 Charlotte N. Hill1,2,3,4
 Gabriela Maita1,2,3
 Camille Cabrolier1,2,3Constanza Aros3,4
 Ana Maria Vega-Letter5Pamela Gonzalez1,2
 Alexis M. Kalergis1,2
 Patricia Luz-Crawford2,3,4*
 Gareth I. Owen1,2*
- 1Facultad de Ciencias Biológicas, Pontificia Universidad Católica de Chile, Santiago de Chile, Chile
- 2Millenium Institute for Immunology and Immunotherapy, Santiago de Chile, Chile
- 3Laboratorio de Inmunología, Centro de Investigación e Innovación Biomédica, Facultad de Medicina, Universidad de los Andes, Santiago de Chile, Chile
- 4Center of Interventional Medicine for Precision and Advanced Cellular Therapy (IMPACT), Santiago, Chile
- 5Escuela de Ingeniería Bioquímica, Pontificia Universidad Católica de Valparaíso, Valparaíso, Chile
Immune checkpoint inhibitors have significantly advanced the treatment of gastric cancer (GC), yet therapeutic resistance remains common due to the immunosuppressive tumor microenvironment and redundancy among inhibitory checkpoints. Tim-3 (HAVCR2) is an emerging immune checkpoint receptor implicated in tumor immune evasion. However, the role of its ligand, Galectin-9 (Gal-9, LGALS9), in GC pathogenesis and therapy resistance remains poorly understood. We performed bioinformatic analysis of The Cancer Genome Atlas (TCGA) stomach adenocarcinoma (STAD) dataset to assess LGALS9 and HAVCR2 expression and their clinical correlations. We also evaluated associations between LGALS9 expression and immune cell signatures. Functional ex vivo assays were conducted to investigate the effects of Gal-9 on CD8⁺ T cell function and Treg suppressive activity in the context of Tim-3 signaling. Our analysis revealed that both LGALS9 and HAVCR2 are upregulated in gastric tumors and associated with poor patient survival. HAVCR2 expression was significantly higher in invasive adenocarcinomas. LGALS9 expression strongly correlated with signatures of CD8⁺ T cell dysfunction and increased infiltration of regulatory T cells (Tregs). Functionally, Gal-9 promoted Treg suppressive activity and CD8⁺ T cell dysfunction ex vivo through Tim-3 engagement, independently of PD-1 signaling. These findings suggest that Gal-9 contributes to immune evasion in GC by promoting Treg expansion and CD8⁺ T cell exhaustion, potentially driving resistance to anti-PD-1 therapy. We propose circulating Gal-9 as a candidate biomarker of anti-PD-1 resistance and support the rationale for combined blockade of PD-1 and Tim-3 to enhance immunotherapeutic efficacy in GC.
1 Background
Gastric cancer (GC) takes the fifth place on most common cancers worldwide and it is currently the third cause of death by malignant tumors (1–3). In Chile, GC is a principal cause of cancer death (2, 3), with most patients being diagnosed with advanced or metastatic disease (4, 5). While the five-year survival rate for GC patients is 30.4%, this rate falls to approximately 5% in metastatic GC patients, reducing life expectancy to less than a year (6). In the absence of a standard-of-care treatment for advanced or recurrent GC after chemotherapy failure, there is a clinical requirement for new treatment options.
Pembrolizumab, a PD-1 blocking antibody, was granted accelerated approval for the treatment of patients with recurrent locally advanced or metastatic gastric or gastroesophageal junction adenocarcinoma (7). Although this therapy showed a remarkable 56% overall response rate (ORR) on the KEYNOTE-052 trial, the most recent published study shows a 22.7% ORR (8). Currently the only companion diagnostic available is an FDA approved test to determine tumor PDL-1 expression, but despite this selection 80% of patients show no clinical benefit (8), losing their opportunity to receive an effective treatment and suffering the elevated economic burden of this treatment. Similar results have been shown on CHECKMATE trials for another αPD-1 antibody, Nivolumab. In a phase 1/2 study in chemotherapy-refractory GC patients, second line Nivolumab treatment delivered a 26% ORR (44% ORR in PD-L1+ tumors) (7). Thus, while checkpoint therapy is offering enhanced overall survival to a significant number of patients, a better knowledge of GC immune escape mechanisms is required to identify possible predictive biomarkers and design new therapeutic approaches to overcome resistance. Of note, most proposed biomarkers are based on static measures and therefore cannot be evaluated through time and hence fail to rule out acquiring resistance.
Tim-3 is expressed on the most dysfunctional subset among tumor-infiltrating CD8+PD1+ T cells in cancer (9–11), and its upregulation in T cells exacerbates tumor progression in murine models (12). Therefore, Tim-3 has been proposed as a marker that identifies both terminally differentiated effector cell and irreversibly exhausted T cells (13–17). Strikingly, Tim-3 upregulation can be observed after αPD1 therapy (18). Additionally, the simultaneous blockade of Tim-3 and PD1 increases T cell responses compared with anti-PD 1 monotherapy (9, 11, 19–22). On the other hand, Tim-3+Treg are enriched in the tumor and correlate with tumor aggressiveness and progression (23–25). Tim-3+Treg display an enhanced immune-suppressive function that can be abrogated by Tim-3 blockade (23, 26–28). In fact, αTim-3 synergizes with αPD1 therapy to reduce Treg infiltration and increase CD8+ T cell infiltration (9). Tumor Tim-3+Treg accumulation precedes CD8+ T cell dysfunction, and that their early depletion prevents CD8+ T exhaustion (23).
Gal-9 expression is found in 57% of gastric tumors, a key Tim-3 ligand associated with poor prognosis (29–31). Moreover, Tim-3 has also been proposed as a prognostic marker for solid tumors including GC, with high levels of Tim-3 expression associated with poor survival (32). However, the presence of an immune-suppressive tumor microenvironment and redundancy between inhibitory immune checkpoints may be responsible for why a high percentage of GC patients do not show clinical benefit of ICB.
An emerging target is the inhibitory receptor Tim-3 which has been reported to serve as Galectin-9 receptor. Galectin-9 has been widely implicated in CD8+ T cell exhaustion; however, its role in gastric cancer has not been previously characterized. Our findings demonstrate that Gal-9 is sufficient to enhance immune checkpoint expression even in the presence of anti-PD-1 blockade ex vivo, suggesting that it may contribute to therapy resistance. Further clinical studies are required to validate its role and assess its potential as a predictive biomarker in a clinical setting.
2 Methods
2.1 TCGA database bioinformatics analysis
The bioinformatics analysis of gastric cancer data of patients with gastric adenocarcinoma from TCGA Database was performed with TIMER (Tumor Immune Estimation Resource; © X Shirley Liu Lab & Jun Liu Lab 2018). Specifically, gene expression quartiles were used to define high and low expression, and z-score > 2 was used as a threshold for overexpression relative to normal tissue. Spearman and Pearson’s regression analysis were performed considering a p-value of 0.05 or less significant. TIMER analysis considered data of 387 tumor samples from 1 data set (Stomach Adenocarcinoma 415 dataset) of untreated patients from the TCGA database. Tumor infiltrating-Treg and CD8+ exhaustion signatures were calculated as previously described (33, 34). Briefly, each signature was calculated using the mean z-scores of gene expression values corresponding to each gene least. Then, specific correlation of LGALS9 levels (TPM) with molecular signatures were performed by spearman’s regression analysis.
Overall Survival (OS) and Progression-Free Survival (PFS) and Post Progression Survival (PPS) from patients was obtained from the TCGA STAD 2018 data set along with HAVCR2 and LGALS9 mRNA levels. High and low levels were defined as the upper and low quartile respectively. Hazard ratio (HR) was calculated using LogRank (Mantel-Cox) and Gehan-Breslow-Wilcoxon tests on GraphPad®Prism 9.0.
2.2 Gastric cancer and epithelial cell lines culture
The gastric cancer cell line AGS and the gastric epithelial cell line GES-1 were cultured in 10% FBS supplemented RPMI 1640 and transfected using a CMV3-LGALS9 expression vector or empty vector as control. Transfections were performed during 4–6 hours in OPTIMEM media using a transfection solution with 1:1 DNA: Fugene. Gal-9 expression was assessed by western blot (human anti-Gal9, CST) and ELISA (Gal-9 DuoSet R&D). Besides transfections, recombinant human Galectin-9 (rhGal-9, R&D) was used to treat cells. After transfection or rhGal-9 treatment, viability was evaluated by WST-1 assay (Sigma), migration and invasion assay were performed as previously described (35) in the presence or absence of 30mM α-Lactose (Sigma).
2.3 Primary T cell cultures and Flow cytometry
T cells were isolated from peripheral blood mononuclear cells (PBMC) from healthy donors with written consent and ethical approval from the Ethical Committee of the Pontificia Universidad Católica de Chile. First, PBMCs were isolated by Ficoll gradient (Ficoll-Plus®), then T cells were enriched by magnetic separation using the Untouched Human Pan T Cells isolation kit® (Life Technologies) according to manufacturer’s indications. T cells were continuously stimulated with Dynabeads® CD3/CD28, 10ng/mL IL-2 and rhGal-9 (0.25, 0.5, and 1μg/mL) in presence or absence of blocking antibodies: 20μg/mL αTim-3 (Biolegend) and 20μg/mL αPD-1 (InVivoMab®) and cultured for 5 days in T cell media (10ng/mL IL-2 (Biolegend), 10% FBS, 1% Penicllin-Streptomycin, 1% Glutamine, 50μM B-Mercaptoethanol, 50nM HEPES supplemented RPMI Glutamax). After culture cells were stained with LIVE/DEAD™ Fixable Near-IR Dead Cell Stain Kit® (LifeTechnologies) and labelled antibodies against CD4, CD8, CD127, CD25, PD-1, Tim-3, Lag-3, IFNγ, and Foxp3. For IFNγ staining, cells were stimulated with phorbol 12-myristate 13-acetate (PMA, Sigma), Ionomycin (Sigma) and Brefeldin A (Biolegend) for 4 hours before staining. Results were obtained by flow cytometry using FACS BD –Canto II and FACS DIVA and results were analyzed using FlowJo 10.5.
2.4 ELISA assay
Galectin-9 ELISA assay was performed using Gal-9 DuoSet kit according to manufacturer instructions. Briefly, MaxiSorp plates (Falcon) were coated overnight with anti-Gal-9 in the PBS-BSA solution at RT. Then washed with PBS-Tween, blocked for 1h at and incubated with cell conditioned media for 2h at RT, after incubation plates were washed and incubated with capture antibodies and streptavidin. Colorimetric assay using TMB was performed and after 15 min absorbance was measured at 450nm and 690nm and the concentration of samples was calculated by applying a 4-PL regression to the standard curve.
2.5 Statistical analysis
Statistical analyses were performed using GraphPad Prism 9. For comparisons between two independent groups, the non-parametric Mann–Whitney U test was applied due to small sample sizes and non-normal distribution. When comparing more than two groups, Kruskal–Wallis tests followed by Dunn’s post hoc test were applied to account for non-normal distributions and multiple comparisons. Correlations in gene expression data from the TCGA-STAD cohort were assessed using Spearman’s rank correlation. Kaplan–Meier survival analyses were conducted using the log-rank (Mantel–Cox) test, with hazard ratios calculated for high vs. low expression quartiles. A p-value < 0.05 was considered statistically significant.
3 Results
3.1 Elevated levels of LGALS9 and HAVCR2 are associated with cancer progression and reduced patient survival
Galectin-9 (LGALS9) and Tim-3 (HAVCR2) mRNA levels were evaluated in registered normal gastric tissue samples (n=35) and tumors (n=379) from the TCGA database (STAD 2018). LGALS9 was significantly increased in tumor samples (2.773 ± 0.18) compared to normal tissue (1.708 ± 0.61), while it did not show significant differences between stages; stage I and II displayed a mean level of 6.412 ± 0.17 and stages III and IV a mean of 7.723 ± 0.08 (Figure 1A). HAVCR2 levels were also significantly higher on tumor samples (2.517 ± 0.19) than in normal tissue (1.188± 0.69) (Figure 1D). Unlike its ligand, HAVCR2 levels were increased in advanced-stage (7.723 ± 0.08) compared to early-stage disease (6.419 ± 0.08) (Figure 1C).
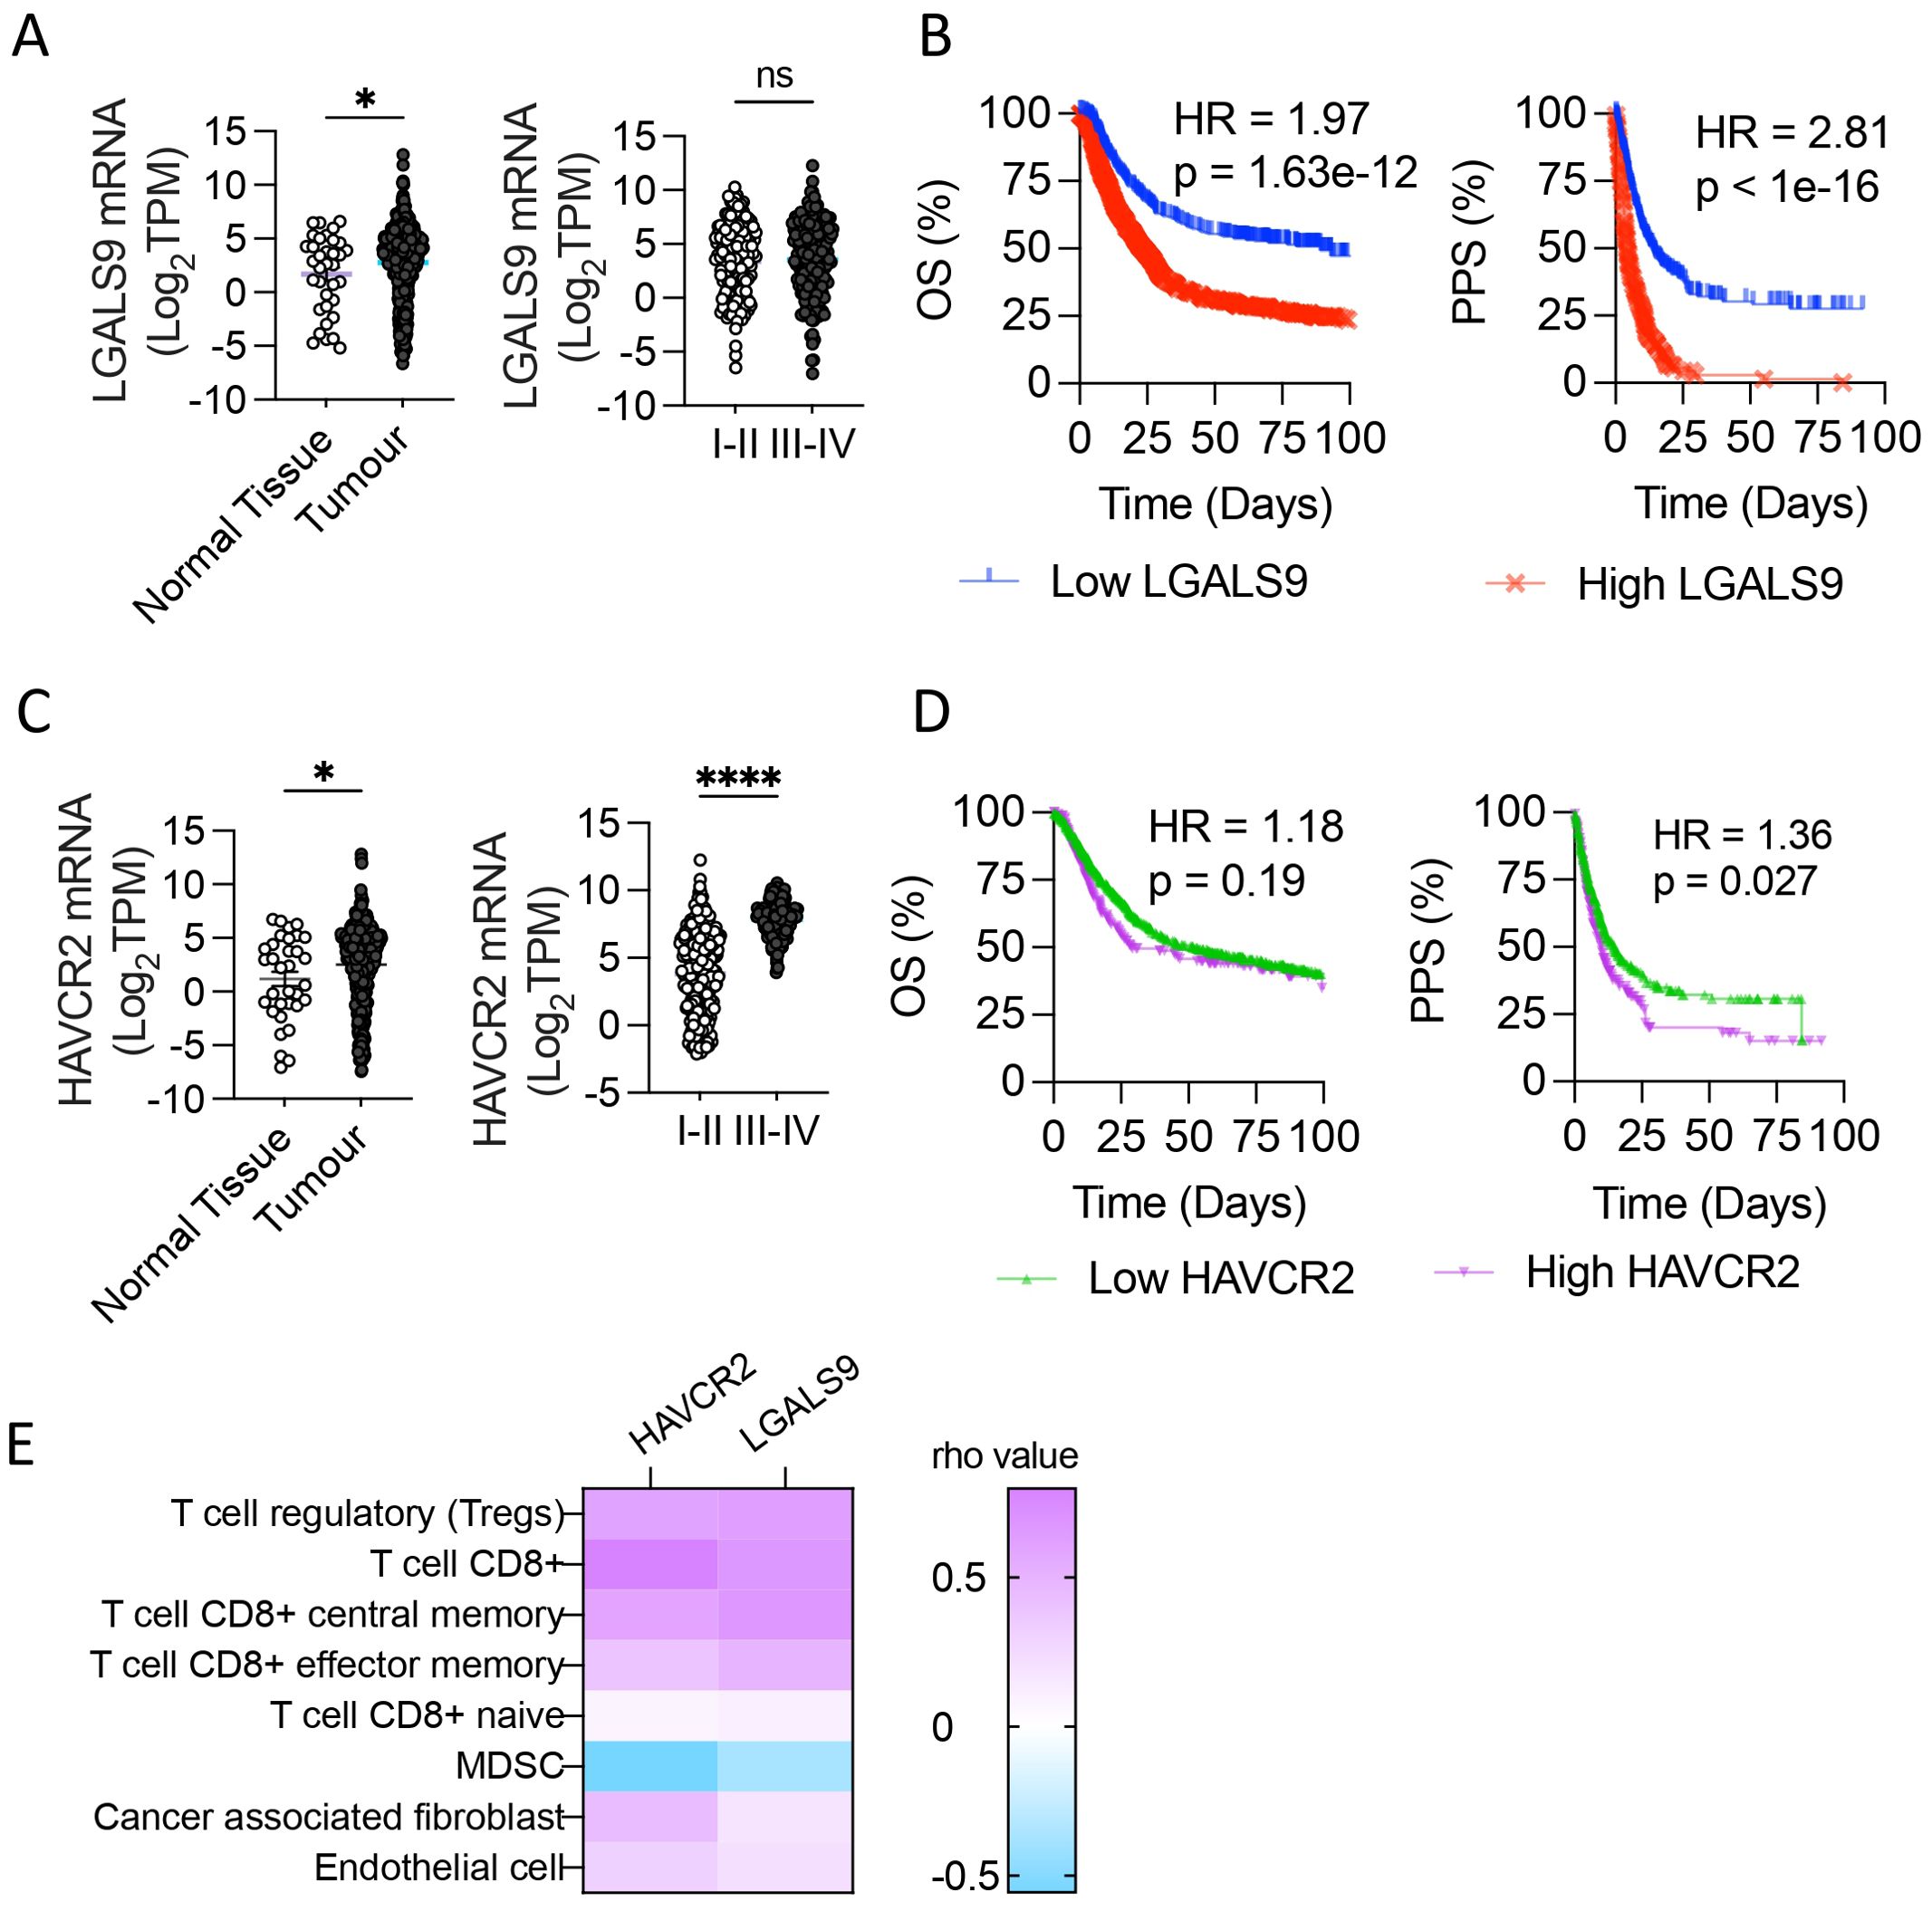
Figure 1. Galectin-9 and Tim-3 levels in Stomach Adenocarcinoma associate with patient 583 outcome. Galectin-9 (LGALS9) and Tim-3 (HAVCR2) mRNA levels were evaluated in normal gastric 584 tissue samples and tumors from the TCGA database (STAD 2018). LGALS9 and HAVCR2 levels in 585 normal tissue and tumor and its levels among stages (A, C), *p,0.05, ****p<0.0001. unpaired t-Student test. 586 Overall Survival (OS) and Post Progression Survival (PPS) depending on LGALS9 (B) and HAVCR2 587 (D) levels. Pearson correlation of HAVCR2 and LGALS9 mRNA levels with tumor 588 microenvironment cell gene signature (TIMER®) (E). Gehan-Breslow-Wilcoxon test and LogRank test. 589 HR, Hazard Ratio; TPM, Transcripts Per Million.
Given that LGALS9 and HAVCR2 levels were upregulated in STAD and that HAVCR2 levels were associated with advanced stages, we evaluated if higher levels of mRNA expression were associated with poor clinical outcomes (Figures 1B, D). The Overall Survival (OS) was shorter in patients with the highest LGALS9 quartile, with a median survival of 89.43 compared to 23.5 months in the lowest quartile (p<0.0001), with a Hazard Ratio (HR) of 1.97 (Figure 1B). In a similar pattern, the Post Progression Survival (PPS) of the highest and lowest LGALS9 quartile presented a median survival of 4.3 and 13.8 months, respectively, with an HR of 2.81 and p<0.0001. OS of HAVCR2 highest and lowest quartile levels had a median survival of 29.2 and 51.8 months respectively, with a HR=1.189 and p=0.186 (Figure 1D). On the other hand, PPS of the HAVCR2 highest quartile presented a median survival of 10.3 months, significantly shorter that the lowest quartile of 14.8 months (HR=1.36, p=0.027).
As LGALS9 and HAVCR2 genes are associated with immune regulation, we evaluated the correlation of these transcripts’ abundance with the gene signature of tumor microenvironment cells Cibersort ABS on TIMER®. Both genes strongly associate with tumor T cells, including CD8+ and Treg, obtaining rho values > 0.5 for these gene signatures (Figure 1E).
3.2 Gal-9 promotes cell migration and invasion in vitro
To determine the consequences of Gal-9 overexpression in GC cells, we transfected AGS cells with a Gal-9 expression vector (CMV3-Gal9) or empty vector as control (CMV3-Empty). CMV3-Gal9 transfection led to a 10-fold increase in protein expression and secretion without altering cell viability or proliferation (Supplementary Figure S1). We evaluated if Gal-9 overexpression could enhance cancer cell migration and invasion. The addition of rhGal-9 to the AGS cell line caused a significant increase in cell migration (Figures 2A, B), which was also observed in the gastric epithelial cell line, GES-1 (Figure 2C). Interestingly, when cells were treated with a-Lactose to block extracellular Gal-9 sugar-binding domains, the increase in cell migration was prevented in both cell lines (Figures 2E, G, H). Similarly, Gal-9 overexpressing AGS and GES-1 cells displayed a significant increase in invasion, which was effectively prevented by α-Lactose (Figures 2D, F), suggesting that Gal-9 promotion of cell migration and invasion may be both physiological and pathophysiological.
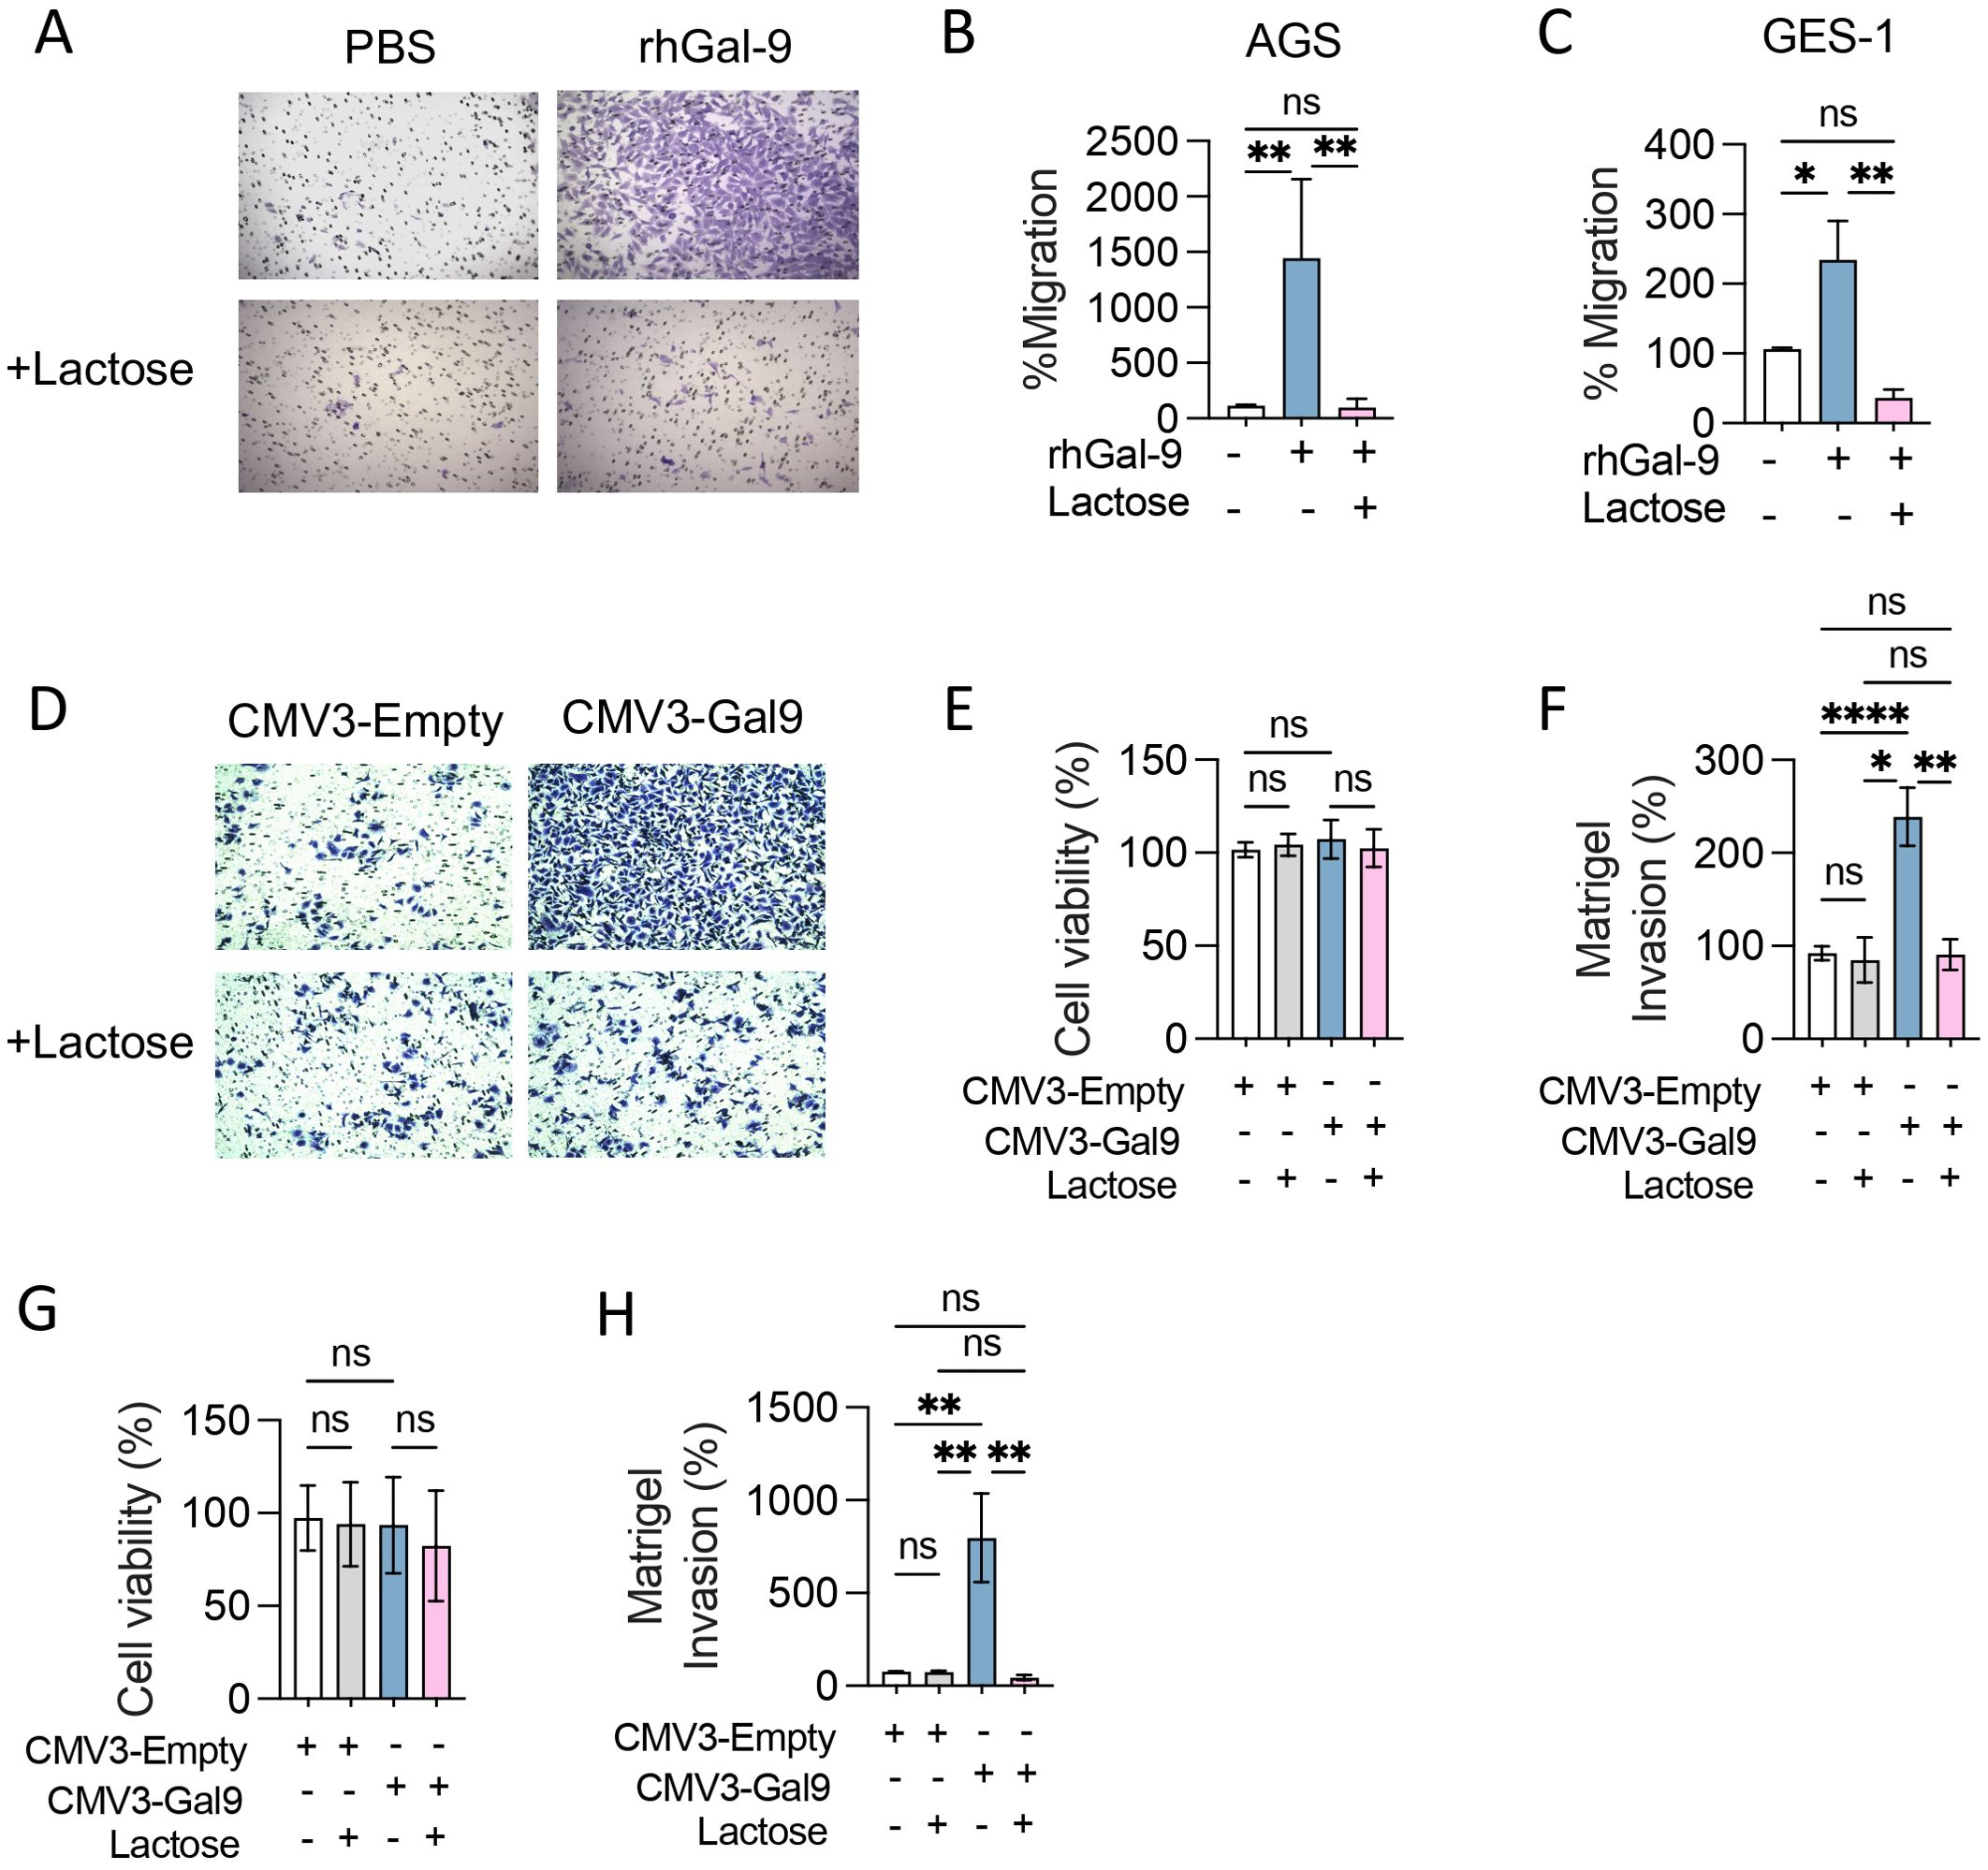
Figure 2. Galectin-9 promotes cancer and epithelial cell migration and invasion in vitro. Transwell migration (A-C) and Matrigel invasion assays (D-H) were performed with AGS and GES-1 cell lines in presence of recombinant human Galectin-9 (rhGal-9) or upon Galectin-9 overexpression (CMV3-Gal9). Lactose 30mM was used to block Gal-9 glycan binding regions. Representative photographs of stained membranes are shown (A, D). Cell viability after transfection was measured by MTS assay in AGS (E) and GES-1 (G) cell lines. Matrigel invasion of transfected AGS (F) and GES-1 (H) was quantified. Migration and Invasion percentages were calculated considering PBS or CMV3-Empty as control. Results presented as mean and SD, *p<0.05, ** p<0.01, ****p<0.0001 Kruskal-Wallis, U-Man Whitney, n=3.
3.3 Galectin-9 associates with tumor Treg infiltration and promotes Tim-3+ Treg expansion and suppressive capacity in vitro
As Cibersort utilizes molecular signatures based on natural Treg and mice models, we performed a gene set enrichment analysis based on a tumor infiltrating-Treg signature (34). We found a strong association between LGALS9 levels and this Treg signature, with a Rho value of 0.965 and p<0.001 after Spearman’s regression (Figure 3A). As LGALS9 levels strongly correlated with tumoral-Treg’s signature, we treated T cells with increasing concentrations of rhGal-9 (0.25, 0.5 and 1.0µg/mL) and observed a dose-dependent increase of CD4+CD127loCD25+Foxp3+ Treg frequency (Figures 3B, C). Noteworthy, rhGal-9 addition did not impact CD3+ T cell viability (Supplementary Figure S2). Therefore, Gal-9 may promote Treg expansion through Tim-3 signaling. In fact, we found that Tim3+Treg is increased and that Foxp3 is upregulated upon Gal-9 engagement (Figures 3D–F). To determine if this effect was dependent on Tim-3 engagement, we used a blocking antibody targeting Tim-3, which prevented the rhGal-9 mediated increase in Treg frequency among total T cells (Figure 3G). To determine if Gal-9 could promote Treg induction as previously described in murine models, we treated CD4+ naive cells with rhGal9 (Supplementary Figure S3). Interestingly, in this setting Gal-9 failed to increase Treg induction from naïve CD4+ T cells, however, it enriched the Tim3+iTreg population and enhanced the suppressive capacity of the induced Tregs (Figures 3H–K). Additionally, only Gal-9 overexpressing cancer cells expanded the Treg population (Figures 3L, M).
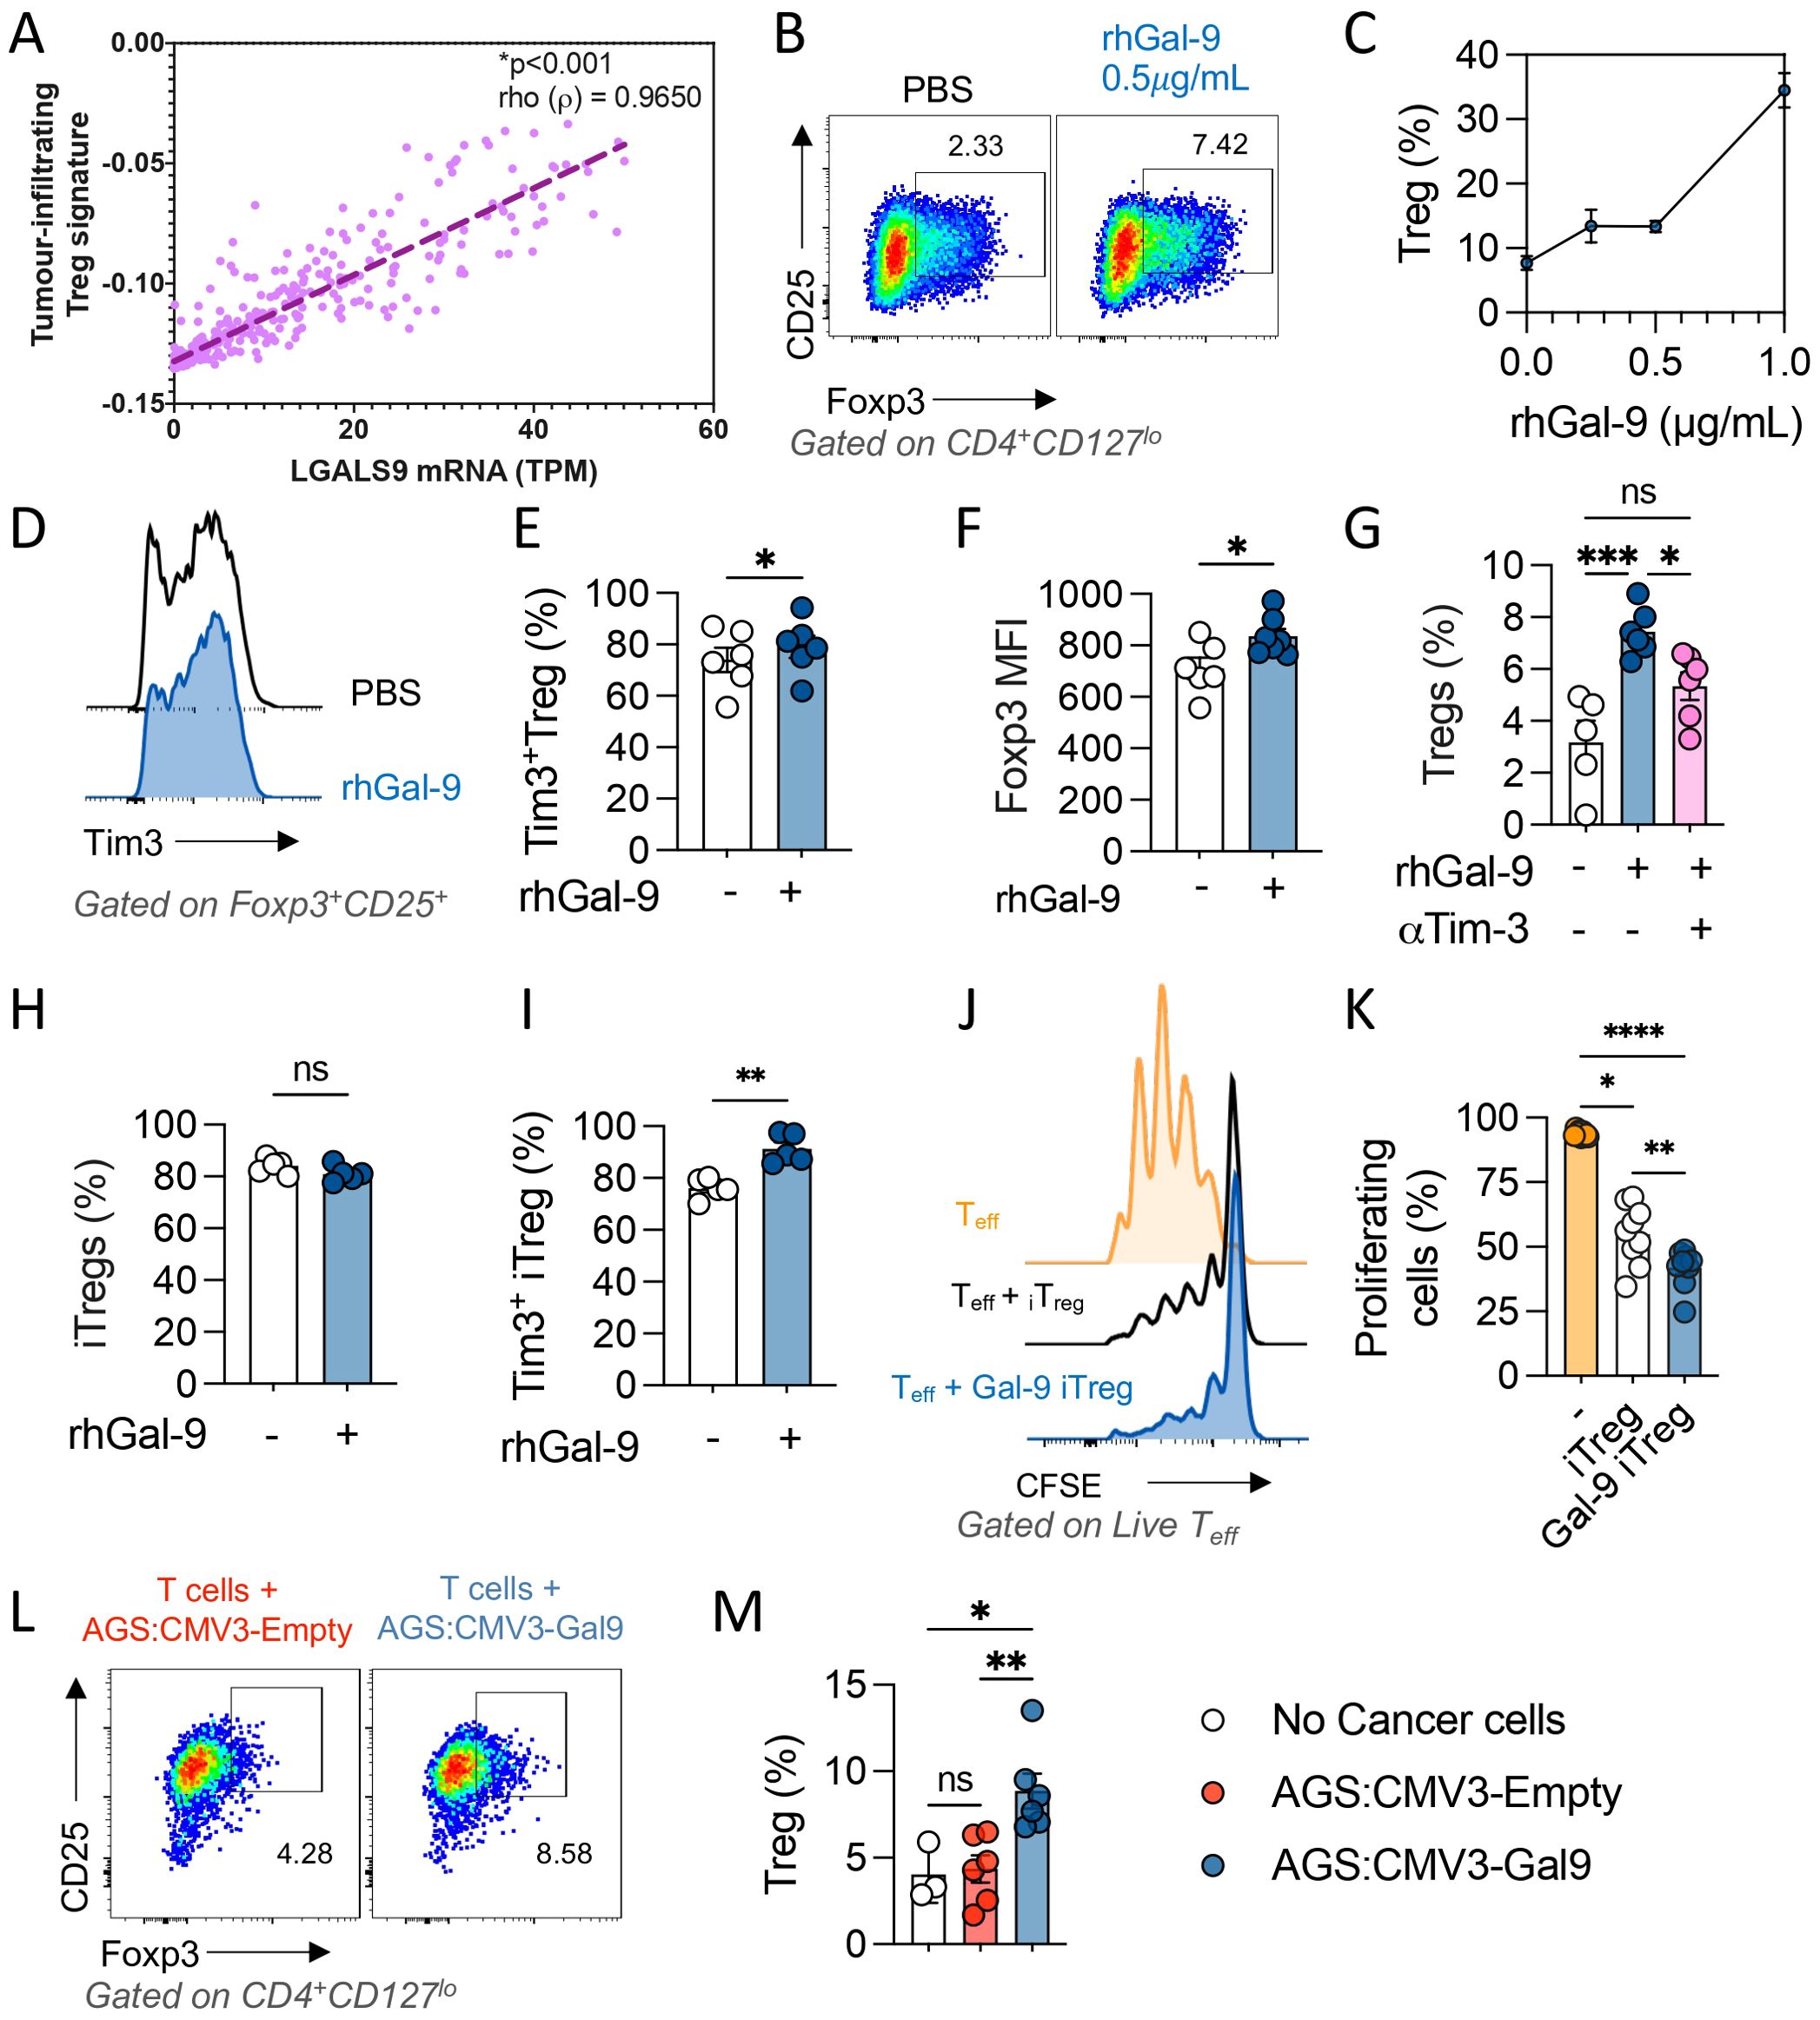
Figure 3. Galectin-9 associates with tumor Treg infiltration and promotes Tim-3+ iTreg expansion and suppressive capacity in vitro. Tumor infiltrating Treg transcriptional signature was determined using the STAD 2018 TCGA dataset and its correlation with LGALS9 mRNA levels was evaluated through Spearman’s regression, Rho value=0.3642 and p<0.001 (A). CD3+ T cells were enriched and activated with αCD3/αCD28 in the presence of rGal-9, a dose dependent increase in Treg frequency was observed (B, C). rhGal-9 upregulated Tim-3 (D, E) and Foxp3 (F) in Treg cells. The addition of an αTim-3 blocking antibody on Treg frequency was also assessed (G). Naïve CD4 T cells were isolated and iTreg were generated in vitro in presence of rhGal-9 (H), frequency of Tim3+ iTreg (I) was assessed. The suppressive capacity of then iTreg was then evaluated in a suppression assay by coculture with CTV stained Tconv (J, K). Coculture of CD3+ T cells with Gal-9 expressing cancer cells (AGS CMV3-Gal9) or control cancer cells (AGS CMV3-Empty) (L, M). Results presented as mean and SE *p<0.05; **p<0.01; ***p<0.001; ****p<0.0001 Mann Whitney test or Kruskal Wallis – Mann Whitney.
Gal-9 associates with CD8+ T cell exhaustion in Stomach Adenocarcinoma and promotes an exhausted like phenotype in blood derived CD8+ T cells. Given that the Gal-9 mRNA levels are associated with a CD8+ 220 T cell dysfunction signature in gastric tumours (Figure 4A), we evaluated if Gal-9 promoted the frequency of dysfunctional CD8+ T cells in vitro. T cells were isolated with informed consent from healthy donors (n=8) and stimulated with αCD3/αCD28 activating beads in presence of rhGal-9 at increasing concentrations (0.25, 0.5 and 1µg/mL). Although Gal-9 effectively decreased total CD8+ T cell frequency (data not shown), this population was significantly enriched in PD-1+Tim-3+ exhausted-like T cells and dose-dependently decreased cell division (Figures 4B–D). We assessed if a Tim-3 blocking could prevent CD8+ T cells exhaustion by measuring the frequency of PD-1+Tim-3+, PD-1+Tim-3+Lag-3+, and PD-1+IFNy- subpopulations. Gal-9 significantly increased these populations of CD8+ T cells, which was completely abolished by the blockade of Tim-3 (Figures 4E, F). Similar results were observed when isolated CD8+ T cells were stimulated with Gal-9 (Supplementary Figure S2).
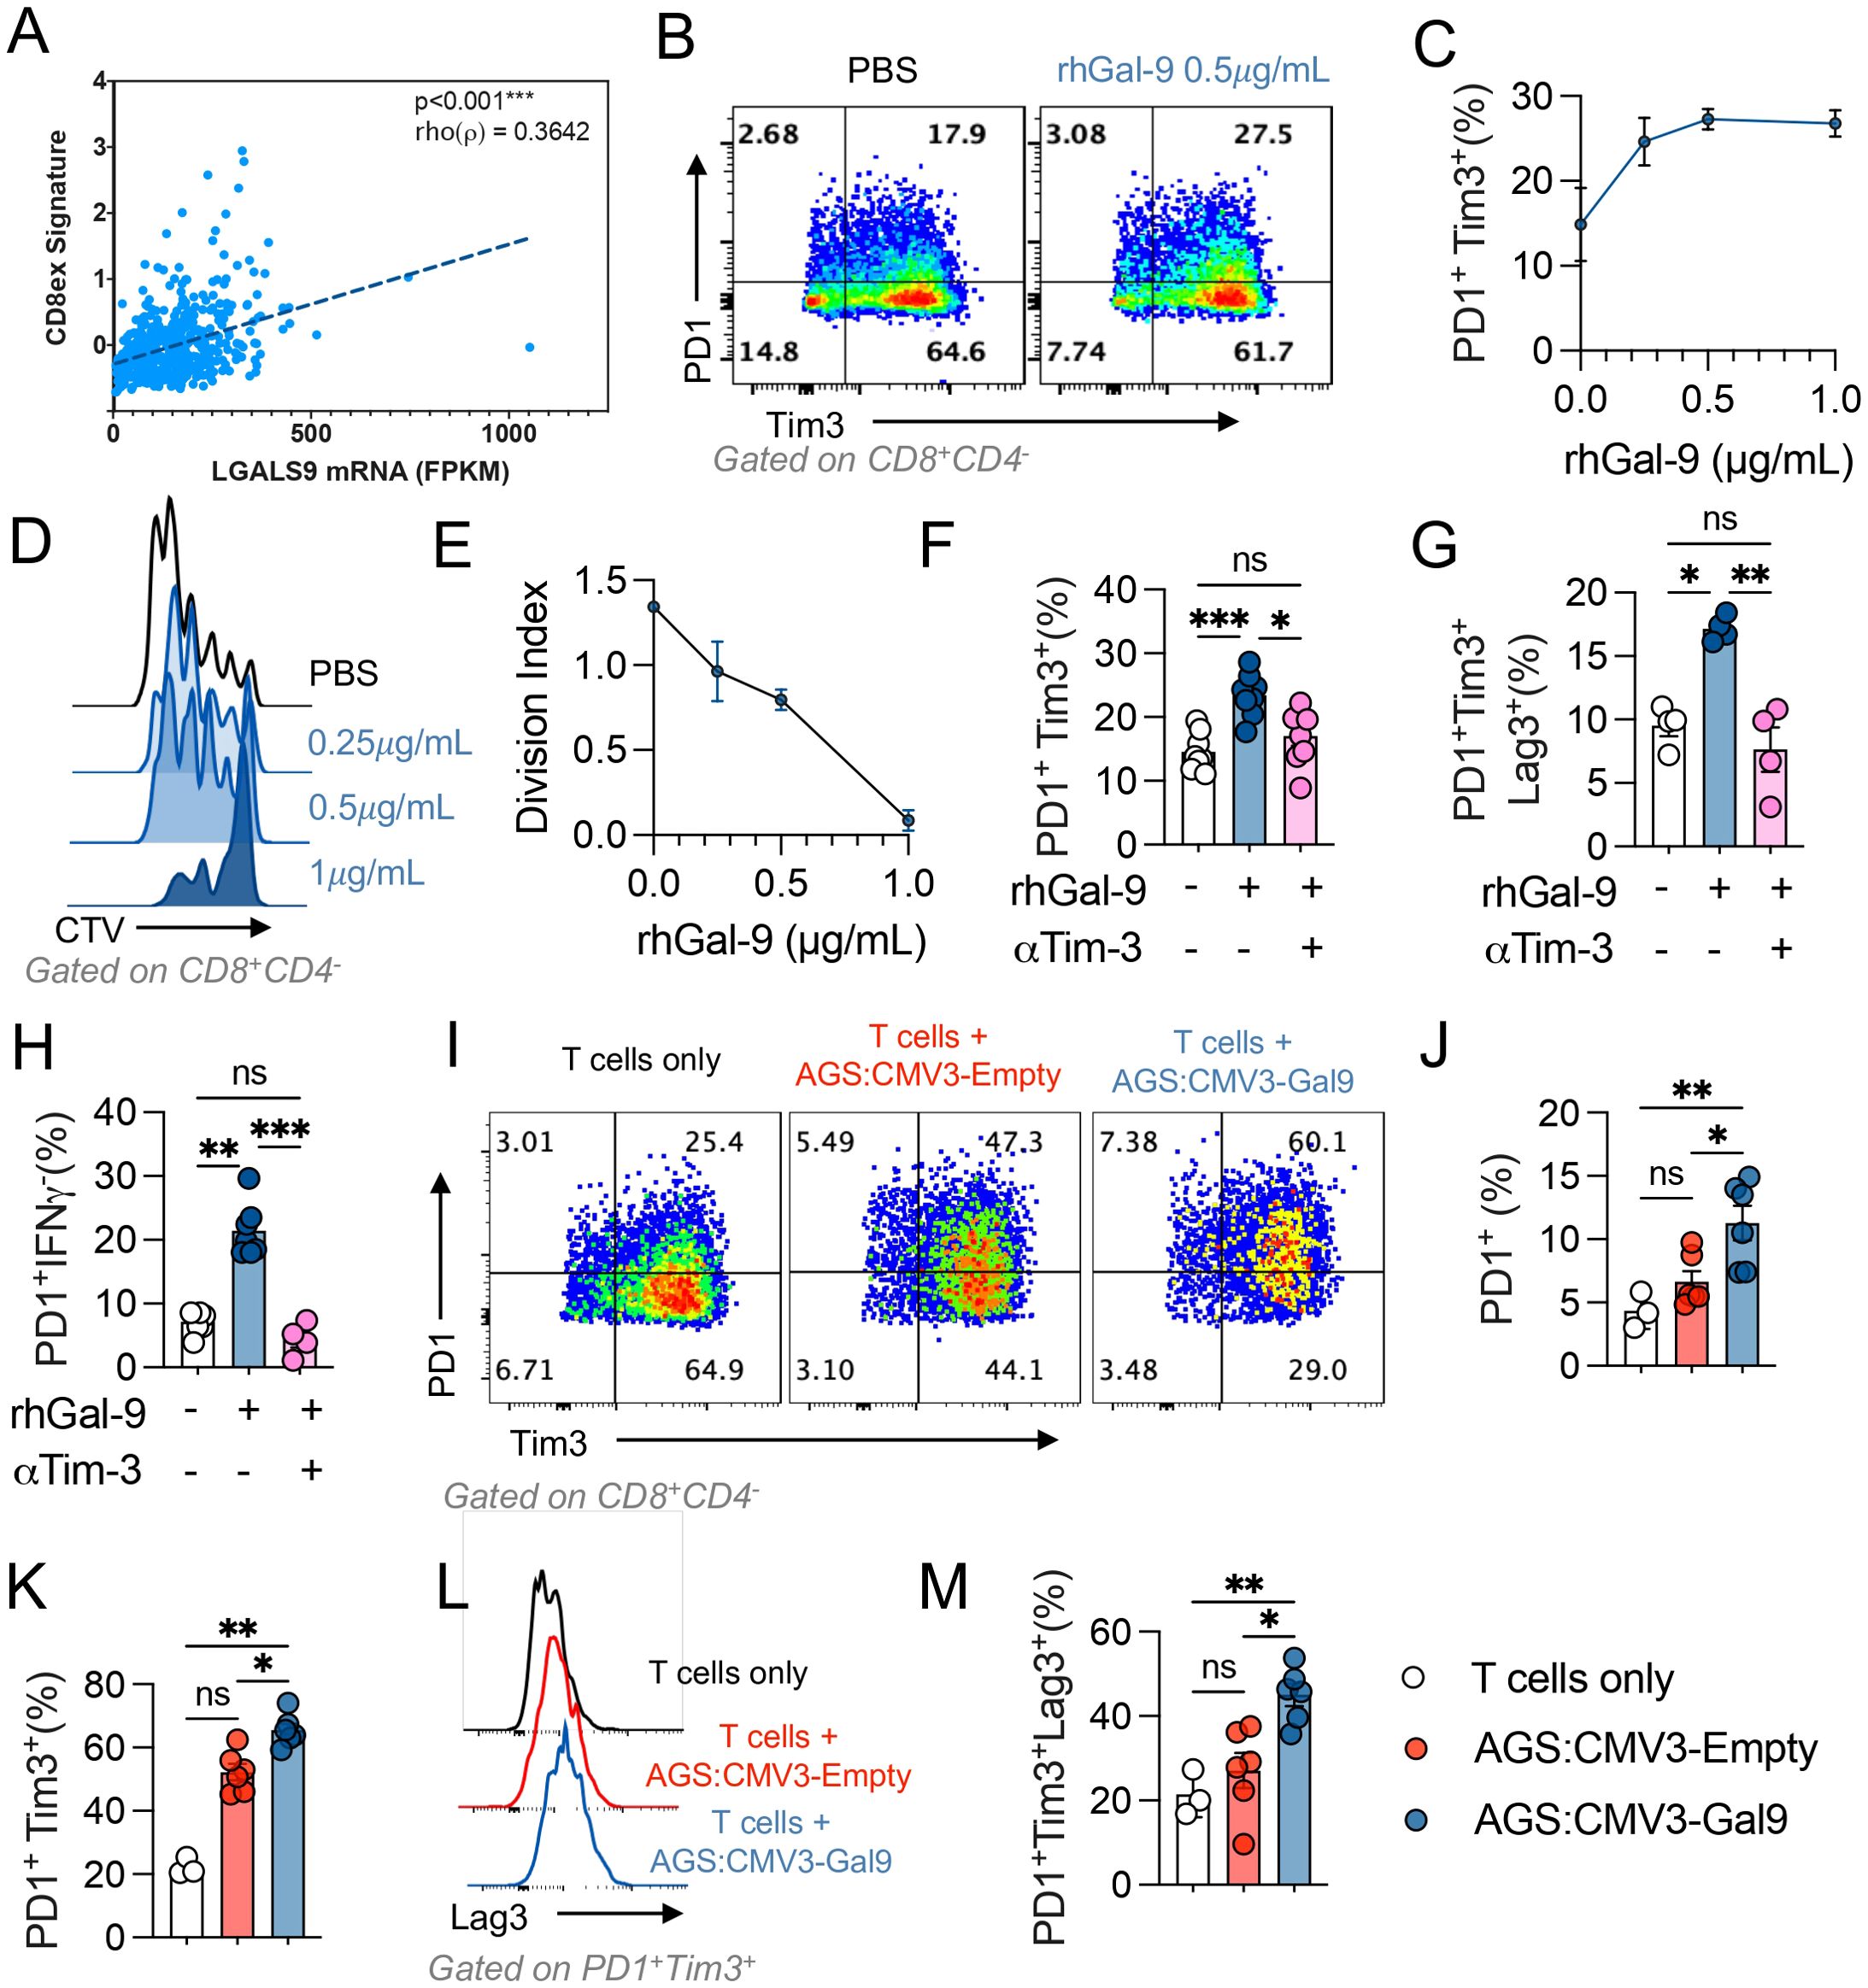
Figure 4. Galectin-9 associates with CD8+ T cell exhaustion in stomach adenocarcinoma. Correlation between LGALS9 levels and an exhausted CD8+ (CD8ex) signature on the STAD 2018 TCGA dataset was performed, Spearman’s regression, Rho value=0.3642 and p<0.001 (A). Isolated CD3+ T cells from healthy donors were activated with αCD3/αCD28 beads and treated with rhGal-9 or vehicle (PBS) (B, C) in the presence or absence of an aTim3 blocking antibody. The frequency of PD1+Tim3+ (B, C) and the division index (D, E) was assessed by flow cytometry. To determine the effect of the addition of aTim- 3, the frequencies of PD1+Tim3+ (F), PD1+Tim3+LAG3+ (G) and PD1+IFNg+ (H) CD8+T cells was assessed (n=8). Gal-9 expressing (CMV3-Gal9) or control s (CMV3-Empty) AGS cells were cocultured with aCD3/aCD28 activated CD3+ T cells, after 72h the frequencies of PD1+, PD1+Tim3+ (I-K), PD1+Tim3+LAG3+ (L, M) CD8+T cells were assessed (n=5). Results presented as mean and SE *p<0.05; **p<0.01; ***p<0.001 Kruskal Wallis – Mann Whitney.
We then evaluated if Gal-9 expressing cancer cells were capable of increasing CD8+ T cell exhaustion. When co-culturing Gal-9 overexpressing cancer cells with T cells, we observed a significant increase in the percentage of CD8+PD1+, CD8+PD1+Tim3+, and CD8+PD-1+Tim-3+Lag-3+ T cell populations (Figures 4G–L). These results indicate that Gal-9 expressing cancer cells can promote CD8+ T cell exhaustion and Treg expansion.
3.4 The Galectin-9 mediated increase in exhausted-like CD8+ T cells is independent of PD-1
Given that Gal-9 increased exhausted-like CD8+ T cells populations, we evaluated if this could be maintained upon αPD-1 blockade. The percentage of CD8+ T cells and the exhausted-like populations PD1+Tim3+, PD1+Tim3+LAG3+, PD1+IFNy- were assessed by flow cytometry (Figure 5). rhGal-9 increased the frequency of these exhausted-like populations, even in the presence of αPD-1, not with the addition of αTim-3. Thus, Gal-9/Tim-3 pathway may promote CD8+ exhaustion even in the presence of αPD-1.
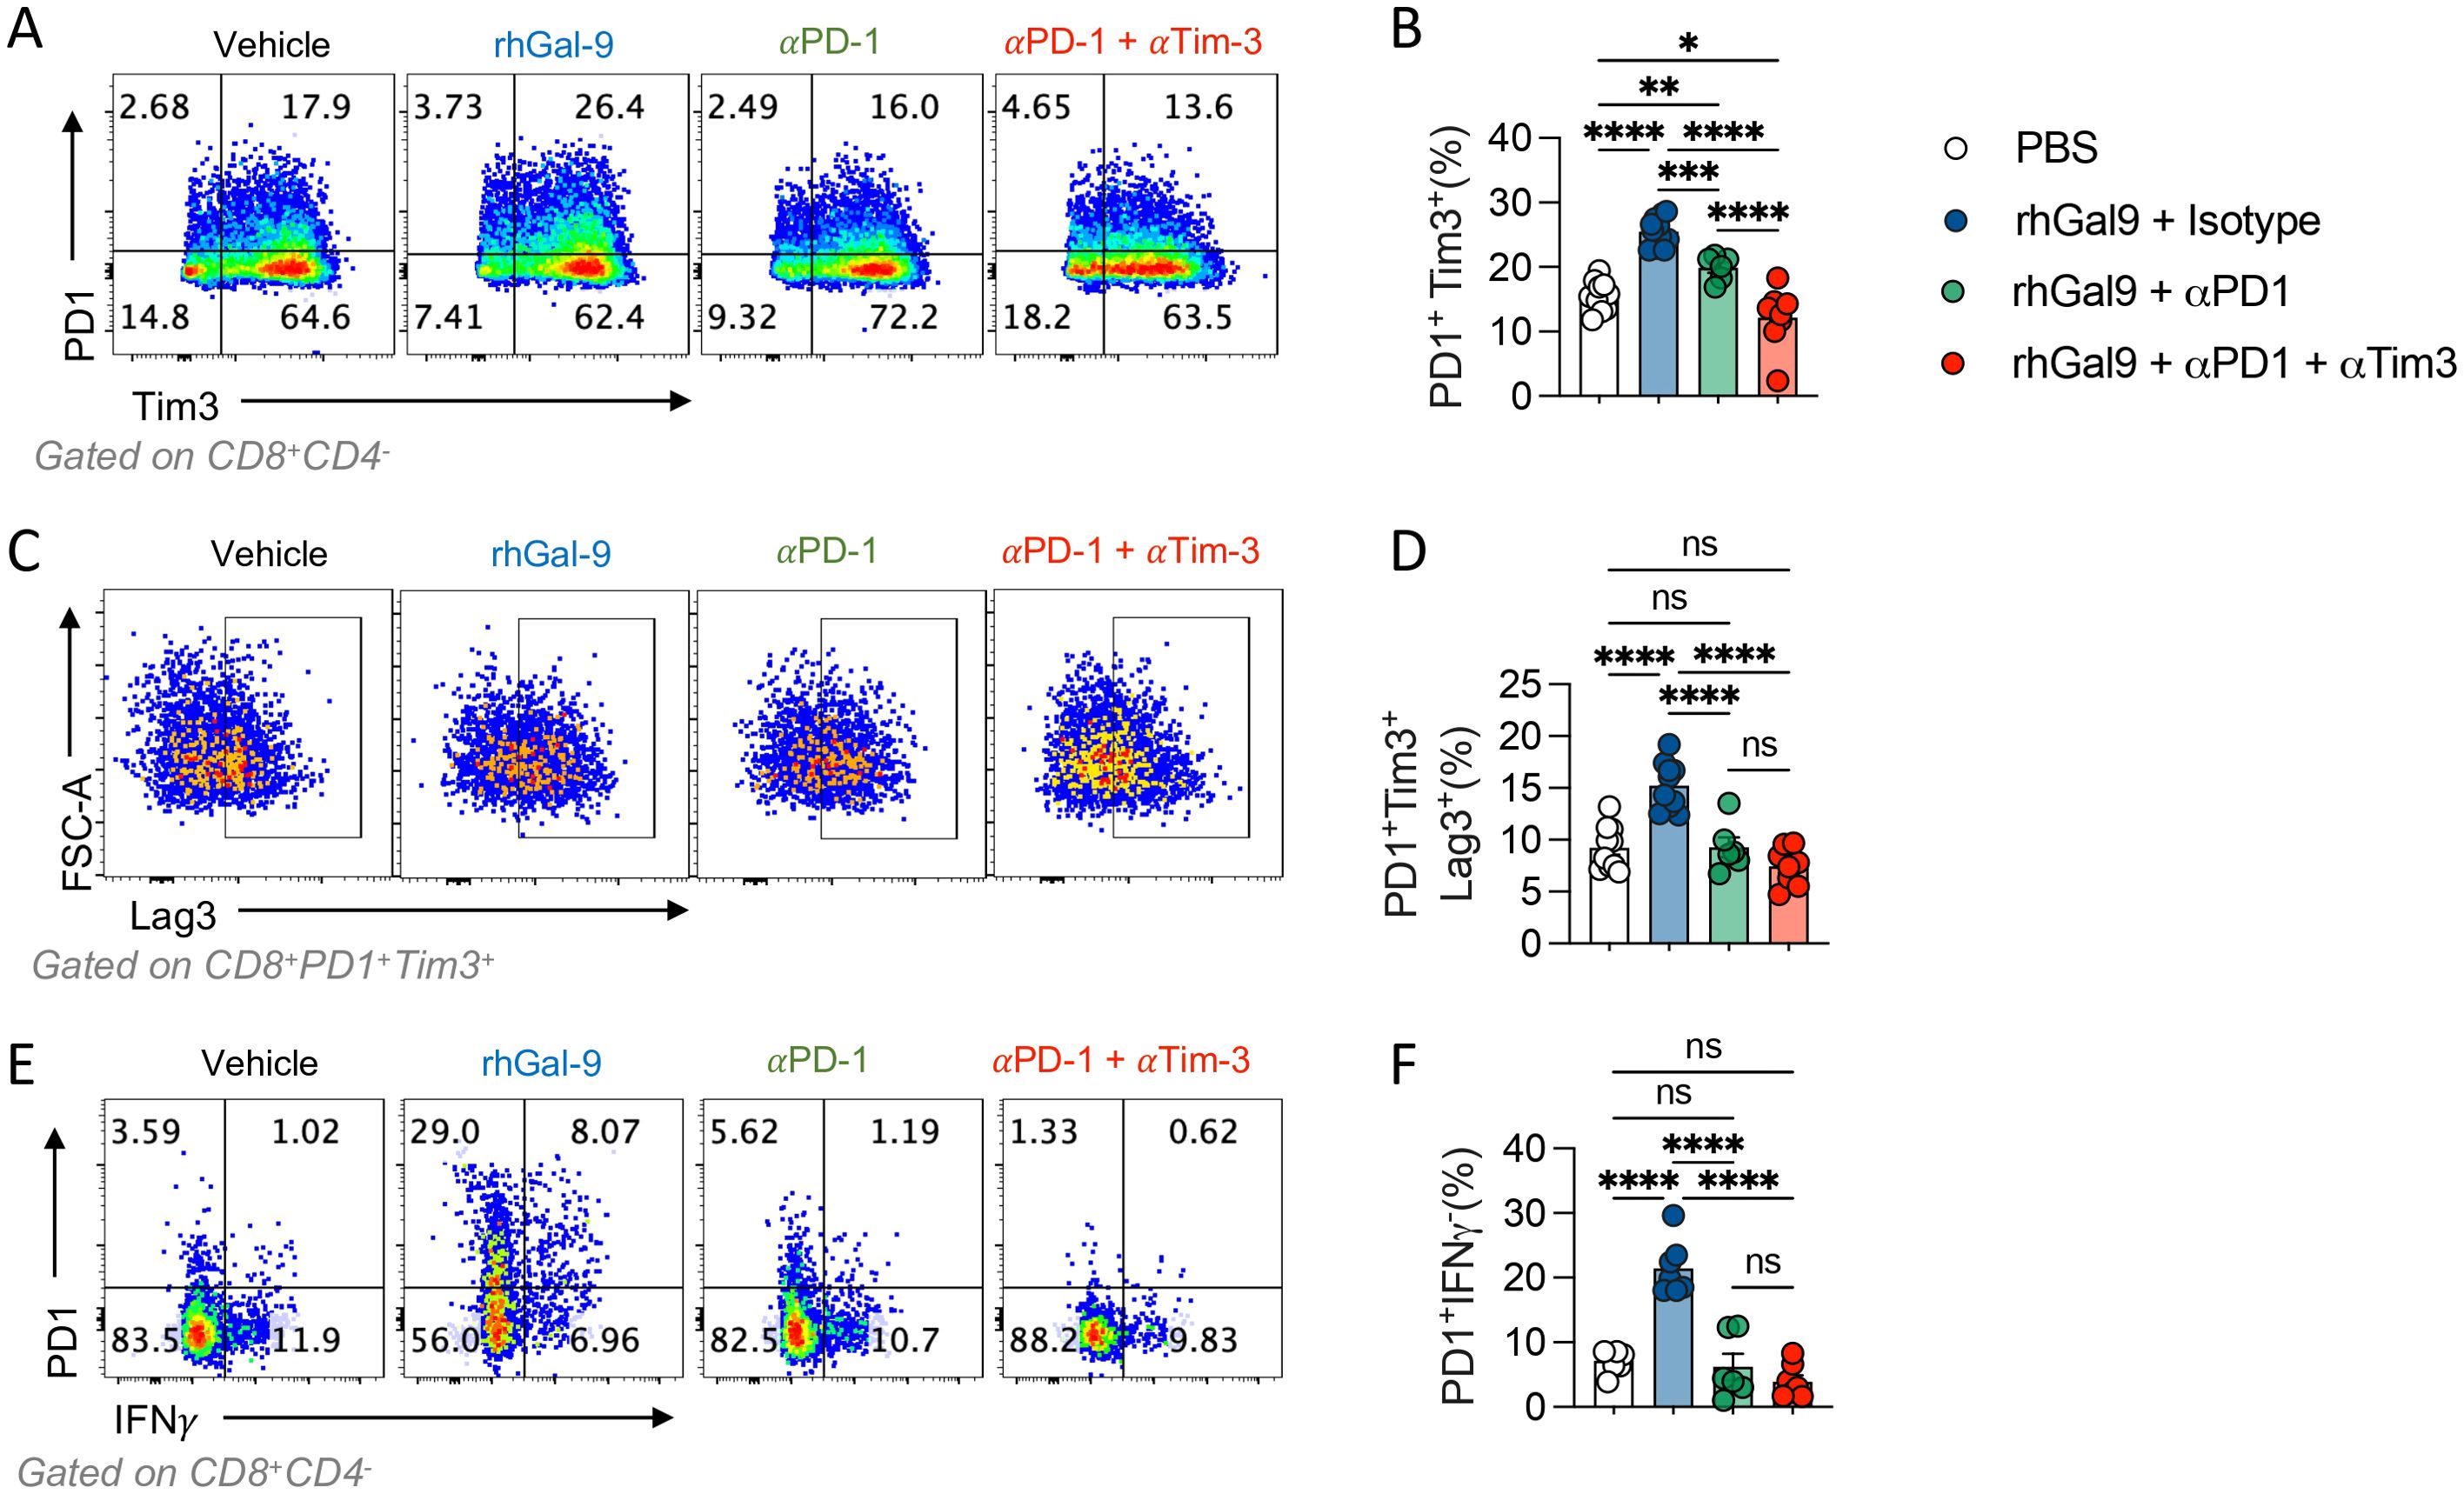
Figure 5. Galectin-9 increases PD1+Tim3+ T cells in the presence of αPD1 blocking antibody. T cells isolated from healthy donors were activated with αCD3/αCD28 beads and treated with rhGal9 in presence or absence of αPD1 blocking antibodies or a combination of αPD1 and αTim3 antibodies. After 96h, cells were harvested and stained for flow cytometry. PD1+Tim3+(A, B), PD1+Tim3+Lag3+ (C, D) and PD1+IFNγ+ (E, F) frequencies were assessed. Results presented as mean and SE *p<0.05, **p<0.01, ***p<0.001, ****p<0.0001 n=5, Kruskal Wallis, Mann Whitney.
4 Discussion
Gal-9 role in GC biology has been understudied and there are contradicting studies. Gal-9 expression was associated with improved survival, but only when late stages were ruled out (36). Similarly, cytoplasmic Gal-9 in GC cell lines suppresses migration, invasion, and epithelial-mesenchymal transition and inhibits metastasis (37). Controversially, we observed that high levels of LGALS9 significantly associate with poor outcomes and that extracellular Gal-9 effectively induces cell migration and invasion through its sugar binding domains. Similarly, other authors found that Gal-9 associates with poor prognosis on an Asian cohort of patients (31). This increase in invasion was not only observed on cancer cells but also on gastric epithelial cells, suggesting that this could be in fact a physiological function of extracellular Gal-9. Taken together, it is likely that Gal-9 has different functions depending on its subcellular expression, where cytoplasmic and extracellular Gal-9 display different biological functions.
CD8+ T cells are key elements of the cancer immune response, and their dysfunctional states are widely associated with poor clinical outcomes and immunotherapy resistance (38). A reduced effector function, including the production of TNF, IL-2 and IFNγ has been previously reported in dysfunctional CD8+ T cells (39–42). It must be noted that dysfunctional T cells are a highly heterogeneous population. Taking this into consideration, it has been suggested that this T cell subset can be classified into ‘pre- dysfunctional’, ‘early dysfunctional’ and ‘late dysfunctional’ cells (43). However, it must be kept in mind that T cell dysfunction is not a binary state, but rather a continuum of different states that culminate into a terminally exhausted phenotype leading to senescence. The transcriptomic analysis brought to light that a molecular signature of dysfunctional CD8+ positively correlates with tumor LGALS9, supporting that Gal-9 is associated with CD8+ dysfunction in GC. To further evaluate this hypothesis, we performed in vitro experiments with T cell primary cultures. Gal-9 increased both PD-1+Tim-3+ and PD-1+Tim-3+Lag3+ populations, which have been respectively suggested as early dysfunctional and late dysfunctional T cells. Importantly, the appearance of these sub-populations was accompanied by a dose-dependent impairment of cell division. It has been proposed that CD8+ T cells retain proliferative capacity during their transition from the pre-dysfunctional state to an early dysfunctional state but lose this capacity at the stage of more profound, ‘late’, dysfunction, either because of an intrinsic block or because their high inhibitory receptor expression suppresses T cell activation (40, 43–47). Herein, we demonstrate that CD8+ T cell proliferative capacity is impaired by Gal-9, and that it further drives an exhausted-like phenotype, increasing the frequency of PD-1+Tim-3+ exhausted-like progenitors and terminally exhausted cells characterized by the expression of Lag3 and failed IFNγ production. Moreover, co-treatment with a Tim3- blocking antibody prevented this effect. Therefore, it is likely that Gal-9, acting through Tim-3 engagement, is sufficient to increase the frequency of these populations. Validating these findings, previous reports show that blockade Gal-9 or Tim-3 restores CD8+ T cell proliferation (48). A variety of transcription factors regulate CD8+ T cell dysfunctionality, including TOX and TCF1 [Reviewed in (43)]. TCF1 and TOX appear to be determinants for T cell fate regarding a commitment into a stem-like phenotype or a dysfunctional phenotype in murine models (49). Since our results indicate that Gal-9 is driving the differentiation process into late- dysfunctional cells, further studies should evaluate if this protein can regulate these transcription factors and furthermore and increase the expression of the late-dysfunction marker CXCL13 (40, 43).
Tumour-resident Treg cells have been shown to counteract tumor-specific immune responses by suppressing the infiltration and anti-tumor activity of CD8+ T cells (50). Moreover, Treg accumulation has been associated with immunotherapy resistance in mice and patients (51, 52). Therefore, we evaluated if LGALS9 levels were also associated with increased Treg infiltration. Strikingly, transcriptomic analysis revealed a strong positive correlation, suggesting that Gal-9 could increase Treg infiltration, possibly by expanding this population or alternatively increasing their trafficking into the tumor. Seki et al. showed that Lgals9 knockout (KO) mice displayed a reduced frequency of Treg (52). A separate study showed that this KO mouse had impaired Foxp3 expression, that exogenous Gal-9 could restore Foxp3 function, and furthermore, that TGFβ1 induces Gal-9 expression in a feedforward loop (53). In addition, Gal-9 promoted TGFβ1-dependent induction of Treg via the TGFβ/Smad signaling pathway. Given the evidence from mice models and our bioinformatics results, as a proof of concept we evaluated if Gal-9 could expand Treg, using T cell primary cultures from healthy donors. In accordance with our hypothesis, we observed that Gal-9 at the three concentrations used effectively increased Treg frequency. Furthermore, Gal-9 was able to upregulate Foxp3 expression, enrich the Tim3+Treg population and potentiate iTreg suppressive capacity.
It has been shown that Tim-3 blockade relieves Treg mediated immunosuppression. Using the Tgfbr1/Pten double KO mouse model, the application of an αTim- 3 antibody reduced Treg count and restored IFNγ production haltering tumor growth (27, 28). Tim-3 appears not only to play a key role on Treg function in cancer, but also in autoimmune diseases such as osteoarthritis, where a reduction of Tim-3 expression on Treg associates with a decreased production of IL-10 (26). Besides Tim-3, Gal-9 has been reported to act through other receptors such as CD44 and CD137 (54). In murine models where Gal-9 could expand Treg, this action was principally attributed to an interaction with the CD44 receptor that enhanced the stability and function of these cells (53). However, our observations in human peripheral T cells, Gal-9 action appears to be predominantly mediated through the Tim-3 receptor, although we cannot rule out that Gal-9 could also, albeit partially, mediate changes through alternative receptors. Mechanistically, it has been proposed that Tim3 can enhance Treg effector-like phenotype through glycolytic metabolism (PMID: 34525351). In accordance, Gal-9 has been proposed to regulate T cell function through the PI3K/AKT/mTOR pathway (PMID: 38141929). Taking together it is possible that Gal-9 signaling through Tim-3 modulates cell metabolism by fine-tuning of the PI3K/AKT/mTOR pathway. While this remains to be evaluated, we can conclude that Tim-3 is required for Gal-9 mediated Treg expansion.
In the field of immunotherapy, there remains an open question of whether ICB acts by reinvigorating a tumor-resident T cell population or mobilization of T cells from outside the tumor also occurs. Studies in mice models revealed that stem-like T cells were critical for obtaining a positive tumor response upon application of single agent αPD-1 therapy or αPD-1 and αCTLA-4 combination therapy. However, by depleting stem-like T cells and thus leaving late-dysfunctional T cells, treatment with ICB still reduced tumor growth (14), thus indicating that this treatment not only prevents exhaustion but can also rescue exhausted cells. Other studies presented similar results (40, 46), supporting that early-dysfunctional T cells, but not late-dysfunctional T cells, may be responsible for the favorable responses observed with ICB therapies [Extensively reviewed in (43)]. Tim-3 targeting promotes IL-12-dependent antitumor immunity without altering immune infiltration (55), thus supporting a key role for this pathway in the peripheral activation of T cells and possibly early fate establishment during antigen presentation.
Herein we report that a CD8+ dysfunction molecular signature is positively correlated with LGALS9 levels. Importantly, the same signature applied to pre-treatment transcriptomic data from patients with melanoma who subsequently received ICIs, consistently out-performed all other candidate predictive biomarkers tested, including PD-L1 levels, tumor mutational burden, and an IFNγ signature (33). Given the results of our bioinformatic analysis, we evaluated if Gal-9 could provide a bypass to the presence of a PD1 blocking antibody. Even in presence of the αPD-1, Gal-9 increased the frequency of both the early (PD-1+Tim3+) and late (PD-1+Tim3+Lag3+) exhausted phenotypes. The participation of the Tim-3 receptor is highlighted by the effectively decreased frequency of these subsets. Of note, it was published that Gal-9 could also bind to PD-1, in a way that promoted a lattice formation between PD-1 and Tim-3, which was proposed to increase the stability of dysfunctional T cells, possibly by reducing Tim-3 mediated cell death (56). These results have clinical applicability as they suggest that the axis Gal-9/Tim-3 T cells can push T cells into a dysfunctional state even in the presence of an ICB antibody (Figure 6). Interestingly these results indicate not only that Gal-9 presence could provide a bypass to αPD-1 therapy and thus contribute to ICB resistance, but also shine a light on αPD-1’ mechanism. In our experiments, αPD-1 treatment effectively reduced the amount of dysfunctional T cells and thus a principal modus operandi of αPD-1 therapies may be to obstruct the differentiation of T cells into a dysfunctional state. Although the main discussion within the field has been that a durable response to α-PD1 therapy requires the presence of tumor-specific T cells with low levels of dysfunction, our results point to another possibility. Whether it is merely the levels of exhaustion, or also the presence of inhibitory ligands that are the determinants is yet to be ascertained. As T cell exhaustion is led by a robust system of inhibitory pathways, under the activation of other co-inhibitory pathways such as Gal-9/Tim-3, T cells may undergo this differentiation regardless of the αPD-1 treatment. In line with this idea, an immuno-predictive score for neuroblastoma based on the levels of inhibitory and activating immune-checkpoint genes, IMPRES, was found to be associated with immunologically hot tumors and longer overall survival in patients with untreated metastatic melanoma (57). In predicting responses to ICB in this setting, IMPRES strikingly achieved an overall accuracy of AUC = 0.83, outperforming existing predictors and capturing almost all true responders while misclassifying less than half of the non-responders. This work strengthens the hypothesis that a robust network of regulatory checkpoints is in operation to maintain the tumor immunosuppressive microenvironment (Figure 6). Noteworthy, our results showed that a combinatory strategy using αPD-1 together with αTim-3 effectively prevented the effects of Gal9 on T cell fate, further supporting the idea of combining ICB for cancer treatment. Encouragingly, there are 63 clinical trials of antibodies targeting Tim-3 either alone or in combination with PD-1 blockers. Moreover, Gal-9 is a secreted protein that can be detected in plasma, and thus future studies should examine the clinical benefit of evaluating Gal-9 and intra-tumor Tim-3 levels as a companion diagnostic for αPD-1 + αTim-3 combinatorial immunotherapy. Furthermore plasmatic Gal-9 may prove value as a resistance risk indicator for patients receiving ICB monotherapy and could signal when to begin combinatorial therapy.
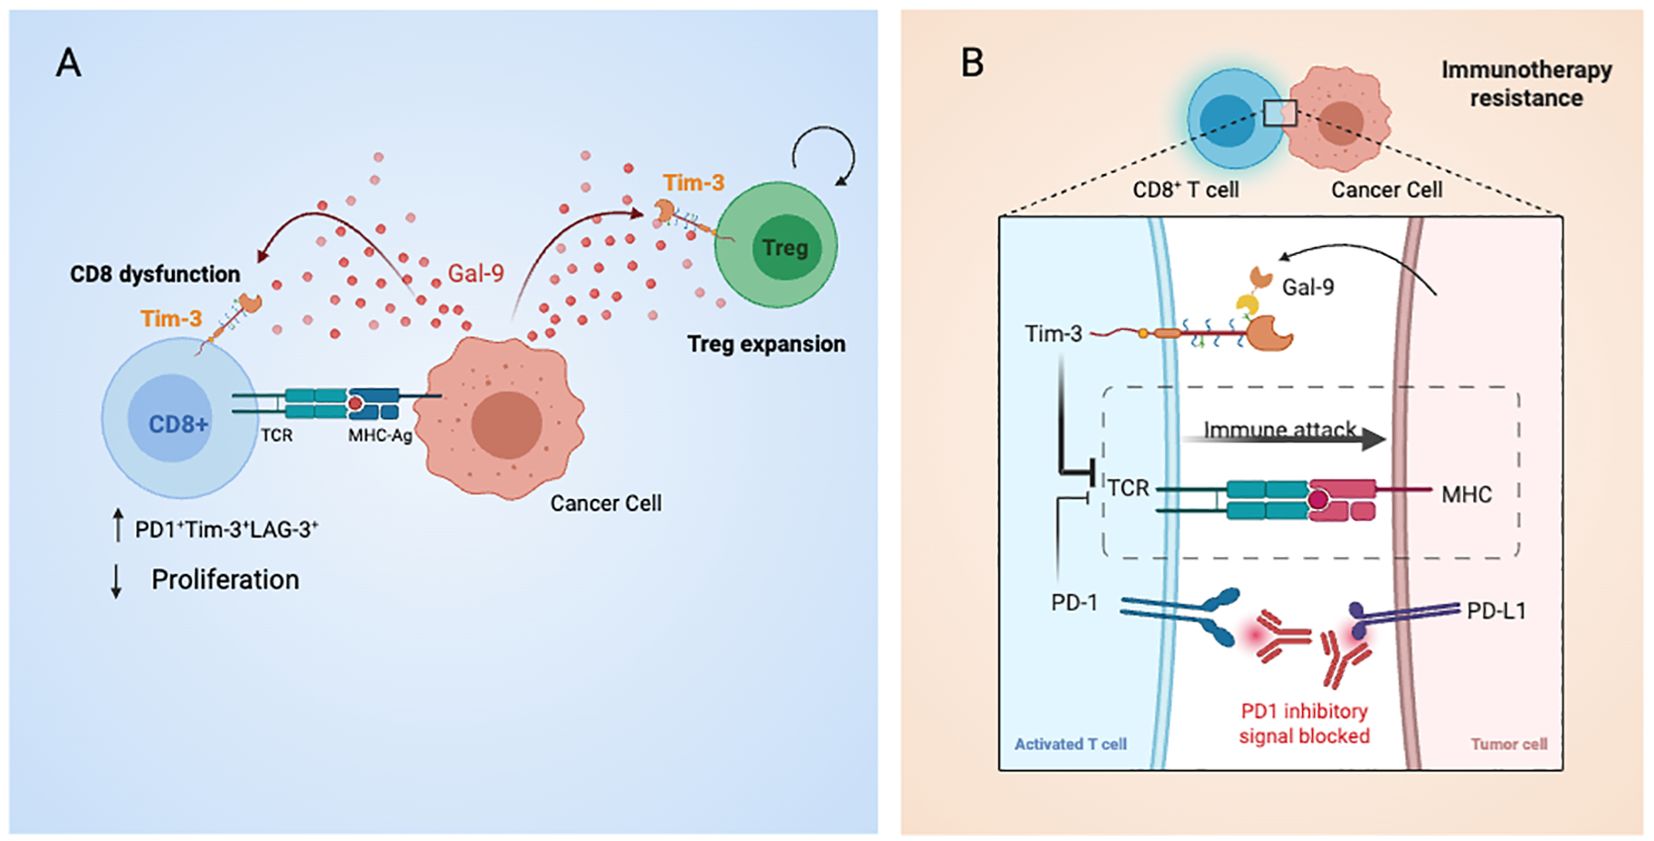
Figure 6. Graphical summary of Galectin-9-mediated immune modulation and checkpoint blockade bypass in gastric cancer. (A) Tumor cells secrete Galectin-9, which binds to Tim-3 on CD8+ T cells and Tregs, promoting T cell exhaustion and enhancing Treg suppressive activity. These effects contribute to immune evasion and resistance to PD-1 blockade. (B) Cell-to-cell interactions between antigen-presenting cells and T cells are shown, including TCR–MHC engagement and co-inhibitory signaling via PD-1 and Tim-3. Dual blockade with anti-PD-1 and anti-Tim-3 antibodies is proposed to restore effector T cell function and counteract Gal-9-driven immunosuppression.
In summary, this study combines transcriptomic analysis with ex vivo functional assays to uncover a role for Galectin-9 in promoting CD8+ T cell dysfunction and Treg expansion in gastric cancer. A major strength is the integration of patient-derived data with mechanistic in vitro validation. However, reliance on the TCGA database, which lacks treatment metadata and may introduce selection bias, limits the ability to generalize findings to treated populations. Further in vivo and clinical studies are warranted to confirm these observations.
Data availability statement
The raw data supporting the conclusions of this article will be made available by the authors, without undue reservation.
Ethics statement
The studies involving humans were approved by Pontificia Universidad Catolica de Chile. The studies were conducted in accordance with the local legislation and institutional requirements. The participants provided their written informed consent to participate in this study (Figure 6).
Author contributions
CH: Conceptualization, Formal analysis, Investigation, Methodology, Project administration, Writing – original draft, Writing – review & editing. GM: Investigation, Writing – review & editing, Formal analysis. CC: Formal analysis, Investigation, Writing – review & editing. AV-L: Methodology, Resources, Supervision, Writing – review & editing. PG: Investigation, Project administration, Writing – review & editing. AK: Funding acquisition, Resources, Writing – review & editing. PL-C: Conceptualization, Funding acquisition, Investigation, Methodology, Resources, Supervision, Writing – review & editing. GO: Conceptualization, Funding acquisition, Project administration, Supervision, Writing – review & editing. CA: Formal analysis, Investigation, Validation, Writing – review & editing.
Funding
The author(s) declare that financial support was received for the research and/or publication of this article. Millennium Institute on Immunology and Immunotherapy ANID ACE 210015 (CN09016 / ICN 2021045; former P09/016-F), ANID-FONDAP-15130011(APOYO 1523A0008) & 152220002, FONDECYT 1220586, 1180241, 1180173, 1211353 & 1250932 ANID—Basal funding for Scientific and Technological Center of Excellence, IMPACT, #FB210024.
Acknowledgments
Illustrations were made using Biorender.com.
Conflict of interest
The authors declare that the research was conducted in the absence of any commercial or financial relationships that could be construed as a potential conflict of interest.
Generative AI statement
The author(s) declare that no Generative AI was used in the creation of this manuscript.
Publisher’s note
All claims expressed in this article are solely those of the authors and do not necessarily represent those of their affiliated organizations, or those of the publisher, the editors and the reviewers. Any product that may be evaluated in this article, or claim that may be made by its manufacturer, is not guaranteed or endorsed by the publisher.
Supplementary material
The Supplementary Material for this article can be found online at: https://www.frontiersin.org/articles/10.3389/fimmu.2025.1600792/full#supplementary-material
References
1. Karimi P, Islami F, Anandasabapathy S, Freedman ND, and Kamangar F. Gastric cancer: descriptive epidemiology, risk factors, screening, and prevention. Cancer Epidemiol Biomarkers Prev. (2014) 23:700–13. doi: 10.1158/1055-9965.EPI-13-1057
2. Bray F, Ferlay J, Soerjomataram I, Siegel RL, Torre LA, and Jemal A. Global cancer statistics 2018: GLOBOCAN estimates of incidence and mortality worldwide for 36 cancers in 185 countries. CA Cancer J Clin. (2018) 68:394–424. doi: 10.3322/caac.21492
3. Thrift AP and El-Serag HB. Burden of gastric cancer. Clin Gastroenterol Hepatol. (2020) 18:534–42. doi: 10.1016/j.cgh.2019.07.045
4. Müller B, de La Fuente H H, Barajas B O, Cardemil J B, Vila T A, Mordojovich S E, et al. Registry of gastric cancer evaluation in Chile (REGATE): Basal clinical features of 523 patients. Rev Chil Cir. (2011) 63:147–53. doi: 10.4067/S0718-40262011000200004
5. Caglevic C, Silva S, Mahave M, Rolfo C, and Gallardo J. The current situation for gastric cancer in Chile. Ecancermedicalscience. (2016) 10:707. doi: 10.3332/ecancer.2016.707
6. Ohtsu A, Shimada Y, Shirao K, Boku N, Hyodo I, Saito H, et al. Randomized phase III trial of fluorouracil alone versus fluorouracil plus cisplatin versus uracil and tegafur plus mitomycin in patients with unresectable, advanced gastric cancer: The Japan Clinical Oncology Group Study (JCOG9205). J Clin Oncol. (2003) 21:54–9. doi: 10.1200/JCO.2003.04.130
7. Joshi SS, Maron SB, and Catenacci DV. Pembrolizumab for treatment of advanced gastric and gastroesophageal junction adenocarcinoma. Future Oncol. (2018) 14:417–30. doi: 10.2217/fon-2017-0436
8. Fuchs CS, Doi T, Jang RW, Muro K, Satoh T, Machado M, et al. Safety and efficacy of pembrolizumab monotherapy in patients with previously treated advanced gastric and gastroesophageal junction cancer: phase 2 clinical KEYNOTE-059 trial. JAMA Oncol. (2018) 4:e180013. doi: 10.1001/jamaoncol.2018.0013
9. Sakuishi K, Apetoh L, Sullivan JM, Blazar BR, Kuchroo VK, and Anderson AC. Targeting Tim-3 and PD-1 pathways to reverse T cell exhaustion and restore anti-tumor immunity. J Exp Med. (2010) 207:2187–94. doi: 10.1084/jem.20100643
10. Fourcade J, Sun Z, Pagliano O, Chauvin J-M, Sander C, Janjic B, et al. PD-1 and Tim-3 regulate the expansion of tumor antigen-specific CD8+ T cells induced by melanoma vaccines. Cancer Res. (2014) 74:1045–55. doi: 10.1158/0008-5472.CAN-13-2908
11. Jin H-T, Anderson AC, Tan WG, West EE, Ha S-J, Araki K, et al. Cooperation of Tim-3 and PD-1 in CD8 T-cell exhaustion during chronic viral infection. Proc Natl Acad Sci U S A. (2010) 107:14733–8. doi: 10.1073/pnas.1009731107
12. Dardalhon V, Anderson AC, Karman J, Apetoh L, Chandwaskar R, Lee DH, et al. Tim-3/galectin-9 pathway: regulation of Th1 immunity through promotion of CD11b+Ly-6G+ myeloid cells. J Immunol. (2010) 185:1383–92. doi: 10.4049/jimmunol.0903275
13. Kurtulus S, Madi A, Escobar G, Klapholz M, Nyman J, Christian E, et al. Checkpoint blockade immunotherapy induces dynamic changes in PD-1-CD8+ Tumor-infiltrating T cells. Immunity. (2019) 50:181–94.e6. doi: 10.1016/j.immuni.2018.11.014
14. Siddiqui I, Schaeuble K, Chennupati V, Fuertes Marraco SA, Calderon-Copete S, Pais Ferreira D, et al. Intratumoral tcf1+PD-1+CD8+ T cells with stem-like properties promote tumor control in response to vaccination and checkpoint blockade immunotherapy. Immunity. (2019) 50:195–211.e10. doi: 10.1016/j.immuni.2018.12.021
15. Wu T, Ji Y, Moseman EA, Xu HC, Manglani M, Kirby M, et al. The TCF1-Bcl6 axis counteracts type I interferon to repress exhaustion and maintain T cell stemness. Sci Immunol. (2016) 1. doi: 10.1126/sciimmunol.aai8593
16. Brummelman J, Mazza EMC, Alvisi G, Colombo FS, Grilli A, Mikulak J, et al. High-dimensional single cell analysis identifies stem-like cytotoxic CD8+ T cells infiltrating human tumors. J Exp Med. (2018) 215:2520–35. doi: 10.1084/jem.20180684
17. Miller BC, Sen DR, Al Abosy R, Bi K, Virkud YV, LaFleur MW, et al. Subsets of exhausted CD8+ T cells differentially mediate tumor control and respond to checkpoint blockade. Nat Immunol. (2019) 20:326–36. doi: 10.1038/s41590-019-0312-6
18. Koyama S, Akbay EA, Li YY, Herter-Sprie GS, Buczkowski KA, Richards WG, et al. Adaptive resistance to therapeutic PD-1 blockade is associated with upregulation of alternative immune checkpoints. Nat Commun. (2016) 7:10501. doi: 10.1038/ncomms10501
19. Nebbia G, Peppa D, Schurich A, Khanna P, Singh HD, Cheng Y, et al. Upregulation of the Tim-3/galectin-9 pathway of T cell exhaustion in chronic hepatitis B virus infection. PloS One. (2012) 7:e47648. doi: 10.1371/journal.pone.0047648
20. Ngiow SF, von Scheidt B, Akiba H, Yagita H, Teng MWL, and Smyth MJ. Anti-TIM3 antibody promotes T cell IFN-γ-mediated antitumor immunity and suppresses established tumors. Cancer Res. (2011) 71:3540–51. doi: 10.1158/0008-5472.CAN-11-0096
21. Zhou Q, Munger ME, Veenstra RG, Weigel BJ, Hirashima M, Munn DH, et al. Coexpression of Tim-3 and PD-1 identifies a CD8+ T-cell exhaustion phenotype in mice with disseminated acute myelogenous leukemia. Blood. (2011) 117:4501–10. doi: 10.1182/blood-2010-10-310425
22. Golden-Mason L, Palmer BE, Kassam N, Townshend-Bulson L, Livingston S, McMahon BJ, et al. Negative immune regulator Tim-3 is overexpressed on T cells in hepatitis C virus infection and its blockade rescues dysfunctional CD4+ and CD8+ T cells. J Virol. (2009) 83:9122–30. doi: 10.1128/JVI.00639-09
23. Sakuishi K, Ngiow SF, Sullivan JM, Teng MWL, Kuchroo VK, Smyth MJ, et al. TIM3+FOXP3+ regulatory T cells are tissue-specific promoters of T-cell dysfunction in cancer. Oncoimmunology. (2013) 2:e23849. doi: 10.4161/onci.23849
24. Yan J, Zhang Y, Zhang J-P, Liang J, Li L, and Zheng L. Tim-3 expression defines regulatory T cells in human tumors. PloS One. (2013) 8:e58006. doi: 10.1371/journal.pone.0058006
25. Gao X, Zhu Y, Li G, Huang H, Zhang G, Wang F, et al. TIM-3 expression characterizes regulatory T cells in tumor tissues and is associated with lung cancer progression. PloS One. (2012) 7:e30676. doi: 10.1371/journal.pone.0030676
26. Li S, Wan J, Anderson W, Sun H, Zhang H, Peng X, et al. Downregulation of IL-10 secretion by Treg cells in osteoarthritis is associated with a reduction in Tim-3 expression. BioMed Pharmacother. (2016) 79:159–65. doi: 10.1016/j.biopha.2016.01.036
27. Liu J-F, Wu L, Yang L-L, Deng W-W, Mao L, Wu H, et al. Blockade of TIM3 relieves immunosuppression through reducing regulatory T cells in head and neck cancer. J Exp Clin Cancer Res. (2018) 37:44. doi: 10.1186/s13046-018-0713-7
28. Bu M, Shen Y, Seeger WL, An S, Qi R, Sanderson JA, et al. Ovarian carcinoma-infiltrating regulatory T cells were more potent suppressors of CD8(+) T cell inflammation than their peripheral counterparts, a function dependent on TIM3 expression. Tumour Biol. (2016) 37:3949–56. doi: 10.1007/s13277-015-4237-x
29. Jiang J, Jin M-S, Kong F, Cao D, Ma H-X, Jia Z, et al. Decreased galectin-9 and increased Tim-3 expression are related to poor prognosis in gastric cancer. PloS One. (2013) 8:e81799. doi: 10.1371/journal.pone.0081799
30. Wang Y, Zhao E, Zhang Z, Zhao G, and Cao H. Association between Tim−3 and Gal−9 expression and gastric cancer prognosis. Oncol Rep. (2018) 40:2115–26. doi: 10.3892/or.2018.6627
31. Choi SI, Seo KW, Kook MC, Kim CG, Kim YW, and Cho SJ. Prognostic value of tumoral expression of galectin-9 in gastric cancer. Turk J Gastroenterol. (2017) 28:166–70. doi: 10.5152/tjg.2017.16346
32. Zhang Y, Cai P, Liang T, Wang L, and Hu L. TIM-3 is a potential prognostic marker for patients with solid tumors: A systematic review and meta-analysis. Oncotarget. (2017) 8:31705–13. doi: 10.18632/oncotarget.15954
33. Jiang P, Gu S, Pan D, Fu J, Sahu A, Hu X, et al. Signatures of T cell dysfunction and exclusion predict cancer immunotherapy response. Nat Med. (2018) 24:1550–8. doi: 10.1038/s41591-018-0136-1
34. Magnuson AM, Kiner E, Ergun A, Park JS, Asinovski N, Ortiz-Lopez A, et al. Identification and validation of a tumor-infiltrating Treg transcriptional signature conserved across species and tumor types. Proc Natl Acad Sci U S A. (2018) 115:E10672–81. doi: 10.1073/pnas.1810580115
35. Sandoval-Bórquez A, Polakovicova I, Carrasco-Véliz N, Lobos-González L, Riquelme I, Carrasco-Avino G, et al. MicroRNA-335-5p is a potential suppressor of metastasis and invasion in gastric cancer. Clin Epigen. (2017) 9:114. doi: 10.1186/s13148-017-0413-8
36. Cho S-J, Kook M-C, Lee JH, Shin J-Y, Park J, Bae Y-K, et al. Peroxisome proliferator-activated receptor γ upregulates galectin-9 and predicts prognosis in intestinal-type gastric cancer. Int J Cancer. (2015) 136:810–20. doi: 10.1002/ijc.v136.4
37. Irie A, Yamauchi A, Kontani K, Kihara M, Liu D, Shirato Y, et al. Galectin-9 as a prognostic factor with antimetastatic potential in breast cancer. Clin Cancer Res. (2005) 11:2962–8. doi: 10.1158/1078-0432.CCR-04-0861
38. Bunney PE, Zink AN, Holm AA, Billington CJ, and Kotz CM. Orexin activation counteracts decreases in nonexercise activity thermogenesis (NEAT) caused by high-fat diet. Physiol Behav. (2017) 176:139–48. doi: 10.1016/j.physbeh.2017.03.040
39. Baitsch L, Baumgaertner P, Devêvre E, Raghav SK, Legat A, Barba L, et al. Exhaustion of tumor-specific CD8+ T cells in metastases from melanoma patients. J Clin Invest. (2011) 121:2350–60. doi: 10.1172/JCI46102
40. Thommen DS, Koelzer VH, Herzig P, Roller A, Trefny M, Dimeloe S, et al. A transcriptionally and functionally distinct PD-1+ CD8+ T cell pool with predictive potential in non-small-cell lung cancer treated with PD-1 blockade. Nat Med. (2018) 24:994–1004. doi: 10.1038/s41591-018-0057-z
41. Blackburn SD, Shin H, Freeman GJ, and Wherry EJ. Selective expansion of a subset of exhausted CD8 T cells by alphaPD-L1 blockade. Proc Natl Acad Sci U S A. (2008) 105:15016–21. doi: 10.1073/pnas.0801497105
42. Wherry EJ, Blattman JN, Murali-Krishna K, van der Most R, and Ahmed R. Viral persistence alters CD8 T-cell immunodominance and tissue distribution and results in distinct stages of functional impairment. J Virol. (2003) 77:4911–27. doi: 10.1128/JVI.77.8.4911-4927.2003
43. van der Leun AM, Thommen DS, and Schumacher TN. CD8+ T cell states in human cancer: insights from single-cell analysis. Nat Rev Cancer. (2020) 20:218–32. doi: 10.1038/s41568-019-0235-4
44. Li H, van der Leun AM, Yofe I, Lubling Y, Gelbard-Solodkin D, van Akkooi ACJ, et al. Dysfunctional CD8 T cells form a proliferative, dynamically regulated compartment within human melanoma. Cell. (2019) 176:775–89.e18. doi: 10.1016/j.cell.2018.11.043
45. Sade-Feldman M, Yizhak K, Bjorgaard SL, Ray JP, de Boer CG, Jenkins RW, et al. Defining T cell states associated with response to checkpoint immunotherapy in melanoma. Cell. (2018) 175:998–1013.e20. doi: 10.1016/j.cell.2018.10.038
46. Clarke J, Panwar B, Madrigal A, Singh D, Gujar R, Wood O, et al. Single-cell transcriptomic analysis of tissue-resident memory T cells in human lung cancer. J Exp Med. (2019) 216:2128–49. doi: 10.1084/jem.20190249
47. Savas P, Virassamy B, Ye C, Salim A, Mintoff CP, Caramia F, et al. Single-cell profiling of breast cancer T cells reveals a tissue-resident memory subset associated with improved prognosis. Nat Med. (2018) 24:986–93. doi: 10.1038/s41591-018-0078-7
48. Li Z, Liu X, Guo R, and Wang P. TIM-3 plays a more important role than PD-1 in the functional impairments of cytotoxic T cells of Malignant Schwannomas. Tumour Biol. (2017) 39:1010428317698352. doi: 10.1177/1010428317698352
49. Scott AC, Dündar F, Zumbo P, et al. TOX is a critical regulator of tumour-specific T cell differentiation. Nature. (2019) 571:270–4. doi: 10.1038/s41586-019-1324-y
50. Ahrends T and Borst J. The opposing roles of CD4+ T cells in anti-tumour immunity. Immunology. (2018) 154:582–92. doi: 10.1111/imm.2018.154.issue-4
51. Saleh R and Elkord E. Treg-mediated acquired resistance to immune checkpoint inhibitors. Cancer Lett. (2019) 457:168–79. doi: 10.1016/j.canlet.2019.05.003
52. Zhang H, Li Y, Liu X, et al. ImmTAC/Anti-PD-1 antibody combination to enhance killing of cancer cells by reversing regulatory T-cell-mediated immunosuppression. Immunology. (2018) 155:238–50. doi: 10.1111/imm.2018.155.issue-2
53. Wu C, Thalhamer T, Franca RF, et al. Galectin-9-CD44 interaction enhances stability and function of adaptive regulatory T cells. Immunity. (2014) 41:270–82. doi: 10.1016/j.immuni.2014.06.011
54. Liu J, Huang S, Su X-Z, Song J, and Lu F. Blockage of galectin-receptor interactions by α-lactose exacerbates plasmodium berghei-induced pulmonary immunopathology. Sci Rep. (2016) 6:32024. doi: 10.1038/srep32024
55. Gardner A, de Mingo Pulido Á, Hänggi K, Bazargan S, Onimus A, Kasprzak A, et al. TIM-3 blockade enhances IL-12-dependent antitumor immunity by promoting CD8+ T cell and XCR1+ dendritic cell spatial co-localization. J Immunother Cancer. (2022) 10. doi: 10.1136/jitc-2021-003571
56. Yang R, Sun L, Li C-F, Wang Y-H, Yao J, Li H, et al. Galectin-9 interacts with PD-1 and TIM-3 to regulate T cell death and is a target for cancer immunotherapy. Nat Commun. (2021) 12:832. doi: 10.1038/s41467-021-21099-2
Keywords: gastric cancer, immune checkpoint blockade, galectin-9, TIM-3, anti-PD1
Citation: Hill CN, Maita G, Cabrolier C, Aros C, Vega-Letter AM, Gonzalez P, Kalergis AM, Luz-Crawford P and Owen GI (2025) Galectin-9 and Tim-3 in gastric cancer: a checkpoint axis driving T cell exhaustion and Treg-mediated immunosuppression independently of anti-PD-1 blockade. Front. Immunol. 16:1600792. doi: 10.3389/fimmu.2025.1600792
Received: 26 March 2025; Accepted: 22 May 2025;
Published: 01 July 2025.
Edited by:
Anand Rotte, Arcellx Inc., United StatesReviewed by:
Frankie Chi Fat Ko, The University of Hong Kong, Hong Kong SAR, ChinaChao Yang, St. Jude Children’s Research Hospital, United States
Copyright © 2025 Hill, Maita, Cabrolier, Aros, Vega-Letter, Gonzalez, Kalergis, Luz-Crawford and Owen. This is an open-access article distributed under the terms of the Creative Commons Attribution License (CC BY). The use, distribution or reproduction in other forums is permitted, provided the original author(s) and the copyright owner(s) are credited and that the original publication in this journal is cited, in accordance with accepted academic practice. No use, distribution or reproduction is permitted which does not comply with these terms.
*Correspondence: Patricia Luz-Crawford, cGx1ekB1YW5kZXMuY2w=; Gareth I. Owen, Z293ZW5AYmlvLnB1Yy5jbA==