 Zhuoqi Li1†
 Mei Tian2†
 Yuanhui Yang3†Yuanyuan Wang4†Lu Zhang1Fujing Huang1
 Xiao Wen1Xiaoshu Yin1
 Xiaoyan Lin3,5*
 Yuan Tian1*
- 1Department of Radiotherapy Oncology, Affiliated Hospital of Shandong University of Traditional Chinese Medicine, Jinan, China
- 2Department of Respiratory and Critical Care Medicine, Affiliated Hospital of Shandong University of Traditional Chinese Medicine, Jinan, China
- 3Department of Pathology, Shandong Provincial Hospital, Shandong University, Jinan, China
- 4Department of Oncology, The Second Affiliated Hospital of Shandong University of Traditional Chinese Medicine, Jinan, Shandong, China
- 5Department of Pathology, Shandong Provincial Hospital Affiliated to Shandong First Medical University, Jinan, China
Purpose: To investigate the functions of lung TRM cells in the development and treatment of lung adenocarcinoma (LUAD).
Methods: R-language bioinformatics analysis was applied to obtain differentially expressed (DE) lung TRM cell-specific genes and a related prognostic signature, which were further validated using external datasets, immunohistochemical staining images, and biological experiments.
Results: A total of 130 DE lung TRM cell-specific genes were identified, 14 of which were involved in the prognostic signature, including SLC16A3, ARHGAP11A, PTTG1, DTL, GPRIN1, EXO1, GAPDH, TYMS, DAPK2, CCL20, HLA-DQA1, ADAM12, ALOX5AP and OASL. The signature was efficient and robust in predicting the overall survival and anti-PD-1/PD-L1 immunotherapeutic outcomes of patients with LUAD. The AUCs for predicting the 1-, 3-, and 5-year survival rates were 0.688, 0.698, and 0.648, respectively, in the training cohort, and were 0.867, 0.662, and 0.672, respectively, in the validation cohort. The signature also had predictive value for the sensitivity of patients to chemical drugs. TYMS was a hub gene in the prognostic signature, and was strongly associated with LUAD progression and cell proliferation in the experimental validation.
Conclusions: The lung TRM cell-related prognostic signature is an effective tool for predicting the prognosis and therapeutic outcomes of patients with LUAD.
1 Introduction
Tissue-resident memory T (TRM) cells are a special subpopulation of memory T cells that were recently discovered to reside in non-lymphoid tissues without entering the bloodstream (1). TRM cells can reside in a wide range of tissues, including epithelial barrier tissues, such as the lungs, gastrointestinal tract, and skin, as well as non-barrier tissues, such as the brain, kidneys, and joints (2–4). TRM cells are also found in many types of tumor tissues, such as lung cancer, breast cancer, intestinal cancer, ovarian cancer, and melanoma tissues, and they play important roles in anti-tumoral immunology (5–9). The infiltration of TRM cells is a favorable factor for the prognosis of cancer patients, and the abundance of CD103+CD8+T cells in tumor tissues is correlated with increased disease-free survival and overall survival in patients with lung, breast, endometrial, and ovarian cancers (10). However, the underlying mechanisms are not well understood.
Recently, it has been demonstrated that TRM cells in different organs and tissue sites are specific and play different roles (11). Through the integration of single-cell protein and transcriptome analyses, TRM cell-specific genes associated with major barrier sites in the human body, such as the lungs, skin, and jejunum, were identified, and these TRM cell-specific genes were closely related to the specific functions of each organ (11). Whether the TRM cell-specific genes of an organ can regulate TRM cells to exert specific immune responses against tumors at that tissue site is a question that needs to be addressed.
Lung cancer remains one of the most prevalent cancers worldwide and causes the most cancer-related deaths (12). Lung adenocarcinoma (LUAD) is a type of non-small-cell lung cancer that accounts for the highest percentage of lung cancer cases. LUAD is often accompanied by both genomic and morphological abnormalities. However, its pathogenesis is not well understood, and more effective treatments are currently being explored (13, 14). The tumor immune microenvironment (TME) is an important cause of heterogeneity in lung adenocarcinoma and can influence disease progression and the response to therapy (15). TRM cells are important components of the tumor microenvironment, and the infiltration of CD103+CD8+TRM cells into the tumor microenvironment has been reported to be a favorable prognostic factor for patients with LUAD (16–20). However, the underlying mechanisms have not yet been elucidated.
Although the role of TRM cells in lung cancer immunomodulation and immunotherapy has been partially reported in some studies, research methods have been limited mostly to experiments on cells and animals, and there are few reports on the use of bioinformatics methods to explore novel biomarkers that can regulate the functions of TRM cells and potentially become predictive and therapeutic biomarkers. In this study, the lung TRM cell-specific genes identified in previous studies were subjected to bioinformatics analysis in many LUAD samples to identify novel potential biomarkers related to the prognosis, TME landscape, and immunotherapy of patients with LUAD. The functions of key genes in LUAD were validated using in vitro experiments. These findings may help elucidate the roles of TRM cells in LUAD and identify novel biomarkers for personalized prediction and treatment of LUAD.
2 Materials and methods
2.1 Data collection and preprocessing
The R package “TCGAbiolinks” was used to download the log-transformed FPKM expression profiles and clinical information from the TCGA-LUAD dataset. A total of 497 tumor samples with both expression data and survival information were retained for the construction of the prognostic signature. The GSE41271 and GSE42127 bulk expression datasets were downloaded from the Gene Expression Omnibus (GEO) database (https://www.ncbi.nlm.nih.gov/geo/) and were used to validate the prognostic signature. The data processing standard of the GEO bulk expression dataset was as follows: the probes were converted to gene symbols according to the probe correspondence with the platform. If one probe corresponded to multiple genes, the probe was removed, and if multiple probes corresponded to the same symbol, the median value was taken. Single-cell RNA-seq data were obtained from the GSE131907 dataset of the GEO database. Fifteen primary LUAD samples from the GSE131907 dataset were used for the analyses. The clinical and transcriptomic data of the GSE126044 and GSE135222 cohorts, in which NSCLC patients were treated with the PD-1/PD-L1 blockade, were downloaded from the GEO database and used to evaluate the predictive efficacy of the prognostic signature. A total of 480 lung TRM cell-specific genes were obtained from a previous publication (11).
2.2 Identification of differentially expressed lung TRM cell-related genes
The R package “limma” was used to identify the differentially expressed genes (DEGs) between LUAD and adjacent normal tissues, with thresholds set at |log2FC|≥1 and FDR<0.05. The DEGs intersecting with the lung TRM cell-specific genes were regarded as differentially expressed (DE) TRM cell-related genes and were chosen for subsequent analysis.
2.3 Construction of protein-protein interaction networks (PPIs) for DE lung TRM cell-related genes
The interactive relationships of the lung TRM cell-related genes were acquired from the STRING database (https://www.string-db.org/), and a protein-protein interaction (PPI) was constructed based on this information.
2.4 Functional enrichment of the DE lung TRM cell-specific genes
The R package “clusterProfiler” was applied for the functional annotation of the DE lung TRM cell-related genes, with the p-value cutoff set at 0.05. Functional enrichment analysis was performed to predict the potential biological functions of these genes.
2.5 Construction of the lung TRM-related prognostic signature
Univariate Cox regression analysis was used to determine the hazard ratios (HR) and prognostic significance. Genes with p values < 0.05 were prognosis-associated genes. Least Absolute Shrinkage and Selection Operator (LASSO) regression analysis was applied to further identify key prognostic factors, and a risk score model for predicting survival was constructed by weighting the expression of each key prognostic gene with LASSO regression coefficients (“exp” represents the expression level of the genes, and “coef” represents the Cox regression coefficient):
The patients were divided into high-risk and low-risk groups based on the median risk score. The “Kaplan-Meier” method was used to generate survival curves for the prognostic analysis, and the “log-rank” test was used to evaluate the significance of the differences in overall survival between groups. The receiver operating characteristic (ROC) curve was used to assess the predictive efficacy of the prognostic models. The R package “timeROC” was used to visualize the “area under the curve” (AUC). Univariate and multivariate Cox regression analyses were performed to evaluate the independent predictive value of the prognostic model.
2.6 Evaluation of the TME landscape
The “ESTIMATE” algorithm was used to calculate the immunity score, stroma score, and tumor purity for each tumor sample, and then the “Wilcoxon” test was subsequently used to compare the differences in the immunity score, stroma score, and tumor purity among different subgroups of samples. The correlations between the risk score and the immunity score, stroma score, and tumor purity were calculated using Spearman analysis. Single-sample gene set enrichment analysis (ssGSEA) was used to evaluate the relative abundance of each infiltrating cell in the TME. The gene sets of the 28 types of immune cells used in the analysis were obtained from a previous publication (21). The R packages “GSVA” and “GSEABase” were used to compare the differences in biological pathways and immune functions.
2.7 Prediction of drug sensitivity
The “calcPhenotype” function of the R package “oncoPredict” was used to assess the IC50 values of the samples for the drugs. The correlation coefficients between the risk score, the expression of genes included in the prognostic model, and the drug IC50 values were calculated using Spearman analysis.
2.8 Quality control for the scRNA-seq data
The R package “Seurat” (version 4.1.0) was used for quality control of the scRNA-seq data. To exclude some low-quality cells and genes expressed at low levels, we set the thresholds as follows (1): each gene was expressed in at least three cells (2); the number of features per cell was between 500 and 6000, and the number of counts per cell was between 1000 and 20,000; and (3) the number of mitochondrial and erythrocyte genes was less than 20% of the total number of genes in each cell. Next, the “NormalizeData” function was used for normalization, and the “FindVariableFeatures” function was used to identify highly variable genes on the basis of their average expression values (greater than 0.1 and less than 3) and dispersion (greater than 0.5). The R package “Harmony” was used to perform batch correction between the samples to avoid batch effects interfering with downstream analysis. The data were then scale transformed and downscaled via principal component analysis (PCA), and the top 50 principal components were selected for downstream analysis and visualized via the “RunTSNE” function.
2.9 Identification of the subtypes of malignant tumor cells
Malignant cells in which at least two model genes were detected were selected for subsequent analysis. After standardization, normalization, identification of highly variable genes, removal of batch effects and PCA, the first 50 principal components were selected at a resolution of 0.1. Three subtypes of tumor cells were subsequently identified by clustering and grouping again. The marker genes of each subtype of tumor cells were identified via the “FindAllMarkers” function (avg_log2fc > 0.25, p_val_adj < 0.05). The CellScore was calculated based on the genes included in the prognostic model via the “AddModuleScore” function of the “Seurat” package. The malignant cells were divided into high and low groups based on the median cell score.
2.10 Trajectory analysis and cellular communication analysis
The R package “monocle2” was used to conduct the trajectory analysis of the tumor cells. Different states reflect the internal transformation of tumor cells. The R package “CellChat” was used to analyze the communication between tumor cells and other cells.
2.11 Validation of the expression levels of genes via immunohistochemical staining images
The expression levels of the genes included in the lung TRM cell-related prognostic model were validated at the protein level using immunohistochemical staining images from the Human Protein Atlas database (https://www.proteinatlas.org/). The staining intensity levels of each gene in normal lung tissues and LUAD tissues were observed and compared.
2.12 Clinical sample collection and immunohistochemistry
Lung adenocarcinoma samples were collected from the pathology department of Shandong Provincial Hospital from 2017 to 2021. Written informed consent was obtained from all participants. Tumor tissues were obtained from excised biopsies, fixed in formalin and embedded in paraffin (FFPE) for histological evaluation. After paraffin wax removal and rehydration, the sections were placed in citrate antigen retrieval solution and boiled for 15 minutes for antigen retrieval. An endogenous peroxidase blocker was then added to block the endogenous peroxidase activity in the sections. After incubation at room temperature for 30 min, 50 µL of goat serum working solution was added to each sample, which was subsequently incubated at 37°C for 20 min to block nonspecific staining. The sections were subsequently incubated with a primary antibody (rabbit anti-thymidylate synthase antibody, 1:100, ab108995, Abcam) for 1 h at 37°C. After 3 × 5-minute washes with PBS, the sections were incubated with a biotinylated secondary antibody at room temperature for 30 min, followed by subsequent washes (3 × 5 min in PBS). The sections were subsequently dried with absorbent paper and incubated with 50 µL horseradish peroxidase-labeled streptavidin for 20 min at 37°C. The sections were then rinsed with PBS for 3 × 5 min each. After immunostaining, the sections were visualized using an MBMbio Intelligence 400 scanner according to the manufacturer’s protocol. The slides were independently examined by two experienced pathologists according to the WHO criteria. The expression levels of each gene were characterized using a scoring system. The staining intensity was graded into four levels: 0, no positive staining (negative), 1 point for light yellow (weakly positive), 2 points for brownish yellow (positive); and 3, dark brown (strongly positive). The percentage of positive cells was also classified into four levels: 1 point was given when it was ≤25%, 2 points when it ranged from 26% to 50%, 3 points when it was between 51% and 75%, and 4 points when it was >75%. The final scoring results were obtained by multiplying the scores of the above two items. Based on the results, the samples were divided into four grades: negative expression (0 points), low expression (1–4 points), moderate expression (5–8 points) and high expression (9–12 points).
2.13 Cell lines and culture
The human cell line, H1395, was purchased from the National Laboratory Cell Resource Sharing Platform (Beijing, China) at the beginning of this study, with STR authentications. H1395 cells were cultured in RPMI 1640 medium supplemented with 10% fetal bovine serum (FBS) and 100 U/mL penicillin/streptomycin (Invitrogen, Carlsbad, CA, USA) at 37°C in a humidified incubator with 5% CO2.
2.14 siRNA design and transfection
The siRNA oligo sequences (5’-3’) against TYMS mRNAs (si-TYMS-1#: sense, GGGAUUCUCCACCAGAGAATT; antisense, UUCUCUGGUGGAGAAUCCCTT; si-TYMS-2#: sense, CCAACUGCAAAGAGUGAUUTT; antisense, AAUCACUCUUUGCAGUUGGTT) were synthesized by GenePharma Co. (Shanghai, China). H1395 cells were transfected with the siRNAs using Omifection-R (OMIGET, China) siRNA transfection reagent according to the manufacturer’s instructions when the cells reached a confluence of 60–80% confluence. The successful knockdown of TYMS expression was confirmed by quantitative RT-PCR (qRT-PCR) and western blotting 48 h post-transfection. Scramble siRNAs (sense: 5’-UUCUCCGAACGUGUCACGUTT-3’; antisense: 5’-ACGUGACACGUUCGGAGAATT-3’) were used as negative controls.
2.15 RNA extraction and quantitative real-time PCR
The total RNA of the cell lines was isolated using the Total RNA Isolation kit (TRIcom Reagent) of GenStone Biotech and then reverse-transcribed into cDNA using TransScript First-Strand cDNA Synthesis SuperMix (TransGen Biotech, China) according to the manufacturer’s instructions. Next, qRT-PCR was performed using the FastStart Universal SYBR Green Master (ROX) (Roche, Germany) on an ABI-7500 Fast system (Applied Biosystems). ALU was used as the endogenous reference gene for the cultured cell lines. Each sample was analyzed quantitatively in six replicates. The relative expression levels of these genes were determined using the ΔΔCt method. The differences in target gene expression between different groups were analyzed using the Kruskal-Wallis test and plotted using GraphPad Prism 10.1.2. P < 0.05 was considered statistically significant (***indicates p < 0.001). The primer sequences are shown in Table 1.
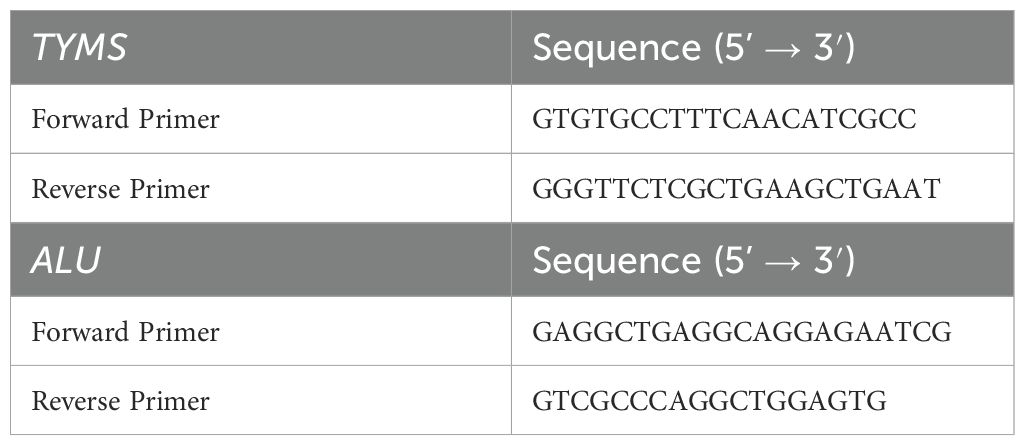
Table 1. The sequences of the primers used in the study.
2.16 Western blotting
Total protein was extracted from cultured cells using RIPA buffer. Primary polyclonal antibodies against TYMS (15047-1-AP, ProteinTech) and β-Actin (66009-1-Ig, ProteinTech) were used at dilutions of 1:3,000 and 1:20,000, respectively. The signals were visualized using an enhanced chemiluminescence kit (Millipore) and an Alpha Imager system.
2.17 Assessment of cell proliferation with IncuCyte
The long-term dynamic proliferation of the H1395 cells was observed using a long-term dynamic observation platform (IncuCyte, Essen, MI, USA). The cells were seeded into 96-well plates (3000 cells per well, six wells per group) and cultured for 120 h to generate proliferation curves. The cells were photographed every 24 h on the platform and analyzed using IncuCyte ZOOM software (Essen, Ann Arbor, MI, USA).
2.18 Statistical analysis
All analyses were performed using R software (version 4.4.2). For significance analysis between various values (such as expression levels, infiltration ratios, and various eigenvalues), the Wilcoxon rank-sum test was applied to compare the differences between two groups of samples, and the Kruskal-Wallis test was used to compare the differences between multiple groups of samples. For the plot presentation, ns indicates p > 0.05, * indicates p < 0.05, ** indicates p < 0.01, *** indicates p < 0.001, and **** indicates p < 0.0001. Survival curves for the prognostic analysis were generated using the Kaplan-Meier method, and the significance of the differences was determined using the log-rank test.
3 Results
3.1 Identification of DE lung TRM cell-specific genes
A flow chart of the study is shown in Figure 1. To assess whether the expression of lung TRM-cell-specific genes affects tumorigenesis and tumor progression in LUAD, differential expression analysis was performed in LUAD and adjacent normal tissues. First, 1002 downregulated genes and 741 upregulated genes in tumor tissues were screened (Figures 2A, B; Supplementary Table 1), including 130 lung TRM cell-specific genes (Figure 2C; Supplementary Table 2). Protein-protein interaction network (PPI) analysis results revealed extensive interactions among the DE lung TRM cell-specific genes, and the node connectivity of the RRM2, CDK1, CCNA2 and EXO1 genes was relatively high, which may indicate that these genes play a dominant role in the regulatory network (Figure 2D).
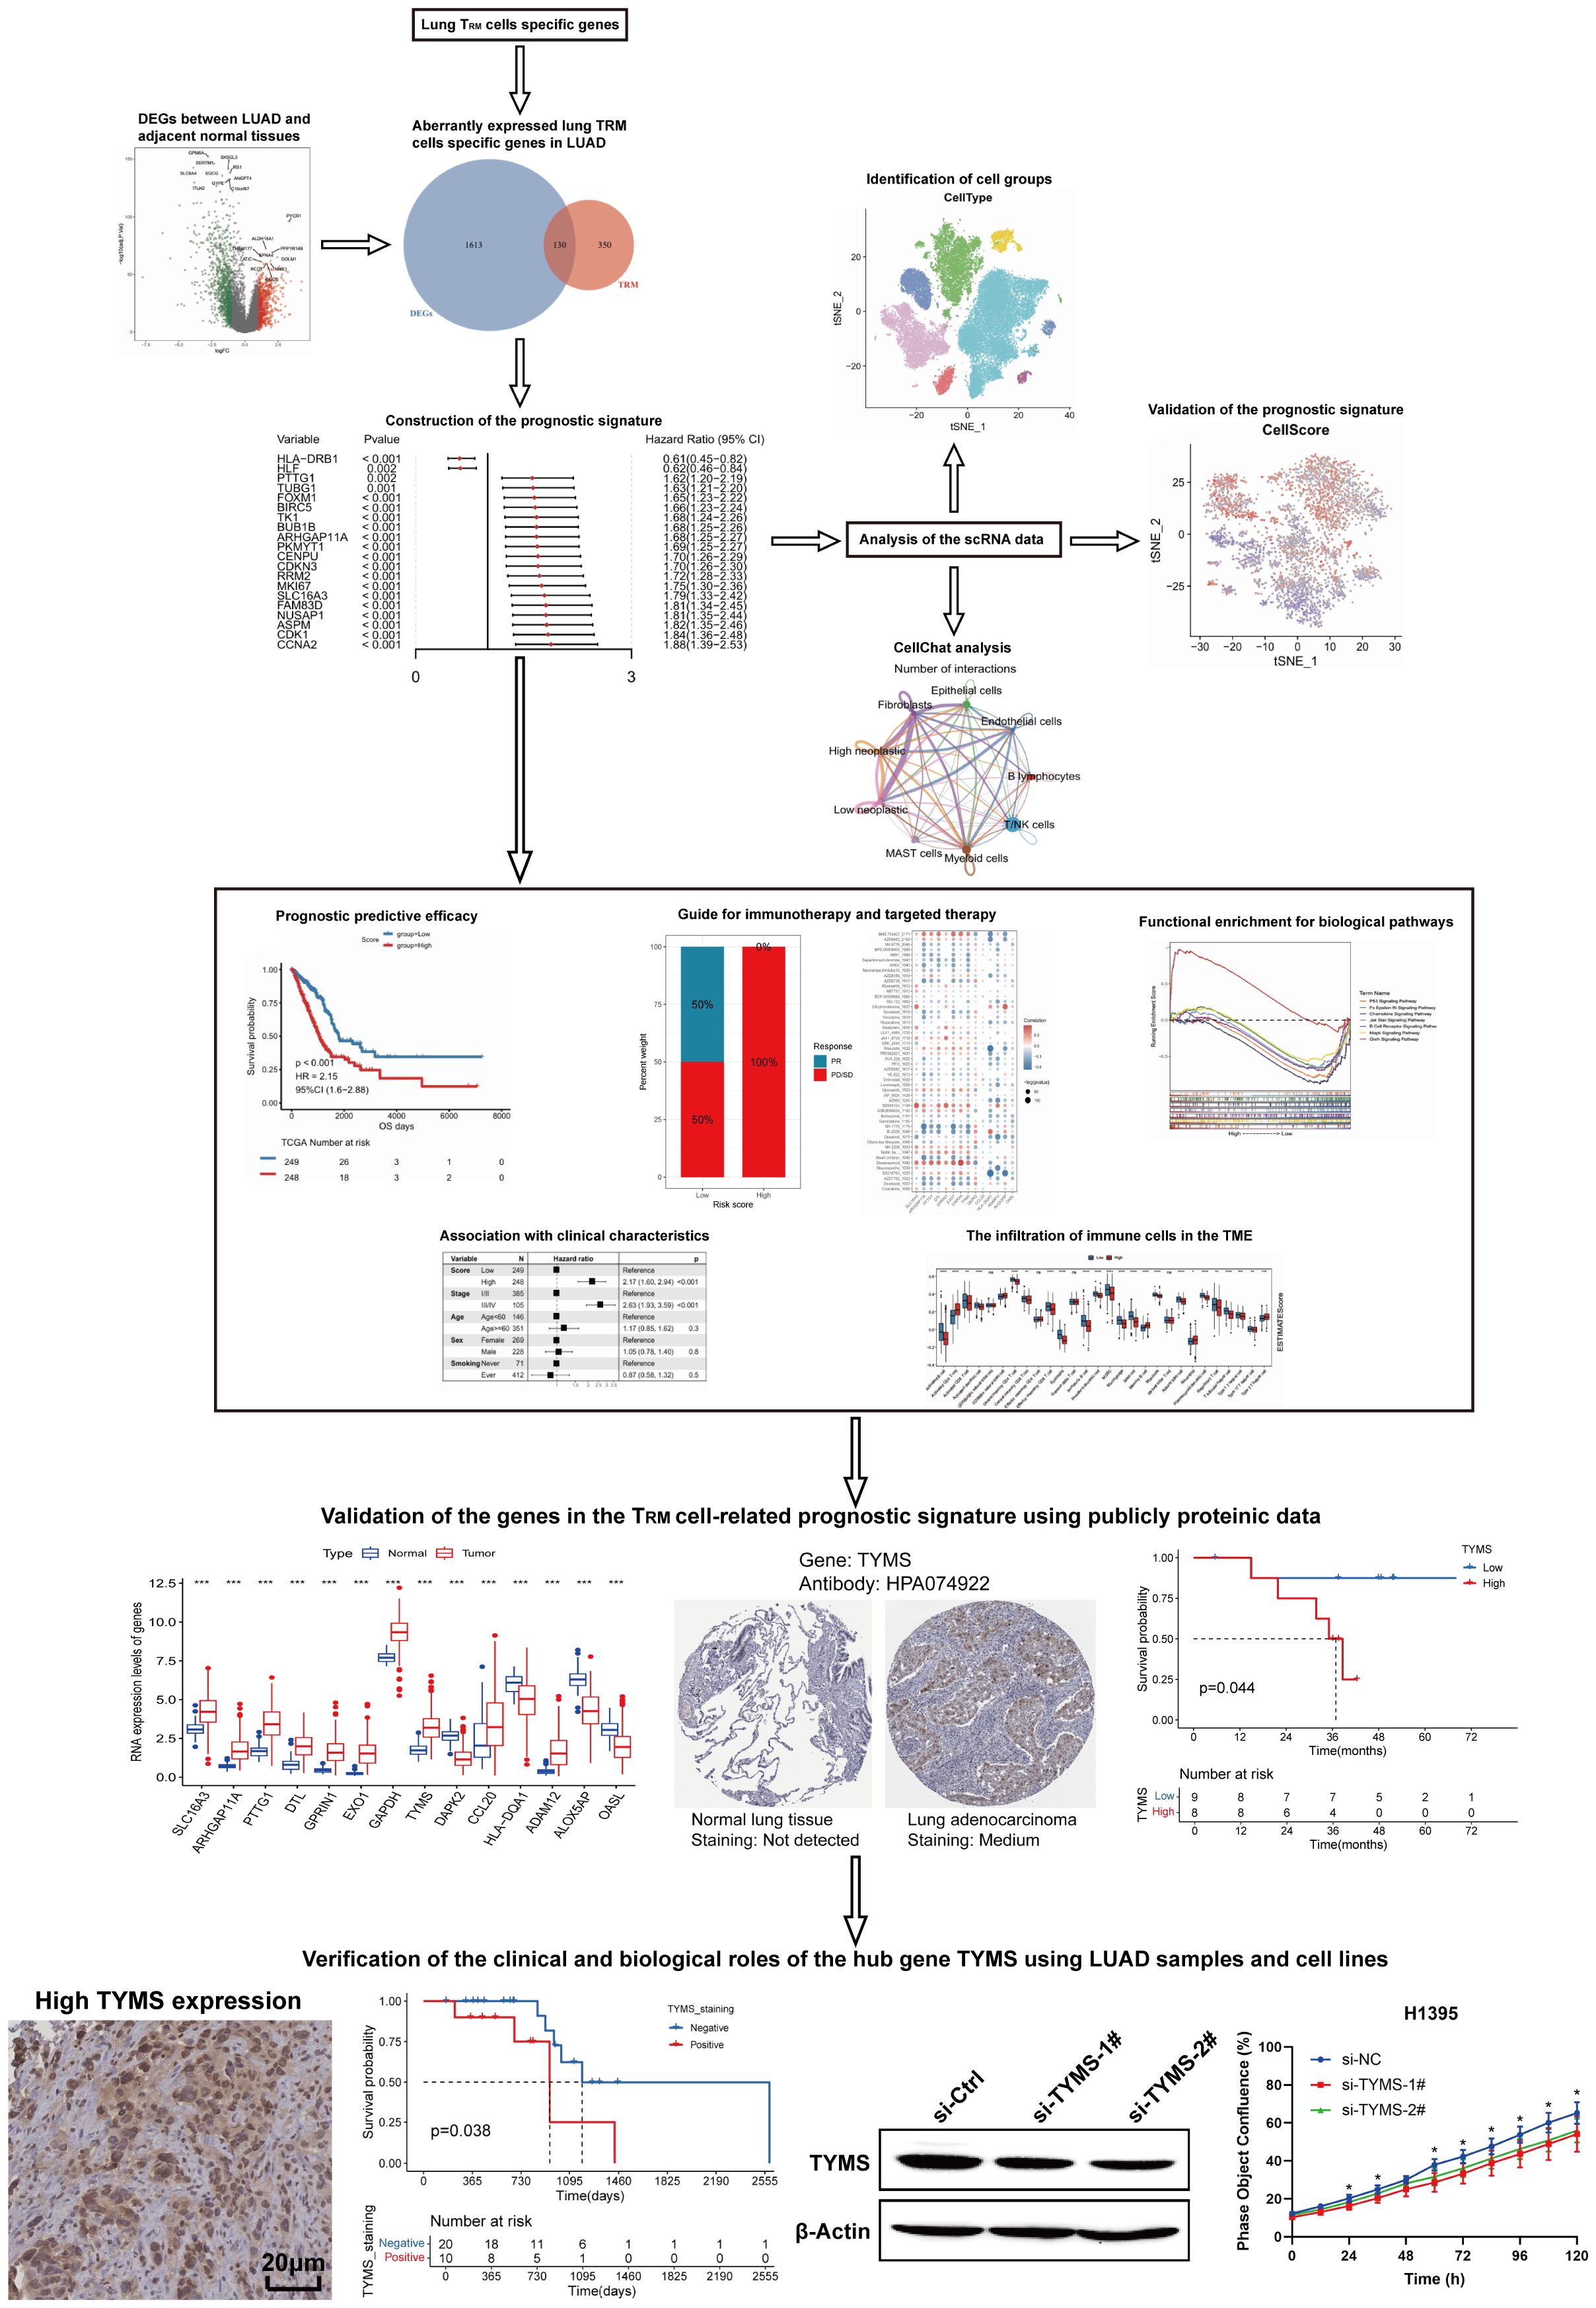
Figure 1. The flow chart of this study.
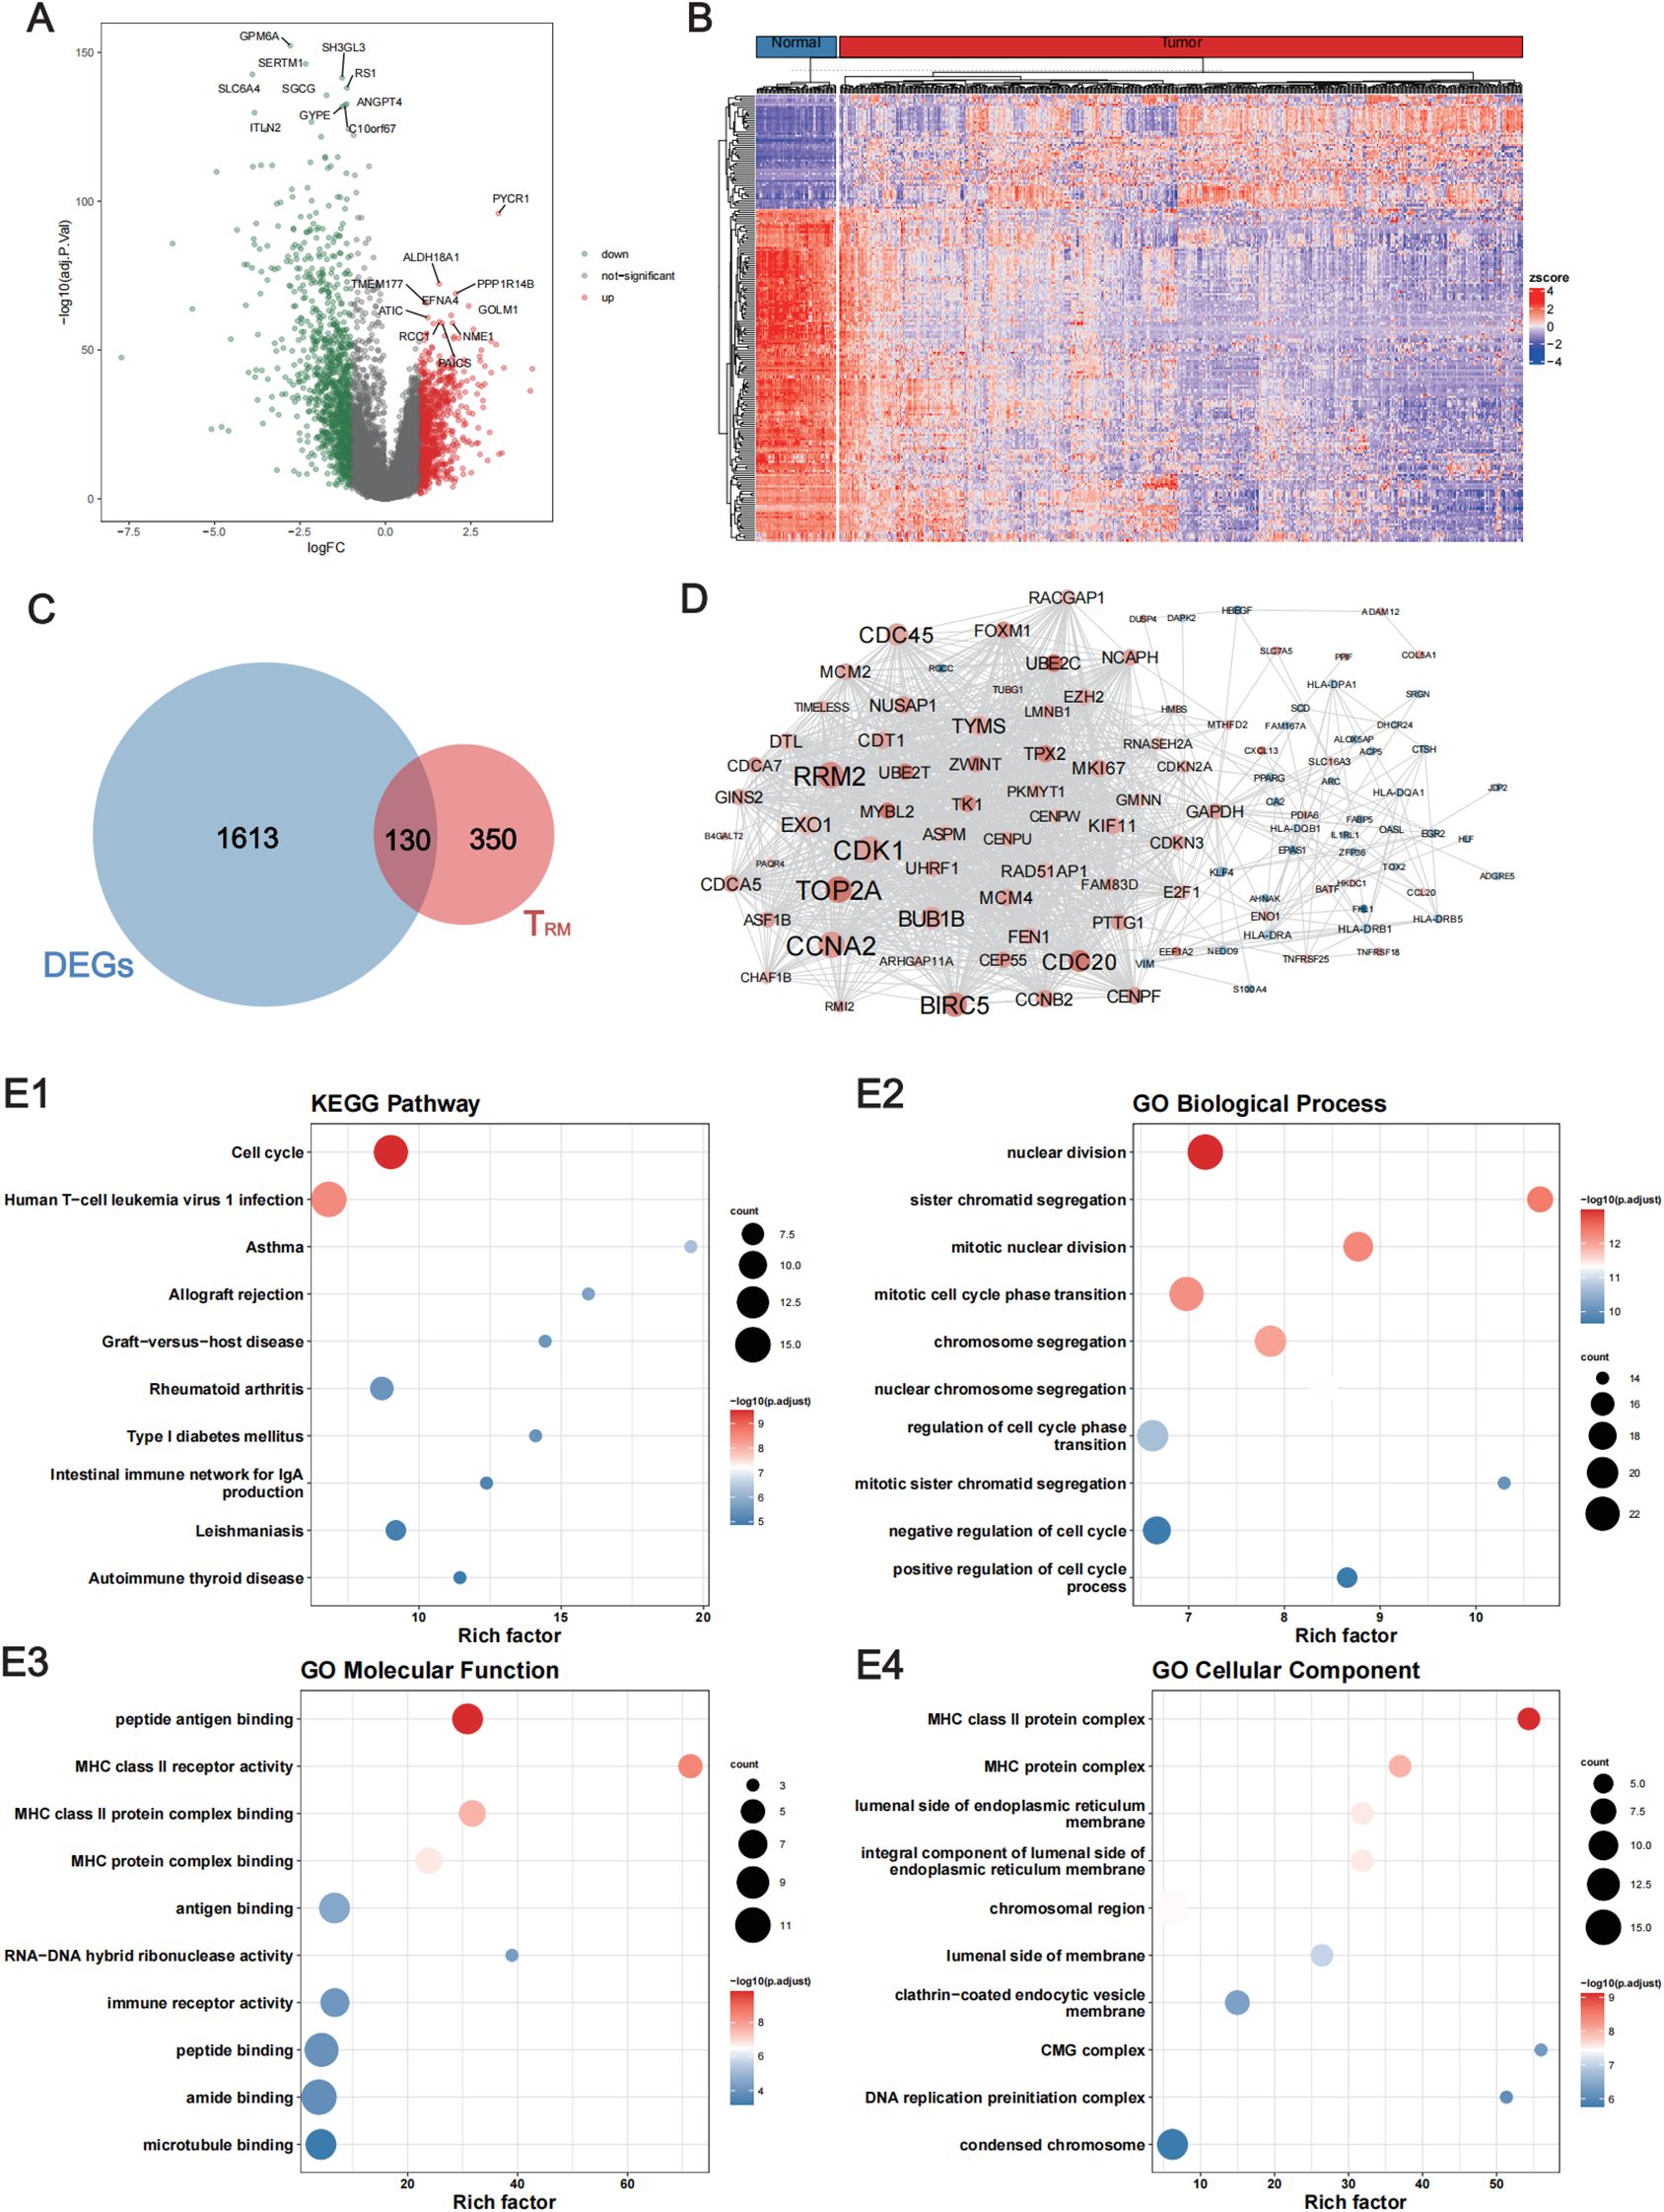
Figure 2. Identification of the lung TRM cell-related genes that were differentially expressed between LUAD and adjacent normal tissues. (A) Volcano plot showing the DEGs between LUAD and adjacent normal tissues. The red dots represent the upregulated genes with log2FC ≥ 1 and FDR < 0.05, whereas the green dots represent downregulated genes with log2FC ≤ -1 and FDR < 0.05. (B) Heatmap of the DEGs. The upper horizontal axis denotes the cluster analysis of each sample. The blue color indicates adjacent normal tissues, whereas the red color indicates tumor tissues. The left longitudinal axis indicates the cluster analysis of the DEGs. The blue and red blocks represent relatively low and high expression, respectively. (C) Venn diagram showing the intersecting genes among the DEGs and the TRM cell-related genes in the lung. (D) The PPI network of the intersecting genes among the DEGs and the lung TRM cell-related genes. (E1) KEGG pathway, (E2) GO biological process, (E3) GO molecular function and (E4) GO cellular component enrichment analyses of the intersecting genes. FC, fold change; FDR, false discovery rate; DEGs, differentially expressed genes.
The results of functional enrichment analysis revealed that the DE lung TRM cell-specific genes were significantly enriched in biological processes such as cell cycle regulation and chromosome segregation and were significantly associated with functions such as MHC class II molecule receptor activity, antigen binding, and immune receptor activity (Figures 2E1–E4), suggesting that these genes are related to TRM cells.
3.2 Construction and validation of the lung TRM-related prognostic signature
To investigate the clinical value of the DE lung TRM cell-specific genes, a lung TRM cell-related prognostic signature was constructed and validated. First, a univariate Cox regression analysis was performed. There were 62 genes associated with overall patient survival, and the top 20 genes with the greatest significance are shown in Figure 3A; Supplementary Table 3. The KM curves of the top six genes with the lowest p-values are presented in (Figures 3B1–B6). Least absolute shrinkage and selection operator (LASSO) regression analysis was subsequently conducted to further investigate the clinical significance of these genes. The trajectory of each independent variable was obtained (Figure 3C), and as the lambda gradually increased, the number of independent variable coefficients gradually decreased to zero (Figure 3C). Ten-fold cross-validation was used to build the model, and the confidence intervals for each lambda value are shown in Figure 3D. Fourteen genes were identified when the model was optimized. Therefore, we selected the 14 genes for the subsequent analyses and constructed a risk score model based on their coefficients and expression levels of the 14 genes (Figure 3E). The formula for calculating the risk-score model is as follows:
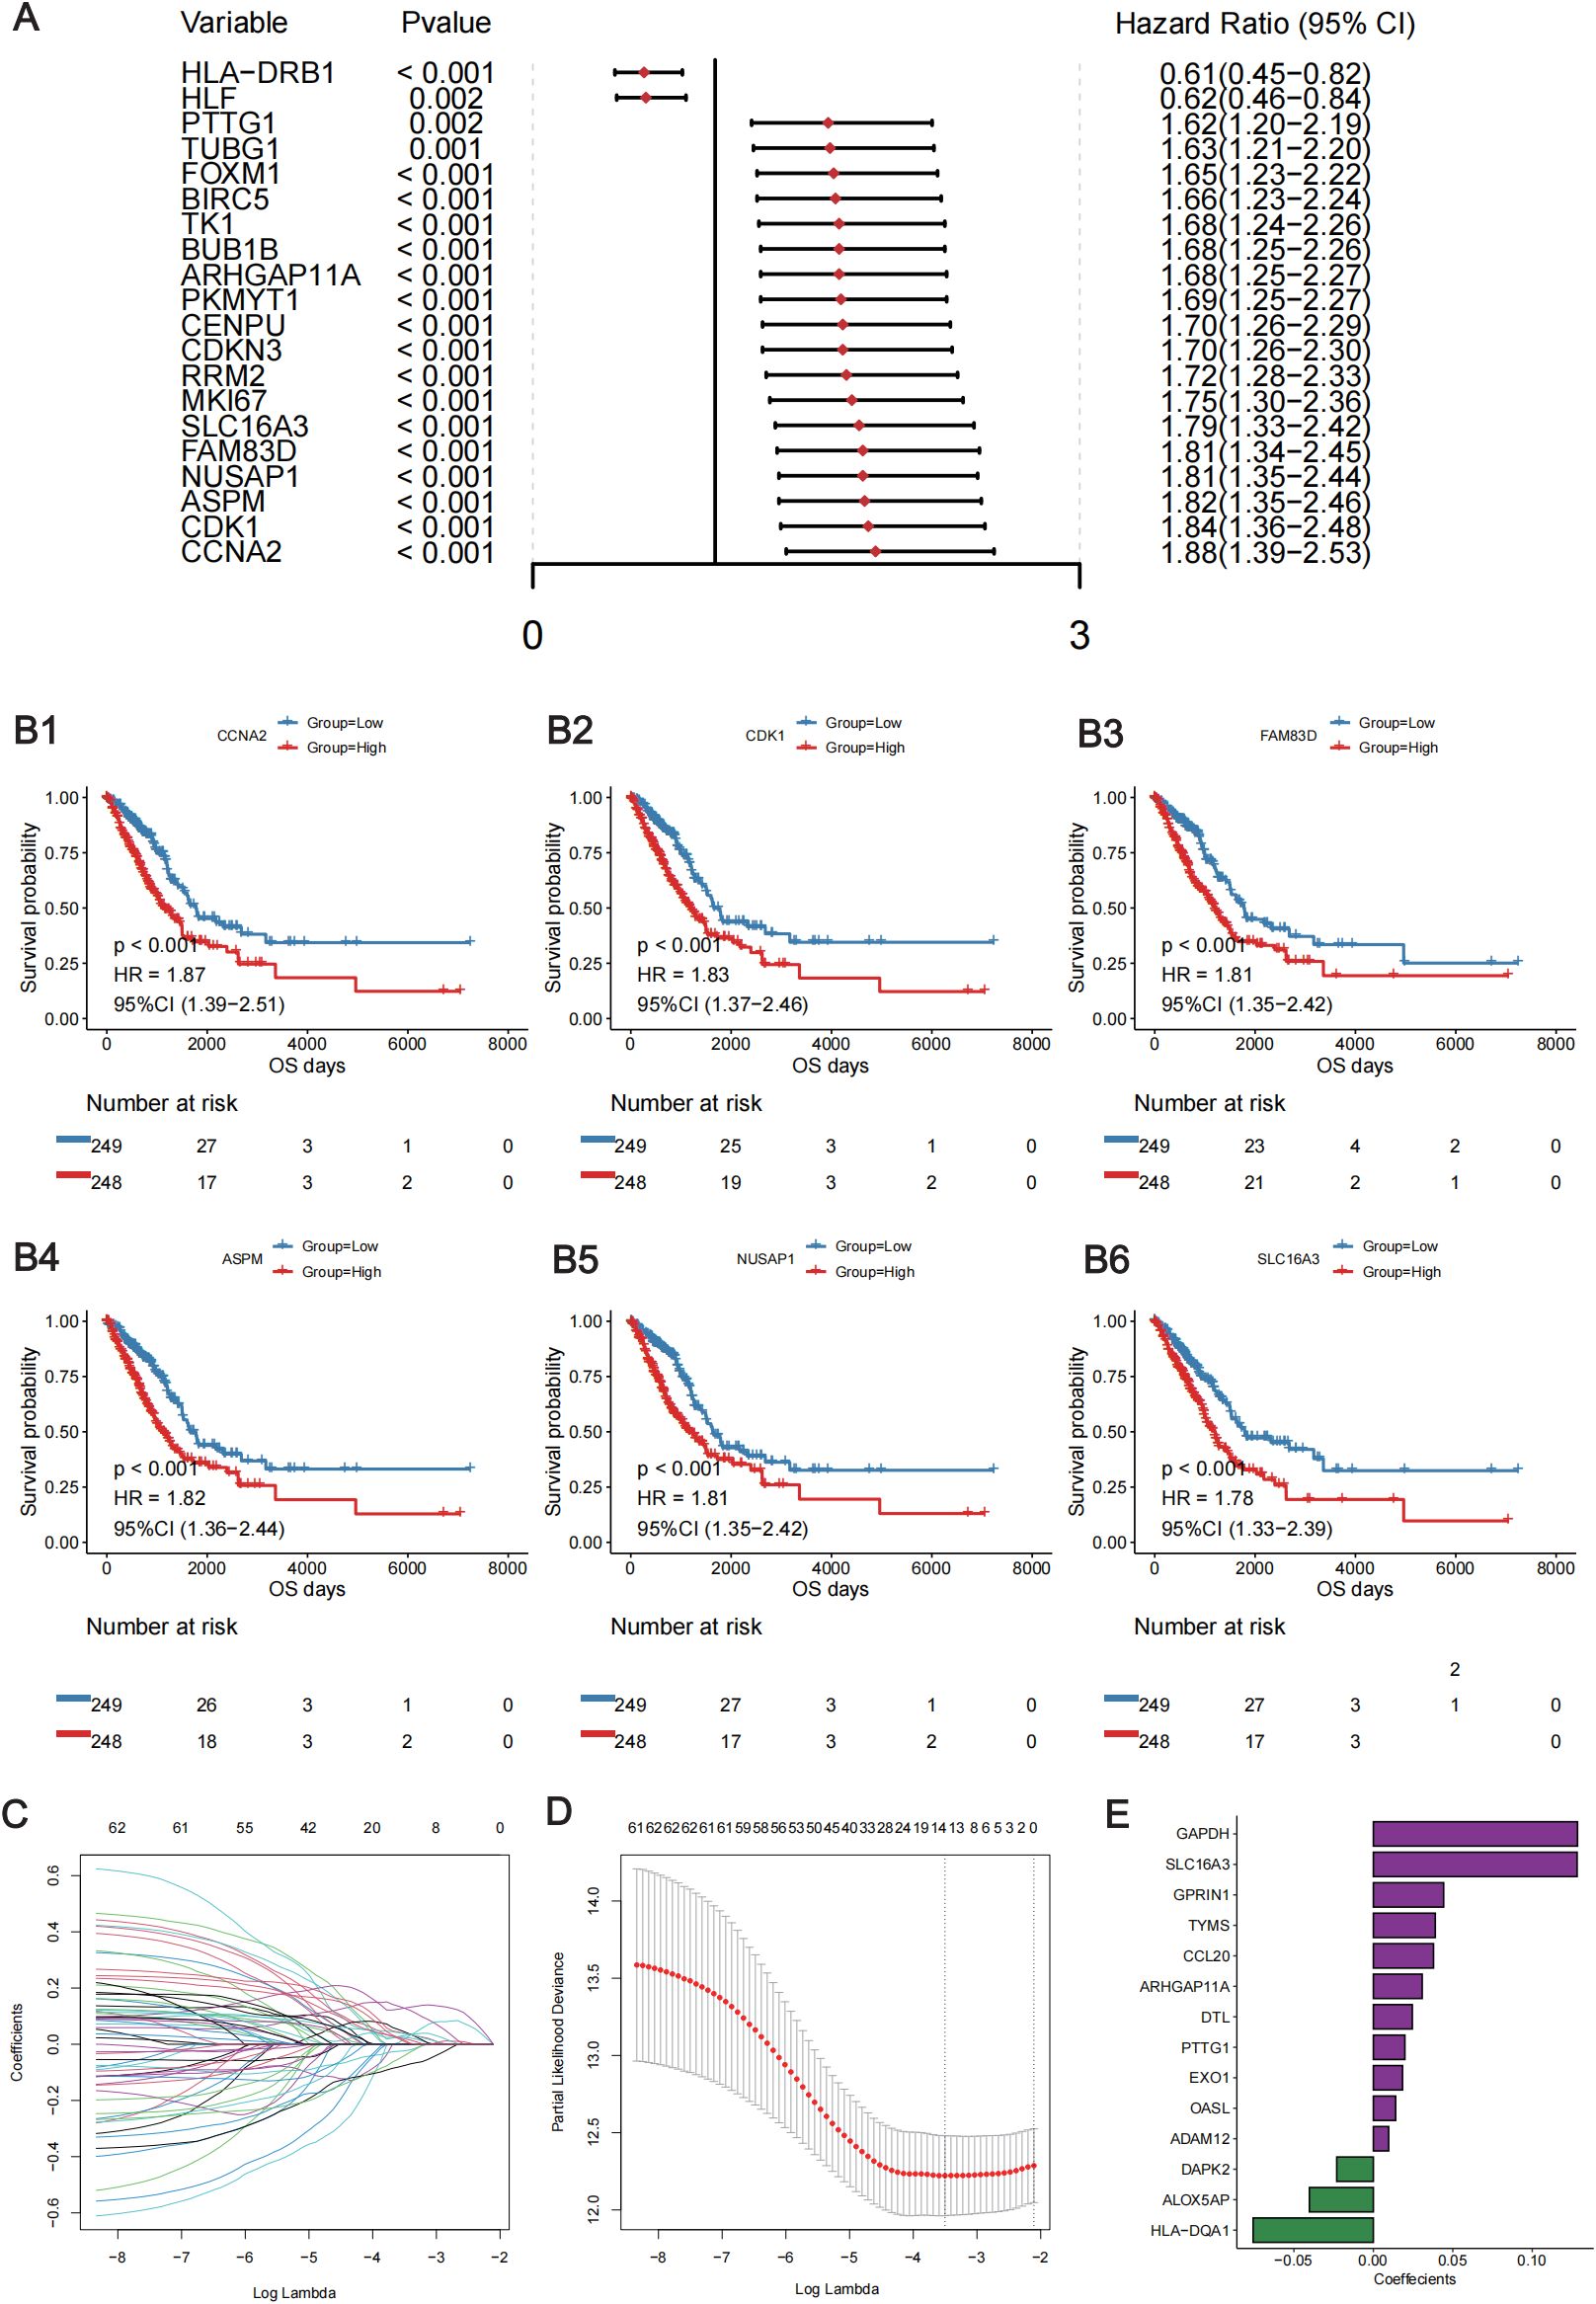
Figure 3. Construction of the lung TRM cell-related prognostic model. (A) Forest plot showing the top 20 lung TRM cell-related prognostic genes identified via univariate Cox regression analysis. The left column of each panel shows the p value of each gene, and the right column shows the corresponding forest plot. (B) The KM survival curves of the top 6 prognostic genes in the univariate Cox regression analysis: CCNA2 (B1), CDK1 (B2), FAM83D (B3), ASPM (B4), NUSAP1 (B5) and SLC16A3 (B6). The abscissa axis shows the survival time, whereas the ordinate axis shows the survival probability. The blue color represents low expression, whereas the red color represents high expression of each gene. The risk table is presented under the KM survival curves of each gene. (C) Scatter plot showing the trajectory of each independent variable. The abscissa axis represents the log value of the independent variable lambda. The vertical axis indicates the coefficient of the independent variable. (D) Dynamic process diagram of variables screened by LASSO regression analysis and selection process diagram of the cross-validation parameter lambda. (E) Coefficient of each gene included in the prognostic model.
Score = SLC16A3 * (0.128) + ARHGAP11A * (0.031) + PTTG1 * (0.020) +DTL * (0.025) + GPRIN1 * (0.044) + EXO1 * (0.018) + GAPDH * (0.128) + TYMS * (0.039) + DAPK2 * (-0.023) + CCL20 * (0.038) + HLA-DQA1 * (-0.076) +ADAM12 * (0.010) + ALOX5AP * (-0.040) + OASL * (0.014).
Using the 14-gene risk score model, the samples in the TCGA-LUAD training cohort were divided into high- and low-risk groups according to the median risk score. Overall survival analysis revealed that the OS of patients in the high-risk group was significantly lower than that of patients in the low-risk group in both the training cohort (TCGA-LUAD) (Figure 4A) and the two validation cohorts: GSE41271 (Figure 4D) and GSE42127 (Figure 4G). The ROC curve revealed that the AUCs of the patients at 1, 3, and 5 years were relatively high (0.688, 0.698, and 0.648, respectively) in the training cohort (Figure 4B). The AUCs of patients at 1, 3, and 5 years were 0.649, 0.638, and 0.646, respectively, in validation cohort GSE41271 (Figure 4E). The AUCs of the patients at 1, 3, and 5 years were 0.867, 0.662, and 0.672, respectively, in validation cohort GSE42127 (Figure 4H). To test whether the risk score model was an independent prognostic factor for LUAD patients, we performed univariate and multivariate Cox regression analyses via the “coxph()” function in the R package “survival”. In all the training and validation cohorts, the risk score was an independent prognostic factor among other clinical features, such as age, sex, and tumor stage (Figures 4C, F, I). These results demonstrated that the 14-gene prognostic signature based on the DE lung TRM cell-specific genes had strong prognostic efficacy with high robustness and generalizability.
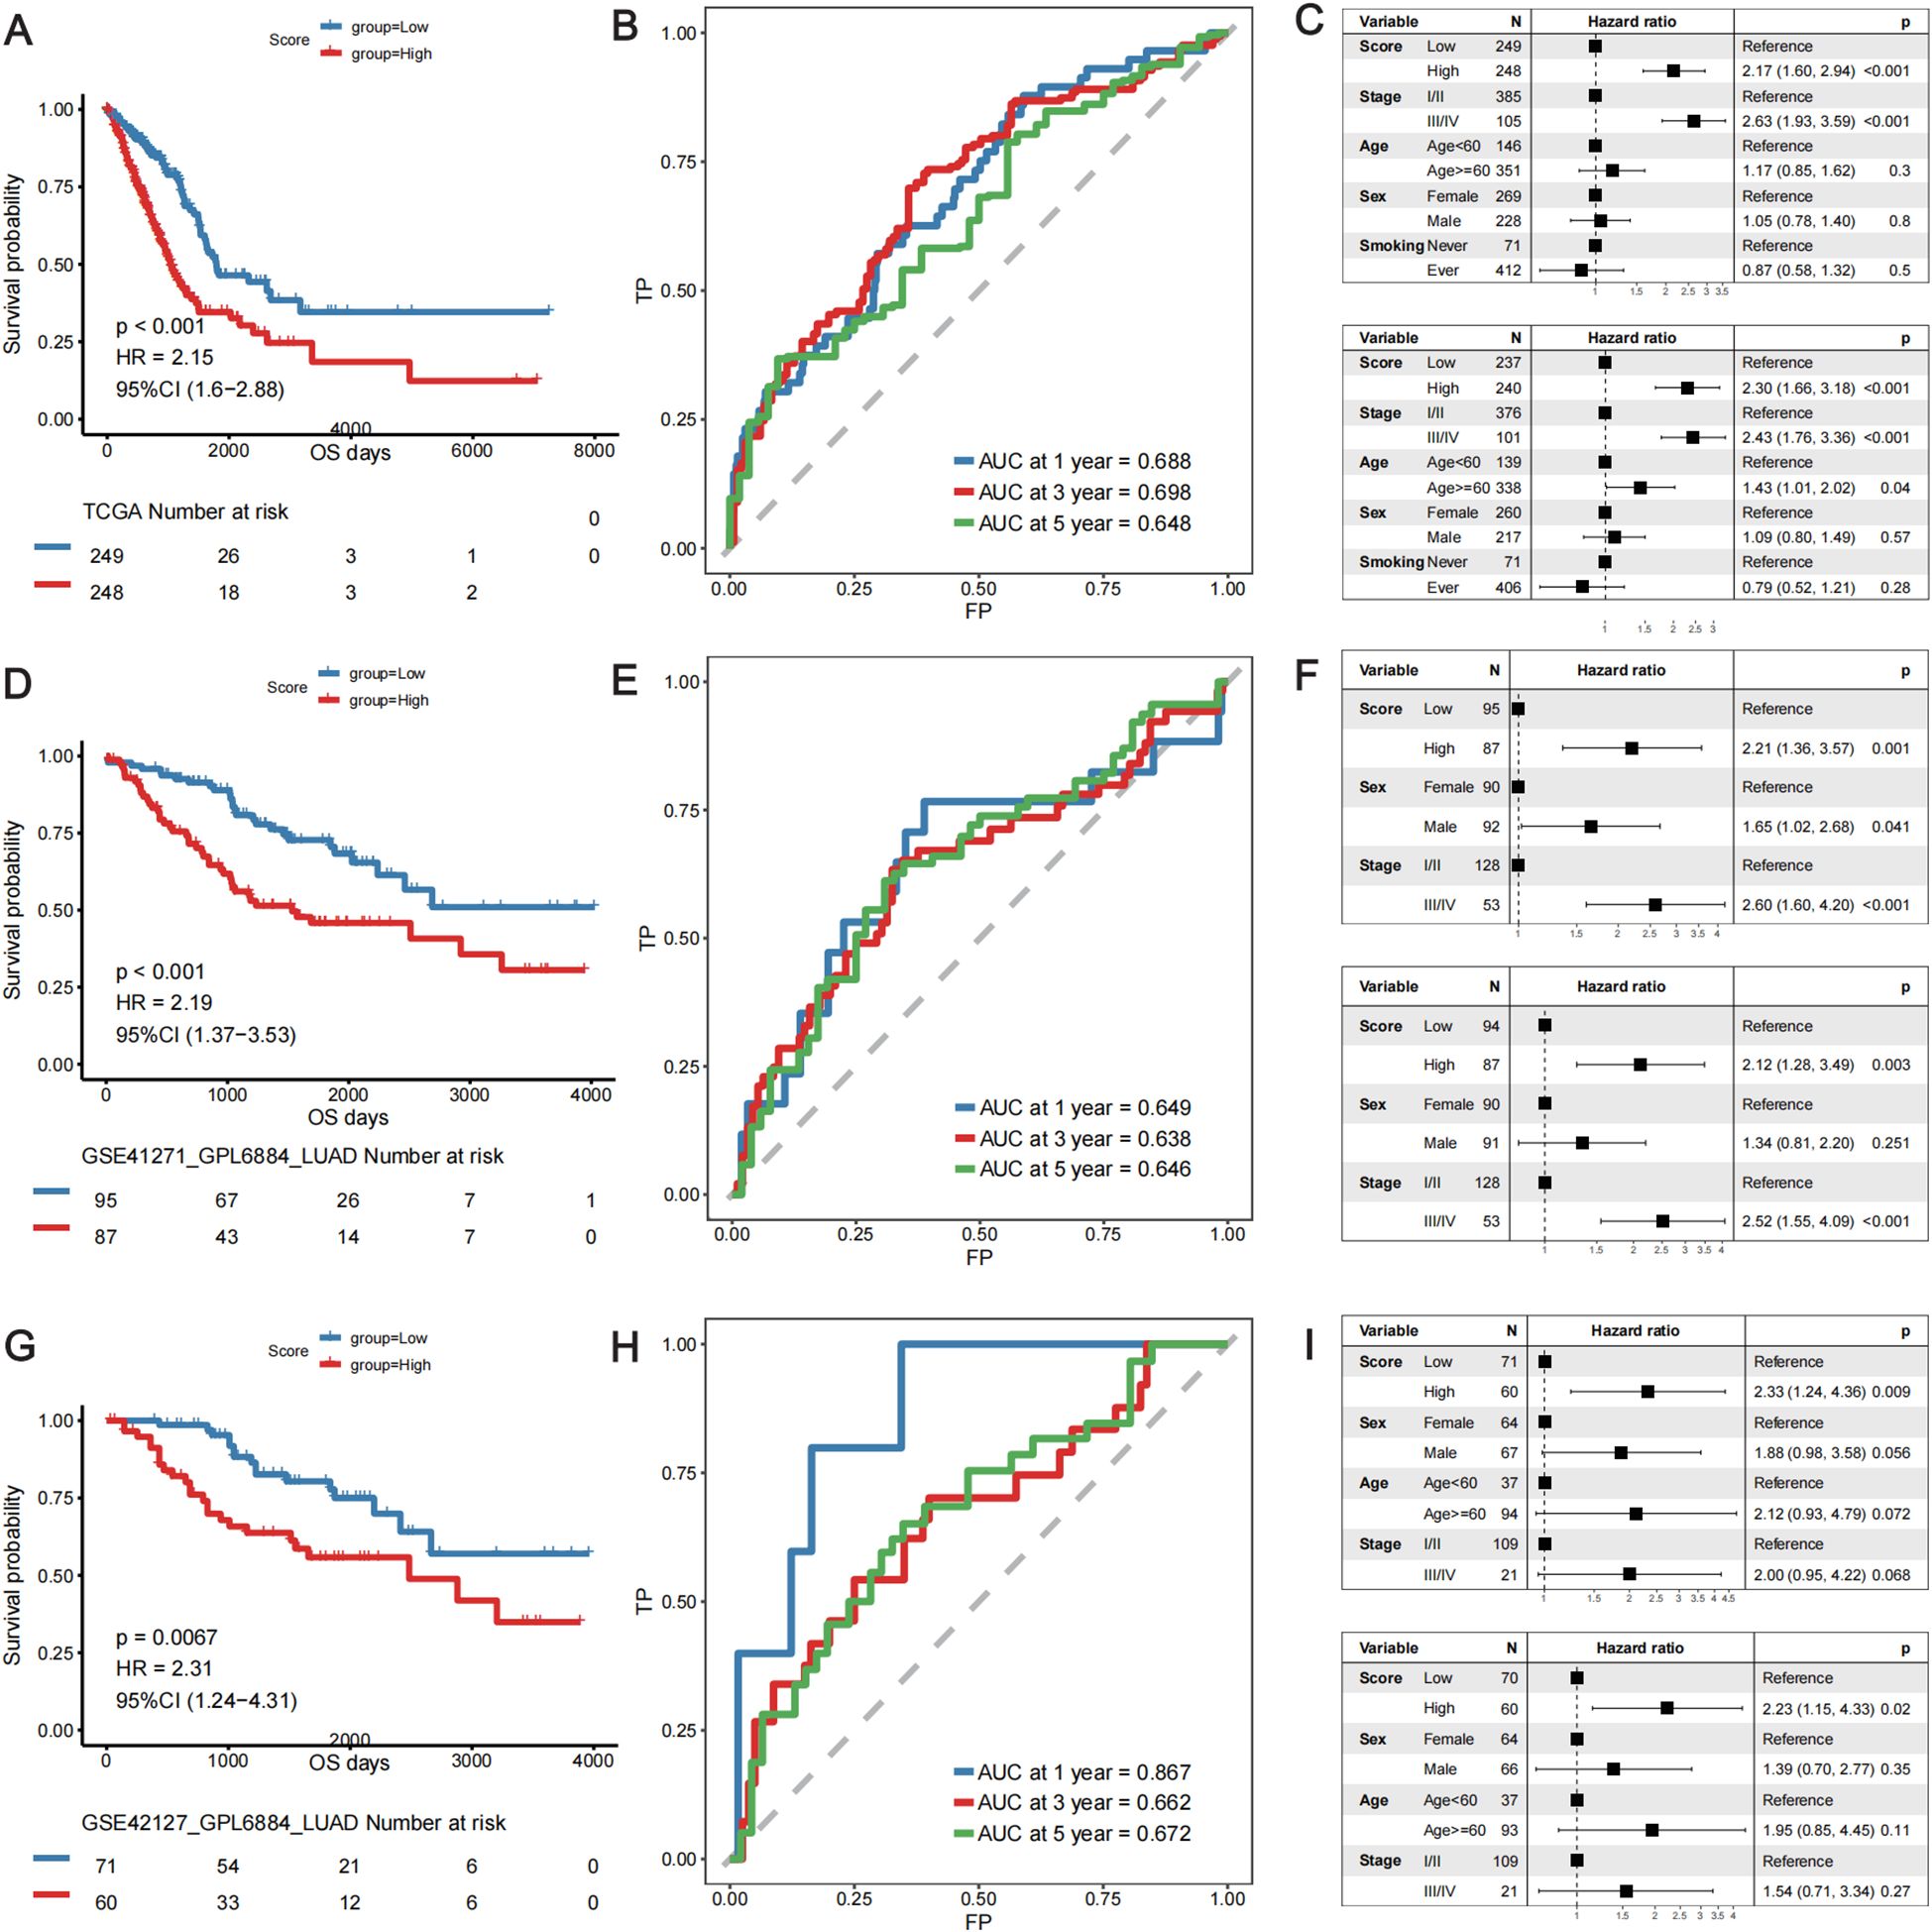
Figure 4. Validation of the predictive efficacy of the lung TRM cell-related prognostic model in the training cohort: (A–C) TCGA-LUAD cohort and in the validation cohorts: (D–F) GSE41271 and (G–I) GSE42127. (A, D, G) KM survival curves of patients in the low- and high-risk score groups in the TCGA-LUAD cohort, GSE41271 cohort and GSE42127 cohort, respectively. The blue color represents patients in the low-risk score group, whereas the red color represents patients in the high-risk score group. The risk table is presented under the KM survival curves of each gene. (B, E, H) ROC curves for predicting the 1-, 3-, and 5-year survival of patients according to the risk score in the TCGA-LUAD cohort, GSE41271 cohort and GSE42127 cohort, respectively. The abscissa axis represents specificity, and the vertical axis represents sensitivity. Different colors represent different predictive times. (C, F, I) Univariate and multivariate Cox regression analyses of the prognostic model in the TCGA-LUAD cohort, GSE41271 cohort and GSE42127 cohort, respectively. The upper forest plot in each panel is the result of univariate Cox regression analysis, whereas the lower plot is the result of multivariate Cox regression analysis. In each forest plot, the variables are listed on the left of each panel. The hazard ratio of each variable and the corresponding forest plot are in the middle of each panel. The p values of the corresponding variables are shown on the right.
3.3 Association between the TRM cell-related prognostic signature and clinicopathologic features
The associations between the TRM-related prognostic signature and patients’ clinicopathological features were further analyzed. The results revealed that the proportions of patients aged <60 years, with advanced-stage disease, and with a history of smoking was significantly greater in the high-risk score group than in the low-risk score group (p < 0.05). The proportions of patients of different sexes, ALK rearrangements, EGFR mutations, and KRAS mutations did not significantly differ between the high- and low-risk score groups (Supplementary Figure 1). Patients aged <60 years, with advanced-stage disease, male sex, and a history of smoking had significantly higher risk scores than the other groups of patients, and there was no significant difference in the risk scores for patients with EGFR mutations or KRAS mutations (Supplementary Figure 2).
3.4 Depiction of the TME landscape via the prognostic signature
To further explore the functions of lung-specific TRM cells in the TME of LUAD, gene set enrichment analysis (GSEA) and immune cell infiltration analysis were conducted in the high- and low-risk score groups of patients. The results revealed that signaling pathways, such as P53, B-cell receptor, and MAPK, were significantly activated in the low-risk score group (Figure 5A; Supplementary Table 4), and immune-related biological processes, such as T-cell activation, proliferation, and B-cell activation, were also significantly activated in the low-risk score group (Figure 5B; Supplementary Table 4). Further analysis of immune cell infiltration revealed that the infiltration of immune cells, such as activated B cells, activated CD8+T cells, central memory CD4+T cells, central memory CD8+T cells, and effector memory CD8+T cells, was significantly greater in the low-risk score group (Figure 5C). These results demonstrate that patients in the low-risk score group had stronger antitumor immunity and greater infiltration of TRM cells, which may be the reason for their longer survival time. The ESTIMATE, immunity, and stroma scores were significantly greater in the low-risk score group, whereas the tumor purity was significantly greater in the high-risk score group (Figures 5D1–D4). Next, the expression levels of the immune checkpoint genes were compared between the high- and low-risk score groups. The results revealed that the expression levels of several immune checkpoint genes, including CD276 and LAG3, were significantly different between the two groups (Figure 5E). These findings suggest the possibility of exploring novel targets for immunotherapy.
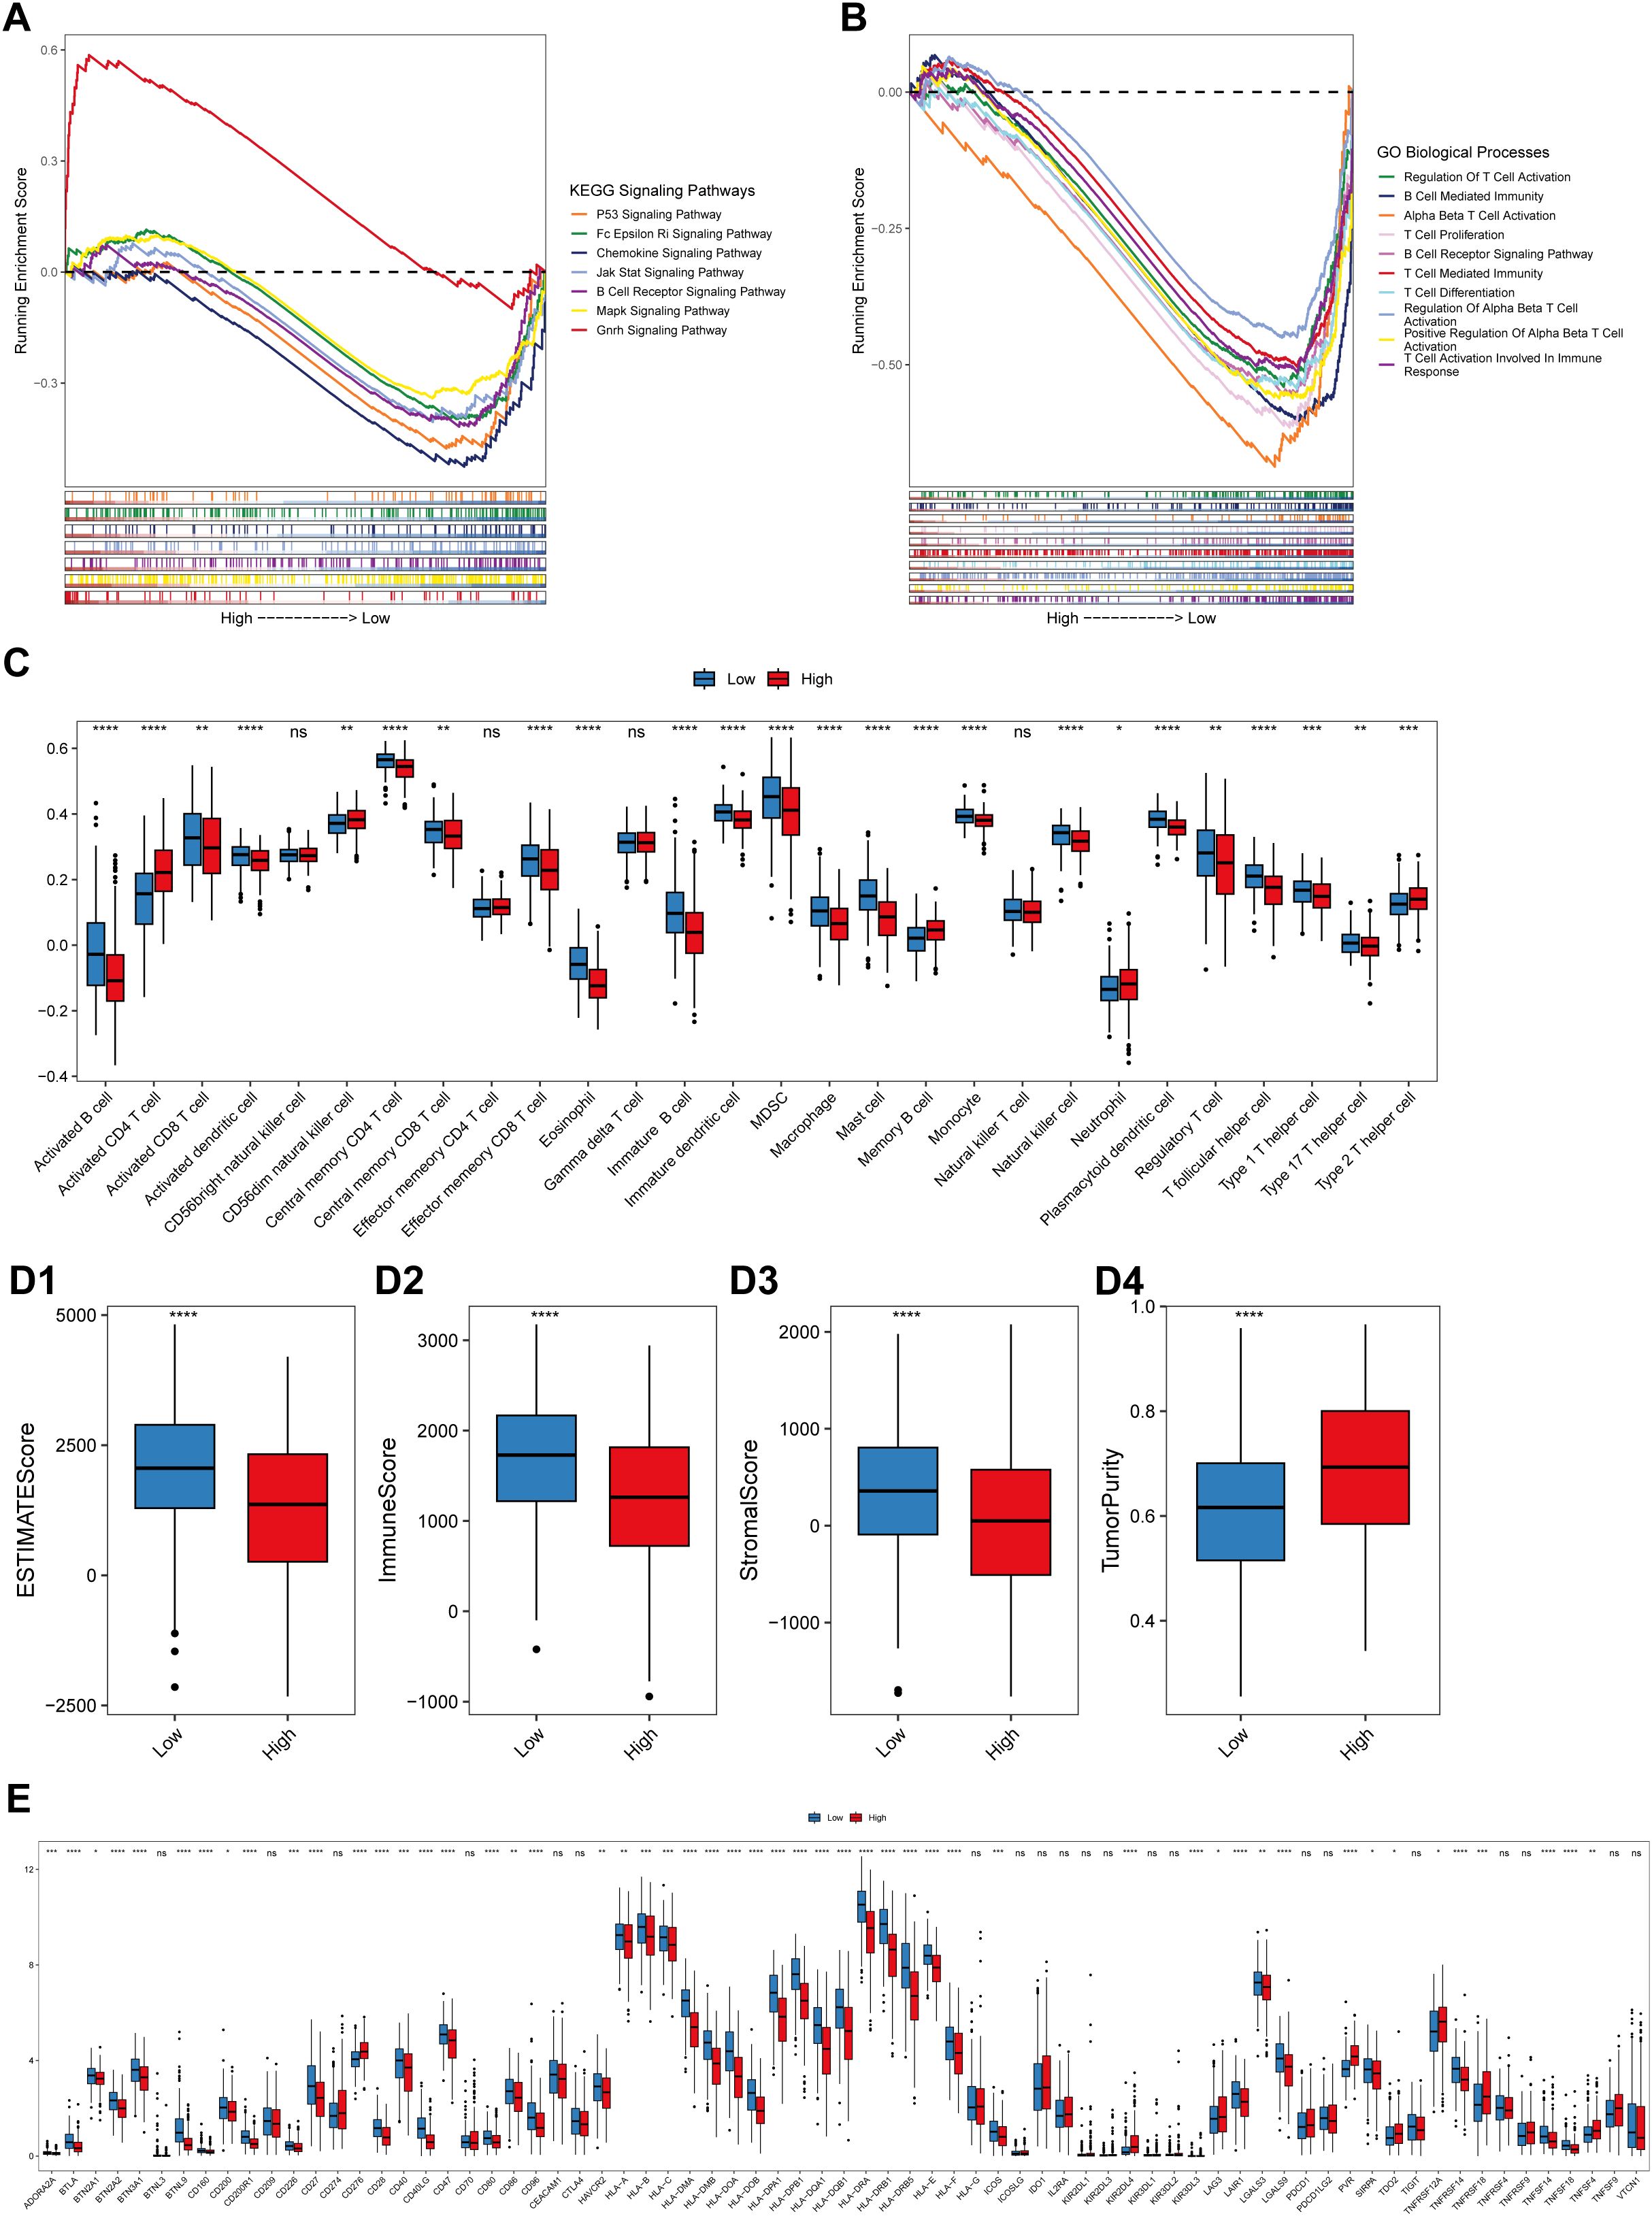
Figure 5. Correlation between the risk score and the immune landscape. (A) Pathways that are activated in different risk score groups according to KEGG GSEA enrichment analysis of bulk RNA-seq data. (B) Pathways that were activated in different risk score groups according to the GO-BP enrichment analysis of the bulk RNA-seq data. The abscissa axis represents the ranked gene list according to their expression levels in the two groups. The vertical axis represents the running enrichment score. Curves of different colors represent different pathways. (C) Relative abundances of the 28 types of immune cells in the low-risk score and high-risk score groups. The abscissa axis represents the names of the immune cells. The vertical axis represents the infiltration fraction. (D) Box plots showing the ESTIMATE score (D1), immune score (D2), stromal score (D3) and tumor purity (D4) in the low- and high-risk score groups. (E) Expression levels of immune checkpoint genes in the low-risk score and high-risk score groups. The abscissa axis shows the gene names, and the vertical axis shows the relative expression levels of these genes.
3.5 Validation of the predictive efficacy of the prognostic model at the single-cell level
A total of 51935 cells, including 4827 B lymphocytes, 635 endothelial cells, 10998 epithelial cells, 1764 fibroblasts, 1735 MAST cells, 9098 myeloid cells, 22878 T/NK cells, and 27578 cells, were detected in the GSE131907 scRNA-seq cohort (Supplementary Figure 3). The PCA results revealed that there was a significant batch effect between samples (Supplementary Figures 4A, B), and the batch effect between samples was removed via the R package “Harmony” (Supplementary Figures 4C, D). The distribution of different cell types was determined via UMAP analysis (Supplementary Figure 4E), and heterogeneity in the distribution of cells among the samples was detected (Supplementary Figure 4F).
A total of 3906 malignant tumor cells with at least two model genes detected were extracted for subsequent analyses. These malignant cells were renormalized and clustered, and three subtypes of malignant cells were identified (Figures 6A, B1–B3). These cell subtypes were defined according to the genes that were highly expressed in the clusters, and these three subtypes were named IFI27+Mal, FBXO2+Mal and HMGB2+Mal (Figures 6A, B1–B3). With the “FindAllMarkers” function, we identified the marker genes of each cell subtype (Supplementary Table 5), and the top 5 marker genes of each cell subtype are shown in Figure 6C. FBXO2+Mal highly expressed genes such as CXCL14, TNNC2 and ASS1, which were significantly enriched in biological processes such as the regulation of the apoptosis signaling pathway and peptidase activity (Supplementary Figure 5A). HMGB2+Mal highly expressed genes such as STMN1, TUBA1B and UBE2C, which were significantly enriched in biological processes such as the regulation of cell adhesion, leukocyte migration and leukocyte chemotaxis (Supplementary Figure 5B). IFI27+Mal highly expressed genes such as SFTPA2, SFTPA1 and SCGB3A1, which were significantly enriched in biological processes such as the regulation of cell adhesion, leukocyte migration and leukocyte chemotaxis (Supplementary Figure 5C).
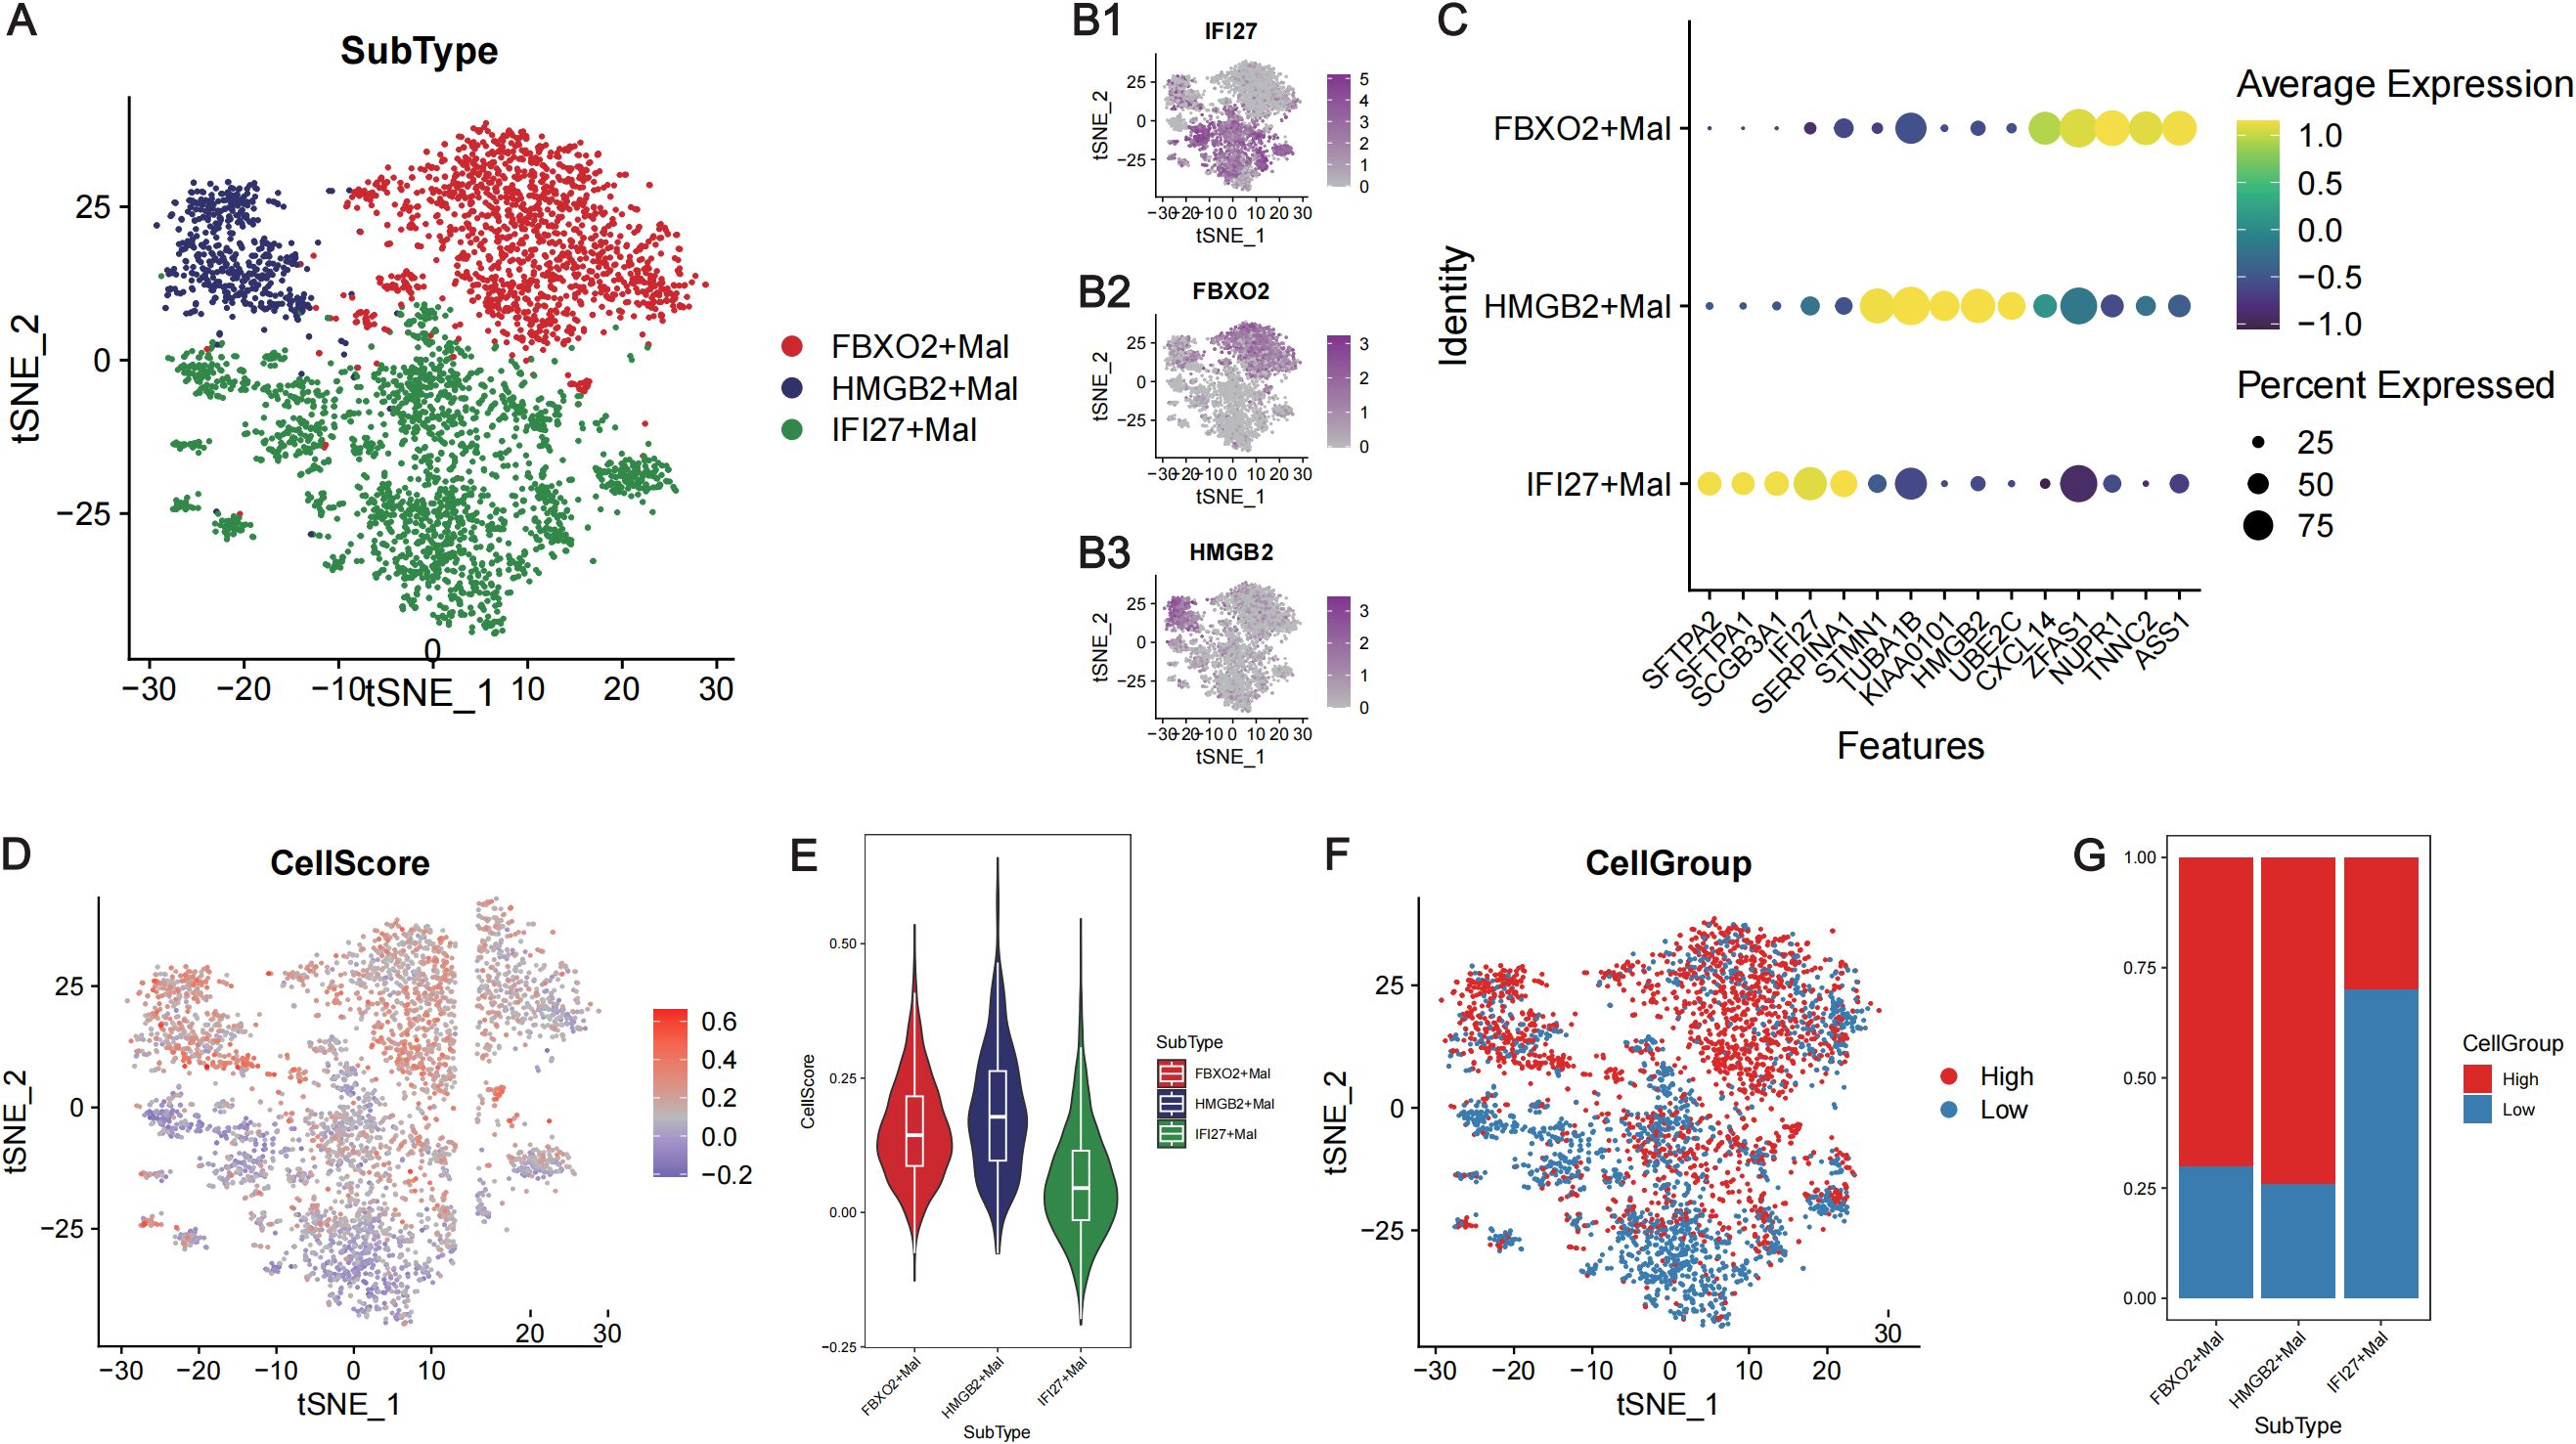
Figure 6. Calculation of the risk score at the single-cell level in LUAD. (A) TSNE plot showing the three subtypes of malignant tumor cells. Different colors represent different cell subtypes. (B) TSNE plots showing the expression levels of the marker genes in the three subtypes of malignant tumor cells: IFI27 (B1), FBXO2 (B2) and HMGB2 (B3). (C) Bubble diagram presenting the expression of the top 5 marker genes of the three subtypes of malignant cells. The abscissa axis shows the gene names, and the vertical axis shows the names of the cell subtypes. Yellow indicates high expression, whereas yellow indicates low expression. The bubble size represents the percentage of each gene expressed in each subtype of cell. (D) The TSNE plot showing the cell score for each malignant cell. Blue represents a low score, whereas red represents a high score. (E) Violin plot showing the cell scores of three subtypes of malignant cells. The abscissa axis shows the cell names, and the vertical axis shows the CellScore. (F) The TSNE plot shows that the single cells were divided into high- and low-CellScore groups. (G) Proportion of different subtypes of malignant cells in the high- and low-cell groups. The abscissa represents the cell name, and the vertical axis represents the proportion.
The CellScore of each malignant tumor cell line was calculated via the “AddModuleScore” function (Figure 6D), and the malignant tumor cells were divided into high- and low-CellScore groups (Figure 6F). Among the three cell subtypes, FBXO2+Mal and HMGB2+Mal had higher CellScores (Figure 6E), and the CellGroup was high (Figure 6G). GSEA of the cells in high- and low-CellScore groups revealed that immune-related biological processes, such as T-cell migration and the B-cell receptor signaling pathway, were also significantly activated in the low-CellScore group (Supplementary Figure 6; Supplementary Table 6).
Trajectory analysis of the extracted malignant epithelial cells revealed three differentiation states (Figure 7A). In the trajectory from State1 to State2 cells, the IFI27+Mal subpopulation decreased significantly, whereas the HMGB2+Mal subpopulation increased significantly (Figure 7D). In the State1 to State3 cell trajectories, the proportion of the FBXO2+Mal subpopulation increased, but the HMGB2+Mal subpopulation also increased (Figure 7D). In the trajectory from State1 to State2, there was no significant increase in the CellScore. However, in the trajectory from State1 to State3, there was a significant increase in the CellScore (Figures 7B, C) and an increase in the proportion of high-cell groups (Figures 7E, F). This suggests that the malignancy of the tumor cells increased from low to high in the trajectory.
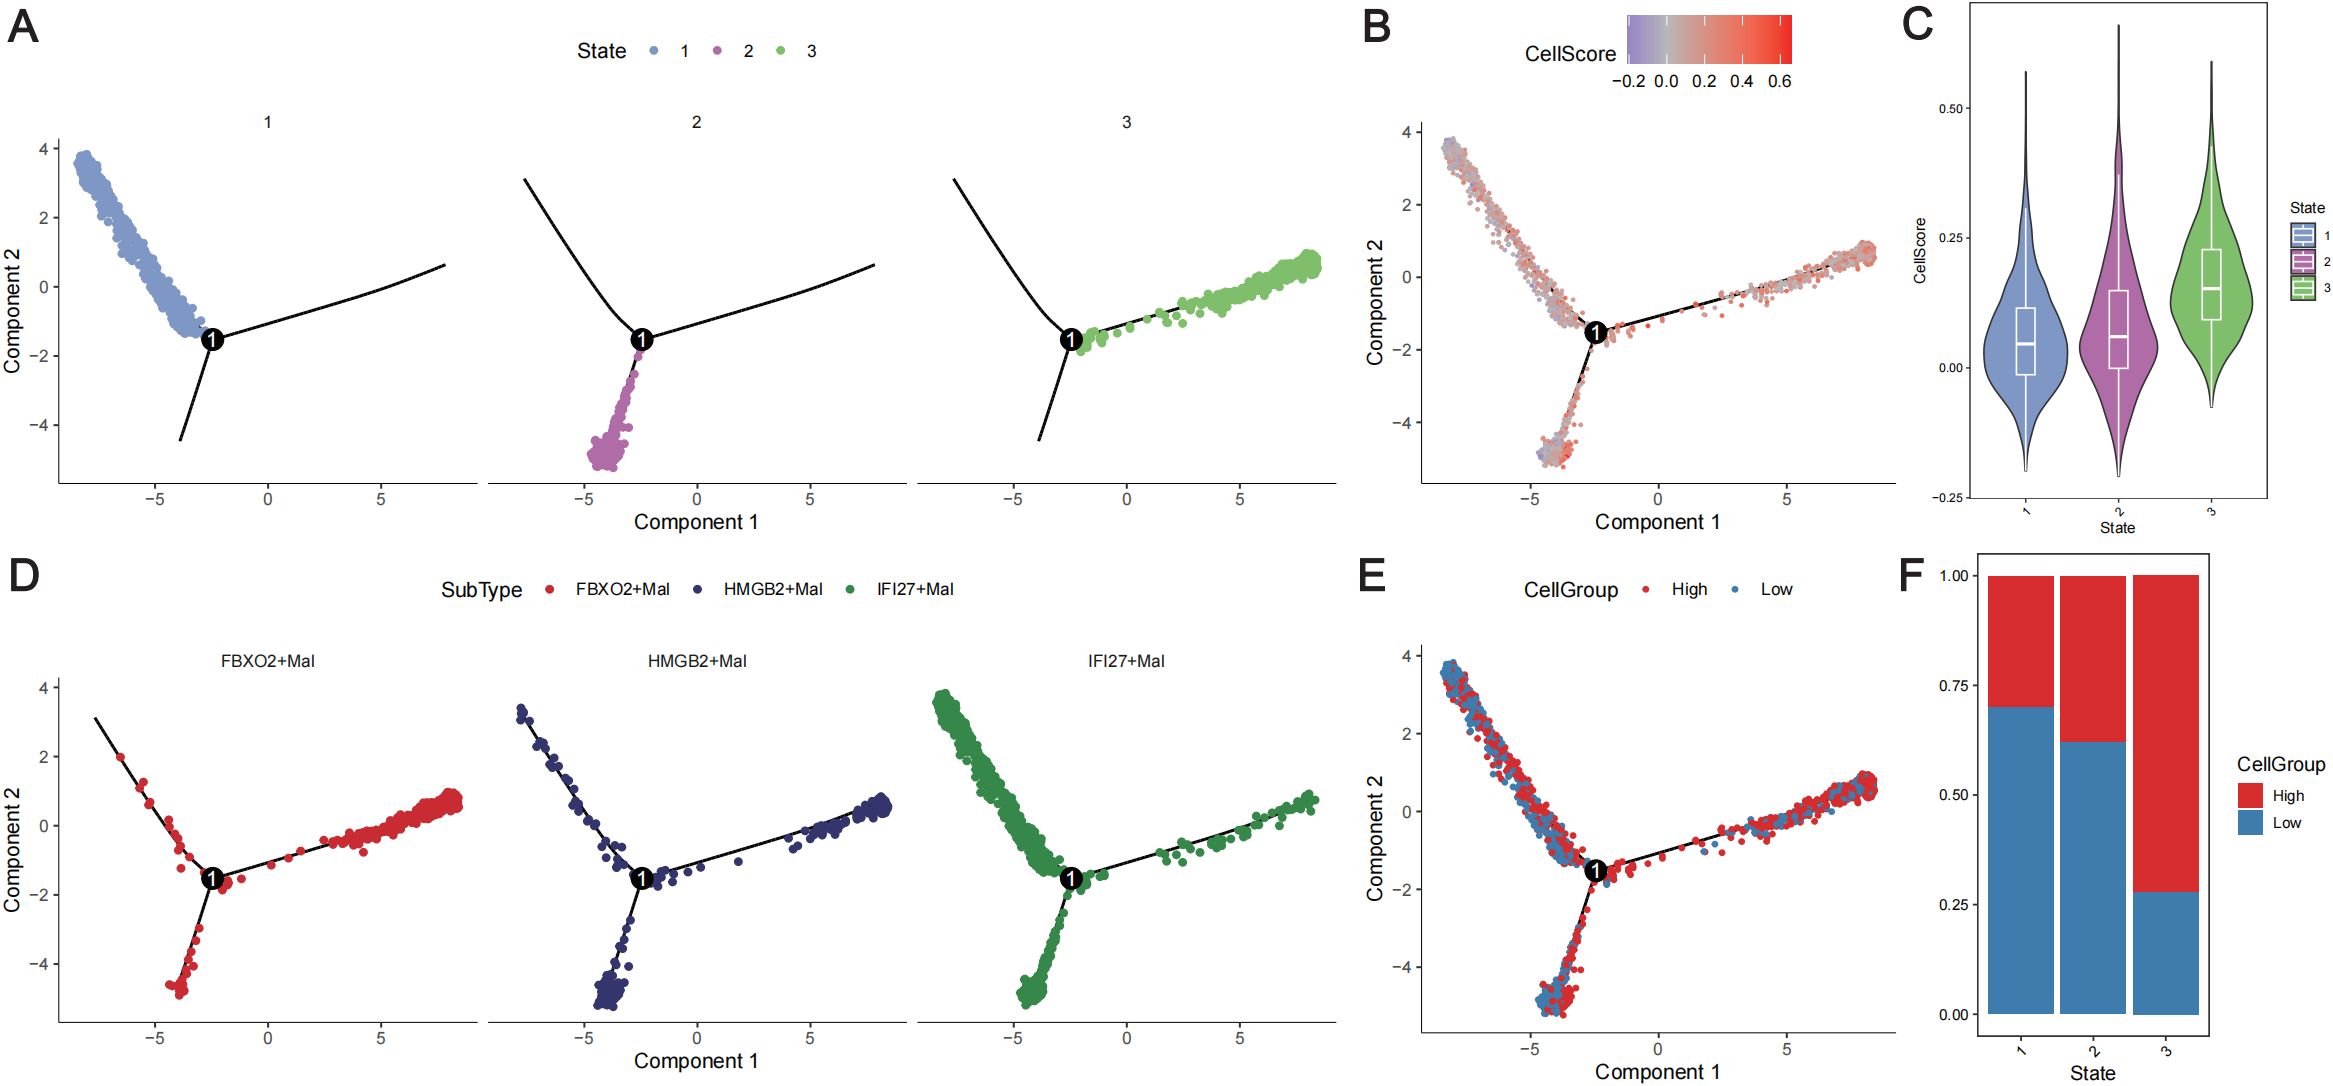
Figure 7. Trajectory analysis of malignant tumor cells. (A) Distribution of the three differentiation states of malignant cells. Different colors represent different states. (B) Distribution of malignant cells with different cell scores according to the differentiation trajectory. Different colors represent different cell scores. (C) Violin plot showing the cell scores in different states of the cell differentiation trajectory. (D) Distribution of the three subtypes of cells according to the cell differentiation trajectory. Different colors represent different cell subtypes. (E) Distribution of different cell groups according to the cell differentiation trajectory. Red represents a high CellScore, whereas blue represents a low CellScore. (F) Distribution of low- and high-cell groups in different cell differentiation states. Red represents the high-CellScore group, whereas blue represents the low-CellScore group.
To further analyze the differences in physiological activity between high- and low-neoplastic populations, cell-to-cell communication was analyzed via the “CellChat” package. Extensive cellular communication was observed between the cell populations (Supplementary Figure 7A). High neoplastic cells were more likely to be outgoing signaling-dominant senders than low neoplastic cells (Supplementary Figure 7B), and different cell populations were found to have outgoing signaling patterns in different biological pathways (Supplementary Figures 7C, D). Compared with low neoplastic patients, high neoplastic patients exhibited specific cellular communication in the CSF and KIT signaling pathways (Supplementary Figures 7E, F).
3.6 Lung TRM-related prognostic model for the treatment of LUAD
The IC50 values of the drugs in the training cohort were predicted using the R package “oncoPredict” via the use of the drug information from the GDSC database combined with the expression profiles of the training set. Spearman correlation analysis was performed between the prognostic signature and the log2(IC50) value for each drug (Supplementary Table 7). Patients in the high-risk group had a poorer prognosis; therefore, the top six drugs with the most significant negative correlations were selected according to the absolute values of the correlation coefficients. The six drugs used were AZD6738_ 1917, BI.2536_1086, docetaxel_1007, docetaxel_1819, MK.1775_179, and paclitaxel_1080 (p<0.05). The log2(IC50) values of these six drugs were lower in the high-risk score group than those in the low-risk score group and had greater sensitivity (Figures 8A1–A6). The Spearman correlation coefficients between the risk scores and drug log2 (IC50) values were also calculated, and the top 50 drugs were selected for display, which revealed that there was a correlation between gene expression levels and most of the drug log2 (IC50) values (Figure 8B).
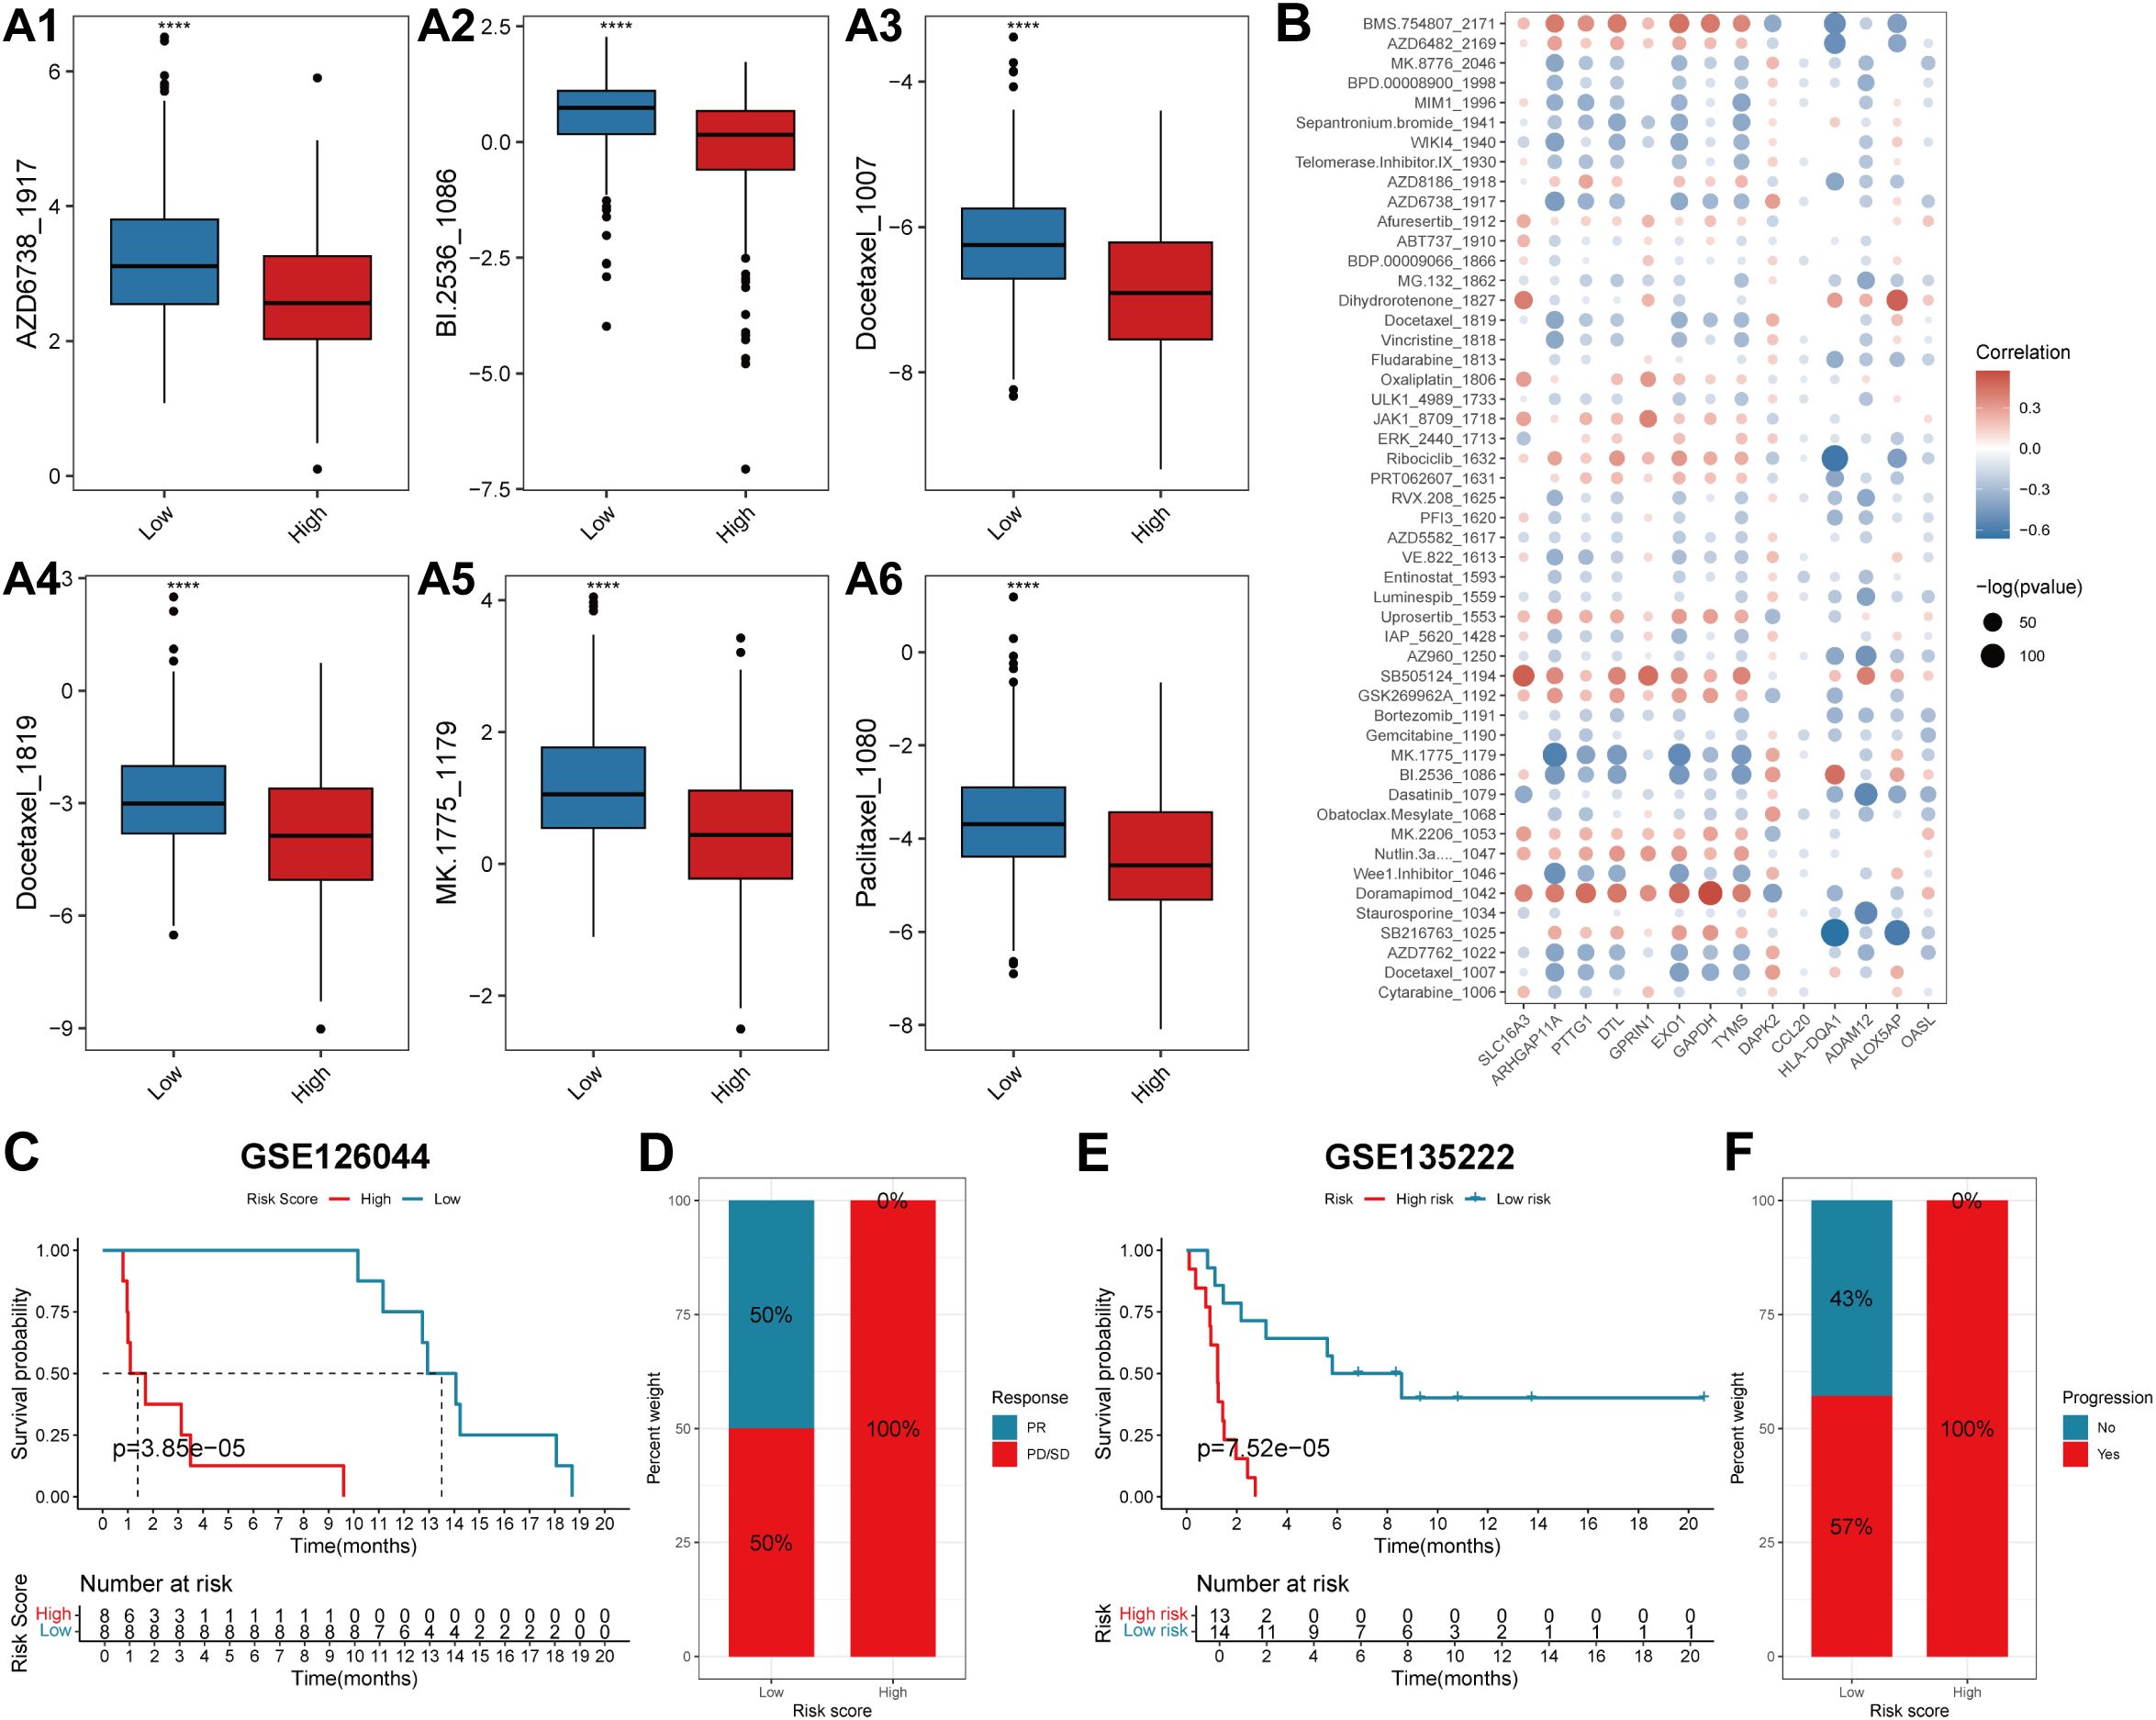
Figure 8. The predictive efficacy of the prognostic model for chemotherapy and immunotherapy. (A) Box plots showing the log2(IC50) values of the six drugs that had the highest negative correlation with the risk score in the high- and low-score groups: AZD6738_1917 (A1), BI.2536_1086 (A2), Docetaxel_1007 (A3), Docetaxel_1819 (A4), MK.1775_1179 (A5) and Paclitaxel_1080 (A6). In each box plot, the abscissa axis indicates the risk score groups, and the vertical axis indicates the log2(IC50) value of each drug. (B) The correlation coefficients between the top 50 drugs that have the highest negative correlation with the risk score and the expression levels of the genes involved in the prognostic signature. The abscissa axis indicates the gene names, and the vertical axis indicates the drug names. Red indicates a positive correlation, whereas blue represents a negative correlation. The sizes of the circles indicate significance (-log(p value)). (C, E) KM survival curves of patients in the low- and high-risk score groups in the two immunotherapeutic cohorts GSE126044 and GSE135222. The blue color represents patients in the low-risk score group, whereas the red color represents patients in the high-risk score group. The risk table is presented under the KM survival curves of each gene. (D) The proportions of patients who experienced a PR or PD/SD after receiving anti-PD1/PD-L1 immunotherapy in the low- and high-risk score groups. (F) The proportions of patients who experienced progressive and no progressive disease after receiving anti-PD1/PD-L1 immunotherapy in the low- and high-risk score groups. PR, partial response; PD, progressive disease; SD, stable disease.
To explore the predictive efficacy of the lung TRM-related prognostic model for patients receiving anti-PD1/PD-L1 immunotherapy, two immunotherapeutic cohorts, GSE126044 and GSE135222, were used for the prognostic analysis. The results revealed that patients in the low-risk score group had a superior overall survival status compared with patients in the high-risk score group in both cohorts (Figures 8C, E). Patients with low-risk scores had a greater response rate (Figure 8D) and a greater progression-free rate to anti-PD1/PD-L1 immunotherapy (Figure 8F).
3.7 Validation of the expression levels of genes in the protein data
To validate whether the protein expression levels of the genes involved in the lung TRM cell-related prognostic model were consistent with the RNA expression levels, immunohistochemical staining images were obtained from the Human Protein Atlas database (https://www.proteinatlas.org/). The results of immunohistochemical staining for SLC16A3, ARHGAP11A, PTTG1, GPRIN1 and TYMS were greater in LUAD tissues than in normal lung tissues, which was consistent with the RNA expression levels of these genes (Figures 9A–F). Immunohistochemical staining for HLA-DQA1, ALOX5AP and OASL was lower in LUAD tissues than in normal lung tissues, which was consistent with the RNA expression levels of these genes (Figures 9A, G–J). The LUAD proteome expression data and corresponding clinical information were obtained from the supplementary data of the study by Xu et al. (22). Survival analysis based on the proteome data revealed that SLC16A3, TYMS, ALOX5AP and OASL were risk factors for patient prognosis, whereas HLA-DQA1 was a protective factor (Figures 10A–E). These findings validated the functions of key genes in the TRM cell-related prognostic signature.
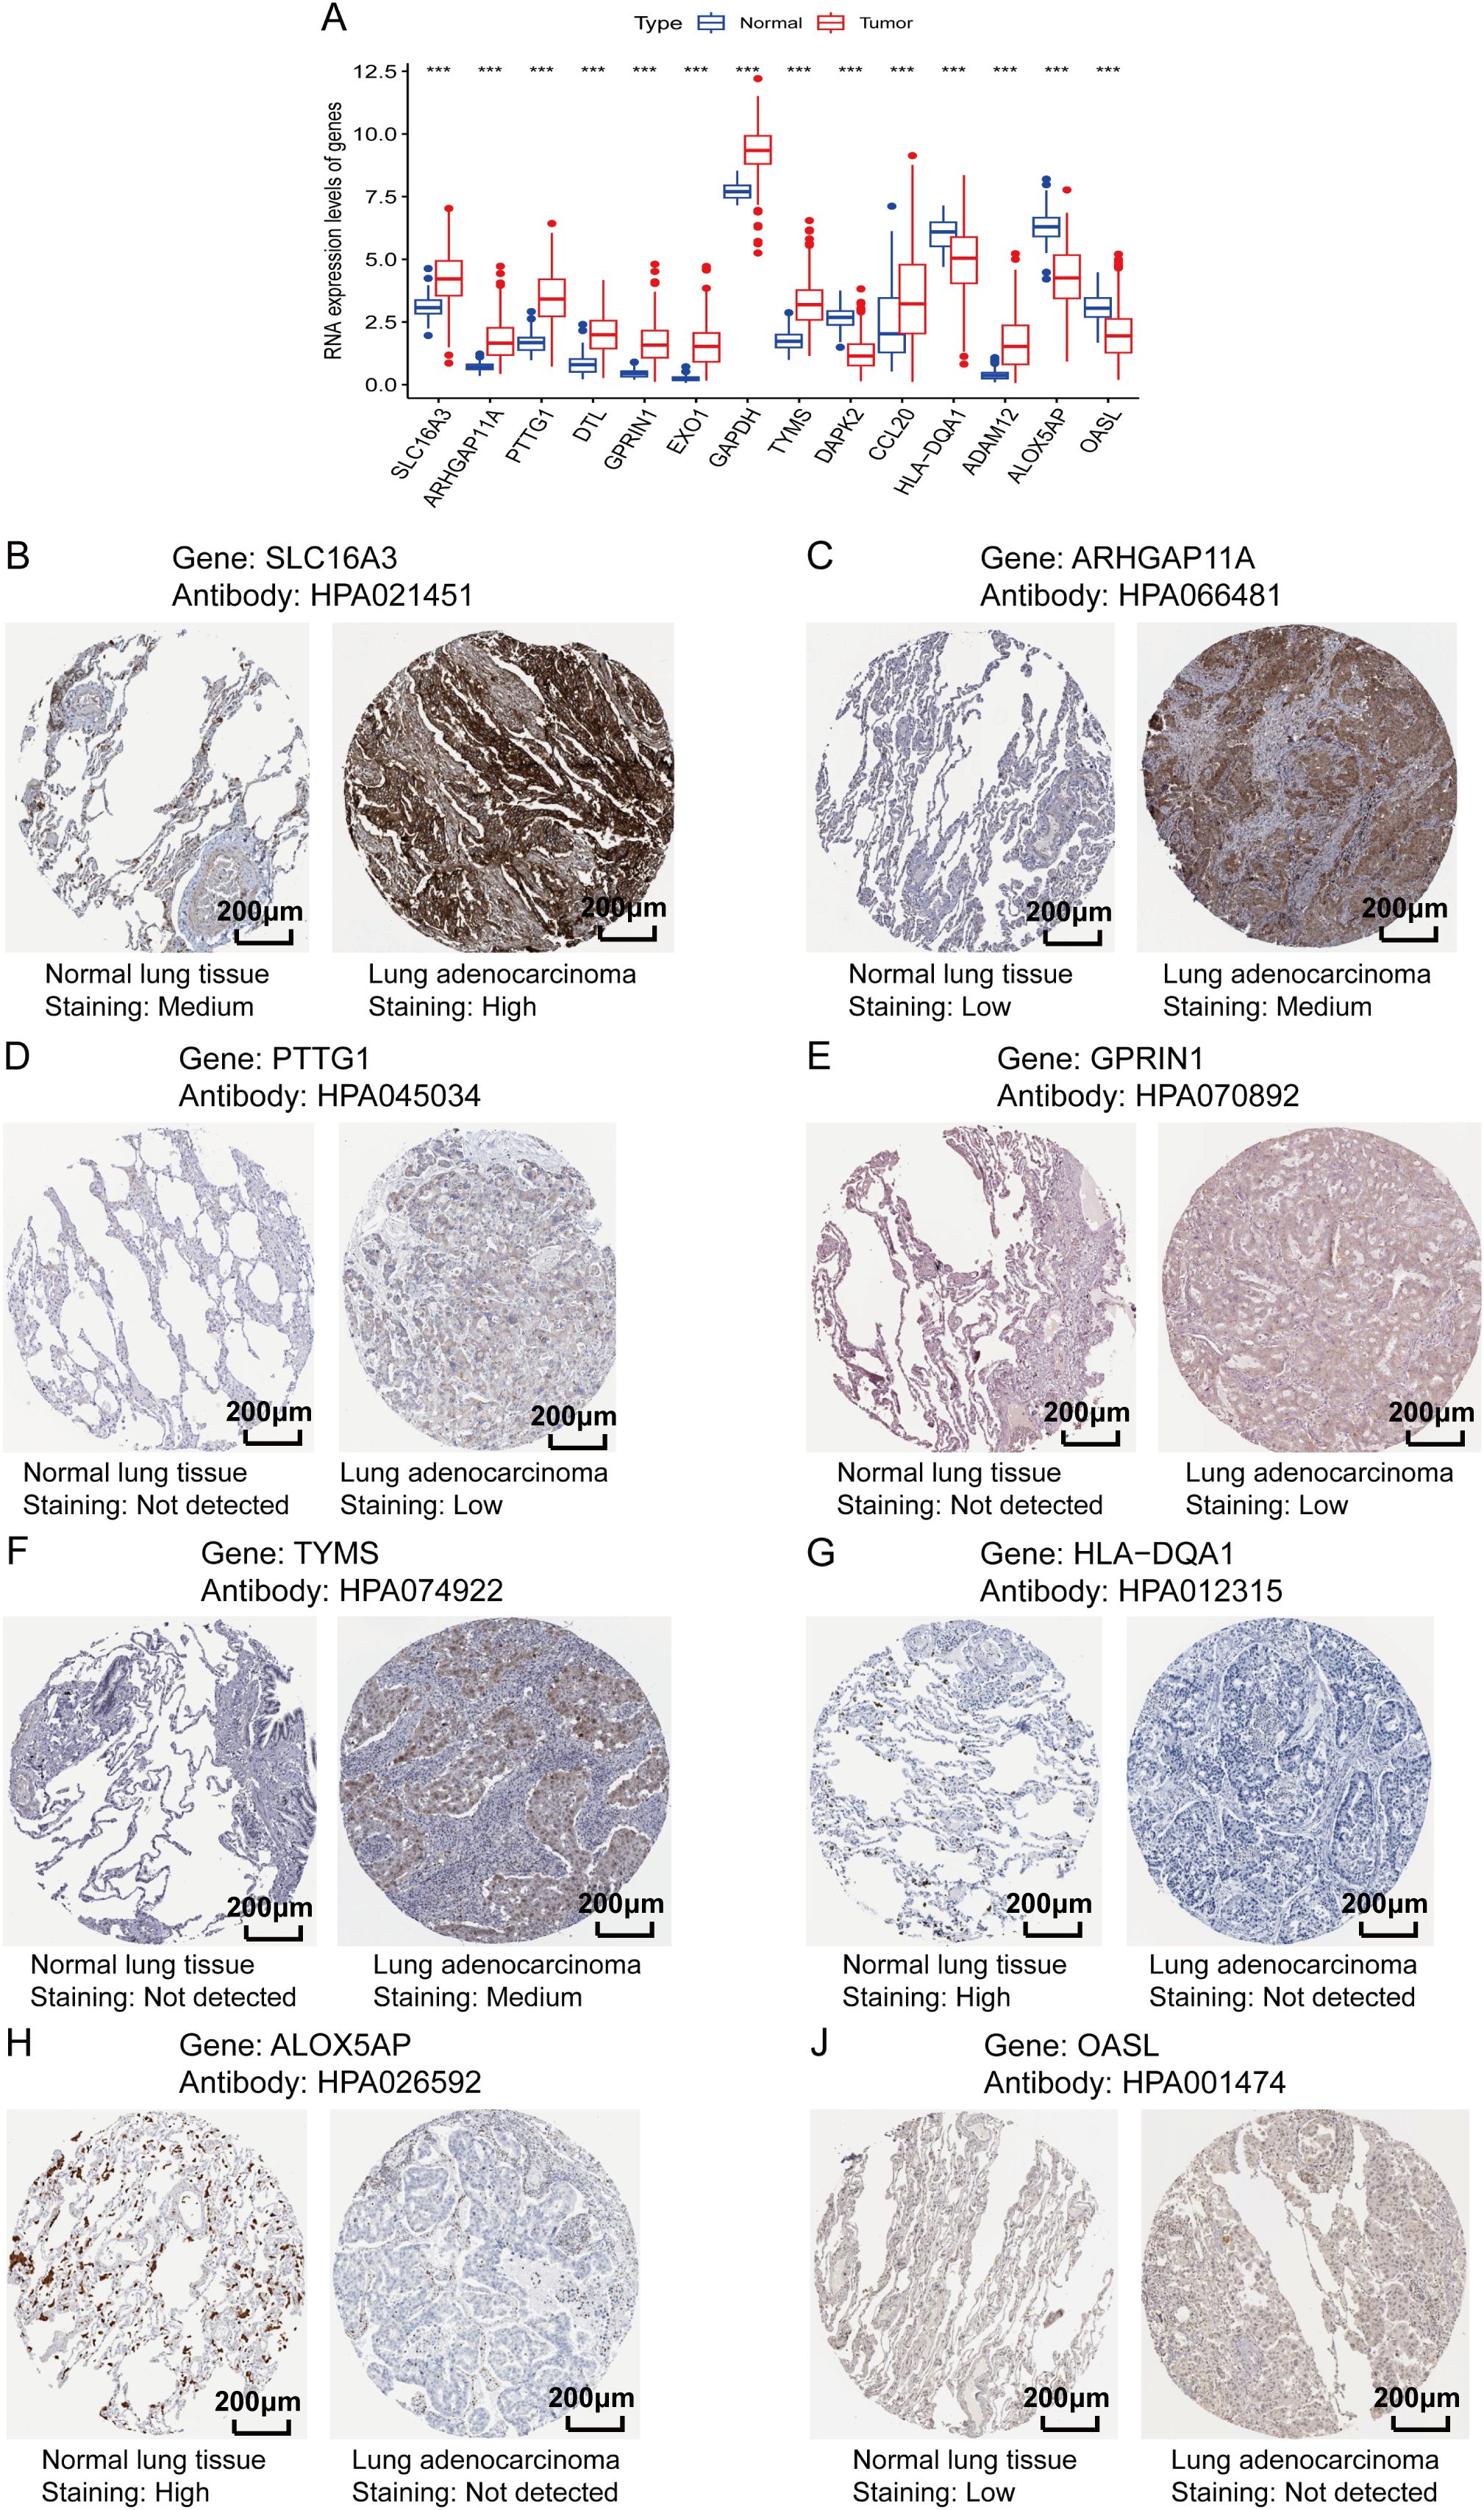
Figure 9. Validation of the protein expression levels of genes involved in the lung TRM-related prognostic signature. (A) RNA expression levels of the genes included in the prognostic model in LUAD and adjacent normal tissues. The abscissa axis shows the gene names, and the vertical axis shows the RNA expression levels. (B–J) Immunohistochemical staining images obtained from the Human Protein Atlas database (https://www.proteinatlas.org/): (B) SLC16A3, (C) ARHGAP11A, (D) PTTG1, (E) GPRIN1, (F) TYMS, (G) HLA-DQA1, (H) ALOX5AP and (J) OASL. The names of the genes and antibodies are presented at the top of each panel. The left image of each panel is the adjacent normal tissue, whereas the right image is the LUAD tissue. The staining intensity is labeled under each image.
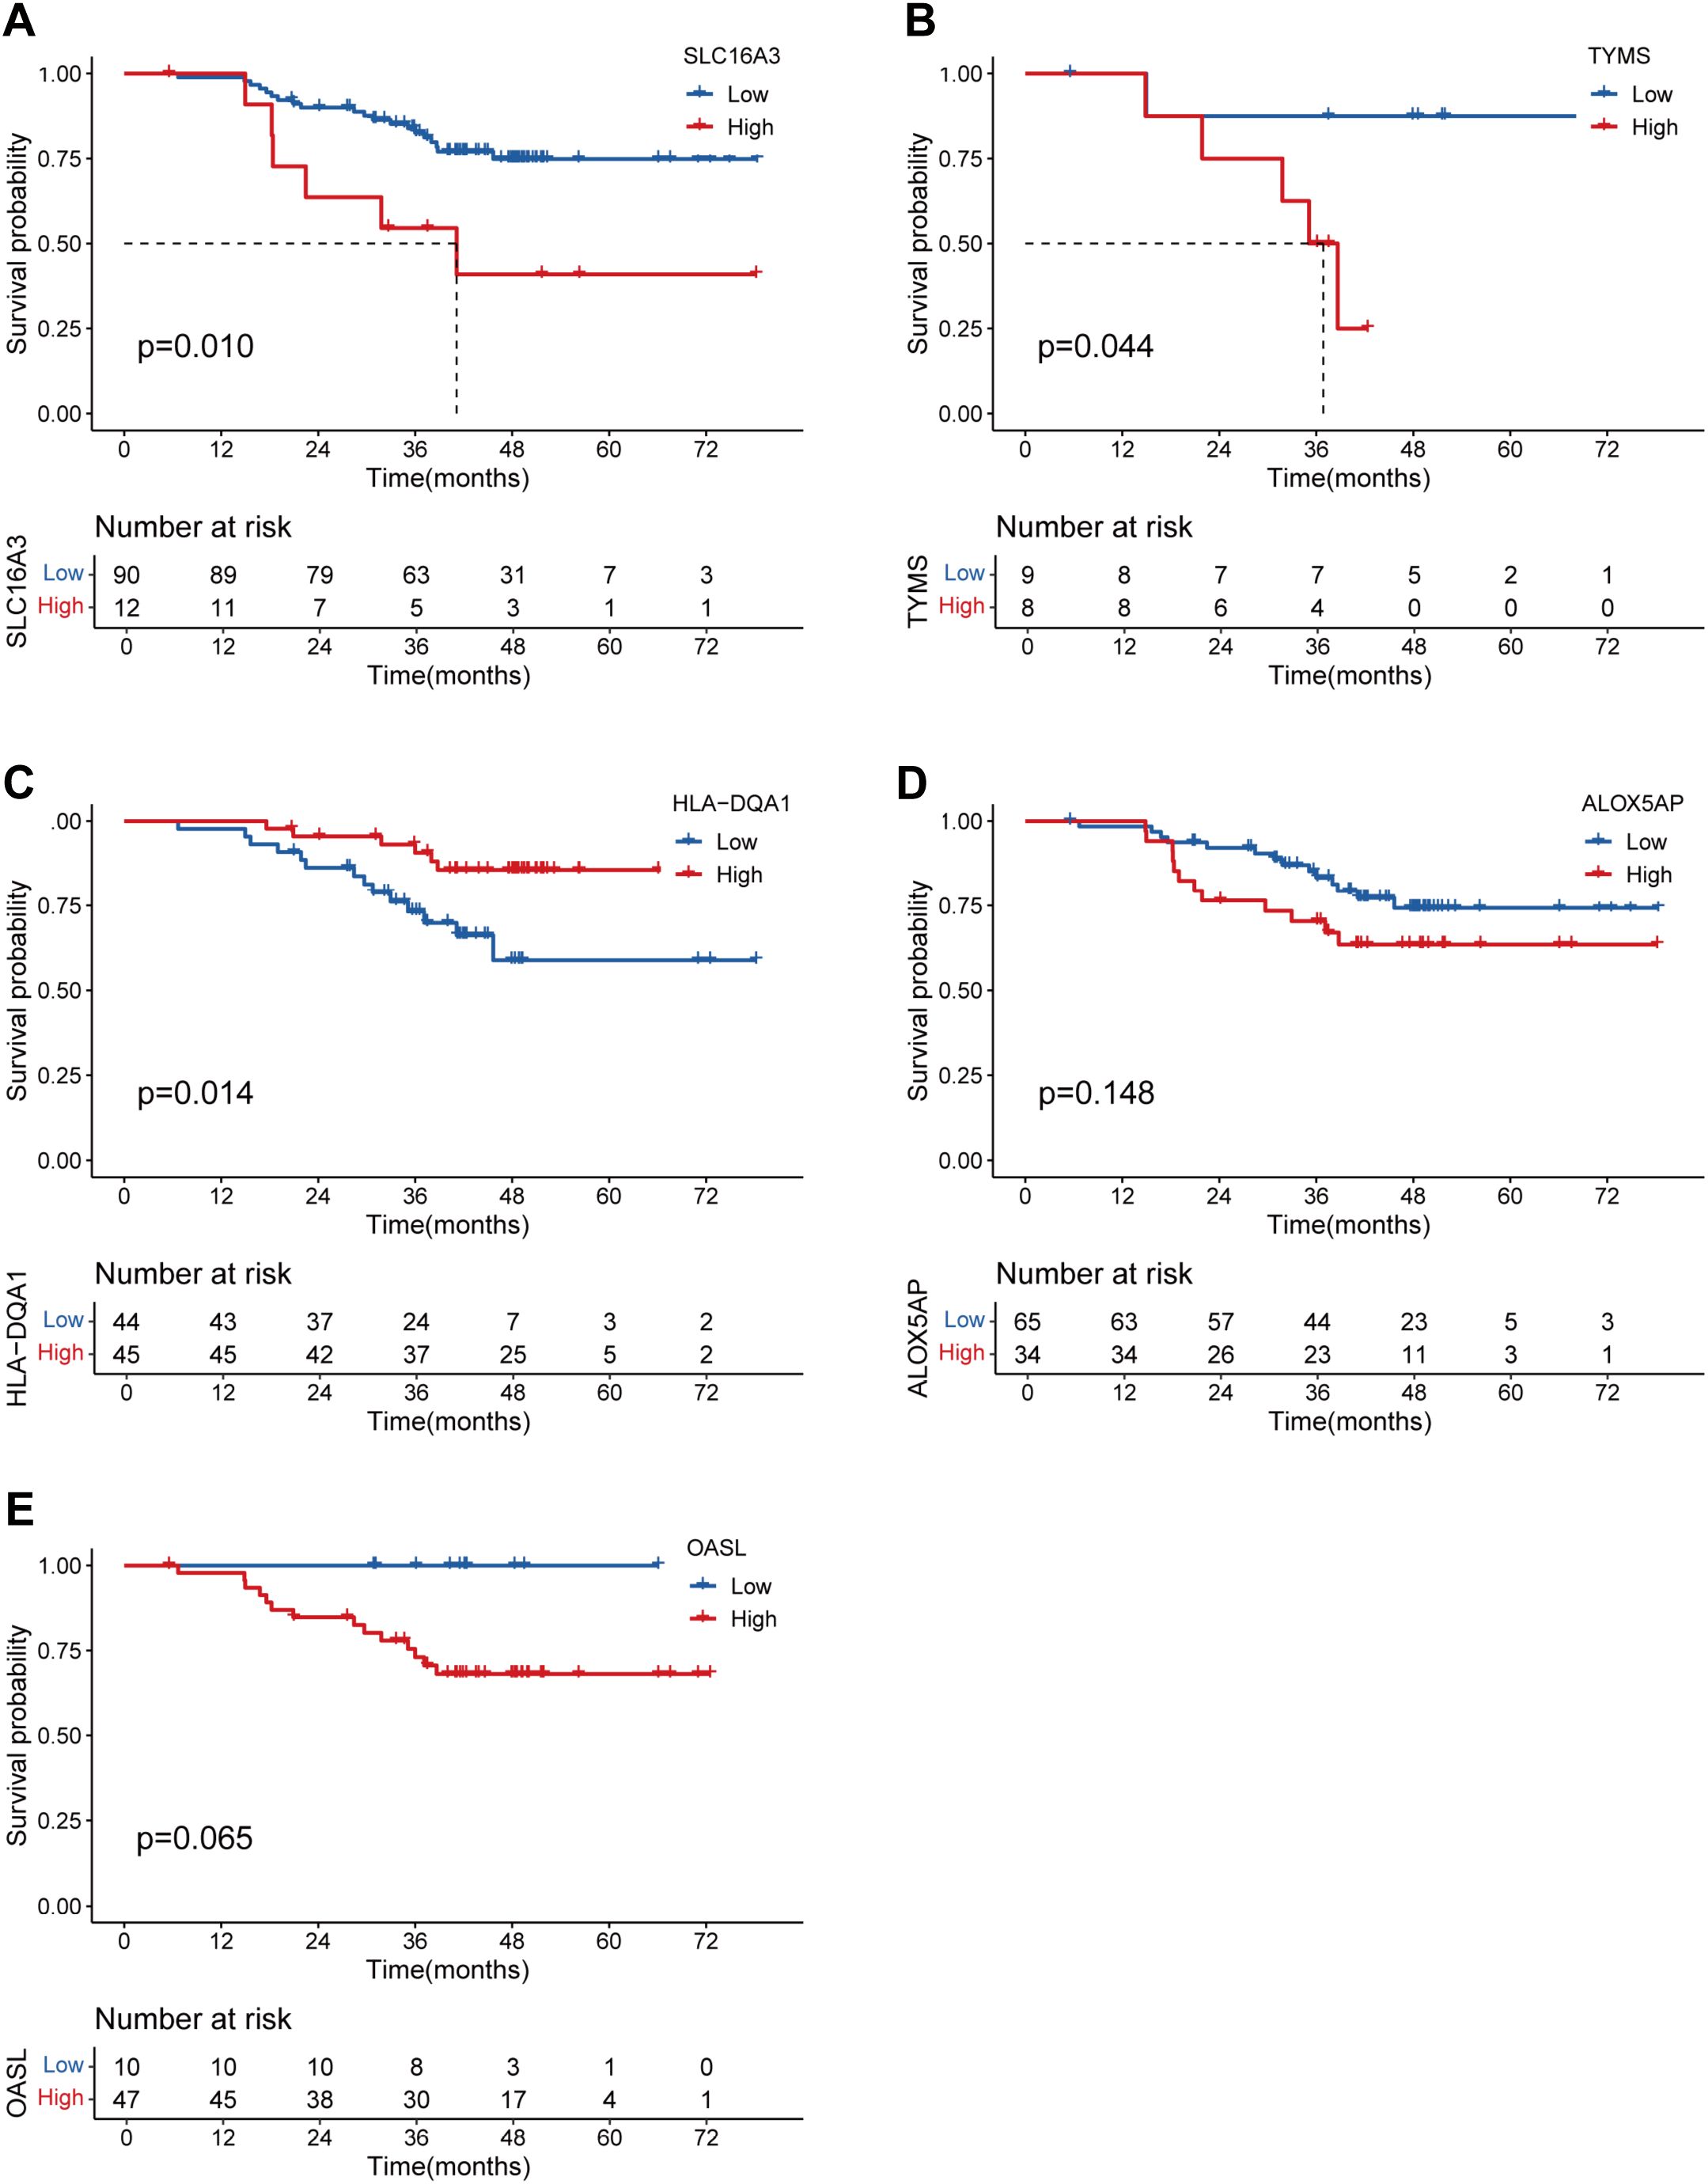
Figure 10. Validation of the prognostic significance of the genes involved in the lung TRM-related prognostic signature via proteomic data. K–M curves showing the survival status of LUAD patients with low and high protein expression of (A) SLC16A3, (B) TYMS, (C) HLA-DQA1, (D) ALOX5AP and (E) OASL.
3.8 Verification of the clinical and biological roles of the TYMS hub gene
Previous results revealed that TYMS was a hub gene in the TRM cell-related prognostic signature in the PPI analysis and the construction of the risk score model (Figures 2D, 3E; Supplementary Table 3). However, the function of TYMS in LUAD has rarely been investigated. To further investigate the clinical and biological roles of TYMS in LUAD, we performed immunohistochemical staining experiments using LUAD samples and assessed the proliferation of LUAD cell lines. Images of LUAD samples with negative, low, moderate, and high TYMS expression, magnified 40 × 10 times under a light microscope, are presented in (Figures 11A1–A4). The clinical samples included in this study were from a total of 30 patients with LUAD, 10 of whom were positive for TYMS and 20 of whom were negative. Survival analysis revealed that patients with negative TYMS staining in their tumor tissues had longer overall survival times than patients with positive TYMS staining (p=0.038, Figure 11B). Patients with M1 tumors had a higher TYMS-positive staining rate than those with M0 tumors (Figure 11C), and patients with clinical stage IV tumors had a higher TYMS-positive staining rate than those with stages II and III tumors (Figure 11D). These findings indicated that TYMS is a risk factor for LUAD patients, which is consistent with our previous findings (Figure 3E; Supplementary Table 3).
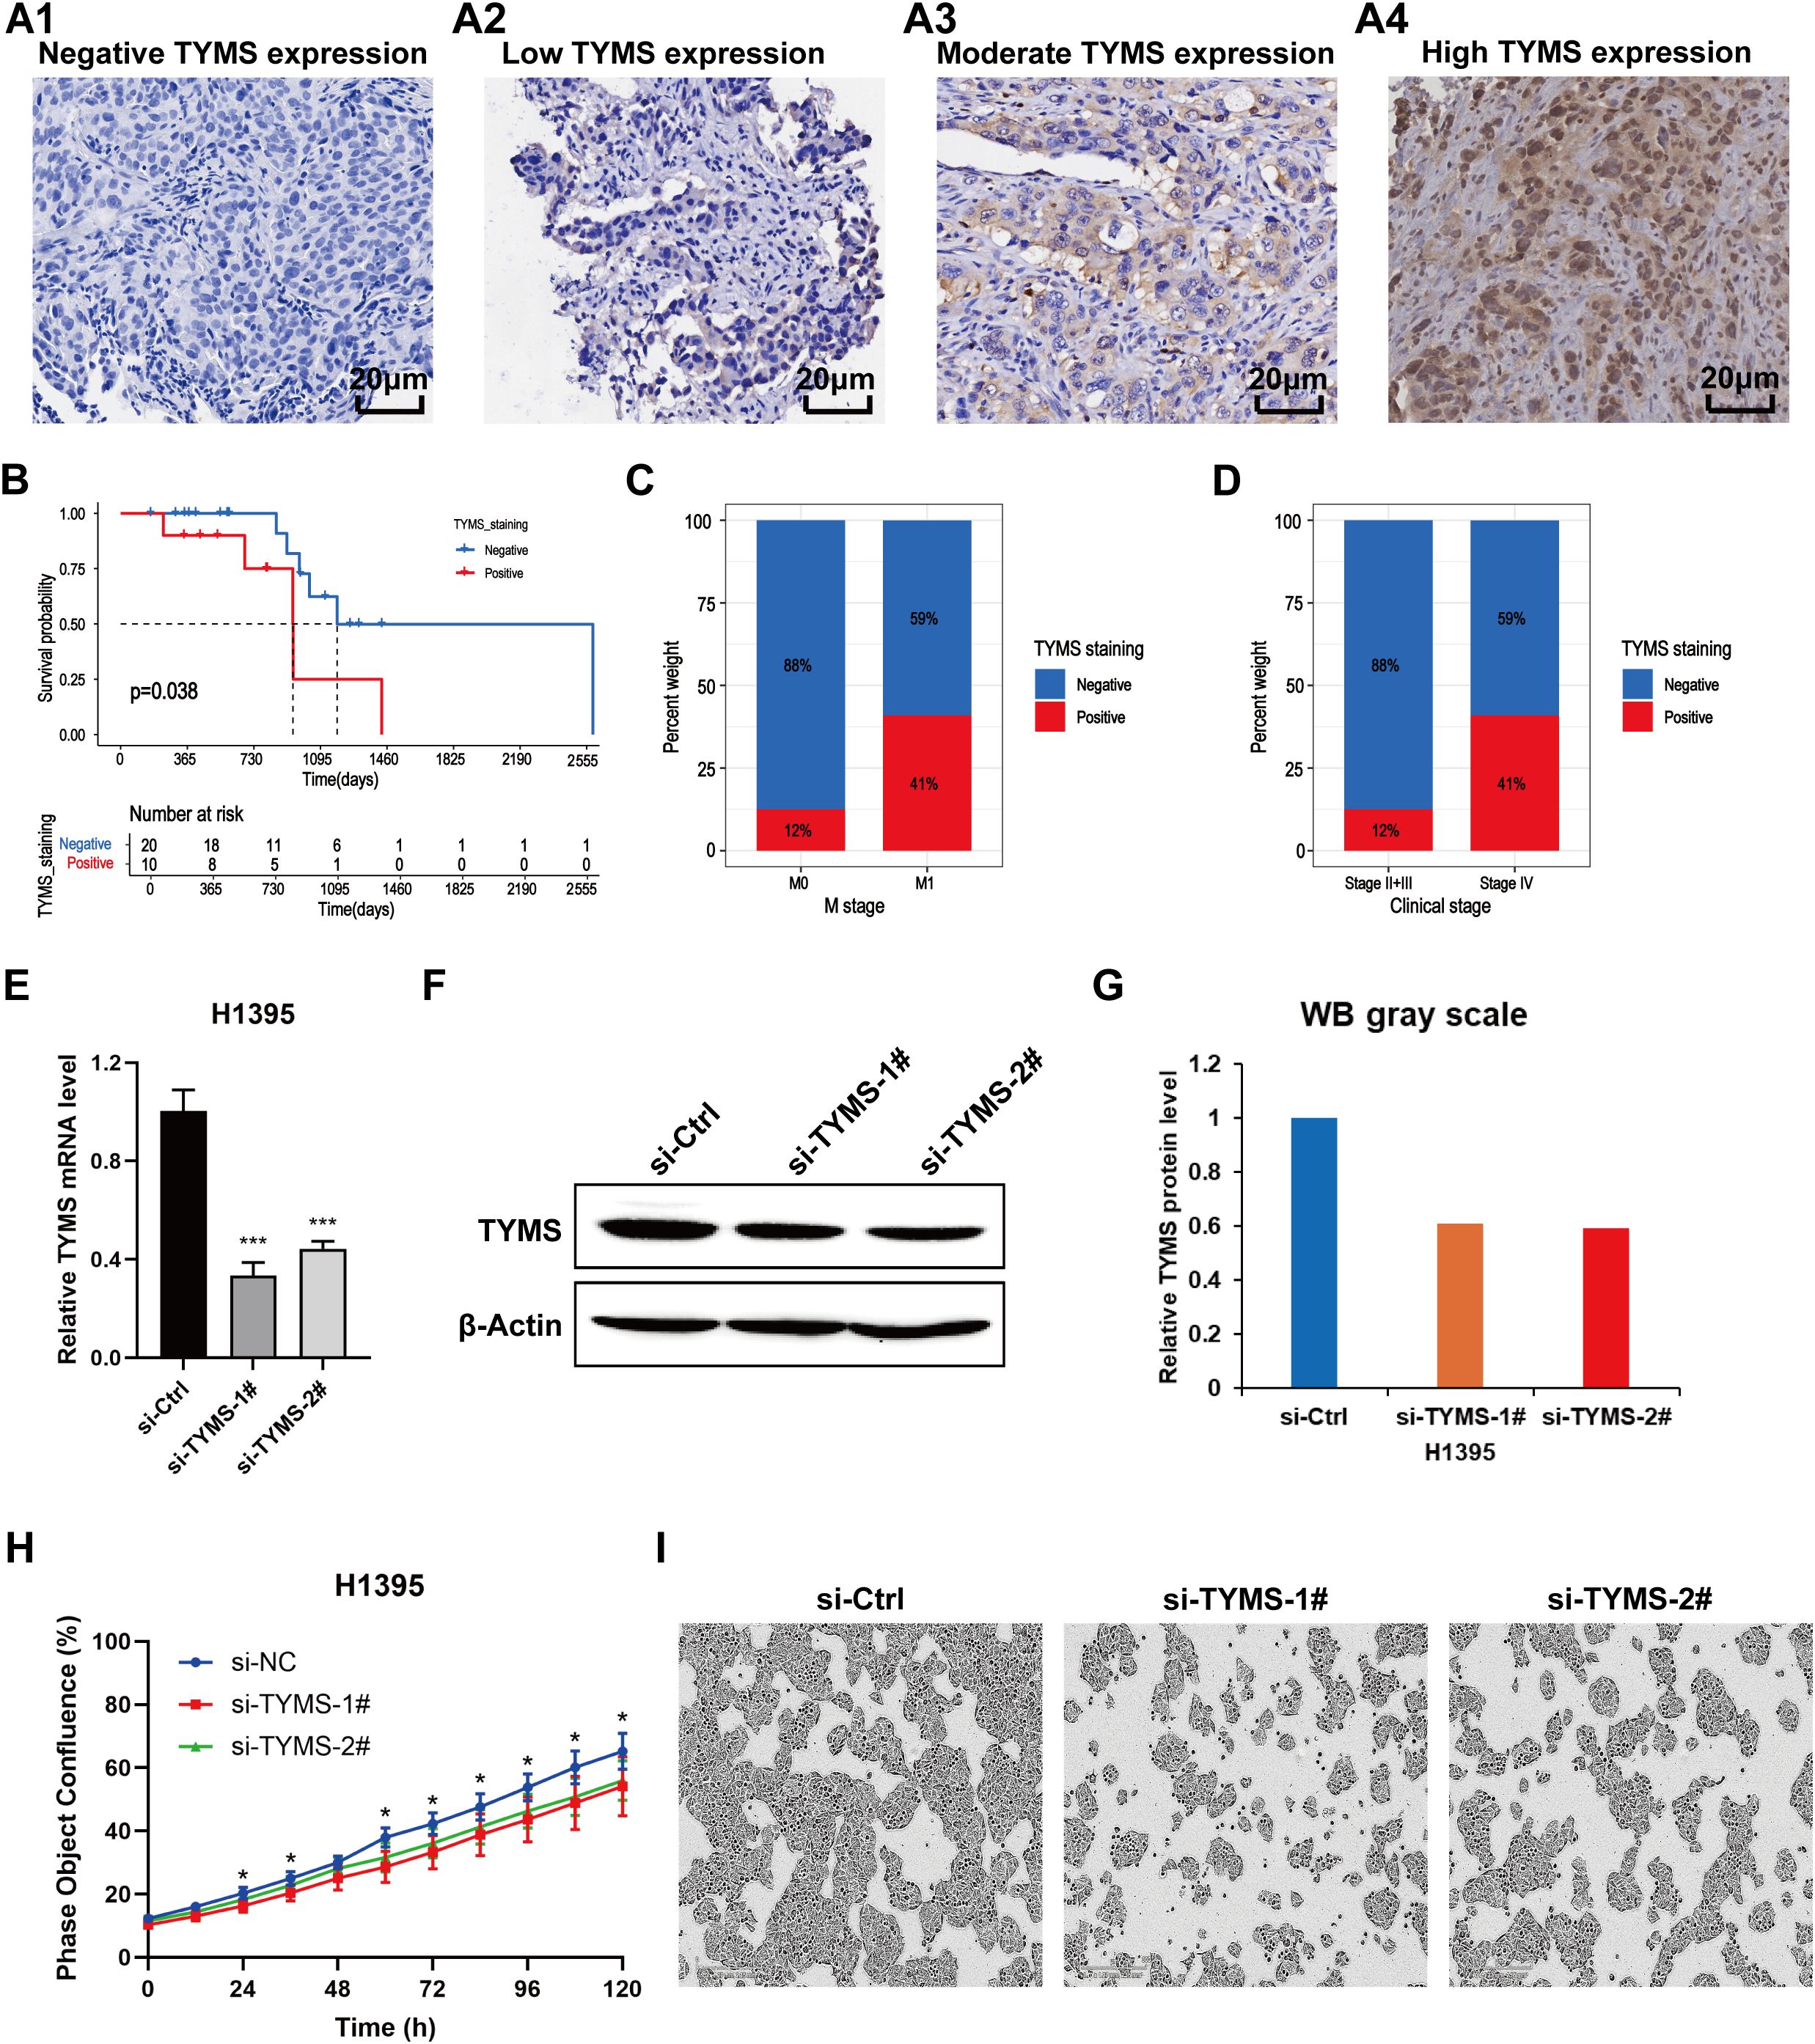
Figure 11. Validation of the clinical and biological roles of TYMS through experiments on LUAD clinical samples (n=30) and cell lines. (A) Images of LUAD samples with negative TYMS expression (A1), low TYMS expression (A2), moderate TYMS expression (A3) and high TYMS expression (A4) in the immunohistochemical experiment. (B) Kaplan–Meier curves showing the survival status of LUAD patients with negative and positive TYMS staining. (C) Percentage plot showing the proportion of samples with negative and positive staining among tumors at the M0 and M1 stages. (D) Percentage plot showing the proportions of samples with negative and positive staining among patients with clinical stages II+III and clinical stage IV disease. (E) Column chart showing the relative mRNA expression levels of TYMS in the si-TYMS-1#, si-TYMS-2# and control groups via qRT–PCR. (F) Western blotting results showing the protein levels of TYMS in the si-TYMS-1#, si-TYMS-2# and control groups. (G) The corresponding grayscale of the WB results in (F). (H) Proliferation curves of H1395 cells in the si-TYMS-1#, si-TYMS-2# and control groups. (I) Images of H1395 cells in the si-TYMS-1#, si-TYMS-2# and control groups captured by the IncuCyte platform 120 hours after seeding into 96-well plates.
In the cell proliferation experiment, first, TYMS was successfully knocked down through the siRNA oligos, as evaluated by qRT-PCR (Figure 11E) and western blotting (Figures 11F, G). The results of long-term dynamic observation experiments using the IncuCyte platform revealed that the proliferative capacity of H1395 cells was significantly impaired in the TYMS-knockdown groups compared with the control groups (Figures 11H, I), suggesting that TYMS may promote LUAD cell proliferation. These findings validate the role of TYMS in enhancing the growth of H1395 cells, suggesting its potential in promoting LUAD progression.
3.9 Validating the correlation between the TRM cells infiltration density and the expression levels of the prognostic predictors in LUAD
To further verify the link between tissue-resident memory T cells infiltration and the expression of the TRM cell-related prognostic predictors, Spearman’s correlation analysis was performed between the expression levels of the marker genes of TRM cells: CD8, CD69, CD103, and the 14 genes included in the TRM cell-related prognostic signature. The analytical results were consistent in the three datasets: TCGA (Figure 12A), GSE41271 (Figure 12B), and GSE42127 (Figure 12C). Interestingly, the expression levels of genes that were significant risk factors for LUAD patient prognosis, such as GAPDH, GPRIN1 and EXO1, were negatively correlated with the expression levels of TRM cell marker genes (Figures 3E, 12A–C). In contrast, the genes that are protective factors for the prognosis of LUAD, such as HLA-DQA1 and ALOX5AP, were positively correlated with the three TRM cell markers (Figures 3E, 12A–C). Moreover, the risk score of the LUAD patients was negatively correlated with the important TRM cell marker gene CD69 in all three cohorts (Figures 12A–C). These results confirmed again that the prognostic predictors involved in the TRM cell-related signature could affect patient prognosis by regulating the infiltration of TRM cells.
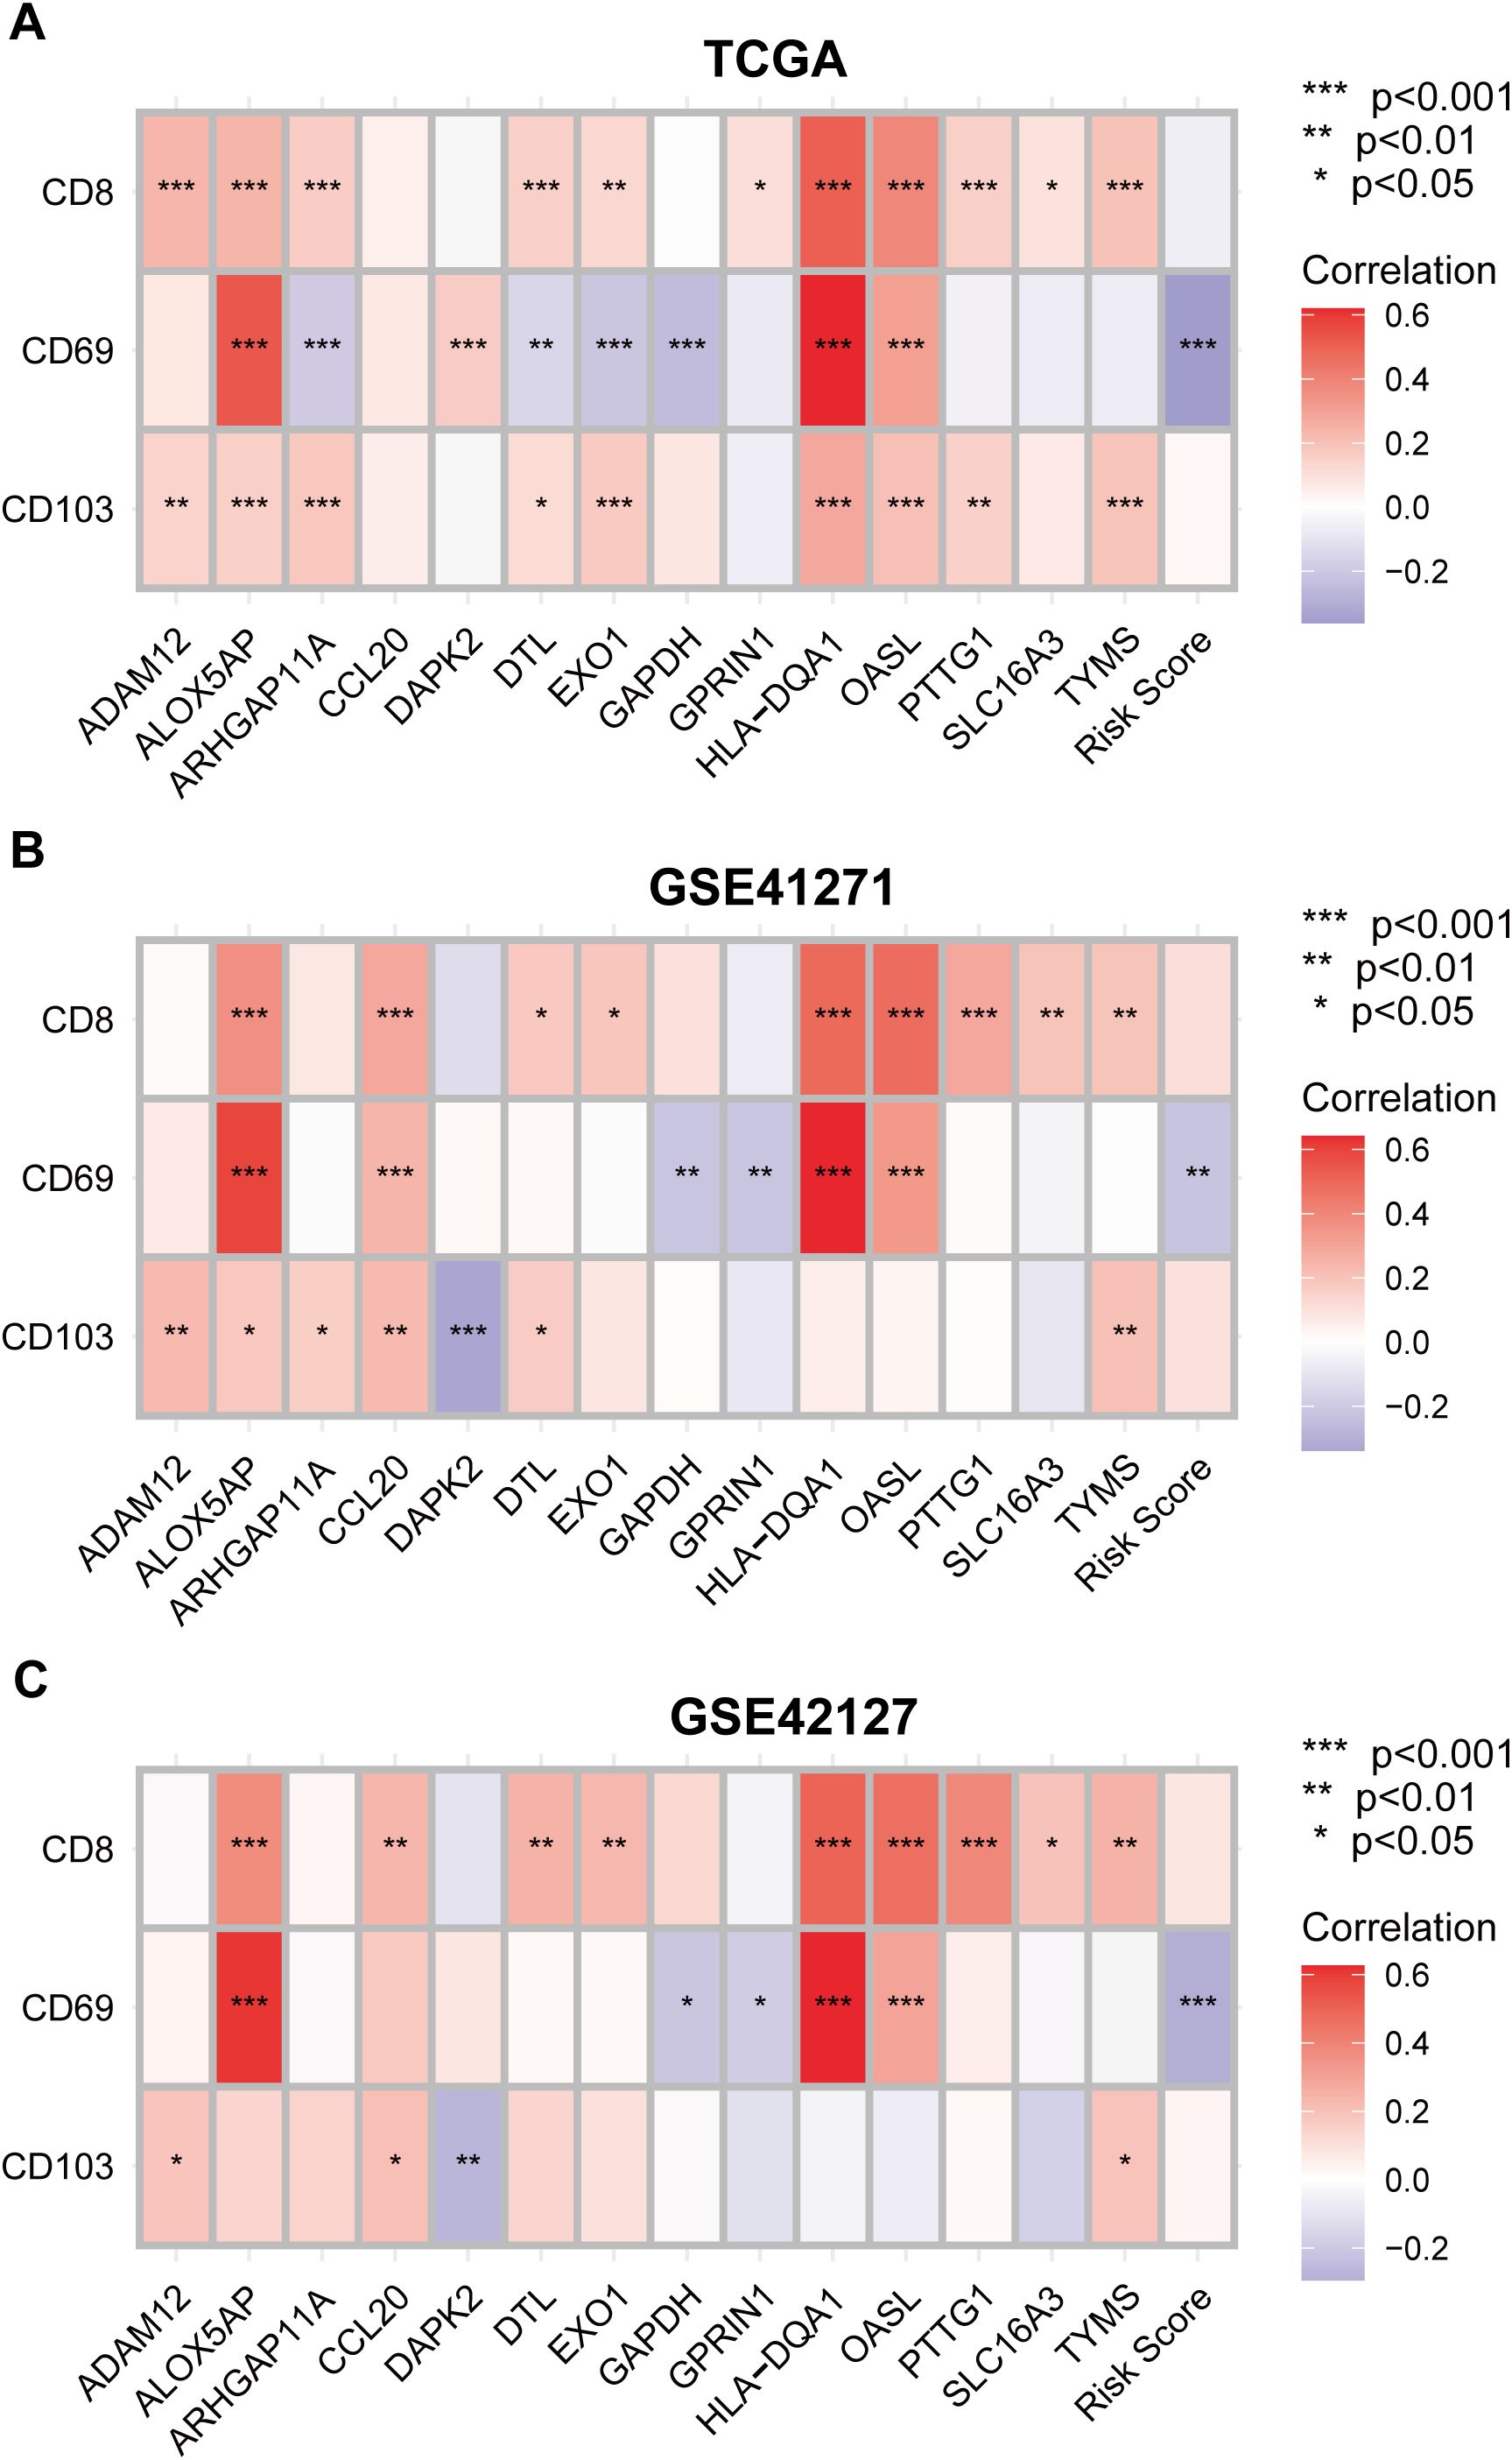
Figure 12. Validating the correlation between the tissue-resident memory T cells infiltration density and the expression levels of the prognostic predictors in LUAD. (A–C) Correlation analysis between TRM cell marker genes CD8, CD69 and CD103, and the 14 genes involved in the TRM cell-related prognostic signature using TCGA (A), GSE 41271 (B) and GSE42127 (C) datasets. Negative correlation: blue; positive correlation: red.
4 Discussion
TRM cells can reside in specific organs or tissues without entering the blood circulation (1). A recent study revealed that TRM cells in different tissues or organs have distinct transcriptomic status and specific gene expression patterns, which may be closely related to their specific functions in these organs (11). For example, acute respiratory virus-specific TRM cells, such as influenza- and SARS-CoV-2-specific TRM cells, are more likely to be maintained in the lungs than at other sites; TRM cells that target the intestinal microbiota and pathogens are maintained in the intestinal tract, whereas in the skin, TRM cells are produced in response to skin infections and are associated with protective immune responses. The infiltration of TRM cells has been proven to be a protective factor for patient prognosis in many cancers (10). Recent studies have shown that even the dysfunctional CD8+TRM cells, induced by interactions with surrounding tumor cells, play important roles in anti-tumoral reactivity (23, 24). The efficacy of anti-PD-1 immunotherapy is also highly dependent on the sufficiency of CD8+TRM cells infiltrating in the TME (25). However, it is unclear whether TRM-specific genes in one type of organ can regulate TRM cells to exert specific immune responses against tumors.
To explore the roles of TRM-specific genes in regulating the development of LUAD, in this study, TRM cell-specific genes that were differentially expressed (DE) between LUAD and adjacent normal tissues were identified (Figures 2A–D; Supplementary Tables 1, 2). Then, 62 TRM-specific DE genes associated with OS were identified through univariate Cox regression analysis (Supplementary Table 3), and a TRM-related prognostic model was constructed based on these genes (Figures 3A–E). The prognostic model showed strong predictive efficacy in both the training and validation cohorts (Figures 4A–I). Patients with low- and high-risk scores also had different clinical features according to the prognostic model (Supplementary Figures 1, 2). Fourteen lung TRM cell-specific genes were included in the prognostic model (Figure 3E). Among the 14 genes, GAPDH, SLC16A3, PRIN1, TYMS, CCL20, ARHGAP11A, DTL, PTTG1, EXO1, OASL and ADAM12 were risk factors, whereas DAPK2, ALOX5AP and HLA-DQA1 were protective factors for the prognosis of patients with LUAD (Figure 3E). Our results are consistent with those of previously published studies (26–38). We noticed that TYMS and EXO1 had strong connectivity with other TRM cell-specific genes in the PPI analysis; therefore, these two genes may play central roles in the regulatory network of these genes (Figure 2D). We intend to further explore the clinical and biological functions of these two genes in our future studies, and our research on the functions of EXO1 in LUAD has recently been published recently (39).
The results of the GSEA of the DEGs between the low- and high-risk score groups revealed that some pathways related to the antitumoral response, such as the B-cell receptor signaling pathway (40), regulation of T-cell activation and T-cell-mediated immunity (41), were activated in the low-risk score group (Figures 5A, B; Supplementary Table 4). Some immune cells that play important roles in killing tumor cells also infiltrated more in the low-risk score group, such as activated CD8+T cells and central memory CD8 T cell (22, 23, 41, 42) (Figure 5C). This was validated by correlation analysis between CD8+TRM cell marker genes CD8, CD69, CD103 (2), the TRM cell-related risk score, and the 14 genes involved in the TRM cell-related prognostic signature. Among the 14 genes, genes that are associated with inferior prognosis of LUAD patients, such as GAPDH, GPRIN1 and EXO1, were negatively correlated with the expression levels of TRM cells markers (Figures 3E, 12A–C). However, genes that were associated with superior prognosis of LUAD patients, such as HLA-DQA1 and ALOX5AP, were positively correlated with TRM cell marker genes (Figures 3E, 12A–C). The risk score, which was associated with poor prognosis, was significantly negatively correlated with the TRM cell marker CD69 in all three cohorts (Figures 4, 12). This confirmed that the TRM cell-related risk score was negatively associated with TRM cell infiltration in LUAD, and the prognostic predictors involved in the risk score model may impact the prognosis of LUAD patients by regulating TRM cell infiltration. These findings suggest that the risk score was negatively correlated with antitumor immune activation in LUAD patients, which may be an important reason for the better prognosis in the low-risk score group. Moreover, most of the reported immune checkpoint genes were highly expressed in the low-risk score group (Figure 5E). This finding was consistent with the finding that patients in the low-risk score group had better clinical outcomes after treatment with immune checkpoint blockade (Figures 8C–F).
Given that single-cell sequencing is an efficient method for studying the spatiotemporal heterogeneity of tumors (43–45), we further analyzed the scRNA-seq data to validate the predictive efficacy of the TRM-related prognostic model (Supplementary Figures 3, 4). Three subtypes of malignant cells were identified, namely, IFI27+Mal, FBXO2+Mal and HMGB2+Mal (Figures 6A–C). The results also revealed that the FBXO2+Mal and HMGB2+Mal cell subtypes had significantly higher scores than IFI27+Mal cells (Figures 6D–G). Functional enrichment analysis revealed that the marker genes of IFI27+Mal cells were enriched in pathways related to immune activation, such as the positive regulation of leukocyte and MHC class II receptor activity (Supplementary Figure 5; Supplementary Table 5), which was consistent with previous findings that the TRM-related risk score and cell score were negatively correlated with immune activation (Figures 5A–D; Supplementary Figure 6A). FBXO2, HMGB2 and IFI27 are all oncogenes according to previous reports (46–51), and their roles in regulating the development of LUAD and the possibility of becoming therapeutic targets need to be further studied.
The above results were mainly based on analyses of RNA expression data. In subsequent analyses, the protein expression levels of the genes included in the TRM-related signature were investigated using immunohistochemical images from the Human Protein Atlas database (https://www.proteinatlas.org/). SLC16A3, ARHGAP11A, PTTG1, GPRIN1 and TYMS were more highly expressed in LUAD tissues, whereas HLA-DQA1, ALOX5AP and OASL were expressed at lower levels in LUAD tissues than in normal lung tissues. These findings validated the differences in the RNA expression of these genes (Figures 9A–J). Survival analysis via proteomic data verified the prognostic significance of several TRM-related signature genes, including SLC16A3, TYMS, HLA-DQA1, ALOX5AP and OASL (Figures 10A–E). Among these genes included in the TRM-related signature, TYMS appeared to be a hub gene. TYMS has been reported to be an oncogene for colorectal cancer, pancreatic cancer and lymphoma and promotes tumor progression (52–54), but its role in LUAD has rarely been reported. Our experiments using LUAD clinical samples and cell lines demonstrated that TYMS could also promote the progression of LUAD (Figures 11A–I), and may be a potential therapeutic target that could regulate the functions of TRM cells in LUAD. A few reports have suggested that the expression levels of TYMS are associated with the TME landscape and responses to immune checkpoint inhibitor therapy (55, 56). However, the underlying mechanisms have not been elucidated. TYMS is a key enzyme in the 5-FU catabolic pathway and is associated with the response to 5-FU-based therapy (57). A study has also demonstrated that 5-FU/platinum chemotherapy could facilitate tumor-reactive T cell and M1-like macrophage interactions, thus improving the efficacy of anti-PD-1 immunotherapy for advanced gastroesophageal adenocarcinomas (GEA) (58). Therefore, TYMS may regulate the TME and anti-PD-1 immunotherapeutic response via its roles in 5-FU metabolism. Moreover, TYMS is regulated by MYC, which affects PD-1 expression in colorectal cancer (59). Thus, TYMS may also affect anti-PD1 immunotherapy through MYC.
Our study had some limitations. First, our study was based mainly on bioinformatics analyses of public datasets and was only partially verified by experiments on clinical tissues. Biological and molecular experiments in vitro and/or in vivo are needed to further investigate the functions of key genes and the activities of the corresponding signaling pathways. Second, owing to the retrospective nature of our study, bias may be inevitable, and prospective experiments are needed for further validation. Third, the differentially expressed TRM cell-related genes were identified with thresholds set at |log2FC|≥1 and FDR<0.05, using bioinformatic methods. Although they are standard methods, some genes that do not meet with the threshold criteria may also play significant roles in the functions of lung TRM cells and the development of LUAD. Moreover, the experimental validation in our study focused primarily on the PPI hub gene TYMS owing to the limitation of time and experimental conditions. In the future studies, we will extend these functional studies to other key genes.
5 Conclusion
The prognostic signature based on lung TRM cell-related genes was efficient and robust for predicting the prognosis and therapeutic outcomes of patients with LUAD. The expression and functions of key genes in the prognostic signature were verified through experiments with LUAD samples and cell lines. Our findings increase the understanding of TRM-related clinical and biological significance in LUAD and may provide potential therapeutic targets for LUAD.
Data availability statement
The raw data supporting the conclusions of this article will be made available by the authors, without undue reservation.
Ethics statement
The studies involving humans were approved by the Ethics Committee of Shandong Provincial Hospital. The studies were conducted in accordance with the local legislation and institutional requirements. The human samples used in this study were acquired from primarily isolated as part of your previous study for which ethical approval was obtained. Written informed consent for participation was not required from the participants or the participants’ legal guardians/next of kin in accordance with the national legislation and institutional requirements.
Author contributions
ZL: Formal analysis, Visualization, Methodology, Software, Validation, Writing – original draft, Investigation, Data curation. MT: Validation, Methodology, Data curation, Software, Writing – original draft, Visualization, Investigation. YY: Writing – original draft, Investigation, Software, Data curation, Validation, Visualization. YW: Formal analysis, Methodology, Visualization, Writing – original draft, Investigation, Data curation. LZ: Formal analysis, Writing – review & editing, Data curation, Visualization, Software. FH: Investigation, Data curation, Software, Writing – review & editing, Formal analysis. XW: Formal analysis, Writing – review & editing, Data curation, Investigation. XY: Writing – review & editing, Software, Investigation, Data curation. XL: Conceptualization, Writing – review & editing, Resources, Investigation, Methodology, Supervision. YT: Project administration, Funding acquisition, Supervision, Methodology, Investigation, Writing – review & editing, Conceptualization, Resources.
Funding
The author(s) declare that financial support was received for the research and/or publication of this article. This study was funded by the Research Start-up Fund for Talent Introduction of the Affiliated Hospital of Shandong University of Traditional Chinese Medicine (yjgjzcrc-202402) and the Clinical Medical Science and Technology Innovation Program of Jinan (202430045).
Acknowledgments
We are very grateful to the Gene Expression Omnibus (GEO) and the Cancer Genome Atlas (TCGA) databases for providing the transcriptome and clinical information.
Conflict of interest
The authors declare that this research was conducted in the absence of any commercial or financial relationships that could be construed as potential conflicts of interest.
Generative AI statement
The author(s) declare that no Generative AI was used in the creation of this manuscript.
Publisher’s note
All claims expressed in this article are solely those of the authors and do not necessarily represent those of their affiliated organizations, or those of the publisher, the editors and the reviewers. Any product that may be evaluated in this article, or claim that may be made by its manufacturer, is not guaranteed or endorsed by the publisher.
Supplementary material
The Supplementary Material for this article can be found online at: https://www.frontiersin.org/articles/10.3389/fimmu.2025.1600863/full#supplementary-material
Supplementary Figure 1 | The percentages of patients with different ages (A), tumor stages (B), sexes (C), EGFR alteration status (D), ALK-EML4 fusion status (E), KRAS alteration status (F) and smoking history (G) in the low- and high-risk score groups.
Supplementary Figure 2 | Box plots showing the risk scores of patients with different ages (A), tumor stages (B), sexes (C), EGFR alteration status (D), smoking history (E) and KRAS alteration status (F).
Supplementary Figure 3 | Quality control of the scRNA-seq data. (A–F) Correlation analysis between nFeature_RNA and nCount_RNA (A), percent.mito and nCount_RNA (B), percent.HB and nCount_RNA (C), percent.mito and nFeature_RNA (D), percent.HB and nFeature_RNA (E), percent.HB and percent.mito (F). The correlation coefficients were marked on the top of each panal. (G–J) The nFeature_RNA (G), nCount_RNA (H), percent.mito (I) and percent.HB (J) in different LUAD samples. The abscissa axes show the names of LUAD samples, whilst the ordinate axes show the numbers or percentages of each items.
Supplementary Figure 4 | Annotation of the cell types in the scRNA-seq data. (A) ElbowPlot of the PCA. (B) PCA of the scRNA-seq data. (C) The distribution of cells before the removal of the batch effect. (D) The distribution of cells after the removal of the batch effect. (E) The TSNE plot showing the distribution of the cell types annotated in the harmony analysis. Different colors represent different cell types. The names of the cell types are annotated on the right of the plot. (F) The percent bar chart showing the proportions of different types of cells in the LUAD tissues. The abscissa axes show the names of LUAD samples, whilst the ordinate axes show the percentage weight of each cell. The figure note is marked on the right.
Supplementary Figure 5 | Functional enrichment analysis for the marker genes of FBXO2+ (A1–A4), HMGB2+ (B1–B4) and IFI27+ (C1–C4) malignant tumor cells.
Supplementary Figure 6 | GSEA of the DEGs between the low- and high-CellScore groups. (A) Pathways that are activated in different risk score groups according to KEGG enrichment analysis of the scRNA-seq data. (B) Pathways that are activated in different risk score groups according to the results of the GO-BP enrichment analysis of the scRNA-seq data. The abscissa axis represents the list of genes ranked according to their expression levels in the two groups. The vertical axis represents the running enrichment score. Curves of different colors represent different pathways.
Supplementary Figure 7 | Cellular communication analysis for the high- and low-CellScore groups. (A) The number of receptor–ligand pairs between different cell populations. The sizes of the dots represent the number of corresponding cells. The thickness of the lines indicates the number of receptors and ligands between different cell populations. The color of the connecting line was the same as the color of the signal emitter. (B) Statistical dot plot of the dominant signaling pathways. The colors of the dots indicate different cell populations. The sizes of the dots are proportional to the number of ligands and receptors inferred from each cell population, and the x- and y-axes indicate the strengths of the cell populations as signal senders and receivers, respectively. (C) Statistical heatmap of the signaling dominant of the significant pathways. The abscissa axis indicates the cell, and the vertical axis indicates the names of the signaling pathways. (D) Dot plot of the signaling dominant of the significant pathways. The abscissa axis indicates the names of the signaling pathways, and the vertical axis indicates the cell names. (E) Tumor cells in the high-CellScore group had stronger cellular communication with myeloid cells in the CSF signaling pathway network. (F) Tumor cells in the high-CellScore group had stronger cellular communication with mast cells in the KIT signaling pathway network.
Supplementary Table 1 | Differential expression analysis of genes between LUAD and adjacent normal tissues.
Supplementary Table 2 | The intersecting genes of the DEGs between LUAD and adjacent normal tissues and between lung TRM cell-related genes.
Supplementary Table 3 | The 62 prognostic genes identified in the univariate Cox regression analysis.
Supplementary Table 4 | KEGG GSEA and GO-BP GSEA enrichment analysis of the DEGs between the low- and high-risk score groups in the bulk RNA-seq data.
Supplementary Table 5 | The marker genes of each subtype of malignant cells.
Supplementary Table 6 | KEGG GSEA and GO-BP GSEA enrichment analysis of the DEGs between the low- and high-risk score groups in the scRNA-seq data.
Supplementary Table 7 | Correlation analysis between the risk score and the log2(IC50) values of the drugs.
References
1. Yuan R, Yu J, Jiao Z, Li J, Wu F, Yan R, et al. The roles of tissue-resident memory T cells in lung diseases. Front Immunol. (2021) 12:710375. doi: 10.3389/fimmu.2021.710375
2. Mueller SN and Mackay LK. Tissue-resident memory T cells: local specialists in immune defense. Nat Rev Immunol. (2016) 16:79–89. doi: 10.1038/nri.2015.3
3. Clark RA. Resident memory T cells in human health and disease. Sci Transl Med. (2015) 7:269rv1. doi: 10.1126/scitranslmed.3010641
4. Schenkel JM and Masopust D. Tissue-resident memory T cells. Immunity. (2014) 41:886–97. doi: 10.1016/j.immuni.2014.12.007
5. Snyder ME and Farber DL. Human lung tissue resident memory T cells in health and disease. Curr Opin Immunol. (2019) 59:101–8. doi: 10.1016/j.coi.2019.05.011
6. Byrne A, Savas P, Sant S, Li R, Virassamy B, Luen SJ, et al. Tissue-resident memory T cells in breast cancer control and immunotherapy responses. Nat Rev Clin Oncol. (2020) 17:341–8. doi: 10.1038/s41571-020-0333-y
7. Noble A, Pring ET, Durant L, Man R, Dilke SM, Hoyles L, et al. Altered immunity to microbiota, B-cell activation and depleted γδ/resident memory T cells in colorectal cancer. Cancer Immunol Immunother. (2022) 71:2619–29. doi: 10.1007/s00262-021-03135-8
8. Webb JR, Milne K, Watson P, Deleeuw RJ, and Nelson BH. Tumor-infiltrating lymphocytes expressing the tissue resident memory marker CD103 are associated with increased survival in high-grade serous ovarian cancer. Clin Cancer Res. (2014) 20:434–44. doi: 10.1158/1078-0432.CCR-13-1877
9. Edwards J, Wilmott JS, Madore J, Gide TN, Quek C, Tasker A, et al. CD103+ Tumor-resident CD8+ T cells are associated with improved survival in immunotherapy-naïve melanoma patients and expand significantly during anti-PD-1 treatment. Clin Cancer Res. (2018) 24:3036–45. doi: 10.1158/1078-0432.CCR-17-2257
10. Amsen D, van Gisbergen KPJM, Hombrink P, and van Lier RAW. Tissue-resident memory T cells at the center of immunity to solid tumors. Nat Immunol. (2018) 19:538–46. doi: 10.1038/s41590-018-0114-2
11. Poon MML, Caron DP, Wang Z, Wells SB, Chen D, Meng W, et al. Tissue adaptation and clonal segregation of human memory T cells in barrier sites. Nat Immunol. (2023) 24:309–19. doi: 10.1038/s41590-022-01395-9
12. Siegel RL, Miller KD, Wagle NS, and Jemal A. Cancer statistics, 2023. CA Cancer J Clin. (2023) 73:17–48. doi: 10.3322/caac.21763
13. Karasaki T, Moore DA, Veeriah S, Naceur-Lombardelli C, Toncheva A, Magno N, et al. Evolutionary characterization of lung adenocarcinoma morphology in TRACERx. Nat Med. (2023) 29:833–45. doi: 10.1038/s41591-023-02230-w
14. Gillette MA, Satpathy S, Cao S, Dhanasekaran SM, Vasaikar SV, Krug K, et al. Proteogenomic characterization reveals therapeutic vulnerabilities in lung adenocarcinoma. Cell. (2020) 182:200–25. doi: 10.1016/j.cell.2020.06.013
15. Sorin M, Rezanejad M, Karimi E, Fiset B, Desharnais L, Perus LJM, et al. Single-cell spatial landscapes of the lung tumor immune microenvironment. Nature. (2023) 614:548–54. doi: 10.1038/s41586-022-05672-3
16. Djenidi F, Adam J, Goubar A, Durgeau A, Meurice G, de Montpréville V, et al. CD8+CD103+ tumor-infiltrating lymphocytes are tumor-specific tissue-resident memory T cells and a prognostic factor for survival in lung cancer patients. J Immunol. (2015) 194:3475–86. doi: 10.4049/jimmunol.1402711
17. Ganesan AP, Clarke J, Wood O, Garrido-Martin EM, Chee SJ, Mellows T, et al. Tissue-resident memory features are linked to the magnitude of cytotoxic T-cell responses in human lung cancer. Nat Immunol. (2017) 18:940–50. doi: 10.1038/ni.3775
18. Oja AE, Piet B, van der Zwan D, Blaauwgeers H, Mensink M, de Kivit S, et al. Functional heterogeneity of CD4+ Tumor-infiltrating lymphocytes with a resident memory phenotype in NSCLC. Front Immunol. (2018) 9:2654. doi: 10.3389/fimmu.2018.02654
19. Clarke J, Panwar B, Madrigal A, Singh D, Gujar R, Wood O, et al. Single-cell transcriptomic analysis of tissue-resident memory T cells in human lung cancer. J Exp Med. (2019) 216:2128–49. doi: 10.1084/jem.20190249
20. Weeden CE, Gayevskiy V, Marceaux C, Batey D, Tan T, Yokote K, et al. Early immune pressure initiated by tissue-resident memory T cells sculpts tumor evolution in non-small cell lung cancer. Cancer Cell. (2023) 41:837–52. doi: 10.1016/j.ccell.2023.03.019
21. Charoentong P, Finotello F, Angelova M, Mayer C, Efremova M, Rieder D, et al. Pancancer immunogenomic analyses reveal genotype-immunophenotype relationships and predictors of response to checkpoint blockade. Cell Rep. (2017) 18:248–62. doi: 10.1016/j.celrep.2016.12.019
22. Xu JY, Zhang C, Wang X, Zhai L, Ma Y, Mao Y, et al. Integrative proteomic characterization of human lung adenocarcinoma. Cell. (2020) 182:245–61. doi: 10.1016/j.cell.2020.05.043
23. Li H, van der Leun AM, Yofe I, Lubling Y, Gelbard-Solodkin D, van Akkooi ACJ, et al. Dysfunctional CD8 T cells form a proliferative, dynamically regulated compartment within human melanoma. Cell. (2019) 176:775–89. doi: 10.1016/j.cell.2018.11.043
24. Liu W, You W, Lan Z, Ren Y, Gao S, Li S, et al. An immune cell map of human lung adenocarcinoma development reveals an anti-tumoral role of the Tfh-dependent tertiary lymphoid structure. Cell Rep Med. (2024) 5:101448. doi: 10.1016/j.xcrm.2024.101448
25. Barboy O, Bercovich A, Li H, Eyal-Lubling Y, Yalin A, Shapir Itai Y, et al. Modeling T cell temporal response to cancer immunotherapy rationalizes development of combinatorial treatment protocols. Nat Cancer. (2024) 5:742–59. doi: 10.1038/s43018-024-00734-z
26. Wang S, Wang R, Hu D, Zhang C, Cao P, and Huang J. Machine learning reveals diverse cell death patterns in lung adenocarcinoma prognosis and therapy. NPJ Precis Oncol. (2024) 8:49. doi: 10.1038/s41698-024-00538-5
27. Zheng P, Mao Z, Luo M, Zhou L, Wang L, Liu H, et al. Comprehensive bioinformatics analysis of the solute carrier family and preliminary exploration of SLC25A29 in lung adenocarcinoma. Cancer Cell Int. (2023) 23:222. doi: 10.1186/s12935-023-03082-7
28. Wang Y, Tan H, Yu T, Chen X, Jing F, and Shi H. Potential immune biomarker candidates and immune subtypes of lung adenocarcinoma for developing mRNA vaccines. Front Immunol. (2021) 12:755401. doi: 10.3389/fimmu.2021.755401
29. Wan S, Liu Z, Chen Y, Mai Z, Jiang M, Di Q, et al. MicroRNA-140-3p represses the proliferation, migration, invasion and angiogenesis of lung adenocarcinoma cells by targeting TYMS (thymidylate synthetase). Bioengineered. (2021) 12:11959–77. doi: 10.1080/21655979.2021.2009422
30. Fan T, Li S, Xiao C, Tian H, Zheng Y, Liu Y, et al. CCL20 promotes lung adenocarcinoma progression by driving epithelial–mesenchymal transition. Int J Biol Sci. (2022) 18:4275–88. doi: 10.7150/ijbs.73275
31. Li L, Peng M, Xue W, Fan Z, Wang T, Lian J, et al. Integrated analysis of dysregulated long noncoding RNAs/microRNAs/mRNAs in metastasis of lung adenocarcinoma. J Transl Med. (2018) 16:372. doi: 10.1186/s12967-018-1732-z
32. Fan Q, Lu Q, Wang G, Zhu W, Teng L, Chen W, et al. Optimizing component formula suppresses lung cancer by blocking DTL-mediated PDCD4 ubiquitination to regulate the MAPK/JNK pathway. J Ethnopharmacol. (2022) 299:115546. doi: 10.1016/j.jep.2022.115546
33. Shu J, Jiang J, and Zhao G. Identification of novel gene signature for lung adenocarcinoma by machine learning to predict immunotherapy and prognosis. Front Immunol. (2023) 14:1177847. doi: 10.3389/fimmu.2023.1177847
34. Ren Q, Zhang P, Lin H, Feng Y, Chi H, Zhang X, et al. A novel signature predicts prognosis and immunotherapy in lung adenocarcinoma based on cancer-associated fibroblasts. Front Immunol. (2023) 14:1201573. doi: 10.3389/fimmu.2023.1201573
35. Lv J, Wang L, Shen H, and Wang X. Regulatory roles of OASL in lung cancer cell sensitivity to Actinidia chinensis Planch root extract (acRoots). Cell Biol Toxicol. (2018) 34:207–18. doi: 10.1007/s10565-018-9422-4
36. Li K, Quan L, Huang F, Li Y, and Shen Z. ADAM12 promotes the resistance of lung adenocarcinoma cells to EGFR-TKI and regulates the immune microenvironment by activating PI3K/Akt/mTOR and RAS signaling pathways. Int Immunopharmacol. (2023) 122:110580. doi: 10.1016/j.intimp.2023.110580
37. He W, Ju D, Jie Z, Zhang A, Xing X, and Yang Q. Aberrant CpG-methylation affects genes expression predicting survival in lung adenocarcinoma. Cancer Med. (2018) 7:5716–26. doi: 10.1002/cam4.1834
38. Wu Z, Zhou J, Xiao Y, Ming J, Zhou J, Dong F, et al. CD20+CD22+ADAM28+ B cells in tertiary lymphoid structures promote immunotherapy response. Front Immunol. (2022) 13:865596. doi: 10.3389/fimmu.2022.865596
39. Li Z, Lin X, Yang Y, Tian M, Zhang L, Huang F, et al. EXO1 is a key gene for lung-resident memory T cells and has diagnostic and predictive values for lung adenocarcinoma. Sci Rep. (2025) 15:4002. doi: 10.1038/s41598-025-88126-w
40. Downs-Canner SM, Meier J, Vincent BG, and Serody JS. B-cell function in the tumor microenvironment. Annu Rev Immunol. (2022) 40:169–93. doi: 10.1146/annurev-immunol-101220-015603
41. van der Leun AM, Thommen DS, and Schumacher TN. CD8+ T-cell states in human cancer: insights from single-cell analysis. Nat Rev Cancer. (2020) 20:218–32. doi: 10.1038/s41568-019-0235-4
42. Wang T, Shen Y, Luyten S, Yang Y, and Jiang X. Tissue-resident memory CD8+ T cells in cancer immunology and immunotherapy. Pharmacol Res. (2020) 159:104876. doi: 10.1016/j.phrs.2020.104876
43. Maynard A, McCoach CE, Rotow JK, Harris L, Haderk F, Kerr DL, et al. Therapy-induced evolution of human lung cancer revealed by single-cell RNA sequencing. Cell. (2020) 182:1232–51. doi: 10.1016/j.cell.2020.07.017
44. Leader AM, Grout JA, Maier BB, Nabet BY, Park MD, Tabachnikova A, et al. Single-cell analysis of human non-small cell lung cancer lesions refines tumor classification and patient stratification. Cancer Cell. (2021) 39:1594–609. doi: 10.1016/j.ccell.2021.10.009
45. Salcher S, Sturm G, Horvath L, Untergasser G, Kuempers C, Fotakis G, et al. High-resolution single-cell atlas reveals diversity and plasticity of tissue-resident neutrophils in non-small cell lung cancer. Cancer Cell. (2022) 40:1503–20. doi: 10.1016/j.ccell.2022.10.008
46. Buehler M, Yi X, Ge W, Blattmann P, Rushing E, Reifenberger G, et al. Quantitative proteomic landscapes of primary and recurrent glioblastoma reveal a protumorigeneic role for FBXO2-dependent glioma-microenvironment interactions. Neuro Oncol. (2023) 25:290–302. doi: 10.1093/neuonc/noac169
47. Ji J, Shen J, Xu Y, Xie M, Qian Q, Qiu T, et al. FBXO2 targets glycosylated SUN2 for ubiquitination and degradation to promote ovarian cancer development. Cell Death Dis. (2022) 13:442. doi: 10.1038/s41419-022-04892-9
48. Che X, Jian F, Wang Y, Zhang J, Shen J, Cheng Q, et al. FBXO2 promotes proliferation of endometrial cancer by ubiquitin-mediated degradation of FBN1 in the regulation of the cell cycle and the autophagy pathway. Front Cell Dev Biol. (2020) 8:843. doi: 10.3389/fcell.2020.00843
49. Cui G, Cai F, Ding Z, and Gao L. HMGB2 promotes the Malignancy of human gastric cancer and indicates poor survival outcome. Hum Pathol. (2019) 84:133–41. doi: 10.1016/j.humpath.2018.09.017
50. Liu W and Cheng J. LINC00974 sponges miR-33a to facilitate cell proliferation, invasion, and EMT of ovarian cancer through HMGB2 upregulation. Genet Mol Biol. (2022) 45:e20210224. doi: 10.1590/1678-4685-GMB-2021-0224
51. Zhang Y, Chen C, Liu Z, Guo H, Lu W, Hu W, et al. PABPC1-induced stabilization of IFI27 mRNA promotes angiogenesis and Malignant progression in esophageal squamous cell carcinoma through exosomal miRNA-21-5p. J Exp Clin Cancer Res. (2022) 41:111. doi: 10.1186/s13046-022-02339-9
52. Zhang F, Ye J, Guo W, Zhang F, Wang L, and Han A. TYMS-TM4SF4 axis promotes the progression of colorectal cancer by EMT and upregulating stem cell marker. Am J Cancer Res. (2022) 12:1009–26.
53. Fu Z, Jiao Y, Li Y, Ji B, Jia B, and Liu B. TYMS presents a novel biomarker for diagnosis and prognosis in patients with pancreatic cancer. Med (Baltimore). (2019) 98:e18487. doi: 10.1097/MD.0000000000018487
54. Guijarro MV, Nawab A, Dib P, Burkett S, Luo X, Feely M, et al. TYMS promotes genomic instability and tumor progression in Ink4a/Arf null background. Oncogene. (2023) 42:1926–39. doi: 10.1038/s41388-023-02694-7
55. Xiong K, Pan B, Fang H, and Tao Z. Single-cell sequencing analysis reveals cancer-associated pericyte subgroup in esophageal squamous cell carcinoma to predict prognosis. Front Immunol. (2025) 15:1474673. doi: 10.3389/fimmu.2024.1474673
56. Ye Z, Du Y, Yu W, Lin Y, Zhang L, and Chen X. Construction of a circadian rhythm-relevant gene signature for hepatocellular carcinoma prognosis, immunotherapy and chemosensitivity prediction. Heliyon. (2024) 10:e33682. doi: 10.1016/j.heliyon.2024.e33682
57. Xu F, Ye ML, Zhang YP, Li WJ, Li MT, Wang HZ, et al. MicroRNA-375-3p enhances chemosensitivity to 5-fluorouracil by targeting thymidylate synthase in colorectal cancer. Cancer Sci. (2020) 111:1528–41. doi: 10.1111/cas.14356
58. An M, Mehta A, Min BH, Heo YJ, Wright SJ, Parikh M, et al. Early immune remodeling steers clinical response to first-line chemoimmunotherapy in advanced gastric cancer. Cancer Discov. (2024) 14:766–85. doi: 10.1158/2159-8290.CD-23-0857
Keywords: TRM cells, LUAD, prognostic signature, immunotherapeutic outcomes, TYMS
Citation: Li Z, Tian M, Yang Y, Wang Y, Zhang L, Huang F, Wen X, Yin X, Lin X and Tian Y (2025) Revealing the significance of tissue-resident memory T cells in lung adenocarcinoma through bioinformatic analysis and experimental validation. Front. Immunol. 16:1600863. doi: 10.3389/fimmu.2025.1600863
Received: 27 March 2025; Accepted: 12 June 2025;
Published: 26 June 2025.
Edited by:
Anand Rotte, Arcellx Inc, United StatesReviewed by:
Hanjie Li, Chinese Academy of Sciences (CAS), ChinaChao Yang, St. Jude Children’s Research Hospital, United States
Copyright © 2025 Li, Tian, Yang, Wang, Zhang, Huang, Wen, Yin, Lin and Tian. This is an open-access article distributed under the terms of the Creative Commons Attribution License (CC BY). The use, distribution or reproduction in other forums is permitted, provided the original author(s) and the copyright owner(s) are credited and that the original publication in this journal is cited, in accordance with accepted academic practice. No use, distribution or reproduction is permitted which does not comply with these terms.
*Correspondence: Xiaoyan Lin, bGlueGlhb3lhbnlhbkAxNjMuY29t; Yuan Tian, dHl0eXRpYW55dWFuQGFsaXl1bi5jb20=
†These authors have contributed equally to this work