 Sudheendra Hebbar Subramanyam1
 Judit Turyne Hriczko1Saskia Schulz1Thomas Look2,3Tannaz Goodarzi1
 Tim Clarner4Miriam Scheld4
 Markus Kipp5
 Eva Verjans1Svenja Böll1
 Christopher Neullens1
 Ivan Costa6Zhijian Li6Lin Gan7
 Bernd Denecke7§
 Angela Schippers1
 Stefan Floess8
 Jochen Huehn8
 Edgar Schmitt9
 Tobias Bopp9
 Hermann Wasmuth10Ron Winograd10
 Rudi Beyaert11,12
 Bart Lambrecht11,13
 Martin Zenke2,3,14,15†
 Norbert Wagner1
 Kim Ohl1‡
 Klaus Tenbrock1,16*‡
- 1Department of Pediatrics, Rheinisch-Westfälische Technische Hochschule Aachen University Hospital, Aachen, Germany
- 2Helmholtz-Institute for Biomedical Engineering, Rheinisch-Westfälische Technische Hochschule Aachen University, Aachen, Germany
- 3Institute for Biomedical Engineering, Department of Cell Biology, Rheinisch-Westfälische Technische Hochschule Aachen University Hospital, Aachen, Germany
- 4Institute of Neuroanatomy and Jülich Aachen Research Alliance (JARA)-BRAIN, Faculty of Medicine, Rheinisch-Westfälische Technische Hochschule Aachen University, Aachen, Germany
- 5Institute of Anatomy, Medical University of Rostock, Rostock, Germany
- 6Instutute for Computational Genomics, Interdisciplinary Center for Clinical Research Aachen (IZKF Aachen), Rheinisch-Westfälische Technische Hochschule Aachen University Hospital, Aachen, Germany
- 7Genomics Facility, Interdisciplinary Center for Clinical Research Aachen (IZKF Aachen), Rheinisch-Westfälische Technische Hochschule Aachen University Hospital, Aachen, Germany
- 8Department of Experimental Immunology, Helmholtz Centre for Infection Research, Braunschweig, Germany
- 9Institute for Immunology, University Medical Center, Johannes Gutenberg University Mainz, Mainz, Germany
- 10Department of Medicine, Luiusenhospital Aachen, Aachen, Germany
- 11Vlaams Instituut voor Biotechnologie (VIB) Center for Inflammation Research, Ghent, Belgium
- 12Department of Biomedical Molecular Biology, Ghent University, Ghent, Belgium
- 13Department of Respiratory Medicine, Ghent University Hospital, Ghent, Belgium
- 14Department of Medicine IV, Hematology, Oncology, and Stem Cell Transplantation, Rheinisch-Westfälische Technische Hochschule Aachen University Hospital, Aachen, Germany
- 15Center for Integrated Oncology Aachen Bonn Cologne Duesseldorf (CIO ABCD), Aachen, Germany
- 16Division of Pediatric Rheumatology, Department of Pediatrics, Inselspital, Bern University Hospital, University of Bern, Bern, Switzerland
Introduction: Regulatory T-cells (Tregs) are characterized by the expression of Foxp3, a master regulator involved in the development and function of Tregs. Foxp3 expression is dependent on activity of the Treg specific demethylated site (TSDR), which contains a CREB binding site. We aimed to find out how Foxp3 specific CREB deletion affects Treg expression and function.
Methods: Tregs from Foxp3creCREBfl/fl mice and wild type (CREBfl/fl) mice were analyzed by flow cytometry. Cytokine analysis was performed by flow cytometry, ELISA and RT-qPCR. Gene expression analysis was performed using Affymetrix HTA2 assays, ATAC-sequencing, and Methylation-assays. For functional relevance, a CD4 T cell mediated transfer colitis was performed.
Results and discussion: Foxp3creCREBfl/fl mice showed increased frequencies of Tregs (CD25+/Foxp3+) in thymus, spleen and peripheral lymph nodes and in nonlymphoid organs including lung and colon, but decreased Foxp3 expression at the single cell level. Despite decreased Foxp3 expression, enhanced expression of the IL- 33 receptor (ST-2), IL-10, IL-13, and CREM was observed. CREB deficient Tregs were highly suppressive in vitro and prevented disease activity in a CD4 T cell mediated transfer colitis in an IL-10 dependent way. Mechanistically CREB fulfils dual roles in Tregs: (1) it promotes Foxp3 expression under Steady state conditions and (2) in cooperation with CREM, CREB restricts chromatin accessibility at the ST2 locus, thereby modulating IL-33 driven immune responses. This dual regulation balances FoxP3-dependent Treg stability with IL-10 mediated suppression of inflammation.
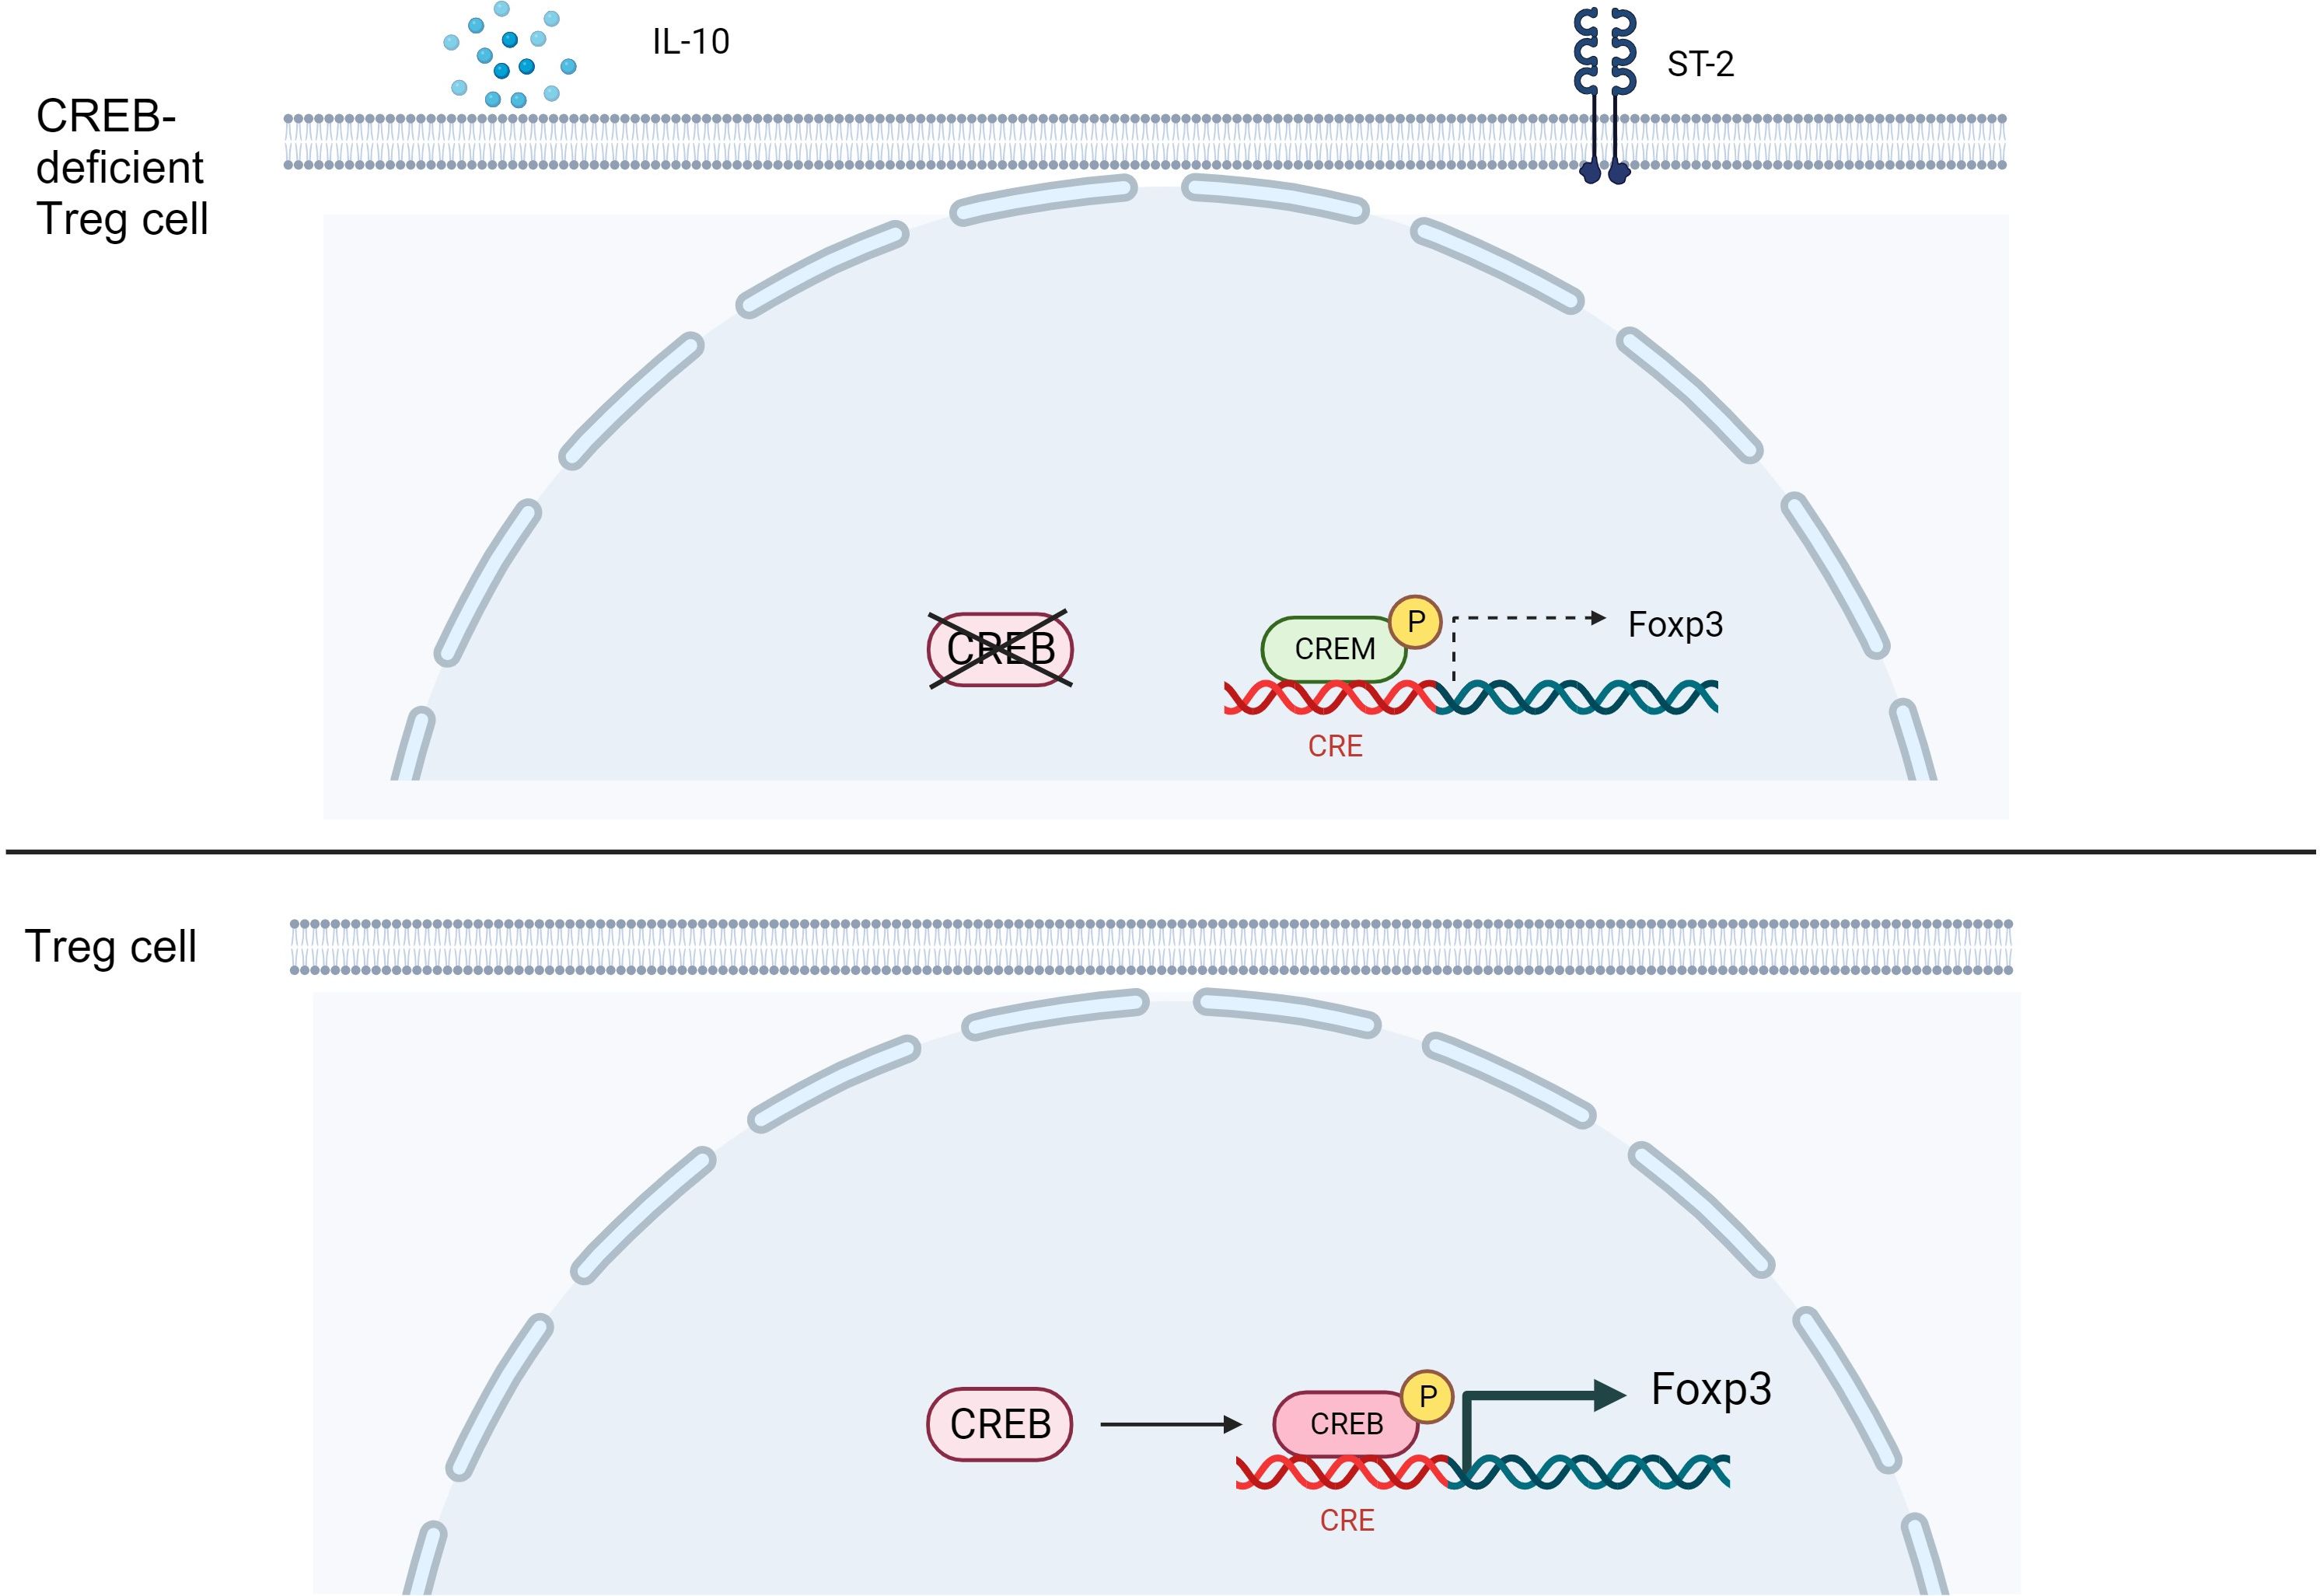
Graphical Abstract.
1 Introduction
Regulatory T cells (Tregs) marked by Foxp3 expression are important for immune balance. In the absence of Foxp3, mice (scurfy disease) (1) and humans (IPEX, polyglandular autoimmunopathy) develop severe autoimmune disease (2). Foxp3 Tregs arise from two sources; thymus-derived Tregs (t-Tregs) develop in the thymus, while inducible Tregs (iTregs) are generated in the periphery from conventional CD4+ T cells upon TGF-β stimulation (3). Both tTreg and iTreg generation largely depend on the presence of IL-2, which is not only required for homeostatic maintenance but also for the thymic development of Tregs (4–7).
ST-2, also known as IL1RL1, belongs to the Toll-like receptor/IL-1 receptor superfamily. ST-2, through its ligand IL-33, plays a pivotal role in MyD88/NFκB signaling. The interaction of ST-2 with its ligand IL-33 induces Foxp3 and GATA3 expression in Tregs at mucosal sites (8). ST-2 mainly exists in two isoforms: soluble ST-2 (sST-2) and membrane-bound ST-2. sST-2 functions as a decoy receptor of IL-33 and inhibits NFκB signaling, while membrane-bound ST-2 promotes NFκB signaling (9). Increased ST-2 levels have been observed in diseases such as inflammatory bowel disease (IBD), asthma, colon cancers, and graft versus host disease (10). In many non-lymphoid tissues, Tregs show enriched expression of ST-2 and most of these are iTregs. The regulation of ST-2+Tregs is dependent on the transcription factor basic leucine zipper transcription factor ATF-like (BATF) (11, 12), while other factors have not yet been defined. BATF belongs to the cAMP-responsive element binding protein/activating transcription factor (CREB/ATF) family of transcription factors, can dimerize with Jun, and has been shown to compete with CREB for binding to CRE/AP1 sites.
Our understanding of the molecular mechanism of suppression is still limited. IL-10 plays an important role in suppressing CD4+ effector T-cell function. Additionally, IL-10 prevents activation of antigen-presenting cells (APCs), such as dendritic cells and macrophages, through the downregulation of costimulatory molecules and production of inflammatory cytokines within these cells (13). Selective ablation of IL-10 in Foxp3+ Tregs revealed that IL-10 production by Tregs is essential for keeping the immune response in check at environmental interfaces such as the colon and lungs (14). IL-10 also acts in an autocrine manner by maintaining FoxP3 expression and the suppressive capacity of Tregs (15, 16). Interestingly, IL-10 is responsive to cAMP stimulation, at least in THP1 cells and macrophages, and the IL-10 promoter contains four putative cAMP response element sites (CRE, TGACGTCA), which are conserved between humans and mice (17). Following TLR activation, pCREB (phosphorylated CREB) is recruited to the IL-10 promoter and enhances IL-10 transcription in macrophages (18).
Previous data from Wang et al. (19) suggested that CREB negatively regulated the survival of iTregs and is particularly important in the generation of CD4+Th17 cells. Using CD4CRE CREBfl/fl mice, they showed that these cells prevented colitis in a Rag2-/- model; however, their model had the disadvantage that the CD4 cells of these mice expressed lower amounts of IL-2, which could have hampered iTreg induction. Our analysis now expands upon their findings and determines an important role for CREB in the generation of ST2+Tregs. Using Foxp3CRECREBfl/fl mice, we herein confirm the colitis phenotype but can show that i) CREB deficiency in Tregs induces expression of ST2+Tregs, ii) the phenotype that prevents colitis in Rag2-/- mice is primarily dependent on abundance of IL-10, and iii) this phenotype can be reversed by knockout of CREM, which lowers the expression of ST2.
2 Materials and methods
2.1 Mouse strains
Experiments were performed with age-matched CREBfl/fl, VAVcreCREBfl/fl, and Foxp3creCREBfl/fl mice (all C57BL/6). Foxp3creCREBfl/fl mice were generated by crossing CREB-flox mice (20) with C57BL/6 Foxp3-IRES Cre mice (provided by T. Bopp, University of Mainz, Germany). Foxp3cre-CREBfl/fl mice were used as controls (denoted as CREBfl/fl). Foxp3CreROSARFP mice were provided by T. Bopp University of Mainz and crossed with our CREBfl/fl mice. Rag2-/- (C57BL/6) mice were provided by A. Schippers (Uniklinik RWTH Aachen, Germany). All the mice were bred in our animal facility and kept under standardized conditions.
2.2 Transfer colitis
To induce transfer colitis, Rag2-/- mice were adoptively transferred 2 x 10⁶ CD4+ CD25- T cells. Animals were sacrificed as soon as a significant loss of weight was measurable. The spleen and mesenteric lymph nodes (mLNs) were harvested for further analysis. One part of the colon was fixed in formalin for histological scoring and the other part was fixed in RNAlater (Qiagen, Germany) for subsequent mRNA analysis. For soluble ST2 (sST2) treatment, the mice received 100 µg mouse sST2 (produced by the VIB Protein Core facility, Belgium, and provided by R. Beyaert, VIB-UGent Center for Inflammation Research, Belgium), three times/week by intraperitoneal means (i.p). The control group received PBS i.p. For IL-10R treatment, the mice received 500 µg anti-IL-10R antibody (1B1mAB) (kindly provided by Prof. Edgar Schmitt, University of Mainz, Germany) or IgG control AK (Rat IgG kappa) i.p. once a week during the first 3 weeks.
2.3 Histological scoring
Initially, 4 µm paraffin sections from the fixed colon were cut serially, mounted onto glass slides, and deparaffinized. The colon sections were stained with hematoxylin and eosin by the Core Facility (IZKF) of the RWTH Aachen University. Blinded histological scoring was performed using a standard microscope, based on the JLS method as described previously (21, 22). Each colon section was scored for the four general criteria: severity, degree of hyperplasia, degree of ulceration, if present, and percentage of area involved. A subjective range of 1–3 (1 = mild, 2 = moderate, 3 = severe) was used for the first three categories. Severity: Focally small or widely separated multifocal areas of inflammation limited to the lamina propria were graded as mild lesions (1). Multifocal or locally extensive areas of inflammation extending to the submucosa were graded as moderate lesions (2). If the inflammation extended to all layers of the intestinal wall or the entire intestinal epithelium was destroyed, lesions were graded as severe (3). Hyperplasia: Mild hyperplasia consisted of morphologically normal lining epithelium that was at least twice as thick (length of crypts) as adjacent or control mucosa. Moderate hyperplasia was characterized by the lining epithelium being two or three times the normal thickness, cells were hyperchromatic, numbers of goblet cells were decreased, and scattered individual crypts developed an arborizing pattern. Severe hyperplastic regions exhibited a markedly thickened epithelium (four or more times normal thickness), marked hyperchromasia of cells, few to no goblet cells, a high mitotic index of cells within the crypts, and numerous crypts with an arborizing pattern. Ulceration was graded as: 0 = no ulcer, 1 = 1–2 ulcers (involving up to a total of 20 crypts), 2 = 1–4 ulcers (involving a total of 20–40 crypts), and 3 = any ulcers exceeding the former in size. A 10% scale was used to estimate the area involved in the inflammatory process. 0 = 0%, 1 = 10%–30%, 2 = 40%–70%, 3 = >70%.
2.4 Cell isolation
Single cell suspensions were isolated from spleens and lymph nodes (LNs) [peripheral lymph nodes (pLNs) and mLNs] using cell strainers and erythrocytes were lysed with lysis buffer. To obtain immune cells from the lungs, tissue was excised into small pieces and digested with 0.1% collagenase in DPBS for 1hr. The digested fraction was passed through a 40μm nylon strainer and rinsed with DPBS. The flow through was centrifuged and the cell pellet was lysed using RBC lysis buffer. The cell pellet was used for the flow cytometric analysis. Colons were retrieved from the mice and rinsed with a cannula with PBS+0.5%BSA. Afterwards, the colons were excised into small pieces and placed in a digestive medium containing RPMI (10mL), collagenase V (0.85mg/mL), collagenase D (1.25mg/mL), dispase (1mg/mL) and DNase (30μg/mL) and incubated for 45 minutes at 37°C with gentle shaking. The digested fraction was passed through a 40 μm nylon strainer and the flow-through was collected and centrifuged to obtain a pellet. Percoll gradient centrifugation was performed by using 35% Percoll. The cell pellet obtained was lysed using RBC lysis buffer and was used for further analysis. The livers were retrieved from the mice. The gall bladders were removed and the livers were excised into small pieces and placed in a digestive medium containing RPMI without FCS (3mL), 1.25mg/mL collagenase D, and 30μg/mL DNase. The fraction was incubated for 45 minutes and digestion was stopped by adding PBS+0.5% BSA+2mM EDTA and homogenized using a syringe. The digested fraction was passed through a 100μm nylon strainer and the flow-through was centrifuged. The pellet obtained was used for the Percoll gradient centrifugation using 35% Percoll. The cell pellet obtained after the Percoll gradient centrifugation was lysed using RBC lysis buffer and was used for the flow cytometric analysis.
2.5 Suppression Assay
CD4 T-cells (Teffector cells) were isolated from the spleens of wild-type mice. The cells were labeled with eFluor 660 proliferation dye from Thermo Fischer according to the manufacturer’s instructions. After the labeling, the cells were stimulated with plate-coated anti-CD3 (10µg/mL, eBioscience, Germany) and soluble anti-CD28 (1µg/mL) (eBioscience) in the presence of CD4+CD25+ cells from either wild-type or Foxp3creCREBfl/fl mice in different ratios (1:0, 1:0.5, 1:0.75, and 1:1) for 3 days. After 3 days of stimulation, the cells were analyzed using flow cytometric analysis.
2.6 T cell differentiation assays
Magnetic Activated Cell Sorting (MACS)-isolated CD4+CD25- T cells (2x10⁶ per mL) were incubated with plate-coated anti-CD3 (10µg/mL, eBioscience, Germany) and soluble anti-CD28 (1µg/mL) (eBioscience, Germany). TH0 cells were left without exogenous cytokines, and 5 ng/mL TGF-β was added to induce Treg differentiation.
2.7 Flow cytometry
For surface staining, single cell suspensions were stained with anti-CD4, anti-CD3, anti-CD8, anti-B220, anti-CD25, CD45, anti-GL-7, anti-ICOS, anti-ST2, anti-Nrp1, and anti-PD-1 (all from eBioscience, Germany). For intracellular staining of CREB, Foxp3, CTLA-4, Helios, GATA3, T-bet, and RORγt, cells were fixed and permeabilized with a FOXP3 staining buffer set (Thermo Fischer, eBioscience, Germany) following the manufacturer’s instructions and stained with respective antibodies (eBioscience, Germany) for 30 min. Intracellular cytokines were stained with anti-IFN-γ-Alexa 647 (eBioscience, Germany) and anti-IL-17-Alexa 488 (BD, USA), and IL-10-APC (eBioscience, Germany) after PMA (30nM) and Ionomycin (1.5µM) (both Sigma-Aldrich, USA) re-stimulation in the presence of GolgiPlug/GolgiStop (BD Biosciences, USA). A daily calibrated FACS-Canto II flow cytometer (Becton Dickinson, MountainView, CA, USA) was used to perform the phenotypic analysis. Lymphocytes were gated by forward (FSC), side scatter (SSC), and CD3, CD4, and B220 expression. A figure exemplifying the gating strategies is provided in the Supplementary Materials (Supplementary Figure 6). For data analysis FCS-Express 4.0 Research Edition (DeNovo software Glendale, CA, USA) and FlowJo version 10 were used.
2.8 Luciferase assay
RLM cells carrying a stable pGL3-TSDR-FoxPro luciferase plasmid were kindly provided by Jochen Huehn (HZI Braunschweig, Germany). Cells were transfected with the pcDNA-CREB plasmid or pcDNA. Cells were left to rest overnight before luciferase activity was measured by using the Dual-Glo Luciferase Assay System (Promega, USA).
2.9 RNA isolation and real-time PCR
Total RNA from isolated T cells and colon tissue was isolated using the RNeasy Mini Kit (Qiagen, Germany). cDNA was then generated from 200 ng total RNA using the RevertAid H Minus First Strand cDNA Synthesis Kit (Thermo Fisher Scientific, USA) according to the manufacturer´s instructions. RT-PCR was performed using the SYBR Green PCR kit (Eurogentec, Germany) and data were acquired with the ABI Prism 7300 RT-PCR system (Applied Biosystems/Life Technologies, Germany). Each measurement was set up in duplicate. After normalization to the endogenous reference control gene ß-actin for mice, the relative expression was calculated.
2.10 RNA extraction and microarray for gene expression analysis
CD4+CD25+Nrp1+ Tregs were sorted by FACS. Genome-wide transcriptome analyses of FoxpcreCREBfl/fl and CREBfl/fl Tregs were performed in independent triplicate using Gene Chip® Mouse Gene 2.0 arrays (Affymetrix, Santa Clara, CA, USA). Total RNA extraction was carried out using the RNeasy Micro Kit (Qiagen, Germany) according to the manufacturer’s protocol and then quantified (Nanodrop). RNA quality was assessed using the RNA 6000 Nano Assay with the 2100 Bioanalyzer (Agilent, Santa Clara, CA, USA). Samples for the Gene 2.0 arrays were prepared and hybridized to the arrays according to the Affymetrix WT Plus Kit manual. Briefly, for each sample, 100 ng of total RNA was reverse-transcribed into cDNA using a random hexamer oligonucleotide tagged with a T7 promoter sequence. After second-strand synthesis, double-strand cDNA was used as a template for amplification with T7 RNA polymerase to obtain antisense cRNA. Random hexamers and dNTPs spiked out with dUTP were then used to reverse-transcribe the cRNA into single-stranded sense-strand cDNA. The cDNA was then fragmented with uracil DNA glycosylase and apurinic/apyrimidic endonuclease 1. The fragment size was checked using the 2100 Bioanalyzer and ranged from 50 to 200 bp. Fragmented sense cDNA was biotin-end-labeled with TdT and the probes were hybridized to the Gene 2.0 arrays at 45°C for 16h with 60 rpms. Hybridized arrays were washed and stained on a Fluidics Station 450 (program: FS450 0002) and scanned on a GeneChip® Scanner 3000 7G (both Affymetrix). Raw image data were analyzed with Affymetrix® Expression Console™ Software (Affymetrix, USA), and gene expression intensities were normalized and summarized with a robust multiarray average algorithm (23). Transcripts that were expressed differently more than 1.5-fold with a raw p-value lower than 0.05 between the sample groups were categorized as regulated. A enrichment analysis for Wiki pathways was performed using WebGestalt (24). For the enrichment analysis only, genes that changed at least 1.5-fold with a p-value lower than 0.05 between Foxp3creCREBfl/fl and CREBfl/fl samples were taken into consideration.
2.11 TSDR methylation analysis
For all the methylation analyses, cells from male mice were used. Genomic DNA was prepared from FACS-sorted Tconv cells (CD4+CD25-) and Treg cells (CD4+CD25+Nrp1+) from CREBfl/fl and Foxp3creCREBfl/fl mice and subsequently converted by bisulfite according to the manufacturer’s instructions (DNeasy Blood & Tissue Kit, Qiagen; EZ DNA Methylation-Lightning Kit, Zymo Research, USA). Pyrosequencing of the Treg cell-specific demethylated region (TSDR) (chromosome position X:7583950-7584149, genome assembly GRCm38.p6) was performed as described previously (25).
2.12 Transposase-accessible chromatin assay using sequencing
Omni-transposase-accessible chromatin assay using sequencing (ATAC-seq) was performed according to (26, 27) with minor modifications. Prior to transposition, dead cells were removed by centrifugation (800 rpm, 4 min, 4°C). The transposition reaction was conducted with 7.5 μL Tagment DNA Enzyme 1 (TDE1) for 60 min at 37°C. Pre-amplification was conducted with NEBNext Ultra II Q5 Master Mix and Nextera PCR Primers (5 cycles). Quantitative PCR amplification was conducted with NEBNext Ultra II Q5 Master Mix, Nextera PCR Primer, and SYBR Gold to determine the number of additional cycles. PCR amplification of additional cycles was the same as for pre-amplification. PCR fragments were purified with Qiagen MinElute PCR Purification Kit and library concentration and quality were determined using an Agilent High Sensitive DNA Kit and TapeStation, respectively. ATACseq libraries were sequenced on the Illumina NextSeq 500 Platform with 75 bps paired-end reads in duplicate. ATAC-seq libraries were trimmed with Trim Galore (parameters -q 30 –paired –trim1) and aligned to the mouse genome (mm9) using Bowtie2 (28) (parameters -X2000 –no-mixed –no-discordant). Duplicate fragments were removed, and reads were filtered for alignment quality of >Q30 using samtools (29). Next, we used MAC2 (30) to perform peak calling (parameters: nomodel, nolambda, keep-dup auto, call-summits). Transcription factor footprinting and differential activity was performed using HINT-ATAC as described in Li et al. (27).
2.13 ELISA
Total IgG and IgE were measured from sera using the Ready-Set-Go ELISA system (affymetrix: eBioscience, USA). IL-10 was determined in cell supernatants using mouse IL-10 ELISA Ready-SET-GO! (2nd Generation) (Thermo Fisher Scientific, USA), according to the manufacturer’s instructions.
2.14 Statistical analysis
All data are presented as mean ± standard error (SEM). Data were tested for normality using the Shapiro–Wilk normality test. Differences between two groups were evaluated using two-tailed unpaired or paired (if indicated) Student’s t-tests. A two-tailed Mann–Whitney test was used if data were not normally distributed. One-way ANOVA was performed if there are more than two groups. Measurements were taken from distinct samples. All statistical analysis and subsequent graphics generation were performed using GraphPad Prism versions 7.0 and 8.0 (GraphPad Software, USA). A p-value <0.05 was statistically significant.
2.15 Study approval
The animal study was approved by the regional government authorities and animal procedures were performed according to German legislation for animal protection. Permission for the projects was granted by the Regierungspräsident/LANUV Nordrhein-Westfalen (81-02.04. 2017.A393).
2.16 Data availability
The ATAC-Seq and microarray raw datasets have been deposited in GEO under the accession codes GSE157693 and GSE157933. All data that support the findings of this study are available within the article and the Supplementary Material. All other data, including raw data used in each figure, will be provided upon reasonable request to the corresponding author.
3 Results
3.1 CREB enhances Treg numbers but downregulates Foxp3 expression in Tregs
CREB is a transcriptional activator and has been found to critically stabilize Foxp3 expression (31). It is therefore widely accepted that CREB promotes FoxP3 expression in Tregs (32–34). To verify this hypothesis in vivo, we generated mice with a Foxp3-specific knockout of CREB (Foxp3creCREBfl/fl). To our surprise, these mice showed enhanced numbers of CD25+/Foxp3+ positive Tregs in the thymus (Figures 1A, D), spleen (Figures 1B, D), and pLN (Figures 1C, D). Splenic Tregs showed no altered expression of Nrp1, PD-1, CTLA4, and ICOS (Supplementary Figures 1A, B). There was also no convincing different expression of Th lineage transcription factors GATA3 and RORyT and T-bet in CD4+Foxp3+ cells within different organs (Supplementary Figures 2A–E). However, Foxp3creCREBfl/fl mice displayed lower Foxp3 expression in Tregs on the single cell level (Figures 1E, F), which can be explained by the fact that CREB directly activates the TSDR (31) (Figure 1G). To verify Cre expression in the Foxp3-Cre mice, we crossed Foxp3creCREBfl/fl mice with Cre-inducible reporter mice (ROSARFP) and examined reporter gene expression in lymphocytes. RFP expression was confined to CD4+CD25+ cells, which is important for excluding cell extrinsic side-effects (Figures 1H, I).

Figure 1. Genetic deletion of CREB in Foxp3+ cells increases the percentage of Tregs but downregulates their Foxp3 expression. (A) Statistical analysis of splenic Treg (CD4+CD25+Foxp3+) percentages from CREBfl/fl and Foxp3creCREBfl/fl mice (N = 9, four independently performed experiments, each with 2–3 age and sex-matched mice that were 6–9 weeks old). (B) Statistical analysis of Treg percentages within the thymuses (CD3+CD4spCD25+Foxp3+) of CREBfl/fl and Foxp3creCREBfl/f l mice (N = 7, three independently performed experiments, each with 2–3 age and sex-matched mice that were 6–9 weeks old). (C) Statistical analysis of Treg (CD4+CD25+Foxp3+) percentages from pLNs of CREBfl/fl and Foxp3CRECREBfl/fl mice (N =5, two independently performed experiments, each with 2–3 age and sex-matched mice that were 7–9 weeks old). (D) Density plot showing CD25+Foxp3+ cells gated on CD3+CD4+CD8- cells in the thymuses of CREBfl/fl and Foxp3creCREBfl/fl mice (left), CD25+Foxp3+ cells gated on CD4+ cells in the spleens of CREBfl/fl and Foxp3creCREBfl/fl mice (middle), and CD4+CD25+Foxp3+ cells in the pLNs from CREBfl/fl and Foxp3creCREBfl/fl mice (right). (E) Statistical analysis of mean fluorescent intensity (MFI) of Foxp3 in CREBfl/fl and Foxp3creCREBfl/fl CD4+CD25+ T cells (N=6, 3 independently performed experiments, each with two animals that were 6–8 weeks old and sex- and age-matched). (F) Representative histogram showing an overlay of Foxp3 expression in CD4+CD25+ cells from CREBfl/f l(black) and Foxp3creCREBfl/fl (grey) spleens. (G) RLM cells carrying a stable pGL3-TSDR-FoxPro luciferase plasmid were transfected either with an empty vector or CREB plasmid and stimulated with PMA, and luciferase activity was measured after 4 hours (N = 5). (H) Percentages of RFP+ cells within the CD4+ (on the left), CD19+ (in the middle), and CD8+ populations (on the right) in the spleens of Foxp3creROSARFP and Foxp3creCREBfl/flROSARFP mice. (I) Representative histogram showing the MFI of RFP expression in CD4+CD25- (black) and CD4+CD25+ cells (red) in the spleens of Foxp3creROSARFP and Foxp3creCREBfl/flROSARFP mice. (J) Percentage of RFP+ cells within the CD45+CD3+CD4+ population in the lungs and colons of Foxp3creROSARFP and Foxp3creCREBfl/flROSARFP mice. (K) Statistical analysis of CD45+CD3+CD4+RFP+ cells in the lung tissue of Foxp3CREROSARFP and Foxp3creCREBfl/flROSARFP mice (N=4, three independently performed experiments). (L) Statistical analysis of CD45+CD3+CD4+RFP+ cells in the colon tissue of Foxp3creROSARFP and Foxp3creCREBfl/flROSARFP mice (N=4, three independently performed experiments). Two-tailed, unpaired t-tests were used to test the significance. *p<0.05, **p<0.01, ***p<0.001, and ****p<0.0001 and the results are expressed as the mean ± SEM.
We further used Foxp3creCREBfl/fl ROSARFP mice to assess the percentages of Tregs in non-lymphoid organs. While we did not observe differences in liver tissue, we found a particularly marked upregulation of Treg percentages within the lungs and colons of Foxp3creCREBfl/fl ROSARFP mice compared to Foxp3creROSARFP mice (Figures 1J–L) and enhanced absolute numbers of Tregs in the colons of Foxp3creCREBfl/fl ROSARFP (Supplementary Figure 7B). This prompted us to analyze whether CREB expression in Tregs differs in different tissues. We could not find an association between high tissue-dependent CREB expression and the effects of CREB deficiency on Treg percentages; however, we found a high expression of CREB in murine colonic Tregs (Supplementary Figure 8).
3.2 CREB-deficient Tregs are suppressive in vitro
To test whether lower Foxp3 expression affects the suppressive capacity of CREB-deficient Tregs, we co-cultured CREBfl/fl Tregs and Foxp3creCREBfl/fl Tregs with anti-CD3 and anti-CD28 stimulated WT CD4+ cells. Surprisingly, Foxp3creCREBfl/fl Tregs revealed an increased capacity to reduce CD4+ T cell proliferation (Figures 2A, B). These data suggest that deletion of CREB, despite reducing Foxp3 expression per cell, enhances the function of Tregs. In addition, the expression of Helios was enhanced (Figure 2C) and bisulfite sequencing revealed a demethylated TSDR (Figure 2D), which suggests a stable and suppressive phenotype (35). In conclusion, despite the reduction of Foxp3 levels per cell, CREB deficiency leads to stable and functional Tregs in vitro.

Figure 2. In vitro suppressive capacity of Tregs is enhanced in the absence of CREB. (A) WT CD4+ T cells from the spleens (Teff) were labeled with eFluor 660 and stimulated with anti-CD3/CD28 antibodies for 3 days. CD4+CD25+ T cells (Tregs) from CREBfl/fl or Foxp3creCREBfl/fl animals were added in different ratios (1:0, 1:0.5, 1:0.75, and 1:1). The proliferation of responder T cells was assessed in a eFluor 660 (eBioscience) dilution (N = 3) using flow cytometry (B) Representative density plots of (A). (C) Statistical analysis of MFI of helios in CREBfl/fl and Foxp3creCREBfl/fl CD4+Foxp3+ T cells (N = 5, 2 independently performed experiments, each with 2–3 animals that were 8 weeks old and sex-matched; a two-tailed Mann–Whitney test was performed to test for significance). (D) Representative TSDR methylation patterns of purified CD4+CD25+Nrp1+ Treg cells and CD4+CD25− conventional T cells isolated from the spleens of 6–8-week-old male mice (N = 4). Amplicons are vertically arranged, each representing a single CpG motif. The methylation rate of each motif was translated into a yellow-green-blue color code. *p<0.05, and all the results are expressed as the mean ± SEM.
3.3 CREB-deficient Tregs reveal gene expression signature with enhanced expression of IL-10, IL-4, IL-13, and ST2
To understand why CREB-deficient Tregs are suppressive despite reduced Foxp3 expression, we performed a whole transcriptome analysis (Affymetrix HTA2 arrays) of flow-sorted (CD4+CD25+Nrp-1+) Foxp3creCREBfl/fl and CREBfl/fl Tregs (Supplementary Figure 3A) and appropriate wild-type mice because, at the time of this analysis, the Foxp3CRECREBfl/fl ROSARFP mice were not yet available. Using a fold-change of 1.5 and a p-value of less than 0.05, we found 111 downregulated and 122 upregulated genes in the Foxp3creCREBfl/fl compared to the CREBfl/fl Tregs, and among them, IL-10 and IL-13 were the two most differentially regulated in the Foxp3creCREBfl/fl Tregs (Figure 3A). KEGG pathway analysis revealed an enrichment of differentially regulated genes in pathways that are associated with Th2 cytokines, such as asthma, Th2 and Th2 cell differentiation, and cytokine-cytokine receptor interaction pathways (Figure 3B). Higher Il13 and Il10 mRNA expression in Foxp3creCREBfl/fl Tregs could be further confirmed by RT-qPCR (Figures 3C, D). CD4+CD25+Foxp3+ cells also showed enhanced IL-10 protein levels after 3 days of CD3/CD28 stimulation, as assessed by flow cytometry (Figures 3E, F). In vitro Treg differentiation with TGF-β revealed a reduced capacity of Foxp3creCREBfl/fl T cells to differentiate towards Foxp3+ cells, while IL-10 expressing cells within Foxp3+ cells were enhanced (Figure 3G). Furthermore, IL-10 cytokine expression of TGF-β−stimulated Foxp3creCREBfl/fl T cells measured by ELISA was enhanced, as was Il13, Il5, and Il10 mRNA expression, which suggests that CREB deficiency in Tregs induces a Th2-biased phenotype (Figures 3H-L). Beyond cytokines, Il1r1 (ST2) showed enhanced expression on the microarray. ST2, the receptor of IL-33, is preferentially expressed on colonic Tregs, where it promotes Treg function and adaptation to the inflammatory environment. It provides a necessary signal for Treg-cell accumulation and maintenance in inflamed tissues, and it was shown to regulate IL-10-expressing Tregs in the gut (8). In addition, IL-33 has been identified as a major interleukin in asthma pathology (36). ST2 was highly expressed in the Foxp3creCREBfl/fl Tregs, which was confirmed by flow cytometry (Figures 3M, N). Moreover, the whole transcriptome analysis also revealed an upregulated expression of CREM in Foxp3creCREBfl/fl Tregs and qRT-PCR also showed tendentially enhanced CREM expression in Foxp3creCREBfl/fl Tregs (Figure 3O). In conclusion, these data suggest that CREB deletion induces ST2+ Tregs. This finding led us to investigate the protein expression of ST2 within different organs in Foxp3creROSARFP and Foxp3creCREBfl/flROSARFP mice. ST2 expression was clearly enhanced in Tregs in the thymus, spleens, mesenteric lymph nodes, lungs, and colons of these mice (Figures 3P–T).

Figure 3. Altered gene expression in CREB deficient Tregs. (A)Gene expression in Tregs from the spleens of CREBfl/fl and Foxp3creCREBfl/fl mice. Colors indicate significant upregulation or downregulation of at least 1.5-fold with a p-value not more than 0.05 (blue); regulation of at least 1.5-fold or regulation with p-value not more than 0.05 (red). (B) Selection of pathways and associated genes that were significantly enriched. (C) N-fold Il13 mRNA expression in splenic Tregs from CREBfl/fl and Foxp3creCREBfl/fl mice (N = 5, male, 8–10 weeks old) analyzed by RT-qPCR. Bars indicate the mean and error bars the SEM, and a two-tailed one-sample test was used to test for significance. D) N-fold Il10 mRNA expression in splenic Tregs from CREBfl/fl and Foxp3creCREBfl/fl mice (N = 5, male, 8–10 weeks old) analyzed by RT-qPCR. Bars indicate mean and error bars SEM, and a two-tailed one-sample test was used to test for significance. E) MACS-isolated T cells from spleens were stimulated ex vivo with anti-CD3/CD28 antibodies for 3 days and re-stimulated with PMA/Ionomycin in the presence of Golgi Plug™. A representative density plot shows IL-10 production in CD4+Foxp3+ cells. (F) Statistical analysis of IL-10 expression of Foxp3+ cells after treatment as in (E) (N = 3 independent experiments, each dot represents one animal, two tailed unpaired t-test. (G) CD4+CD25- T cells were stimulated with anti-CD3/CD28 antibodies in the presence/absence of 5 ng/mL TGF-β for 5 days. Percentages of Foxp3+ cells from six independently performed experiments were determined, each with the spleen from one mouse (N =13 CREBfl/fl and N=12 Foxp3creCREBfl/fl mice), and a two-tailed unpaired t-test was used to test for significance. (H) Statistical analysis of IL-10+ cells within Foxp3+ cells after treatment as in G). An unpaired two-tailed t-test was used to test for significance, each dot represents one animal, and error bars the SEM. (I) IL-10 in supernatants of CD4+CD25- T cells after stimulation with anti-CD3/CD28 antibodies in the presence of 5 ng/mL TGF-β for 5 days was measured by ELISA, and an unpaired two- tailed t-test was performed to test for significance. The bars indicate the mean and the error bars the SEM (N = 6). (J–L) Δ ct mRNA expression of cells after treatment as in (G) Each dot represents one animal and error bars the SEM. Two-tailed unpaired t-tests were used to test for significance. (M) Statistical analysis of splenic ST2+ cells within CD4+ and CD4+CD25+ cells of CREBfl/fl and Foxp3creCREBfl/fl mice. There were three independently performed experiments (N = 10 CREBfl/fl and N =11 Foxp3creCREBfl/fl mice), a two-tailed unpaired t-test was used to test for significance, and each dot represents one animal and error bars the SEM. (N) Representative density plot of M. (O) N-fold Crem mRNA expression in splenic Tregs from CREBfl/fl and Foxp3creCREBfl/fl mice (N = 3, male, 8–10 weeks old) cells analyzed by RT-qPCR. (P–T) Statistical analysis of ST2+ in CD4+ and CD4+RFP+ cells in Foxp3creROSARFP (N = 5) and Foxp3creCREBfl/flROSARFP (N = 5) in the (P) spleens, (Q) mesenteric lymph nodes, (R) thymuses, and (S) lungs. Bars indicate mean and error bars the SEM, and a two-tailed unpaired t-test was used to test for significance. (T) Statistical analysis of ST2+ in CD3+ and CD3+RFP+ cells in Foxp3creROSARFP (N = 5) and Foxp3creCREBfl/flROSARFP (N = 5) in the colon. A two-tailed unpaired t-test was used to test for significance. *p<0.05, **p<0.01, and ***p<0.001, and the results are expressed as the mean ± SEM.
3.4 Foxp3creCREBfl/fl T cells dampen inflammation in experimental colitis
Since ST2+Tregs also play a protective role in intestinal mucosal inflammation (8), we performed a transfer of Foxp3creCREBfl/fl T cells (CD4+CD25-) or appropriate CREBfl/fl T cells (CD4+CD25-) into lymphopenic Rag2-/- mice. This usually results in the development of colitis within 5 weeks. Strikingly, the transfer of Foxp3creCREBfl/fl T cells did not result in the expected weight loss (Figure 4A) and the recipient mice displayed decreased intestinal inflammation (Figures 4B, C). Furthermore, there was a significant decrease of Il6, Tnfa, Il17a, and Ifng, along with a non-significant trend towards decreased Il1b in the gut (Figure 4D) and reduced IFN-γ production. There was also a trend towards reduced IL-17A in CD4+ T cells in the mLNs (Supplementary Figure S4E–G). Limitations include the absence of IL-6 and TNFα protein data due to the limited availability of the tissue. The experiment was repeated with CD4+CD25- T cells from Foxp3creROSARFP and Foxp3creCREBfl/fl ROSARFP mice into Rag2-/- mice and with CD4+CD25- cells from CREBfl/fl and VAVcreCREBfl/fl mice into Rag2-/- mice, with the same results. The transfer of CD4+CD25- T cells from Foxp3creCREBfl/fl ROSARFP mice (Figures 5A–G) and from VAVcreCREBfl/fl prevented the development of colitis (Supplementary Figure 11) and resulted in enhanced accumulation of RFP+ Tregs in different organs (Figures 5A–G). Interestingly, RFP+ Tregs also accumulated in the liver, while we did not find a difference in the RFP expression in the Foxp3creCREBfl/fl ROSARFP mice under steady state conditions.
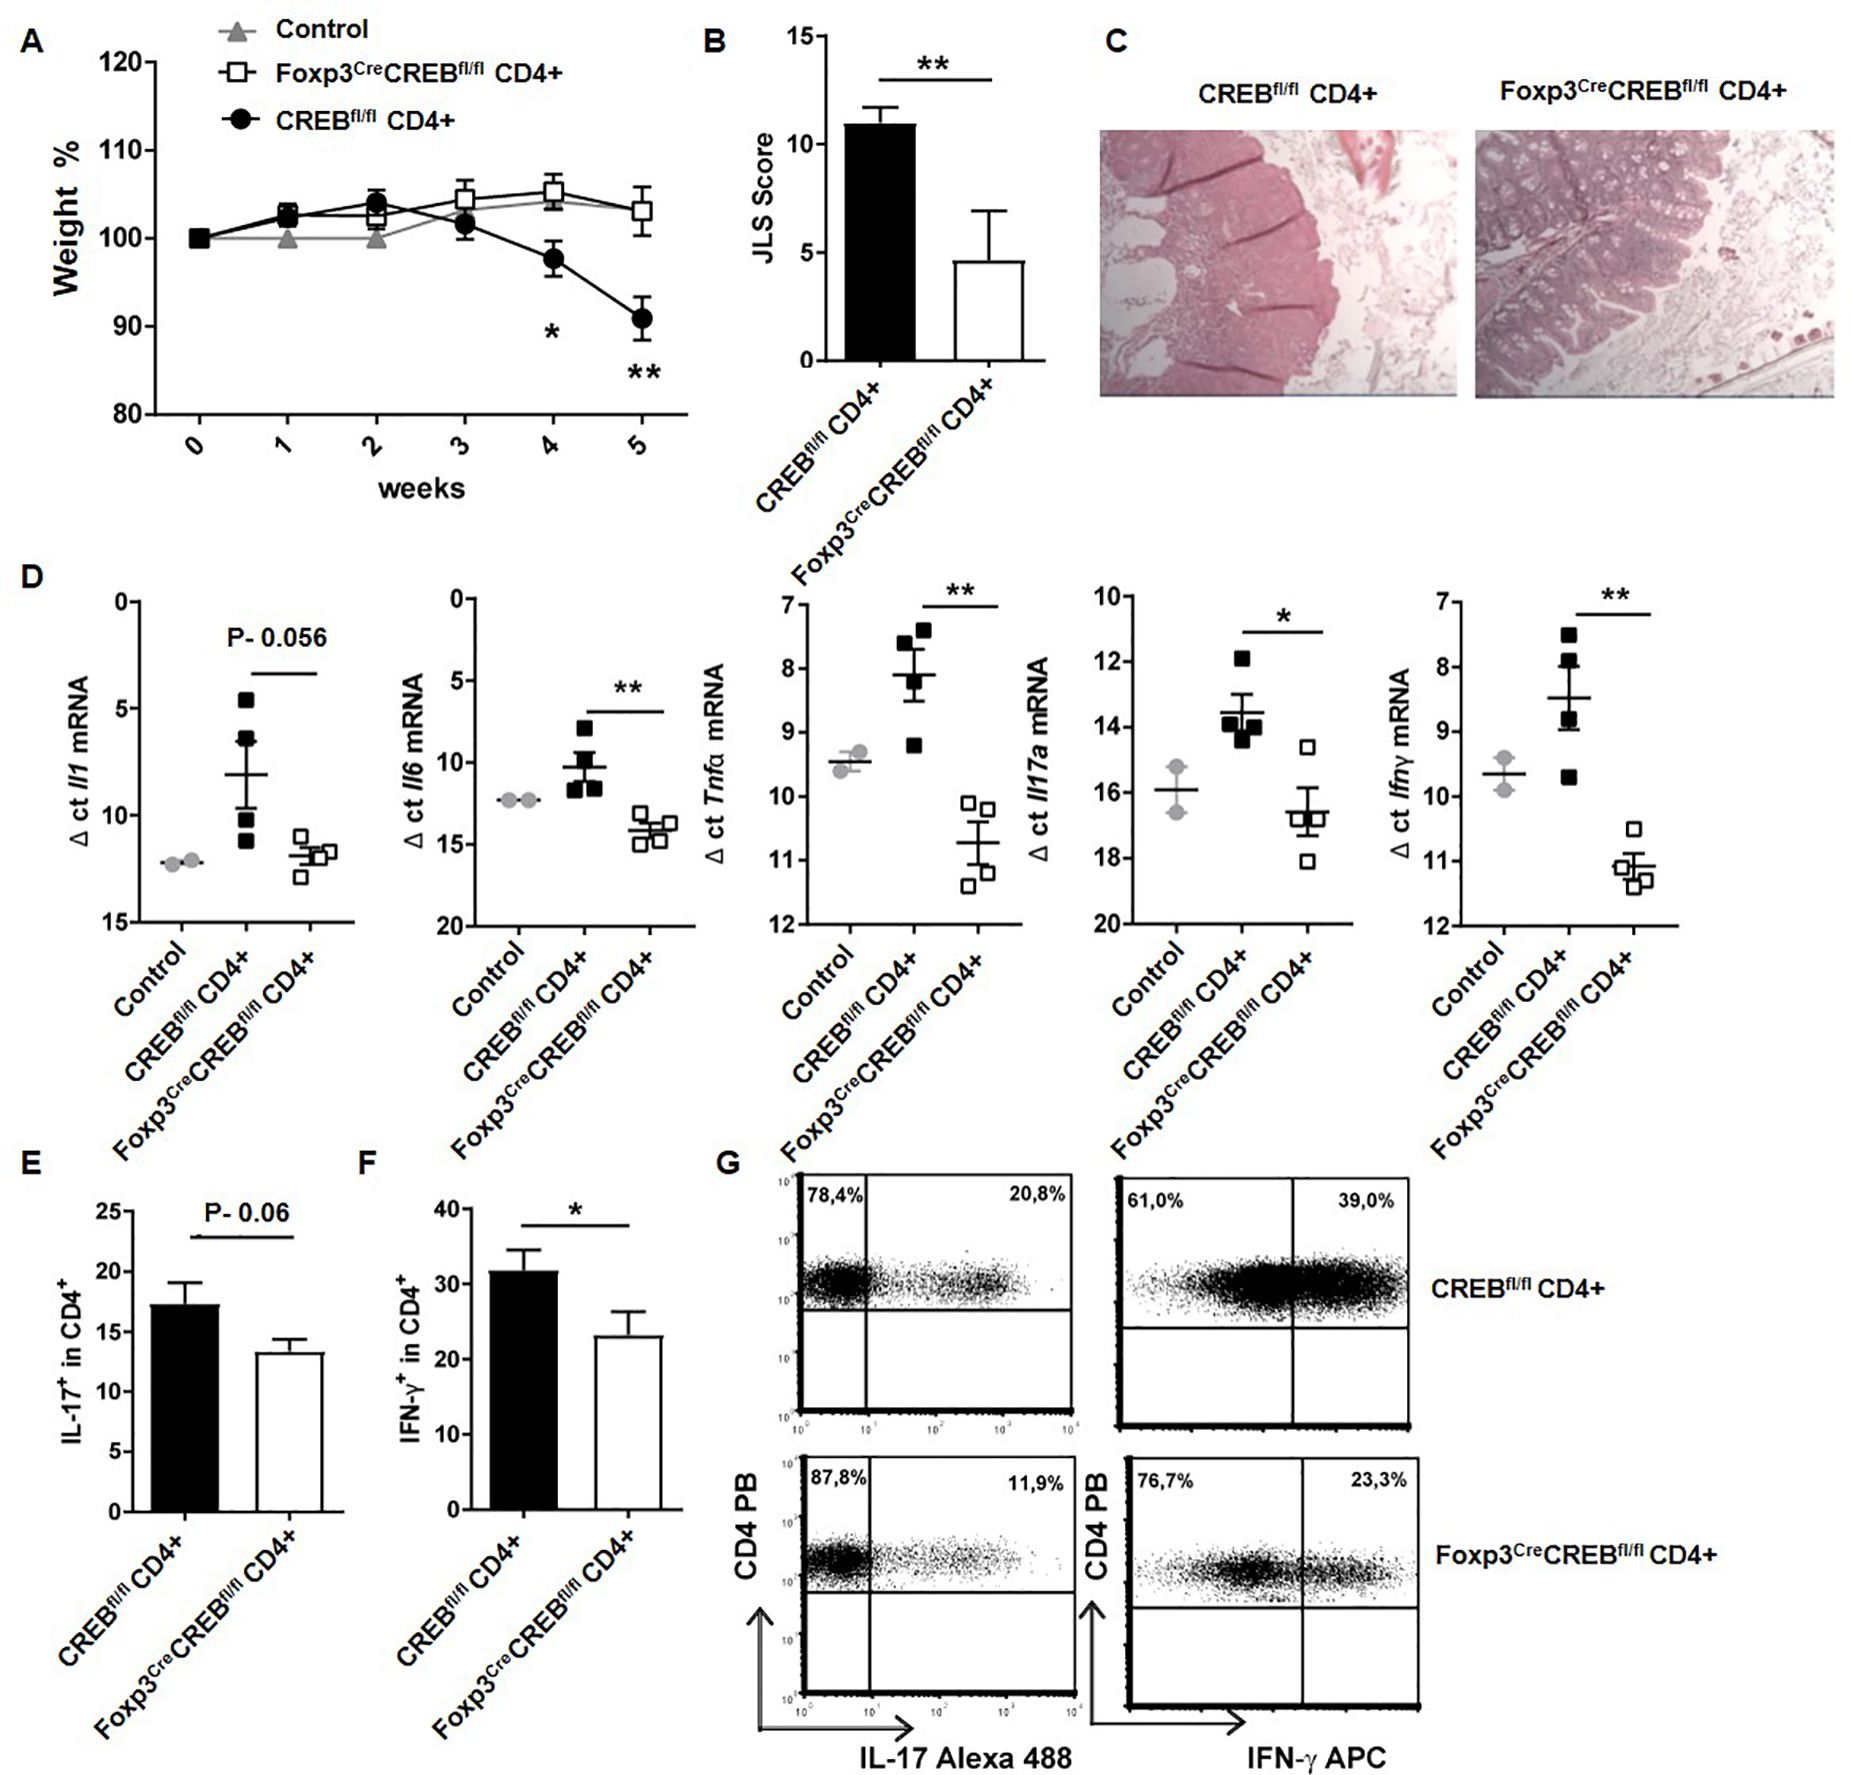
Figure 4. Foxp3creCREBfl/fl CD4+ T cells induce only moderate inflammation in experimental colitis. Rag2-/- mice were adoptively transferred CD4+ CD25- wild-type cells (CREBfl/fl CD4+) or Foxp3creCREBfl/fl CD4+ CD25- T cells. Untreated Rag-/- mice were used as controls. Mice were weighed and sacrificed 5 weeks after transfer. (A) Body weight as a percentage of starting weight. A two-tailed unpaired t-test were used to test for significance (N = 11 CREBfl/fl, N = 9 Foxp3creCREBfl/fl recipients, and five control Rag-/- mice were analyzed in three independently performed experiments). (B) Results of histological JLS score of colon sections (two independently performed experiments; CREBfl/fl recipients N = 5, Foxp3creCREBfl/fl recipients N = 6; a two-tailed Mann–Whitney test was used). (C) Representative photomicrographs of H&E-stained colon sections imaged using 10x magnification. (D) Expression of inflammatory cytokines analyzed by RT-qPCR. Dots represent Δ ct values normalized to β-actin. Each dot represents one animal (ct levels are inversely proportional to the amount of target nucleic acid in the sample). Two-tailed unpaired t-tests were used to test for significance (N = 2 control mice, N = 4 CREBfl/f, N = 4 Foxp3creCREBfl/fl recipients). (E) Statistical analysis of IL-17+ cells within CD4+ cells in mLNs (three independently performed experiments, CREBfl/fl recipients N = 9, Foxp3creCREBfl/fl recipients N = 9). A two-tailed unpaired t-test was used. (F) Statistical analysis of IFN-γ+ cells within CD4+ cells in mLNs (Three independently performed experiments; CREBfl/fl recipients N = 11, Foxp3creCREBfl/fl recipients N = 9). A two-tailed unpaired t-test was used. (G) Representative dot plots of E and (F) *p<0.05 and **p<0.01 and the results are expressed as the mean ± SEM.
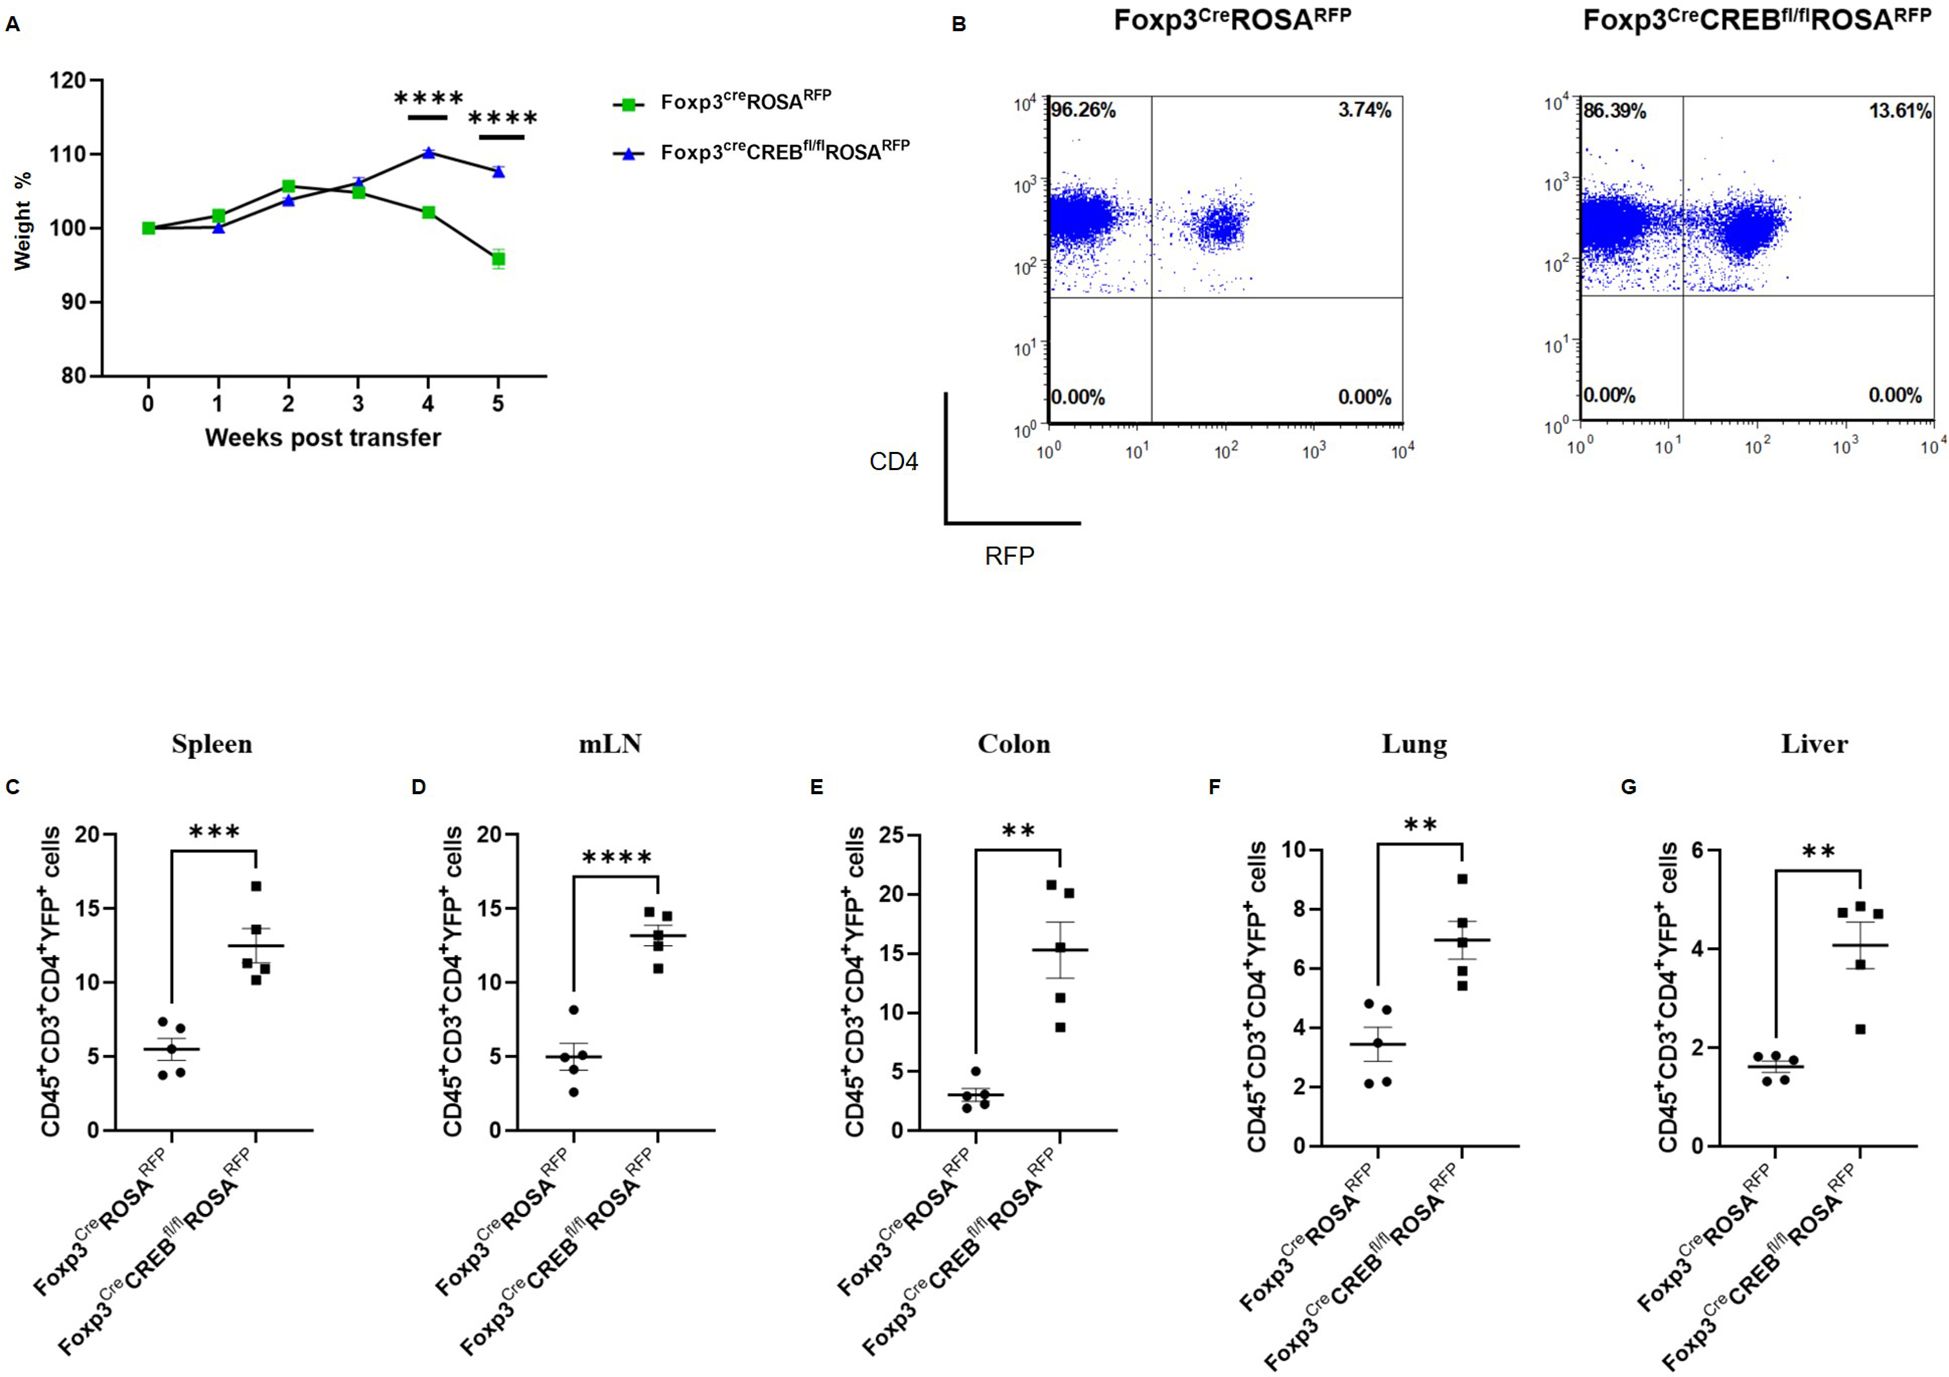
Figure 5. Foxp3creCREBfl/flROSARFP CD4+ T cells induce only moderate inflammation in experimental colitis, while CD4+RFP+ cells expand in peripheral tissues. Rag2-/- mice were adoptively transferred CD4+ CD25- wild-type cells (FoxpcreROSARFPCD4+) or Foxp3creCREBfl/lfROSARFP CD4+ CD25- T cells. Mice were weighed and sacrificed 5 weeks after transfer. (A) Body weight as a percentage of starting weight. A two-tailed unpaired t-test was used to test for significance (N = 5 FoxpcreROSARFP and N = 5 Foxp3creCREBfl/lfROSARFP recipient mice were analyzed in one independently performed experiment). B) Dot plots representing frequencies of RFP+ cells within the CD45+CD3+CD4+ population in the spleens of Rag2-/- mice that received cells from either Foxp3creROSARFP or Foxp3creCREBfl/flROSARFP mice. Percentages of CD45+CD3+CD4+RFP+ cells in the (C) spleens, (D) mLNs, (E) colons, (F) lungs, and (G) livers. A two-tailed unpaired t-test was used. **p<0.01, ***p<0.001, and ****p<0.0001 and the results are expressed as the mean ± SEM.
3.5 Blockade of IL-10 but not of ST2 signaling reverses the protective effects of Foxp3creCREBfl/fl T cells in experimental colitis
ST2+ Tregs are protective in intestinal inflammation (8), and,in addition, they are Th2 biased and release IL-10 (37). To decipher whether Foxp3creCREBfl/fl T cells prevent colitis through IL-10 production and/or ST2 expression, we performed an adoptive transfer colitis experiment with anti-IL10R antibodies or recombinant soluble ST2 (sST2). sST2 acts as a decoy for IL-33 and inhibits its biological activity (38). The blockade of IL-10 signaling induced colitis in the formerly resistant Foxp3creCREBfl/fl T cell-recipient mice (Figures 6A–C), while the ST2 blockade had no effect on disease progression (Supplementary Figure 4).

Figure 6. Reduced colitis in Foxp3creCREBfl/fl CD4+ T cell recipients depends on IL-10 signaling. Rag2-/- mice were adoptively transferred CD4+ wild-type cells (WT CD4+) or Foxp3creCREBfl/fl CD4+ T cells. Mice were either treated with an anti-IL10R antibody or an isotype control. (A) Body weight as a percentage of starting weight. Bars indicate mean and error bars the SEM (N=5 animals in each group; a two-tailed unpaired t-test was used; two independently performed experiments). (B) Representative photomicrographs of a H&E-stained colon section from CREBfl/fl and Foxp3creCREBfl/fl CD4+ T cell recipients that were treated with anti-IL10R, imaged using 10x magnification. (C) Results of histological JLS score of colon sections (two independently performed experiments with overall N=5 mice in each group; a two-tailed Mann–Whitney test was used to test for significance). *p<0.05 and **p<0.01 and the results are expressed as the mean ± SEM.
3.6 Genome-wide chromatin accessibility of WT and CREB-deficient Tregs
To analyze whether CREB deletion alters chromatin accessibility at different promoters and enhancers, we performed ATAC-seq in CREBfl/fl and Foxp3creCREBfl/fl Tregs. We observed a decrease in open chromatin around CREB and CREM motifs in the Foxp3creCREBfl/fl mice, which indicates loss of binding activity of these transcription factors in these cells (Figure 7A). The Il1rl1 (ST2) region showed significant differences in open chromatin around the original and an alternative promoter in Tregs from the Foxp3creCREBfl/fl mice, while canonical CRE motifs, which are 8-base pair palindromic sequences (5′-TGACGTCA-3′), could not be identified (Figure 7B). In addition, the IL-10 enhancer region showed clear differences between the two mouse strains. Within this region, binding sites for Nrf1 were identified, which is a CREB-dependent transcription factor (39). Moreover, we found a change in open chromatin of an alternate promoter of CREM (Figure 7C). CREM has been identified as one of the most regulated genes in ST-2 positive colonic Tregs of healthy mice (40). To prove whether CREM is involved in the regulation of ST2, we generated Foxp3creCREBfl/flCREM-/- mice. In vitro differentiation towards Foxp3+ cells was not significantly diminished in Foxp3creCREBfl/flCREM-/- mice (Figure 7D). Furthermore, deletion of CREM normalized Foxp3 expression per cell in CREB-deficient Tregs at least to some extent (Figure 7E) but reversed the expression of ST2 (Figure 7F). Taken together, our data suggest that the interaction of CREB and CREM determines the expression of Foxp3 and ST2 and the induction of CREM in CREB-deficient Tregs contributes to reduced Foxp3 expression. To prove the effect in vivo, we performed a transfer of Foxp3creCREBfl/flCREM-/- T cells (CD4+CD25-) or appropriate wild-type T cells (CD4+CD25-) into lymphopenic Rag2-/- mice. The additional genetic deletion of CREM reversed the effect of the CREB deletion and resulted in enhanced colitis severity, measured by JLS (The Jackson Laboratory Scoring) score in the transferred mice (Figure 7G).

Figure 7. Genome-wide chromatin accessibility of CREBfl/fl and Foxp3creCREBfl/fl mice. (A) ATAC-seq foot printing analysis indicates a decrease in TF activity for CREB and CREM upon CREB KO and an increase in TF activity of NRF1 upon CREB KO (p-value < 0.05; z-test). (B, C) Example of genes with loss of chromatin accessibility upon CREB KO includes enhancer regions around SC-2/Il1rl1 (blue peaks) and an alternative promoter of CREM (red peaks) (adjusted p-value < 0.05; MACS2 diff. peak caller). (D) CD4+CD25- T cells were stimulated with anti-CD3/CD28 antibodies in the presence/absence of 5 ng/mL TGF-β for 5 days. Percentages of Foxp3+ cells from six independently performed experiments were determined, each with the spleen from one mouse (N = 13 CREBfl/fl, N = 12 Foxp3creCREBfl/fl, and N = 3 Foxp3creCREBfl/flCREM-/- mice; a two-tailed unpaired t-test was used to test for significance; bars indicate the mean and error bars the SEM). (E) Statistical analysis of MFI of Foxp3 in CREBfl/fl (N = 13), Foxp3creCREBfl/fl (N = 9), and Foxp3creCREBfl/flCREM-/- (N =3) CD4+CD25+ T cells. Bars indicate the mean and error bars the SEM, and a two-tailed unpaired t-test was used to test for significance. (F) Statistical analysis of ST2+ in CD4+ and CD4+CD25+ cells in CREBfl/fl (N = 5), Foxp3creCREBfl/fl (N = 6), and Foxp3creCREBfl/flCREM-/- (N =3) CD4+CD25+ T cells. Bars indicate the mean and error bars the SEM, and one-way ANOVA was used to test for significance. (G) Rag2-/- mice were adoptively transferred CREBfl/fl CD4 T-cells (CD4+CD25-) or Foxp3creCREBfl/fl CREM-/- CD4+ T cells (CD4+CD25-). Histological JLS score results of the colon sections (one experiment with overall N=4/5 mice in each group; a two-tailed Mann–Whitney test was used to test for significance). *p<0.05, **p<0.01, and ****p<0.0001 and the results are expressed as the mean ± SEM.
4 Discussion
In this study, we provide evidence that CREB cells intrinsically regulate Foxp3 expression in Tregs and thereby play a critical role in Treg cell-mediated immune homeostasis. In detail, CREB deficient Tregs showed a reduced expression of Foxp3 per cell but enhanced expression of ST2, IL-10, and IL-13. Enhanced IL-10 expression of CREB-deficient Tregs prevents T cell-mediated colitis. Enhanced IL-10 expression is also a hallmark of ST2+ Tregs. ST2 is expressed on colonic Tregs and enhances local intestinal Treg cell responses (8). We identified particularly enhanced expression of Tregs in the colons and lungs of Foxp3creCREBfl/fl mice, which also includes upregulation of ST2 expression and may contribute to the unexpectedly protective role of CREB deletion in Tregs in type I immune responses. This protective role is in line with Wang et al. (19) who demonstrated an important role for CREB in regulating the balance between Th17 cells and Tregs. They showed that mice bearing a deletion of CREB in all CD4+ T cells prevented T cell-mediated transfer colitis comparable to our model. Moreover, these mice were also resistant in an EAE model. This protective effect in EAE was surprisingly lost when CREB was specifically deleted in Tregs. Nevertheless, except in the EAE model, Wang et al. did not analyze the Foxp3-specific CREB-deleted mice in further detail.
We hypothesize that, in particular, the enhanced IL-10 secretion prevented colitis in Rag-/- mice that received Foxp3creCREBfl/fl CD4+ T cells. IL-10 is an important regulator of intestinal homeostasis, as IL-10 and IL-10R deficient mice spontaneously develop intestinal inflammation (41, 42) and blocking IL-10 signaling induced colitis in Foxp3creCREBfl/fl T cell recipients that were previously resistant. It has been shown before that CREB induces IL-10 transcription in macrophages. Our data, thus, were highly unexpected and do not support these findings but may instead argue for cell-dependent mechanisms that regulate IL-10 expression. Our ATAC-seq data however do not show a direct effect of CREB expression on chromatin accessibility within the IL-10 enhancer and promoter region, thus we currently cannot mechanistically explain these findings.
We also found enhanced percentages of Tregs within the thymus, spleens, and pLNs but reduced Foxp3 expression per cell within peripheral lymphoid organs. Wang et al. also suggest that compensation by related transcription factors such as CREM exist. Interestingly and corroborating that theory, we found a clear upregulation of CREM in CREB-deficient Tregs and additional deletion of CREM recuperates Foxp3 expression in CREB deficient Treg cells, while it downregulates ST2 expression. Strikingly, CREM expression, which was enhanced in Foxp3creCREBfl/fl Tregs, was found before as a highly regulated gene in ST2-positive colon and skin Tregs (40). Delacher et al. characterized ST2+ tissue Tregs that are present in all non-lymphoid tissues, which were found to express killer cell lectin-like receptor subfamily G1 (KLRG1) and Th2-associated factors, including IL-10 (11, 12). These “tisTregsST-2” cells are programmed by BATF (12) in lymphoid organs and perform important tissue homeostasis and regenerative functions. Our data point to the fact that the expression of CREB and CREM also regulate these tisTregST2 in non-lymphoid tissues such as the colon, lungs, and liver. Spath et al. vigorously analyzed ST2 trajectories in mice and showed a high plasticity in ST2 expression and hierarchies in tissue-specific phenotypes (43). In addition, they found that ST2+ Tregs were highly proliferative and had a high migratory potential. This is in line with our findings that these cells can be found in the spleen, lung, liver, mLN, and the colon. They additionally found a high prevalence in skin and VAT, which was not analyzed in our setting. When comparing the transcriptional profiles with our analyses, we can confirm an upregulation of PTPN13 in our data (1.97-fold) and a regulation of Rab4a (-1.51-fold) between the CREB-deficient Tregs and wild-type Tregs, and the other factors that distinguished ST2+ from ST2- Tregs (Lyn, Gata3, Rln3, Klrg1, and Tbc1d4) were not different. Interestingly, in their analysis, ST2+ Tregs were enriched in more activated, differentiated Treg populations, such as ID2+ Tregs, and ID2 was upregulated in our analysis as well (1.7-fold) (43).
The limitations of our study are that we mainly mechanistically analyzed splenic Tregs, while ST2 is a hallmark of tissue Tregs, and further analysis will show how this affects local Tregs and tissue homeostasis. We observed an increase in regulatory T cell (Treg) frequencies and elevated ST2 expression in both lung and colon mucosal tissues. However, a limitation of our current study is that we did not perform comprehensive epigenetic and transcriptional profiling of the Tregs from these tissues, nor did we investigate the role of CREM, which has been suggested to compensate for ST2 expression from the splenic Tregs. These important aspects will be addressed in future studies to provide a deeper understanding of the mechanisms underlying Treg function and regulation in mucosal environments. Another issue is that it is not clear how CREB activation is regulated in Tregs. CREB has nine serine residues in the kinase inducible domain (KID) that can be phosphorylated and activated by different kinases and different phosphorylation patterns of CREB can exert opposite effects. Further research will therefore be necessary to identify therapeutic targets to directly influence CREB activity in Tregs. In conclusion, we provide evidence that CREB plays a pivotal role in Tregs. CREB is an important transcription factor to maintain Foxp3 expression, and the interaction of CREM and CREB is crucial for the expression of ST2 in Tregs. A lack of CREB enhances IL-10 expression and thereby prevents Th1-mediated diseases.
Data availability statement
The datasets presented in this study can be found in online repositories. The names of the repository/repositories and accession number(s) can be found below: https://www.ncbi.nlm.nih.gov/geo/, GSE157693 https://www.ncbi.nlm.nih.gov/geo/, GSE157933.
Ethics statement
The animal study was approved by Regierungspräsident/LANUV Nordrhein-Westfalen. The study was conducted in accordance with the local legislation and institutional requirements.
Author contributions
SHS: Formal analysis, Visualization, Writing – original draft, Validation, Writing – review & editing, Methodology, Investigation. JHr: Writing – review & editing, Investigation. SS: Investigation, Writing – review & editing. TL: Writing – review & editing, Investigation. TG: Writing – review & editing, Investigation. TC: Writing – review & editing, Investigation. MS: Writing – review & editing, Investigation. MK: Writing – review & editing, Conceptualization. EV: Writing – review & editing, Investigation. SB: Investigation, Writing – review & editing. CN: Writing – review & editing, Investigation. IC: Formal analysis, Writing – review & editing. ZL: Writing – review & editing, Formal Analysis. LG: Formal analysis, Writing – review & editing. BD: Formal analysis, Writing – review & editing. AS: Writing – review & editing, Resources. SF: Writing – review & editing, Formal analysis, Investigation. JHu: Writing – review & editing, Conceptualization, Formal analysis. ES: Writing – review & editing, Resources. TB: Resources, Writing – review & editing, Conceptualization. HW: Resources, Writing – review & editing. RW: Resources, Writing – review & editing. RB: Resources, Writing – review & editing. BL: Writing – review & editing, Resources. MZ: Writing – review & editing, Conceptualization, Formal analysis. NW: Writing – review & editing. KO: Supervision, Project administration, Methodology, Investigation, Conceptualization, Data curation, Formal analysis, Writing – review & editing, Visualization. KT: Funding acquisition, Project administration, Visualization, Data curation, Supervision, Writing – review & editing, Conceptualization, Methodology.
Funding
The author(s) declare that financial support was received for the research and/or publication of this article. DFG grant TE339/20-1 to KT. KT and KO got support from the Interdisciplinary Centre for Clinical Research within the Faculty of Medicine at the RWTH Aachen University (IZKF grant Project number – PTD 1-7). JH and TB were supported by the DFG grant SFB/TRR355/1 (Project number:490846870).
Acknowledgments
The authors acknowledge the IZKF Flow Cytometry Facility for the use of a cell sorter (DFG grant project ID 439895892) and the genomics facility for their service.
Conflict of interest
The authors declare that the research was conducted in the absence of any commercial or financial relationships that could be construed as a potential conflict of interest.
The author(s) declared that they were an editorial board member of Frontiers, at the time of submission. This had no impact on the peer review process and the final decision.
Generative AI statement
The author(s) declare that no Generative AI was used in the creation of this manuscript.
Correction note
This article has been corrected with minor changes. These changes do not impact the scientific content of the article.
Publisher’s note
All claims expressed in this article are solely those of the authors and do not necessarily represent those of their affiliated organizations, or those of the publisher, the editors and the reviewers. Any product that may be evaluated in this article, or claim that may be made by its manufacturer, is not guaranteed or endorsed by the publisher.
Supplementary material
The Supplementary Material for this article can be found online at: https://www.frontiersin.org/articles/10.3389/fimmu.2025.1601008/full#supplementary-material
References
1. Wildin RS, Ramsdell F, Peake J, Faravelli F, Casanova JL, Buist N, et al. X-linked neonatal diabetes mellitus, enteropathy and endocrinopathy syndrome is the human equivalent of mouse scurfy. Nat Genet. (2001) 27:18–20. doi: 10.1038/83707, PMID: 11137992
2. Bennett CL, Christie J, Ramsdell F, Brunkow ME, Ferguson PJ, Whitesell L, et al. The immune dysregulation, polyendocrinopathy, enteropathy, X-linked syndrome (IPEX) is caused by mutations of FOXP3. Nat Genet. (2001) 27:20–1. doi: 10.1038/83713, PMID: 11137993
3. Zhou X, Bailey-Bucktrout SL, Jeker LT, Penaranda C, Martínez-Llordella M, Ashby M, et al. Instability of the transcription factor Foxp3 leads to the generation of pathogenic memory T cells in vivo. Nat Immunol. (2009) 10:1000–7. doi: 10.1038/ni.1774, PMID: 19633673
4. Setoguchi R, Hori S, Takahashi T, and Sakaguchi S. Homeostatic maintenance of natural Foxp3(+) CD25(+) CD4(+) regulatory T cells by interleukin (IL)-2 and induction of autoimmune disease by IL-2 neutralization. J Exp Med. (2005) 201:723–35. doi: 10.1084/jem.20041982, PMID: 15753206
5. Zorn E, Nelson EA, Mohseni M, Porcheray F, Kim H, Litsa D, et al. IL-2 regulates FOXP3 expression in human CD4+CD25+ regulatory T cells through a STAT-dependent mechanism and induces the expansion of these cells in vivo. Blood. (2006) 108:1571–9. doi: 10.1182/blood-2006-02-004747, PMID: 16645171
6. Liao W, Lin JX, and Leonard WJ. IL-2 family cytokines: new insights into the complex roles of IL-2 as a broad regulator of T helper cell differentiation. Curr Opin Immunol. (2011) 23:598–604. doi: 10.1016/j.coi.2011.08.003, PMID: 21889323
7. Ohl K and Tenbrock K. Regulatory T cells in systemic lupus erythematosus. Eur J Immunol. (2015) 45:344–55. doi: 10.1002/eji.201344280, PMID: 25378177
8. Schiering C, Krausgruber T, Chomka A, Fröhlich A, Adelmann K, Wohlfert EA, et al. The alarmin IL-33 promotes regulatory T-cell function in the intestine. Nature. (2014) 513:564–8. doi: 10.1038/nature13577, PMID: 25043027
9. Kakkar R and Lee R. The IL-33/ST2 pathway: therapeutic target and novel biomarker. Nat Rev Drug Discov. (2008) 7:827–40. doi: 10.1038/nrd2660, PMID: 18827826
10. Griesenauer B and Paczesny S. The ST2/IL-33 axis in immune cells during inflammatory diseases. Front Immunol. (2017) 24:475. doi: 10.3389/fimmu.2017.00475, PMID: 28484466
11. Delacher M, Imbusch CD, Weichenhan D, Breiling A, Hotz-Wagenblatt A, Träger U, et al. Genome-wide DNA-methylation landscape defines specialization of regulatory T cells in tissues. Nat Immunol. (2017) 18:1160–72. doi: 10.1038/ni.3799, PMID: 28783152
12. Delacher M, Imbusch CD, Hotz-Wagenblatt A, Mallm JP, Bauer K, Simon M, et al. Precursors for nonlymphoid-tissue treg cells reside in secondary lymphoid organs and are programmed by the transcription factor BATF. Immunity. (2020) 52:295–312.e211. doi: 10.1016/j.immuni.2019.12.002, PMID: 31924477
13. Okamoto A, Fujio K, Okamura T, and Yamamoto K. Regulatory T-cell-associated cytokines in systemic lupus erythematosus. J BioMed Biotechnol. (2011) 2011:463412. doi: 10.1155/2011/463412, PMID: 22219657
14. Rubtsov YP, Rasmussen JP, Chi EY, Fontenot J, Castelli L, Ye X, et al. Regulatory T cell-derived interleukin-10 limits inflammation at environmental interfaces. Immunity. (2008) 28:546–58. doi: 10.1016/j.immuni.2008.02.017, PMID: 18387831
15. Murai M, Turovskaya O, Kim G, Madan R, Karp CL, Cheroutre H, et al. Interleukin 10 acts on regulatory T cells to maintain expression of the transcription factor Foxp3 and suppressive function in mice with colitis. Nat Immunol. (2009) 10:1178–84. doi: 10.1038/ni.1791, PMID: 19783988
16. Unutmaz D and Pulendran B. The gut feeling of Treg cells: IL-10 is the silver lining during colitis. Nat Immunol. (2009) 10:1141–3. doi: 10.1038/ni1109-1141, PMID: 19841645
17. Brenner S, Prösch S, Schenke-Layland K, Riese U, Gausmann U, and Platzer C. cAMP-induced Interleukin-10 promoter activation depends on CCAAT/enhancer-binding protein expression and monocytic differentiation. J Biol Chem. (2003) 278:5597–604. doi: 10.1074/jbc.M207448200, PMID: 12493739
18. Sanin DE, Prendergast CT, and Mountford AP. IL-10 production in macrophages is regulated by a TLR-driven CREB-mediated mechanism that is linked to genes involved in cell metabolism. J Immunol. (2015) 195:1218–32. doi: 10.4049/jimmunol.1500146, PMID: 26116503
19. Wang X, Ni L, Chang D, Lu H, Jiang Y, Kim BS, et al. Cyclic AMP-responsive element-binding protein (CREB) is critical in autoimmunity by promoting th17 but inhibiting treg cell differentiation. EBioMedicine. (2017) 25:165–74. doi: 10.1016/j.ebiom.2017.10.010, PMID: 29050947
20. Okawa H, Motohashi H, Kobayashi A, Aburatani H, Kensler TW, and Yamamoto M. Hepatocyte-specific deletion of the keap1 gene activates Nrf2 and confers potent resistance against acute drug toxicity. Biochem Biophys Res Commun. (2006) 339:79–88. doi: 10.1016/j.bbrc.2005.10.185, PMID: 16293230
21. Bleich A, Mähler M, Most C, Leiter EH, Liebler-Tenorio E, Elson CO, et al. Refined histopathologic scoring system improves power to detect colitis QTL in mice. Mamm Genome. (2004) 15:865–71. doi: 10.1007/s00335-004-2392-2, PMID: 15672590
22. Pils MC, Bleich A, Prinz I, Fasnacht N, Bollati-Fogolin M, Schippers A, et al. Commensal gut flora reduces susceptibility to experimentally induced colitis via T-cell-derived interleukin-10. Inflammation Bowel Dis. (2011) 17:2038–46. doi: 10.1002/ibd.21587, PMID: 21182023
23. Irizarry RA, Hobbs B, Collin F, Beazer-Barclay YD, Antonellis KJ, Scherf U, et al. Exploration, normalization, and summaries of high density oligonucleotide array probe level data. Biostatistics. (2003) 4:249–64. doi: 10.1093/biostatistics/4.2.249, PMID: 12925520
24. Wang J, Duncan D, Shi Z, and Zhang B. WEB-based GEne seT anaLysis toolkit (WebGestalt): update 2013. Nucleic Acids Res. (2013) 41:W77–83. doi: 10.1093/nar/gkt439, PMID: 23703215
25. Garg G, Muschaweckh A, Moreno H, Vasanthakumar A, Floess S, Lepennetier G, et al. Blimp1 prevents methylation of foxp3 and loss of regulatory T cell identity at sites of inflammation. Cell Rep. (2019) 26:1854–1868 e1855. doi: 10.1016/j.celrep.2019.01.070, PMID: 30759395
26. Corces MR, Trevino AE, Hamilton EG, Greenside PG, Sinnott-Armstrong NA, Vesuna S, et al. An improved ATAC-seq protocol reduces background and enables interrogation of frozen tissues. Nat Methods. (2017) 14:959–62. doi: 10.1038/nmeth.4396, PMID: 28846090
27. Li Z, Schulz MH, Look T, Begemann M, Zenke M, and Costa IG. Identification of transcription factor binding sites using ATAC-seq. Genome Biol. (2019) 20:45. doi: 10.1186/s13059-019-1642-2, PMID: 30808370
28. Langmead B and Salzberg SL. Fast gapped-read alignment with Bowtie 2. Nat Methods. (2012) 9:357–9. doi: 10.1038/nmeth.1923, PMID: 22388286
29. Li H, Handsaker B, Wysoker A, Fennell T, Ruan J, Homer N, et al. The sequence alignment/map format and SAMtools. Bioinformatics. (2009) 25:2078–9. doi: 10.1093/bioinformatics/btp352, PMID: 19505943
30. Zhang Y, Liu T, Meyer CA, Eeckhoute J, Johnson DS, Bernstein BE, et al. Model-based analysis of chIP-seq (MACS). Genome Biol. (2008) 9:R137. doi: 10.1186/gb-2008-9-9-r137, PMID: 18798982
31. Kim HP and Leonard WJ. CREB/ATF-dependent T cell receptor-induced FoxP3 gene expression: a role for DNA methylation. J Exp Med. (2007) 204:1543–51. doi: 10.1084/jem.20070109, PMID: 17591856
32. Ruan Q, Kameswaran V, Tone Y, Li L, Liou HC, Greene MI, et al. Development of Foxp3(+) regulatory t cells is driven by the c-Rel enhanceosome. Immunity. (2009) 31:932–40. doi: 10.1016/j.immuni.2009.10.006, PMID: 20064450
33. Polansky JK, Schreiber L, Thelemann C, Ludwig L, Krüger M, Baumgrass R, et al. Methylation matters: binding of Ets-1 to the demethylated Foxp3 gene contributes to the stabilization of Foxp3 expression in regulatory T cells. J Mol Med (Berl). (2010) 88:1029–40. doi: 10.1007/s00109-010-0642-1, PMID: 20574810
34. Zheng Y, Josefowicz S, Chaudhry A, Peng XP, Forbush K, and Rudensky AY. Role of conserved non-coding DNA elements in the Foxp3 gene in regulatory T-cell fate. Nature. (2010) 463:808–12. doi: 10.1038/nature08750, PMID: 20072126
35. Thornton AM, Lu J, Korty PE, Kim YC, Martens C, Sun PD, et al. Helios(+) and Helios(-) Treg subpopulations are phenotypically and functionally distinct and express dissimilar TCR repertoires. Eur J Immunol. (2019) 49:398–412. doi: 10.1002/eji.201847935, PMID: 30620397
36. Drake LY and Kita H. IL-33: biological properties, functions, and roles in airway disease. Immunol Rev. (2017) 278:173–84. doi: 10.1111/imr.12552, PMID: 28658560
37. Siede J, Fröhlich A, Datsi A, Hegazy AN, Varga DV, Holecska V, et al. IL-33 receptor-expressing regulatory T cells are highly activated, th2 biased and suppress CD4 T cell proliferation through IL-10 and TGFbeta release. PloS One. (2016) 11:e0161507. doi: 10.1371/journal.pone.0161507, PMID: 27548066
38. Holgado A, Braun H, Van Nuffel E, Detry S, Schuijs MJ, Deswarte K, et al. IL-33trap is a novel IL-33-neutralizing biologic that inhibits allergic airway inflammation. J Allergy Clin Immunol. (2019) 144:204–15. doi: 10.1016/j.jaci.2019.02.028, PMID: 30876911
39. Suliman HB, Sweeney TE, Withers CM, and Piantadosi CA. Co-regulation of nuclear respiratory factor-1 by NFkappaB and CREB links LPS-induced inflammation to mitochondrial biogenesis. J Cell Sci. (2010) 123:2565–75. doi: 10.1242/jcs.064089, PMID: 20587593
40. Miragaia RJ, Gomes T, Chomka A, Jardine L, Riedel A, Hegazy AN, et al. Single-cell transcriptomics of regulatory T cells reveals trajectories of tissue adaptation. Immunity. (2019) 50:493–504 e497. doi: 10.1016/j.immuni.2019.01.001, PMID: 30737144
41. Kuhn R, Löhler J, Rennick D, Rajewsky K, and Müller W. Interleukin-10-deficient mice develop chronic enterocolitis. Cell. (1993) 75:263–74. doi: 10.1016/0092-8674(93)80068-P, PMID: 8402911
42. Spencer SD, Di Marco F, Hooley J, Pitts-Meek S, Bauer M, Ryan AM, et al. The orphan receptor CRF2–4 is an essential subunit of the interleukin 10 receptor. J Exp Med. (1998) 187:571–8. doi: 10.1084/jem.187.4.571, PMID: 9463407
Keywords: IL-33, ST2, Foxp3, IL-10, CREB, CREM
Citation: Hebbar Subramanyam S, Turyne Hriczko J, Schulz S, Look T, Goodarzi T, Clarner T, Scheld M, Kipp M, Verjans E, Böll S, Neullens C, Costa I, Li Z, Gan L, Denecke B, Schippers A, Floess S, Huehn J, Schmitt E, Bopp T, Wasmuth H, Winograd R, Beyaert R, Lambrecht B, Zenke M, Wagner N, Ohl K and Tenbrock K (2025) CREB regulates Foxp3+ST-2+ TREGS with enhanced IL-10 production. Front. Immunol. 16:1601008. doi: 10.3389/fimmu.2025.1601008
Received: 27 March 2025; Accepted: 04 June 2025;
Published: 24 July 2025; Corrected: 29 August 2025.
Edited by:
Deborah Yablonski, Technion Israel Institute of Technology, IsraelReviewed by:
Heth Roderick Turnquist, University of Pittsburgh, United StatesWayne Hancock, University of Pennsylvania, United States
Copyright © 2025 Hebbar Subramanyam, Turyne Hriczko, Schulz, Look, Goodarzi, Clarner, Scheld, Kipp, Verjans, Böll, Neullens, Costa, Li, Gan, Denecke, Schippers, Floess, Huehn, Schmitt, Bopp, Wasmuth, Winograd, Beyaert, Lambrecht, Zenke, Wagner, Ohl and Tenbrock. This is an open-access article distributed under the terms of the Creative Commons Attribution License (CC BY). The use, distribution or reproduction in other forums is permitted, provided the original author(s) and the copyright owner(s) are credited and that the original publication in this journal is cited, in accordance with accepted academic practice. No use, distribution or reproduction is permitted which does not comply with these terms.
*Correspondence: Klaus Tenbrock, a3RlbmJyb2NrQHVrYWFjaGVuLmRl
†Present address: Martin Zenke, Department of Medicine IV, Hematology, Oncology, and Stem Cell Transplantation, Rheinisch-Westfälische Technische Hochschule Aachen University Hospital, Aachen, Germany Center for Integrated Oncology Aachen Bonn Cologne Duesseldorf (CIO ABCD), Aachen, Germany
‡These authors have contributed equally to this work
§Deceased