 Ricardo Cuesta-Martín de la Cámara1,2,3*
 Laura Miguel-Berenguel1,3Carmen Cámara1,2
 Itsaso Losantos-García4Esteban Frauca-Remacha5,6,7
 Loreto Hierro-Llanillo5,6,7Gema Muñoz-Bartolo5,6,7María Dolores Lledín-Barbacho5,6,7
 Ana Martínez-Feito1
 Eduardo López-Granados1,2,7,8†
 Elena Sánchez-Zapardiel1,2,7†
- 1Clinical Immunology Department, University Hospital La Paz, Madrid, Spain
- 2Lymphocyte Pathophysiology in Immunodeficiencies Group, La Paz Institute for Health Research (IdiPAZ), Madrid, Spain
- 3Medicine and Surgery Department, PhD School, Autonomous University of Madrid, Madrid, Spain
- 4Biostatistics Platform, La Paz Institute for Health Research (IdiPAZ), Madrid, Spain
- 5Paediatric Hepatology Department, University Hospital La Paz, Madrid, Spain
- 6European Reference Network (ERN) RARE LIVER, Madrid, Spain
- 7European Reference Network (ERN) TransplantChild, Madrid, Spain
- 8Centre for Biomedical Network Research on Rare Diseases (CIBERER U767), Madrid, Spain
Background: Immune monitoring has been proposed to optimize immunosuppressive therapy in liver recipients. This study aims to describe immunological changes following liver transplantation in pediatric recipients and to identify immune markers associated with post-transplant complications.
Methods: The immunological status of 95 pediatric liver recipients was prospectively assessed before transplantation and at 1, 3, 6, 9 and 12 months post-transplantation. Serum immunoglobulins (Ig) were measured by nephelometry and immunophenotype was evaluated by flow cytometry. T, B and NK lymphocyte counts were adjusted for age using standard reference ranges.
Results: Graft rejection, post-transplant lymphoproliferative disorder and autoimmune hepatitis was diagnosed in 6%, 2% and 0% patients, respectively. Early infections affected 43% patients, while late infections occurred in 17%, 24%, 10% and 9% recipients at each follow-up interval. Baseline immune dysregulation primarily involved the cellular compartment, with 78% recipients showing lymphopenia. Lymphocyte subpopulation scores improved following liver transplantation, with CD4+ score normalizing by month 1 and CD8+, CD19+ and NK scores by month 6. First-month IgG hypogammaglobulinemia, observed in 20% recipients, resolved completely at month 12. First-month T-cell lymphopenia (CD3+ hazard ratio [HR] 2.48, p=0.005; CD8+ HR 2.38, p=0.008) and hypogammaglobulinemia (IgG HR 2.18, p=0.036; IgA HR 2.40, p=0.011; IgM HR 2.61, p=0.006) were associated with higher risk of late infections. In multivariate analysis, only CD3+ T-cell lymphopenia remained a significant predictor (HR 2.13, p=0.030).
Conclusions: Baseline immune dysregulation resolved within the first months post-transplantation. Early infections were unrelated to immune markers, while late infections were associated with CD3+ T-cell lymphopenia and hypogammaglobulinemia.
1 Introduction
Liver transplantation (LT) remains the most effective treatment for end-stage liver disease (1). Advances in immunosuppressive therapies and surgical techniques have improved survival rates, both in adults (72-73%) (2, 3) and children (73-94%) (4, 5). However, the precise tailoring of immunosuppressive treatments for each recipient remains challenging. Striking the optimal balance between minimizing the risk of rejection and avoiding complications related to immunosuppressive drugs remains crucial (6). Among these complications, infections are the leading cause of mortality in pediatric LT recipients (4.1%) (7).
Currently, clinical practice relies primarily on pharmacokinetics to estimate immunosuppression, but this approach is often insufficient in pediatric LT (8). New strategies, including pharmacogenomics, immune biomarkers, cellular therapy, tolerance induction and alternative immunosuppressants, show promise for managing narrow therapeutic range drugs (9). Hence, immune monitoring has been proposed as a valuable tool to predict immunological and infectious complications after LT (10).
In LT humoral immune responses are monitored by the presence of donor-specific antibodies, which are often a contraindication for immunosuppression weaning (11). However, there are no standardized techniques to measure cellular responses against infections and/or malignancies. Specific T-cell responses have been proposed as biomarkers for predicting post-transplant lymphoproliferative disorder (PTLD) (12). Our previous study evaluated this approach in the pediatric LT setting, to identify patients with inadequate control of Epstein-Barr virus (EBV) infection (13).
In recent years, new follow-up strategies combining both humoral and cellular immunity in LT have been explored (14–16). Fukui et al. studied 82 adult liver recipients, finding that low serum complement 3 (C3) levels before and one month after transplantation predicted 90-day mortality (14). Previously, Iovino et al. found that liver recipients who develop infections had lower immunoglobulin G (IgG) levels at day 3 post-transplantation and higher CD64 monocyte counts at day 7 (15). Similarly, Carbone et al. had observed that liver recipients at higher infection risk had baseline hypocomplementemia C3 and hipergammablobulinemia IgG, but showed reduced IgG levels by day 7 post-transplantation (16).
While those studies focused on adults, research on immune changes in pediatric LT is limited (8), as studying immunity in children is challenging due to age-related effects on T- and B-cell number and function, influencing their susceptibility to infections and other complications (17). However, epidemiological observations (18) suggest that children exhibit more favorable outcomes than adults when confronted with viruses like EBV and Severe Acute Respiratory Syndrome Coronavirus 2, likely due to their robust innate immune responses, characterized by more active natural killer (NK) and NKT cells, as well as increased regulatory T cells (Tregs).
Given these differences, it is crucial to translate this understanding into the context of immunosuppression in pediatric LT. This prospective study aims to define humoral and cellular immunity changes before LT and up to one year after the procedure in a cohort of pediatric recipients, considering age-related variations. Additionally, we seek to identify immune markers associated with the risk of clinically relevant infections, autoimmunity, PTLD and rejection events.
2 Methods
2.1 Patients and study design
Our prospective study included 106 pediatric patients from University Hospital La Paz, who received a liver graft between January 2019 and December 2023. All patients gave informed consent, approved by the ethics committee of our institution (reference PI-4000). Eleven patients were withdrawn from the study (Figure 1), resulting in a final cohort of 95 patients. Transplant indication was categorized in five groups (Table 1), according to Díaz Fernandez et al. (19).
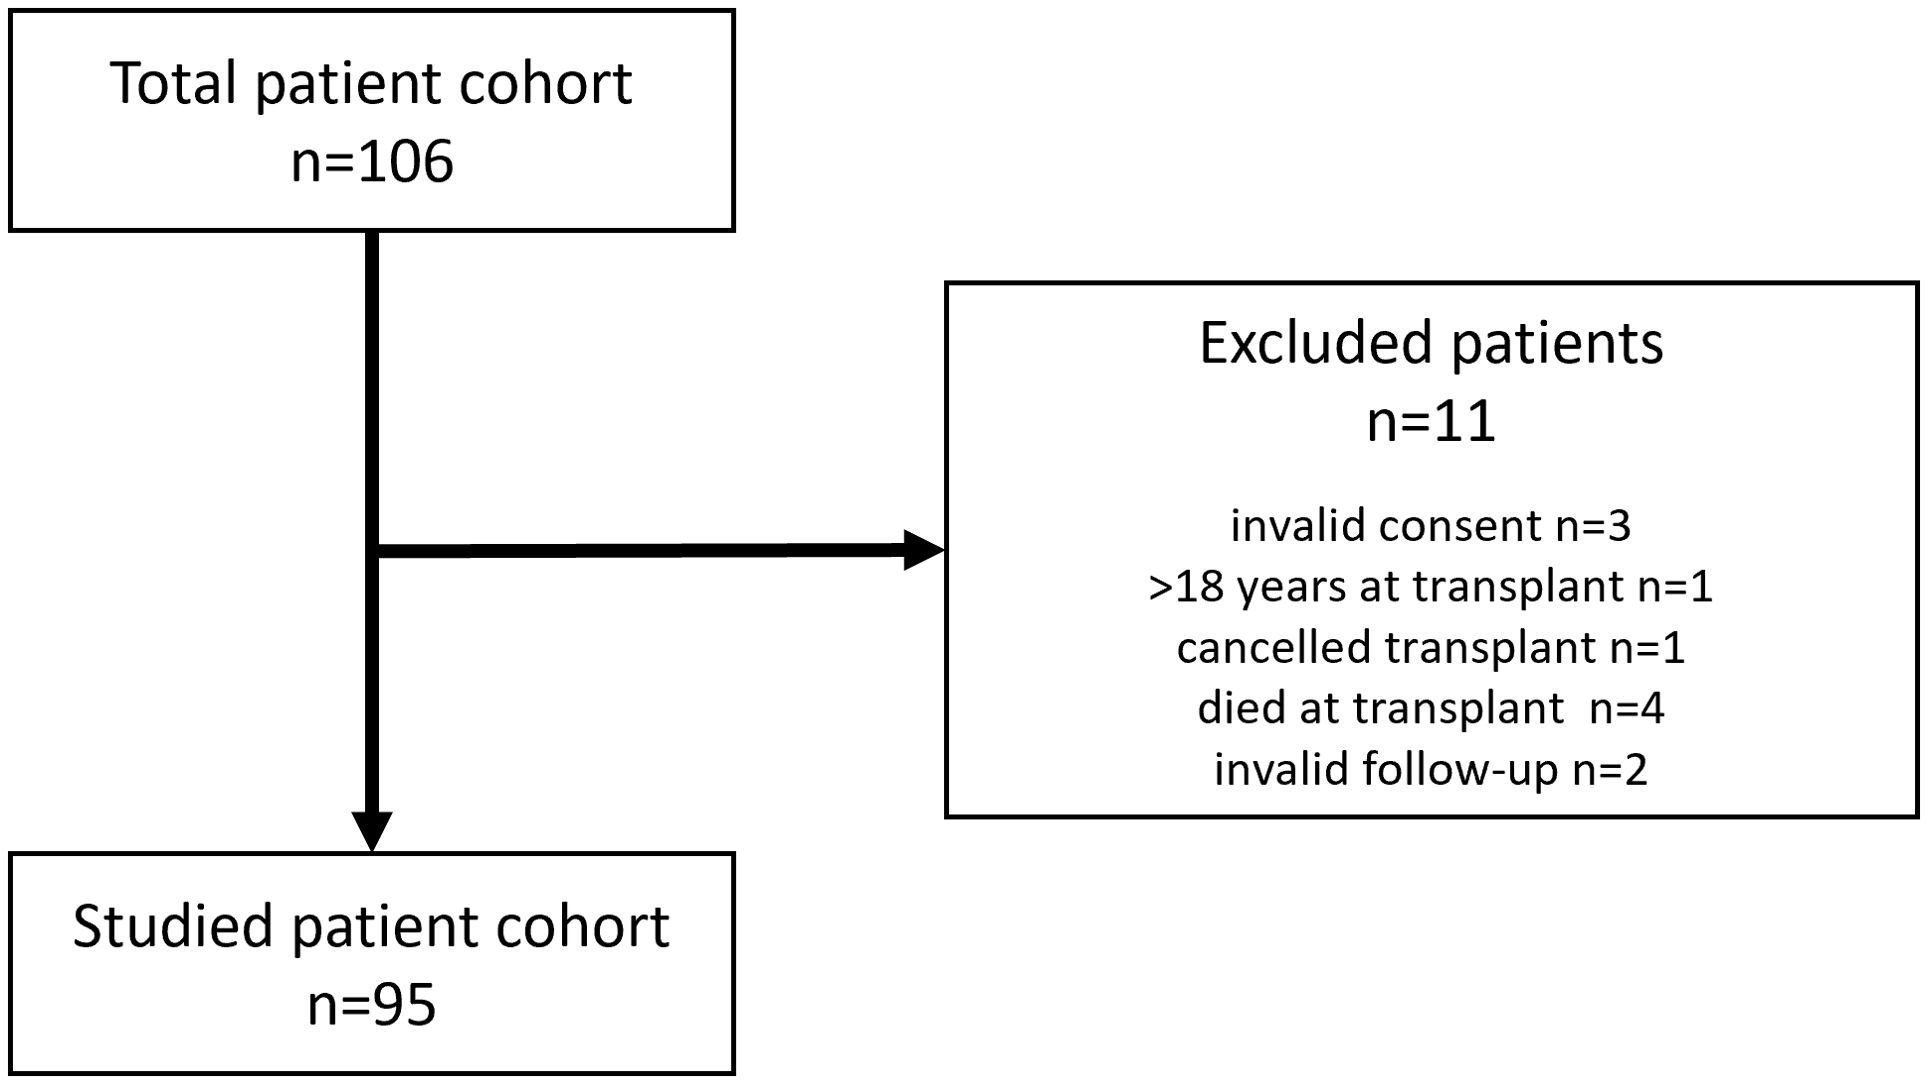
Figure 1. Flowchart for the inclusion of the pediatric liver transplanted patient cohort (n=95).
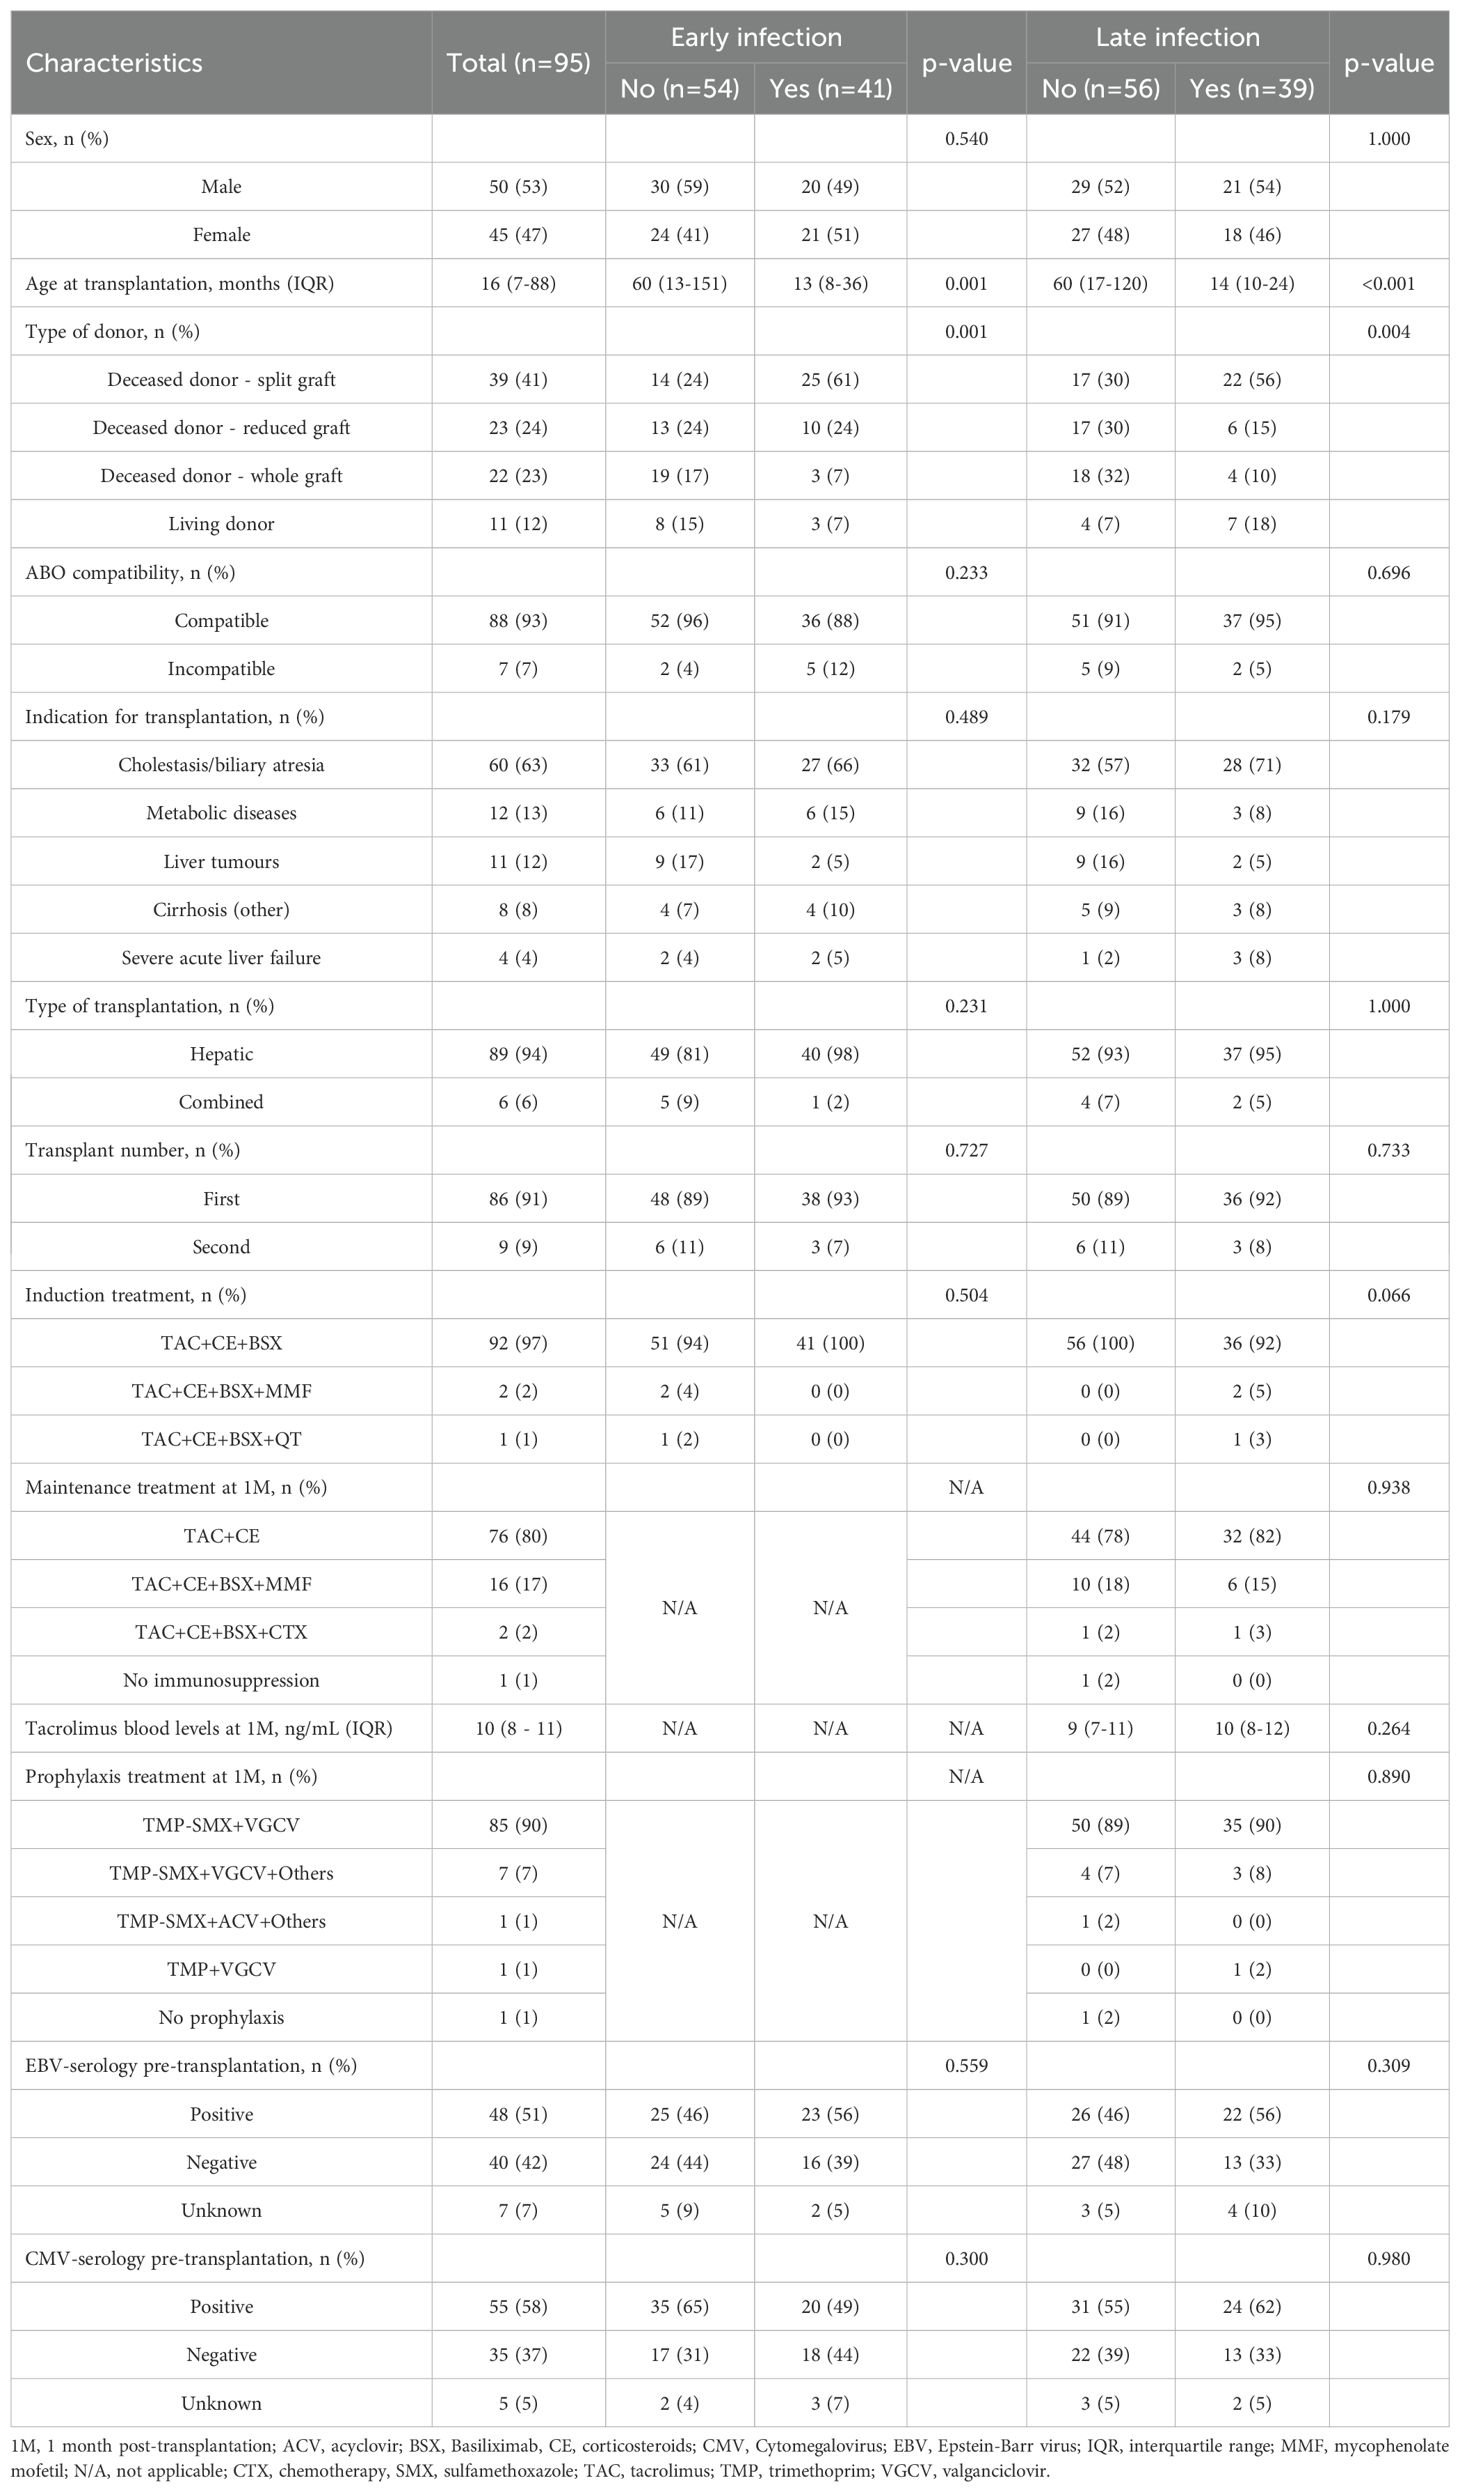
Table 1. Epidemiologic and clinical features in a cohort of pediatric liver recipients, further categorized as early/late infected and non-infected patients.
Patients were monitored for 1 year. Follow-up periods included a baseline study just before transplantation (PreTx) and five studies post-transplantation at 1, 3, 6, 9 and 12 months after the procedure (1M, 3M, 6M, 9M and 12M). Demographic and clinically relevant information was collected (Table 1). Immune status was assessed at each timepoint. We considered clinically relevant infections, rejection, liver autoimmunity and PTLD as primary outcomes.
The standard induction regimen consisted of basiliximab administered on days 0 and 4 post-transplantation, combined with tacrolimus and corticosteroids. Maintenance immunosuppression mainly consisted of tacrolimus and corticosteroids. In selected cases experiencing rejection episodes, mycophenolate mofetil was added to the regimen.
Antimicrobial prophylaxis included trimethoprim-sulfamethoxazole for Pneumocystis jirovecii, administered for two years post-transplantation, and either ganciclovir or valganciclovir for Cytomegalovirus, prescribed for six months post-transplantation regardless of donor/recipient serostatus.
Infectious events were categorized according to Van Delden et al. (20), and their relevance was defined as proven bacterial, probable/proven fungal and probable/proven viral infections, as well as viral syndromes. Early infections were defined as those occurring within the first month post-transplantation, while infections occurring thereafter were classified as late infections. Autoimmune hepatitis (AIH) was defined by a positive test result for any of the following antibodies: anti-mitochondrial M2, anti-filamentous-actin (F-actin), anti-Liver Cytosol Antigen Type 1 or anti-Liver-Kidney Microsomal antibodies, along with meeting clinical criteria. PTLD diagnosis was based on histopathologic criteria. The histopathological diagnosis of acute allograft rejection was determined based on the Banff criteria (21).
2.2 Immune status assessment
Cellular immune status was evaluated by multiparametric flow cytometry. Briefly, 75µL of whole blood was stained with various monoclonal antibody combinations, using different panels over time due to supplier changes (Supplementary Table S1). Comparative analyses were conducted to ensure that the percentages remained consistent across all panels (data not shown). Cell acquisition was made on a BD FACSCanto™ or a DxFLEX flow cytometer. The resulting data were analyzed by FACSDiva™ (BD, USA) or Kaluza (Beckman Coulter, USA) software.
Immunophenotype of T lymphocytes (CD3+, further classified as CD4+ and CD8+), B lymphocytes (CD19+), NK lymphocytes (CD3-CD16+CD56+) and NKT cells (CD3+CD16+CD56+) was performed. CD4+ and CD8+ T lymphocytes were further distributed in naïve (Tn, CD27+CD45RO-), effector (Teff, CD27-CD45RO-), central memory (Tcm, CD27+CD45RO+-) and effector memory (Tefm, CD27-CD45RO+-) subsets. Additional quantified subpopulations included recent thymic emigrants (RTE, CD4+CD45RA+CD31+), Treg (CD3+CD4+CD25+CD127low), gamma-delta T lymphocytes (Tγδ, CD3+TCRγδ+), activated T cells (CD3+HLA-DR+) and memory B cells (Bm, CD19+CD27+).
Absolut numbers of T, B and NK lymphocytes were normalized to a patient-specific age range (22), creating a variable called “score”. To calculate the score, the median of the age-specific normal range was subtracted from the absolute number of lymphocytes in the subpopulation. The result was then divided by the difference between the 90th percentile and the 10th percentile of the normal range for that age group. Lymphopenia was defined as a score under -0.5 and lymphocytosis as a score over 0.5.
Regarding humoral immunity, levels of immunoglobulins G, A and M (IgG, IgA and IgM) were quantified on serum by nephelometry following manufacturer’s instructions (Siemens, Altona). Hypogammaglobulinemia was defined as values of IgG, IgA or IgM below the lower 95% confidence interval for each age group (23).
2.3 Statistical analysis
Quantitative variables were compared between two groups using the Mann–Whitney U test, except for the Δscore, for which the Student’s t-test was applied after confirming normal distribution with the Shapiro–Wilk test. When comparing quantitative variables across more than two groups, the Kruskal-Wallis test was used, followed by Dunn’s post hoc test for pairwise comparisons. Survival analysis was performed using the Cox proportional hazards model. The optimal multivariate model was selected using the Akaike Information Criterion, starting with variables with a p-value <0.100 from univariate analysis. The final model retained variables with the best fit. Statistical significance was set at p <0.05. All analyses were conducted with RStudio (version 4.3.3, R Core Team, 2024).
3 Results
3.1 Baseline clinical features
Ninety-five patients were ultimately included in our prospective study (Figure 1), with a median age of 16 (7–88) months. The baseline characteristics of the cohort are detailed in Table 1. Split graft from a deceased donor was the most common type of donation (41%), with biliary atresia being the predominant indication for LT (63%). Only 6 patients (6%) underwent combined liver-kidney transplantation, while 9 others (9%) required a second transplant due to primary graft failure (n=7), acute rejection (n=1) or tumor recurrence (n=1).
Ninety-seven percent of the patients received the standard induction regimen. Two patients (2%) also received mycophenolate as part of their induction therapy due to a combined transplant with a kidney graft, whereas one patient (1%) with a liver tumor was on chemotherapy at the time of transplantation.
Seven patients (7%) received intravenous immunoglobulin (IVIG). Two (2%) were prescribed IVIG prior to transplantation: one as part of the treatment for Gestational Alloimmune Liver Disease and another in the context of Evans syndrome associated with Autoimmune Lymphoproliferative Syndrome. Two patients (2%) received IVIG post-transplantation for the management of either adenovirus or Epstein–Barr virus infections. Three additional patients (3%) were treated with IVIG due to severe post-transplant hypogammaglobulinemia. Only two of these seven patients (29%) remained free of infections.
3.2 Events of rejection, AIH, PTLD and infection post-transplantation
Regarding post-transplant outcomes, 6 episodes of acute cellular rejection were diagnosed (6%) along the follow-up (median time 233 [50 – 349] days). Three patients had a diagnosis of AIH before transplantation: one with type 1 AIH, one with seronegative AIH and one with suspected AIH. One patient tested positive for anti-F-actin antibodies at a titer of 1:80 at 6M, though the antibody was undetectable in subsequent tests. Other autoimmune complications included one case of autoimmune neutropenia and one of autoimmune hemolytic anemia. PTLD was diagnosed in 2 patients (2%) at 6M and 9M, respectively. The low number of rejection, AIH or PTLD events reported prevented us from doing statistical analysis.
Regarding infections, most of them occurred within the first month post-transplantation (early infections) (median time 4 [1-12] days), affecting 41 patients (43%) (Figure 2A). In subsequent months, the proportion decreased to 17%, 24%, 10% and 9% during their respective follow-up periods (Figure 2A). Early infections were predominantly bacterial, accounting for 51% of cases (Figure 2B). In contrast, late infections (median time 100 [30-150] days) were primarily viral, comprising 68%, 67%, 47% and 75% of infections during the corresponding follow-up periods (Figure 2B). Pathogens causing early and late infections are detailed in Supplementary Table S2.
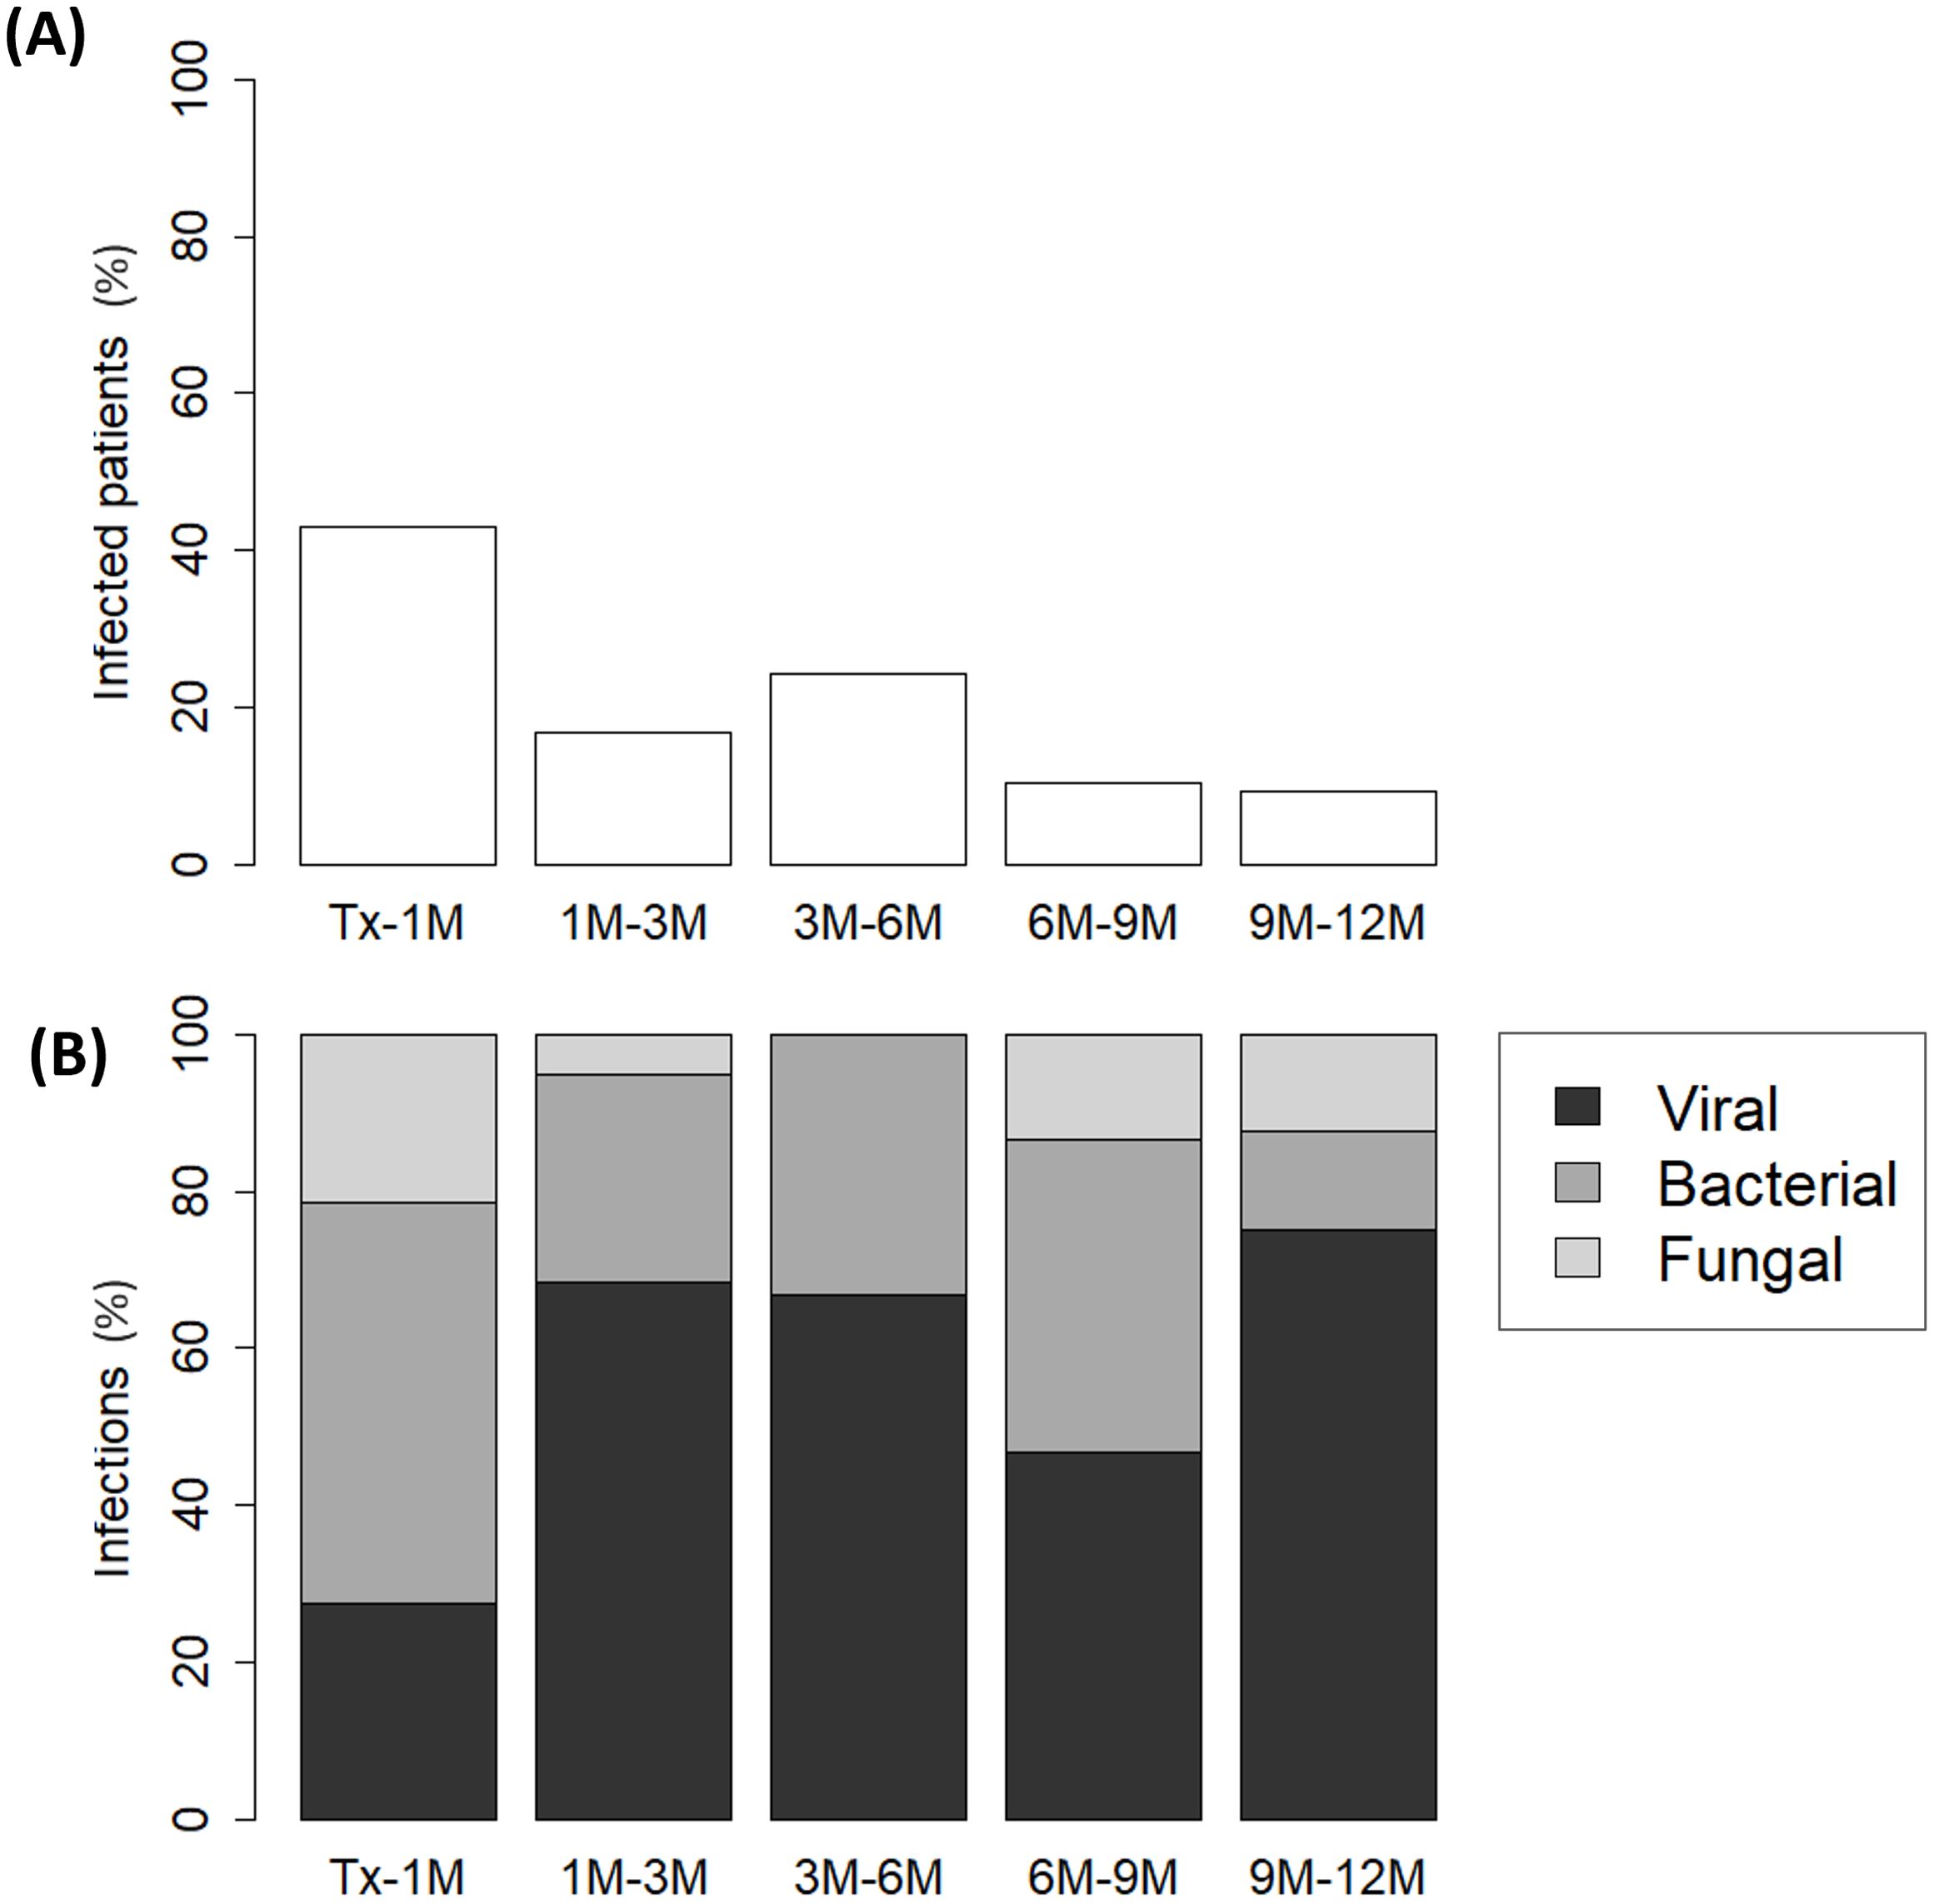
Figure 2. Percentage of (A) infected pediatric liver recipients and (B) distribution of infection types (viral, bacterial, or fungal) across each follow-up period: from transplantation (Tx) to 1 month post-transplantation (1M), 1M to 3M, 3M to 6M, 6M to 9M and 9M to 12M.
3.3 Evolution of immunoglobulins and lymphocyte populations during the first year post-transplantation
IgA hypogammaglobulinemia was detected in 2 (3%) recipients before the procedure, while the rest of patients maintained normal levels of both IgG and IgM (Supplementary Table S3). Transplantation had a negative impact on immunoglobulin levels during the first month post-transplantation, with 18 (20%), 19 (21%) and 17 (19%) recipients developing hypogammaglobulinemia for IgG, IgA, and IgM, respectively. During the subsequent months, immunoglobulin levels gradually increased (Figures 3A-C) and, by the end of the follow-up period, most patients had returned to normal levels. However, 7 (11%) patients still had IgM hypogammaglobulinemia, and 2 (3%) patients had hypogammaglobulinemia of either IgG or IgA (Supplementary Table S3).
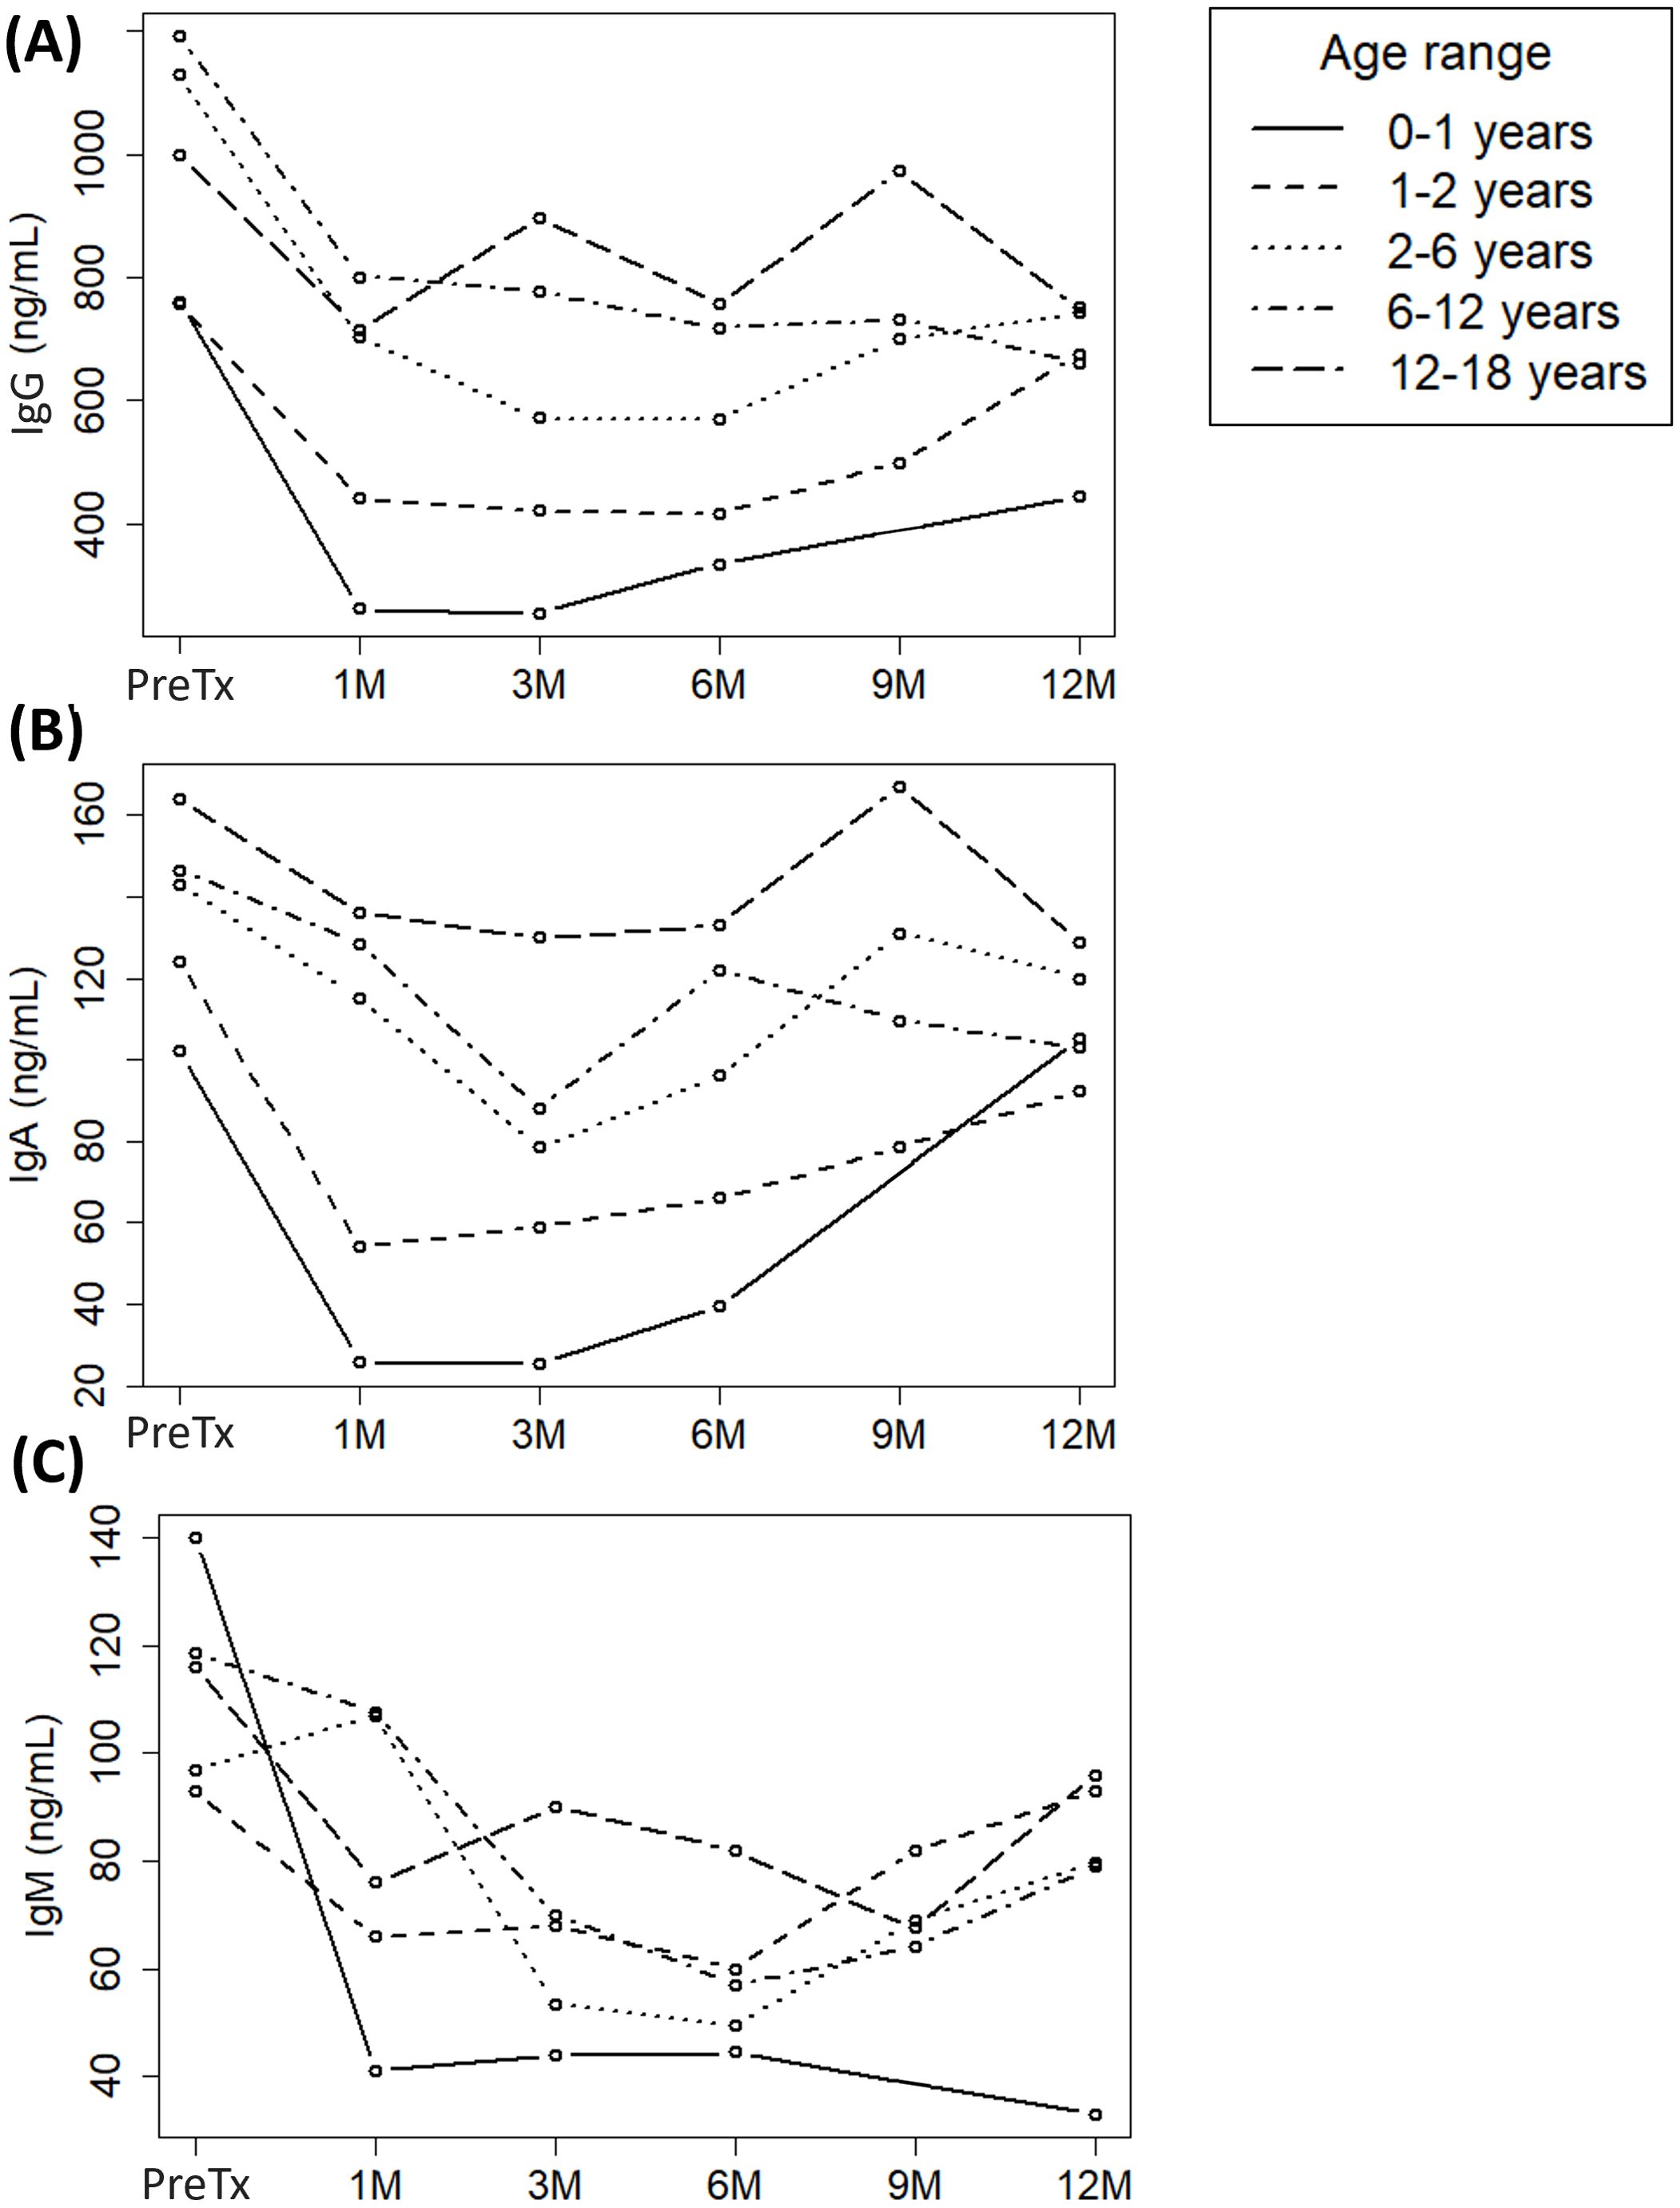
Figure 3. Evolution of (A) immunoglobulin G (IgG), (B) IgA and (C) IgM serum levels in a cohort of pediatric liver recipients grouped by age ranges across each follow-up period: pre-transplantation (Pre-Tx) and 1, 3, 6, 9 and 12 months post-transplantation (1M, 3M, 6M, 9M and 12M, respectively).
Lymphopenia was frequent among recipients prior to transplantation (78%) (Supplementary Table S3), and mainly attributable to baseline CD3+ T lymphopenia (81%). In contrast, pre-transplant B and NK lymphopenia was observed in lower percentages (42% and 6%, respectively) (Supplementary Table S3). Accordingly, the baseline median score of total lymphocytes (Figure 4A) and T lymphocytes (Figure 4B) mirrored each other, both being below -0.5 prior to transplantation, including CD4+ (Figure 4C) and CD8+ (Figure 4D) T subsets. Upon transplantation, T lymphocytes already increased above -0.5 at 1M (Figure 4B), rising from -0.77 (-0.94 to -0.60) to -0.30 (-0.60 to 0.07) (p<0.001). Concomitantly, both CD4+ (PreTx -0.76 [-0.89 to -0.57] vs 1M -0.30 [-0.53 to 0.13], p<0.001) and CD8+ (PreTx -0.71 [-0.80 to -0.51] vs 1M -0.34 [-0.58 to 0.02], p<0.001) T-cell scores also exceeded -0.5 at 1M (Figures 4C, D, respectively).
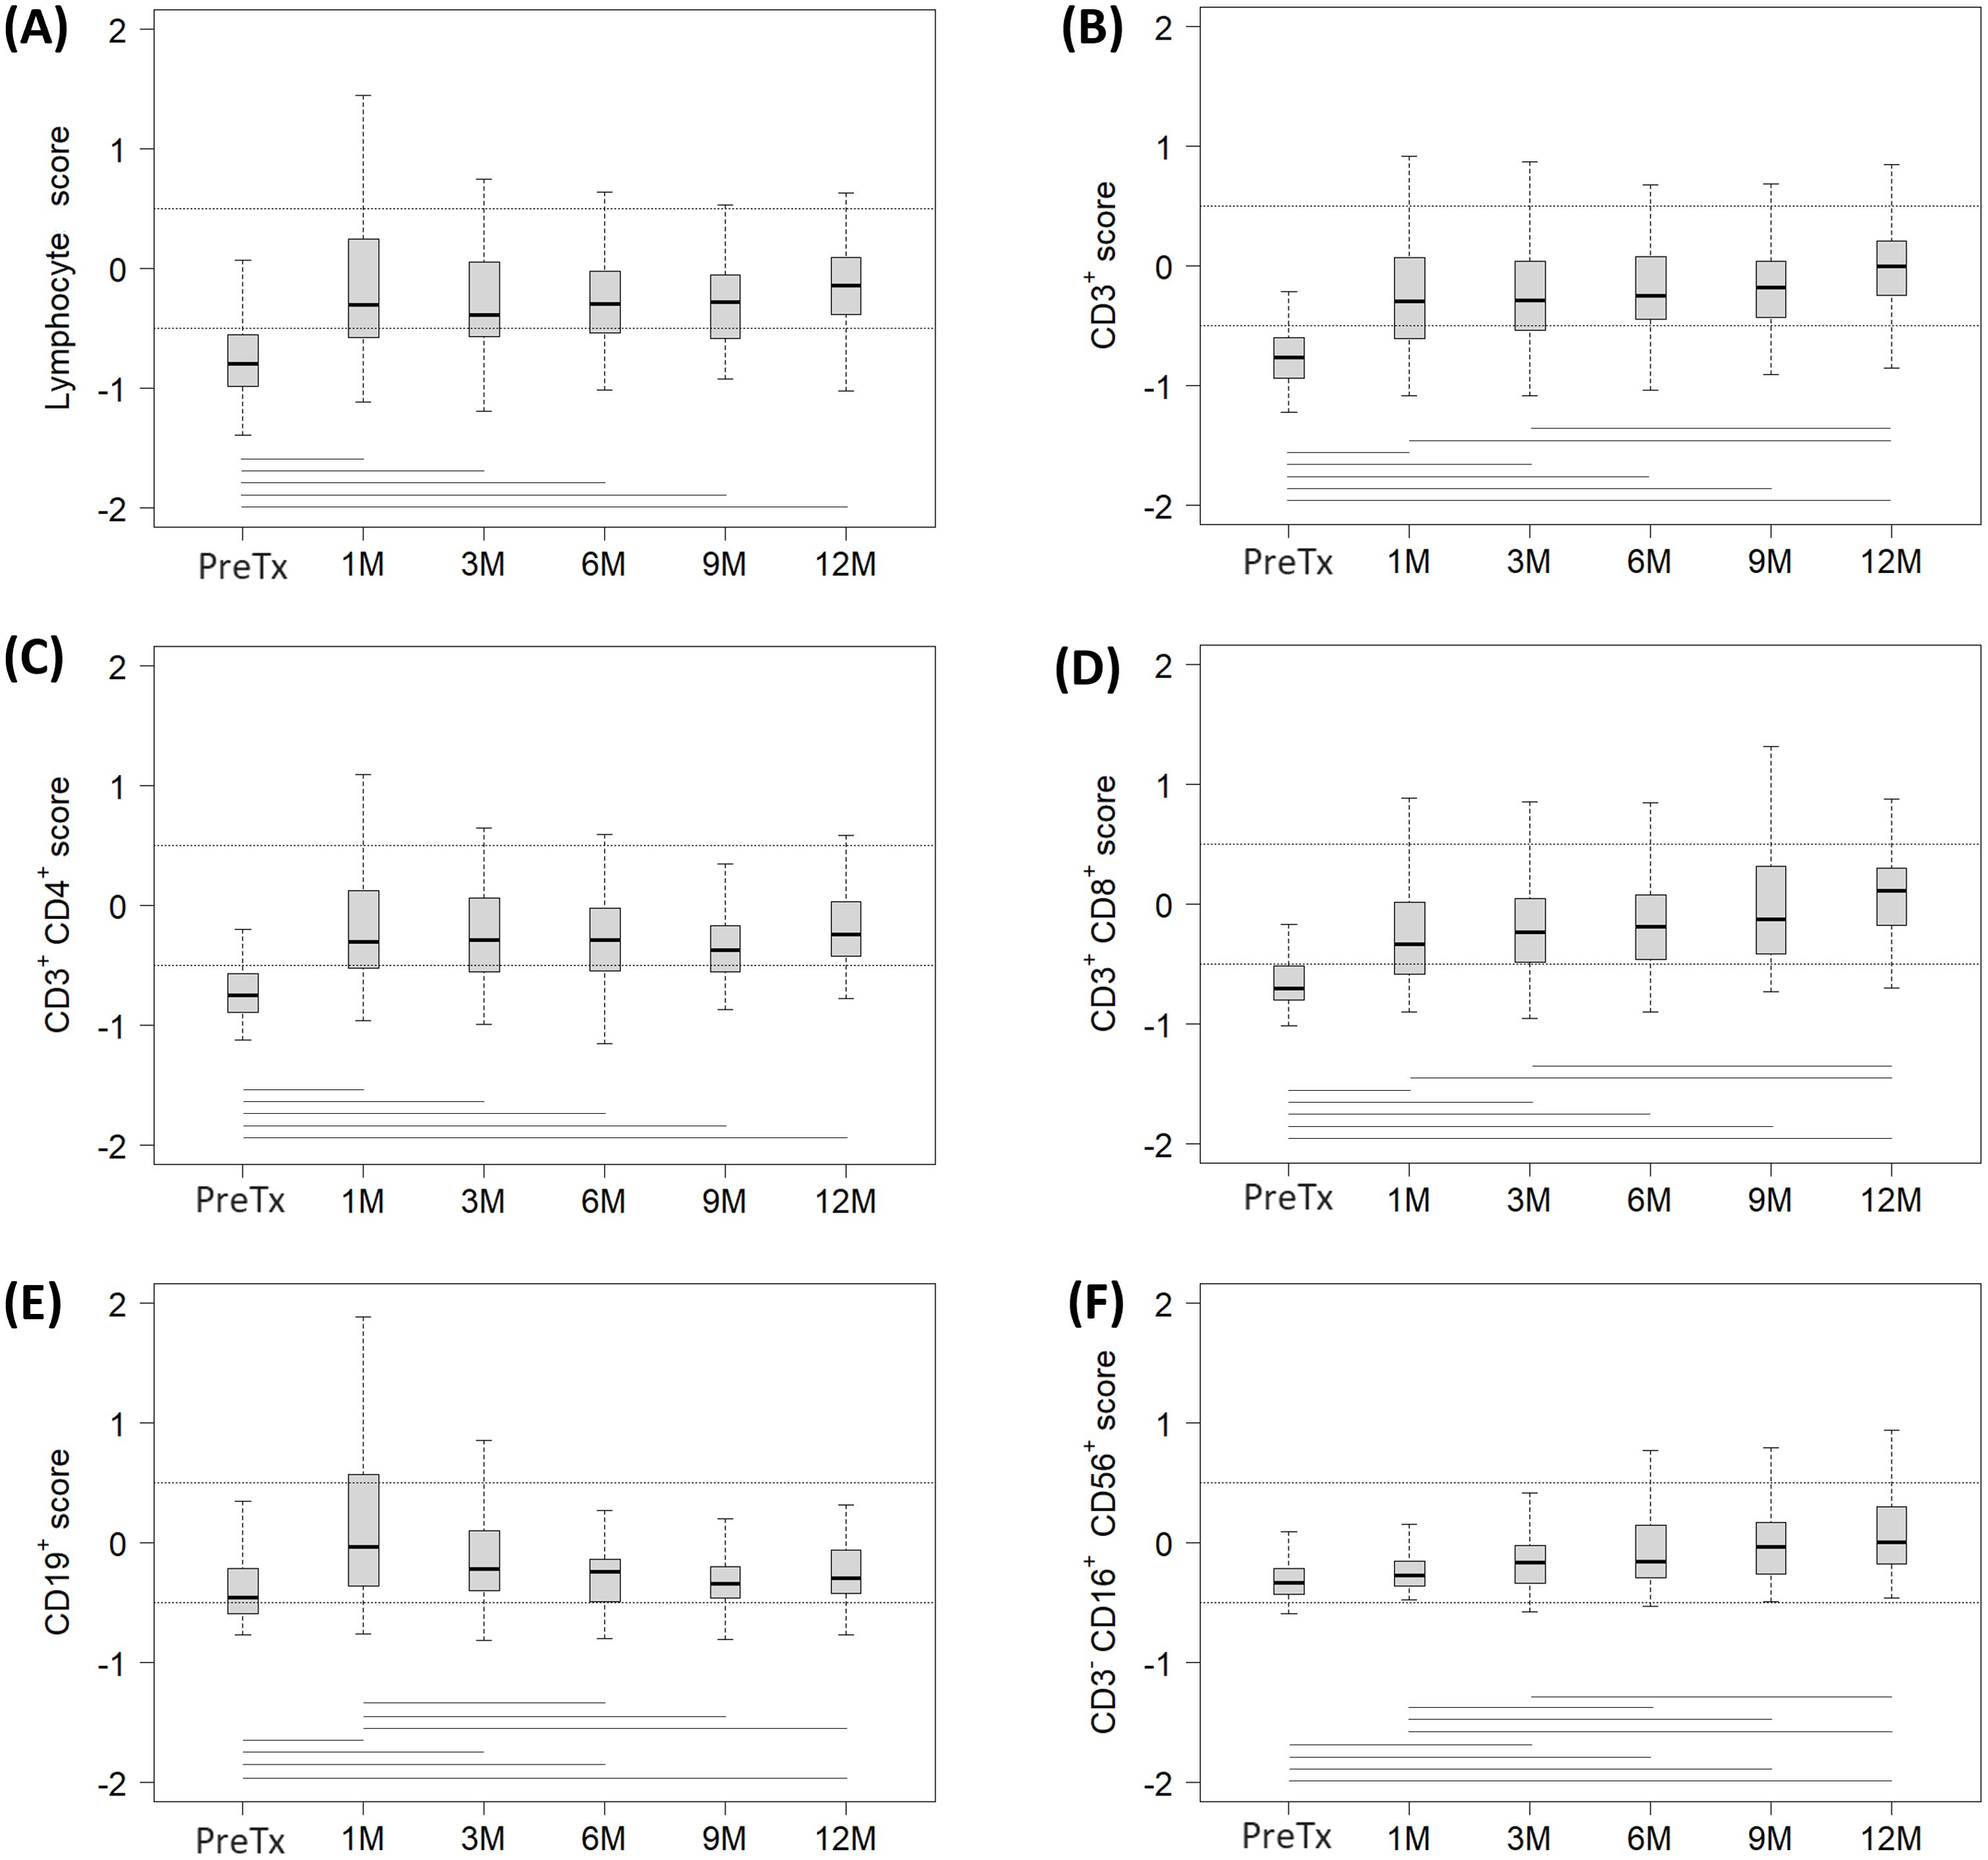
Figure 4. Evolution of each lymphocyte subpopulation score in a cohort of pediatric liver recipients across each follow-up period: pre-transplantation (Pre-Tx) and 1, 3, 6, 9 and 12 months post-transplantation (1M, 3M, 6M, 9M and 12M, respectively). Studied subsets included (A) total lymphocytes, (B) CD3+ T lymphocytes, (C) CD3+CD4+ T lymphocytes, (D) CD3+CD8+ T lymphocytes, (E) CD19+ B lymphocytes and (F) CD3-CD16+CD56+ NK lymphocytes. Scores were calculated by substracting the median of the age-specific normal range from the absolute number of lymphocytes in the subpopulation. Dashed lines mark the normal range, defined as scores between -0.5 and 0.5. Horizontal lines represent statistically significant differences between the median scores of two distinct follow-up periods.
CD3+ T lymphocytes at 1M and 3M were significantly lower compared to 12M values (1M -0.30 [-0.60 to 0.07] and 3M -0.30 [-0.54 to 0.04] vs 12M -0.01 [-0.24 to 0.20], p=0.005 and p=0.008, respectively), with the CD3+ T-cell score remaining comparable from 6M onwards. Regarding CD4+ T-cell score, it normalized at 1M and remained stable throughout the follow-up (Figure 4C), with no significant differences observed. Kinetics of the CD8+ T-cell score paralleled those described for CD3+ T lymphocytes (Figure 4D). CD8+ T lymphocytes at 1M and 3M were significantly lower compared to 12M values (1M -0.34 [-0.58 to 0.02] and 3M -0.24 [-0.49 to 0.05] vs 12M 0.11 [-0.18 to 0.30], p<0.001 and p=0.003, respectively). Normalization was observed at 6M, after which the CD8+ T-cell score remained stable.
Regarding B lymphocytes, a significant expansion at 1M was observed (PreTx -0.46 [-0.59 to -0.21] vs 1M -0.04 [-0.36 to 0.57], p<0.001) (Figure 4E), showing values over 0.5 score (lymphocytosis) in 27 (30%) patients at that timepoint. B-cell expansion observed at 1M significantly decreased by 6M (-0.25 [-0.49 to -0.14], p<0.001), when normalization was achieved. From that time onwards, B-cell score remained stable, with no significant differences observed.
The impact of transplantation on NK-cell score appeared less pronounced initially (Figure 4F). Compared to pre-transplant study, a significant increase was detected at 3M (PreTx -0.33 [-0.43 to -0.21] vs 3M -0.17 [-0.34 to -0.02], p<0.001). After 6M, NK-cell scores normalized and remained stable in the following months.
3.4 Evolution of expanded-phenotype cell populations during the first year post-transplantation
Firstly, the decrease in Treg subpopulation at 1M (Table 2) was likely an artifact of the technique, as basiliximab (anti-CD25) used in induction therapy interfered with CD25 detection by flow cytometry. Therefore, 1-month Treg frequencies were excluded from our analysis.
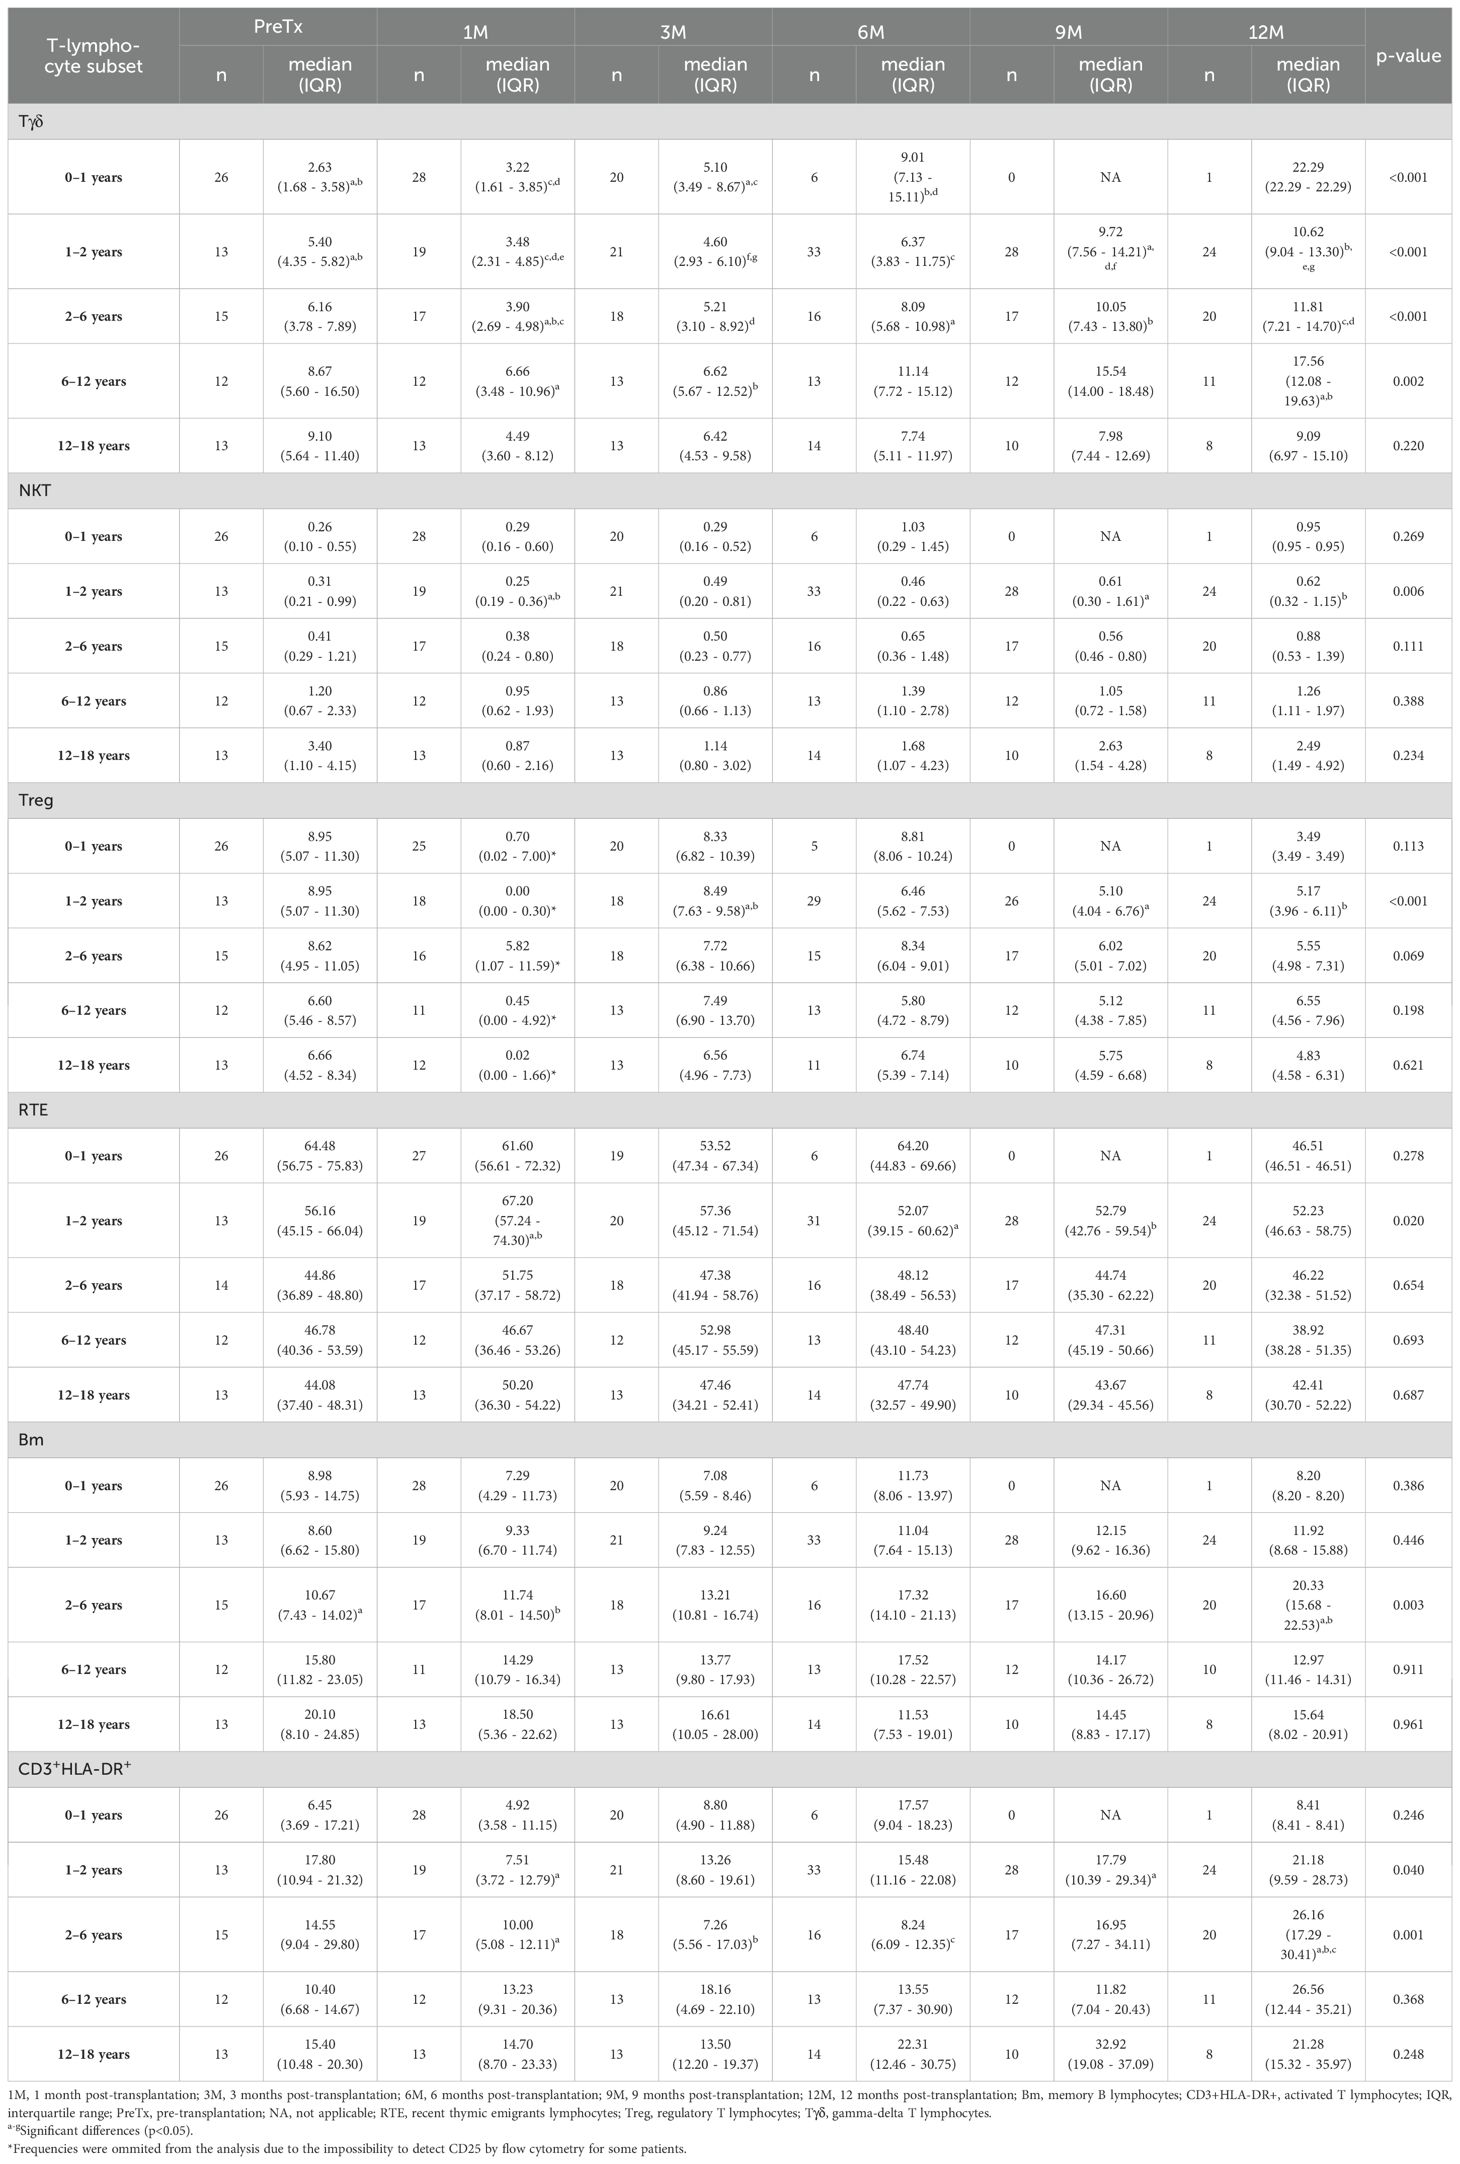
Table 2. Lymphocyte frequencies along the different follow-up periods in a cohort of pediatric liver recipients segregated by age ranges.
Infant patients aged 0–1 year (Table 2) showed a significant increase in Tγδ lymphocyte frequency, rising from 2.63% pre-transplantation and 3.22% at 1M to 5.10% at 3M (p= 0.008 and p =0.001, respectively) and 9.01% at 6M (p=0.015 and p=0.002, respectively). In recipients aged 1–2 years, Tγδ lymphocyte frequency significantly increased from 5.40% pre-transplantation to 9.72% at 9M and 10.62% at 12M (p=0.005 and p=0.003, respectively). This rise was also significant when comparing 1M (3.48%) to 6M (6.37%), 9M and 12M (p=0.008, p<0.001 and p<0.001, respectively), and when comparing 3M (4.60%) to 9M and 12M (p<0.001 for both comparisons).
Regarding NKT lymphocytes in patients aged 1–2 years (Table 2), their frequency increased from 0.25% at 1M to 0.61% at 9M (p= 0.003) and 0.62% at 12M (p=0.006). Conversely, Treg frequency decreased from 8.49% at 3M to 5.10% at 9M (p<0.001) and 5.17% at 12M (p<0.001), while the frequency of RTE declined from 67.20% at 1M to 52.07% at 6M and 52.79% at 9M (p= 0.015 and p= 0.012, respectively). In contrast, activated CD3+HLA-DR+ T lymphocytes showed an increase from 7.51% at 1M to 17.79% at 9M (p=0.023).
Similarly, patients aged 2–6 years increased their Tγδ and CD3+HLA-DR+ subsets throughout the follow-up period (Table 2). Interestingly, frequencies of Bm only showed an increase in that age group, rising from baseline 10.67% and 11.74% at 1M to 20.33% at 12M (p=0.007 and p=0.016, respectively). On the other hand, in older patients aged 6–12 years, only an increase in Tγδ lymphocytes from 6.66% at 1M and 6.62% at 3M to 17.56% at 12M (p=0.009 and p=0.008, respectively) was detected. For recipients aged 12–18 years, the frequencies remained stable throughout the entire follow-up period, with multiple comparisons yielding no significant p-values.
The distribution by age of CD4+ and CD8+ Tn, Teff, Tcm, and Tefm lymphocyte subpopulations throughout the follow-up period remained comparable (Supplementary Figures S1, S2). However, in patients aged from 2–6 years, median frequencies of CD8+ Tn significantly decreased from 1M to 12M (75.61% vs 54.20%, p=0.012). Conversely, CD8+ Teff and Tefm subsets in this age group significantly increased in the same period (CD8+ Teff 1.71% vs 11.34%, p=0.005; CD8+ Tefm 3.81% vs 10.00%, p=0.010) (Supplementary Figure S2).
3.5 Association of T-cell lymphopenia and hypogammaglobulinemia with the risk of infection
When segregated according to the time of infection (early/late), statistical analysis showed that infected patients were significantly younger at transplant and primarily received split grafts (Table 1). To better assess immunological parameters post-transplantation, we subtracted each subpopulation score from pre-transplant study to the one obtained at 1M (Δscore). The higher the Δscore, the better the normalization of lymphocyte subpopulations. Patients that remained free from late infections had higher Δscore for T CD3+ (0.524 vs 0.263, p=0.018) and T CD4+ (0.452 vs 0.287, p=0.036) than those who developed late infections (Table 3). Interestingly, T CD8+ Δscore was also higher in non-infected patients, although this increase nearly reached statistical significance (0.483 vs 0.178, p=0.054).
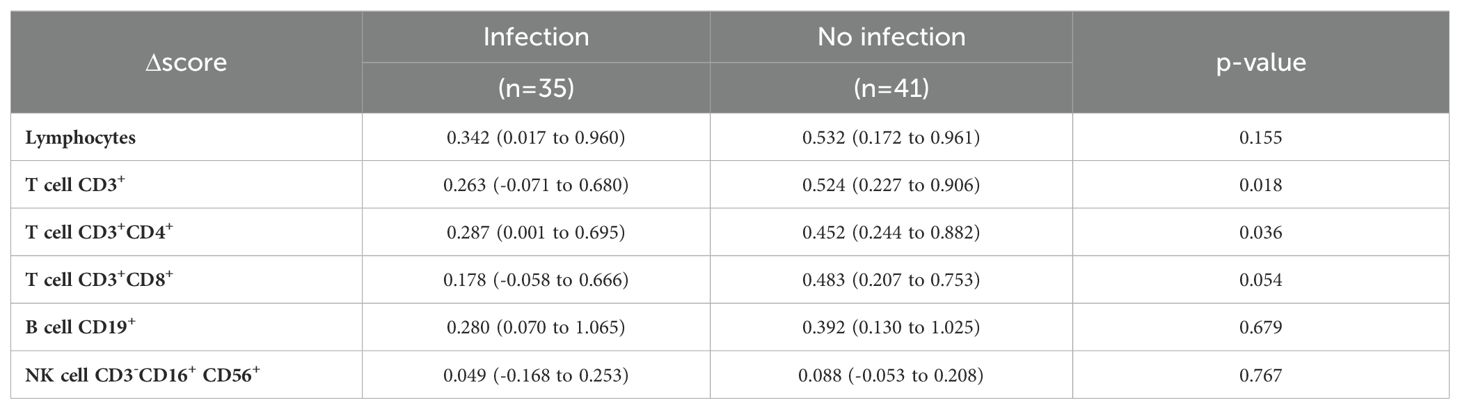
Table 3. Estimation of cellular immunity recovery following pediatric liver transplantation calculated by differences between pre-transplant score and 1-month post-transplant score (Δscore).
Subsequently, a survival analysis was performed to explore the relationship between pre-transplant immunological status and the risk of early infections (Table 4). The univariate analysis identified a significant association between the risk of post-transplant infections and both the age at transplantation and the type of graft. Patients aged 0–1 years (hazard ratio [HR] 5.23, p=0.027) or 1–2 years (HR 5.29, p=0.034) had a significantly higher risk of infection. Transplantation using a split graft was associated with a threefold risk for infection (HR 3.02, p=0.071), although this correlation was not statistically significant in the univariate analysis. None of the immunological variables analyzed were associated with the risk of early infection. Interestingly, in the multivariate analysis, only transplantation with a split graft was independently associated with an increased risk of early infection (HR 3.42, p=0.047).
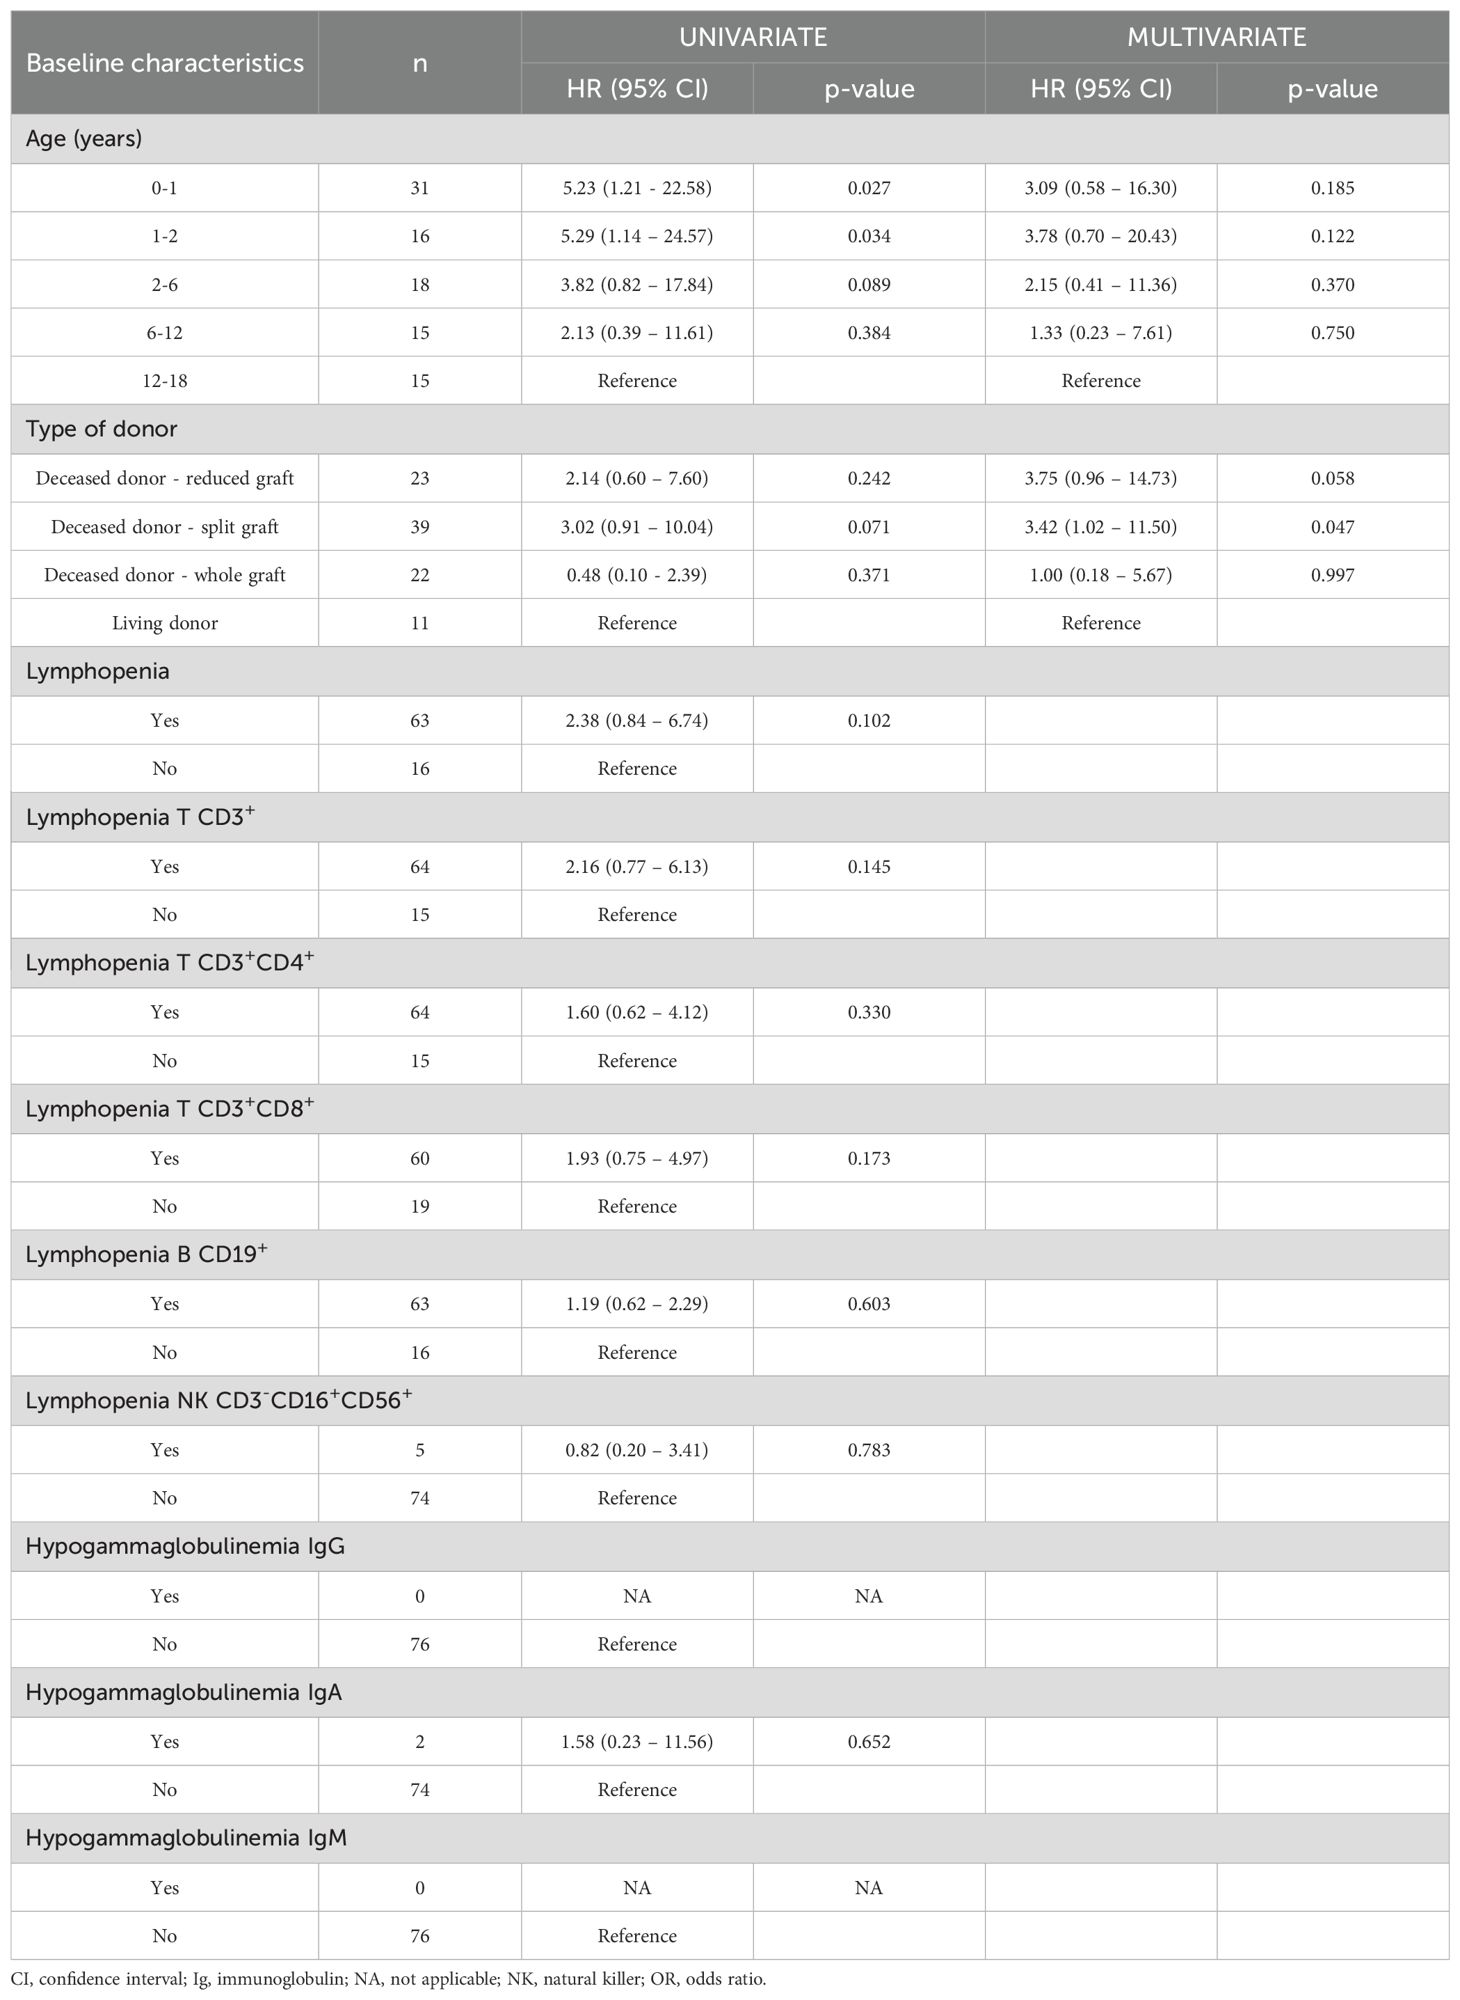
Table 4. Early infection univariate and multivariate analysis in a cohort of pediatric liver recipients categorized by their immune status of lymphopenia or hypogammaglobulinemia pre-transplantation.
We next analyzed how immune status at 1M influenced the likelihood of remaining free from late infection (Table 5). The univariate model revealed that infants aged 0–1 years had a significantly higher risk of late infection (HR 3.49, p=0.046). Conversely, patients who received a whole graft from deceased donor had a significantly lower risk (HR 0.28, p=0.044). In terms of immunological status, CD3+ or CD8+ T lymphopenia (HR 2.48, p=0.005 and HR 2.38, p=0.008, respectively) and hypogammaglobulinemia (IgG, IgA or IgM), were associated with a higher risk of late infection (HR 2.18, p=0.036 and HR 2.40, p=0.011 and HR 2.61, p=0.006, respectively). The multivariate model showed that only lymphopenia T CD3+ was independently associated with an increased risk of late infection (HR 2.13, p=0.030). Kaplan-Meier curves for patients with or without T lymphopenia are graphed in Figure 5. Patients with CD3+ T lymphopenia showed significantly higher infection rates after the first month post-transplantation (p=0.005) (Figure 5A). While CD4+ T lymphopenia did not show a statistically significant association with infection rates (Figure 5B), the presence of CD8+ T lymphopenia was significantly associated with higher infection rates, highlighting the differential impact of T-cell subsets on infection risk (Figure 5C).
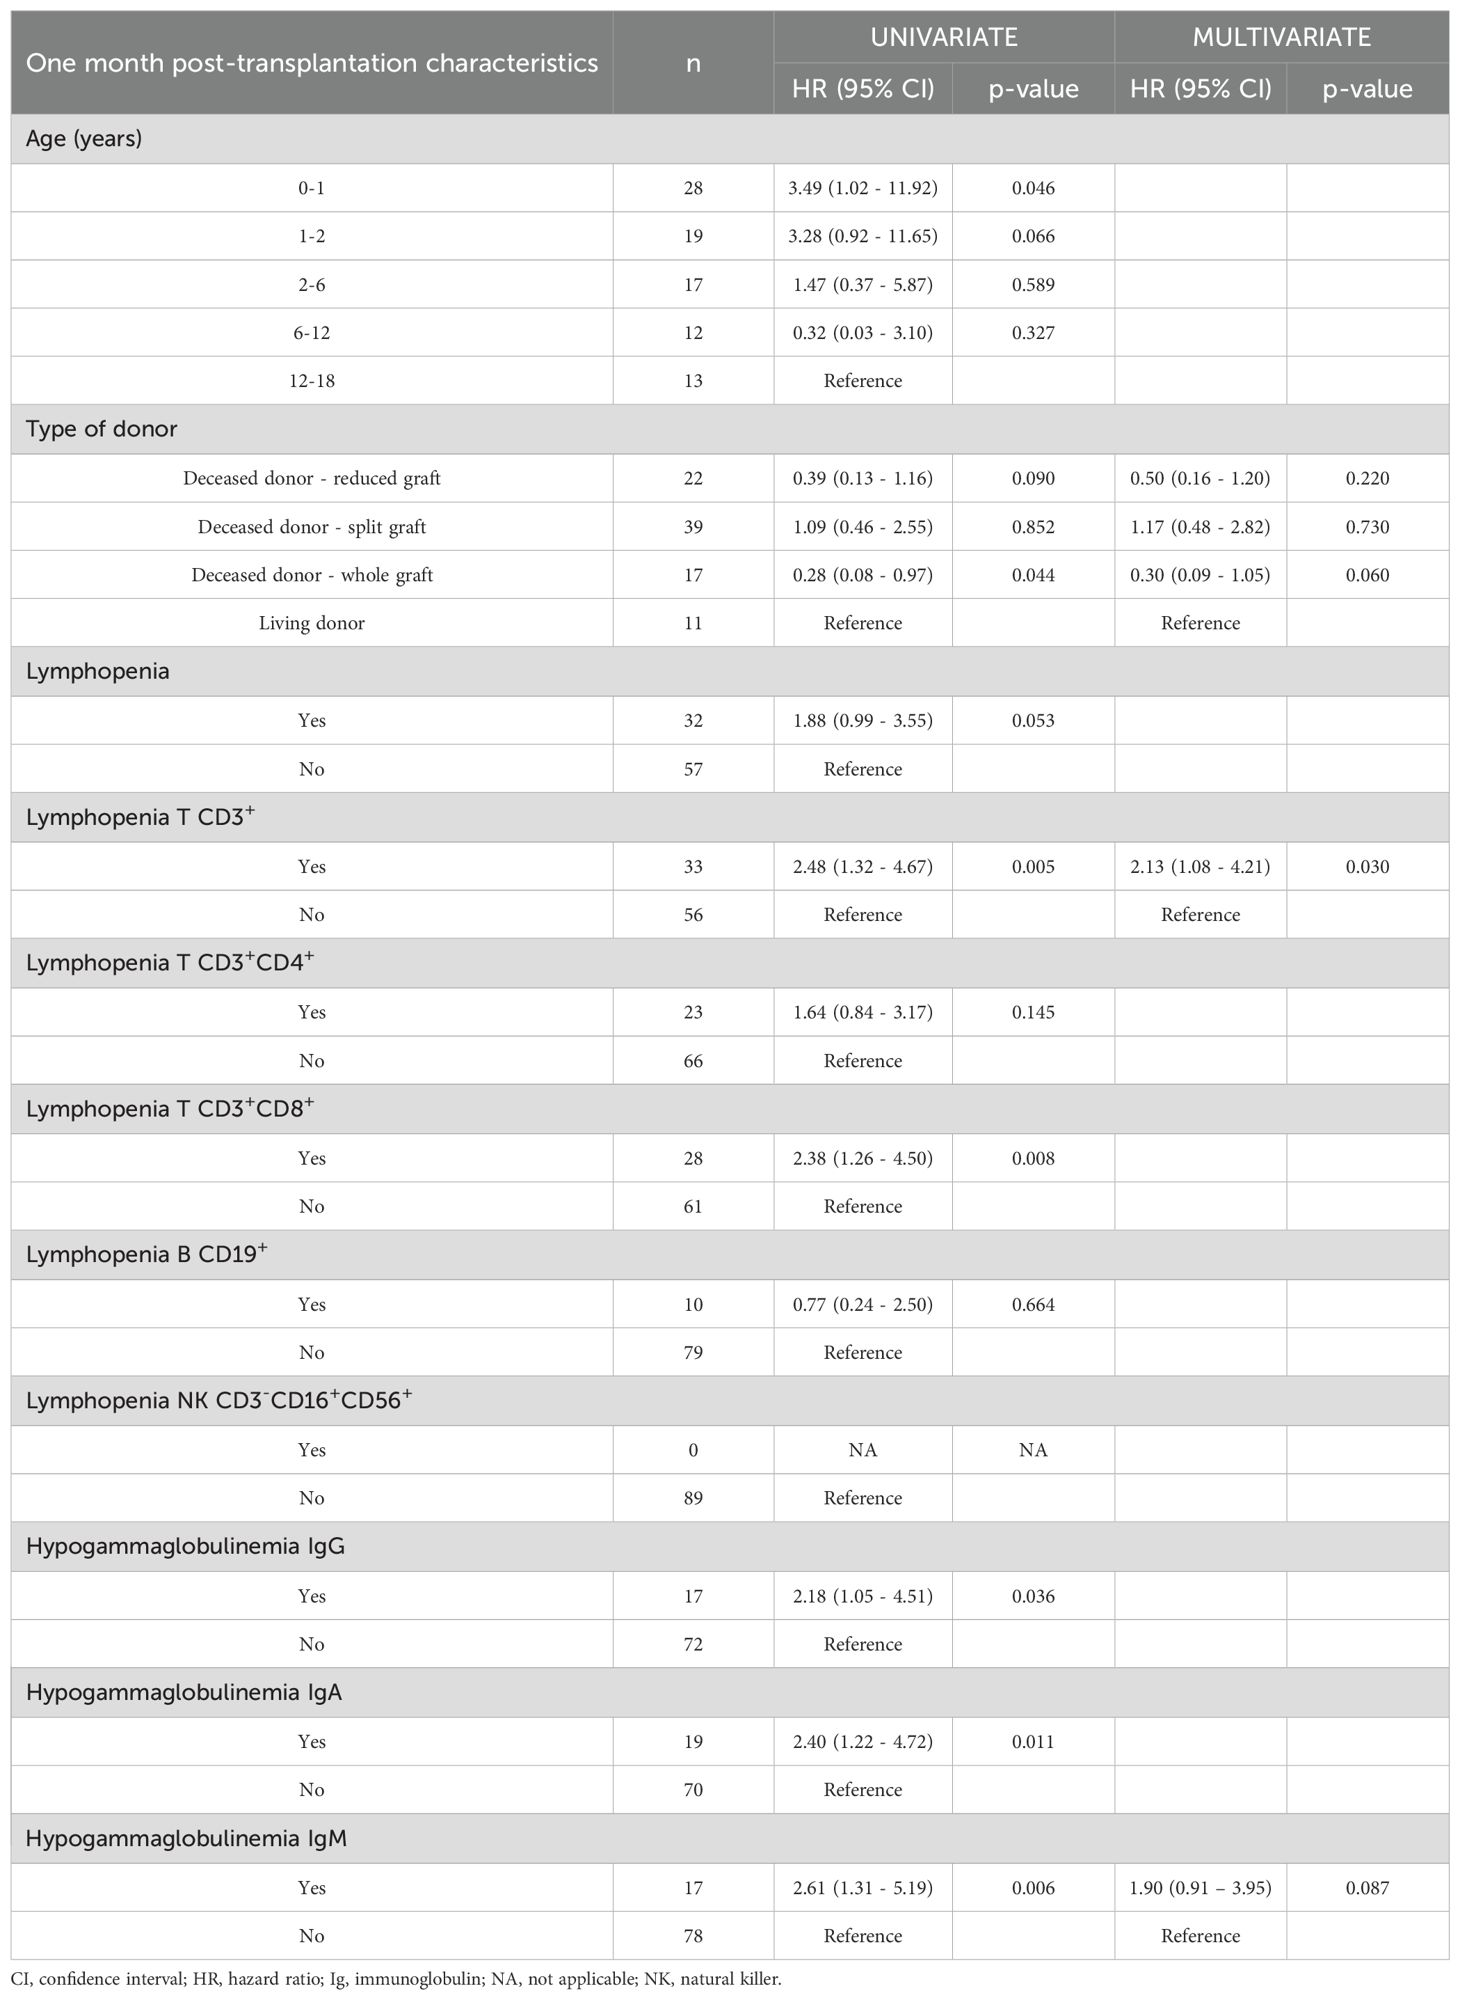
Table 5. Late infection univariate and multivariate analysis in a cohort of pediatric liver recipients categorized by their immune status of lymphopenia or hypogammaglobulinemia at one month post-transplantation.
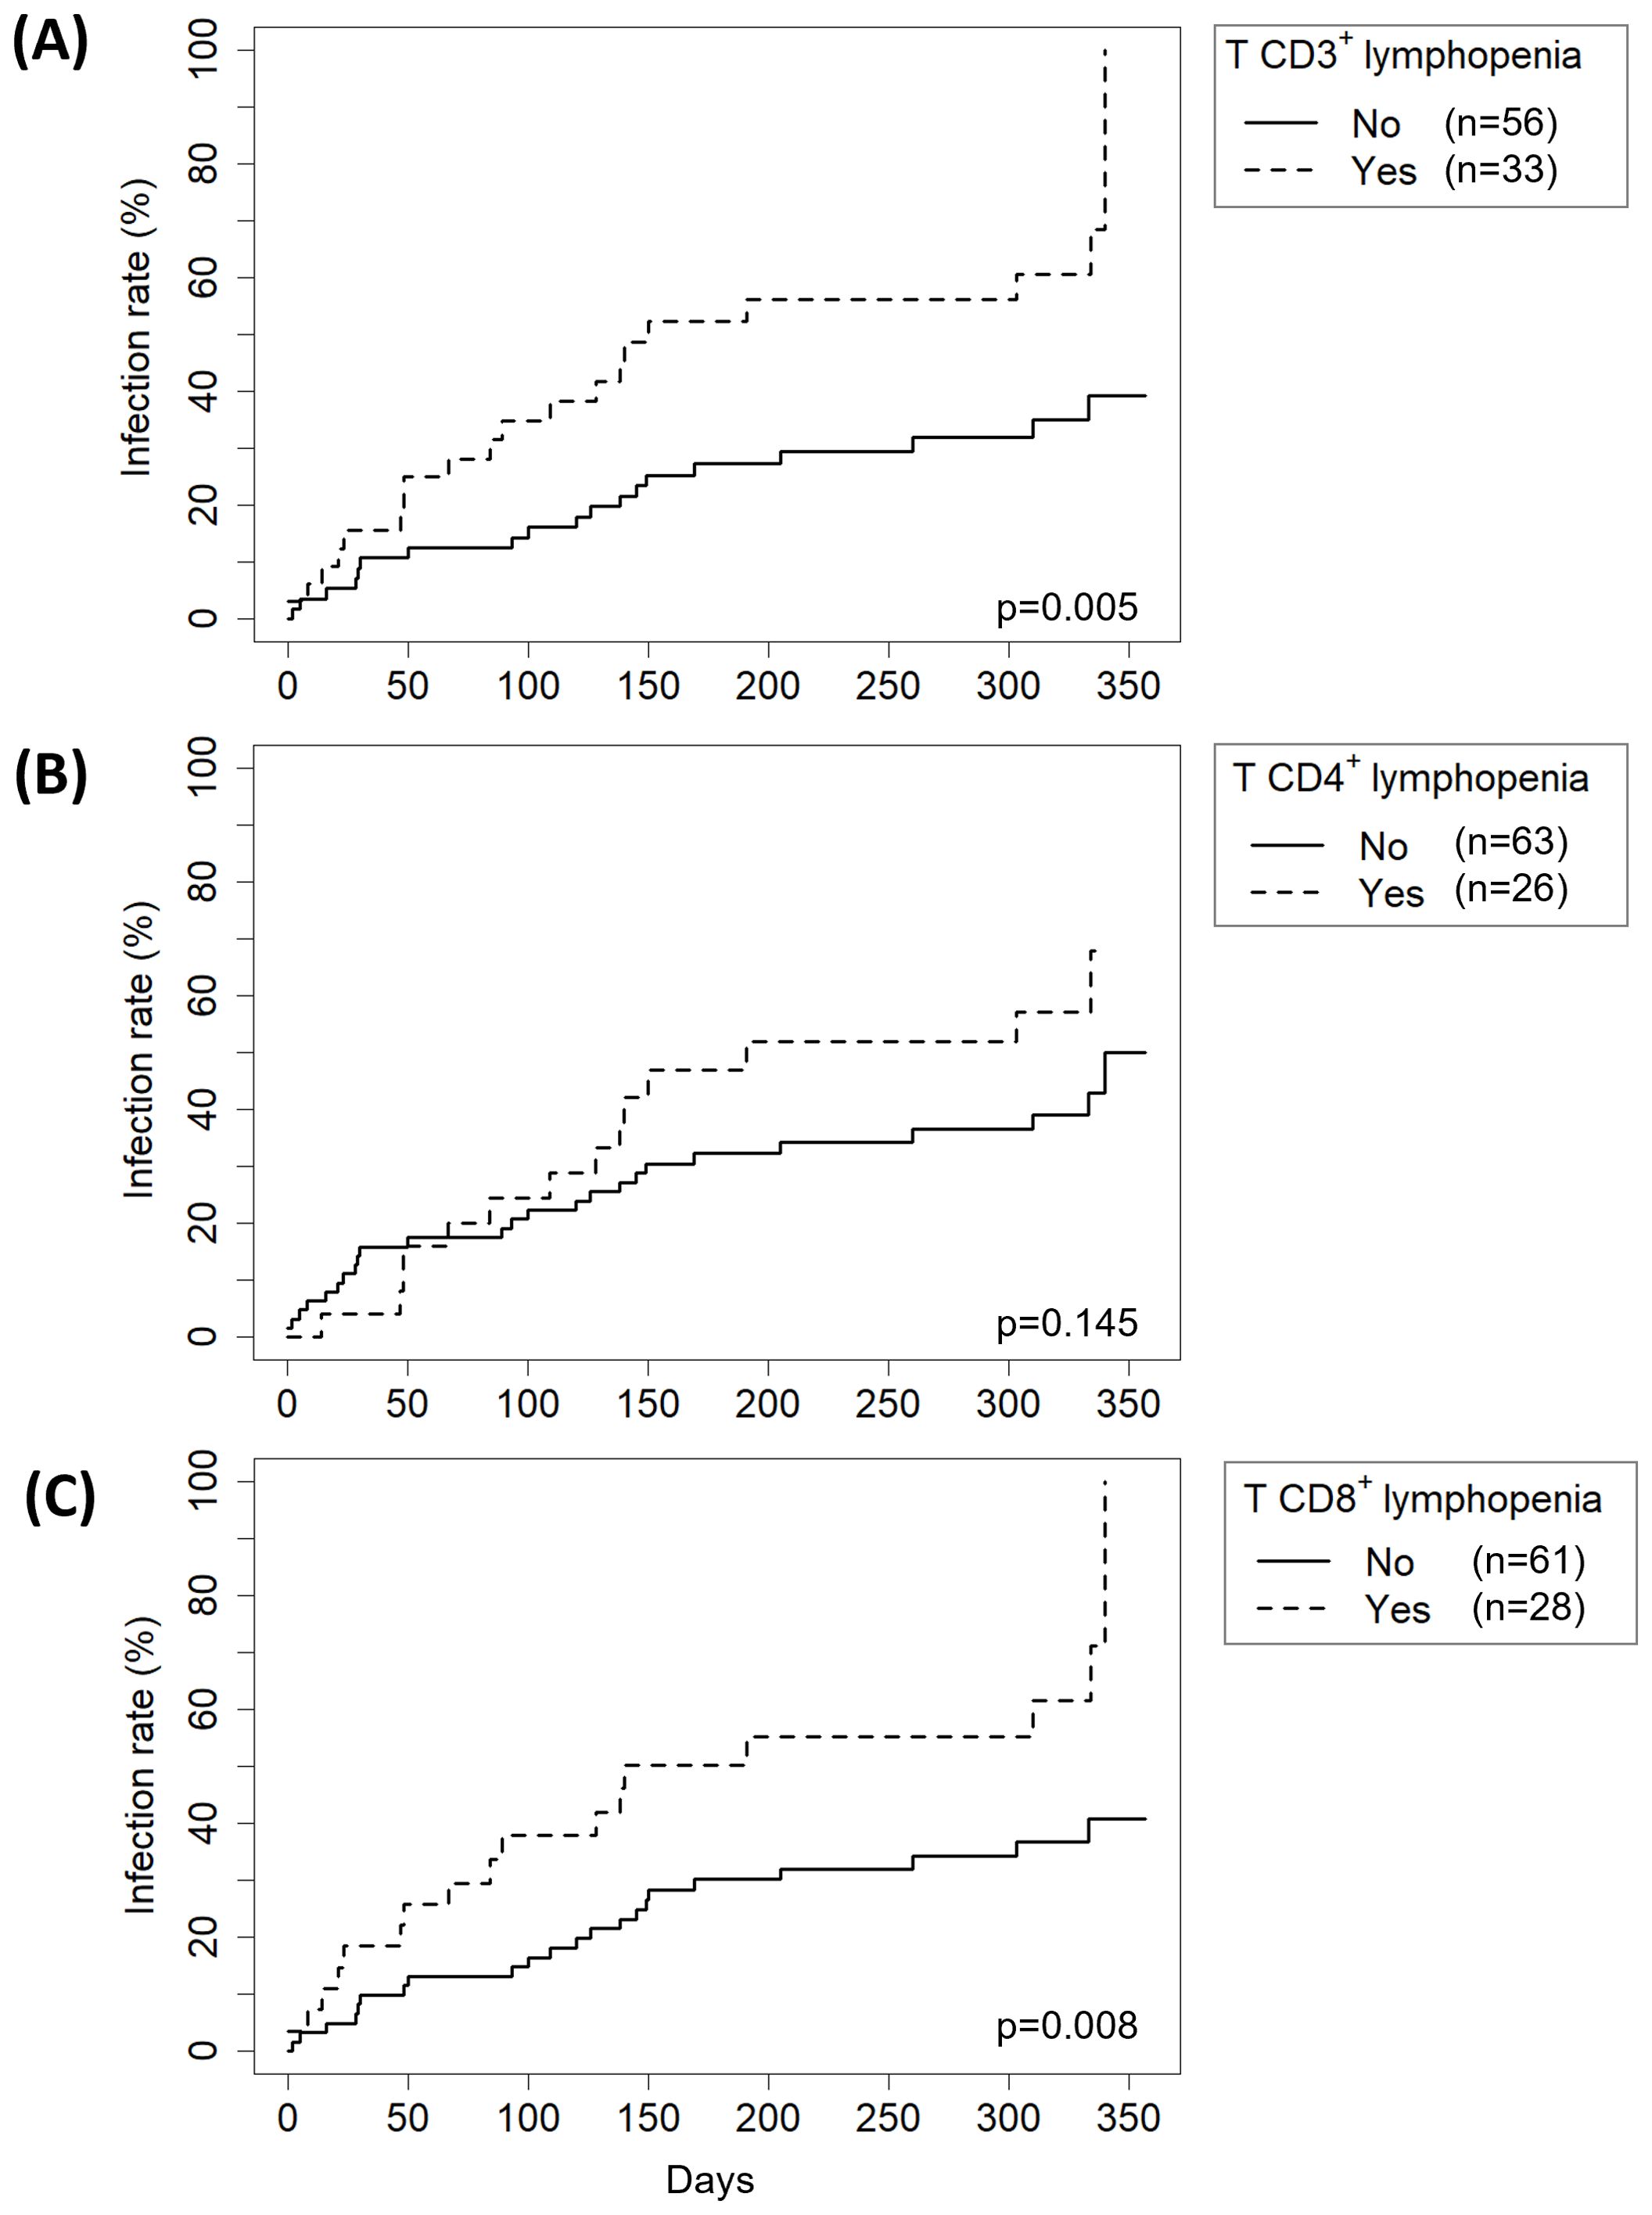
Figure 5. Effect of the presence of (A) T CD3+ T lymphopenia, (B) CD4+ T lymphopenia or (C) CD8+ T lymphopenia on late infection risk. Global p-values were obtained at 1 month post-transplantation by Kaplan-Meier analysis.
Furthermore, we stratified patients into four groups based on IgG levels and CD3+ T-cell counts at 1M: normal IgG/normal CD3+ (n=50), normal IgG/CD3+ T lymphopenia (n=22), IgG hypogammaglobulinemia/normal CD3+ (n=6) and IgG hypogammaglobulinemia/CD3+ T lymphopenia (n=11). The risk of late infection was significantly higher in patients with normal IgG/CD3+ T lymphopenia (HR 3.03, 95% CI 1.46–6.30, p=0.003), IgG hypogammaglobulinemia/normal CD3+ (HR 4.16, 95% CI 1.36–12.74, p=0.013) and IgG hypogammaglobulinemia/CD3+ T lymphopenia (HR 2.86, 95% CI 1.10–7.44, p=0.031), compared to the normal IgG/normal CD3+ group.
4 Discussion
This study aimed to define the immune changes in pediatric LT and identify markers related to post-transplant complications. Our findings revealed that baseline T lymphopenia and first-month post-transplant IgG hypogammaglobulinemia mostly recover early in the follow-up. Additionally, patients with T CD3+ lymphopenia at 1M have a twofold increased risk of late infections.
In our cohort, end-stage liver disease negatively impacted the cellular compartment. Although the detrimental effect of biliary atresia on cellular immunity has been previously described (24), we found no association when comparing baseline immune scores of patients grouped by their underlying diagnosis (Supplementary Table S4). However, in line with previous results published by Möhring et al. (25), patients with liver tumors had the highest numbers of lymphocytes when adjusted for age (median score -0.63 [-0.89 to -0.37]). In a cohort of 60 adult patients with cirrhosis T CD4+ lymphopenia was observed (26), attributing it to defective lymphocyte production, splenic pooling and apoptosis from bacterial translocation. This may help understanding the variations in immune pre-transplant status within our cohort.
LT differently affected humoral and cellular immunity. Humoral immunity was negatively affected by LT, since patients who did not have hypogammaglobulinemia prior to the transplant developed it after receiving the graft. Our results are consistent with previous findings in pediatric liver recipients (14, 27), and are likely due to the excessive loss of immunoglobulin-rich ascitic serum during surgery. However, the effect of the immunosuppressive treatment should also be considered.
Conversely, cellular immunity immediately benefits from LT, as the frequency of patients with total lymphopenia decreased from 78% PreTx to 36% at 1M. In a cohort of 304 adult kidney recipients, lymphocyte subpopulations were analyzed at PreTx, 1M and 6M. Consistent with our results, those without anti-thymocyte globulin induction showed increased T-cell counts at 1M (28).
Our approach focuses on simultaneously monitoring humoral and cellular immunity after LT, allowing us to determine the timepoint at which normalization occurs for each Ig and lymphocyte subpopulation. The number of patients with hypogammaglobulinemia of any isotype began to decrease immediately after 1M. By 12M, only two patients showed IgG hypogammaglobulinemia, both of whom had received rituximab treatment for either PTLD or autoimmune hemolytic anemia. While CD3+ and CD8+ T-cell score normalization occurred at 6M, CD4+ T-cell score normalized at 1M; on the other hand, B-cell and NK-cell scores normalized at 6M. Interestingly, we noticed a remarkable expansion of B cells at 1M, likely compensating for the hypogammaglobulinemia present at that time.
Regarding expanded-phenotype subpopulations, transplantation had a less pronounced impact, since differences with PreTx values were only found for Tγδ lymphocytes in patients aged 0–2 years and Bm lymphocytes in patients 2–6 years old. Further differences appeared at 9M and 12M, likely reflecting age-related changes occurring throughout the follow-up period. This is supported by the absence of significant differences in patients over 12 years, suggesting diminished age-related fluctuations as patients mature. However, stratifying patients by age resulted in a reduced sample size in each subgroup, which may have limited the statistical power to detect additional differences.
Similarly, slight differences appeared in frequencies of Tn, Teff, Tcm and Tefm subsets. As children age, the frequency of Tn cells decreases, while the percentage of Teff, Tefm, and Tcm subpopulations increase, as anticipated (29). However, in patients aged 2–6 years, there was a significant decrease in CD8+ Tn cells and a significant increase in CD8+ Teff and Tefm subsets from 1M onwards, which might be related with cytotoxic immune response to viral late infections at that period.
In our cohort, acute cellular rejection occurred in 6% of patients, lower than previously reported. A 2004 study of 1,092 pediatric LT found a 48.4% incidence, with biopsies confirming 92% of cases (30), while a recent study in 50 pediatric cases reported a 68% incidence, with biopsies conducted at the physician’s discretion (31). The absence of serial biopsies in our cohort may have led to an underestimation of the true incidence, as subacute rejections could have been missed.
Autoimmune and PTLD complications were rare in our cohort. None of the recipients developed either de novo or recurrent AIH, despite reported incidences in pediatric LT of 1-11% (onset at 2–12 years post-LT) (32) and 38-89% (onset at 11–43 months) (33), respectively. Similarly, PTLD was diagnosed in 2% of our recipients, lower than reported incidences of 7.8-9.7% (4, 12). This may be attributed to our relatively short 1-year follow-up period compared to the 4–12 years of follow-up in other studies (4, 12).
Consistent with previous reports, early infections in our cohort were associated with surgery, while late infections resulted from heightened immunosuppression (34, 35). Thus, bacterial infections dominated the first month, whereas opportunistic viral infections become more frequent thereafter, due to prolonged immunosuppressive therapy (34–37). Since most of the studies have focused on adult liver recipient (14–16, 38–40), we specifically monitored the immune status in pediatric recipients to better assess their risk of infections.
Previous research had established that pre-transplant lymphopenia increases infection risk in adult LT (39, 40). Furthermore, Lei et al. found an association between the number of pre-transplant double-negative CD3+CD4-CD8- T-cells and infection risk in a cohort of 19 adult LT (38). However, we did not identify pre-transplant immunological predictors for early infections in pediatric patients. Instead, split graft recipients were at a higher risk of early infections, likely due to increased biliary leakage leading to severe infections (41).
In contrast, we found that T CD3+ lymphopenia at 1M was associated with increased risk of late infections. This is consistent with Fernandez-Ruiz et al., who observed that adult kidney-transplant recipients with T CD8+ lymphopenia had a threefold increased risk of late infections (28). Interestingly, although in our multivariate analysis we did not find an association with hypogammaglobulinemia, other prospective studies have reported that infected adult liver recipients had lower IgG levels at days 3 (15) or 7 (16) post-transplantation. In line with these findings, our stratified analysis revealed that both isolated and combined alterations in IgG levels and CD3+ T-cell counts at 1M were associated with a significantly increased risk of late infections.
Previous studies have shown that lymphopenia is associated with an increased risk of both opportunistic and community-acquired infections. A large Danish cohort study in the general population demonstrated that individuals with lymphopenia had a significantly higher risk of hospital admission with an infection, as well as infection-related mortality (42). Similarly, in patients with solid tumors, radiation-induced lymphopenia has been linked to an elevated risk of bacterial infections (43). These findings support the relevance of peripheral T-cell counts as general markers of immune competence and infection susceptibility.
Beyond the markers explored in this research, assessing immune function could provide additional insights. A prospective study by Sood et al. (n=75) demonstrated that low interferon-gamma production after non-pathogen specific stimulation at week 1 post-transplant was associated with a higher risk of early infections, whereas elevated levels correlated with an increased risk of rejection (44). Incorporating such functional assays alongside markers like CD64 monocyte counts (15) or PD1 exhaustion marker (38) may enhance our ability to predict infection risk.
To our knowledge, this is the first prospective study monitoring the immune response of pediatric liver recipients. The ChilSFree cohort study proposed a similar approach (8), but results are yet to be reported. Based on our findings, we propose that measuring serum Ig levels, T (including CD4+ and CD8+ subsets), B and NK lymphocytes at PreTx, 1M, 6M and 12M provides a comprehensive assessment of immune recovery and identifies late infections risks. To validate these results, future multicenter studies should adopt a standardized protocol across all participating centers. Sample collection timepoints and technical procedures must be harmonized, and inclusion criteria and clinical endpoints unified. Such collaborative efforts would not only confirm the utility of these biomarkers but also support the development of personalized immunosuppression strategies in pediatric liver transplantation.
A key limitation of our study is the low incidence of autoimmune complications, PTLD and rejection, which restricted our ability to identify additional markers. Moreover, the lack of a more detailed classification of infections based on anatomical site and clinical severity limits our ability to accurately differentiate community-acquired infections from those opportunistic infections. Another limitation is the lack of immune function analysis. Thus, further studies with larger cohorts and immune function assessment are necessary to better understand the immunological landscape of post-transplant complications.
In conclusion, we showed that pediatric liver recipients have baseline immune dysregulation that is resolved during the first months after transplantation. While early infections in our cohort did not show significant immunological predictors, late infections appeared to be influenced by T-cell lymphopenia and hypogammaglobulinemia. Our findings highlight potential factors that could guide strategies for managing post-transplant infections. These insights could contribute to more personalized approaches in immunosuppressive therapy.
Data availability statement
The original contributions presented in the study are included in the article/Supplementary Material. Further inquiries can be directed to the corresponding author.
Ethics statement
The studies involving humans were approved by University Hospital La Paz ethics committee. The studies were conducted in accordance with the local legislation and institutional requirements. Written informed consent for participation in this study was provided by the participants’ legal guardians/next of kin.
Author contributions
RC: Methodology, Conceptualization, Data curation, Investigation, Writing – review & editing, Writing – original draft. LM: Writing – review & editing, Investigation, Methodology. CC: Writing – review & editing, Investigation, Conceptualization. IL: Writing – review & editing, Data curation. EF: Writing – review & editing, Conceptualization, Investigation. LH: Writing – review & editing, Investigation, Conceptualization. GM: Investigation, Writing – review & editing. ML: Writing – review & editing, Investigation. AM: Writing – review & editing, Investigation. EL: Conceptualization, Writing – review & editing, Writing – original draft, Supervision, Investigation. ES: Conceptualization, Supervision, Writing – review & editing, Investigation, Writing – original draft.
Funding
The author(s) declare that financial support was received for the research and/or publication of this article. This work was supported by FIS (ISCIII) grant no. PI19-01311. The publication of this study has been funded by “Ayudas Luis Álvarez” promoted by La Paz Institute for Health Research (IdiPAZ).
Acknowledgments
The authors are grateful to all participating patients and their families. They would also like to express their appreciation to Teresa Plaza, Amaya Iturralde, Sergio Ruiz, Natividad Herraiz and Concepción Esteban, for their excellent technical assistance. This study has been funded by Instituto de Salud Carlos III (ISCIII) through the project “PI19-01311” and co-funded by the European Union.
Conflict of interest
The authors declare that the research was conducted in the absence of any commercial or financial relationships that could be construed as a potential conflict of interest.
The author(s) declared that they were an editorial board member of Frontiers, at the time of submission. This had no impact on the peer review process and the final decision.
Generative AI statement
The author(s) declare that no Generative AI was used in the creation of this manuscript.
Publisher’s note
All claims expressed in this article are solely those of the authors and do not necessarily represent those of their affiliated organizations, or those of the publisher, the editors and the reviewers. Any product that may be evaluated in this article, or claim that may be made by its manufacturer, is not guaranteed or endorsed by the publisher.
Supplementary material
The Supplementary Material for this article can be found online at: https://www.frontiersin.org/articles/10.3389/fimmu.2025.1605716/full#supplementary-material
Supplementary Figure 1 | Distribution of CD4+ T naïve (Tn), effector (Teff), central memory (Tcm) and effector memory (Tefm) subsets in a cohort of pediatric liver recipients grouped by age ranges across each follow-up period: pre-transplantation (PreTx) and 1, 3, 6, 9 and 12 months post-transplantation (1M, 3M, 6M, 9M and 12M, respectively).
Supplementary Figure 2 | Distribution of CD8+ T naïve (Tn), effector (Teff), central memory (Tcm) and effector memory (Tefm) subsets in a cohort of pediatric liver recipients grouped by age ranges across each follow-up period: pre-transplantation (PreTx) and 1, 3, 6, 9 and 12 months post-transplantation (1M, 3M, 6M, 9M and 12M, respectively).
References
1. Adams DH, Sanchez-Fueyo A, and Samuel D. From immunosuppression to tolerance. J Hepatol. (2015) 62:S170–85. doi: 10.1016/j.jhep.2015.02.042
2. Adam R, Karam V, Delvart V, O’Grady J, Mirza D, Klempnauer J, et al. Evolution of indications and results of liver transplantation in Europe. A report from the European Liver Transplant Registry (ELTR). J Hepatol. (2012) 57:675–88. doi: 10.1016/j.jhep.2012.04.015
3. Ghelichi-Ghojogh M, Rajabi A, Mohammadizadeh F, Shojaie L, Vali M, Afrashteh S, et al. Survival Rate of Liver Transplantation in Asia: A Systematic Review and Meta-Analysis. Iran J Public Health. (2022) 51:2207–20. doi: 10.18502/ijph.v51i10.10979
4. Jain A, Mazariegos G, Kashyap R, Kosmach-Park B, Starzl TE, Fung J, et al. Pediatric liver transplantation: A Single Center Experience Spanning 20 Years1. Transplantation. (2002) 73:941–7. doi: 10.1097/00007890-200203270-00020
5. Jara P and Hierro L. Trasplante hepático infantil. Resultados a largo plazo. Gastroenterología y Hepatología. (2010) 33:398–410. doi: 10.1016/j.gastrohep.2009.11.004
6. Singer A, Locke JE, and Singer A. Evolving concepts in the selection of immunosuppression regimen for liver transplant recipients. HMER. (2011) 3(3):53-62. doi: 10.2147/HMER.S13682
7. Baumann U, Karam V, Adam R, Fondevila C, Dhawan A, Sokal E, et al. Prognosis of children undergoing liver transplantation: A 30-year European study. Pediatrics. (2022) 150:e2022057424. doi: 10.1542/peds.2022-057424
8. Goldschmidt I, Karch A, Mikolajczyk R, Mutschler F, Junge N, Pfister ED, et al. Immune monitoring after pediatric liver transplantation – the prospective ChilSFree cohort study. BMC Gastroenterol. (2018) 18:63. doi: 10.1186/s12876-018-0795-x
9. Zarrinpar A and Busuttil RW. Immunomodulating options for liver transplant patients. Expert Rev Clin Immunol. (2012) 8:565–78. doi: 10.1586/eci.12.47
11. Lefaucheur C, Louis K, Morris AB, Taupin JL, Nickerson P, Tambur AR, et al. Clinical recommendations for posttransplant assessment of anti–HLA (Human Leukocyte Antigen) donor-specific antibodies: A Sensitization in Transplantation: Assessment of Risk consensus document. Am J Transplantation. (2023) 23:115–32. doi: 10.1016/j.ajt.2022.11.013
12. Baker A, Frauca Remacha E, Torres Canizales J, Bravo-Gallego LY, Fitzpatrick E, Alonso Melgar A, et al. Current practices on diagnosis, prevention and treatment of post-transplant lymphoproliferative disorder in pediatric patients after solid organ transplantation: results of ERN transplantChild healthcare working group survey. Children. (2021) 8:661. doi: 10.3390/children8080661
13. Cuesta-Martín de la Cámara R, Torices-Pajares A, Miguel-Berenguel L, Reche-Yebra K, Frauca-Remacha E, Hierro-Llanillo L, et al. Epstein-Barr virus-specific T-cell response in pediatric liver transplant recipients: a cross-sectional study by multiparametric flow cytometry. Front Immunol. (2024) 15:1479472. doi: 10.3389/fimmu.2024.1479472
14. Fukui S, Hidaka M, Fukui S, Morimoto S, Hara T, Soyama A, et al. The contribution of serum complement component 3 levels to 90-day mortality in living donor liver transplantation. Front Immunol. (2021) 12:652677. doi: 10.3389/fimmu.2021.652677
15. Iovino L, Taddei R, Bindi ML, Morganti R, Ghinolfi D, Petrini M, et al. Clinical use of an immune monitoring panel in liver transplant recipients: A prospective, observational study. Transplant Immunol. (2019) 52:45–52. doi: 10.1016/j.trim.2018.11.001
16. Carbone J, Micheloud D, Salcedo M, Rincon D, Bañares R, Clemente G, et al. Humoral and cellular immune monitoring might be useful to identify liver transplant recipients at risk for development of infection. Transplant Infect Dis. (2008) 10:396–402. doi: 10.1111/j.1399-3062.2008.00329.x
17. Simon AK, Hollander GA, and McMichael A. Evolution of the immune system in humans from infancy to old age. Proc R Soc B. (2015) 282:20143085. doi: 10.1098/rspb.2014.3085
18. Shaw ER and Su HC. The influence of immune immaturity on outcome after virus infections. J Allergy Clin Immunol Pract. (2021) 9:641–50. doi: 10.1016/j.jaip.2020.11.016
19. Díaz Fernández C, Gámez Arance M, de la Vega Bueno A, and Frauca Remacha E. Trasplante hepático pediátrico: indicaciones, técnicas quirúrgicas, complicaciones y tratamiento. Anales Pediatría. (2004) 60:42–55. doi: 10.1016/S1695-4033(04)78216-8
20. Van Delden C, Stampf S, Hirsch HH, Manuel O, Meylan P, Cusini A, et al. Burden and timeline of infectious diseases in the first year after solid organ transplantation in the Swiss transplant cohort study. Clin Infect Diseases. (2020) 71:e159–69. doi: 10.1093/cid/ciz1113
21. Demetris AJ, Bellamy C, Hübscher SG, O’Leary J, Randhawa PS, Feng S, et al. 2016 Comprehensive update of the Banff working group on liver allograft pathology: introduction of antibody-mediated rejection. Am J Transplant. (2016) 16:2816–35. doi: 10.1111/ajt.13909
22. Shearer WT, Rosenblatt HM, Gelman RS, Oyomopito R, Plaeger S, Stiehm ER, et al. Lymphocyte subsets in healthy children from birth through 18 years of age. J Allergy Clin Immunol. (2003) 112:973–80. doi: 10.1016/j.jaci.2003.07.003
23. Rich RR, Fleisher TA, Schroeder HW, Weyand CM, Corry DB, and Puck J eds. Clinical immunology: principles and practice. Sixth edition. Amsterdam, The Netherlands: Elsevier (2023). 1279 p.
24. Pawlowska J, Michalkiewicz J, Czubkowski P, Jankowska I, Teisseyre M, Socha P, et al. Reduction of naive CD4/CD45RA+ T cells in children with biliary atresia before and after liver transplantation. Transplant Proc. (2003) 35:3026–8. doi: 10.1016/j.transproceed.2003.10.088
25. Möhring T, Karch A, Falk CS, Laue T, D’Antiga L, Debray D, et al. Immune status in children before liver transplantation—A cross-sectional analysis within the chilsSFree multicentre cohort study. Front Immunol. (2019) 10:52. doi: 10.3389/fimmu.2019.00052
26. Lario M, Muñoz L, Ubeda M, Borrero MJ, Martínez J, Monserrat J, et al. Defective thymopoiesis and poor peripheral homeostatic replenishment of T-helper cells cause T-cell lymphopenia in cirrhosis. J Hepatol. (2013) 59:723–30. doi: 10.1016/j.jhep.2013.05.042
27. Mozer-Glassberg Y, Shamir R, Steinberg R, Kadmon G, Har-Lev E, Mor E, et al. Hypogammaglobulinemia in the early period after liver transplantation in children. Clin Transplant. (2013) 27:E289-294. doi: 10.1111/ctr.12116
28. Fernández-Ruiz M, López-Medrano F, Allende LM, Andrés A, García-Reyne A, Lumbreras C, et al. Kinetics of peripheral blood lymphocyte subpopulations predicts the occurrence of opportunistic infection after kidney transplantation. Transpl Int. (2014) 27:674–85. doi: 10.1111/tri.2014.27.issue-7
29. Garcia-Prat M, Álvarez-Sierra D, Aguiló-Cucurull A, Salgado-Perandrés S, Briongos-Sebastian S, Franco-Jarava C, et al. Extended immunophenotyping reference values in a healthy pediatric population. Cytometry Part B Clinical. (2019) 96:223–33. doi: 10.1002/cyto.b.21728
30. Martin SR, Atkison P, Anand R, Lindblad AS, and SPLIT Research Group. Studies of Pediatric Liver Transplantation 2002: patient and graft survival and rejection in pediatric recipients of a first liver transplant in the United States and Canada. Pediatr Transpl. (2004) 8:273–83. doi: 10.1111/j.1399-3046.2004.00152.x
31. Goldschmidt I, Chichelnitskiy E, Rübsamen N, Jaeger VK, Karch A, D’Antiga L, et al. Diagnosing acute cellular rejection after paediatric liver transplantation—Is there room for interleukin profiles? Children. (2023) 10:128. doi: 10.3390/children10010128
32. Kerkar N and Yanni G. De novo” and “recurrent” autoimmune hepatitis after liver transplantation: A comprehensive review. J Autoimmun. (2016) 66:17–24. doi: 10.1016/j.jaut.2015.08.017
33. Liberal R, Vergani D, and Mieli-Vergani G. Recurrence of autoimmune liver disease and inflammatory bowel disease after pediatric liver transplantation. Liver Transpl. (2016) 22:1275–83. doi: 10.1002/lt.24490
34. Taddei R, Riccardi N, Tiseo G, Galfo V, and Biancofiore G. Early intra-abdominal bacterial infections after orthotopic liver transplantation: A narrative review for clinicians. Antibiotics (Basel). (2023) 12:1316. doi: 10.3390/antibiotics12081316
35. Kim YJ, Kim SI, Wie SH, Kim YR, Hur JA, Choi JY, et al. Infectious complications in living-donor liver transplant recipients: a 9-year single-center experience. Transpl Infect Dis. (2008) 10:316–24. doi: 10.1111/j.1399-3062.2008.00315.x
36. Righi E. Management of bacterial and fungal infections in end stage liver disease and liver transplantation: Current options and future directions. World J Gastroenterol. (2018) 24:4311–29. doi: 10.3748/wjg.v24.i38.4311
37. Camacho PMP, Osorio VB, Cárdenas DFC, García MAA, Tarapués EM, Torres-Cánchala L, et al. Infectious complications in pediatric patients after liver transplantation in the first 3 months at the Fundación Valle del Lili, a Latin American transplant center. J Liver Transplantation. (2024) 15:100221. doi: 10.1016/j.liver.2024.100221
38. Lei H, Tian M, Zhang X, Liu X, Wang B, Wu R, et al. Expansion of double-negative T cells in patients before liver transplantation correlates with post-transplant infections. JCM. (2022) 11:3502. doi: 10.3390/jcm11123502
39. Fernández-Ruiz M, López-Medrano F, Romo EM, Allende LM, Meneu JC, Fundora-Suárez Y, et al. Pretransplant lymphocyte count predicts the incidence of infection during the first two years after liver transplantation: Pretransplant Lymphocyte Count and Infection. Liver Transpl. (2009) 15:1209–16. doi: 10.1002/lt.21833
40. Nierenberg NE, Poutsiaka DD, Chow JK, Cooper J, Price LL, Freeman RB, et al. Pretransplant Lymphopenia is a Novel Prognostic Factor in CMV and Non-CMV Invasive Infection After Liver Transplantation: Lymphopenia & infection after LT. Liver Transpl. (2014) 20:1497–507. doi: 10.1002/lt.23991
41. Matsushima H, Fujiki M, Sasaki K, Raj R, D’Amico G, Simioni A, et al. Biliary complications following split liver transplantation in adult recipients: a matched pair analysis on single-center experience. Liver Transpl. (2023) 29:279–89. doi: 10.1097/LVT.0000000000000058
42. Warny M, Helby J, Nordestgaard BG, Birgens H, and Bojesen SE. Lymphopenia and risk of infection and infection-related death in 98,344 individuals from a prospective Danish population-based study. PLoS Med. (2018) 15:e1002685. doi: 10.1371/journal.pmed.1002685
43. Terrones-Campos C, Ledergerber B, Specht L, Vogelius IR, Helleberg M, and Lundgren J. Risk of bacterial, viral, and fungal infections in patients with solid Malignant tumors treated with curative intent radiation therapy. Adv Radiat Oncol. (2022) 7:100950. doi: 10.1016/j.adro.2022.100950
Keywords: liver transplantation, humoral immunity, cellular immunity, immune monitoring, flow cytometry
Citation: Cuesta-Martín de la Cámara R, Miguel-Berenguel L, Cámara C, Losantos-García I, Frauca-Remacha E, Hierro-Llanillo L, Muñoz-Bartolo G, Lledín-Barbacho MD, Martínez-Feito A, López-Granados E and Sánchez-Zapardiel E (2025) Immune monitoring and risk of infection in pediatric liver transplantation: a prospective study. Front. Immunol. 16:1605716. doi: 10.3389/fimmu.2025.1605716
Received: 03 April 2025; Accepted: 22 May 2025;
Published: 12 June 2025.
Edited by:
Rita Maccario, San Matteo Hospital Foundation (IRCCS), ItalyReviewed by:
Javier Carbone, Gregorio Marañón Hospital, SpainDaniele Lilleri, San Matteo Hospital Foundation (IRCCS), Italy
Copyright © 2025 Cuesta-Martín de la Cámara, Miguel-Berenguel, Cámara, Losantos-García, Frauca-Remacha, Hierro-Llanillo, Muñoz-Bartolo, Lledín-Barbacho, Martínez-Feito, López-Granados and Sánchez-Zapardiel. This is an open-access article distributed under the terms of the Creative Commons Attribution License (CC BY). The use, distribution or reproduction in other forums is permitted, provided the original author(s) and the copyright owner(s) are credited and that the original publication in this journal is cited, in accordance with accepted academic practice. No use, distribution or reproduction is permitted which does not comply with these terms.
*Correspondence: Ricardo Cuesta-Martín de la Cámara, cmljYXJkb2N1ZXN0YW1hcnRpbkBnbWFpbC5jb20=
†These authors have contributed equally to this work and share last authorship