 Diego Morone1,2*
 Rocco D’Antuono3,4*
- 1Università della Svizzera italiana (USI), Faculty of Biomedical Sciences, Institute for Research in Biomedicine, Bellinzona, Switzerland
- 2Graduate School for Cellular and Biomedical Sciences, University of Bern, Bern, Switzerland
- 3Crick Advanced Light Microscopy STP, The Francis Crick Institute, London, United Kingdom
- 4Department of Biomedical Engineering, School of Biological Sciences, University of Reading, Reading, United Kingdom
The integration of computational advances in microscopy has enhanced our ability to visualise immunological events at scales. However, data generated with these techniques is often complex, multi-dimensional, and multi-modal. Data science and artificial intelligence (AI) play a key role in untangling the wealth of information hidden in microscopy data by enhancing image processing, automating image analysis, and assisting in interpreting the results. With this Review, we aim to inform the reader about the advances in the fields of fluorescence and electron microscopy with a focus on their applications to immunology and virology, and the AI approaches to aid image acquisition, analysis, and data interpretation. We also outline the open-source tools for image acquisition and analysis and how these tools can be programmed for an image-informed, AI-assisted acquisition.
1 Introduction
Since the first observations of microorganisms using a high-quality single-lens microscope by Antonie van Leeuwenhoek in the 17th century (1), microscopy has been instrumental in understanding diseases and alterations of the immune system. In the late 19th century, Robert Koch isolated the anthrax and tuberculosis bacteria, establishing microscopy as one of the key techniques for investigating the immune system (2). Today, microscopy offers unparalleled insights into molecular mechanisms, cellular dynamics, and tissue interactions.
Before the 20th century, observations were performed using brightfield light microscopy (3). Afterwards, several innovations have led to progress in the imaging of immune cells and molecules. Among them, we mention the optimisation of fluorescent probes in conjunction with the advancement of fluorescence optical methods (4), the development of techniques for antibody isolation (5), the discovery of natural fluorescent proteins (6), and the development of genetic manipulation techniques (7). These innovations allow today the precise imaging of cells and molecules, enabling real-time tracking of dynamics, localisation, and interactions that characterise the immune system both in vitro and in vivo. On the other hand, the use of electron microscopy (EM) to visualise structures that are relevant for immunology and virology dates back to the first images of viral particles by Ernst Ruska in 1939 (8, 9). Since then, improvements in both protocols and microscope techniques have led to significant increase in resolution, maximum sample size, and tagging specificity. Among these, we should cite progresses in sample preparation, such as ultramicrotomy (10) and cryogenic techniques (11, 12), advancements in microscope hardware, such as the use of digital cameras and direct detectors (13) and scanning electron microscopy (10), or finally advancements in software, for microscope automation (14–17), image reconstruction (18), tomographic reconstructions (19), and alignment between different modalities (20–24). Today, microscopy encompasses a wide range of techniques, ranging spatial scales from the molecular detail to the whole tissue and organ, and time scales from the millisecond to days (25, 26). The wealth of visible and hidden information in the images can deeply enhance our understanding of immune events, if unlocked.
Artificial Intelligence (AI) technologies are pervasive in today’s world and are affecting all fields of knowledge, including science (27). AI enables machines to mimic human intelligence and perform tasks that typically require human cognition, such as learning, problem solving and perception. In microscopy, AI can significantly enhance our understanding by extracting information from images, bridging the gap between scales (28), finding hidden connections within images or between images and other types of data (e.g. genomics or proteomics, 29), and guiding the acquisition in challenging experiments and across modalities (30, 31).
In the first part of this Review, we will survey main microscopy and image analysis techniques, with a focus on their use in immunology and virology. The second part introduces the reader to the concepts of AI and its main applications in microscopy, in particular for immunology and virology research. We finish with a discussion on the current challenges in AI and how its integration with microscopy can drive a new generation of tools to unlock novel insights into the immune system.
2 Microscopy and image analysis for immunology and virology
2.1 Electron microscopy
2.1.1 Room temperature EM
Classic, Room-Temperature Transmission Electron Microscopy (RT-TEM) relies on chemical fixation, lipid staining with contrast agents based on heavy metals, resin embedding, and cutting in ultrathin sections. This methodology, mainly established in the 1960s (32), is an excellent way to investigate subcellular morphology and ultrastructure (33). A certain degree of three-dimensional information can be acquired by capturing EM images at varying sample tilt angles and performing tomographic reconstructions (electron tomography, ET in short, 34). RT-TEM has been applied to visualise organelle changes in immune cells, such as in the investigation of the role of autophagy of the endoplasmic reticulum during plasma cell differentiation (35), the disposal of damaged mitochondria in migrating neutrophils through mitocytosis (a novel mitochondrial quality control process, 36), or the mechanisms of antigen presentation by major histocompatibility complex (MHC) in antigen-presenting cells (37–40). Another classical visualisation approach relies on the negative staining of small particles, such as protein aggregates, viral particles, or extracellular vesicles, and it is used in clinical diagnostics for virus identification (41).
Immuno-Electron Microscopy (IEM) highlights specific markers on the structure of interest by immunostaining with target-specific antibodies conjugated to colloidal gold particles (42). Another way to achieve specific staining is by expressing a genetically encodable tag that triggers the deposition of a contrasting agent (43, 44), which was used for example for the visualisation of the role of ectocytosis in terminating TCR signalling in cytotoxic T cells (CTLs, 45).
Scanning Electron Microscopy (SEM) employs a focused electron beam that scans the surface of a sample, generating an array of secondary electrons that are detected and converted into an image (46). This results in a high-resolution image of the sample’s surface. To improve contrast, the sample is frequently coated with metals. SEM has been employed with immunogold staining to map the SARS-CoV-2 receptor ACE2 distribution along the motile cilia in respiratory multiciliated cells (47). Also, SEM showed how the porosity of liver sinusoids reduces antigen recognition by effector CD8+ T cells (48) or how intercellular nanotubes enable mitochondrial trafficking from bone marrow stromal cells to CD8+ T cells, to enhance their fitness and antitumor efficacy (49).
Finally, volume Electron Microscopy (vEM) is an emerging group of techniques that offers unprecedented insights into the three-dimensional organisation and dynamics of immune cells, tissues, and molecular complexes. vEM is based on TEM or SEM. TEM-based techniques, like serial section TEM (ssTEM) and serial section ET (ssET), reconstruct volumes by acquiring sequentially ultra-thin sample slices. On the other hand, SEM-based techniques, including array tomography, serial block-face SEM (SBF-SEM) and focused ion beam SEM (FIB-SEM), scan sample surfaces to produce image stacks for 3D reconstruction (26, 50, 51). In immunology, SBF-SEM has been applied to reconstruct T cells (52) and to elucidate how Candida albicans exploits transcellular tunnels to invade epithelial cells while evading host immunity (53). FIB-SEM helped in clarifying how G protein subunit Gβ4 negatively regulates phagocytosis by controlling plasma membrane abundance in myeloid cells (54), or was employed to create a 3D reconstruction of CTLs with target cells (45). FIB-SEM was instrumental in reconstructing, with a near-isotropic resolution of 4 nm, whole-cell organelle segmentations, which resulted in the “OpenOrganelle” web repository (55–57). Among others, a notable example is the reconstruction of a CTL interacting with an ovarian cancer cell (56). Moreover, vEM can be combined with advanced labelling techniques like immuno-gold (58) or fluorescent nanoparticles to visualise specific cellular structures or molecular interactions within complex biological samples (59), providing an invaluable information for understanding the spatiotemporal organisation of immune responses at the ultrastructural level.
2.1.2 Cryo-EM and freeze substitution
Cryo-Electron Microscopy (cryo-EM) techniques can currently achieve the sub-nanometre range (60–62). The sample (proteins, cells, or tissues) is first flash-frozen at cryogenic temperature, allowing the creation of a layer of vitreous ice, which fixes the sample while preserving its ultrastructure (11). The vitrified sample can be visualised by different techniques. Microcrystal Electron Diffraction (MicroED) provides structural information from 3D nanocrystals (63). Single Particle Analysis (SPA) reconstructs protein structures without the need for crystallization (61, 62). Cryo-Electron Tomography (cryo-ET) enables the 3D reconstruction by capturing images at varying tilt angles and performing tomographic reconstructions (34) and together with subtomogram averaging can resolve macromolecules (64). Lastly, cryo-Scanning Transmission EM (cryo-STEM) provides a tomographic reconstruction of thick lamellae with quantifiable chemical characterization (65). Cryo-EM techniques have revolutionised structural immunology, enabling the visualisation, in high-resolution, of viral particles (66, 67) or SARS-CoV-2 assembly and egress (68), the TCR complex assembly (69–72), the structural components of antigen processing and presentation (73), the chemokine recognition and the activation of chemokine receptors CCR5, CCR6, CCR2, CCR3 (74), and helped guiding the design of nanoparticles inducing potent neutralising antibody responses (75).
Cryo-Immuno-EM of ultrathin cryo-sections prepared from chemically fixed samples (76) allows the best preservation of protein antigenicity, as it requires chemicals only for fixation (77). When imaging surface proteins, cells can also be labelled with immuno-gold before cryo-fixation and imaged by cryo-ET (78). This approach opens a range of applications for the study of ultrastructural localisation of surface markers, with potential relevance for the field of immunology.
Volume EM at cryogenic conditions can capture 3D morphology in cells at near native state. It can be approached with cryo-ssET (cryo-serial section Electron Tomography) or with cryo-FIB-SEM. For example, cryo-FIB-SEM showed how growth hormone remodels 3D mitochondrial structure in macrophages (79) or the 3D ultrastructure of HIV virological synapses (80).
Finally, in the case of cells and tissues, samples can be plunge-frozen (81, if less than 10-15 μm in thickness) or fixed by high-pressure freezing (82, 83, if between 20-200µm in thickness). After flash-freezing, the sample can be imaged at cryogenic temperature or slowly brought back to room temperature in a chemical fixation buffer, using a so-called freeze-substitution protocols (84). This approach reduces artefacts that could potentially be introduced by toxic chemical agents used as fixatives. Freeze substitution techniques are also employed in light microscopy to reduce fixation artefacts when performing subcellular diffraction-limited or super-resolved imaging (85–89).
2.1.3 Room-temperature CLEM
Correlative Light-Electron Microscopy (CLEM) integrates the complementary approaches of light and electron microscopy on the same portion of cell or tissue to overcome the limitations of both techniques, combining the multichannel protein localisation of light microscopy with nanometre resolution of EM (Figure 1A). The sample is usually imaged separately with the two modalities and then images are aligned with respect to each other. This poses several challenges to both acquisition and image registration. Some approaches that directly combine both modalities in the same microscope are starting to appear (93). One interesting application of CLEM is the visualisation, in the study by Baldwin et al. (49), of mitochondrial transport from bone marrow stromal cells to CD8+ T cells, by fluorescently labelling mitochondria in stromal cells and then imaging CD8+ T cells with both modalities. Also, FIB-SEM has been combined with light microscopy to visualise the virological synapse and virus-containing compartments in HIV-infected T cells (94). The combination of intravital microscopy and electron microscopy merges the dynamic information of immune cells in vivo with a more comprehensive characterisation of the same in fixed tissue. This multiscale deep phenotyping approach is reviewed in (95).
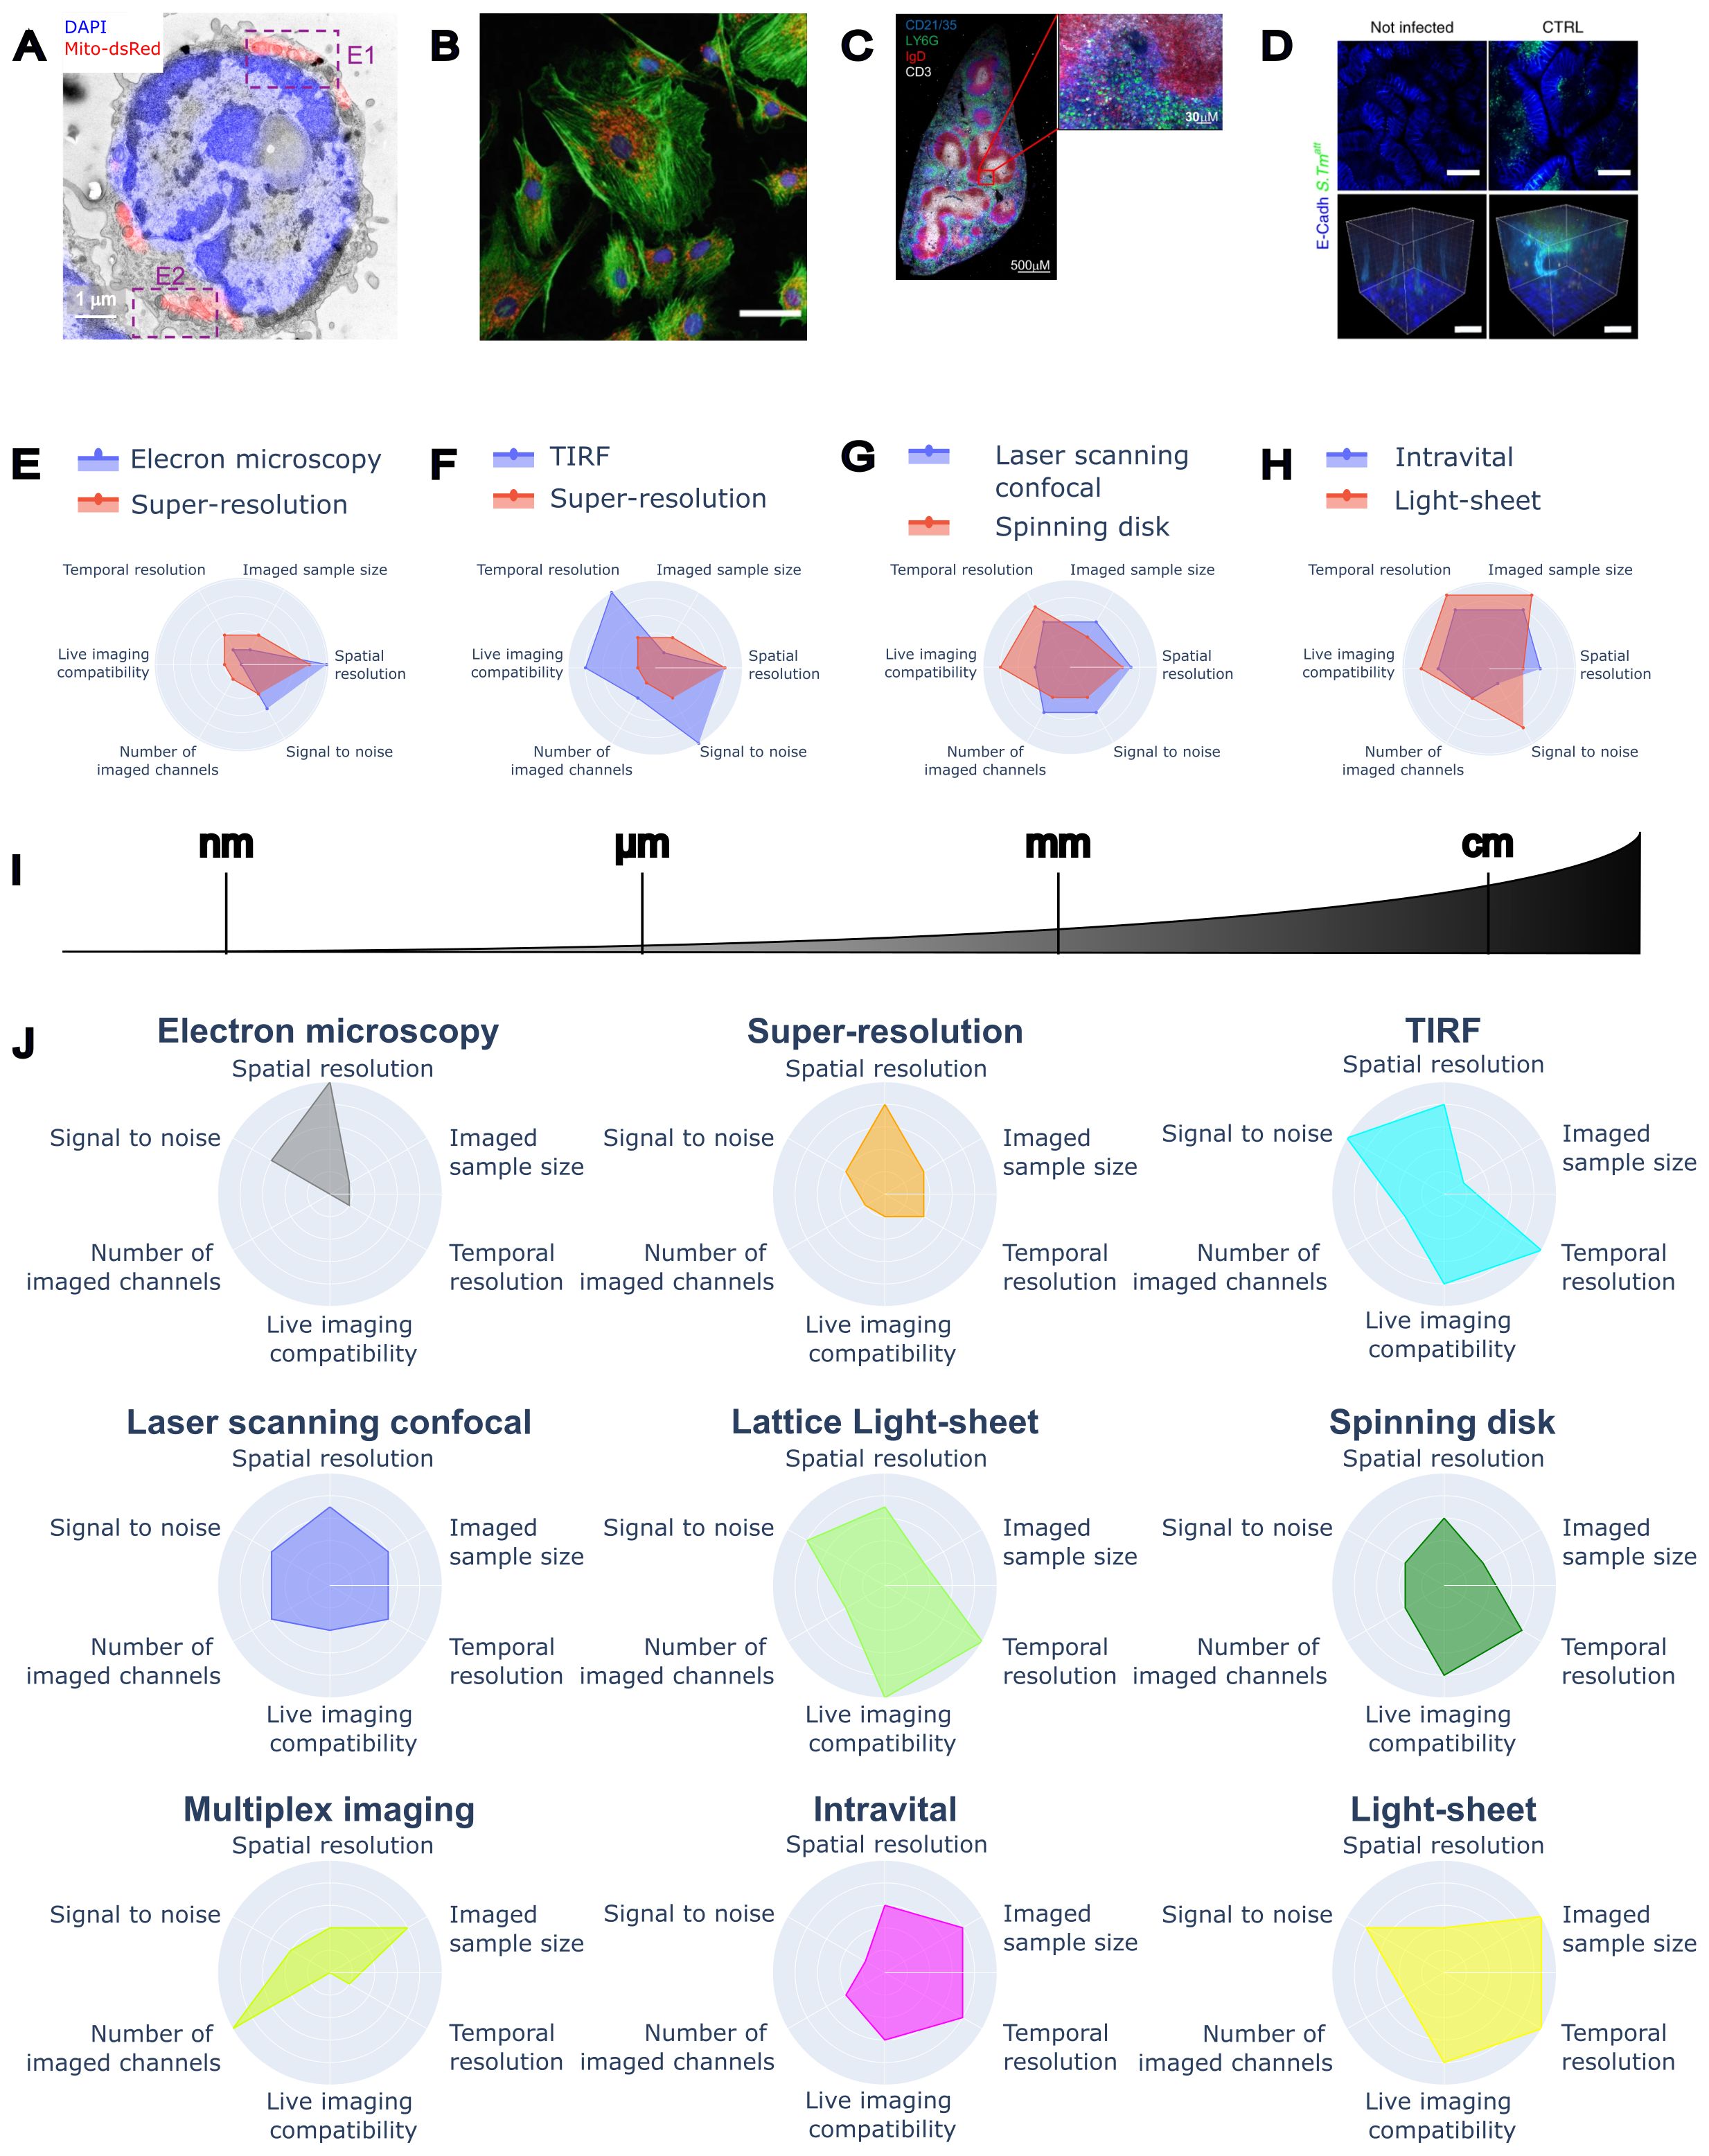
Figure 1. Imaging at scales and performances of different microscopy techniques for immunology. (A) Correlative Light-Electron Microscopy of mouse T cell (transmission electron microscopy image in grey, DAPI in blue, and mitochondria in red), reproduced from (49, CC-BY 4.0). (B) Fluorescence multichannel image of BPAE cells, reproduced from (90, CC-BY 4.0). (C) Whole tissue section of mouse spleen acquired on a confocal microscope, reproduced from (91, CC-BY 4.0). (D) Gut bacterial infection with whole crypts imaged in 3D, reproduced from (92, CC-BY 4.0). (E) Comparison between Electron Microscopy and Super-Resolution techniques. (F) Comparison between TIRF and Super-Resolution techniques. (G) Comparison between Laser Scanning confocal and Spinning Disk confocal. (H) Comparison between Intravital and Light Sheet. (I) The spatial scale covered by different microscopy techniques. (J) Radar plots visualising the performances of individual microscopy techniques.
2.1.4 Cryo-CLEM
CLEM combined with cryogenic conditions also has great potential, due to its preservation of the native state, very high resolution and capacity to retain fluorescent signals (96). For example, this approach has been applied to investigate the intracellular trafficking of Salmonella bacteria (97). In the case of genetically engineered cells (such as when expressing GFP or other fluorescent proteins), cryo-fixation can then be followed by cryo-sectioning with FIB (98) or cryo-ultramicrotomy (99). Cryo-fluorescence light microscopy (cryo-FLM) can guide the lamella milling process (100), also with super-resolution LM (89). Finally, current protocols are extending cryo-CLEM to post-milling visualisation (101), and to 3D samples, such as organoids (102), thus providing a step towards sub-nanometre visualisation in larger 3D context, with relevant applications in immunology.
2.1.5 Conclusions on the use of electron microscopy in immunology and virology
All in all, electron microscopy offers insights into the ultrastructure and three-dimensional organisation of viruses, immune complexes, cells, and tissues that are unattainable with light microscopy techniques (Figures 1E, 1J). Coupled with immunostaining in a correlative approach, EM also informs on the localisation of selected proteins, thus giving context to the ultrastructural detail. EM poses several challenges in terms of image analysis. High-resolution cryo-EM of viral and protein structures employs state-of-the-art algorithms to reconstruct information from low-signal images. Images of thin slices and tomographic reconstructions are frequently analysed by manual segmentation due to the complexity of the ultrastructural contrast. Volume EM reconstructions pose many challenges in terms of image reconstruction, alignment, contrast, and segmentation, due to the size and the complexity of the structures visualised. All these techniques are already or might soon take advantage of the latest AI and image analysis developments (Table 1).
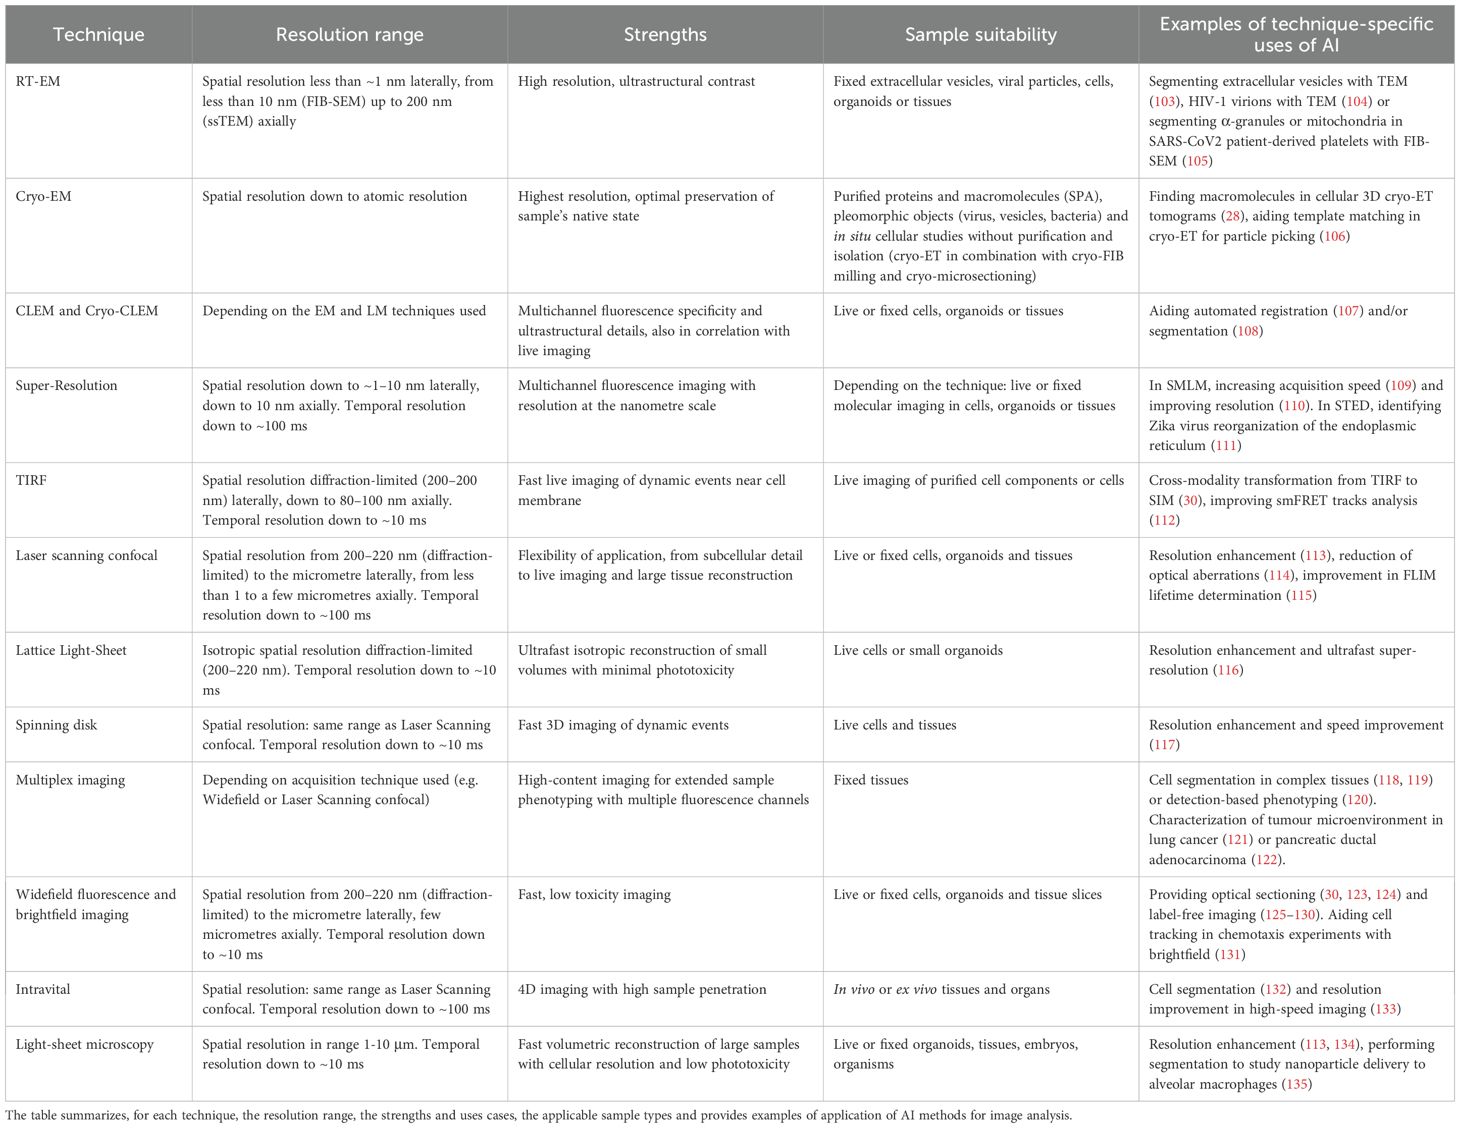
Table 1. Resolution range, strengths, sample type and AI applications for different microscopy techniques.
2.2 Light microscopy
2.2.1 Super-resolution
By selectively tagging molecules of interest, fluorescence microscopy allows the characterisation of functional and structural features of biological samples, with the intrinsic limitation of the optical resolution limit (136, 137). In fluorescence microscopy, the diffraction-limited resolution is in the order of 200–220 nm, a scale compatible with most cell and tissue imaging applications. However, the scale of many biological structures, such as organelles and molecular clusters, is at least one order of magnitude smaller (tens of nm). Super-resolution microscopy of fluorescent samples bridges the scale of light and electron microscopy, preserving sample integrity and the possibility of performing functional imaging on live samples (Figures 1E, 1J). Most super-resolution methods are based on the manipulation or the analysis of the on/off state of emitters (fluorophores), which are changed either spatially or temporally (138), or on the concept of light reassignment by optical rescanning (139) or pixel reassignment (140).
Localisation microscopy is based on experimental minimisation of the number of active emitters in the field of view, either by activating only a few fluorophores at the time or by limiting the population in the ground energetic state. This allows the determination of the emitter position with the highest probability (141). Localisation microscopy, including techniques such as PALM and STORM, requires the acquisition of a high number of frames to accumulate information about biological structures, and the use of blinking fluorophores to obtain a sparse presence of emitters in the field of view. In general, the definition of biological structures in the final image improves with the number of accumulated frames (in the order of thousands). However, there are methods to optimise the acquisition parameters, such as excitation power and number of frames needed, depending on the structure dimensionality (142), or to identify artefacts in the super-resolved image based on a local error map (143). In immunology, localisation microscopy provided information on SARS-Cov-2 entry in liver spheroids (144), showed how the TCR is randomly distributed on the surface of resting antigen-experienced T cells (145), and informed on the structure of cluster in the NK cell’s immune synapse (146).
One of the methods to achieve super-resolution using specific illumination patterns is the STimulated Emission Depletion (STED) microscopy, in which the illumination laser, hitting the sample as a diffraction-limited laser spot, is used together with a depletion laser illumination, shaped as a toroidal pattern that switches off fluorescence, leaving a smaller emission spot and therefore increasing the resolution as a function of the power of the depletion laser (147). In immunology, STED microscopy has been used to show the role of SWAP70 in organising actin cytoskeleton during phagocytosis (148) and how TIGIT receptor can inhibit T cell activation by forming nanoclusters (149).
Other optical super-resolution methods implemented on laser-scanning systems, such as Zeiss Airyscan (150) and Nikon NSPARC (151), rely on light reassignment, assuming that higher order rings of Airy pattern can be detected with arrayed detectors and light be reassigned to the centre of the pattern where single emitters should be located (140). Finally, other methods such as iSIM and SoRa, are based on optically rescanning the point spread function to reduce its size and obtain instant super-resolution imaging on camera-based systems (152).
Instead, super-resolution methods based on the temporal analysis of fluorescence intensity fluctuations do not require blinking fluorophores and can be employed on data sets acquired on conventional microscopes (e.g. wide-field, TIRF, laser scanning confocal). They are referred to as Fluorescence-Fluctuation based Super Resolution Methods (FF-SRM), and each relies on a different statistical analysis of the temporal fluorescence fluctuations (e.g. Super-Resolution Optical Fluctuation Imaging (SOFI, 153), Super-Resolution Radial Fluctuations (SRRF, 154) or Mean-Shift Super-Resolution (MSSR, 155) to overcome specific limitations in the acquisition or in the image, such as low signal-to-noise, low number of frames, capability to reconstruct hollow structures or susceptibility to the creation of image artefacts (156).
All in all, the landscape of super-resolution microscopy ranges from methods based on light reassignment, providing moderate optical resolution increase (e.g. Airyscan), to methods based on localisation microscopy and fluorescence depletion, achieving a resolution of the order of the nanometre (e.g. RESI (157), MINFLUX (158–160) and MINSTED (161)). The use of computational methods on top of super-resolved images can further enhance super-resolution even with a limited number of frames (155).
2.2.2 TIRF
Total Internal Reflection Fluorescence (TIRF) microscopy uses the total internal reflection of a laser beam to create a thin illumination layer. This allows the observation of fluorescent molecules close to the coverslip surface (depth of about 100–200 nm, Figures 1F, 1J162, 163). Such method provides high-resolution images of the basal cell layer with minimal background noise, making it ideal for studying cellular processes such as migration, adhesion, and signalling (164).
In immunology, TIRF microscopy is commonly used to study the interactions between immune cells in antigen presentation. For example, seminal studies employed this technique to investigate TCR clusterization and activation pathways following antigen recognition (165, 166). More recently, TIRF has been used to highlight that clathrin is recruited in microclusters to mediate internalisation and vesicular release of a triggered T cell receptor at the immunological synapse (167). Another application of TIRF microscopy in immunology is the study of receptor clustering, such as to show the importance of CD4+ T cell’s CXCR4 nanoclusters in supporting CXCL12-mediated responses (168). On macrophages, TIRF has been employed to show the accumulation of dynamin-2 at the site of phagosome closure (169).
A recent evolution of TIRF microscopy, called quantitative dynamic footprint (qDF) and based on variable-angle TIRF, was used to visualise leukocytes rolling, adhering, and spreading with nanometre-scale z-resolution (170, 171). Finally, TIRF in conjunction with SIM super-resolution microscopy showed the engagement of two spatially distinct TCR microclusters with ZAP70-bound TCR and LAT-associated signalling complex (172).
2.2.3 Confocal
Confocal microscopy is based on the use of an optical aperture, called a pinhole, to obtain the optical sectioning of the sample and localise the fluorescent signal in 3D (Figure 1B). It was invented by Marvin Minsky (173) – a computer scientist who would later play a significant role in the development of AI concepts and methods – and has been improved with the use of lasers and scanning systems (174, 175). It avoids the need to physically slice thick samples by rejecting out-of-focus light proportionally to the reduction of the pinhole aperture (176).
Thanks to its versatility, confocal microscopy can find applications on a wide range of samples, from fast visualisation of live subcellular events to reconstruction of large portions of thick tissues. On the subcellular scale, confocal live-cell microscopy was used to investigate how lymphocytes, in the absence of chemotactic signalling, orient their migration against a fluid flow (177), to characterise the force dynamics in phagocytic engulfment by cytotoxic T cells (178), and to show how the Golgi complex directs the positioning of lytic granules inside NK cells to guide their cytotoxicity (179). At the cellular level, tracking of macrophages in live-cell confocal imaging helped, together with modelling, in clarifying how these cells use a collective quorum licensing to initiate inflammation (180). In fixed tissue samples (Figure 1C), confocal microscopy has been employed to visualise macrophages in meningeal compartments of the central nervous system (181), vascular endothelium of mouse lymph node (182), virion transport to lymph nodes (183) and neutrophil accumulation (91). Moreover, it helped in defining the role of scavenging chemokines in marginal B cell zone formation (184) or the contribution of innate lymphoid cells and conventional T cells on shaping gut microbiota and lipid metabolism (185), and Treg accumulation around self-activated T cells in lymph node paracortex (186). Finally, it contributed to characterising megakaryocytes in the bone marrow niche (187), periarteriolar alignment and integrin-dependent network formation of tissue-resident mast cells (188), platelets around metastatic niches in lungs (189), and tissue-resident memory T cells on the ocular surface (190). In a high-throughput manner, confocal microscopy was instrumental in isolating CAR-T cell clones with a multi-killing property against patient-derived cancer cell organoids and associating this information with their transcriptomic profile (191).
When coupled with pulsed lasers, confocal microscopy can detect fluorescence lifetimes in so-called Fluorescence Lifetime Imaging (FLIM, 192). The determination of the lifetimes can be done either with exponential fit of the decay histogram or with phasor analysis (193). The measured lifetimes are concentration-independent but microenvironment-dependent. Thus, local microenvironment changes can be assessed, such as pH and ion changes, FRET events (194) or cell membrane tension (195). Confocal microscopy can also be used to visualise structures below the diffraction limit by means of expansion microscopy, which increases the sample size (e.g. by 10-fold), and standard confocal imaging (196). Finally, confocal live acquisitions can offer insights into molecular behaviour with techniques such as Fluorescence Correlation Spectroscopy (FCS, 197), Image Correlation Spectroscopy (ICS, 198), and Number and Brightness (N&B, 199). For example, N&B has been applied to determine GPCR oligomerisation states in live cells (200).
Recently, new technologies in confocal imaging are being developed to increase its speed and multi-view capabilities, such as techniques for fast, super-resolution, and multi-view imaging (201) or virtual scanning light-field technologies (202, 203).
2.2.4 Confocal and multiphoton for intravital imaging
Staying true to the microscopists’ motto, “Seeing is believing” (204), intravital microscopy (IVM) addresses the need to observe events in their context (205), which provides complementary information to static 3D tissue phenotyping (206). Depending on the degree of tissue transparency and the required depth of imaging, IVM can be achieved with widefield, confocal, or multiphoton microscopy. Due to the shallow imaging capabilities of widefield microscopy, most studies are conducted using confocal or multiphoton approaches.
In the case of confocal, IVM is sometimes based on the use of a faster alternative microscope called Spinning Disk (SD, Figures 1G, 1J207). Here, multiple excitation points are obtained by splitting the laser beam with microlenses on a rotating disk, while corresponding pinholes on a second rotating disk perform optical sectioning. Spinning disk microscopy has been applied to visualise Kupfer cells sequestering E. coli to show how this mitigates neonatal sepsis (208), liver-specific Treg and their re-programming of liver neutrophils (209), peritoneal macrophages (210), patrolling by alveolar macrophages (211), and mechanisms of control of dendritic cells by nociceptors (212). A promising approach to confocal IVM is the recent development of confocal light-field microscopy (203, 213), which achieves real-time acquisition of whole volumes (Z-stacks) with micrometre resolution.
Multiphoton microscopy (MPM) combines laser scanning with a multiphoton near-infrared excitation. It is based on the simultaneous absorption of multiple low-energy photons, resulting in the same fluorescence emission as in conventional one-photon excitation. Multiphoton excitation increases the achievable imaging depth (Figure 1D) thanks to the use of near-infrared wavelengths that are scattered less by the sample, eliminates out-of-focus excitation and reduces phototoxicity and photobleaching (214). MPM contributed to several major discoveries in immunology (see reviews 205, 215). The most used type of multiphoton excitation is by means of two photons (also called Two-Photon Microscopy, TPM). Examples of application of TPM in immunology include the visualisation of inflammatory dendritic cells (216–218) and neutrophil efferocytosis (219) in trachea after influenza infection, innate immune responses in the skin during wound repair (220, 221), macrophage aggregation in a peritoneal sterile wound model (222). Moreover, it helped in investigating chemotactic neutrophil migration bias at capillary bifurcations (223), and complement activation in draining lymph nodes following dermal infection (224). In adaptive immunity, TPM contributed to the show that T cell activation occurs in three stages (225), or to elucidate T cell regulation by innate lymphoid cells in the liver (226), corneal tissue-resident T cells localising at the surface of immune privileged eye (190), mechanism of additive cytotoxicity by CTLs (227), dynamic interaction between marginal zone B cells and red blood cells (228), and B cell control of affinity by restraining somatic hypermutation through controlled cell proliferation (229). TPM also aided ex vivo imaging, such as in the visualisation of the role of ATP in limiting protective IgA against enteropathogens (92), or in the visualisation of collagen deposition and mesothelial cell activation in the intraperitoneal gut following microbial contamination (230).
Three- and four-photon excitations have been instrumental to reconstruct the entire depth of a popliteal lymph node (231) or the deep vasculature in brain tumours (232), to the quantification of calcium events in astrocytes in deep portions of tissue (233), and to the acquisition of multichannel data sets (up to 6 channels) in tumour tissues (234). The combined use of TPM and FLIM imaging allows the characterisation of pH and metabolic changes in vivo (235). Finally, to overcome the speed limitations inherent to laser scanning systems, faster implementations have been developed that use a synthetic aperture microscopy to achieve long-term imaging at high speed (236) or with a scan-less multiphoton setup for fast, deep, imaging-based neuron voltage recordings (237). On the other hand, adaptive optics methods have been employed to limit scattering in deep tissues and correct aberrations (233, 238). Finally, sample drift or organ movements can pose challenges that AI could address during or after acquisition.
2.2.5 Multiplex imaging
The goal of understanding biological function within the complex context of tissues – which is of particular importance in immunology – led to the development of techniques for visualising and analysing multiple targets or markers within the same sample. Standard imaging setups are usually limited to very few markers at the same time, while multiplex imaging extends the total number of markers in the order of several tens (239).
Current approaches to multiplex imaging include fluorescence imaging, imaging mass spectrometry, or sequencing techniques. In its fluorescence declination, samples are either stained with many fluorophores simultaneously or repetitively stained with fewer fluorophores in many cycles of imaging and fluorescence bleaching (240). Samples are then acquired in widefield or confocal microscopy, to achieve a cellular resolution (Figure 1J). When combining multiple fluorophores at the same time, several techniques have been developed to ensure the separation of highly overlapping emission spectra, either based on hardware, such as the employment multiple emission windows and spectral unmixing algorithms (241, 242), or by calculating spill-over with single-stain samples (239). In the case of cyclic imaging, usually two or three fluorophores are used per cycle, with repetitive staining, imaging and bleaching phases, as applied to fixed tissues (243–245), cells (246) and live samples (247). Multiplex imaging techniques require a solid antibody validation, which is addressed also by community efforts (248). Cycling imaging is time-consuming, then a possible improvement is the use of fluorescent tags with DNA barcoding: the sample is stained simultaneously with antibodies tagged with orthogonal single-stranded DNA sequences and then imaged in cycles by using an eraser strand between each cycle (249). Finally, recent and promising advances in fluorescent multiplex imaging use FLIM to increase the number of detectable fluorophores or discriminate the autofluorescence contribution (250). In this regard, techniques using AI to overcome the limitations of low photon budget when performing spectral FLIM imaging are of particular interest (115, 251).
Mass-spectrometry based techniques employ a raster-scanned ionising beam to analyse a small portion of the sample that is then associated with a single pixel in the resulting image reconstruction. Material collected can be endogenous, such as proteins, metabolites, lipids, or glycans (252), or exogenous, as in the case of antibody staining with tags suitable for mass spectrometry, such as peptides or rare metal elements. For example, Imaging Mass Cytometry (IMC) and Multiplexed Ion Beam Imaging (MIBI) can reach single-cell resolution, allowing highly multiplexed spatial proteomics (253, 254). With lower resolution (clusters of cells), metabolite mapping has been performed with both mass spectrometry and Raman spectro-microscopy (255). Overall, the development of these techniques greatly increased the amount and quality of data extracted from samples. Furthermore, the mentioned techniques can be combined in a multi-omics approach to increase sample information (256–258). Of interest are methods that couple automated laser microdissection with shotgun lipidomics (259) or with (epi)genomics and transcriptomics, as they integrate imaging, analysis, and hardware feedback steps to extract interesting information for subsequent analysis (260).
Data obtained with multiplex imaging techniques can pose numerous problems regarding analysis due to size, complexity, and heterogeneity. For example, in the case of fluorescence imaging, removing autofluorescence from paraffin-embedded tissues or complex tumour tissues can be hard to achieve (261). Other challenges in the image analysis include segmentation of cells in the complex tissue environment (240), and spectral separation in the case of one-shot imaging with many overlapping fluorophore spectra (262). On the data interpretation side, data clustering and dimensionality reduction are needed to navigate complex multi-channel data sets and integrate these data with other multi-omics approaches (263). An example is the integration of multiplex imaging and spatial transcriptomics to follow thymic evolution (264). Finally, sharing code and protocols of the analysis pipeline ensures a dissemination of techniques and best practices, fostering the improvement of data analysis pipelines (118). All these tasks can be approached with standard or AI-assisted image analysis techniques, as discussed in the second part of this Review (see Section 3).
2.2.6 Light-sheet microscopy
Light-Sheet Fluorescence Microscopy (LSFM, also called Selective Plane Illumination Microscopy, SPIM) achieves 3D sectioning by illuminating the sample with a thin sheet of light and collecting fluorescence emission in a plane orthogonal to the illumination (265). A volume reconstruction can be obtained by translating the beam or the sample in a single direction or by rotating the sample to perform a tomographic reconstruction. This type of illumination achieves a very fast volume reconstruction with micrometre resolution (Figures 1H, 1J), high signal, low photobleaching and phototoxicity (266). In live samples, this technique has been applied to high-throughput live imaging of T cell cytotoxic function against B-cell lymphoma or the interaction of Tregs with gastric tumour spheroids (267).
A notable application of LSFM microscopy in immunology is the reconstruction of fixed, cleared organoids and tissues. Clearing removes the unwanted tissue components and improves the uniformity of tissue refractive index, thus reducing light scattering and improving image quality at high depth (268). LSFM has been applied to reconstruct many organoid types (269). Its use on cleared tissues is particularly interesting for the whole-organ characterisation of immune landscape and vascularisation of the brain (270), clinical identification of melanoma metastasis in the human lymph node (271), and whole-mouse cleared tissue imaging (272–275).
Lattice light-sheet can image subcellular details with an illumination pattern that achieves diffraction-limited isotropic resolution and high acquisition speed (276). This technique was applied, for example, to the study of the interaction between tumour-associated macrophages and CD8+ T cells (277) or to characterise the effect of antigen strength on immune synapses (31). Given the lower penetration depth of visible light compared to multiphoton illumination, the application of LSFM in vivo has been limited to investigating cleared samples, as with the organoids mentioned above, or in embryo development studies (272, 278). However, the development of multiphoton light-sheet systems (279), or the recent implementation of the NIR-II illumination (1000–1700 nm) to light-sheet microscopy opened a window to the feasibility of deep tissue LSFM in vivo (280). On the other hand, a variation of visible-light LSFM called Swept Confocally Aligned Planar Excitation (SCAPE) microscopy (281), was applied to the histopathological characterisation of live tissues from their autofluorescence (282). SCAPE provides information on tissue architecture with cellular resolution, with a strong potential for diagnostic applications.
Overall, LSFM is an exciting field, but numerous challenges remain to be addressed. For instance, the vast amount of generated data renders archiving, pre-processing, visualisation, and analysis considerably more complex than other microscopy techniques (283). Many platforms have been developed to tackle the analysis of these complex and big data sets (284). As outlined in a recent review by Daetwyler and Fiolka (266), we also foresee that light-sheet microscopy, with its fast-imaging capabilities, 3D reconstruction of big volumes and generation of highly informative data sets, will take a central stage in microscopy to image cell-cell interactions in complex 3D structures such as organoids and tissues. Also, the resulting data sets are already pushing the generation of novel data analysis techniques (285, 286).
2.2.7 Conclusions on the use of light microscopy for immunology
In conclusion, light microscopy techniques can span resolutions from the nanometre to the centimetre (Figure 1I). They significantly advanced our understanding of the immune system, by enabling researchers to visualise complex subcellular structures, cellular interactions, and dynamic processes, for immune phenotyping and dynamic live analyses. Yet, biology occurs across all spatial and temporal scales, while current techniques can only see a portion of these events (25). To cover these different scales, we need both progress in imaging techniques, as well as automated analyses that can inform and guide the capture of events across scales in real-time.
2.3 Image analysis
Image analysis is a crucial component of microscopy research, enabling the extraction of quantitative data from complex visual data sets in an unbiased manner (287). The standard toolbox for image analysis comprises tools for image preprocessing, segmentation, tracking, and quantification. Automating this process ensures unbiased data analysis and simplifies compliance with good practices for data and image acquisition reporting (288).
Image preprocessing seeks to minimise noise, enhance contrast, correct geometric distortions, and improve resolution, thus facilitating the subsequent image analysis steps. Denoising techniques improve the signal-to-noise ratio (289): methods vary from standard Gaussian blur and median filter to more advanced techniques such as 3D block-matching (290), non-local means (291, 292), and wavelet transforms (293). Improvements in contrast and resolution can be achieved with deconvolution techniques, where the information about the point spread function of the microscope is used to remove the signal contribution from out-of-focus planes and surrounding signal sources (294). Resolution and contrast improvements can also be obtained by acquiring the same image with slight changes in the illumination beam (295, 296), with general algorithms considering the noise distribution (150, 151), analysing fluorescence fluctuations with algorithms such as mean shift vector analysis (MSSR, 155), or by deconvolution, like in SUPPOSe (297) or B-SIM and Sparse-SIM for SIM images (298, 299). Image registration corrects image distortions and time drift: this is especially useful when reconstructing a volume in a mosaic (300–302), aligning images in case of sample drift, as needed in intravital microscopy (303–306) or aligning images acquired with different modalities, such as in the case of CLEM (51). Lastly, crosstalk correction improves channel separation, eliminating unwanted spectral bleed-through between channels (4, 174), while spectral unmixing techniques use the characterisation of the emission profile to separate many fluorophores with overlapping emission spectra (241). These approaches are particularly useful in multiplex imaging (239) and when subtracting unwanted autofluorescence contributions (242). Other methods for spectral separation include phasor analysis based on fluorescence spectral data, or on fluorescence lifetime (307). Overall, effective image preprocessing greatly simplifies image segmentation, ultimately improving the extraction of quantitative data from microscopy images.
Segmentation of image data is the process of separating the pixels of the background from the pixels of interest, labelling the objects (e.g. organelles, cells, tissue areas) so that properties such as geometrical descriptors can be measured, or intensity statistics be calculated. Image segmentation is at the basis of most automated analysis workflows (308). Segmentation techniques can be broadly categorised into two main groups: region-based and edge-based methods. Region-based segmentation algorithms group together pixels with similar attributes (e.g., intensity, colour) to form homogeneous regions within an image. These algorithms often use intensity thresholding (309), clustering (310), or watershed (311) to identify meaningful segments. On the other hand, edge-based segmentation focuses on identifying boundaries between objects in an image by detecting abrupt changes in pixel attributes, such as intensity or texture. Common edge detection methods include Canny (312, 313), Sobel (314), and Laplacian of Gaussian (LoG) operators (308). The choice of segmentation technique may vary depending on the specific application, where factors to consider include image complexity, object shape, size, and contrast with respect to the background. Object segmentation can then be followed by object classification according to some measurable property, such as object position or shape factors.
Object detection localises objects or regions of interest in an image. The task typically involves identifying the object to be detected (classification) and determining its position in the image (localisation). Object detection is frequently employed to recognise areas of interest, such as a compartment in a cell or tissue (315), and to identify cells in time-lapse microscopy movies for object tracking (316).
Tracking allows the study of temporal dynamics, such as cellular or subcellular movements. Tracking objects in a movie is a two-step process, where object detection and segmentation are followed by object linking between frames (317, 318). Manual or semi-automated tracking software has dominated the scene in studies of immune cell mobility upon antigen presentation, in cell culture experiments, or in lymph node imaging (319). However, when temporal sampling cannot be done at high frequencies, or the linking process is ambiguous, deep learning techniques may prove helpful in enhancing the effectiveness of classical methods (316, 320).
Recent advances in bioimage analysis are significantly broadening its accessibility, allowing researchers to leverage powerful techniques with reduced reliance on programming expertise and lowered computational resource demands. These developments are driven by a growing trend toward simplified user interfaces (321–326), and standardised analysis protocols for light microscopy (327) and electron microscopy (57). However, while these tools streamline many routine analyses, complex or novel research questions often require more sophisticated approaches. This is where the role of the bioimage analyst remains crucial – bridging the gap between readily available software and advanced techniques, and facilitating the development of custom solutions to address unique research challenges (328).
2.4 Impact of open-source software and open hardware in image acquisition
Open-Source software (OSS) has a key role in bioimage analysis because the access to source code enables any researcher to develop customised workflows, even with a limited knowledge of programming languages, thus guaranteeing more transparency and reproducibility (329).
Image quantification has been made easy in the past decades by many graphical user interfaces (GUI) suites, among which the most renowned include ImageJ or FIJI (330), CellProfiler (323), napari (331), QuPath (332). The key aspect that makes these GUIs widely adopted is the abundance of scripts and plugins, together with the possibility to access the source code and develop custom bioimage analysis solutions, whether implemented as point and click interaction or as a script.
A fundamental role of facilitator for bioimage analysis based on scripting has been covered by development environments such as RStudio1 (based on R language), JupyterLab (333, based on Python) or visual programming suite KNIME (334). Because of the richness of the Python environment, in terms of availability of packages, many bioimage analysis solutions have been developed as Jupyter notebooks, especially in the context of machine learning (ML) and deep learning (DL), where code modification might enhance the adaptation to specific image data (118, 335, 336). The availability of complete notebooks where all the steps of a workflow are explained with code comments facilitates the execution by the end user, learning, and reproducibility (335).
The integration between the full control of microscope motorisation (337), image acquisition, real-time (or offline) image analysis, and the possibility to drive a new image acquisition, based on the result of the analysis, constitutes the backbone of what is called feedback microscopy (338), also referred to as smart microscopy (339). The purpose of such integration is to allow the adaptive imaging of the biological sample in the spatial and temporal dimensions (340).
In Figure 2, we present a possible workflow of feedback-based microscopy to identify infected cells and acquire them at higher resolution, minimising the overall acquisition time. A multichannel fluorescence image, including a nuclear marker and an infection reporter (Figures 2A–C), is used to identify all the cells in the field of view (Figure 2D) and measure the level of an infection reporter (Figure 2E). Using a ML clustering algorithm (e.g. k-means clustering), cells are classified based on their infection state (Figure 2F). Then, cells are selected depending on their level of infection (Figure 2G), and the microscope is instructed to navigate to the cell position (Figure 2H), switch objective (Figure 2I), and acquire a higher-resolution image (Figure 2J). This type of workflow presents the advantage of scanning larger areas to increase the number of inspected cells and use higher resolution imaging only for the infected ones, which are identified with an unsupervised ML algorithm.
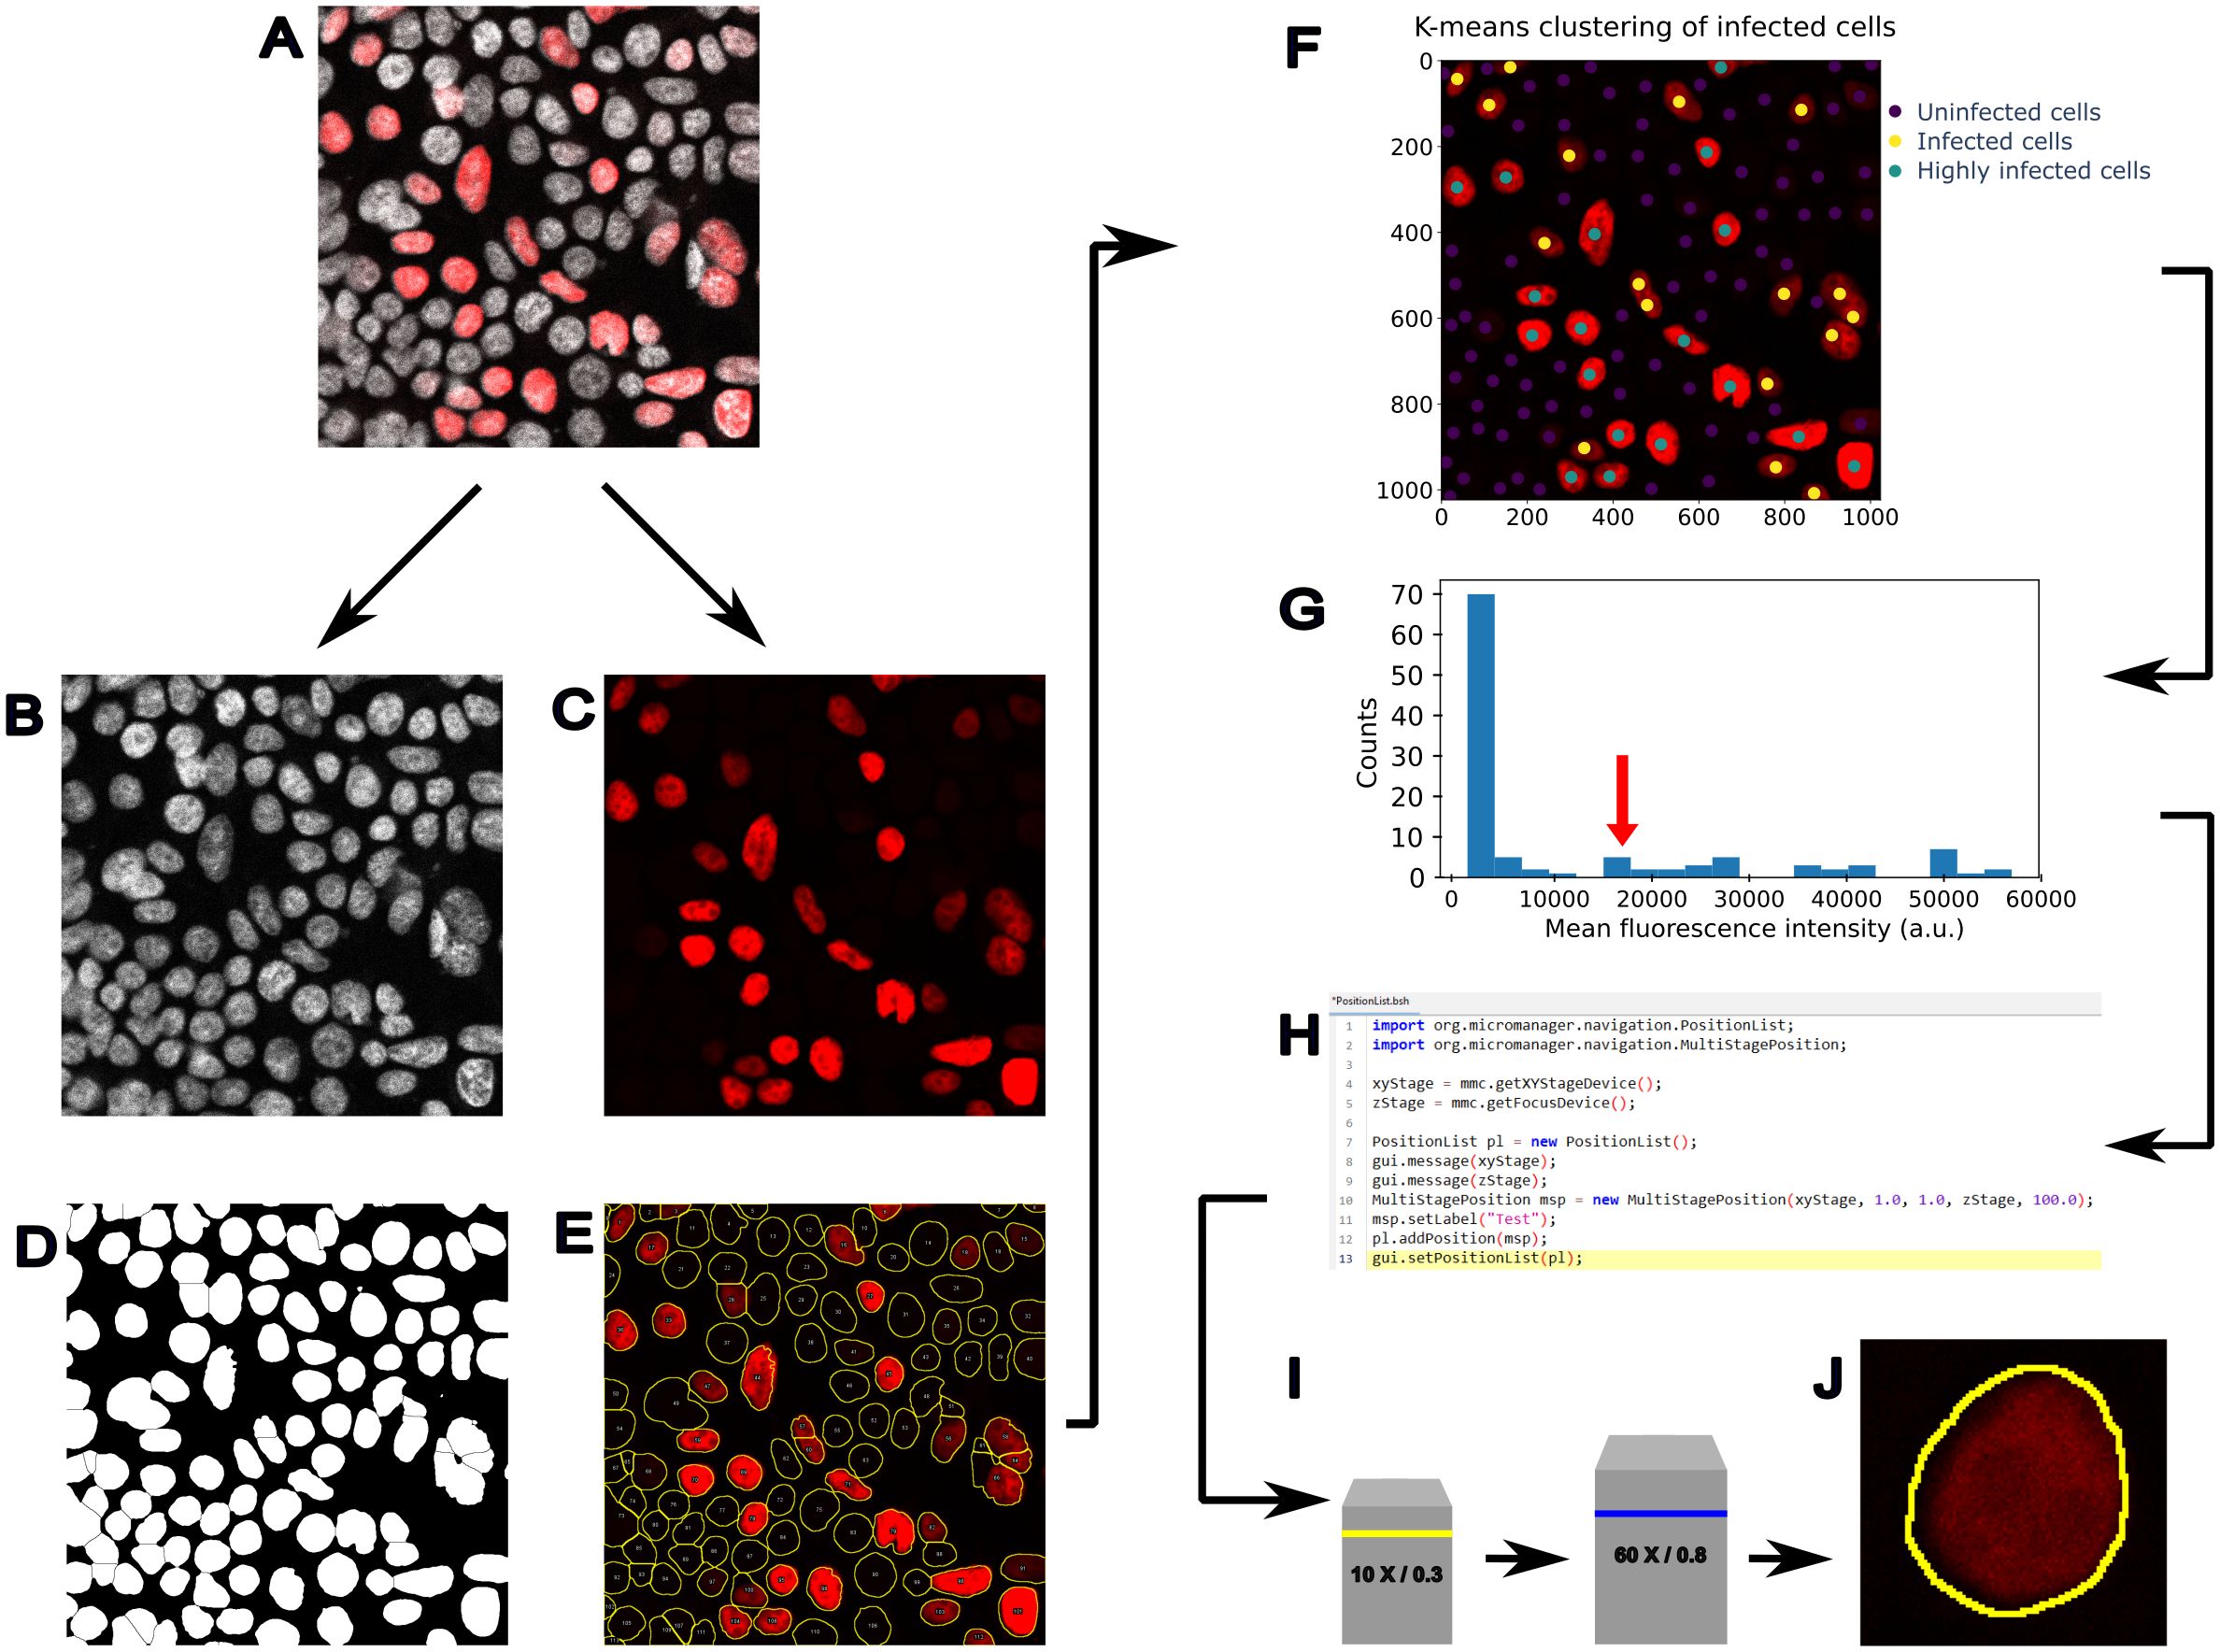
Figure 2. Example of feedback microscopy based on machine learning to analyse infected cells. An application of feedback microscopy to detect infected cells and trigger the acquisition at higher resolution. (A) Fluorescence image showing a nuclear marker (grey) and infection reporter (red). (B) The nuclear marker channel is used to identify all the cells, while (C) the infection reporter is used to detect the infected cells. (D) Binary mask obtained by thresholding the nuclear marker image in (B, E) The segmentation outlines are used to measure the fluorescence in the second channel (red) and assess the level of the infection reporter. (F) K-means clustering can be used to identify cell populations and drive the acquisition of infected cells at higher resolution. In this image, the k-means clustering is initialised by assuming 3 cell populations corresponding to possible levels of infection. After clustering, the cell centroids are labelled with coloured dots, according to the level of infection: uninfected (dark blue dots), infected cells (yellow dots), and highly infected (green dots). (G) The infected cells classified by the k-means clustering show a higher level of fluorescence, and cells with a specific value of fluorescence reporter can be identified to trigger a (H) repositioning of the stage at a specific location (X,Y), executed through a script (e.g. Micro-Manager beanshell script) and a (I) change of objective lens. Finally, (J) the identified cell can be acquired at higher resolution.
Examples of software tools for feedback-based microscopy include AutoscanJ, for the detection of mitotic cells or chromosomal anomalies, based on the same principle of rescanning cells of interest, previously detected with lower magnification (341) or the real-time drift correction in intravital movies (342). In the field of RT-EM, a similar approach has been developed by SerialEM software (14) and its Python interface pyEM (343). This approach was used in the contests of immunological research to show, with tomographic reconstructions, that plasma cells in patients with multiple myeloma display elongated centrioles (344). Another application has been developed for combining light microscopy and FIB-SEM (336). In single-particle cryo-EM, automatic acquisition is even more important because thousands of images are needed to perform a structural reconstruction (17, 345). In cryo-ET, machine learning approaches were used to fully automate in-situ cryo-ET workflow (346).
While some scripting tools, such as ImageJ macro language, are very popular in the bioimage analysis community (347), the complexity of back-end programming languages (e.g. C or Java) to develop software plugins may hinder the quick implementation of novel ideas. To facilitate the use of feedback microscopy, projects like Pycro-Manager (348) or pymmcore2 have been created to implement translation layers between programming languages (in this case, Python can be used to write scripts rather than Java). On the other hand, the Open-Source Hardware (OSH) movement has allowed the implementation of cheaper solutions for image acquisition compared to proprietary microscopy software. Projects like Micro-Manager (349) to control microscope hardware have revolutionised the field, decoupling the need for commercial licences to operate devices from the mere possession of the equipment. In addition to gaining control of microscopy equipment, the possibility to trigger and modulate the image acquisition with plug-in electronics, for example based on Arduino3 or Raspberry Pi4 development boards, has widened the possibilities to customise every microscopy platform. However, technology development requires the developers or early adopters to carry the risks of investing resources in technologies that might have limited or delayed benefits. Then, the advantage has to be identified either in the reduced cost of existing open technology or in access to bleeding-edge techniques, which might be rewarded in terms of scientific publications (350).
Finally, Computer-Aided Design (CAD) for machining or 3D printing of microscope components or auxiliary devices has improved the use of resources to run microscopy experiments. Examples include the open optical setup of light-sheet system openSPIM (351), the possibility of fully 3D printing experimental tools or the wide database of open hardware projects developed by the imaging community (for example, by the LIBRE hub5). These can include accessories such as syringe injection motors, sample supports, frames for optical filters, enabling components based on electronics (352), or even part of the microscope body, etc. (353). The adoption of OSS or OSH solutions is also strictly dependent on their discoverability, modularity, and the standardisation of the software interface (354).
The revolution of openness in scientific software and hardware is not necessarily in opposition to the business model of microscopy companies (355). In fact, at the request of bioimaging researchers, many companies offer support for the use of open software, such as OMERO (supported by Glencoe6356), or have opened part of the software by offering an API to interact with some of the GUI modules, such as Zeiss7 with APEER platform for deep learning (357) or Abberior8 with the possibility to reprogram the hardware configuration (358). In addition to the highly beneficial effect on the broader research community, we believe that companies can also benefit from the openness of both software and hardware. This applies whether resources for science are scarce or research is well funded, because there is always a business model that can be adapted to provide a service for less experienced users (355), and the wide adoption of open imaging solutions by companies enlarges potential customer markets.
The need for openness is even more pressing when AI solutions are implemented, as AI methods are inherently based on probability and as such not prone to reproducibility, and often the general audience employs such methods without a thorough understanding of their applicability and limitations. The second part of this Review aims to clarify some of the concepts and uses of AI for microscopy and immunology.
3 Artificial intelligence for microscopy with applications in immunology and virology
3.1 Historical introduction to AI
The concept of artificial intelligence takes root in Leibniz’s characteristica universalis, a common unified language of pure thought in which every language could be translated, and in calculus ratiocinator, a machine capable of replicating that language (359). Computers were meant to take a set of rules and input data and return some output, but could they think autonomously or even generate novel ideas (360)? This question is still guiding research in the AI field. In the 1940s and 1950s, progress in computational capacity motivated people to explore applications in the domain of pattern recognition, where the human brain excelled. In a seminal paper, McCulloch and Pitts (361) proposed the model of a network that took inspiration from the structure of the brain. This network was composed of a single input and output neuron, with an activation state that would contribute to the final output of the network. Later, developments on this original idea extended network complexity to a multi-layer network (362) and developed algorithms to train networks with more than one layer (backpropagation, 363–365).
In today’s technologies, artificial Neural Networks (NN) are built from a collection of nodes (neurons), operating a set of transformations on the input data to learn different representations of it. Nodes can be aggregated in layers and are connected by activation functions (synapses) computing a weighted sum of their input data. When the NN is trained, some connections get stronger, causing them to acquire a higher weight, while others get weaker, thus reducing their weight. So, NN training is essentially a problem of optimisation of parameters (366, 367). Training occurs iteratively: at each cycle, the network’s weights are optimised, and a loss function — an objective measure of training success — is measured (368). This process continues until a stopping point, such as reaching a specified value of the loss function or after a certain number of iterations. A network may perform poorly because of lack of convergence to validation data (underfitting) or lack of generalizability (overfitting). The choice of loss function is an important part of model design (369), along with the definition of layers and their connection types, which are collectively referred to as network architecture. For example, annotated tumour areas in tissue slices are used as ground truth, and the NN predicts which areas could be classified as tumour in the same slice (370). The loss function estimates how precisely the network predicts tumour areas. After the training phase, the network is applied to predict labels (tumour or healthy) on new tissue slices.
3.2 Machine learning or deep learning?
Machine learning (ML) is a subfield of AI (Figure 3A) that enables systems to learn from data without being explicitly programmed. It focuses on building models or algorithms that can make predictions or decisions by identifying patterns in the data and using them to improve performance over time (378). There are four main types of ML approaches: supervised, unsupervised, self-supervised, and reinforcement learning. Supervised learning is trained on a previously labelled data set that represents bona fide the desired outcome, so both the input and desired output are known. This highlights the importance of preparing a training data set that is most representative of the desired outcome, a simple task in principle but one that should be performed with great care (379). By contrast, unsupervised learning finds a structure from the data itself without any prior labelling information. This is a commonly employed technique when unbiasedly clustering information (Figure 3B: middle row) and grouping differences in classes. For example, k-means clustering or Principal Component Analysis (PCA, Figure 3B: middle row) belong to this category. Self-supervised learning finds a classification by predicting or completing parts of its input, creating labels automatically from unlabelled data. For example, a self-supervised model has been developed to automatically learn semantic relationships between genomic data and improve tasks such as gene annotation or the role of polymorphisms (380). Lastly, Reinforcement Learning (RL, Figure 3B: bottom row) involves an agent interacting with an environment and learning through trial and error. It’s often used in broad AI tasks, such as AI-assisted game-playing and autonomous driving systems (376). Any ML workflow comprises a set of input data, a model architecture, and one or more loss functions. ML models can range from low-complexity models with few layers of data transformation – shallow learning – to higher complexity models involving many layers and many connections between them – deep learning.
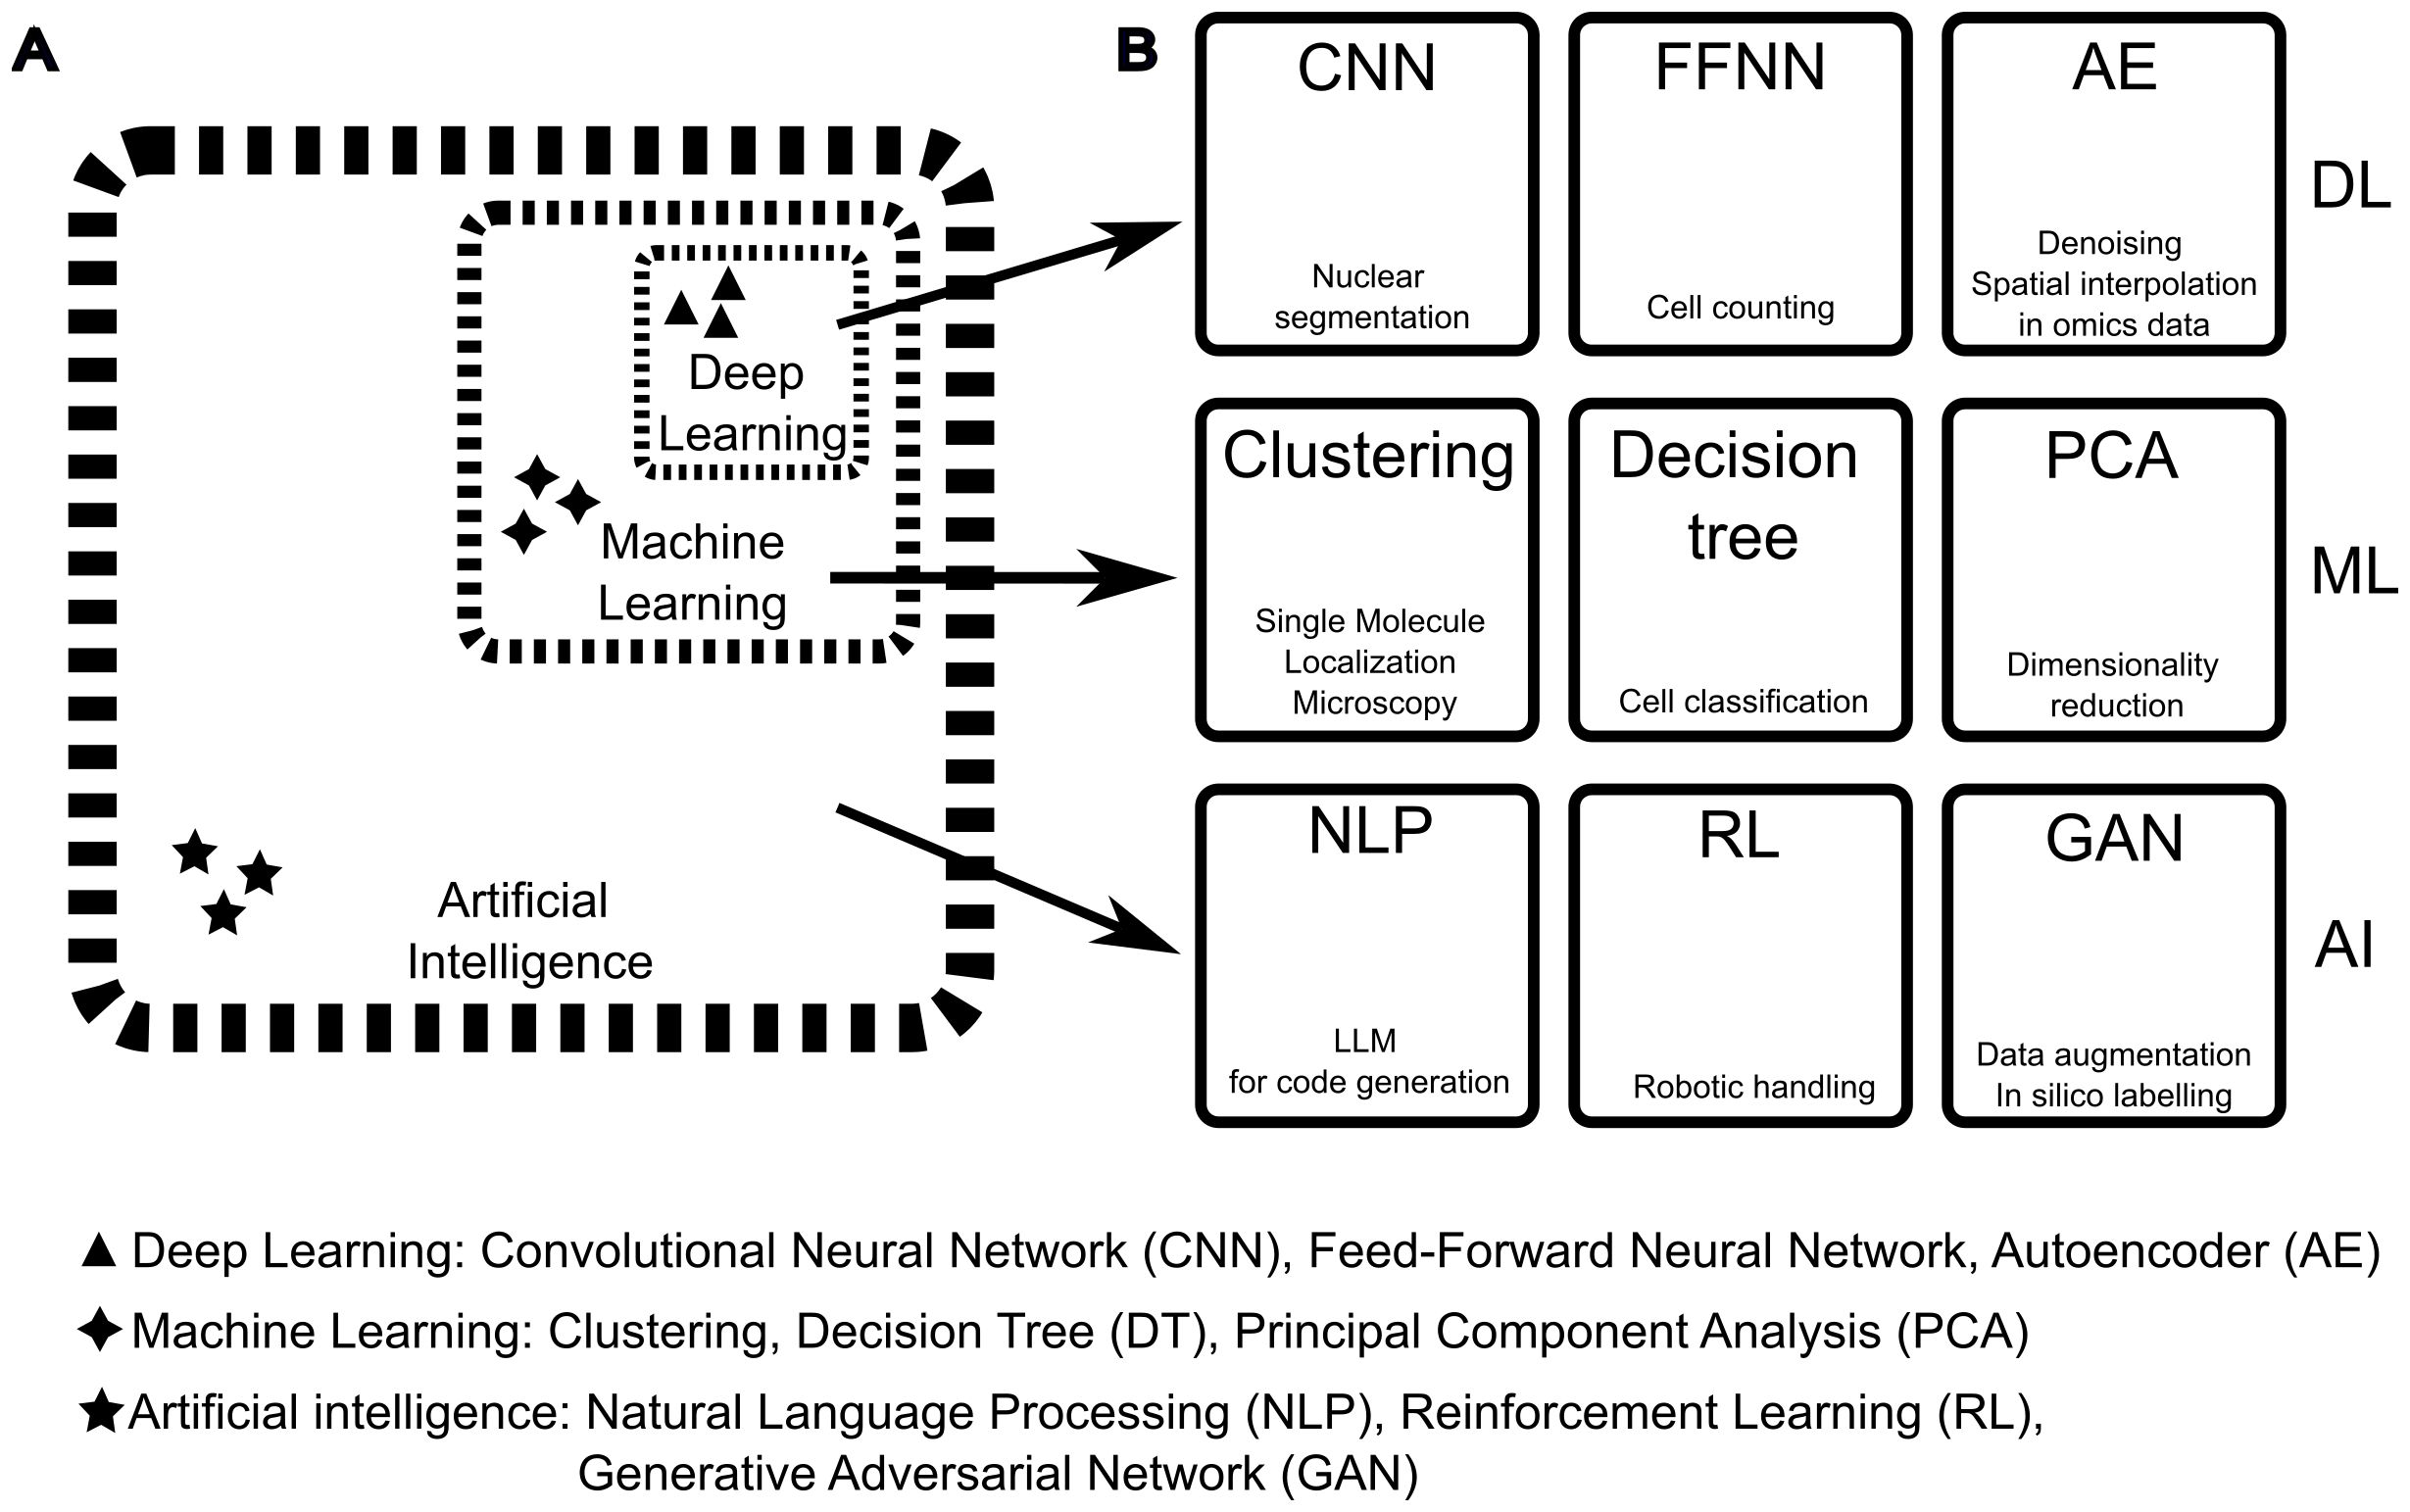
Figure 3. Difference between Artificial Intelligence, Machine Learning, and Deep Learning and examples of methods applicable to microscopy and image analysis. (A) The field of Artificial Intelligence (AI) builds on several disciplines, such as mathematics, physics, biology, and electronics. AI includes a vast collection of computational methods and includes methods categorised as Machine Learning (ML). The latter includes a subcategory defined as Deep Learning (DL). The boundaries between AI, ML, and DL categories should be considered quite permeable as techniques are shared and new hybrid methods are developed. (B) Examples of DL, ML, and AI methods (text on top of the squares) with application to immunological imaging (text on the bottom of the squares). in this figure, the same acronym is used for the singular and plural names of each method. From left to right, for DL: Convolutional Neural Networks (CNN) such as StarDist (371) can be used for crowded nuclei segmentation, Feed-Forward Neural Networks (FFNN) that have been adopted for cell counting (372), Autoencoder networks (AE) that have been used for several analytical tasks such as denoising and spatial interpolation in spatial omics data (373). For ML, from left to right: Clustering methods such as DBSCAN for Single Molecule Localisation Microscopy, Decision Tree methods like random forest for cell classification (322), Principal Components Analysis (PCA) for dimensionality reduction in data analysis including multiple cell measurements (374). For AI, from left to right: Natural Language Processing (NLP) for data mining and code generation (375), Reinforcement Learning (RL) for autonomous improvement of AI models and hardware control (376), and Generative Adversarial Networks (GAN) used for data augmentation to improve the efficiency of image segmentation and interpolation of imaging data sets (377).
Deep learning (DL) is a subfield of machine learning (Figure 3A) where many layers of data representation are connected to create a complex model with multiple levels of abstraction. Even though many foundational concepts and algorithms have been developed in the twentieth century, practical advancements in DL are relatively recent. Three practical steps have contributed to these advancements and to a general renaissance in the field of AI (368). First, the development of small yet significant algorithms enhanced how these deep stacks of layers can be interconnected (366, 367). Second, bigger storage was available to host the growing training data sets. Lastly, cheaper hardware increased computational power. In fact, DL models are based on simple additions and multiplications of big multi-dimensional arrays of data (called “tensors” in mathematics), and these operations can be easily parallelised. The development of powerful graphical units (GPUs), originally designed to improve the gaming experience but with the ability to be programmed for massively parallelised calculations and scientific computing, led to the implementation of GPU-based NNs (381, 382). Today, along with gaming GPUs, researchers can also leverage dedicated GPUs, optimised for DL tasks, and specialised hardware such as tensor processing units (TPUs), with the potential for requiring less computational resources and becoming an integral part of all domains of science, including microscopy. However, practical implementation of these networks still requires programming skills, with Python being the primary development language; popular frameworks include Tensorflow/Keras (368) and Pytorch (383). DL algorithms are affected by hardware bottlenecks in steps that are not hardware accelerated, therefore some attempts have been made to leverage alternative electronics boards like field-programmable gate array (FPGA, 384), which offer the flexibility of reconfigurable circuitry. For applications requiring low power consumption, FPGA have shown to be from 3 to 5 times more efficient than GPU per processed image, for tasks such as image compression (385). The advent of “liquid” and more efficient hardware such as FPGA will dictate the pace by which AI methods are implemented in microscopy and other fields.
To conclude, ML and DL techniques include computational systems capable of learning from data. Shallow ML systems continue to be utilised for their rapid training, minimal computational resource requirements, and low complexity, allowing for a complete understanding of how they operate. In contrast, DL systems require significantly more computing resources but have considerably higher capabilities, thus aiding all areas of microscopy, from experimental design to image acquisition, analysis, and data mining (386). These two types of systems are often used together in algorithms mixing classic programming, traditional ML, and DL according to the task (this permeability is reflected in the dashed lines of Figure 3A).
3.3 Image-based machine learning
Image-based ML methods can preprocess images or segment, detect, and track objects within multidimensional microscopy images. The most used approach is supervised learning, which employs a manually segmented data set to train the model. Traditional, shallow ML techniques for image segmentation include Support Vector Machines (SVM) and Decision Tree classification (Figure 3B: middle row). Such ML models can yield good results across various applications and are featured in numerous open-source image analysis platforms (ilastik (322), Fiji/ImageJ with WEKA (387) and LABKIT plugins (388), QuPath (332), CellProfiler (323), MIB (389). They are user-friendly, can be used even without programming experience, and demand fewer computational resources compared to DL (388).
On the other hand, DL approaches for image processing have expanded the range of problems that can be solved (366). In the case of image-based methods, they are primarily employing a type of NN called Convolutional Neural Network (CNN, Figure 3B: top row, 359, 379). CNNs use layers to extract hierarchical representations of input data, in a way similar to how we learn information on an object by viewing it from different distances or angles. These layers implement two data processing functions: the convolutional filter (hence the name) and the max pooling function. Convolutional filters act like a magnifying glass that scans an input image while applying different kernels (a small matrix) to the image at each position. These kernels help identify specific features within the image, such as edges or corners. The result of this operation is referred to as a feature map, which highlights where these features exist in the image. Max Pool operations are used after convolutional layers to reduce the spatial size of the data while retaining important information, thereby making the network more efficient for computational analysis. Here, we will survey the landscape of current applications of image-based DL methods to the microscopy modalities that we previously discussed, highlighting, where existing, their applications to immunology or virology (Table 1).
A major theme in DL applications to many microscopy techniques has been finding ways to increase the wealth of extracted information and overcoming the limitations of the specific techniques, such as increasing resolution without sacrificing acquisition speed. In cryo-ET, DL has been used to learn structural information from single-particle cryo-ET analysis (390) or to achieve isotropic resolution without the need for sub-tomogram averaging (391). In single-particle cryo-EM, DL aided particle model-building by creation of intermediate-resolution maps (392) or model building automation (393). In virology, DL with single-particle cryo-EM has been instrumental to the characterization of tegument architecture in human cytomegalovirus (394). In super-resolution, and specifically in localisation microscopy, DL has been used to increase the acquisition speed, by reducing the number of images needed to reconstruct the structures of interest (109), or to help in localising multiple adjacent emitters in 3D, thus improving volumetric reconstructions (110). In immunology, DL with STED has been applied to identify Zika virus reorganization of the endoplasmic reticulum (111). In SIM microscopy, DL can increase resolution and speed (395–397), thus better capturing live-cell events with lower phototoxicity. In confocal and spinning-disk microscopy, DL can increase image resolution (113, 117), reduce optical aberrations (114), and improve FLIM lifetime determination with low photon budget, as in fast live-cell imaging (115). In TIRF, DL helped in improving single molecule FRET (smFRET) by analysing single molecule traces (112). In wide-field microscopy, DL was used to enhance the resolution and optical sectioning capabilities (30, 123, 124), yielding confocal resolution while improving speed. In intravital, microscopy, DL approaches combined with two-photon excitation and adaptive-optics aberration correction have improved subcellular resolution without sacrificing acquisition speed (133). Finally, DL has been applied to light-sheet microscopy for physics-informed deconvolution, i.e. a combination of DL with optical information on the microscope setup (134). In light-sheet and confocal microscopy, DL also provided axial resolution enhancement, by learning from unpaired high-resolution, 2D confocal images and low-resolution 2D images from other planes (113).
Methods to improve resolution, signal or speed often apply to a specific imaging modality and do not translate well to other image modalities. Recent DL models have tried to provide a more general approach, for example when restoring fluorescence images from all imaging modalities (398), improving resolution without additional data acquisition (399), interpolating images between frames (400) or when performing object detection (401).
Major limitations of fluorescence microscopy are photobleaching, phototoxicity and limited speed when acquiring multiple channels. DL methods can overcome these limitations by providing in-silico labelling of transmitted light images (126–129). For example, DL with in-silico labelling of brightfield images has been used to improve the tracking in chemotaxis experiments (131), or to predict the lineage choice of differentiating hematopoietic progenitors (130). Finally, DL has been applied to phase, label-free imaging (125), or to achieve fast, volumetric live-cell microscopy of bioluminescent probes (402). In immunology, DL with optical diffraction tomography has been instrumental for label-free tracking of immunological synapse of CAR-T cells (403).
DL methods are now widely used for preprocessing, segmentation, detection and tracking tasks (379, 404). In image preprocessing, DL models are extensively used to denoise fluorescence images, as indicated by the many examples in the literature (290, 398, 405–414). In immunology, DL denoising was instrumental to improve contrast in Imaging Mass Cytometry, thus helping in characterizing the phenotype of immune populations in human bone marrow samples (415). DL helped in separating channels for filter-free imaging (125, 416, 417), and to assist tracking by improving linking accuracy (316, 320, 418). Also, DL is aiding cell phenotyping from multiplex immunohistochemistry images, for example to characterize tumour microenvironment in lung cancer (121) or pancreatic ductal adenocarcinoma (122). Finally, DL models can assess the quality of fluorescence images and identify artefacts (419). Moreover, DL has been applied to denoise low-dose cryo-TEM images (420).
DL is employed in supervised cell segmentation, such as in the case of general models U-Net (421), StarDist (371), Cellpose (422) and Segment-Anything Model (SAM) models (423, 424), which are available as plugins in many open-source and proprietary image analysis software. Specialised models tackle intracellular organelle segmentation (327, 425), segmentation of extracellular vesicles in TEM (103), HIV-1 virions in TEM (104) or mitochondria in FIB-SEM (426). In immunology and virology, DL has been applied to FIB-SEM images of SARS-CoV2 patient-derived platelets to segment α-granules or mitochondria (105). Ligh-sheet microscopy of lungs together with DL-based analysis allowed the spatial profiling of nanoparticle delivery to alveolar macrophages (135). Image segmentation is a challenging part of image analysis in multiplex imaging, where cells are often densely packed. In this case, DL was employed to perform cell segmentation, thus improving single-cell feature extraction (118, 119), or to perform a detection-based classification, therefore providing phenotypic analysis without segmentation (120).
In detection tasks from fluorescence images, DL helped in recognizing apoptotic cells from intravital multiphoton movies (427), phototoxicity in widefield time-lapse experiments (428) or, together with widefield high-content screening, to detect virus-infected cells and predict if they will follow a lytic or non-lytic infection (429). Furthermore, DL with confocal microscopy helped in classifying expression of TLRs from PBMCs of HIV-positive patients under ART therapy (430). In cryo-ET, CNNs are helping annotation and feature extraction for in situ identification of structures of the molecular components of interest (431), or template matching, i.e. detection of objects with an arbitrary shape, which is the most widely used approach in cryo-ET for particle picking (106). Still in cryo-ET, DL has been applied for finding macromolecules in cellular 3D tomograms (28). DL detection algorithms can also support feedback microscopy in real time (432) by automatically detecting events to guide acquisition, generate feedback, and predict cell fate.
In tracking, CNNs with intravital multiphoton microscopy have been used to accurately measure the position and shape of CD4+ T cells interacting with plasmacytoid dendritic cells in vivo, aiming to study interaction differences in lupus nephritis (132) or to link cell tracks in intravital imaging of leukocytes (433).
One of the limitations of supervised learning is the generation of accurate training data sets, which is, in most cases, a manual task that can be time-consuming and still prone to bias. A possible approach to overcoming this limitation is the use of self-supervised methods. For example, information from the OpenCell database was used to cluster proteins into organelles and individual protein complexes (434). Similarly, in another study DL was used to segment mitochondria, based on a training data set that was generated with DL (435). Such simulation-supervised approach could be, in principle, generalisable to other organelles or even to cellular segmentation in tissues. Self-supervised or weakly supervised models are also employed for cancer prognosis and diagnosis in pathology slides (436).
Overall, image-based DL methods are assisting a wide range of microscopy techniques in tasks from acquisition to image analysis and data extraction (Table 2). Many of the above examples are widely applicable to different types of samples, including those related to immunology or virology.
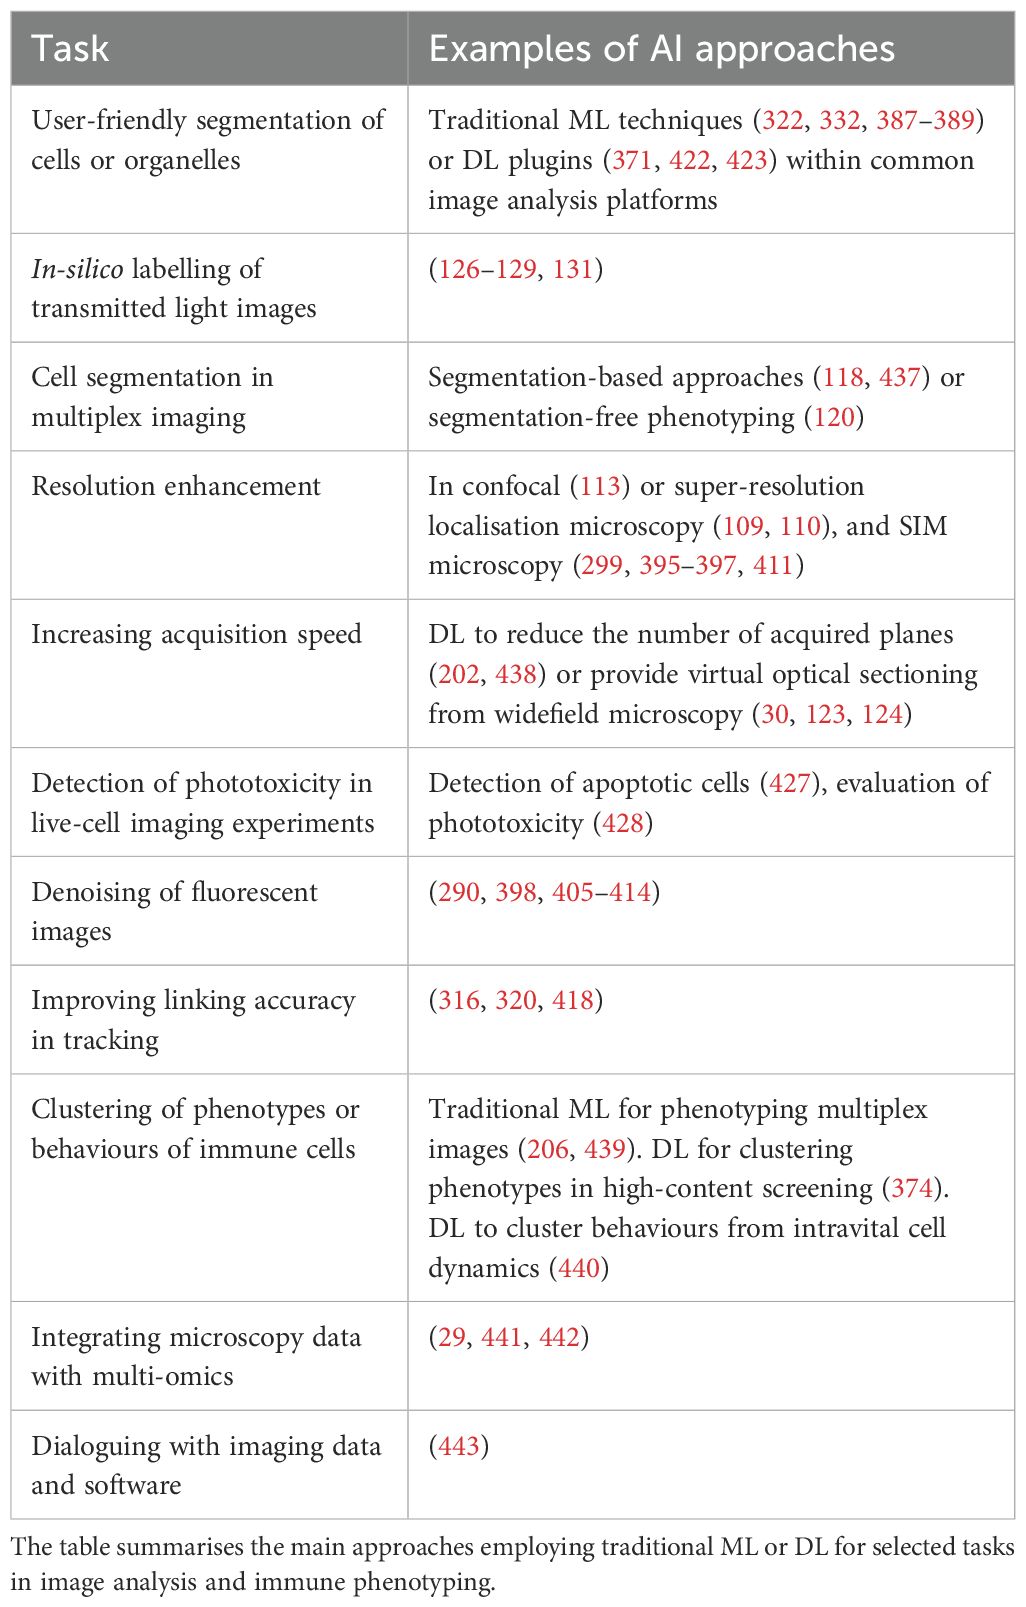
Table 2. Examples of AI approaches for selected tasks.
3.4 Data-based machine learning
Data-based ML can analyse, interpret, and learn from data. In this Review, we refer to data-based methods as the ones that can be applied generally to numerical or categorical data without the specific need for data to be generated with imaging techniques. For example, data-based ML is used in microscopy when clustering data extracted from images with the previously described image-based methods (442, 444), or when combining information from microscopy with text data generated with other methodologies, such as genomics or proteomics data (445). These tasks can be approached using traditional, shallow ML or DL.
Techniques using traditional ML include linear regression, logistic regression, and decision trees, such as Random Forest. For example, logistic regression was employed to predict MHC ligand, where a binding model and an antigen processing model were combined, and results were classified according to logistic regression score (446). Random forest was applied to analyse T cell-dendritic cell interaction in a lupus nephritis model (132).
Instead, unsupervised learning techniques are employed when the desired outcome is unknown or input data are not labelled. In this case, unsupervised learning can help clustering data in groups. Notable examples are the K-means, DBSCAN, and an unsupervised version of random forest algorithms (378). Clustering techniques have been used in high-throughput screenings to highlight differences between biological conditions when segmenting and measuring cells (374), or, in immunology, to cluster signatures and perform neighbourhood analysis in multiplex imaging in tissues (206, 439, 447) and single cells (246).
Another set of techniques, called dimensionality reduction, is used to group variables into “super variables”. Techniques falling in this category are PCA, t-SNE, and UMAP (378). Dimensionality reduction has been used to classify cell cycle and disease progression after feature extraction with CNNs (448), to segment touching cells in confocal and two-photon microscopy (449), to group clonal distribution of CD4+ T cells in gut epithelium following Listeria monocytogenes infection (450), or to obtain behavioural signatures of immune cells in intravital inflammation models, guiding the discrimination between pathogenic and non-pathogenic phenotypes (440). Also, dimensionality reduction techniques are essential in multiplex imaging when grouping cell phenotypes (240, 451).
DL for data-based methods can employ different types of architecture depending on the purpose. An Autoencoder Network (AE) is a type of NN that learns to encode input data into a lower-dimensional representation and then decode it back into the original form, thus learning meaningful representations from the data. This can be helpful for tasks like dimensionality reduction or feature extraction. AE (Figure 3B: top row) has been used to combine low-dimensional representations of scRNA data, generated using large language models, with actual single-cell scRNA-seq data from different species to create a supergene classification that can bridge differences between individual single-cell experiments and different species (452), or to create deep generative models for spatial-omics analysis that can take into account the spatial relationship information (373). A Feed-forward neural network (FFNN, Figure 3B: top row) is another type of NN where information flows only in one direction (forward) through layers of interconnected nodes. FFNNs are commonly applied to regression and classification tasks, as they can learn complex non-linear relationships between inputs and outputs. For example, a feedforward network was used to classify cell tracks in 3D biomimetic gels of immune cells co-cultured with breast cancer cells in organ-on-chip (453).
Recurrent Neural Networks (RNNs) excel at processing sequential data like natural language text, where the context of previous words influences the use of subsequent ones. After dividing data into small chunks – called tokens –, RNNs process them recursively to generate the most likely information based on the previous information. For example, this type of network could predict the cell lineage of hematopoietic cells from brightfield images by extracting time signatures of cells from image features extracted with a CNN (130).
On the other hand, transformer networks weigh the importance of input tokens to construct a connection map without requiring sequential processing (454). They are at the basis of the Natural Language Processing (NLP, Figure 3B: bottom row) chatbots used today, such as ChatGPT, and are also called Large Language Models (LLMs). These tools can serve as a valuable resource aiding researchers in designing microscopy experiments (455) or drafting algorithms to implement the ML techniques described here. LLMs can be applied to data mining in scientific data sets, such as those generated from single-cell omics (as reviewed in 456), and some attempts exist to apply it to bioimage analysis (443, 457). We also foresee that these techniques will be increasingly integrated in microscopy hardware, for AI-assisted sample exploration and acquisition.
Another type of generative network is called Generative Adversarial Network (GAN, Figure 3B: bottom row). This network comprises two networks, one generating new data and the other evaluating its suitability as output. The generating network challenges the evaluating network, thus introducing an element of randomness and “creativity” in the output (458). This broad class of networks can be used to generate models of protein structures (the general AlphaFold (459) and its open version OpenFold (460), or a more specific version for proteins of the immune system (461)) or to reconstruct molecules from cryo-ET tomograms (390, 462). Generative neural networks informed on the features of highly metastatic melanoma by “reverse engineering” a supervised CNN for cell classification. In this example, a CNN is initially trained on patient-derived melanoma xenografts to classify them based on their metastatic capability. Then, a generative neural network is used to create in silico cell images with exaggerated features, which are then used to analyse which features in the CNN are most prevalent (463). This approach is particularly intriguing as it uncovers new quantitative insights within the hidden features of DL, thereby providing information that could potentially lead to the generation of new scientific hypotheses.
In summary, we outlined some applications of data-based ML techniques for microscopy (Table 2). The field is vibrant and complex, and evolving at a fast pace. Shallow ML and DL can be employed to cluster information and combine microscopy data with multi-omics data (29, 441, 442), or to predict molecular biomarkers from pathology images (464). These technologies could aid vaccine design, as outlined in Hederman and Ackerman (465) or to improve antibody design (466). As such, a dialogue between computer scientists, microscopists and immunologists is fundamental.
3.5 Impact of open-source software in AI deployment and democratization
AI can hugely facilitate the analysis of large image data sets and the characterisation of rare biological events. Because OSS solutions can rely on the contribution and critical judgement of the wide imaging community, they are indispensable for the development of trustable AI applications for bioimage analysis. In this regard, several software tools have been deployed during the past years, both as plugins for the major software GUI such as FIJI (StarDist (371), Cellpose (467), DeepImageJ (468)) or napari (SAM (423)), or as code notebooks (ZeroCostDL4Microscopy (335)).
In the previous sections, we outlined the main DL applications to analyse bioimage data, many of which are distributed as open-source software. Although some of these applications were not specifically developed with immunology in mind, their usage can significantly benefit immunological imaging. For instance, existing code can be adapted for specific biological questions, or their training data can be used to enhance other domain-specific DL models.
Furthermore, publicly available image databases are key in truly open-source AI models (469), as outlined by the Open-Source AI Definition9. In this sense, data sets specific to the immunological field (319), or for broader imaging purposes, such as the ones hosted on BioImage Archive (470), can constitute a valuable resource of image data to test AI software tools and foster immunological research. These data sets should follow the “Findable, Accessible, Interoperable, Reusable” (FAIR) principles (471).
Finally, the use of LLMs or other AI methods to aid software creation (443) will constitute an essential part of AI deployment and democratisation, as it empowers every scientist, even without programming experience, with the “wisdom of the crowd” provided by AI training data sets that can summarise a vast amount of human knowledge.
3.6 AI for instrument control
The role of AI for instrument control and automation can be delineated in at least two different ways: the first being the support of AI in automating the development of open-source code (443) for feedback microscopy, while the second involves utilising the AI-based methods described above to interpret the image data, thereby revealing information that can be used to redirect the acquisition process.
The use of open-source platforms Micro-Manager (349) or Pycro-Manager (348) for microscope control can be integrated with Python packages such as Scikit-Image10 (472) for image segmentation and Scikit-Learn11 (473) to run ML tasks and feed results back into the acquisition software. As a practical example, DL segmentation methods have been used to identify cells and set the correct acquisition parameters (474) or switch microscopy modality (31) to image immunological synapses. Furthermore, cost-effective open hardware facilitates possible integrations of the acquisition microscope with AI feedback tools, for example to control anaesthesia, temperature, and humidity in intravital imaging (similarly to approaches tested in the clinics, 475, 476), or correcting the state of the optical system by acting on adaptive optics to minimise the loss of signal (238).
The implementation of AI for instrument control is automating the execution of precise and complex hardware tasks, shifting the troublesome duties from the human to the machine. In our view, rather than totally delegating the control of the experiment and the handling of expensive instruments to the automatic agents (as a kind of hardware/software AI-equipped decision maker), the implementation of AI tools should work as advanced technology to help the human researcher in steering the course of the experiment. In this regard, the integration of large language models and feedback microscopy is foreseen as the future evolution of microscopy, where the user doesn’t necessarily need to be highly skilled in all the aspects of microscope acquisition, hardware control, bioimage analysis: a microscopy platform could accept human language instructions and convert these into hardware control operations to provide the requested type of data sets (477).
4 Discussion
In this Review, we surveyed the primary applications of light and electron microscopy in immunology and virology for preclinical research, outlined the concepts of AI, ML, and DL, and explored their current uses in microscopy, image analysis, data analysis, and feedback microscopy. Although we mentioned studies employing microscopy and AI in immunology, the intersection of these fields remains largely unexplored. For instance, many of the tools discussed are designed for specific applications, and few attempt to integrate multiple imaging modalities or tasks. Lack of generalizability, when not due to training issues, is a major challenge in the current research on DL and microscopy. On this topic, Kawaguchi et al. showed that analytical insights into building more generalizable architectures could be drawn when using specific loss functions and concluded on the importance of human reasoning on the physical properties and engineering principles of the specific problem at hand (478). We believe this capability could arise either through AI-assisted multimodal visualisation or through a combination of direct visualisation and AI computational modelling of structures or dynamic events.
DL networks concatenate many hidden layers to generate a rich output, and although these layers are just composed of numbers and simple operations, understanding how the output relates with their inner functioning is exceptionally challenging. Also, the mathematical structure of DL makes it prone to hallucinations, i.e. the generation of plausible but incorrect output (479). These two problems could be seen as epistemically relevant if we treated the output as scientific knowledge in its own right, without further experimental verification (480). Rather than seeing this as a problem, we think that integrating DL with additional local data, for example from microscopy or other techniques, could enhance our ability to interrogate data and generate additional perspectives (27, 481), potentially inspiring new scientific ideas, to be later supported by rigorous verification, or highlighting the limitations of current theories (482). Finally, the use of AI in real-time contexts requires an evaluation of the possible outcomes of AI hallucinations, with respect to model reliability and consistency. In this regard, the openness of the AI-decision making process, the integration with traditional techniques and a dialogue with the human researcher still have a prominent role.
While one might be tempted to attribute some level of understanding to AI models, it is essential to recognise that these models merely process numerical representations of data generated through mathematical transformations (368). As such, their ability to think is as limited as the size of the data set and the types of possible transformations. This highlights the importance of dataset preparation to achieve reliable outcomes, as well as the need of a community effort for more curated, freely accessible, “FAIR” (471) microscopy data. The careful evaluation of possible cognitive biases during curation of training datasets is very important (483). For example, researchers can assess the imbalance between classes, i.e. the under-representation of certain types of conditions during data generation, the uniformity of data acquisition across instruments or laboratories, the quality of annotations or the methods used for data augmentation (484). Also, the application of AI might require considerations about data privacy and the openness of AI models, especially when relying on external services for the AI processing. Steps to make AI more accessible and broaden its usage include creating efficient models that require less hardware resources and could be used on low-cost computers, or designing better user interfaces to guide the user in all the phases of AI implementation, such as with data quality assessment and data preparation, with the choice of NN architecture, with model validation and during model usage. For example, projects like DeepImageJ (468) and its model sharing platform BioImage Model Zoo12 are going in this direction. Finally, a rigorous determination of the amount of scientific data needed to obtain reliable training is required, as well as techniques for performing automatic choice of DL architecture and training (485).
A cross-disciplinary approach that includes skills in biology, microscopy, electronics, and software programming is necessary for implementing AI-based hardware and software tools. This approach could help shaping open, local models with efficient use of hardware resources, to the benefit of real-time hardware control. To achieve this fully integrated use of AI tools, LLMs can help in data mining and code drafting tasks but are still limited in their capabilities to precisely manipulate factual knowledge, for example to provide advice on microscopy. A step towards more specific and fact-based AI tools is represented by Retrieval-Augmented Generation (RAG) models (486). Ideally a general model, for instance a chatbot such as BioImage.IO (455), could understand better the initial request for help posed by a human researcher (e.g. “find the organelle in these cells”) and could drive a more specialised model, for example a CNN, to perform specific tasks (e.g. segmenting specifically mitochondria).
Looking ahead, we can imagine a future where multiple AI models, or agents, could act on specific parts of the microscopy process (487). New DL agents could integrate fact-checked advice on experiment design with code generation models, AI-based hardware control and analysis models, to assist the user across the whole research cycle. Integrating AI, imaging data science and microscopy automation will allow the automatic monitoring of the sample, the detection of anomalies, and the adaptive change of hardware to guide the acquisition of key biological events, thus enhancing our visualisation capabilities across scales and our systemic understanding of the immune system.
Author contributions
DM: Writing – review & editing, Writing – original draft, Conceptualization. RD: Conceptualization, Writing – review & editing, Writing – original draft.
Funding
The author(s) declare that financial support was received for the research and/or publication of this article. This work was supported by the Institute for Research in Biomedicine, which receives core funding from the Helmut Horten Foundation. This work was supported by the Francis Crick Institute, which receives its core funding from Cancer Research UK (CC1069), the UK Medical Research Council (CC1069) and the Wellcome Trust (CC1069).
Acknowledgments
We would like to thank our reviewers and Tess Brodie, Jakson Luk, Andrea Raimondi, Laura Sironi, Marcus Thelen for critical reading and feedback on this manuscript. We apologise to the many authors whose studies we could not cite due to space constraints. This Review was written by humans, based on the rewarding form of reinforcement learning that is working as facility staff in a microscopy unit. We thank all our numerous users for proposing us new challenges in microscopy and bioimage analysis every day. At the same time, we would like to thank all the colleagues and supervisors that we met during our careers for what they taught us. We hope that they also got something in exchange for the human interaction, which we think will always be fundamental in science.
Conflict of interest
The authors declare that the research was conducted in the absence of any commercial or financial relationships that could be construed as a potential conflict of interest.
Generative AI statement
The author(s) declare that no Generative AI was used in the creation of this manuscript.
Any alternative text (alt text) provided alongside figures in this article has been generated by Frontiers with the support of artificial intelligence and reasonable efforts have been made to ensure accuracy, including review by the authors wherever possible. If you identify any issues, please contact us.
Publisher’s note
All claims expressed in this article are solely those of the authors and do not necessarily represent those of their affiliated organizations, or those of the publisher, the editors and the reviewers. Any product that may be evaluated in this article, or claim that may be made by its manufacturer, is not guaranteed or endorsed by the publisher.
Footnotes
- ^ https://www.rstudio.com
- ^ https://github.com/micro-manager/pymmcore
- ^ https://www.arduino.cc
- ^ https://www.raspberrypi.com
- ^ https://librehub.github.io
- ^ https://www.glencoesoftware.com
- ^ https://www.zeiss.co.uk/microscopy/home.html
- ^ https://abberior.rocks/superresolution-confocal-systems/imspector
- ^ https://opensource.org/ai
- ^ https://scikit-image.org
- ^ https://scikit-learn.org
- ^ https://bioimage.io
References
1. Opal SM. A brief history of microbiology and immunology. Vaccines: A Biography. (2009), 31–56. doi: 10.1007/978-1-4419-1108-7_3
2. Blevins SM and Bronze MS. Robert Koch and the ‘Golden age’ of bacteriology. Int J Infect Dis. (2010) 14:744–51. doi: 10.1016/j.ijid.2009.12.003
3. Croft WJ ed. Under the microscope: A brief history of microscopy. Hackensack, NJ: World Scientific (2006).
4. Lichtman JW and Conchello J-A. Fluorescence microscopy. Nat Methods. (2005) 2:910–9. doi: 10.1038/nmeth817
6. Tsien RY. The green fluorescent protein. Annu Rev Biochem. (1998) 67:509–44. doi: 10.1146/annurev.biochem.67.1.509
7. Cohen SN. DNA cloning: A personal view after 40 years. Proc Natl Acad Sci. (2013) 110:15521–9. doi: 10.1073/pnas.1313397110
8. Goldsmith CS and Miller SE. Modern uses of electron microscopy for detection of viruses. Clin Microbiol Rev. (2009) 22. doi: 10.1128/cmr.00027-09
9. Kausche GA, Pfankuch E, and Ruska H. Die Sichtbarmachung von pflanzlichem Virus im Übermikroskop. Naturwissenschaften. (1939) 27:292–9. doi: 10.1007/BF01493353
10. Bozzola JJ and Russell LD. Electron microscopy: principles and techniques for biologists. 2nd ed. Sudbury, Mass: Jones and Bartlett, Burlington, MA (1999). p. 670.
11. Dubochet J. The physics of rapid cooling and its implications for cryoimmobilization of cells. In: Methods in Cell Biology, vol. 79. Elsevier (2007). p. 7–21. doi: 10.1016/0968-0004(85)90150-1
12. Dubochet J, Adrian M, Lepault J, and McDowall AW. Emerging techniques: Cryo-electron microscopy of vitrified biological specimens. Trends Biochem Sci. (1985) 10:143–6. doi: 10.1016/0968-0004(85)90150-1
13. Amunts A, Brown A, Bai XC, Llácer JL, Hussain T, Emsley P, et al. Structure of the yeast mitochondrial large ribosomal subunit. Science. (2014) 343:1485–9. doi: 10.1126/science.1249410
14. Mastronarde DN. Automated electron microscope tomography using robust prediction of specimen movements. J Struct Biol. (2005) 152:36–51. doi: 10.1016/j.jsb.2005.07.007
15. Carragher B, Kisseberth N, Kriegman D, Milligan RA, Potter CS, Pulokas J, et al. Leginon: An Automated System for Acquisition of Images from Vitreous Ice Specimens. J Struct Biol. (2000) 132:33–45. doi: 10.1006/jsbi.2000.4314
16. Cheng A, Tan YZ, Dandey VP, Potter CS, and Carragher B. Strategies for Automated CryoEM Data Collection Using Direct Detectors. Methods Enzymology [Internet]. (2016), 87–102. doi: 10.1016/bs.mie.2016.04.008
17. Bouvette J, Huang Q, Riccio AA, Copeland WC, Bartesaghi A, and Borgnia MJ. Automated systematic evaluation of cryo-EM specimens with SmartScope. eLife. (2022) 11:e80047. doi: 10.7554/eLife.80047
18. Bárcena M and Koster AJ. Electron tomography in life science. Semin Cell Dev Biol. (2009) 20:920–30. doi: 10.1016/j.semcdb.2009.07.008
19. Ercius P, Alaidi O, Rames MJ, and Ren G. Electron Tomography: A Three-Dimensional Analytic Tool for Hard and Soft Materials Research. Advanced Materials. (2015) 27:5638–63. doi: 10.1002/adma.201501015
20. Wolf SG, Mutsafi Y, Dadosh T, Ilani T, Lansky Z, Horowitz B, et al. 3D visualization of mitochondrial solid-phase calcium stores in whole cells. eLife (2017), 11–06. doi: 10.7554/elife.29929
21. Pfeil-Gardiner O, Rosa HVD, Riedel D, Chen YS, Lörks D, Kükelhan P, et al. Elemental mapping in single-particle reconstructions by reconstructed electron energy-loss analysis. Nat Methods. (2024) 21:2299–306. doi: 10.1038/s41592-024-02482-5
22. Bykov YS, Cortese M, Briggs JAG, and Bartenschlager R. Correlative light and electron microscopy methods for the study of virus–cell interactions. FEBS Lett. (2016) 590:1877–95. doi: 10.1002/1873-3468.12153
23. Yang J, Vrbovská V, Franke T, Sibert B, Larson M, Coomes T, et al. Precise 3D Localization by Integrated Fluorescence Microscopy (iFLM) for Cryo-FIB-milling and In-situ Cryo-ET. Microscopy Microanalysis. (2023) 29:1055–7. doi: 10.1093/micmic/ozad067.541
24. De Boer P, Hoogenboom JP, and Giepmans BNG. Correlated light and electron microscopy: ultrastructure lights up! Nat Methods. (2015) 12:503–13. doi: 10.1038/nmeth.3400
25. Balasubramanian H, Hobson CM, Chew T-L, and Aaron JS. Imagining the future of optical microscopy: Everything, everywhere, all at once. Commun Biol. (2023) 6:1096. doi: 10.1038/s42003-023-05468-9
26. McCafferty CL, Klumpe S, Amaro RE, Kukulski W, Collinson L, and Engel BD. Integrating cellular electron microscopy with multimodal data to explore biology across space and time. Cell. (2024) 187:563–84. doi: 10.1016/j.cell.2024.01.005
27. Nowogrodzki J. ChatGPT for science: How to talk to your data. Nature. (2024) 631:924–5. doi: 10.1038/d41586-024-02386-6
28. Moebel E, Martinez-Sanchez A, Lamm L, Righetto RD, Wietrzynski W, Albert S, et al. Deep learning improves macromolecule identification in 3D cellular cryo-electron tomograms. Nat Methods. (2021) 18:1386–94. doi: 10.1038/s41592-021-01275-4
29. Wan X, Xiao J, Tam SST, Cai M, Sugimura R, Wang Y, et al. Integrating spatial and single-cell transcriptomics data using deep generative models with SpatialScope. Nat Commun. (2023) 14:7848. doi: 10.1038/s41467-023-43629-w
30. Wang H, Rivenson Y, Jin Y, Wei Z, Gao R, Günaydın H, et al. Deep learning enables cross-modality super-resolution in fluorescence microscopy. Nat Methods. (2019) 16:103–10. doi: 10.1038/s41592-018-0239-0
31. Shi Y, Tabet JS, Milkie DE, Daugird TA, Yang CQ, Ritter AT, et al. Smart lattice light-sheet microscopy for imaging rare and complex cellular events. Nat Methods. (2024) 21:301–10. doi: 10.1038/s41592-023-02126-0
32. Gordon RE. Electron microscopy: A brief history and review of current clinical application. Histopathology: Methods Protoc. (2014) 1180:119–35. doi: 10.1007/978-1-4939-1050-2_7
33. Graham L and Orenstein JM. Processing tissue and cells for transmission electron microscopy in diagnostic pathology and research. Nat Protoc. (2007) 2:2439–50. doi: 10.1038/nprot.2007.304
34. Gan L and Jensen GJ. Electron tomography of cells. Q Rev Biophysics. (2012) 45:27–56. doi: 10.1017/S0033583511000102
35. Pengo N, Scolari M, Oliva L, Milan E, Mainoldi F, Raimondi A, et al. Plasma cells require autophagy for sustainable immunoglobulin production. Nat Immunol. (2013) 14:298–305. doi: 10.1038/ni.2524
36. Jiao H, Jiang D, Hu X, Du W, Ji L, Yang Y, et al. Mitocytosis, a migrasome-mediated mitochondrial quality-control process. Cell. (2021) 184:2896–910.e13. doi: 10.1016/j.cell.2021.04.027
37. Roche PA and Furuta K. The ins and outs of MHC class II-mediated antigen processing and presentation. Nat Rev Immunol. (2015) 15:203–16. doi: 10.1038/nri3818
38. Faigle W, Raposo G, Tenza D, Pinet V, Vogt AB, Kropshofer H, et al. Deficient peptide loading and MHC class II endosomal sorting in a human genetic immunodeficiency disease: the chediak-higashi syndrome. J Cell Biol. (1998) 141:1121. doi: 10.1083/jcb.141.5.1121
39. Swanson J, Bushnell A, and Silverstein SC. Tubular lysosome morphology and distribution within macrophages depend on the integrity of cytoplasmic microtubules. Proc Natl Acad Sci United States America. (1987) 84:1921–5. doi: 10.1073/pnas.84.7.1921
40. Barral DC, Staiano L, Guimas Almeida C, Cutler DF, Eden ER, Futter CE, et al. Current methods to analyze lysosome morphology, positioning, motility and function. Traffic. (2022) 23:238–69. doi: 10.1111/tra.12839
41. Laue M. Diagnostic electron microscopy in human infectious diseases – Methods and applications. J Microscopy. (2025) 299:186–205. doi: 10.1111/jmi.13370
42. Mayhew TM, Lucocq JM, and Griffiths G. Relative labelling index: A novel stereological approach to test for non-random immunogold labelling of organelles and membranes on transmission electron microscopy thin sections. J Microscopy. (2002) 205:153–64. doi: 10.1046/j.0022-2720.2001.00977.x
43. Martell JD, Deerinck TJ, Sancak Y, Poulos TL, Mootha VK, Sosinsky GE, et al. Engineered ascorbate peroxidase as a genetically encoded reporter for electron microscopy. Nat Biotechnol. (2012) 30:1143–8. doi: 10.1038/nbt.2375
44. Martell JD, Deerinck TJ, Lam SS, Ellisman MH, and Ting AY. Electron microscopy using the genetically encoded APEX2 tag in cultured mammalian cells. Nat Protoc. (2017) 12:1792–816. doi: 10.1038/nprot.2017.065
45. Stinchcombe JC, Asano Y, Kaufman CJG, Böhlig K, Peddie CJ, Collinson LM, et al. Ectocytosis renders T cell receptor signaling self-limiting at the immune synapse. Science. (2023) 380:818–23. doi: 10.1126/science.abp8933
46. Fischer ER, Hansen BT, Nair V, Hoyt FH, and Dorward DW. Scanning electron microscopy. Curr Protoc Microbiol. (2012) 25:2B.2.1–47. doi: 10.1002/9780471729259.mc02b02s25. CHAPTER, Unit2B.2.
47. Miller KK, Wang P, and Grillet N. SUB-immunogold-SEM reveals nanoscale distribution of submembranous epitopes. Nat Commun. (2024) 15:. doi: 10.1038/s41467-024-51849-x
48. Guidotti LG, Inverso D, Sironi L, Di Lucia P, Fioravanti J, Ganzer L, et al. Immunosurveillance of the liver by intravascular effector CD8+ T cells. Cell. (2015) 161:486–500. doi: 10.1016/j.cell.2015.03.005
49. Baldwin JG, Heuser-Loy C, Saha T, Schelker RC, Slavkovic-Lukic D, Strieder N, et al. Intercellular nanotube-mediated mitochondrial transfer enhances T cell metabolic fitness and antitumor efficacy. Cell. (2024) :S0092867424009565. doi: 10.1016/j.cell.2024.08.029
50. Collinson LM, Bosch C, Bullen A, Burden JJ, Carzaniga R, Cheng C, et al. Volume EM: A quiet revolution takes shape. Nat Methods. (2023) 20:777–82. doi: 10.1038/s41592-023-01861-8
51. Peddie CJ, Genoud C, Kreshuk A, Meechan K, Micheva KD, Narayan K, et al. Volume electron microscopy. Nat Rev Methods Primers. (2022) 2:51. doi: 10.1038/s43586-022-00131-9
52. Wolf T, Jin W, Zoppi G, Vogel IA, Akhmedov M, Bleck CKE, et al. Dynamics in protein translation sustaining T cell preparedness. Nat Immunol. (2020) 21:927–37. doi: 10.1038/s41590-020-0714-5
53. Lachat J, Pascault A, Thibaut D, Le Borgne R, Verbavatz J-M, and Weiner A. Trans-cellular tunnels induced by the fungal pathogen Candida albicans facilitate invasion through successive epithelial cells without host damage. Nat Commun. (2022) 13:3781. doi: 10.1038/s41467-022-31237-z
54. Winer BY, Settle AH, Yakimov AM, Jeronimo C, Lazarov T, Tipping M, et al. Plasma membrane abundance dictates phagocytic capacity and functional cross-talk in myeloid cells. Sci Immunol. (2024) 9:eadl2388. doi: 10.1126/sciimmunol.adl2388
55. Heinrich L, Bennett D, Ackerman D, Park W, Bogovic J, Eckstein N, et al. Whole-cell organelle segmentation in volume electron microscopy. Nature. (2021) 599:141–6. doi: 10.1038/s41586-021-03977-3
56. Xu CS, Pang S, Shtengel G, Müller A, Ritter AT, Hoffman HK, et al. An open-access volume electron microscopy atlas of whole cells and tissues. Nature. (2021) 599:147–51. doi: 10.1038/s41586-021-03992-4
57. Müller A, Schmidt D, Albrecht JP, Rieckert L, Otto M, Galicia Garcia LE, et al. Modular segmentation, spatial analysis and visualization of volume electron microscopy datasets. Nat Protoc. (2024) 19:1436–66. doi: 10.1038/s41596-024-00957-5
58. Gopal S, Chiappini C, Armstrong JPK, Chen Q, Serio A, Hsu C-C, et al. Immunogold FIB-SEM: combining volumetric ultrastructure visualization with 3D biomolecular analysis to dissect cell–environment interactions. Advanced Materials. (2019) 31:1900488. doi: 10.1002/adma.201900488
59. Loginov SV, Fermie J, Fokkema J, Agronskaia AV, De Heus C, Blab GA, et al. Correlative organelle microscopy: fluorescence guided volume electron microscopy of intracellular processes. Front Cell Dev Biol. (2022) 10:829545. doi: 10.3389/fcell.2022.829545
60. Nogales E and Mahamid J. Bridging structural and cell biology with cryo-electron microscopy. Nature. (2024) 628:47–56. doi: 10.1038/s41586-024-07198-2
61. Nakane T, Kotecha A, Sente A, McMullan G, Masiulis S, Brown PMGE, et al. Single-particle cryo-EM at atomic resolution. Nature. (2020) 587. doi: 10.1038/s41586-020-2829-0
62. Yip KM, Fischer N, Paknia E, Chari A, and Stark H. Atomic-resolution protein structure determination by cryo-EM. Nature. (2020) 587:157–61. doi: 10.1038/s41586-020-2833-4
63. Nannenga BL and Gonen T. The cryo-EM method microcrystal electron diffraction (MicroED). Nat Methods. (2019) 16:369–79. doi: 10.1038/s41592-019-0395-x
64. Turoňová B, Hagen WJH, Obr M, Mosalaganti S, Beugelink JW, Zimmerli CE, et al. Benchmarking tomographic acquisition schemes for high-resolution structural biology. Nat Commun. (2020) 11:876. doi: 10.1038/s41467-020-14535-2
65. Wolf SG and Elbaum M. CryoSTEM tomography in biology. In: Methods in Cell Biology [Internet]. Elsevier (2019). p. 197–215. doi: 10.1016/bs.mcb.2019.04.001
66. Dutta M and Acharya P. Cryo-electron microscopy in the study of virus entry and infection. Front Mol Biosci. (2024) 11:1429180. doi: 10.3389/fmolb.2024.1429180
67. Engelenburg B, Shtengel G, Sengupta P, Waki K, Jarnik M, Ablan SD, et al. Distribution of ESCRT machinery at HIV assembly sites reveals virus scaffolding of ESCRT subunits. Science. (2014) 343:653–6. doi: 10.1126/science.1247786
68. Mendonça L, Howe A, Gilchrist JB, Sheng Y, Sun D, Knight ML, et al. Correlative multi-scale cryo-imaging unveils SARS-CoV-2 assembly and egress. Nat Commun. (2021) 12:4629. doi: 10.1038/s41467-021-24887-y
69. Dong D, Zheng L, Lin J, Zhang B, Zhu Y, Li N, et al. Structural basis of assembly of the human T cell receptor-CD3 complex. Nature. (2019) 573:546–52. doi: 10.1038/s41586-019-1537-0
70. Sušac L, Vuong MT, Thomas C, von Bülow S, O’Brien-Ball C, Santos AM, et al. Structure of a fully assembled tumor-specific T cell receptor ligated by pMHC. Cell. (2022) 185:3201–13.e19. doi: 10.1016/j.cell.2022.07.010
71. Arechaga I, Swamy M, Abia D, Schamel WA, Alarcón B, and Valpuesta JM. Structural characterization of the TCR complex by electron microscopy. Int Immunol. (2010) 22:897–903. doi: 10.1093/intimm/dxq443
72. Xin W, Huang B, Chi X, Liu Y, Xu M, Zhang Y, et al. Structures of human γδ T cell receptor-CD3 complex. Nature. (2024) 630:222–9. doi: 10.1038/s41586-024-07439-4
73. Pishesha N, Harmand TJ, and Ploegh HL. A guide to antigen processing and presentation. Nat Rev Immunol. (2022) 22:751–64. doi: 10.1038/s41577-022-00707-2
74. Zhang H, Chen K, Tan Q, Shao Q, Han S, Zhang C, et al. Structural basis for chemokine recognition and receptor activation of chemokine receptor CCR5. Nat Commun. (2021) 12:. doi: 10.1038/s41467-021-24438-5
75. Marcandalli J, Fiala B, Ols S, Perotti M, de van der Schueren W, Snijder J, et al. Induction of potent neutralizing antibody responses by a designed protein nanoparticle vaccine for respiratory syncytial virus. Cell. (2019) 176:1420–31.e17. doi: 10.1016/j.cell.2019.01.046
76. Tokuyasu KT. Application of cryoultramicrotomy to immunocytochemistry. J Microsc. (1986) 143(2):139–49. doi: 10.1111/j.1365-2818.1986.tb02772.x
77. Peters PJ, Bos E, and Griekspoor A. Cryo-Immunogold Electron Microscopy. Curr Protoc Cell Biol. (2006) 30:4.7.1–4.7.19. doi: 10.1002/0471143030.cb0407s30
78. Yi H, Strauss JD, Ke Z, Alonas E, Dillard RS, Hampton CM, et al. Native Immunogold Labeling of Cell Surface Proteins and Viral Glycoproteins for Cryo-Electron Microscopy and Cryo-Electron Tomography Applications. J Histochem Cytochem. (2015) 63:780–92. doi: 10.1369/0022155415593323
79. Soler Palacios B, Villares R, Lucas P, Rodríguez-Frade JM, Cayuela A, Piccirillo JG, et al. Growth hormone remodels the 3D-structure of the mitochondria of inflammatory macrophages and promotes metabolic reprogramming. Front Immunol. (2023) 14:1200259. doi: 10.3389/fimmu.2023.1200259
80. Earl LA, Lifson JD, and Subramaniam S. Catching HIV ‘in the act’ with 3D electron microscopy. Trends Microbiol. (2013) 21:397–404. doi: 10.1016/j.tim.2013.06.004
81. Mahamid J, Pfeffer S, Schaffer M, Villa E, Danev R, Kuhn Cuellar L, et al. Visualizing the molecular sociology at the HeLa cell nuclear periphery. Science. (2016) 351:969–72. doi: 10.1126/science.aad8857
82. Studer D, Humbel BM, and Chiquet M. Electron microscopy of high pressure frozen samples: bridging the gap between cellular ultrastructure and atomic resolution. Histochem Cell Biol. (2008) 130:877–89. doi: 10.1007/s00418-008-0500-1
83. Thompson RF, Walker M, Siebert CA, Muench SP, and Ranson NA. An introduction to sample preparation and imaging by cryo-electron microscopy for structural biology. Methods. (2016) 100:3–15. doi: 10.1016/j.ymeth.2016.02.017
84. Biazik J, Vihinen H, Anwar T, Jokitalo E, and Eskelinen E-L. The versatile electron microscope: An ultrastructural overview of autophagy. Methods. (2015) 75:44–53. doi: 10.1016/j.ymeth.2014.11.013
85. Laporte MH, Klena N, Hamel V, and Guichard P. Visualizing the native cellular organization by coupling cryofixation with expansion microscopy (Cryo-ExM). Nat Methods. (2022) 19:216–22. doi: 10.1038/s41592-021-01356-4
87. Irgen-Gioro S, Yoshida S, Walling V, and Chong S. Fixation can change the appearance of phase separation in living cells. eLife. (2022) 11:e79903. doi: 10.7554/eLife.79903
88. Phillips MA, Harkiolaki M, Pinto DMS, Parton RM, Palanca A, Garcia-Moreno M, et al. CryoSIM: super-resolution 3D structured illumination cryogenic fluorescence microscopy for correlated ultrastructural imaging. Optica. (2020) 7:802. doi: 10.1364/OPTICA.393203
89. Tuijtel MW, Koster AJ, Jakobs S, Faas FGA, and Sharp TH. Correlative cryo super-resolution light and electron microscopy on mammalian cells using fluorescent proteins. Sci Rep. (2019) 9:1369. doi: 10.1038/s41598-018-37728-8
90. D’Antuono R. Basic Digital Image Acquisition, Design, Processing, Analysis, Management, and Presentation. In: Nechyporuk-Zloy V, editor. Principles of Light Microscopy: From Basic to Advanced. Cham, CH: Springer International Publishing (2022). p. 77–104. doi: 10.1007/978-3-031-04477-9_4
91. Di Pilato M, Palomino-Segura M, Mejías-Pérez E, Gómez CE, Rubio-Ponce A, D’Antuono R, et al. Neutrophil subtypes shape HIV-specific CD8 T-cell responses after vaccinia virus infection. NPJ Vaccines. (2021) 6:52. doi: 10.1038/s41541-021-00314-7
92. Proietti M, Perruzza L, Scribano D, Pellegrini G, D’Antuono R, Strati F, et al. ATP released by intestinal bacteria limits the generation of protective IgA against enteropathogens. Nat Commun. (2019) 10:250. doi: 10.1038/s41467-018-08156-z
93. Chang Y-W, Chen S, Tocheva EI, Treuner-Lange A, Löbach S, Søgaard-Andersen L, et al. Correlated cryogenic photoactivated localization microscopy and cryo-electron tomography. Nat Methods. (2014) 11:737–9. doi: 10.1038/nmeth.2961
94. Wang L, Eng ET, Law K, Gordon RE, Rice WJ, and Chen BK. Visualization of HIV T cell virological synapses and virus-containing compartments by three-dimensional correlative light and electron microscopy. J Virol. (2017) 91:e01605-16. doi: 10.1128/JVI.01605-16
95. Hor JL and Germain RN. Intravital and high-content multiplex imaging of the immune system. Trends Cell Biol. (2022) 32:406–20. doi: 10.1016/j.tcb.2021.11.007
96. Turk M and Baumeister W. The promise and the challenges of cryo-electron tomography. FEBS Lett. (2020) 594:3243–61. doi: 10.1002/1873-3468.13948
97. Andrian T, Bakkum T, van Elsland DM, Bos E, Koster AJ, Albertazzi L, et al. Chapter 13—Super-resolution correlative light-electron microscopy using a click-chemistry approach for studying intracellular trafficking. In: Müller-Reichert T and Verkade P, editors. Methods in cell biology, vol. 162. Cambridge, Massachusetts, United States: Academic Press (2021). p. 303–31. doi: 10.1016/bs.mcb.2020.09.001
98. Marko M, Hsieh C, Schalek R, Frank J, and Mannella C. Focused-ion-beam thinning of frozen-hydrated biological specimens for cryo-electron microscopy. Nat Methods. (2007) 4:215–7. doi: 10.1038/nmeth1014
99. Al-Amoudi A, Norlen LPO, and Dubochet J. Cryo-electron microscopy of vitreous sections of native biological cells and tissues. J Struct Biol. (2004) 148:131–5. doi: 10.1016/j.jsb.2004.03.010
100. Pierson JA, Yang JE, and Wright ER. Recent advances in correlative cryo-light and electron microscopy. Curr Opin Struct Biol. (2024) 89:102934. doi: 10.1016/j.sbi.2024.102934
101. Klein S, Wachsmuth-Melm M, Winter SL, Kolovou A, and Chlanda P. Cryo-correlative light and electron microscopy workflow for cryo-focused ion beam milled adherent cells. In: Methods in Cell Biology. Elsevier (2021). p. 273–302.
102. De Beer M, Daviran D, Roverts R, Rutten L, Macías-Sánchez E, Metz JR, et al. Precise targeting for 3D cryo-correlative light and electron microscopy volume imaging of tissues using a FinderTOP. Commun Biol. (2023) 6:510. doi: 10.1038/s42003-023-04887-y
103. Gómez-de-Mariscal E, Maška M, Kotrbová A, Pospíchalová V, Matula P, and Muñoz-Barrutia A. Deep-learning-based segmentation of small extracellular vesicles in transmission electron microscopy images. Sci Rep. (2019) 9:13211. doi: 10.1038/s41598-019-49431-3
104. Rey JS, Li W, Bryer AJ, Beatson H, Lantz C, Engelman AN, et al. Deep-learning in situ classification of HIV-1 virion morphology. Comput Struct Biotechnol J. (2021) 19:5688–700. doi: 10.1016/j.csbj.2021.10.001
105. Matharu SS, Nordmann CS, Ottman KR, Akkem R, Palumbo D, Cruz DRD, et al. Deep learning, 3D ultrastructural analysis reveals quantitative differences in platelet and organelle packing in COVID-19/SARSCoV2 patient-derived platelets. Platelets. (2023) 34:2264978. doi: 10.1080/09537104.2023.2264978
106. Martinez-Sanchez A. Template matching and machine learning for cryo-electron tomography. Curr Opin Struct Biol. (2025) 93:103058. doi: 10.1016/j.sbi.2025.103058
107. Seifert R, Markert SM, Britz S, Perschin V, Erbacher C, Stigloher C, et al. DeepCLEM: automated registration for correlative light and electron microscopy using deep learning. F1000Res. (2020) 9:1275. doi: 10.12688/f1000research.27158.1
108. Belevich I and Jokitalo E. DeepMIB: User-friendly and open-source software for training of deep learning network for biological image segmentation. PloS Comput Biol. (2021) 17:e1008374. doi: 10.1371/journal.pcbi.1008374
109. Ouyang W, Aristov A, Lelek M, Hao X, and Zimmer C. Deep learning massively accelerates super-resolution localization microscopy. Nat Biotechnol. (2018) 36:460–8. doi: 10.1038/nbt.4106
110. Nehme E, Freedman D, Gordon R, Ferdman B, Weiss LE, Alalouf O, et al. DeepSTORM3D: Dense 3D localization microscopy and PSF design by deep learning. Nat Methods. (2020) 17:734–40. doi: 10.1038/s41592-020-0853-5
111. Long RKM, Moriarty KP, Cardoen B, Gao G, Vogl AW, Jean F, et al. Super resolution microscopy and deep learning identify Zika virus reorganization of the endoplasmic reticulum. Sci Rep. (2020) 10:20937. doi: 10.1038/s41598-020-77170-3
112. Wanninger S, Asadiatouei P, Bohlen J, Salem CB, Tinnefeld P, Ploetz E, et al. Deep-LASI: deep-learning assisted, single-molecule imaging analysis of multi-color DNA origami structures. Nat Commun. (2023) 14:6564. doi: 10.1038/s41467-023-42272-9
113. Park H, Na M, Kim B, Park S, Kim KH, Chang S, et al. Deep learning enables reference-free isotropic super-resolution for volumetric fluorescence microscopy. Nat Commun. (2022) 13:3297. doi: 10.1038/s41467-022-30949-6
114. Guo M, Wu Y, Hobson CM, Su Y, Qian S, Krueger E, et al. Deep learning-based aberration compensation improves contrast and resolution in fluorescence microscopy. Nat Commun. (2025) 16:313. doi: 10.1038/s41467-024-55267-x
115. Héliot L and Leray A. Simple phasor-based deep neural network for fluorescence lifetime imaging microscopy. Sci Rep. (2021) 11:23858. doi: 10.1038/s41598-021-03060-x
116. Qiao C, Liu S, Wang Y, et al. A neural network for long-term super-resolution imaging of live cells with reliable confidence quantification. Nat Biotechnol. (2025). doi: 10.1038/s41587-025-02553-8
117. Bai C, Yu X, Peng T, Liu C, Min J, Dan D, et al. 3D Imaging Restoration of Spinning-Disk Confocal Microscopy Via Deep Learning. IEEE Photon Technol Lett. (2020) 32:1131–4. doi: 10.1109/LPT.2020.3014317
118. Schapiro D, Sokolov A, Yapp C, Chen Y-A, Muhlich JL, Hess J, et al. MCMICRO: A scalable, modular image-processing pipeline for multiplexed tissue imaging. Nat Methods. (2022) 19:311–5. doi: 10.1038/s41592-021-01308-y
119. Greenwald NF, Miller G, Moen E, Kong A, Kagel A, Dougherty T, et al. Whole-cell segmentation of tissue images with human-level performance using large-scale data annotation and deep learning. Nat Biotechnol. (2022) 40:555–65. doi: 10.1038/s41587-021-01094-0
120. Sultan S, Gorris MAJ, Martynova E, van der Woude LL, Buytenhuijs F, van Wilpe S, et al. ImmuNet: A segmentation-free machine learning pipeline for immune landscape phenotyping in tumors by multiplex imaging. Biol Methods Protoc. (2025) 10:bpae094. doi: 10.1093/biomethods/bpae094
121. Zheng Y, Sadée C, Ozawa M, Howitt BE, and Gevaert O. Single-cell multimodal analysis reveals tumor microenvironment predictive of treatment response in non–small cell lung cancer. Sci Adv. (2025) 11:eadu2151. doi: 10.1126/sciadv.adu2151
122. Fassler DJ, Abousamra S, Gupta R, Chen C, Zhao M, Paredes D, et al. Deep learning-based image analysis methods for brightfield-acquired multiplex immunohistochemistry images. Diagn Pathol. (2020) 15:100. doi: 10.1186/s13000-020-01003-0
123. Wu Y, Rivenson Y, Wang H, Luo Y, Ben-David E, Bentolila LA, et al. Three-dimensional virtual refocusing of fluorescence microscopy images using deep learning. Nat Methods. (2019) 16:1323–31. doi: 10.1038/s41592-019-0622-5
124. Li B, Tan S, Dong J, Lian X, Zhang Y, Ji X, et al. Deep-3D microscope: 3D volumetric microscopy of thick scattering samples using a wide-field microscope and machine learning. Biomed Optics Express. (2021) 13:284–99. doi: 10.1364/BOE.444488
125. Chen X, Kandel ME, He S, Hu C, Lee YJ, Sullivan K, et al. Artificial confocal microscopy for deep label-free imaging. Nat Photonics. (2023) 17:250–8. doi: 10.1038/s41566-022-01140-6
126. Christiansen EM, Yang SJ, Ando DM, Javaherian A, Skibinski G, Lipnick S, et al. In silico labeling: predicting fluorescent labels in unlabeled images. Cell. (2018) 173:792–803.e19. doi: 10.1016/j.cell.2018.03.040
127. Ounkomol C, Seshamani S, Maleckar MM, Collman F, and Johnson GR. Label-free prediction of three-dimensional fluorescence images from transmitted-light microscopy. Nat Methods. (2018) 15:917–20. doi: 10.1038/s41592-018-0111-2
128. Cheng S, Fu S, Kim YM, Song W, Li Y, Xue Y, et al. Single-cell cytometry via multiplexed fluorescence prediction by label-free reflectance microscopy. Sci Adv. (2021) 7:eabe0431. doi: 10.1126/sciadv.abe0431
129. Li X, Zhang G, Qiao H, Bao F, Deng Y, Wu J, et al. Unsupervised content-preserving transformation for optical microscopy. Light: Sci Appl. (2021) 10:44. doi: 10.1038/s41377-021-00484-y
130. Buggenthin F, Buettner F, Hoppe PS, Endele M, Kroiss M, Strasser M, et al. Prospective identification of hematopoietic lineage choice by deep learning. Nat Methods. (2017) 14:403–6. doi: 10.1038/nmeth.4182
131. Antonello P, Morone D, Pirani E, Uguccioni M, Thelen M, Krause R, et al. Tracking unlabeled cancer cells imaged with low resolution in wide migration chambers via U-NET class-1 probability (pseudofluorescence). J Biol Eng. (2023) 17:5. doi: 10.1186/s13036-022-00321-9
132. Liarski VM, Sibley A, van Panhuys N, Ai J, Chang A, Kennedy D, et al. Quantifying in situ adaptive immune cell cognate interactions in humans. Nat Immunol. (2019) 20:503–13. doi: 10.1038/s41590-019-0315-3
133. Zhang C, Yu B, Lin F, Samanta S, Yu H, Zhang W, et al. Deep tissue super-resolution imaging with adaptive optical two-photon multifocal structured illumination microscopy. PhotoniX. (2023) 4:38. doi: 10.1186/s43074-023-00115-2
134. Wijesinghe P, Corsetti S, Chow DJX, Sakata S, Dunning KR, and Dholakia K. Experimentally unsupervised deconvolution for light-sheet microscopy with propagation-invariant beams. Light: Sci Appl. (2022) 11:319. doi: 10.1038/s41377-022-00975-6
135. Yang L, Liu Q, Kumar P, Sengupta A, Farnoud A, Shen R, et al. LungVis 1.0: an automatic AI-powered 3D imaging ecosystem unveils spatial profiling of nanoparticle delivery and acinar migration of lung macrophages. Nat Commun. (2024) 15:10138. doi: 10.1038/s41467-024-54267-1
136. Inoué S. Foundations of confocal scanned imaging in light microscopy. In: Handbook of Biological Confocal Microscopy. Springer, Boston, MA (2006). p. 1–19. doi: 10.1007/978-0-387-45524-2_1
137. Schermelleh L, Ferrand A, Huser T, Eggeling C, Sauer M, Biehlmaier O, et al. Super-resolution microscopy demystified. Nat Cell Biol. (2019) 21:72–84. doi: 10.1038/s41556-018-0251-8
138. Sahl SJ, Hell SW, and Jakobs S. Fluorescence nanoscopy in cell biology. Nat Rev Mol Cell Biol. (2017) 18:685–701. doi: 10.1038/nrm.2017.71
139. Roth S, Sheppard CJ, Wicker K, and Heintzmann R. Optical photon reassignment microscopy (OPRA). Optical Nanoscopy. (2013) 2:5. doi: 10.1186/2192-2853-2-5
140. Sheppard CJR, Mehta SB, and Heintzmann R. Superresolution by image scanning microscopy using pixel reassignment. Optics Lett. (2013) 38:2889. doi: 10.1364/OL.38.002889
141. Lelek M, Gyparaki MT, Beliu G, Schueder F, Griffié J, Manley S, et al. Single-molecule localization microscopy. Nat Rev Methods Primers. (2021) 1:39. doi: 10.1038/s43586-021-00038-x
142. Fox-Roberts P, Marsh R, Pfisterer K, Jayo A, Parsons M, and Cox S. Local dimensionality determines imaging speed in localization microscopy. Nat Commun. (2017) 8:13558. doi: 10.1038/ncomms13558
143. Culley S, Albrecht D, Jacobs C, Pereira PM, Leterrier C, Mercer J, et al. Quantitative mapping and minimization of super-resolution optical imaging artifacts. Nat Methods. (2018) 15:263–6. doi: 10.1038/nmeth.4605
144. Stebbing J, Sánchez Nievas G, Falcone M, Youhanna S, Richardson P, Ottaviani S, et al. JAK inhibition reduces SARS-CoV-2 liver infectivity and modulates inflammatory responses to reduce morbidity and mortality. Sci Adv. (2021) 7:eabe4724. doi: 10.1126/sciadv.abe4724
145. Rossboth B, Arnold AM, Ta H, Platzer R, Kellner F, Huppa JB, et al. TCRs are randomly distributed on the plasma membrane of resting antigen-experienced T cells. Nat Immunol. (2018) 19:821–7. doi: 10.1038/s41590-018-0162-7
146. Bláha J, Skálová T, Kalousková B, Skořepa O, Cmunt D, Grobárová V, et al. Structure of the human NK cell NKR-P1:LLT1 receptor:ligand complex reveals clustering in the immune synapse. Nat Commun. (2022) 13:5022. doi: 10.1038/s41467-022-32577-6
148. Baranov MV, Revelo NH, Dingjan I, Maraspini R, Ter Beest M, Honigmann A, et al. SWAP70 organizes the actin cytoskeleton and is essential for phagocytosis. Cell Rep. (2016) 17:1518–31. doi: 10.1016/j.celrep.2016.10.021
149. Worboys JD, Vowell KN, Hare RK, Ambrose AR, Bertuzzi M, Conner MA, et al. TIGIT can inhibit T cell activation via ligation-induced nanoclusters, independent of CD226 co-stimulation. Nat Commun. (2023) 14:5016. doi: 10.1038/s41467-023-40755-3
150. Huff J. The Airyscan detector from ZEISS: Confocal imaging with improved signal-to-noise ratio and super-resolution. Nat Methods. (2015) 12:i–ii. doi: 10.1038/nmeth.f.388
151. Delattre S. Igniting new confocal imaging potential – nikon AX R series with NSPARC. Microscopy Today. (2023) 31:23–7. doi: 10.1093/mictod/qaad088
152. Curd A, Cleasby A, Makowska K, York A, Shroff H, and Peckham M. Construction of an instant structured illumination microscope. Methods. (2015) 88:37–47. doi: 10.1016/j.ymeth.2015.07.012
153. Dertinger T, Colyer R, Iyer G, Weiss S, and Enderlein J. Fast, background-free, 3D super-resolution optical fluctuation imaging (SOFI. Proc Natl Acad Sci. (2009) 106:22287–92. doi: 10.1073/pnas.0907866106
154. Gustafsson N, Culley S, Ashdown G, Owen DM, Pereira PM, and Henriques R. Fast live-cell conventional fluorophore nanoscopy with ImageJ through super-resolution radial fluctuations. Nat Commun. (2016) 7:12471. doi: 10.1038/ncomms12471
155. Torres-García E, Pinto-Cámara R, Linares A, Martínez D, Abonza V, Brito-Alarcón E, et al. Extending resolution within a single imaging frame. Nat Commun. (2022) 13:7452. doi: 10.1038/s41467-022-34693-9
156. Alva A, Brito-Alarcón E, Linares A, Torres-García E, Hernández HO, Pinto-Cámara R, et al. Fluorescence fluctuation-based super-resolution microscopy: Basic concepts for an easy start. J Microscopy. (2022) 288:218–41. doi: 10.1111/jmi.13135
157. Reinhardt SCM, Masullo LA, Baudrexel I, Steen PR, Kowalewski R, Eklund AS, et al. Ångström-resolution fluorescence microscopy. Nature. (2023) 617:711–6. doi: 10.1038/s41586-023-05925-9
158. Sahl SJ, Matthias J, Inamdar K, Weber M, Khan TA, Brüser C, et al. Direct optical measurement of intramolecular distances with angstrom precision. Science. (2024) 386:180–7. doi: 10.1126/science.adj7368
159. Balzarotti F, Eilers Y, Gwosch KC, Gynnå AH, Westphal V, Stefani FD, et al. Nanometer resolution imaging and tracking of fluorescent molecules with minimal photon fluxes. Science. (2017) 355(6325):606–12. doi: 10.1126/science.aak9913
160. Wolff JO, Scheiderer L, Engelhardt T, Engelhardt J, Matthias J, and Hell SW. MINFLUX dissects the unimpeded walking of kinesin-1. Science. (2023) 379:1004–10. doi: 10.1126/science.ade2650
161. Scheiderer L, von der Emde H, Hesselink M, Weber M, and Hell SW. MINSTED tracking of single biomolecules. Nat Methods. (2024) 21:569–73. doi: 10.1038/s41592-024-02209-6
162. Axelrod D. Cell-substrate contacts illuminated by total internal reflection fluorescence. J Cell Biol. (1981) 89:141. doi: 10.1083/jcb.89.1.141
163. Fish KN. Total internal reflection fluorescence (TIRF) microscopy. Curr Protoc Cytometry. (2009) 50:12.18.1–12.18.13. doi: 10.1002/0471142956.cy1218s50
164. Brameshuber M, Klotzsch E, Ponjavic A, and Sezgin E. Understanding immune signaling using advanced imaging techniques. Biochem Soc Trans. (2022) 50:853–66. doi: 10.1042/BST20210479
165. Grakoui A, Bromley SK, Sumen C, Davis MM, Shaw AS, Allen PM, et al. The immunological synapse: A molecular machine controlling T cell activation. Science. (1999) 285:221–7. doi: 10.1126/science.285.5425.221
166. Dustin ML and Baldari CT. The immune synapse: past, present, and future. Methods Mol Biol (Clifton N.J.). (2017) 1584:1–5. doi: 10.1007/978-1-4939-6881-7_1
167. Kvalvaag A, Valvo S, Céspedes PF, Saliba DG, Kurz E, Korobchevskaya K, et al. Clathrin mediates both internalization and vesicular release of triggered T cell receptor at the immunological synapse. Proc Natl Acad Sci United States America. (2025) 120:e2211368120. doi: 10.1073/pnas.2211368120
168. Martínez-Muñoz L, Rodríguez-Frade JM, Barroso R, Sorzano CÓ.S, Torreño-Pina JA, Santiago CA, et al. Separating actin-dependent chemokine receptor nanoclustering from dimerization indicates a role for clustering in CXCR4 signaling and function. Mol Cell. (2018) 70:106–19.e10. doi: 10.1016/j.molcel.2018.02.034
169. Marie-Anaïs F, Mazzolini J, Herit F, and Niedergang F. Dynamin-actin cross talk contributes to phagosome formation and closure. Traffic (Copenhagen Denmark). (2016) 17:487–99. doi: 10.1111/tra.12386
170. Sundd P, Gutierrez E, Koltsova EK, Kuwano Y, Fukuda S, Pospieszalska MK, et al. ‘Slings’ enable neutrophil rolling at high shear. Nature. (2012) 488:399–403. doi: 10.1038/nature11248
171. Sundd P, Gutierrez E, Pospieszalska MK, Zhang H, Groisman A, and Ley K. Quantitative dynamic footprinting microscopy reveals mechanisms of neutrophil rolling. Nat Methods. (2010) 7:821–4. doi: 10.1038/nmeth.1508
172. Yi J, Balagopalan L, Nguyen T, McIntire KM, and Samelson LE. TCR microclusters form spatially segregated domains and sequentially assemble in calcium-dependent kinetic steps. Nat Commun. (2019) 10:277. doi: 10.1038/s41467-018-08064-2
173. Minsky M. Memoir on inventing the confocal scanning microscope. Scanning. (1988) 10:128–38. doi: 10.1002/sca.4950100403
174. Jonkman J, Brown CM, Wright GD, Anderson KI, and North AJ. Tutorial: Guidance for quantitative confocal microscopy. Nat Protoc. (2020) 15:1585–611. doi: 10.1038/s41596-020-0313-9
175. Elliott AD. Confocal microscopy: principles and modern practices. Curr Protoc Cytometry. (2020) 92:e68. doi: 10.1002/cpcy.68
176. Sheppard CJR. Scanning optical microscopy. In: Advances in Imaging and Electron Physics, vol. 213. Elsevier (2020). p. 227–325. Available online at: https://linkinghub.elsevier.com/retrieve/pii/S1076567019300825.
177. Valignat M-P, Nègre P, Cadra S, Lellouch AC, Gallet F, Hénon S, et al. Lymphocytes can self-steer passively with wind vane uropods. Nat Commun. (2014) 5:5213. doi: 10.1038/ncomms6213
178. Vorselen D, Wang Y, de Jesus MM, Shah PK, Footer MJ, Huse M, et al. Microparticle traction force microscopy reveals subcellular force exertion patterns in immune cell–target interactions. Nat Commun. (2020) 11:20. doi: 10.1038/s41467-019-13804-z
179. Pedroza LA, van den Haak F, Frumovitz A, Hernandez E, Hegewisch-Solloa E, Orange TK, et al. The Golgi complex governs natural killer cell lytic granule positioning to promote directionality in cytotoxicity. Cell Rep. (2025) 44:115156. doi: 10.1016/j.celrep.2024.115156
180. Muldoon JJ, Chuang Y, Bagheri N, and Leonard JN. Macrophages employ quorum licensing to regulate collective activation. Nat Commun. (2020) 11:878. doi: 10.1038/s41467-020-14547-y
181. Amann L, Fell A, Monaco G, Sankowski R, Wu HZQ, Jordão MJC, et al. Extrasinusoidal macrophages are a distinct subset of immunologically active dural macrophages. Sci Immunol. (2024) 9:eadh1129. doi: 10.1126/sciimmunol.adh1129
182. Brulois K, Rajaraman A, Szade A, Nordling S, Bogoslowski A, Dermadi D, et al. A molecular map of murine lymph node blood vascular endothelium at single cell resolution. Nat Commun. (2020) 11:3798. doi: 10.1038/s41467-020-17291-5
183. Reynoso GV, Weisberg AS, Shannon JP, McManus DT, Shores L, Americo JL, et al. Lymph node conduits transport virions for rapid T cell activation. Nat Immunol. (2019) 20:602–12. doi: 10.1038/s41590-019-0342-0
184. Radice E, Ameti R, Melgrati S, Foglierini M, Antonello P, Stahl RAK, et al. Marginal zone formation requires ACKR3 expression on B cells. Cell Rep. (2020) 32:107951. doi: 10.1016/j.celrep.2020.107951
185. Mao K, Baptista AP, Tamoutounour S, Zhuang L, Bouladoux N, Martins AJ, et al. Innate and adaptive lymphocytes sequentially shape the gut microbiota and lipid metabolism. Nature. (2018) 554:255–9. doi: 10.1038/nature25437
186. Wong HS, Park K, Gola A, Baptista AP, Miller CH, Deep D, et al. A local regulatory T cell feedback circuit maintains immune homeostasis by pruning self-activated T cells. Cell. (2021) 184:3981–97.e22. doi: 10.1016/j.cell.2021.05.028
187. Gaertner F, Ishikawa-Ankerhold H, Stutte S, Fu W, Weitz J, Dueck A, et al. Plasmacytoid dendritic cells control homeostasis of megakaryopoiesis. Nature. (2024) 631:645–53. doi: 10.1038/s41586-024-07671-y
188. Kaltenbach L, Martzloff P, Bambach SK, Aizarani N, Mihlan M, Gavrilov A, et al. Slow integrin-dependent migration organizes networks of tissue-resident mast cells. Nat Immunol. (2023) 24:915–24. doi: 10.1038/s41590-023-01493-2
189. Garcia-Leon MJ, Liboni C, Mittelheisser V, Bochler L, Follain G, Mouriaux C, et al. Platelets favor the outgrowth of established metastases. Nat Commun. (2024) 15:3297. doi: 10.1038/s41467-024-47516-w
190. Loi JK, Alexandre YO, Senthil K, Schienstock D, Sandford S, Devi S, et al. Corneal tissue-resident memory T cells form a unique immune compartment at the ocular surface. Cell Rep. (2022) 39:110852. doi: 10.1016/j.celrep.2022.110852
191. Dekkers JF, Alieva M, Cleven A, Keramati F, Wezenaar AKL, Van Vliet EJ, et al. Uncovering the mode of action of engineered T cells in patient cancer organoids. Nat Biotechnol. (2023) 41:60–9. doi: 10.1038/s41587-022-01397-w
192. Datta R, Heaster TM, Sharick JT, Gillette AA, and Skala MC. Fluorescence lifetime imaging microscopy: Fundamentals and advances in instrumentation, analysis, and applications. J Biomed Optics. (2020) 25:071203. doi: 10.1117/1.JBO.25.7.071203
193. Recoulat Angelini AA, Malacrida L, and Flecha FLG. Fluorescence phasor analysis: basic principles and biophysical applications. Biophys Rev. (2025) 17:1–14. doi: 10.1007/s12551-025-01293-y
194. Lakowicz JR ed. Principles of fluorescence spectroscopy. Midtown Manhattan, New York City: Springer US (2006). doi: 10.1007/978-0-387-46312-4
195. Colom A, Derivery E, Soleimanpour S, Tomba C, Molin MD, Sakai N, et al. A fluorescent membrane tension probe. Nat Chem. (2018) 10:1118–25. doi: 10.1038/s41557-018-0127-3
196. Gambarotto D, Zwettler FU, Le Guennec M, Schmidt-Cernohorska M, Fortun D, Borgers S, et al. Imaging cellular ultrastructures using expansion microscopy (U-ExM). Nat Methods. (2019) 16:71–4. doi: 10.1038/s41592-018-0238-1
197. Bacia K, Kim SA, and Schwille P. Fluorescence cross-correlation spectroscopy in living cells. Nat Methods. (2006) 3:83–9. doi: 10.1038/nmeth822
198. Wiseman PW. Image correlation spectroscopy: Principles and applications. Cold Spring Harbor Protoc. (2015) 2015:336–48. doi: 10.1101/pdb.top086124
199. Digman MA, Dalal R, Horwitz AF, and Gratton E. Mapping the number of molecules and brightness in the laser scanning microscope. Biophys J. (2008) 94:2320–32. doi: 10.1529/biophysj.107.114645
200. Işbilir A, Serfling R, Möller J, Thomas R, De Faveri C, Zabel U, et al. Determination of G-protein–coupled receptor oligomerization by molecular brightness analyses in single cells. Nat Protoc. (2021) 16:1419–51. doi: 10.1038/s41596-020-00458-1
201. Wu Y, Han X, Su Y, Glidewell M, Daniels JS, Liu J, et al. Multiview confocal super-resolution microscopy. Nature. (2021) 600:279–84. doi: 10.1038/s41586-021-04110-0
202. Lu Z, Liu Y, Jin M, Luo X, Yue H, Wang Z, et al. Virtual-scanning light-field microscopy for robust snapshot high-resolution volumetric imaging. Nat Methods. (2023) 20:735–46. doi: 10.1038/s41592-023-01839-6
203. Lu Z, Zuo S, Shi M, Fan J, Xie J, Xiao G, et al. Long-term intravital subcellular imaging with confocal scanning light-field microscopy. Nat Biotechnol. (2024) 43:1–12. doi: 10.1038/s41587-024-02249-5
204. Bajénoff M and Germain RN. Seeing is believing: A focus on the contribution of microscopic imaging to our understanding of immune system function. Eur J Immunol. (2007) 37:S18–33. doi: 10.1002/eji.200737663
205. Germain RN, Robey EA, and Cahalan MD. A decade of imaging cellular motility and interaction dynamics in the immune system. Sci (New York N.Y.). (2012) 336:1676–81. doi: 10.1126/science.1221063
206. Germain RN. Imaging the immune system redux. Immunol Rev. (2022) 306:5–7. doi: 10.1111/imr.13063
207. Pawley JB ed. Handbook of biological confocal microscopy. 3rd ed. Plenum Press, New York and London: Springer (2006).
208. Araujo David B, Atif J, Vargas E, Silva Castanheira F, Yasmin T, Guillot A, et al. Kupffer cell reverse migration into the liver sinusoids mitigates neonatal sepsis and meningitis. Sci Immunol. (2024) 9:eadq9704. doi: 10.1126/sciimmunol.adq9704
209. Umeshappa CS, Solé P, Surewaard BGJ, Yamanouchi J, Mohapatra S, Uddin MM, et al. Liver-specific T regulatory type-1 cells program local neutrophils to suppress hepatic autoimmunity via CRAMP. Cell Rep. (2021) 34:108919. doi: 10.1016/j.celrep.2021.108919
210. Hossain M, Shim R, Lee W-Y, Sharpe AH, and Kubes P. Gata6+ resident peritoneal macrophages promote the growth of liver metastasis. Nat Commun. (2022) 13:4406. doi: 10.1038/s41467-022-32080-y
211. Neupane AS, Willson M, Chojnacki AK, Castanheira FVES, Morehouse C, Carestia A, et al. Patrolling alveolar macrophages conceal bacteria from the immune system to maintain homeostasis. Cell. (2020) 183:110–25.e11. doi: 10.1016/j.cell.2020.08.020
212. Hanč P, Gonzalez RJ, Mazo IB, Wang Y, Lambert T, Ortiz G, et al. Multimodal control of dendritic cell functions by nociceptors. Science. (2023) 379:eabm5658. doi: 10.1126/science.abm5658
213. Hansen JN, Gong A, Wachten D, Pascal R, Turpin A, Jikeli JF, et al. Multifocal imaging for precise, label-free tracking of fast biological processes in 3D. Nat Commun. (2021) 12:4574. doi: 10.1038/s41467-021-24768-4
214. Zipfel WR, Williams RM, and Webb WW. Nonlinear magic: Multiphoton microscopy in the biosciences. Nat Biotechnol. (2003) 21:1369–77. doi: 10.1038/nbt899
215. Pittet MJ, Garris CS, Arlauckas SP, and Weissleder R. Recording the wild lives of immune cells. Sci Immunol. (2018) 3:eaaq0491. doi: 10.1126/sciimmunol.aaq0491
216. Palomino-Segura M, Virgilio T, Morone D, Pizzagalli DU, and Gonzalez SF. Imaging cell interaction in tracheal mucosa during influenza virus infection using two-photon intravital microscopy. J Vis Exp. (2018) 138:e58355. doi: 10.3791/58355
217. Palomino-Segura M, Perez L, Farsakoglu Y, Virgilio T, Latino I, D’Antuono R, et al. Protection against influenza infection requires early recognition by inflammatory dendritic cells through C-type lectin receptor SIGN-R1. Nat Microbiol. (2019) 4:1930–40. doi: 10.1038/s41564-019-0506-6
218. Chatziandreou N, Farsakoglu Y, Palomino-Segura M, D’Antuono R, Pizzagalli DU, Sallusto F, et al. Macrophage death following influenza vaccination initiates the inflammatory response that promotes dendritic cell function in the draining lymph node. Cell Rep. (2017) 18:2427–40. doi: 10.1016/j.celrep.2017.02.026
219. Lim K, Kim T, Trzeciak A, Amitrano AM, Reilly EC, Prizant H, et al. In situ neutrophil efferocytosis shapes T cell immunity to influenza infection. Nat Immunol. (2020) 21:1046–57. doi: 10.1038/s41590-020-0746-x
220. Doni A, Musso T, Morone D, Bastone A, Zambelli V, Sironi M, et al. An acidic microenvironment sets the humoral pattern recognition molecule PTX3 in a tissue repair mode. J Exp Med. (2015) 212:905–25. doi: 10.1084/jem.20141268
221. Kratofil RM, Shim HB, Shim R, Lee WY, Labit E, Sinha S, et al. A monocyte–leptin–angiogenesis pathway critical for repair post-infection. Nature. (2022) 609:166–73. doi: 10.1038/s41586-022-05044-x
222. Zindel J, Peiseler M, Hossain M, Deppermann C, Lee WY, Haenni B, et al. Primordial GATA6 macrophages function as extravascular platelets in sterile injury. Science. (2021) 371:eabe0595. doi: 10.1126/science.abe0595
223. Wang X, Hossain M, Bogoslowski A, Kubes P, and Irimia D. Chemotaxing neutrophils enter alternate branches at capillary bifurcations. Nat Commun. (2020) 11:2385. doi: 10.1038/s41467-020-15476-6
224. Prat-Luri B, Neal C, Passelli K, Ganga E, Amore J, Firmino-Cruz L, et al. The C5a-C5aR1 complement axis is essential for neutrophil recruitment to draining lymph nodes via high endothelial venules in cutaneous leishmaniasis. Cell Rep. (2022) 39:110777. doi: 10.1016/j.celrep.2022.110777
225. Mempel TR, Henrickson SE, and von Andrian UH. T-cell priming by dendritic cells in lymph nodes occurs in three distinct phases. Nature. (2004) 427:154–9. doi: 10.1038/nature02238
226. Fumagalli V, Venzin V, Di Lucia P, Moalli F, Ficht X, Ambrosi G, et al. Group 1 ILCs regulate T cell–mediated liver immunopathology by controlling local IL-2 availability. Sci Immunol. (2022) 7:eabi6112. doi: 10.1126/sciimmunol.abi6112
227. Weigelin B, den Boer AT, Wagena E, Broen K, Dolstra H, de Boer RJ, et al. Cytotoxic T cells are able to efficiently eliminate cancer cells by additive cytotoxicity. Nat Commun. (2021) 12:5217. doi: 10.1038/s41467-021-25282-3
228. Liu D, Winer BY, Chou MY, Tam H, Xu Y, An J, et al. Dynamic encounters with red blood cells trigger splenic marginal zone B cell retention and function. Nat Immunol. (2024) 25:142–54. doi: 10.1038/s41590-023-01690-z
229. Pae J, Schwan N, Ottino-Loffler B, DeWitt WS, Garg A, Bortolatto J, et al. Transient silencing of hypermutation preserves B cell affinity during clonal bursting. Nature. (2025) 641:1–9. doi: 10.1038/s41586-025-08687-8
230. Zindel J, Mittner J, Bayer J, April-Monn SL, Kohler A, Nusse Y, et al. Intraperitoneal microbial contamination drives post-surgical peritoneal adhesions by mesothelial EGFR-signaling. Nat Commun. (2021) 12:7316. doi: 10.1038/s41467-021-27612-x
231. Choe K, Hontani Y, Wang T, Hebert E, Ouzounov DG, Lai K, et al. Intravital three-photon microscopy allows visualization over the entire depth of mouse lymph nodes. Nat Immunol. (2022) 23:330–40. doi: 10.1038/s41590-021-01101-1
232. Schubert MC, Soyka SJ, Tamimi A, Maus E, Schroers J, Wißmann N, et al. Deep intravital brain tumor imaging enabled by tailored three-photon microscopy and analysis. Nat Commun. (2024) 15:7383. doi: 10.1038/s41467-024-51432-4
233. Streich L, Boffi JC, Wang L, Alhalaseh K, Barbieri M, Rehm R, et al. High-resolution structural and functional deep brain imaging using adaptive optics three-photon microscopy. Nat Methods. (2021) 18:7383. doi: 10.1038/s41592-021-01257-6
234. Bakker G-J, Weischer S, Ferrer Ortas J, Heidelin J, Andresen V, Beutler M, et al. Intravital deep-tumor single-beam 3-photon, 4-photon, and harmonic microscopy. eLife. (2022) 11:e63776. doi: 10.7554/eLife.63776
235. Morone D, D’Autilia F, Schorn T, Erreni M, and Doni A. Evaluation of cell metabolic adaptation in wound and tumour by Fluorescence Lifetime Imaging Microscopy. Sci Rep. (2020) 10:6289. doi: 10.1038/s41598-020-63203-4
236. Zhao Z, Zhou Y, Liu B, He J, Zhao J, Cai Y, et al. Two-photon synthetic aperture microscopy for minimally invasive fast 3D imaging of native subcellular behaviors in deep tissue. Cell. (2023) 186:2475–91.e22. doi: 10.1016/j.cell.2023.04.016
237. Sims RR, Bendifallah I, Grimm C, Lafirdeen ASM, Domínguez S, Chan CY, et al. Scanless two-photon voltage imaging. Nat Commun. (2024) 15:5095. doi: 10.1038/s41467-024-49192-2
238. Pinkard H, Baghdassarian H, Mujal A, Roberts E, Hu KH, Friedman DH, et al. Learned adaptive multiphoton illumination microscopy for large-scale immune response imaging. Nat Commun. (2021) 12:1916. doi: 10.1038/s41467-021-22246-5
239. Gerner MY, Kastenmuller W, Ifrim I, Kabat J, and Germain RN. Histo-cytometry: A method for highly multiplex quantitative tissue imaging analysis applied to dendritic cell subset microanatomy in lymph nodes. Immunity. (2012) 37:364–76. doi: 10.1016/j.immuni.2012.07.011
240. Semba T and Ishimoto T. Spatial analysis by current multiplexed imaging technologies for the molecular characterisation of cancer tissues. Br J Cancer. (2024) 131:1737–47. doi: 10.1038/s41416-024-02882-6
241. Zimmermann T, Rietdorf J, and Pepperkok R. Spectral imaging and its applications in live cell microscopy. FEBS Lett. (2003) 546:87–92. doi: 10.1016/S0014-5793(03)00521-0
242. Sadashivaiah V, Tippani M, Page SC, Kwon SH, Bach SV, Bharadwaj RA, et al. SUFI: An automated approach to spectral unmixing of fluorescent multiplex images captured in mouse and post-mortem human brain tissues. BMC Neurosci. (2023) 24:6. doi: 10.1186/s12868-022-00765-1
243. Klevanski M, Herrmannsdoerfer F, Sass S, Venkataramani V, Heilemann M, and Kuner T. Automated highly multiplexed super-resolution imaging of protein nano-architecture in cells and tissues. Nat Commun. (2020) 11:1552. doi: 10.1038/s41467-020-15362-1
244. Cole JD, Sarabia Del Castillo J, Gut G, Gonzalez-Bohorquez D, Pelkmans L, and Jessberger S. Characterization of the neurogenic niche in the aging dentate gyrus using iterative immunofluorescence imaging. eLife. (2022) 11:e68000. doi: 10.7554/eLife.68000
245. Mougios N, Cotroneo ER, Imse N, Setzke J, Rizzoli SO, Simeth NA, et al. NanoPlex: A universal strategy for fluorescence microscopy multiplexing using nanobodies with erasable signals. Nat Commun. (2024) 15:8771. doi: 10.1038/s41467-024-53030-w
246. Gut G, Herrmann MD, and Pelkmans L. Multiplexed protein maps link subcellular organization to cellular states. Sci (New York N.Y.). (2018) 361:eaar7042. doi: 10.1126/science.aar7042
247. Ko J, Wilkovitsch M, Oh J, Kohler RH, Bolli E, Pittet MJ, et al. Spatiotemporal multiplexed immunofluorescence imaging of living cells and tissues with bioorthogonal cycling of fluorescent probes. Nat Biotechnol. (2022) 40:1654–62. doi: 10.1038/s41587-022-01339-6
248. Quardokus EM, Saunders DC, McDonough E, Hickey JW, Werlein C, Surrette C, et al. Organ Mapping Antibody Panels: A community resource for standardized multiplexed tissue imaging. Nat Methods. (2023) 20:1174–8. doi: 10.1038/s41592-023-01846-7
249. Schueder F, Unterauer EM, Ganji M, and Jungmann R. DNA-barcoded fluorescence microscopy for spatial omics. PROTEOMICS. (2020) 20:1900368. doi: 10.1002/pmic.201900368
250. Hwang W, Raymond T, McPartland T, Jeong S, and Evans CL. Fluorescence Lifetime Multiplexing (FLEX) for simultaneous high dimensional spatial biology in 3D. Commun Biol. (2024) 7:1012. doi: 10.1038/s42003-024-06702-8
251. Gouzou D, Taimori A, Haloubi T, Finlayson N, Wang Q, Hopgood JR, et al. Applications of machine learning in time-domain fluorescence lifetime imaging: A review. Methods Appl Fluorescence. (2024) 12:022001. doi: 10.1088/2050-6120/ad12f7
252. Alexandrov T. Spatial metabolomics and imaging mass spectrometry in the age of artificial intelligence. Annu Rev Biomed Data Sci. (2020) 3:61–87. doi: 10.1146/annurev-biodatasci-011420-031537
253. Angelo M, Bendall SC, Finck R, Hale MB, Hitzman C, Borowsky AD, et al. Multiplexed ion beam imaging of human breast tumors. Nat Med. (2014) 20:436–42. doi: 10.1038/nm.3488
254. Giesen C, Wang HAO, Schapiro D, Zivanovic N, Jacobs A, Hattendorf B, et al. Highly multiplexed imaging of tumor tissues with subcellular resolution by mass cytometry. Nat Methods. (2014) 11:417–22. doi: 10.1038/nmeth.2869
255. Du J, Su Y, Qian C, Yuan D, Miao K, Lee D, et al. Raman-guided subcellular pharmaco-metabolomics for metastatic melanoma cells. Nat Commun. (2020) 11:4830. doi: 10.1038/s41467-020-18376-x
256. Phillips D, Matusiak M, Gutierrez BR, Bhate SS, Barlow GL, Jiang S, et al. Immune cell topography predicts response to PD-1 blockade in cutaneous T cell lymphoma. Nat Commun. (2021) 12:6726. doi: 10.1038/s41467-021-26974-6
257. Roider T, Baertsch MA, Fitzgerald D, Vöhringer H, Brinkmann BJ, Czernilofsky F, et al. Multimodal and spatially resolved profiling identifies distinct patterns of T cell infiltration in nodal B cell lymphoma entities. Nat Cell Biol. (2024) 26:478–89. doi: 10.1038/s41556-024-01358-2
258. Zhang D, Deng Y, Kukanja P, Agirre E, Bartosovic M, Dong M, et al. Spatial epigenome–transcriptome co-profiling of mammalian tissues. Nature. (2023) 616:478–89. doi: 10.1038/s41586-023-05795-1
259. Varga-Zsíros V, Migh E, Marton A, Kóta Z, Vizler C, Tiszlavicz L, et al. Development of a laser microdissection-coupled quantitative shotgun lipidomic method to uncover spatial heterogeneity. Cells. (2023) 12:428. doi: 10.3390/cells12030428
260. Brasko C, Smith K, Molnar C, Farago N, Hegedus L, Balind A, et al. Intelligent image-based in situ single-cell isolation. Nat Commun. (2018) 9:226. doi: 10.1038/s41467-017-02628-4
261. Parra ER, Uraoka N, Jiang M, Cook P, Gibbons D, Forget M-A, et al. Validation of multiplex immunofluorescence panels using multispectral microscopy for immune-profiling of formalin-fixed and paraffin-embedded human tumor tissues. Sci Rep. (2017) 7:13380. doi: 10.1038/s41598-017-13942-8
262. Seo J, Sim Y, Kim J, Kim H, Cho I, Nam H, et al. PICASSO allows ultra-multiplexed fluorescence imaging of spatially overlapping proteins without reference spectra measurements. Nat Commun. (2022) 13:2475. doi: 10.1038/s41467-022-30168-z
263. Vandereyken K, Sifrim A, Thienpont B, and Voet T. Methods and applications for single-cell and spatial multi-omics. Nat Rev Genet. (2023) 24:2475. doi: 10.1038/s41576-023-00580-2
264. Yayon N, Kedlian VR, Boehme L, Suo C, Wachter BT, Beuschel RT, et al. A spatial human thymus cell atlas mapped to a continuous tissue axis. Nature. (2024) 635:708–18. doi: 10.1038/s41586-024-07944-6
265. Stelzer EHK, Strobl F, Chang B-J, Preusser F, Preibisch S, McDole K, et al. Light sheet fluorescence microscopy. Nat Rev Methods Primers. (2021) 1:73. doi: 10.1038/s43586-021-00069-4
266. Daetwyler S and Fiolka RP. Light-sheets and smart microscopy, an exciting future is dawning. Commun Biol. (2023) 6:502. doi: 10.1038/s42003-023-04857-4
267. Rocha S, Basto AP, Ijsselsteijn ME, Teles SP, Azevedo MM, Gonçalves G, et al. Immunophenotype of gastric tumors unveils a pleiotropic role of regulatory T cells in tumor development. Cancers. (2021) 13:421. doi: 10.3390/cancers13030421
268. Richardson DS and Lichtman JW. Clarifying tissue clearing. Cell. (2015) 162:246–57. doi: 10.1016/j.cell.2015.06.067
269. Dekkers JF, Alieva M, Wellens LM, Ariese HCR, Jamieson PR, Vonk AM, et al. High-resolution 3D imaging of fixed and cleared organoids. Nat Protoc. (2019) 14:1756–71. doi: 10.1038/s41596-019-0160-8
270. Zhang D, Cleveland AH, Krimitza E, Han K, Yi C, Stout AL, et al. Spatial analysis of tissue immunity and vascularity by light sheet fluorescence microscopy. Nat Protoc. (2024) 19:1053–82. doi: 10.1038/s41596-023-00941-5
271. Merz SF, Jansen P, Ulankiewicz R, Bornemann L, Schimming T, Griewank K, et al. High-resolution three-dimensional imaging for precise staging in melanoma. Eur J Cancer. (2021) 159:182–93. doi: 10.1016/j.ejca.2021.09.026
272. McDole K, Guignard L, Amat F, Berger A, Malandain G, Royer LA, et al. In toto imaging and reconstruction of post-implantation mouse development at the single-cell level. Cell. (2018) 175:859–76.e33. doi: 10.1016/j.cell.2018.09.031
273. Cai R, Kolabas ZI, Pan C, Mai H, Zhao S, Kaltenecker D, et al. Whole-mouse clearing and imaging at the cellular level with vDISCO. Nat Protoc. (2023) 18:1197–242. doi: 10.1038/s41596-022-00788-2
274. Mai H, Luo J, Hoeher L, Al-Maskari R, Horvath I, Chen Y, et al. Whole-body cellular mapping in mouse using standard IgG antibodies. Nat Biotechnol. (2024) 42:617–27. doi: 10.1038/s41587-023-01846-0
275. Vladimirov N, Voigt FF, Naert T, Araujo GR, Cai R, Reuss AM, et al. Benchtop mesoSPIM: A next-generation open-source light-sheet microscope for cleared samples. Nat Commun. (2024) 15:2679. doi: 10.1038/s41467-024-46770-2
276. Chen B-C, Legant WR, Wang K, Shao L, Milkie DE, Davidson MW, et al. Lattice light-sheet microscopy: Imaging molecules to embryos at high spatiotemporal resolution. Science. (2014) 346:1257998. doi: 10.1126/science.1257998
277. Kersten K, Hu KH, Combes AJ, Samad B, Harwin T, Ray A, et al. Spatiotemporal co-dependency between macrophages and exhausted CD8+ T cells in cancer. Cancer Cell. (2022) 40:624–38.e9. doi: 10.1016/j.ccell.2022.05.004
278. Huisken J, Swoger J, Del Bene F, Wittbrodt J, and Stelzer EHK. Optical sectioning deep inside live embryos by selective plane illumination microscopy. Science. (2004) 305:1007–9. doi: 10.1126/science.1100035
279. Mahou P, Vermot J, Beaurepaire E, and Supatto W. Multicolor two-photon light-sheet microscopy. Nat Methods. (2014) 11:600–1. doi: 10.1038/nmeth.2963
280. Wang F, Zhong Y, Bruns O, Liang Y, and Dai H. In vivo NIR-II fluorescence imaging for biology and medicine. Nat Photonics. (2024) 18:535–47. doi: 10.1038/s41566-024-01391-5
281. Bouchard MB, Voleti V, Mendes CS, Lacefield C, Grueber WB, Mann RS, et al. Swept confocally-aligned planar excitation (SCAPE) microscopy for high-speed volumetric imaging of behaving organisms. Nat Photon. (2015) 9:113–9. doi: 10.1038/nphoton.2014.323
282. Patel KB, Liang W, Casper MJ, Voleti V, Li W, Yagielski AJ, et al. High-speed light-sheet microscopy for the in-situ acquisition of volumetric histological images of living tissue. Nat BioMed Eng. (2022) 6:569–83. doi: 10.1038/s41551-022-00849-7
283. Mimori-Kiyosue Y. Journey from image acquisition to biological insight: handling and analyzing large volumes of light-sheet imaging data. Microscopy. (2025) 74(3):164–78. doi: 10.1093/jmicro/dfaf013
284. Jain A, Ulman V, Krumnikl M, Pietzsch T, Preibisch S, and Tomančák P. Image processing and analysis of light sheet microscopy data. In: Light Sheet Fluorescence Microscopy. Weinheim, Germany: John Wiley & Sons, Ltd (2024). p. 203–29. doi: 10.1002/9783527803910.ch7
285. De Medeiros G, Ortiz R, Strnad P, Boni A, Moos F, Repina N, et al. Multiscale light-sheet organoid imaging framework. Nat Commun. (2022) 13:4864. doi: 10.1038/s41467-022-32465-z
286. Marin Z, Wang X, Collison DW, McFadden C, Lin J, Borges HM, et al. Navigate: An open-source platform for smart light-sheet microscopy. Nat Methods. (2024) 21:1967–69. doi: 10.1038/s41592-024-02413-4
287. Cimini BA, Bankhead P, D’Antuono R, Fazeli E, Fernandez-Rodriguez J, Fuster-Barceló C, et al. The crucial role of bioimage analysts in scientific research and publication. J Cell Sci. (2024) 137:jcs262322. doi: 10.1242/jcs.262322
288. Boehm U, Nelson G, Brown CM, Bagley S, Bajcsy P, Bischof J, et al. QUAREP-LiMi: A community endeavor to advance quality assessment and reproducibility in light microscopy. Nat Methods. (2021) 18:1423–6. doi: 10.1038/s41592-021-01162-y
289. Meiniel W, Olivo-Marin J-C, and Angelini ED. Denoising of microscopy images: A review of the state-of-the-art, and a new sparsity-based method. IEEE Trans Image Process. (2018) 27:3842–56. doi: 10.1109/TIP.2018.2819821
290. Dabov K, Foi A, Katkovnik V, and Egiazarian K. Image denoising with block-matching and 3D filtering. Image Processing: Algorithms Systems Neural Networks Mach Learn. (2006) 6064:354–65. doi: 10.1117/12.643267
291. Buades A, Coll B, and Morel J-M. (2005). A non-local algorithm for image denoising, in: 2005 IEEE Computer Society Conference on Computer Vision and Pattern Recognition (CVPR’05), San Diego, CA, USA: IEEE, Vol. 2. pp. 60–5. doi: 10.1109/CVPR.2005.38
292. Boulanger J, Kervrann C, Bouthemy P, Elbau P, Sibarita J-B, and Salamero J. Patch-based nonlocal functional for denoising fluorescence microscopy image sequences. IEEE Trans Med Imaging. (2010) 29:442–54. doi: 10.1109/TMI.2009.2033991
293. Luisier F, Vonesch C, Blu T, and Unser M. Fast interscale wavelet denoising of Poisson-corrupted images. Signal Process. (2010) 90:415–27. doi: 10.1016/j.sigpro.2009.07.009
294. Sage D, Donati L, Soulez F, Fortun D, Schmit G, Seitz A, et al. DeconvolutionLab2: An open-source software for deconvolution microscopy. Methods. (2017) 115:28–41. doi: 10.1016/j.ymeth.2016.12.015
295. Dehez H, Piché M, and Koninck YD. Resolution and contrast enhancement in laser scanning microscopy using dark beam imaging. Optics Express. (2013) 21:15912–25. doi: 10.1364/OE.21.015912
296. You S, Kuang C, Rong Z, and Liu X. Eliminating deformations in fluorescence emission difference microscopy. Optics Express. (2014) 22:26375–85. doi: 10.1364/OE.22.026375
297. Toscani M, Martínez OE, and Martínez S. Resolution, accuracy and precision in super-resolved microscopy images using SUPPOSe. Optics Lasers Eng. (2023) 161:107337. doi: 10.1016/j.optlaseng.2022.107337
298. Saurabh A, Brown PT, Bryan JS IV, Fox ZR, Kruithoff R, Thompson C, et al. Approaching maximum resolution in structured illumination microscopy via accurate noise modeling. NPJ Imaging. (2025) 3:5. doi: 10.1038/s44303-024-00066-8
299. Zhao W, Zhao S, Li L, Huang X, Xing S, Zhang Y, et al. Sparse deconvolution improves the resolution of live-cell super-resolution fluorescence microscopy. Nat Biotechnol. (2022) 40:606–17. doi: 10.1038/s41587-021-01092-2
300. Preibisch S, Saalfeld S, and Tomancak P. Globally optimal stitching of tiled 3D microscopic image acquisitions. Bioinformatics. (2009) 25:1463–65. doi: 10.1093/bioinformatics/btp184
301. Chalfoun J, Majurski M, Blattner T, Bhadriraju K, Keyrouz W, Bajcsy P, et al. MIST: accurate and scalable microscopy image stitching tool with stage modeling and error minimization. Sci Rep. (2017) 7:4988. doi: 10.1038/s41598-017-04567-y
302. Muhlich JL, Chen Y-A, Yapp C, Russell D, Santagata S, and Sorger PK. Stitching and registering highly multiplexed whole-slide images of tissues and tumors using ASHLAR. Bioinformatics. (2022) 38:4613–21. doi: 10.1093/bioinformatics/btac544
303. Gómez-Conde I, Caetano SS, Tadokoro CE, and Olivieri DN. Stabilizing 3D in vivo intravital microscopy images with an iteratively refined soft-tissue model for immunology experiments. Comput Biol Med. (2015) 64:246–60. doi: 10.1016/j.compbiomed.2015.07.001
304. Goobic AP, Tang J, and Acton ST. Image stabilization and registration for tracking cells in the microvasculature. IEEE Trans Biomed Eng. (2005) 52:287–99. doi: 10.1109/TBME.2004.840468
305. Dunn KW, Lorenz KS, Salama P, and Delp EJ. IMART software for correction of motion artifacts in images collected in intravital microscopy. IntraVital. (2014) 3:e28210. doi: 10.4161/intv.28210
306. Thevenaz P, Ruttimann UE, and Unser M. A pyramid approach to subpixel registration based on intensity. IEEE Trans Image Process. (1998) 7:27–41. doi: 10.1109/83.650848
307. Malacrida L. Phasor plots and the future of spectral and lifetime imaging. Nat Methods. (2023) 20:965–7. doi: 10.1038/s41592-023-01906-y
308. Szeliski R. Computer vision: algorithms and applications. Cham, CH: Springer International Publishing (2022). doi: 10.1007/978-3-030-34372-9
309. Otsu N. A threshold selection method from gray-level histograms. IEEE Trans Systems Man Cybernetics. (1979) 9:62–6. doi: 10.1109/TSMC.1979.4310076
310. Mittal H, Pandey AC, Saraswat M, Kumar S, Pal R, and Modwel G. A comprehensive survey of image segmentation: Clustering methods, performance parameters, and benchmark datasets. Multimedia Tools Appl. (2022) 81:35001–26. doi: 10.1007/s11042-021-10594-9
311. Kornilov A, Safonov I, and Yakimchuk I. A review of watershed implementations for segmentation of volumetric images. J Imaging. (2022) 8:127. doi: 10.3390/jimaging8050127
312. Rong W, Li Z, Zhang W, and Sun L. (2014). An improved Canny edge detection algorithm, in: 2014 IEEE International Conference on Mechatronics and Automation, . pp. 577–82. doi: 10.1109/ICMA.2014.6885761
313. Canny J. A computational approach to edge detection. In: IEEE Transactions on Pattern Analysis and Machine Intelligence, San Diego, CA, USA: IEEE, vol. 8. (1986). doi: 10.1109/TPAMI.1986.4767851
314. Sobel I. An isotropic 3 x 3 image gradient operator. In: Freeman H, editor. Machine vision for three-dimensional scenes. Cambridge, Massachusetts, United States: Academic Press (1990). p. 379–9.
315. Manzo C and Garcia-Parajo MF. A review of progress in single particle tracking: From methods to biophysical insights. Rep Prog Phys. (2015) 78:124601. doi: 10.1088/0034-4885/78/12/124601
316. Midtvedt B, Helgadottir S, Argun A, Pineda J, Midtvedt D, and Volpe G. Quantitative digital microscopy with deep learning. Appl Phys Rev. (2021) 8:011310. doi: 10.1063/5.0034891
317. Jaqaman K, Loerke D, Mettlen M, Kuwata H, Grinstein S, Schmid SL, et al. Robust single-particle tracking in live-cell time-lapse sequences. Nat Methods. (2008) 5:695–702. doi: 10.1038/nmeth.1237
318. Tinevez J-Y, Perry N, Schindelin J, Hoopes GM, Reynolds GD, Laplantine E, et al. TrackMate: An open and extensible platform for single-particle tracking. Methods. (2017) 115:80–90. doi: 10.1016/j.ymeth.2016.09.016
319. Pizzagalli DU, Farsakoglu Y, Palomino-Segura M, Palladino E, Sintes J, Marangoni F, et al. Leukocyte Tracking Database, a collection of immune cell tracks from intravital 2-photon microscopy videos. Sci Data. (2018) 5:180129. doi: 10.1038/sdata.2018.129
320. Sugawara K, Çevrim Ç, and Averof M. Tracking cell lineages in 3D by incremental deep learning. eLife. (2022) 11:e69380. doi: 10.7554/eLife.69380
321. Miura K, Tosi S, Möhl C, Zhang C, Paul-Gilloteaux P, Schulze U, et al. Bioimage analysis tools. In: Miura K, editor. Bioimage data analysis. Wiley-VCH (2016). Available online at: https://hal.science/hal-02910986 (Accessed September 5, 2025).
322. Berg S, Kutra D, Kroeger T, Straehle CN, Kausler BX, Haubold C, et al. ilastik: Interactive machine learning for (bio)image analysis. Nat Methods. (2019) 16:1226–32. doi: 10.1038/s41592-019-0582-9
323. Stirling DR, Swain-Bowden MJ, Lucas AM, Carpenter AE, Cimini BA, and Goodman A. CellProfiler 4: Improvements in speed, utility and usability. BMC Bioinf. (2021) 22:433. doi: 10.1186/s12859-021-04344-9
324. D’Antuono R and Pisignano G. ZELDA: A 3D image segmentation and parent-child relation plugin for microscopy image analysis in napari. Front Comput Sci. (2022) 3:796117. doi: 10.3389/fcomp.2021.796117
325. Cross SJ, Fisher JDJR, and Jepson MA. ModularImageAnalysis (MIA): assembly of modularised image and object analysis workflows in imageJ. J Microscopy. (2024) 296:173–83. doi: 10.1111/jmi.13227
326. Gerst R, Cseresnyés Z, and Figge MT. JIPipe: Visual batch processing for ImageJ. Nat Methods. (2023) 20:168–9. doi: 10.1038/s41592-022-01744-4
327. Lefebvre AEYT, Sturm G, Lin T-Y, Stoops E, López MP, Kaufmann-Malaga B, et al. Nellie: Automated organelle segmentation, tracking and hierarchical feature extraction in 2D/3D live-cell microscopy. Nat Methods. (2025) 22:1–13. doi: 10.1038/s41592-025-02612-7
328. Martins GG, Cordelières FP, Colombelli J, D’Antuono R, Golani O, Guiet R, et al. Highlights from the 2016-2020 NEUBIAS training schools for Bioimage Analysts: A success story and key asset for analysts and life scientists. F1000Research. (2021) 10:334. doi: 10.12688/f1000research.25485.1
329. Levet F, Carpenter AE, Eliceiri KW, Kreshuk A, Bankhead P, and Haase R. Developing open-source software for bioimage analysis: opportunities and challenges. F1000Research. (2021) 10:302. doi: 10.12688/f1000research.52531.1
330. Schindelin J, Arganda-Carreras I, Frise E, Kaynig V, Longair M, Pietzsch T, et al. Fiji: an open-source platform for biological-image analysis. Nat Methods. (2012) 9:676–82. doi: 10.1038/nmeth.2019
331. Sofroniew N, Lambert T, Evans K, Nunez-Iglesias J, Bokota G, Winston P, et al. Napari: A multi-dimensional image viewer for python. Zenodo. (2022). doi: 10.5281/zenodo.6598542
332. Bankhead P, Loughrey MB, Fernández JA, Dombrowski Y, McArt DG, Dunne PD, et al. QuPath: Open source software for digital pathology image analysis. Sci Rep. (2017) 7:16878. doi: 10.1038/s41598-017-17204-5
333. Kluyver T, Ragan-Kelley B, Pérez F, Granger B, Bussonnier M, Frederic J, et al. Jupyter Notebooks – a publishing format for reproducible computational workflows. In: Positioning and Power in Academic Publishing: Players, Agents and Agendas. Amsterdam, NL: IOS Press (2016). p. 87–90. doi: 10.3233/978-1-61499-649-1-87
334. Berthold MR, Cebron N, Dill F, Gabriel TR, Kötter T, Meinl T, et al. KNIME - the konstanz information miner. ACM SIGKDD Explor Newsletter. (2009) 11(1):26–31. doi: 10.1145/1656274.1656280
335. Von Chamier L, Laine RF, Jukkala J, Spahn C, Krentzel D, Nehme E, et al. Democratising deep learning for microscopy with ZeroCostDL4Mic. Nat Commun. (2021) 12:2276. doi: 10.1038/s41467-021-22518-0
336. Serra Lleti JM, Steyer AM, Schieber NL, Neumann B, Tischer C, Hilsenstein V, et al. CLEMSite, a software for automated phenotypic screens using light microscopy and FIB-SEM. J Cell Biol. (2023) 222:e202209127. doi: 10.1083/jcb.202209127
337. Edelstein A, Amodaj N, Hoover K, Vale R, and Stuurman N. Computer control of microscopes using μManager. Curr Protoc Mol Biol. (2010) 92:14 20 1–14 20 17. doi: 10.1002/0471142727.mb1420s92
338. Tischer C, Hilsenstein V, Hanson K, and Pepperkok R. Adaptive fluorescence microscopy by online feedback image analysis. Methods Cell Biol. (2014) 123:489–503. doi: 10.1016/B978-0-12-420138-5.00026-4
339. Scherf N and Huisken J. The smart and gentle microscope. Nat Biotechnol. (2015) 33:815–8. doi: 10.1038/nbt.3310
340. Royer LA, Lemon WC, Chhetri RK, Wan Y, Coleman M, Myers EW, et al. Adaptive light-sheet microscopy for long-term, high-resolution imaging in living organisms. Nat Biotechnol. (2016) 34:1267–78. doi: 10.1038/nbt.3708
341. Tosi S, Lladó A, Bardia L, Rebollo E, Godo A, Stockinger P, et al. AutoScanJ: A suite of imageJ scripts for intelligent microscopy. Front Bioinf. (2021) 1:627626. doi: 10.3389/fbinf.2021.627626
342. Vladymyrov M, Abe J, Moalli F, Stein JV, and Ariga A. Real-time tissue offset correction system for intravital multiphoton microscopy. J Immunol Methods. (2016) 438:35–41. doi: 10.1016/j.jim.2016.08.004
343. Schorb M, Haberbosch I, Hagen WJH, Schwab Y, and Mastronarde DN. Software tools for automated transmission electron microscopy. Nat Methods. (2019) 16:471–7. doi: 10.1038/s41592-019-0396-9
344. Dittrich T, Köhrer S, Schorb M, Haberbosch I, Börmel M, Goldschmidt H, et al. A high-throughput electron tomography workflow reveals over-elongated centrioles in relapsed/refractory multiple myeloma. Cell Rep Methods. (2022) 2:100322. doi: 10.1016/j.crmeth.2022.100322
345. Bepler T, Borst AJ, Bouvette J, Cannone G, Chen S, Cheng A, et al. Smart data collection for CryoEM. J Struct Biol. (2022) 214:107913. doi: 10.1016/j.jsb.2022.107913
346. Eisenstein F, Fukuda Y, and Danev R. Smart parallel automated cryo-electron tomography. Nat Methods. (2024) 21:1612–5. doi: 10.1038/s41592-024-02373-9
347. Schroeder AB, Dobson ETA, Rueden CT, Tomancak P, Jug F, and Eliceiri KW. The imageJ ecosystem: open-source software for image visualization, processing, and analysis. Protein Sci. (2021) 30:234–49. doi: 10.1002/pro.3993
348. Pinkard H, Stuurman N, Ivanov IE, Anthony NM, Ouyang W, Li B, et al. Pycro-manager: open-source software for customized and reproducible microscope control. Nat Methods. (2021) 18:226–8. doi: 10.1038/s41592-021-01087-6
349. Edelstein AD, Stuurman N, Tsuchida MA, Amodaj N, Pinkard H, and Vale RD. Advanced methods of microscope control using μManager software. JBM. (2014) 1:1. doi: 10.14440/jbm.2014.36
350. Munck S, Bo C, Cawthorne C, and Colombelli J. Innovating in a bioimaging core through instrument development. J Microscopy. (2024) 294:319–37. doi: 10.1111/jmi.13312
351. Gualda EJ, Vale T, Almada P, Feijó JA, Martins GG, and Moreno N. OpenSpinMicroscopy: an open-source integrated microscopy platform. Nat Methods. (2013) 10:599–600. doi: 10.1038/nmeth.2508
352. Oellermann M, Jolles JW, Ortiz D, Seabra R, Wenzel T, Wilson H, et al. Open hardware in science: the benefits of open electronics. Integr Comp Biol. (2022) 62:1061–75. doi: 10.1093/icb/icac043
353. Boulter E, Colombelli J, Henriques R, and Féral CC. The LEGO® brick road to open science and biotechnology. Trends Biotechnol. (2022) 40:1073–87. doi: 10.1016/j.tibtech.2022.02.003
354. Bonvoisin J, Molloy J, Häuer M, and Wenzel T. Standardisation of practices in open source hardware. J Open Hardware. (2020) 4:1–11. doi: 10.5334/joh.22
355. Wenzel T. Open hardware: from DIY trend to global transformation in access to laboratory equipment. PloS Biol. (2023) 21:3001931. doi: 10.1371/journal.pbio.3001931
356. Allan C, Burel J-M, Moore J, Blackburn C, Linkert M, Loynton S, et al. OMERO: flexible, model-driven data management for experimental biology. Nat Methods. (2012) 9:245–53. doi: 10.1038/nmeth.1896
357. Dang D, Le M, Irmer T, Angay O, Fichtl B, and Schwarz B. APEER: an interactive cloud platform for microscopists to easily deploy deep learning. (2021). doi: 10.5281/zenodo.5539895
358. Pereira A, Sousa M, Almeida AC, Ferreira LT, Costa AR, Novais-Cruz M, et al. Coherent-hybrid STED: high contrast sub-diffraction imaging using a bi-vortex depletion beam. Optics Express. (2019) 27:8092. doi: 10.1364/OE.27.008092
359. Skansi S. Introduction to deep learning: from logical calculus to artificial intelligence. Cham, CH: Springer International Publishing (2018). doi: 10.1007/978-3-319-73004-2
360. Turing AM. Computing machinery and intelligence. Mind. (1950) 49:443–60. doi: 10.1093/mind/LIX.236.433
361. McCulloch WS and Pitts W. A logical calculus of the ideas immanent in nervous activity. Bull Math Biophysics. (1943) 5:115–33. doi: 10.1007/BF02478259
362. Rosenblatt F. The perceptron: A probabilistic model for information storage and organization in the brain. psychol Rev. (1958) 65:386–408. doi: 10.1037/h0042519
363. Werbos P. Beyond regression: new tools for prediction and analysis in the behavioral sciences. Cambridge, MA: Harvard Univ (1974).
365. LeCun Y. Une procédure d’apprentissage pour Réseau à seuil assymétrique in Cognitiva 85: A la Frontière de l’Intelligence Artificielle. In: Des Sciences de la Connaissance et des Neurosciences Paris, France: Secréariat du Colloque COGNITIVA CESTA (1985). p. 599–604.
366. LeCun Y, Bengio Y, and Hinton G. Deep learning. Nature. (2015) 521:436–44. doi: 10.1038/nature14539
367. Schmidhuber J. Deep learning in neural networks: an overview. Neural Networks. (2015) 61:85–117. doi: 10.1016/j.neunet.2014.09.003
369. Brooks M. Inside the maths that drives AI. Nature. (2024) 631:244–6. doi: 10.1038/d41586-024-02185-z
370. Esteva A, Kuprel B, Novoa RA, Ko J, Swetter SM, Blau HM, et al. Dermatologist-level classification of skin cancer with deep neural networks. Nature. (2017) 542:115–8. doi: 10.1038/nature21056
371. Weigert M and Schmidt U. Nuclei instance segmentation and classification in histopathology images with starDist. IEEE International Symposium on Biomedical Imaging Challenges (ISBIC), Kolkata, India (2022) 1–4. doi: 10.1109/ISBIC56247.2022.9854534
372. Jesper Sjöström P, Frydel BR, and Wahlberg LU. Artificial neural network-aided image analysis system for cell counting. Cytometry. (1999) 36:18–26. doi: 10.1002/(SICI)1097-0320(19990501)36:1<18::AID-CYTO3>3.0.CO;2-J
373. Tian T, Zhang J, Lin X, Wei Z, and Hakonarson H. Dependency-aware deep generative models for multitasking analysis of spatial omics data. Nat Methods. (2024) 21:1501–13. doi: 10.1038/s41592-024-02257-y
374. Stirling DR, Carpenter AE, and Cimini BA. CellProfiler Analyst 3.0: Accessible data exploration and machine learning for image analysis. Bioinformatics. (2021) 37:3992–4. doi: 10.1093/bioinformatics/btab634
375. Simon E, Swanson K, and Zou J. Language models for biological research: A primer. Nat Methods. (2024) 21:1422–9. doi: 10.1038/s41592-024-02354-y
376. Sutton RS and Barto AG. Reinforcement Learning, second edition: An Introduction. 2nd edition. MIT press, Cambridge, MA: Bradford Books (2018).
377. Baniukiewicz P, Lutton EJ, Collier S, and Bretschneider T. Generative adversarial networks for augmenting training data of microscopic cell images. Front Comput Sci. (2019) 1:10. doi: 10.3389/fcomp.2019.00010
378. Greener JG, Kandathil SM, Moffat L, and Jones DT. A guide to machine learning for biologists. Nat Rev Mol Cell Biol. (2022) 23:40–55. doi: 10.1038/s41580-021-00407-0
379. Moen E, Bannon D, Kudo T, Graf W, Covert M, and Van Valen D. Deep learning for cellular image analysis. Nat Methods. (2019) 16:1233–46. doi: 10.1038/s41592-019-0403-1
380. Gündüz HA, Binder M, To X-Y, Mreches R, Bischl B, McHardy AC, et al. A self-supervised deep learning method for data-efficient training in genomics. Commun Biol. (2023) 6:928. doi: 10.1038/s42003-023-05310-2
381. Ciresan DC, Meier U, Masci J, Gambardella LM, and Schmidhuber J. (2011). Flexible, high performance convolutional neural networks for image classification, in: IJCAI Proceedings-International Joint Conference on Artificial Intelligence, aaai press palo alto ca, Vol. 22.
382. Krizhevsky A, Sutskever I, and Hinton GE. ImageNet classification with deep convolutional neural networks. Commun ACM. (2017) 60(6):84–90. doi: 10.1145/3065386
383. Paszke A, Gross S, Chintala S, Chanan G, Yang E, DeVito Z, et al. Automatic differentiation in PyTorch (2017). Available online at: https://openreview.net/forum?id=BJJsrmfCZ (Accessed September 4, 2025).
384. Cittadini E, Marinoni M, and Buttazzo G. A hardware accelerator to support deep learning processor units in real-time image processing. Engineering Applications of Artificial Intelligence. (2025) 145:110159.
385. Caba J, Díaz M, Barba J, Guerra R, López JADLT, and Sebastián. FPGA-Based On-Board Hyperspectral Imaging Compression: Benchmarking Performance and Energy Efficiency against GPU Implementations. Remote Sens. (2020) 12:3741. doi: 10.3390/rs12223741
386. Meijering E. A bird’s-eye view of deep learning in bioimage analysis. Comput Struct Biotechnol J. (2020) 18:2312–25. doi: 10.1016/j.csbj.2020.08.003
387. Arganda-Carreras I, Kaynig V, Rueden C, Eliceiri KW, Schindelin J, Cardona A, et al. Trainable Weka Segmentation: A machine learning tool for microscopy pixel classification. Bioinf (Oxford England). (2017) 33:2424–6. doi: 10.1093/bioinformatics/btx180
388. Arzt M, Deschamps J, Schmied C, Pietzsch T, Schmidt D, Tomancak P, et al. LABKIT: labeling and segmentation toolkit for big image data. Front Comput Sci. (2022) 4:777728. doi: 10.3389/fcomp.2022.777728
389. Belevich I, Joensuu M, Kumar D, Vihinen H, and Jokitalo E. Microscopy image browser: A platform for segmentation and analysis of multidimensional datasets. PloS Biol. (2016) 14:e1002340. doi: 10.1371/journal.pbio.1002340
390. Powell BM and Davis JH. Learning structural heterogeneity from cryo-electron sub-tomograms with tomoDRGN. Nat Methods. (2024) 21:1525–36. doi: 10.1038/s41592-024-02210-z
391. Liu YT, Zhang H, Wang H, Tao CL, Bi GQ, and Zhou ZH. Isotropic reconstruction for electron tomography with deep learning. Nat Commun. (2022) 13:6482. doi: 10.1038/s41467-022-33957-8
392. He J, Lin P, Chen J, Cao H, and Huang SY. Model building of protein complexes from intermediate-resolution cryo-EM maps with deep learning-guided automatic assembly. Nat Commun. (2022) 13:4066. doi: 10.1038/s41467-022-31748-9
393. Jamali K, Käll L, Zhang R, Brown A, Kimanius D, and Scheres SHW. Automated model building and protein identification in cryo-EM maps. Nature. (2024) 628:450–7. doi: 10.1038/s41586-024-07215-4
394. Jih J, Liu YT, Liu W, and Zhou ZH. The incredible bulk: Human cytomegalovirus tegument architectures uncovered by AI-empowered cryo-EM. Sci Adv. (2024) 10:eadj1640. doi: 10.1126/sciadv.adj1640
395. Christensen CN, Ward EN, Lu M, Lio P, and Kaminski CF. ML-SIM: Universal reconstruction of structured illumination microscopy images using transfer learning. Biomed Optics Express. (2021) 12:2720–33. doi: 10.1364/BOE.414680
396. Qiao C, Li D, Guo Y, Liu C, Jiang T, Dai Q, et al. Evaluation and development of deep neural networks for image super-resolution in optical microscopy. Nat Methods. (2021) 18:194–202. doi: 10.1038/s41592-020-01048-5
397. Jin L, Liu B, Zhao F, Hahn S, Dong B, Song R, et al. Deep learning enables structured illumination microscopy with low light levels and enhanced speed. Nat Commun. (2020) 11;1934. doi: 10.1038/s41467-020-15784-x
398. Ma C, Tan W, He R, and Yan B. Pretraining a foundation model for generalizable fluorescence microscopy-based image restoration. Nat Methods. (2024) 21:1558–67. doi: 10.1038/s41592-024-02244-3
399. Qiao C, Zeng Y, Meng Q, Chen X, Chen H, Jiang T, et al. Zero-shot learning enables instant denoising and super-resolution in optical fluorescence microscopy. Nat Commun. (2024) 15:4180. doi: 10.1038/s41467-024-48575-9
400. Priessner M, Gaboriau DCA, Sheridan A, Lenn T, Garzon-Coral C, Dunn AR, et al. Content-aware frame interpolation (CAFI): Deep learning-based temporal super-resolution for fast bioimaging. Nat Methods. (2024) 21:322–30. doi: 10.1038/s41592-023-02138-w
401. Midtvedt B, Pineda J, Skärberg F, Olsén E, Bachimanchi H, Wesén E, et al. Single-shot self-supervised object detection in microscopy. Nat Commun. (2022) 13:7492. doi: 10.1038/s41467-022-35004-y
402. Morales-Curiel LF, Gonzalez AC, Castro-Olvera G, Lin L-C, El-Quessny M, Porta-de-la-Riva M, et al. Volumetric imaging of fast cellular dynamics with deep learning enhanced bioluminescence microscopy. Commun Biol. (2022) 5:1330. doi: 10.1038/s42003-022-04292-x
403. Lee M, Lee YH, Song J, Kim G, Jo Y, Min H, et al. Deep-learning-based three-dimensional label-free tracking and analysis of immunological synapses of CAR-T cells. eLife. (2020) 9:e49023. doi: 10.7554/eLife.49023
404. Ravindran S. Five ways deep learning has transformed image analysis. Nature. (2022) 609:864–66. doi: 10.1038/d41586-022-02964-6
405. Krull A, Buchholz T-O, and Jug F. Noise2Void—Learning denoising from single noisy images (2019). Available online at: https://openaccess.thecvf.com/content_CVPR_2019/html/Krull_Noise2Void_-_Learning_Denoising_From_Single_Noisy_Images_CVPR_2019_paper.html (Accessed September 5, 2025).
406. Weigert M, Schmidt U, Boothe T, Müller A, Dibrov A, Jain A, et al. Content-aware image restoration: Pushing the limits of fluorescence microscopy. Nat Methods. (2018) 15:1090–7. doi: 10.1038/s41592-018-0216-7
407. Li Y, Su Y, Guo M, Han X, Liu J, Vishwasrao HD, et al. Incorporating the image formation process into deep learning improves network performance. Nat Methods. (2022) 19:1427–37. doi: 10.1038/s41592-022-01652-7
408. Zhang G, Li X, Zhang Y, Han X, Li X, Yu J, et al. Bio-friendly long-term subcellular dynamic recording by self-supervised image enhancement microscopy. Nat Methods. (2023) 20:1957–70. doi: 10.1038/s41592-023-02058-9
409. Li X, Hu X, Chen X, Fan J, Zhao Z, Wu J, et al. Spatial redundancy transformer for self-supervised fluorescence image denoising. Nat Comput Sci. (2023) 3:1067–80. doi: 10.1038/s43588-023-00568-2
410. Rehman A, Zhovmer A, Sato R, Mukouyama Y, Chen J, Rissone A, et al. Convolutional neural network transformer (CNNT) for fluorescence microscopy image denoising with improved generalization and fast adaptation. Sci Rep. (2024) 14:18184. doi: 10.1038/s41598-024-68918-2
411. Qiao C, Li D, Liu Y, Zhang S, Liu K, Liu C, et al. Rationalized deep learning super-resolution microscopy for sustained live imaging of rapid subcellular processes. Nat Biotechnol. (2023) 41:367–77. doi: 10.1038/s41587-022-01471-3
412. Chen J, Sasaki H, Lai H, Su Y, Liu J, Wu Y, et al. Three-dimensional residual channel attention networks denoise and sharpen fluorescence microscopy image volumes. Nat Methods. (2021) 18:678–87. doi: 10.1038/s41592-021-01155-x
413. Chong X, Cheng M, Fan W, Li Q, and Leung H. M-Denoiser: Unsupervised image denoising for real-world optical and electron microscopy data. Comput Biol Med. (2023) 164:107308. doi: 10.1016/j.compbiomed.2023.107308
414. Laine RF, Jacquemet G, and Krull A. Imaging in focus: An introduction to denoising bioimages in the era of deep learning. Int J Biochem Cell Biol. (2021) 140:106077. doi: 10.1016/j.biocel.2021.106077
415. Lu P, Oetjen KA, Bender DE, Ruzinova MB, Fisher DAC, Shim KG, et al. IMC-Denoise: a content aware denoising pipeline to enhance Imaging Mass Cytometry. Nat Commun. (2023) 14(1):1601. doi: 10.1038/s41467-023-37123-6
416. Dai B, You S, Wang K, Long Y, Chen J, Upreti N, et al. Deep learning–enabled filter-free fluorescence microscope. Sci Adv. (2025) 11:eadq2494. doi: 10.1126/sciadv.adq2494
417. Liu S, Zou W, Sha H, Feng X, Chen B, Zhang J, et al. Deep learning-enhanced snapshot hyperspectral confocal microscopy imaging system. Optics Express. (2024) 32:13918–31. doi: 10.1364/OE.519045
418. Yao Y, Smal I, Grigoriev I, Akhmanova A, and Meijering E. Deep-learning method for data association in particle tracking. Bioinformatics. (2020) 36:4935–41. doi: 10.1093/bioinformatics/btaa597
419. Andhari MD, Rinaldi G, Nazari P, Vets J, Shankar G, Dubroja N, et al. Quality control of immunofluorescence images using artificial intelligence. Cell Rep Phys Sci. (2024) 5:102220. doi: 10.1016/j.xcrp.2024.102220
420. Buchholz T-O, Krull A, Shahidi R, Pigino G, Jékely G, and Jug F. Content-aware image restoration for electron microscopy. Methods Cell Biol. (2019) 152:277–89. doi: 10.1016/bs.mcb.2019.05.001
421. Falk T, Mai D, Bensch R, Çiçek Ö, Abdulkadir A, Marrakchi Y, et al. U-Net: Deep learning for cell counting, detection, and morphometry. Nat Methods. (2018) 16:67–70. doi: 10.1038/s41592-018-0261-2
422. Stringer C and Pachitariu M. Cellpose3: one-click image restoration for improved cellular segmentation. Nat Methods. (2025) 22:592–9. doi: 10.1038/s41592-025-02595-5
423. Archit A, Freckmann L, Nair S, Khalid N, Hilt P, Rajashekar V, et al. Segment anything for microscopy. Nat Methods. (2025) 22:579–91. doi: 10.1038/s41592-024-02580-4
424. Kirillov A, Mintun E, Ravi N, Mao H, Rolland C, Gustafson L, et al. (2023). Segment anything, in: 2023 IEEE/CVF International Conference on Computer Vision (ICCV), Paris, France. San Diego, CA: IEEE. doi: 10.1109/iccv51070.2023.00371
425. Morone D, Marazza A, Bergmann TJ, and Molinari M. Deep learning approach for quantification of organelles and misfolded polypeptide delivery within degradative compartments. Mol Biol Cell. (2020) 31(14):1437–549. doi: 10.1091/mbc.E20-04-0269
426. Suga S, Nakamura K, Nakanishi Y, Humbel BM, Kawai H, and Hirabayashi Y. An interactive deep learning-based approach reveals mitochondrial cristae topologies. PloS Biol. (2023) 21:e3002246. doi: 10.1371/journal.pbio.3002246
427. Pulfer A, Pizzagalli DU, Gagliardi PA, Hinderling L, Lopez P, Zayats R, et al. Transformer-based spatial–temporal detection of apoptotic cell death in live-cell imaging. eLife. (2024) RP90502. doi: 10.7554/eLife.90502
428. Gómez-de-Mariscal E, Del Rosario M, Pylvänäinen JW, Jacquemet G, and Henriques R. Harnessing artificial intelligence to reduce phototoxicity in live imaging. J Cell Sci. (2024) 137:jcs261545. doi: 10.1242/jcs.261545
429. Andriasyan V, Yakimovich A, Petkidis A, Georgi F, Witte R, Puntener D, et al. Microscopy deep learning predicts virus infections and reveals mechanics of lytic-infected cells. iScience. (2021) 24:102543. doi: 10.1016/j.isci.2021.102543
430. Omange RW, Kim SC, Kolhatkar NS, Plott T, Van Trump W, Zhang K, et al. AI discovery of TLR agonist-driven phenotypes reveals unique features of peripheral cells from healthy donors and ART-suppressed people living with HIV. Front Immunol. (2025) 16:1541152. doi: 10.3389/fimmu.2025.1541152
431. Chen M, Dai W, Sun SY, Jonasch D, He CY, Schmid MF, et al. Convolutional neural networks for automated annotation of cellular cryo-electron tomograms. Nat Methods. (2017) 14:983–5. doi: 10.1038/nmeth.4405
432. Li X, Li Y, Zhou Y, Wu J, Zhao Z, Fan J, et al. Real-time denoising enables high-sensitivity fluorescence time-lapse imaging beyond the shot-noise limit. Nat Biotechnol. (2023) 41:282–92. doi: 10.1038/s41587-022-01450-8
433. Moghadam MR and Chen YPP. Tracking leukocytes in intravital time lapse images using 3D cell association learning network. Artif Intell Med. (2021) 118:102129. doi: 10.1016/j.artmed.2021.102129
434. Kobayashi H, Cheveralls KC, Leonetti MD, and Royer LA. Self-supervised deep learning encodes high-resolution features of protein subcellular localization. Nat Methods. (2022) 19:995–1003. doi: 10.1038/s41592-022-01541-z
435. Sekh AA, Opstad IS, Godtliebsen G, Birgisdottir Å.B, Ahluwalia BS, Agarwal K, et al. Physics-based machine learning for subcellular segmentation in living cells. Nat Mach Intell. (2021) 3:1071–80. doi: 10.1038/s42256-021-00420-0
436. Wang X, Zhao J, Marostica E, Yuan W, Jin J, Zhang J, et al. A pathology foundation model for cancer diagnosis and prognosis prediction. Nature. (2024) 634:970–78. doi: 10.1038/s41586-024-07894-z
437. Bortolomeazzi M, Montorsi L, Temelkovski D, Keddar MR, Acha-Sagredo A, Pitcher MJ, et al. A SIMPLI (Single-cell identification from multiPLexed images) approach for spatially-resolved tissue phenotyping at single-cell resolution. Nat Commun. (2022) 13:1–14. doi: 10.1038/s41467-022-28470-x
438. Song E, Kim M, Lee S, Liu H-W, Kim J, Choi D-H, et al. VONet: A deep learning network for 3D reconstruction of organoid structures with a minimal number of confocal images. Patterns. (2024) 5:101063. doi: 10.1016/j.patter.2024.101063
439. Palla G, Spitzer H, Klein M, Fischer D, Schaar AC, Kuemmerle LB, et al. Squidpy: A scalable framework for spatial omics analysis. Nat Methods. (2022) 19:171–8. doi: 10.1038/s41592-021-01358-2
440. Crainiciuc G, Palomino-Segura M, Molina-Moreno M, Sicilia J, Aragones DG, Li JLY, et al. Behavioural immune landscapes of inflammation. Nature. (2022) 601:415–21. doi: 10.1038/s41586-021-04263-y
441. Acharya D and Mukhopadhyay A. A comprehensive review of machine learning techniques for multi-omics data integration: Challenges and applications in precision oncology. Briefings Funct Genomics. (2024) 23:549–60. doi: 10.1093/bfgp/elae013
442. Ballard JL, Wang Z, Li W, Shen L, and Long Q. Deep learning-based approaches for multi-omics data integration and analysis. BioData Min. (2024) 17:38. doi: 10.1186/s13040-024-00391-z
443. Royer LA. Omega—Harnessing the power of large language models for bioimage analysis. Nat Methods. (2024) 21:1371–3. doi: 10.1038/s41592-024-02310-w
444. Driscoll MK and Zaritsky A. Data science in cell imaging. J Cell Sci. (2021) 134:jcs254292. doi: 10.1242/jcs.254292
445. Abdelaziz EH, Ismail R, Mabrouk MS, and Amin E. Multi-omics data integration and analysis pipeline for precision medicine: Systematic review. Comput Biol Chem. (2024) 113:108254. doi: 10.1016/j.compbiolchem.2024.108254
446. O’Donnell TJ, Rubinsteyn A, and Laserson U. MHCflurry 2.0: improved pan-allele prediction of MHC class I-presented peptides by incorporating antigen processing. Cell Syst. (2020) 11:42–48.e7. doi: 10.1016/j.cels.2020.06.010
447. Patrick E, Canete NP, Iyengar SS, Harman AN, Sutherland GT, and Yang P. Spatial analysis for highly multiplexed imaging data to identify tissue microenvironments. Cytometry Part A. (2023) 103:593–9. doi: 10.1002/cyto.a.24729
448. Eulenberg P, Köhler N, Blasi T, Filby A, Carpenter AE, Rees P, et al. Reconstructing cell cycle and disease progression using deep learning. Nat Commun. (2017) 8:463. doi: 10.1038/s41467-017-00623-3
449. Pizzagalli DU, Gonzalez SF, and Krause R. A trainable clustering algorithm based on shortest paths from density peaks. Sci Adv. (2019) 5:eaax3770. doi: 10.1126/sciadv.aax3770
450. Bilate AM, London M, Castro TBR, Mesin L, Bortolatto J, Kongthong S, et al. T cell receptor is required for differentiation, but not maintenance, of intestinal CD4+ Intraepithelial lymphocytes. Immunity. (2020) 53:1001–14.e20. doi: 10.1016/j.immuni.2020.09.003
451. Lewis SM, Asselin-Labat M-L, Nguyen Q, Berthelet J, Tan X, Wimmer VC, et al. Spatial omics and multiplexed imaging to explore cancer biology. Nat Methods. (2021) 18:997–1012. doi: 10.1038/s41592-021-01203-6
452. Rosen Y, Brbić M, Roohani Y, Swanson K, Li Z, and Leskovec J. Toward universal cell embeddings: Integrating single-cell RNA-seq datasets across species with SATURN. Nat Methods. (2024) 21:1492–500. doi: 10.1038/s41592-024-02191-z
453. Mencattini A, Di Giuseppe D, Comes MC, Casti P, Corsi F, Bertani FR, et al. Discovering the hidden messages within cell trajectories using a deep learning approach for in vitro evaluation of cancer drug treatments. Sci Rep. (2020) 10:7653. doi: 10.1038/s41598-020-64246-3
454. Vaswani A, Shazeer N, Parmar N, Uszkoreit J, Jones L, Gomez AN, et al. Attention is all you need. Adv Neural Inf Process Syst. (2017) 30. Available online at: https://proceedings.neurips.cc/paper/2017/hash/3f5ee243547dee91fbd053c1c4a845aa-Abstract.html (Accessed September 5, 2025).
455. Lei W, Fuster-Barceló C, Reder G, Muñoz-Barrutia A, and Ouyang W. BioImage.IO Chatbot: A community-driven AI assistant for integrative computational bioimaging. Nat Methods. (2024) 21:1368–70. doi: 10.1038/s41592-024-02370-y
456. Szałata A, Hrovatin K, Becker S, Tejada-Lapuerta A, Cui H, Wang B, et al. Transformers in single-cell omics: A review and new perspectives. Nat Methods. (2024) 21:1430–43. doi: 10.1038/s41592-024-02353-z
457. Zhang S, Dai G, Huang T, and Chen J. Multimodal large language models for bioimage analysis. Nat Methods. (2024) 21:1390–3. doi: 10.1038/s41592-024-02334-2
458. Gui J, Sun Z, Wen Y, Tao D, and Ye J. A review on generative adversarial networks: algorithms, theory, and applications. IEEE Trans Knowledge Data Eng. (2023) 35:3313–32. doi: 10.1109/TKDE.2021.3130191
459. Abramson J, Adler J, Dunger J, Evans R, Green T, Pritzel A, et al. Accurate structure prediction of biomolecular interactions with AlphaFold 3. Nature. (2024) 630:493–500. doi: 10.1038/s41586-024-07487-w
460. Ahdritz G, Bouatta N, Floristean C, Kadyan S, Xia Q, Gerecke W, et al. OpenFold: Retraining AlphaFold2 yields new insights into its learning mechanisms and capacity for generalization. Nat Methods. (2024) 21:1514–24. doi: 10.1038/s41592-024-02272-z
461. Abanades B, Wong WK, Boyles F, Georges G, Bujotzek A, and Deane CM. ImmuneBuilder: Deep-Learning models for predicting the structures of immune proteins. Commun Biol. (2023) 6:575. doi: 10.1038/s42003-023-04927-7
462. Rangan R, Feathers R, Khavnekar S, Lerer A, Johnston JD, Kelley R, et al. CryoDRGN-ET: Deep reconstructing generative networks for visualizing dynamic biomolecules inside cells. Nat Methods. (2024) 21:1537–45. doi: 10.1038/s41592-024-02340-4
463. Zaritsky A, Jamieson AR, Welf ES, Nevarez A, Cillay J, Eskiocak U, et al. Interpretable deep learning uncovers cellular properties in label-free live cell images that are predictive of highly metastatic melanoma. Cell Syst. (2021) 12:733–47.e6. doi: 10.1016/j.cels.2021.05.003
464. El Nahhas OSM, Loeffler CML, Carrero ZI, van Treeck M, Kolbinger FR, Hewitt KJ, et al. Regression-based Deep-Learning predicts molecular biomarkers from pathology slides. Nat Commun. (2024) 15:1253. doi: 10.1038/s41467-024-45589-1
465. Hederman AP and Ackerman ME. Leveraging deep learning to improve vaccine design. Trends Immunol. (2023) 44:333–44. doi: 10.1016/j.it.2023.03.002
466. Pertseva M, Gao B, Neumeier D, Yermanos A, and Reddy ST. Applications of machine and deep learning in adaptive immunity. Annu Rev Chem Biomolecular Eng. (2021) 12:39–62. doi: 10.1146/annurev-chembioeng-101420-125021
467. Stringer C, Wang T, Michaelos M, and Pachitariu M. Cellpose: A generalist algorithm for cellular segmentation. Nat Methods. (2021) 18:100–6. doi: 10.1038/s41592-020-01018-x
468. Gómez-de-Mariscal E, García-López-de-Haro C, Ouyang W, Donati L, Lundberg E, Unser M, et al. DeepImageJ: A user-friendly environment to run deep learning models in ImageJ. Nat Methods. (2021) 18:1192–5. doi: 10.1038/s41592-021-01262-9
469. Maffulli S. ‘Open source’ AI isn’t truly open—Here’s how researchers can reclaim the term. Nature. (2025) 640:9. doi: 10.1038/d41586-025-00930-6
470. Hartley M, Kleywegt GJ, Patwardhan A, Sarkans U, Swedlow JR, and Brazma A. The bioImage archive – building a home for life-sciences microscopy data. Comput Resour Mol Biol. (2022) 434:167505. doi: 10.1016/j.jmb.2022.167505
471. Wilkinson MD, Dumontier M, Aalbersberg IJJ, Appleton G, Axton M, Baak A, et al. The FAIR Guiding Principles for scientific data management and stewardship. Sci Data. (2016) 3:160018. doi: 10.1038/sdata.2016.18
472. van der Walt S, Schönberger JL, Nunez-Iglesias J, Boulogne F, Warner JD, Yager N, et al. the scikit-image contributors. (2014) scikit-image: image processing in Python. PeerJ 2:e453. doi: 10.7717/peerj.453
473. Pedregosa F, Varoquaux G, Gramfort A, Michel V, Thirion B, Grisel O, et al. Scikit-learn: machine learning in python. J Mach Learn Res. (2011) 12:2825–30.
474. Wang Z, Wang J, Zhao Y, Jin J, Si W, Chen L, et al. 3D live imaging and phenotyping of CAR-T cell mediated-cytotoxicity using high-throughput Bessel oblique plane microscopy. Nat Commun. (2024) 15;6677. doi: 10.1038/s41467-024-51039-9
475. Wingert T, Lee C, and Cannesson M. Machine learning, deep learning, and closed loop devices—Anesthesia delivery. Anesthesiology Clinics. (2021) 39:565. doi: 10.1016/j.anclin.2021.03.012
476. Singh M and Nath G. Artificial intelligence and anesthesia: A narrative review. Saudi J Anaesthesia. (2022) 16:86. doi: 10.4103/sja.sja_669_21
477. Carpenter AE, Cimini BA, and Eliceiri KW. Smart microscopes of the future. Nat Methods. (2023) 20:962–4. doi: 10.1038/s41592-023-01912-0
478. Kawaguchi K, Bengio Y, and Kaelbling L. Generalization in Deep Learning. In: Grohs P and Kutyniok G, editors. Mathematical Aspects of Deep Learning, 1st ed. Cambridge University Press, Cambridge, UK (2022). p. 112–48.
479. Banerjee S, Agarwal A, and Singla S. LLMs will always hallucinate, and we need to live with this. arXiv. (2024). doi: 10.48550/arXiv.2409.05746
480. Duede E. Deep learning opacity in scientific discovery. Philosophy Sci. (2023) 90:1089–99. doi: 10.1017/psa.2023.8
481. Germain RN, Van Allen EM, Trynka G, Tsang JS, Grün D, Kiemen AL, et al. AI and immunology. Immunity. (2024) 57:1177–81. doi: 10.1016/j.immuni.2024.05.016
482. Meade BJ. Reply to: One neuron versus deep learning in aftershock prediction. Nature. (2019) 574:E4. doi: 10.1038/s41586-019-1583-7
483. Lee RM, Eisenman LR, Khuon S, Aaron JS, and Chew T-L. Believing is seeing – the deceptive influence of bias in quantitative microscopy. J Cell Sci. (2024) 137:jcs261567. doi: 10.1242/jcs.261567
484. Durkee MS, Abraham R, Clark MR, and Giger ML. Artificial intelligence and cellular segmentation in tissue microscopy images. Am J Pathol. (2021) 191:1693–701. doi: 10.1016/j.ajpath.2021.05.022
485. Salehin I, Islam S, Saha P, Noman SM, Tuni A, Hasan M, et al. AutoML: A systematic review on automated machine learning with neural architecture search. J Inf Intell. (2024) 2:52–81. doi: 10.1016/j.jiixd.2023.10.002
486. Lewis P, Perez E, Piktus A, Petroni F, Karpukhin V, Goyal N, et al. Retrieval-augmented generation for knowledge-intensive NLP tasks. In Proceedings of the 34th International Conference on Neural Information Processing Systems (NIPS '20). Curran Associates Inc., Red Hook, NY, USA (2020) 793:9459–74.
Keywords: microscopy, immunology, virology, machine learning, deep learning, image analysis, feedback microscopy, smart microscopy
Citation: Morone D and D’Antuono R (2025) AI-based hardware and software tools in microscopy to boost research in immunology and virology. Front. Immunol. 16:1610345. doi: 10.3389/fimmu.2025.1610345
Received: 11 April 2025; Accepted: 13 August 2025;
Published: 30 September 2025.
Edited by:
Giovanni Porta, University of Insubria, ItalyReviewed by:
Jie E. Yang, University of Wisconsin-Madison, United StatesShengshan Xu, Jiangmen Central Hospital, China
Copyright © 2025 Morone and D’Antuono. This is an open-access article distributed under the terms of the Creative Commons Attribution License (CC BY). The use, distribution or reproduction in other forums is permitted, provided the original author(s) and the copyright owner(s) are credited and that the original publication in this journal is cited, in accordance with accepted academic practice. No use, distribution or reproduction is permitted which does not comply with these terms.
*Correspondence: Diego Morone, ZGllZ28ubW9yb25lQGlyYi51c2kuY2g=; Rocco D’Antuono, cm9jY28uZGFudHVvbm9AY3JpY2suYWMudWs=