 Yongchang Zhu1,2†
 Ranran Dai3,4†Hao Zhao5Junwei Luo5Keyi Li5Wei Xue5
 Litao Qin1Hongyuan Pan5Shixiu Liao1*
 Bingtao Hao2,6*
- 1Henan Key Provincial Laboratory of Genetic Diseases and Functional Genomics, People’s Hospital of Zhengzhou University, Zhengzhou University, Zhengzhou, China
- 2Department of Immunology, School of Basic Medical Sciences, Zhengzhou University, Zhengzhou, China
- 3RNA Biomedical Institute, Sun Yat-Sen Memorial Hospital, Zhongshan School of Medicine, Sun Yat-Sen University, Guangzhou, China
- 4Center for Stem Cell Biology and Tissue Engineering, Key Laboratory for Stem Cells and Tissue Engineering, Ministry of Education, Zhongshan School of Medicine, Sun Yat-Sen University, Guangzhou, China
- 5Cancer Research Institute, School of Basic Medical Sciences, Southern Medical University, Guangzhou, China
- 6Henan Eye Institute, Henan Academy of Innovations in Medical Science, Zhengzhou, China
T cell receptor (TCR) diversity, essential for the recognition of a wide array of antigens, is generated through V(D)J recombination. The Tcra and Tcrd genes reside within a shared genomic locus, with Tcrd rearrangement occurring first in the double-negative (DN) stage during thymocyte development. Elucidating the regulatory mechanisms governing Tcrd rearrangement is therefore crucial for understanding the developmental coordination of both Tcrd and Tcra rearrangements. Chromatin architecture, orchestrated by CTCF-cohesin complexes and their binding sites, plays a fundamental role in regulating V(D)J recombination of antigen receptor genes. In this study, we report that EACBE, a CTCF binding element (CBE) located downstream of the Tcra-Tcrd locus, regulates Tcrd rearrangement. EACBE promotes the usage of proximal Vδ gene segments by facilitating spatial proximity between the Tcrd recombination centre and these Vδ elements. Notably, EACBE counteracts the insulating effects of INTs, two CBEs that demarcate the proximal V region from the Dδ-Jδ-Cδ cluster, thereby enabling effective chromatin extrusion. Furthermore, EACBE indirectly shapes the Tcra repertoire through its influence on Tcrd rearrangement. These findings reveal a novel regulatory axis involving special chromatin configuration and highlight distinct roles for specific CTCF binding sites in modulating antigen receptor gene assembly.
1 Introduction
The adaptive immune system relies on T and B lymphocytes to detect and respond to foreign pathogens through highly diverse surface antigen receptors (1). T cell development in the thymus progresses through three stages: double negative (DN), double positive (DP), and single positive (SP). T cell receptor (TCR) diversity arises from recombination of variable (V), diversity (D), and joining (J) gene segments, flanked by recombination signal sequences (RSSs) recognized by the RAG1/2 recombinase complex. Among the four genes (Tcra, Tcrb, Tcrg, and Tcrd), Tcra and Tcrd are uniquely co-located within a single genomic locus on chromosome 14 in mice. The Tcrd gene lies between the Vα and Jα gene clusters and shares a subset of V gene segments with Tcrα (2). Chromatin accessibility has been shown to regulate the recombination initiation, with germline transcription increasing accessibility of RSSs for RAG binding (3). This establishes a mechanistic link between transcriptional regulation and V(D)J recombination. Enhancers Eδ and Eα play essential role in promoting transcription and recombination of Tcrd and Tcra, respectively (4–6).
Chromatin is organized in a highly structured and hierarchical manner within the nucleus, and this organization is tightly regulated by architectural proteins such as CTCF and cohesion (7). CTCF, a conserved 11 zinc finger protein, binds to CBEs and mediates a range of gene regulatory functions, including transcriptional insulation and long-distance chromatin interactions (8–10). Cohesin, a ring-like tetrameric complex, is best known for its role in sister chromatid cohesion during mitosis but also contributes significantly to higher-order chromatin organization and facilitates genome-wide chromatin interactions (11, 12). CTCF and cohesin frequently colocalize at genomic sites, where convergent CBEs serves as anchors for the formation of chromatin loops (13–16). Targeted degradation or genetic ablation of CTCF or cohesin disrupts these interactions, underscoring their essential roles in genome topology (17, 18). In the context of antigen receptor gene rearrangement, the juxtaposition of V gene segments with (D)J segments is a prerequisite for effective V(D)J recombination. Chromatin immunoprecipitation (ChIP) analyses have demonstrated that CTCF and cohesin colocalize at V segments and cis-regulatory elements in the Tcra-Tcrd locus (19). Notably, deletion of either CTCF or cohesin in DP thymocytes impaired Tcra rearrangement by disrupting chromatin loops between regulatory elements (20, 21).
CBEs and their coordinated interactions play a crucial role in regulating the spatial organization and rearrangement of antigen receptor genes. Specifically, IGCR1 and 3’CBE, which consist of two CBEs and a tandem array of ten CBEs, respectively, are located within the immunoglobulin heavy chain (Igh) locus. The chromatin loop structure formed by the interaction between IGCR1 and 3’CBE restricts the spatial proximity between the 3’VH region and the DJH region, thereby orchestrating Igh rearrangement (22–25). In the Tcra-Tcrd locus, two CBEs, INT1 and INT2, collectively known as INTs, are positioned between the proximal Vα region and the first Vδ gene, Trdv4. At the DN stage, INTs interacts with the CBE in the TEA promoter to form a chromatin loop that encompasses the Tcrd recombination center, thereby regulating Tcrd rearrangement. Deletion of INTs results in a significant increase in the usage of Trdv2-2, while the usage of distal Vδ segments is reduced. This shift reflects enhanced proximity between Trdv2–2 and the Tcrd recombination center. These findings indicate that the loop formed by INTs and TEA CBE restricts the rearrangement of proximal Vδ segments, thus increasing Tcrd diversity (26).
During thymocyte development, Tcrd undergoes rearrangement at the DN stage, while Tcra rearranges at the DP stage, with Tcrd rearrangement proceding Tcra. The Vδ to DJδ rearrangement results in the deletion of the genomic region between the used Vδ segment and the Dδ-Jδ-Cδ region, which subsequently affects Tcra rearrangement. Previous studies have shown that Tcra rearrangement initiates from the proximal Vα and Jα genes, progressively extending towards the distal regions. Consequently, Tcrd rearrangement, especially the rearrangements of Vδ segments in the repetitive V region, promotes the usage of Vα segments, thereby increasing the diversity of the TCRα repertoire. Deletion of the INTs has been shown to impair Tcra rearrangement, likely due to defects in Tcrd rearrangement (26). Through the ablation of Tcrd recombination, Danielle J et al. discovered that Tcrd rearrangement enhanced the diversity of the primary Vα rearrangement in mice (27). Therefore, Tcrd rearrangement plays a crucial role in maintaining the diversity of the Tcra repertoire.
Two CBEs have been identified just downstream of the enhancer Eα, referred to as EACBE. Our previous findings have shown that EACBE regulates Tcra rearrangement (28). Previous studies have shown that Eα is primed but inactive during the DN stage, and no evidence suggests that Eα contributes Tcrd rearrangement (6, 29). However, our prior research indicated that EACBE deletion also affects the Tcrd repertoire. Specifically, in EACBE-/- thymocytes, the usage of proximal Vδ segments, such as Trdv2–2 and Trdv1, was reduced, whereas the usage of Trdv5 and distal Vδ genes was increased (28), contrasting with the effects of INTs on Tcrd rearrangement. Nonetheless, it has been documented that Eα influences the expression of rearranged Tcrd (6, 30). The question of whether the impact of EACBE on the Tcrd repertoire is due to direct effects on rearrangement or post-rearrangement expression requires further investigation, as the underlying mechanisms remain unclear. Additionally, it remains to be determined whether the influence of EACBE on Tcra rearrangement at the DP stage is a consequence of its effect on Tcrd rearrangement at the DN stage.
To address these issues, we conducted this study on DN cells derived from EACBE knockout mice. Our findings indicate that EACBE has a direct impact on Tcrd rearrangement. Additionally, EACBE indirectly influences the Vα usage in DP cells by modulating Tcrd rearrangement, specifically affecting the diversity of Trav14-related TCR. ATAC-seq and germline transcription results demonstrate that EACBE deletion slightly reduces the chromatin activity of Trdv2-2. Furthermore, we provide evidence that EACBE facilitates the Tcrd recombination center to overcome the isolation imposed by INTs, thereby enhancing its interaction with the proximal Vδ region.
2 Materials and methods
2.1 Mice
Mice used for all experiments were 4 to 8-week-old of mixed sex and housed in a specific-pathogen-free facility managed by the Southern Medical University Division of Laboratory Animal Center. EACBE-/-, Rag1-/-, Rag2-/-, EACBE-/- Rag2-/-and EACBE-/- Rag1-/- mice had been previously characterized (PMID: 32853367, 37534534). All procedures involving mice were conducted in strict compliance with the protocols sanctioned by the Institutional Animal Care and Use Committee at Southern Medical University.
2.2 Cell collection
Thymus glands were carefully harvested and homogenized in MACS buffer. Thymocytes were filtered through a 40 μm nylon mesh to obtain a single-cell suspension. For LAM-HTGTS analysis, DN thymocytes (Thy1.2+, CD4-, CD8-) and DP thymocytes (Thy1.2+, CD4+, CD8+) were sorted from WT or EACBE-/- mice. Rag-deficient DN thymocytes are directly isolated from Rag1-/- and EACBE-/- Rag1-/- mice.
2.3 Flow cytometry and cell sorting
Unless otherwise specified, all antibodies were procured from Biolegend. DN and DP cells were sorted through staining with antibodies targeting CD4 (RM4–5), CD8 (53–6.7), and Thy1.2 (53–2.1). The γδ-T cells in the thymus, spleen, and lymph nodes were identified using anti-γδ-T (GL3) and CD3 (145–2C11) antibodies. Data acquisition was performed using a BD FACSCanto II flow cytometer configured for eight-color analysis.
2.4 PCR and Southern blot analysis of Vδ usage
Total thymocytes were lysed by incubation in a buffer containing 10 mM Tris–HCl (pH 8.0), 150 mM NaCl, 10 mM EDTA, 0.4% (wt/vol) SDS, and 0.1 mg/ml proteinase K, maintained overnight at 37°C. Genomic DNA was subsequently isolated using phenol/chloroform extraction followed by ethanol precipitation. The polymerase chain reaction (PCR) was conducted under the following conditions: an initial denaturation at 95°C for 3 minutes; 30 cycles consisting of denaturation at 95°C for 30 seconds, annealing at 60°C for 30 seconds, and extension at 72°C for 1 minute; and a final extension at 72°C for 5 minutes. Following agarose gel electrophoresis and transfer to nylon membranes, PCR products were detected through hybridization with biotin-labeled oligonucleotide probes. The sequences of primers and probes are detailed in Supplementary Table S1.
2.5 3C-HTGTS
3C-HTGTS libraries were constructed using thymocytes isolated from Rag1-/- or EACBE-/- Rag1-/- mice. For each experiment, three to four mice were utilized. The detailed methodology has been previously outlined (31). The sequences of the nested primer, and adapter-complementary primer are provided in Supplementary Table S2.
2.6 ATAC-seq
To analyze open chromatin regions, ATAC-seq was conducted utilizing DN thymocytes derived from Rag1-/- or EACBE-/- Rag1-/- mice. Initially, approximately 5 × 10^4 cell pellets were washed once with cold PBS. Cells were lysed on ice for 3 minutes in 50 μl ice-cold Lysis Buffer, which comprised 10 mM Tris at pH 7.4, 10 mM NaCl, 3 mM MgCl2, 0.1% NP-40, 0.1% TWEEN 20, and 0.01% Digitonin dissolved in DEPC-treated water. Following lysis, the cells were resuspended in 1 ml of ice-cold RBS-Wash buffer containing 10 mM Tris at pH 7.4, 10 mM NaCl, 3 mM MgCl2, and 0.1% TWEEN 20, and then centrifuged at 4°C at 500 × g for 5 minutes to pellet the cellular material. The tagmentation process was executed in 1 × Tagmentation Buffer that included 10 mM Tris at pH 7.4, 5 mM MgCl2, 10% DMF, 33% PBS, 0.1% TWEEN 20, and 0.01% Digitonin, employing 100 nM of Tn5 Transposase for 30 minutes at 37°C. Immediately after tagmentation, the free DNA fragments were purified following the protocol specified by the QIAquick PCR Purification Kit (QIAGEN, 28106, Germany). This step was followed by a final PCR amplification cycle of 10 to 15 rounds using P5 and P7 primers. Post-purification, the prepared libraries were sequenced via the Illumina NovaSeq 6000 sequencing platform to generate 150bp pair-end reads.
2.7 LAM-HTGTS
LAM-HTGTS was performed using 1 μg DNA of sorted DN cells or 6 μg DNA of sorted DP cells from one WT or EACBE-/- mice per experiment. DNA was extracted using DNA Isolation Mini Kit (Vazyme, DC102) and sonicated to about 500bp on a Qsonica Bioruptor Sonicator. Sonicated DNA was linearly amplified with a biotinylated primer that anneals to sites of interest. Biotin-labeled single stranded DNA products were enriched with streptavidin C1 beads (65001, Thermo Fisher Scientific), and followed by 3’ end ligation with the bridge adapter. The adapter-ligated products were amplified through nested PCR using a nested primer and an adapter-complementary primer (Supplementary Table S3). The detailed primers used in this study are also listed in Supplementary Information, Supplementary Table S3. And a final PCR for another 10–12 cycles of amplification with P5 and P7 primers was performed. After purification, libraries were sequenced on an Illumina NovaSeq 6000 platform to obtain 150 bp pair-end reads.
2.8 Germline transcription for qPCR or RNA-Seq
RNA was extracted from DN thymocytes from Rag1-/- or EACBE-/- Rag1-/- mice employing TRIzol reagent (Invitrogen), adhering strictly to the manufacturer’s protocol. 500ng RNA was used to synthesize cDNA according to the manufacturer’s instructions (Vazyme, R312). Quantitative real-time PCR (qPCR) was then conducted utilizing a Relative Quantification approach. The thermal cycling conditions were set as follows: an initial denaturation at 95°C for 5 minutes, followed by 45 cycles of denaturation at 95°C for 30 seconds, and annealing/extension at 60°C for 1 minute. The primer sequences employed are cataloged in Supplementary Tables S4 or S5. The relative expression levels of various gene transcripts were computed using the comparative ΔΔCt method, where the ΔΔCt value for each target gene was normalized against that of the housekeeping gene Actb.
For subsequent library construction, 1μg of total RNA was processed. Initially, ribosomal RNA (rRNA) was removed using an rRNA depletion kit, and the remaining mRNA was fragmented into shorter segments (200–300 bp) with the addition of a fragmentation buffer. First-strand cDNA synthesis was initiated using random hexamer primers, while second-strand cDNA was synthesized in the presence of buffer, deoxynucleotide triphosphates (dNTPs including dUTP, dATP, dGTP, and dCTP), RNase H, and DNA polymerase I. The cDNA was subsequently purified using the QiaQuick PCR kit and eluted with EB buffer. Following this, the cDNA underwent end repair, adenylation, and ligation with Illumina adapters. The second cDNA strand containing uracil was specifically degraded by the USER enzyme. Lastly, PCR amplification was performed to enrich for strand-specific cDNA libraries. Post-purification, these libraries were subjected to high-throughput sequencing on the Illumina NovaSeq 6000 platform, generating 150bp paired-end reads.
2.9 Native chromatin immunoprecipitation-qPCR
Native ChIP was performed on DN thymocytes from 3–4 Rag2-/- or EACBE-/- Rag2-/- mice per experiment. Cells were lysed in 200μl of a buffer containing 80 mM NaCl, 10 mM Tris-HCl pH8.0, 10 mM sodium butyrate, 6 mM MgCl2, 1 mM CaCl2, 250 mM sucrose, 0.2% (vol/vol) NP40, 0.1 mM PMSF, and 1×protease inhibitor cocktail, followed by a 5-minute incubation on ice. The lysate was then subjected to centrifugation at 600 × g for 5 minutes at 4°C. The nuclear pellet was subsequently washed once with a buffer composed of 10 mM NaCl, 10 mM Tris-HCl (pH 8.0), 10 mM sodium butyrate, 3 mM MgCl2, 1 mM CaCl2, and 250 mM sucrose. To generate predominantly mononucleosomes with a minor fraction of dinucleosomes, the nuclei were digested by incubating them for 5 minutes at 37°C in 200 μl of the same buffer supplemented with 8 units of Micrococcal nuclease (Worthington). The enzymatic reaction was halted by adding 8 μl of a stop solution containing 0.2 M EDTA and 0.2 M EGTA. Following centrifugation at 18,000 × g for 10 minutes, the supernatant was diluted to achieve a final concentration of 16.7 mM Tris (pH 8.0), 1.2 mM EDTA, 167 mM NaCl, 1.1% Triton X-100 (v/v), 0.1 mM PMSF, and 1× protease inhibitor cocktail. The chromatin was then incubated overnight at 4°C with specific antibodies: anti-trimethylated H3K4 (Millipore, 04-745), anti-acetylated H3K27 (Abcam, ab4729), or control rabbit IgG (R&D Systems, ab-105-c). Protein A/G magnetic beads (Pierce, 88802) were added to the mixture and incubated for an additional four hours. Post-incubation, the immunoprecipitates were rigorously washed, and the DNA was purified for subsequent analysis.
Quantitative PCR (qPCR) was performed using a StepOne™ Real-Time PCR System (Thermo Fisher, 4376373) with Hieff™ qPCR SYBR® Green Master Mix (YEASEN, China). A standard curve was constructed using gradient concentrations of genomic DNA to ensure accurate quantification. Both immunoprecipitated and input DNAs were quantified, and the Actb gene promoter served as a positive control to normalize the bound/input ratios across different samples. Detailed primer sequences are provided in Supplementary Table S6. The PCR protocol included an initial denaturation step at 95°C for 5 minutes, followed by 45 cycles of 30 seconds at 95°C and 1 minute at 60°C.
2.10 3C-HTGTS data processing for pairwise chromatin interactions
Paired-end Illumina sequencing FASTQ data were processed by removing adapters and low-quality reads using Fastp (v0.20.0). Following quality control, trimmed reads were extracted from the sequence files with Cutadapt (v1.18). Paired-end reads containing nested primers or adapter primers were manually merged into single reads using restriction enzyme recognition sequences with PEAR (v0.9.6). Subsequently, the initial digested fragment located behind the viewpoint (VP) was isolated by fragmenting the single reads according to restriction enzyme recognition sequences. The remaining single-end reads were aligned to the enzyme-digested mm10 reference genome using Bowtie2 (v2.4.5, parameters: -p 8 –sensitive). The mouse genome sequence (mm10) was sourced from UCSC (http://hgdownload.cse.ucsc.edu/goldenPath/mm10/bigZips/chromFa.tar.gz), and concordantly exact alignments were extracted using SAMtools (v1.9). Self-ligation and off-target reads were filtered out post-mapping. For visualization purposes, the final BAM files were converted into bedGraph files using Bedtools (v2.29.2). The signal peak bedGraph file was generated through a process of post-comparison filtering, signal statistical analysis, and standardization. We applied the CPM (Counts Per Million in cis) normalization method to the bedGraph files and visualized the results using the IGV genome browser. Differential pairwise interactions were identified using the R package R.4Cker (version 1.0.0, with k=30), employing the near viewpoint Analysis function to delineate interaction domains with the viewpoint. Additionally, DESeq2 (version 1.34.0, with a significance threshold of p < 0.05) was utilized for further analysis (32). Finally, we compiled the results into a comprehensive report and visualized the data using the Bioconductor package ggplot2 (version 3.3.6).
2.11 3C-HTGTS data processing for three-way chromatin interactions
The quality control of the raw data and the fragmentation process based on restriction enzyme sites were conducted in accordance with the previously described pairwise chromatin interaction method. Subsequently, all fragments retrieved from the same read were organized on a single line according to the unique identifier of each read, and continuous fragments were removed. To construct contact matrices, the first two digested fragments following the viewpoint fragment were extracted, or various combinations of three fragments were generated by arranging all fragments from the same read. Raw contact matrices were produced at resolutions of 3 kb, 5 kb, and 10 kb. For the correction of raw contact matrices, these interaction counts were normalized to a total of 1,000,000 interactions at the same resolutions. Like a Hi-C matrix, coverage was represented in a two-dimensional matrix, where each point indicated the number of interactions identified between two bins at a specific resolution. Differential analysis and visualization of local interactions derived from three-way interactions were performed using the R package GENOVA (v1.0.0). Loops observed on the IGV genome browser were identified using fixed-size bin resolutions ranging from 3 kb to 10 kb. Briefly, interaction loops (contact frequencies >= 5) were identified by using raw contact frequencies.
2.12 VP-SOI analysis for three-way interactions for 3C-HTGTS
In accordance with the methodology described by Vermeulen et al. (33), our study identified cooperative, random, or competitive multi-way interactions involving the viewpoint (VP) and two additional sites of interest: a second site of interest (SOI) and a third site. This was achieved through an association analysis. Specifically, in cases where the interaction is cooperative among the VP, SOI, and the third site, a subset of reads containing both the VP and SOI should also frequently encompass the third site. To evaluate whether the third site exhibits cooperative, random, or competitive interactions, we compared its frequency in the set of reads containing both the VP and SOI (referred to as the positive set) with its frequency in the set of reads containing the VP but lacking the SOI (referred to as the negative set). To mitigate the effects of technical and sampling variations, we randomly sampled same reads from the negative set equivalent to the number of reads in the positive set. Subsequently, we randomly filtered one fragment from each sampled read in the negative set to substitute for the SOI fragment present in all reads of the positive set. This procedure was iterated 1,000 times to construct an average negative profile, with the mean and standard deviation calculated accordingly. Subsequently, the positive contact profile was compared to the negative profile, and a z-score was computed to assess the significance of cooperative or competitive interactions among the VP, the SOI, and the third partner. A z-score approaching zero suggests a random contact frequency between the SOI and the third partner in the presence of the VP, whereas a positive or negative z-score indicates cooperative or competitive interactions among these three genomic regions, respectively.
2.13 ATAC-Seq analysis
The raw sequence reads were initially processed to remove adapter sequences and low-quality reads using fastp (version 0.20.0). Subsequently, the filtered reads were aligned to the mouse genome (mm10) utilizing Bowtie2 (version 2.4.5) with parameters set to -p 8 –sensitive. PCR duplicate fragments were removed using Picard (version 2.22.8). Unmapped, multi-mapped reads, as well as those mapping to chromosome M (chrM), were filtered out. The Fragments Ratio in Peaks (FRiP) value was calculated using Bedtools (version 2.29.2) and awk (version 4.0.2). We employed deepTools (version 3.5.0) to generate bigWig files with CPM normalization, which can be visualized in IGV. SAM files were converted to BAM format using SAMtools (version 1.9) for subsequent peak calling. Peaks were identified using MACS2 (version 2.2.4) with specified parameters (–nomodel –shift -100 –extsize 200 -B –keep-dup all –broad –broad-cutoff 0.1), and annotations were performed using the R package ChIPSeeker (version 1.36.0).
2.14 Tcra repertoire analysis
Tcra repertoire sequencing data were obtained from our publicly available resource. The detailed analytical methodology has been previously described (28). To determine the differences in Vα gene usage, the usage of each Vα gene in EACBE-/- was subtracted from its corresponding usage in the WT.
2.15 LAM-HTGTS analysis
The initial raw data underwent filtration using fastp (version 0.20.0). Subsequently, trimmed reads, which included nested primers and adapter primers, were removed and extracted from the sequence file following quality control procedures implemented with Cutadapt (version 1.18). Additionally, reads exhibiting contamination or low quality were eliminated. The identification of T-cell receptor alpha and delta chain V, D, and J genes, as well as the extraction of CDR3 sequences from the clean reads, was conducted utilizing MiXCR (version 3.0.11) (available at https://github.com/milaboratory/mixcr). The corresponding germline sequences were aligned with reference sequences obtained from the international ImMunoGeneTics (IMGT) database.
3 Results
3.1 EACBE promotes proximal Vδ usage while restricting distal Vδ rearrangement
In our previous study, we analyzed the Tcrd repertoire in wild-type (WT) and EACBE-/- mouse using 5’ rapid amplification of cDNA ends (5’ RACE) with a Cδ-specific primer. The results revealed a significant reduction in the usage of proximal Vδ segments, such as Trdv2–2 and Trdv1, in EACBE-deleted thymocytes, whereas the usage of Trdv5 and distal Vδ segments was increased (28). These findings suggest that EACBE contributes to the regulation of V(D)J recombination of the Tcrd gene. The enhancer Eα was previously shown to be dispensable for Tcrd rearrangement but necessary for maintaining physiological expression levels of mature VDJδ transcripts (30). To determine whether EACBE directly regulates Tcrd rearrangement, we performed a PCR-Southern blot assay. The results confirmed that EACBE deletion leads to an increase in Trdv5 rearrangements and a decrease in Trdv2–2 rearrangements (Supplementary Figure S1A).
To obtain a more comprehensive view of Tcrd rearrangement dynamics, we employed Trdj1-HTGTS-seq to examine the usage of Vδ genes in sorted DN cells. In WT cells, frequently used Vδ segments included Trdv5, Trdv2-2, Trdv1, Trav21/dv12, Trav15-2/dv6-2, Trav15-1/dv6-1, Trav15n-1, Trav15d-2/dv6d-2, and Trav15d/dv6d-1, with Trdv2–2 being the most prominently used. Compared to WT DN cells, the usage of Trdv5 and distal Trav15 family genes was increased in EACBE-deleted DN cells, alongside reduced usage of proximal Vδ genes (Trdv2–2 and Trdv1) (Figure 1A), which is consistent with the 5’ RACE results. These data support a direct regulatory role of EACBE in Tcrd rearrangement.
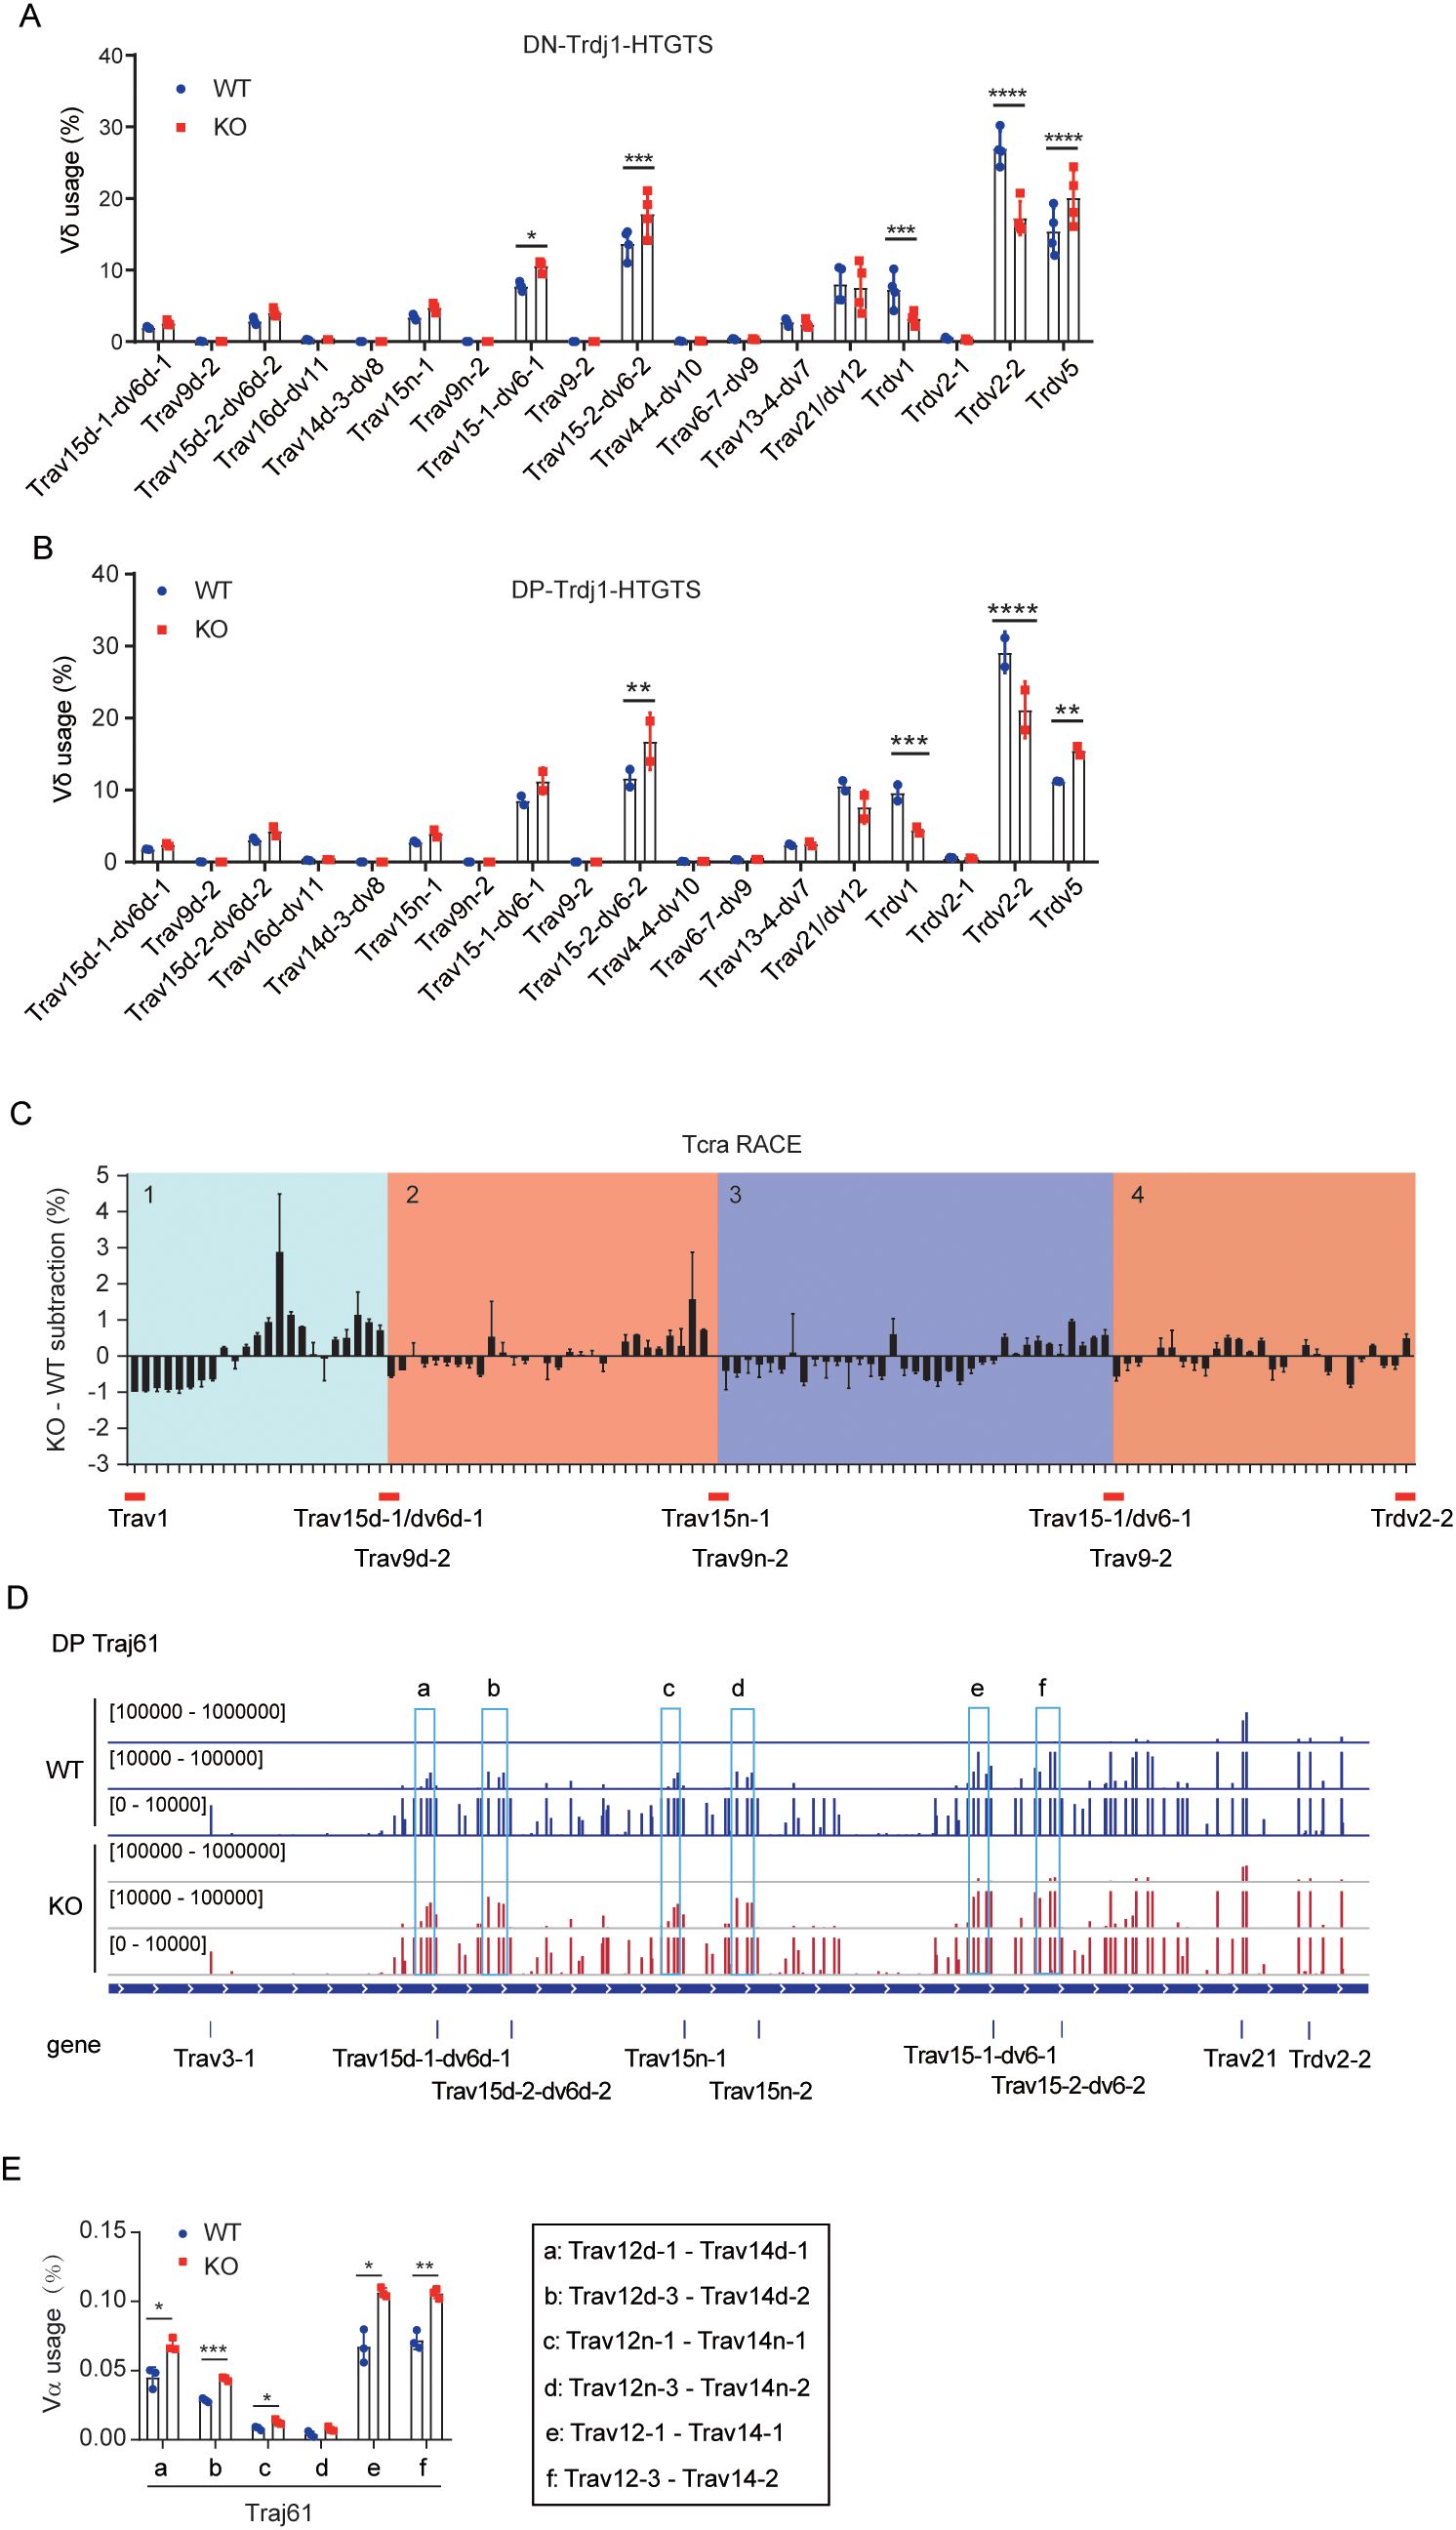
Figure 1. EACBE regulates Vα gene usage by modulating the rearrangement of distal Vδ segments. (A) The usage of Vδ segments was detected by LAM-HTGTS from the Trdj1 viewpoint in sorted DN thymocytes from WT (Blue circle) and EACBE-/- (Red quadrate) mice. Data represent the mean ± s.d. of four experiments. *P <0.05, ***P <0.001, ****P <0.0001 by two-side multiple Student’s T test. (B) The usage of Vδ segments was detected by LAM-HTGTS from the Trdj1 viewpoint in sorted DP thymocytes from WT (Blue circle) and EACBE-/- (Red quadrate) mice. Data represent the mean ± s.d. of two experiments. **P <0.01, ***P <0.001, ****P <0.0001 by two-side multiple Student’s T test. (C) EACBE-/- to WT subtraction of Vα usage, calculated from previous Tcra repertoire sequencing data (GEO: GSE145147). (D) Detection of Vα peaks by LAM-HTGTS with the Traj61 viewpoint in sorted DP thymocytes from WT (Blue) and EACBE-/- (Red) mice. Each experiment was repeated three times. The Y-axis represents the binding strength of the peaks that are rearranged with VP. (E) Histogram showing the usage of three Vα segments located behind the Trav15 family from panel (D). Data represent the mean ± s.d. of three experiments. *P <0.05, **P <0.01, ***P <0.001 by two side multiple Student’s T test.
To assess the functional consequences of altered Tcrd rearrangement, we assessed the γδ T cell populations in the thymus, spleen, and lymph nodes of WT and EACBE-/- mice. Although γδ T cell proportion were comparable in the thymus and spleen, a slight reduction was observed in the lymph nodes of EACBE-/- mice (Supplementary Figure S1B). These results suggest that EACBE deletion does not markedly impair γδ T cell development.
Previous studies have demonstrated that Tcrd rearrangement increases the usage of Vα segments in the repeat region and enhances the diversity of the Tcra repertoire (26, 34). Therefore, we examined the usage of Vδ genes in sorted DP thymocytes from WT and EACBE-/- mice using Trdj1-HTGTS-seq. We observed that the Vδ usage profile in WT DP cells mirrored that in WT DN cells. In contrast, EACBE-/- DP cells exhibited increased rearrangement of Trdv5 and distal Vδ genes and reduced rearrangements of proximal Vδ segments (Figure 1B). These findings indicate that EACBE may indirectly regulates Tcra rearrangement by modulating Tcrd rearrangement during the DN stage.
3.2 EACBE restricts Trav15 family rearrangements at the DN stage
Our recent study demonstrated that EACBE deletion changed Vα usages in Tcra primary rearrangement (28). To assess whether this change is attributable to alterations in Tcrd rearrangement in EACBE-deficient mice, we performed a comprehensive analysis of Vα usage in WT and EACBE-/- thymocytes, utilizing previous Tcra 5’ RACE data. The analysis revealed a distinctive, repetitive alteration in Vα usage, in which Vα segments could be grouped into four repetitive domains based on three frequently used Vδ segments from the Trav15 family: 1) Trav1 to Trav15d-1/dv6d-1, 2) Trav9d-2 to Trav15n-1, 3) Trav9n-2 to Trav15-1/dv6-1, and 4) Trav9–2 to Trdv2-2 (Figure 1C). Notably, the overall Vα usage within these four regions remained unchanged in EACBE-/- mouse thymocytes compared to WT (Supplementary Figure S1C). However, within region 4, the usage of certain proximal Vα genes increased. Furthermore, EACBE deletion resulted in increased usage of several Vα segments just upstream of the Trav15 family members in the other three regions, followed by a subsequent decrease in usage from 3’ to 5’ regions (Figure 1C, Supplementary Figure S1D). Consequently, we hypothesized that EACBE modulates Vα gene usage by regulating distal Vδ usage, especially the Trav15 family.
To confirm this, we detected Tcra primary rearrangements in sorted DP cells from WT and EACBE-/- mice using Traj61-HTGTS-seq. Although Traj61 is a pseudogene, it is the first Jα gene to undergo rearrangement, and its rearrangement serves as a marker for Tcra primary rearrangement. In WT DP cells, Traj61 predominantly rearranged with proximal Vα genes, particularly Trav21, consistent with previous findings (28, 34). Additionally, we observed frequent rearrangements of Traj61 with Vα segments just upstream of the Trav15 family (Figure 1D). In contrast, EACBE deletion in DP cells resulted in a reduction of Traj61 rearrangements with proximal Vα genes, like Trav21, while increasing rearrangements with the Trav12-Trav14 region upstream of the Trav15 family (Figures 1D, E). These findings suggest that EACBE not only facilitates proximal Vα-to-Jα rearrangements during the DP stage but also restricts Trav15 family rearrangements during the DN stage, thereby preserving the diversity of the Tcra repertoire at the DP stage. Recent work by Danielle J et al. (27) revealed that the usage of the Trav15-dv6 family in Tcrd recombination enhances Tcra repertoire diversity, further supporting our observations.
3.3 EACBE influences Trav14 family rearrangements during the DP stage by modulating Trav15 family rearrangements during the DN stage
Sleckman BP et al. reported that the usage of Vα segments in peripheral T cells of Eα-deficient mice were highly restricted, as the majority of these cells expressed Trav14(Vα2)-related TCRs, compared to 5%–10% of peripheral T cells in WT mice (30). To elucidate the effect of EACBE on Trav14 rearrangement, we analyzed Trav14 family rearrangements in sorted DP cells from WT and EACBE-deficient mice using Trav14-HTGTS sequencing. The results revealed a significant increase in rearrangement between the Trav14 family and 5’ Jα segments (from Traj61 to Traj38), and a significant decrease in rearrangement with 3’ Jα segments (Traj21 to Traj2) (Figures 2A, B), consistent with 5’ RACE results.
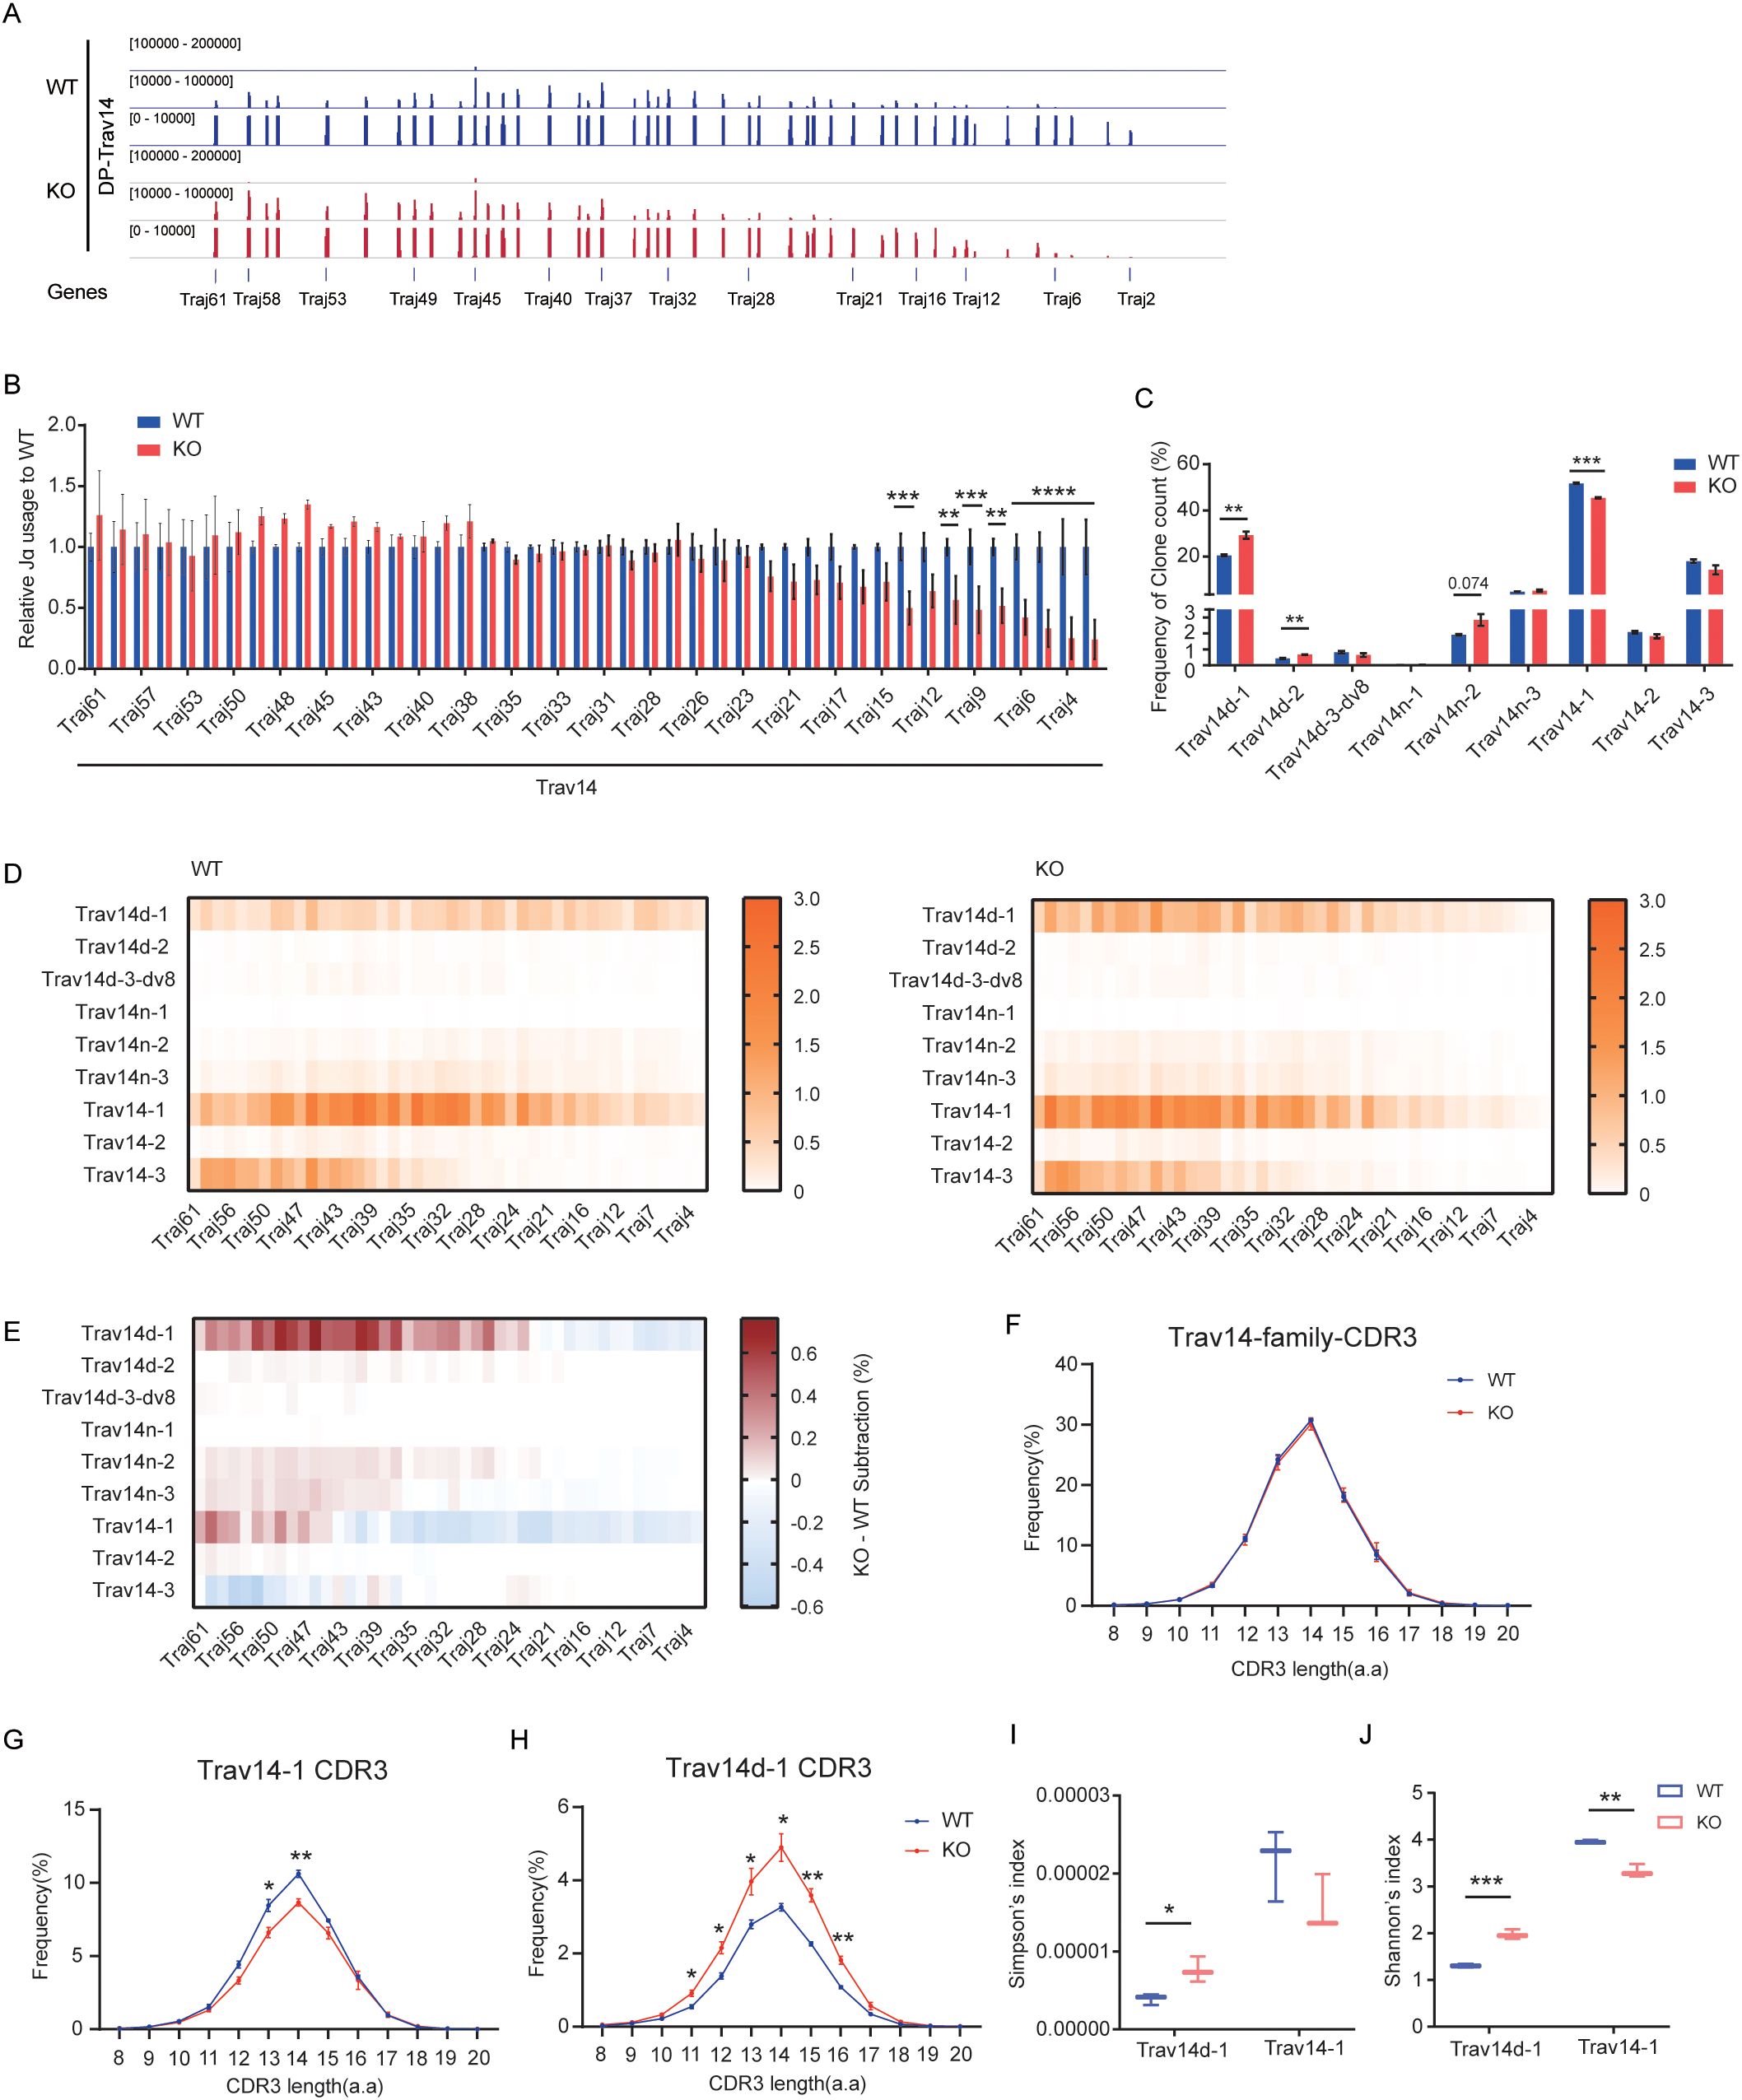
Figure 2. EACBE regulates the diversity of Trav14 family-related TCRs. (A) Detection of Jα peaks by LAM-HTGTS with the Trav14 viewpoint in sorted DP thymocytes from WT (Blue) and EACBE-/- (Red) mice. Each experiment was repeated three times. The Y-axis represents the binding strength of the peaks that are rearranged with VP. (B) Histogram showing relative Jα usage of from panel (A). Data represent the mean ± s.d. of three experiments. **P <0.01, ***P <0.001 by two side multiple Student’s T test. (C) Histogram showing the usage frequency of each member of the Trav14 family from panel (A). Data represent the mean ± s.d. of three experiments. **P <0.01, ***P <0.001, ****P <0.0001 by two side multiple Student’s T test. (D) Heatmap showing the Trav14-Jα combination of each Trav14 member in sorted DP thymocytes from WT and EACBE-/- mice. Each experiment was repeated three times. (E) Heatmap of EACBE-/- – WT subtraction represents the Trav14-Jα combination of the differences from panel (D). Data represent the mean of three experiments. (F) CDR3 lengths of Trav14 family repertoires in WT and EACBE-/- mice. Data represent the mean ± s.d. of three experiments. (G, H) CDR3 length of Trαv14-1 (G) and Trαv14d-1 (H) repertoires in WT and EACBE-/- mice. Data represent the mean ± s.d. of three experiments. *P <0.05, **P <0.01 by two side multiple Student’s T test. (I, J) Simpson’s index (I) and Shannon’s index (J) of Trαv14–1 and Trαv14d-1 repertoires in WT and EACBE-/- mice. Data represent the mean ± s.d. of three experiments.
The Trav14-HTGTS sequencing panel contains nine Vα members of the Trav14 family, located at varying distances from the Tcra gene recombination center, namely Trav14d-1, Trav14d-2, Trav14d-3-dv8, Trav14n-1, Trav14n-2, Trav14n-3, Trav14-1, Trav14-2, and Trav14-3 (2). In WT mice, Trav14d-1, Trav14-1, and Trav14–3 are the most frequently used segments, with Trav14–1 being the most prevalent (Figure 2C, Supplementary Figure S2A). The frequencies of segments within the Trav14 family do not align consistently with those observed in the Trav15 family. For instance, Trav14–2 is located upstream of Trav15-2-dv2, which demonstrates the highest rearrangement frequency among Trav15 family members. The rearrangement of the Trav15 family with DJδ in DN cells reduces the spatial distance between Trav14 family members and the Tcra recombination center in DP cells. Despite Trav14–2 exhibiting the highest primary rearrangement frequency within the Trav14 family, its overall usage frequency remains relatively low compared to other Trav14 family members (Figures 1A, E, 2C). EACBE deletion significantly enhances the rearrangement of Trav14d-1 and Trav14d-2, while significantly reduces the rearrangement of Trav14-1 (Figure 2C, Supplementary Figure S2A). Furthermore, we observed a significant increase in the rearrangement of each Trav14 member with 5’ Jα, except for Trav14-3 (Figures 2D, E). These results suggest that EACBE plays a role in modulating the diversity of Trav14-related TCRα chain.
The CDR3 region of the antigen receptor is crucial for antigen recognition, with its amino acid composition playing a central role in determining specificity (35). To assess the impact of EACBE on CDR3 diversity, we conducted an analysis of the amino acid sequence characteristics of CDR3 in Trav14-related T-cell receptor α (TCRα). The result revealed that EACBE deletion did not alter the amino acid length or composition of CDR3 within the Trav14 family (Figure 2F, Supplementary Figure S2B). However, it did influence the frequency distribution of CDR3 lengths and types among various members of the Trav14 family (Figures 2G, H, Supplementary Figures S2C, 2D). Additionally, we observed a slight, albeit statistically insignificant, reduction in the overall CDR3 diversity of the Trav14 family following EACBE deletion (Supplementary Figures S2E, 2F). Interestingly, the CDR3 diversity of individual Trav14 family members either increased or decreased, consistent with the rearrangement outcomes (Figures 2I, J). These results indicate that EACBE plays a regulatory role in the rearrangement processes and diversity of TCRs associated with the Trav14 family.
3.4 EACBE deletion reduces chromatin activity at the Trdv2–2 site
The accessibility and germline transcription of antigen receptor genes are crucial for regulating V(D)J recombination (36). To investigate whether EACBE modulates Tcrd rearrangement by influencing the chromatin activity of the Tcrd locus, we assessed accessibility, active histone modifications, and germline transcription at the Tcra-Tcrd locus in DN cells. ATAC-seq analysis revealed a marked decrease in the accessibility of Trdv5, Trdd2, Trdv2-2, and upstream region of Trav17 (Figure 3A). Chromatin markers indicative of active regions, such as H3K27 acetylation (H3K27ac) (37) and H3K4 trimethylation (H3K4me3) (38–40), are integral to V(D)J recombination. ChIP-qPCR assays showed no statistically significant alterations in these active chromatin marks across most regions of the Tcra-Tcrd locus following EACBE deletion, including Trav21, Trdd1, Trdj1, Trdj2, Trdv5, TEAp, and Eα. Specifically, at the Trdv2–2 promoter, we noted slight reductions in H3K4me3 and H3K27ac levels (Figures 3B, C). These results suggest a potential impact on the transcriptional activity of Trdv2-2.
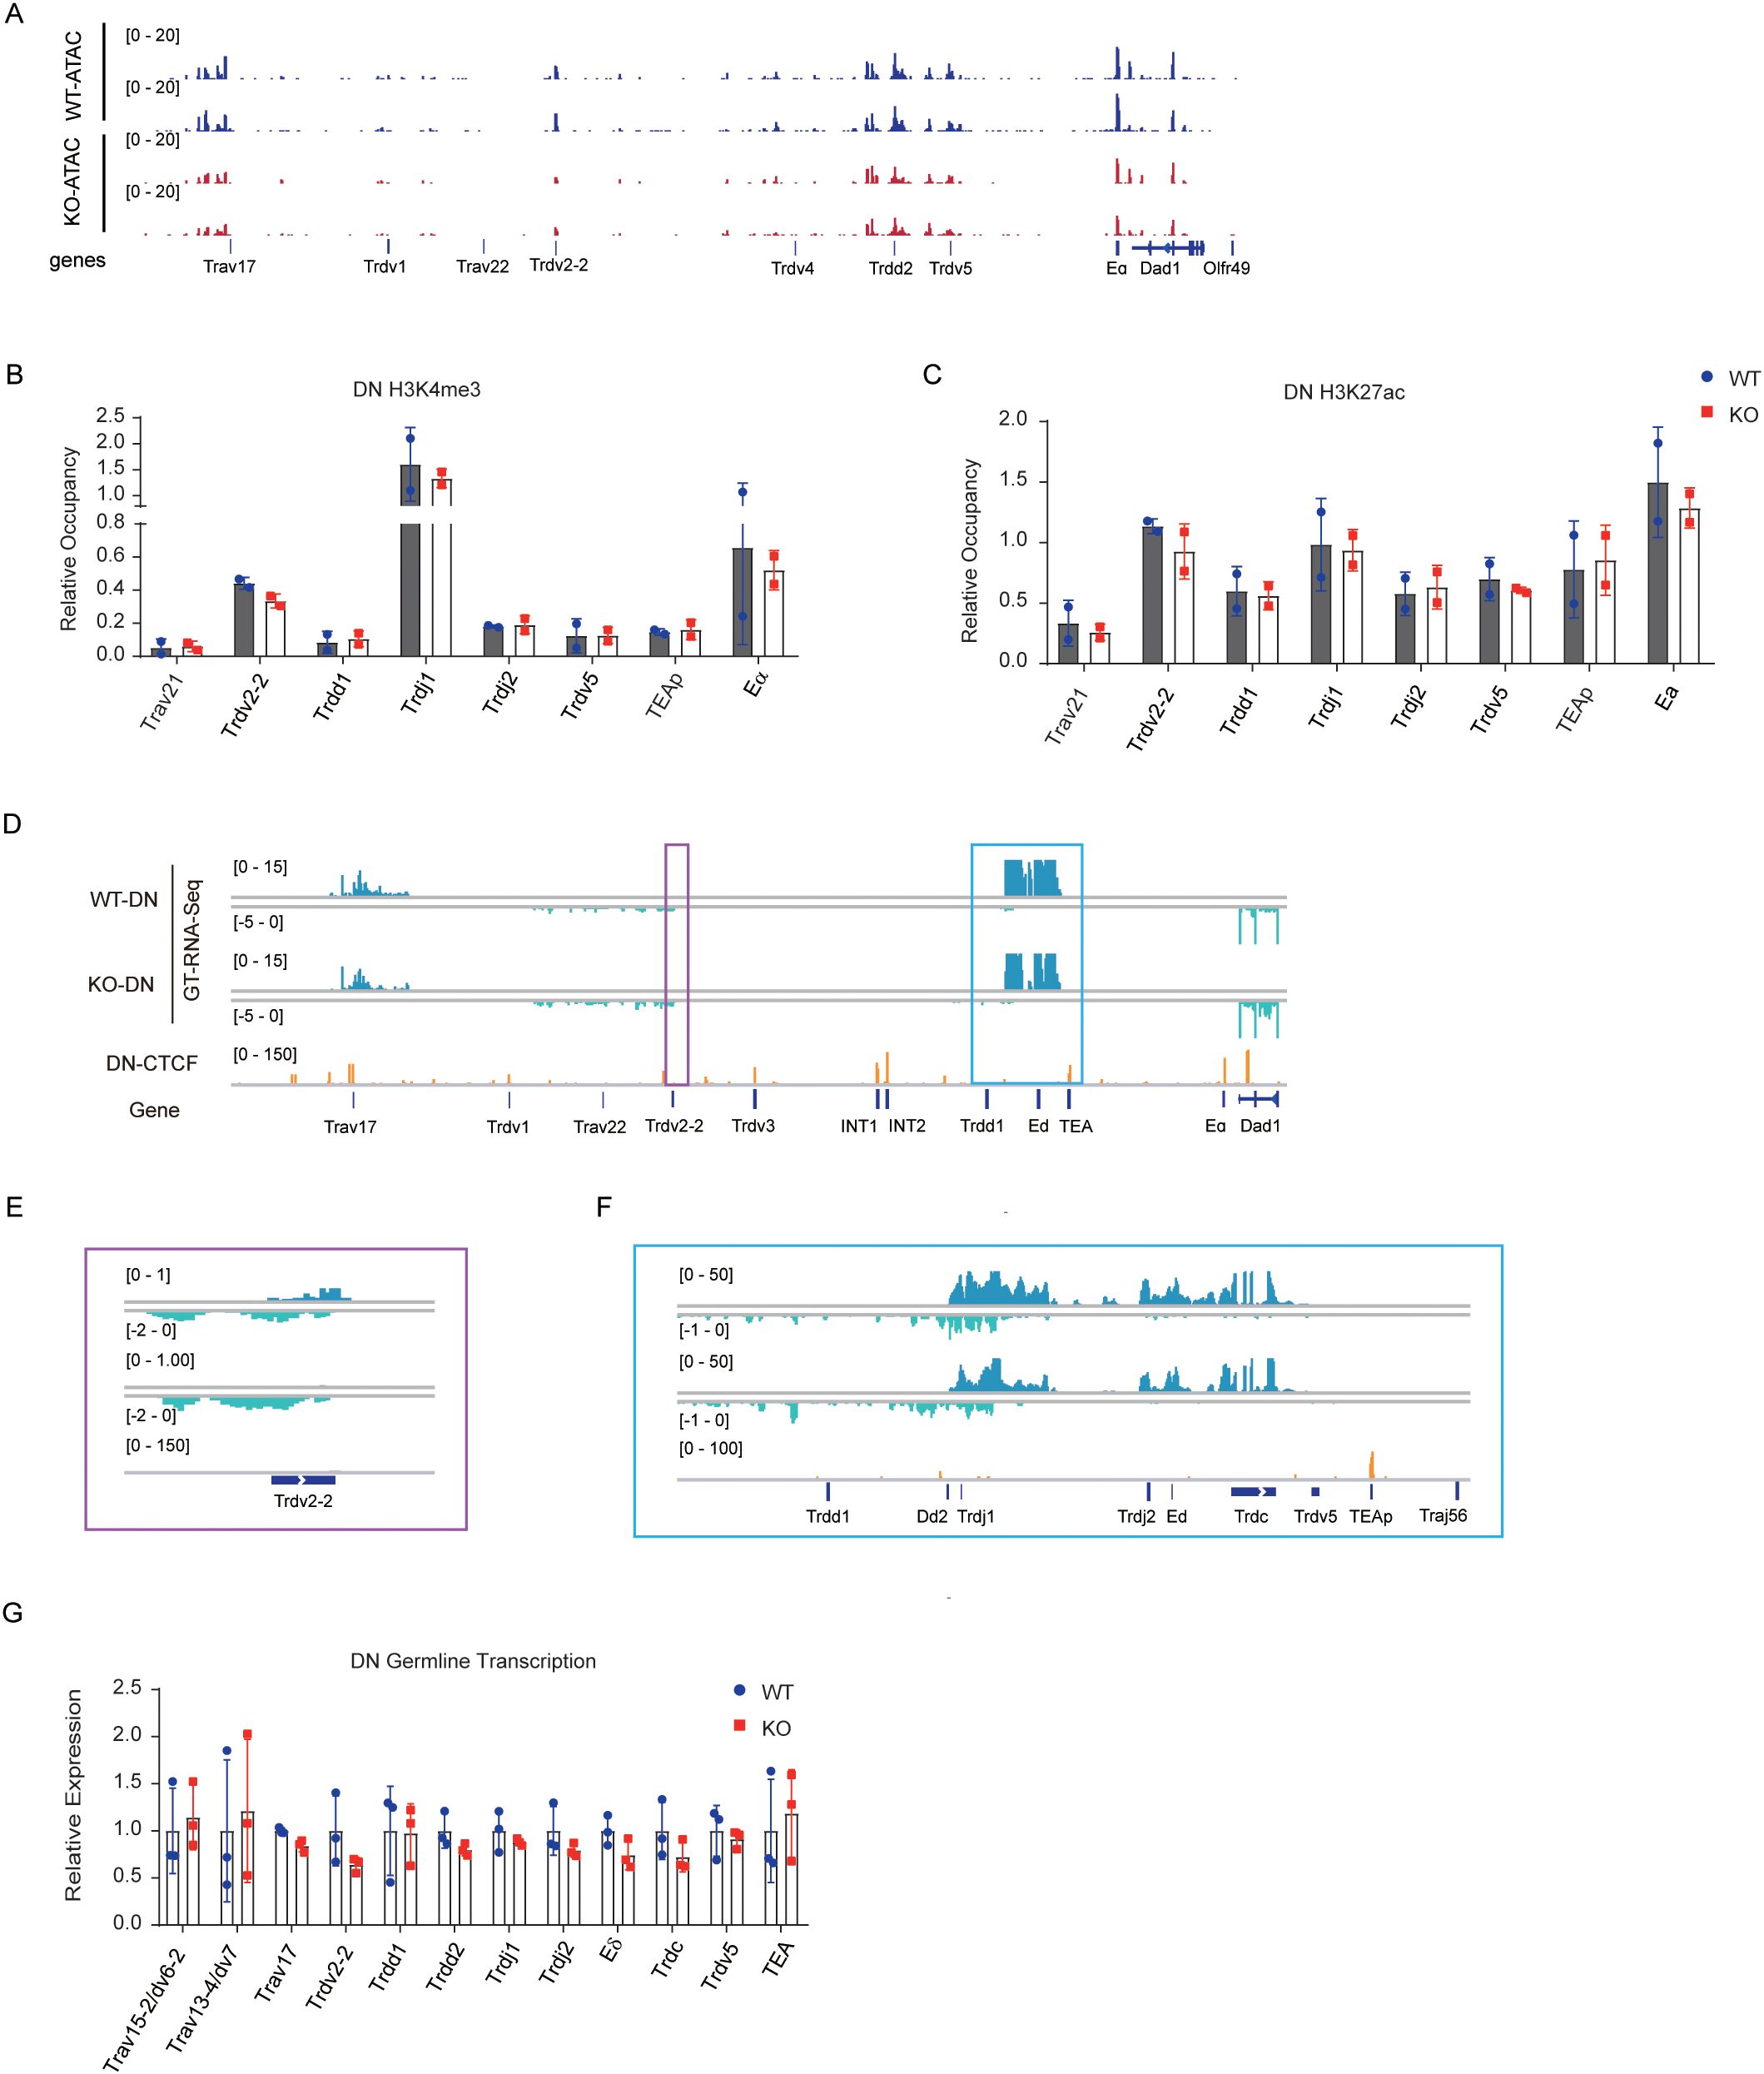
Figure 3. EACBE regulates chromatin activity of Tcrd gene in DN cells. (A) ATAC-seq signals on the Tcra-Tcrd locus in DN thymocytes from Rag1−/− and EACBE−/− Rag1−/− mice. Data were representative of two independent experiments. (B, C) Histone H3K4me3 (B) and H3K27ac (C) modification analyzed by ChIP-qPCR on the Tcra-Tcrd locus in DN thymocytes from Rag2−/− and EACBE−/− Rag2−/− mice. Each experiment was repeated twice. (D-F) Genome browser views depicting GT-RNA-seq data of the Tcra-Tcrd locus in DN thymocytes from Rag1−/− and EACBE−/− Rag1−/− mice. Positive strand transcription is shown in Ocean Blue, and negative strand transcription is shown in pale green. Coordinates (mm10): chr14: 53747480-54261865. Rectangles of the same color correspond to the same enlarged area. Data represent the one experiment. (G) Relative germline transcription in the Tcra-Tcrd locus in DN thymocytes from Rag1−/− and EACBE−/− Rag1−/− mice detected using reverse-transcription qPCR. Expressions were normalized to the Actb gene. Data represent the mean ± s.d. of three experiments.
To further explore the effects of EACBE deletion on Tcrd transcriptional activity, we conducted GT-RNA-Seq using DN thymocytes derived from EACBE+/+ × Rag1−/− and EACBE−/− × Rag1−/− mice. In WT DN cells, the highest transcriptional activity was observed at the Tcrd recombination center, followed by a region proximal to Trav17. Weak transcriptional activity was also detected in the region between Trdv1 and Trdv2-2 (Figure 3D). These transcriptional patterns align with the rearrangement activity of Tcrd in DN cells. EACBE deletion resulted in a reduction of forward transcription at Trdv2-2, while reverse transcription experienced a slight increase (Figure 3E). Furthermore, transcription at Dδ-Jδ segments were modestly decreased in EACBE-deficient mice (Figure 3F).
To corroborate these findings, RT-qPCR experiments were conducted to assess germline transcription of Tcrd gene. Although the results did not reach statistical significance, EACBE deletion was associated with a reduction in the germline transcription of these segments, including Trav17, Trdv2-2, Trdd2, Eδ, and Trdc, with Trdv2–2 exhibiting the most pronounced decrease (Figure 3G). These findings suggest that EACBE deletion attenuated chromatin activity at the Trdv2–2 promoter, leading to a subsequent decrease in its rearrangement.
3.5 EACBE regulates the spatial organization of the Tcrα-Tcrd locus at the DN stage
We previously reported that EACBE deletion reduced interactions between the proximal Vα and proximal Jα regions in DP thymocytes (28). To further explore the effect of EACBE deletion on interactions involving Trdv2-2, Trdv5, and Trdd2, we conducted a 3C-HTGTS assay using these segments as viewpoints. In DN cells from Rag1-deficient mice, Trdv2–2 exhibited substantial interactions with sequences extending from upstream Trav21 to downstream INTs (Figures 4A, B). Notably, EACBE deletion resulted in a significant reduction in interactions between Trdv2–2 and sequences from INTs to Eα, including the Dδ-Jδ-Cδ region (Figure 4B). Additionally, we observed a significant increase in interactions between Trdv2–2 and the downstream region of EACBE, which may be attributed to the EACBE deletion weakening the insulation at the TAD boundary in which it is situated (Supplementary Figures S3A, S3B).
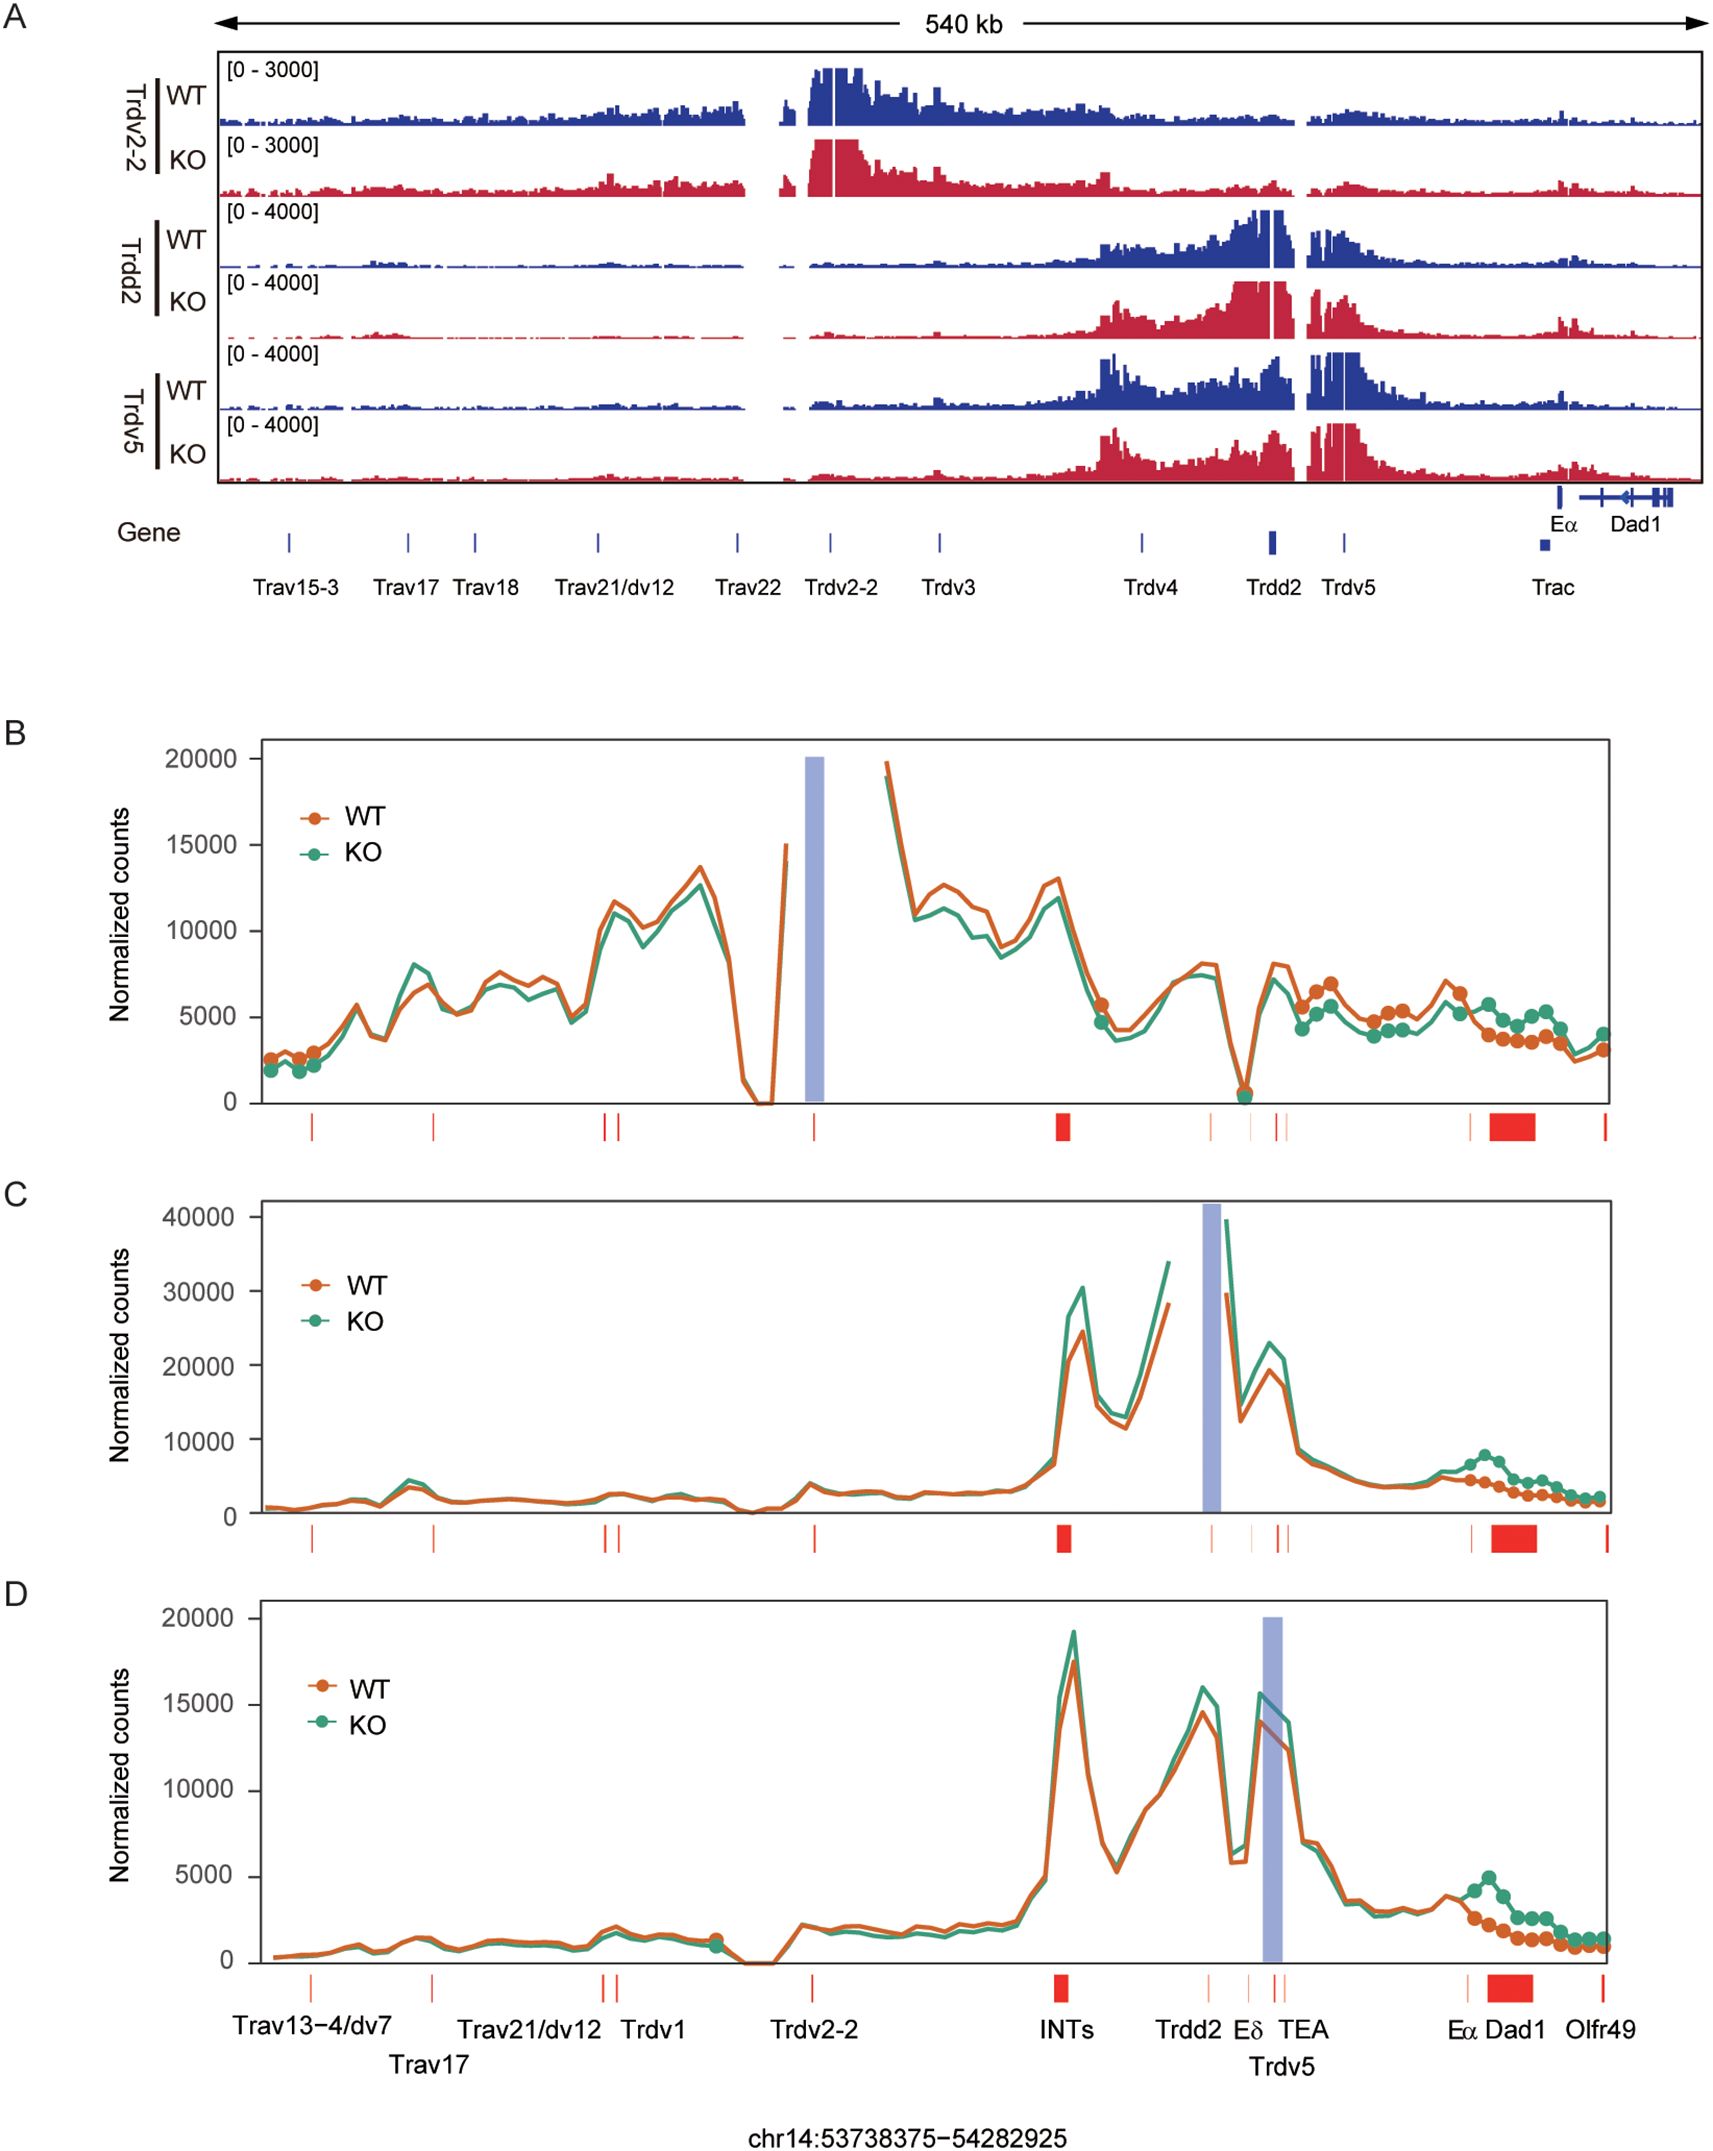
Figure 4. EACBE regulates the spatial organization of the Tcrα-Tcrd locus at the DN stage. (A) Genome browser views depicting 3C-HTGTS pairwise chromatin interactions from Trdv2-2, Trdd2, and Trdv5 viewpoints in the 3’ portion of the Tcra-Tcrd locus in DN thymocytes from Rag1−/− (WT, blue) and EACBE−/− Rag1−/− (KO, red) mice. 3C-HTGTS is representative of three replicates for each viewpoint. Gene annotations are shown below. Coordinates (mm10): chr14: 53738375-54282925. (B-D) Line plots displaying the difference of pairwise interactions between Rag1−/− (WT, orange) and EACBE−/− Rag1−/−(KO, green) mice at the Trdv2-2 (B), Trdd2 (C) and Trdv5 (D) viewpoints using the 4C-ker program. Analysis is based on three independent experimental replicates. Filled circles highlight significant differential interactions (P < 0.05; statistics derived using DESeq2). Gene positions are annotated by red-filled rectangles and the blue-filled bar highlights the viewpoint position.
Interactions involving Trdd2 were confined to the region between INTs and TEAp (Figures 4A, C), consistent with previous observation (26). As anticipated, the deletion of EACBE resulted in increased interactions of Trdd2 with sequences located downstream of EACBE (Supplementary Figures S3A, S3C). The deletion also increased interactions between Trdd2 and sequences between INTs and TEAp, including Trdv5, while leaving interactions with sequences upstream of INTs unaffected (Figure 4C). Furthermore, Trdv5 exhibited slightly increased interactions with sequences between INTs and TEA (Figures 4A, D), consistent with Trdd2 3C-HTGTS data. Trdv5 also demonstrated increased interactions with sequences downstream of EACBE (Supplementary Figures S3A, S3D). Our previous research demonstrated that the EACBE deletion would affect the expression of its downstream genes in the thymocyte cells (28). However, the EACBE deletion did not exhibit a similar impact on downstream gene expression in DN cells (Supplementary Figure S3E).
In summary, these results indicate that EACBE establishes a TAD boundary at the DN stage to restrict the interaction between the Tcra-Tcrd locus and its downstream regions. We also observed that EACBE deletion not only enhanced interactions within the region from INTs to TEAp, but also weakened interactions between Trdv2–2 and the region from INTs to Eα. This suggests that EACBE deletion enhance the insulation of INTs. In brief, EACBE is involved in regulating the spatial organization of the Tcrα-Tcrd locus at the DN stage, facilitating the normal rearrangement of the Tcrα-Tcrd locus.
3.6 EACBE reduces the insulation of INTs in DN cells
To investigate the impact of EACBE on the higher-order chromatin structure of Tcra-Tcrd at the DN stage, we did a three-way interaction analysis recently developed in our laboratory. This method has previously been used to examine the higher-order chromatin architecture of the Tcra-Tcrd locus in DP thymocytes, as well as the cooperative interactions among Vα, Jα, and Eα (31). In this study, we applied this method to analyze the higher-order chromatin structure of the locus in DN cells. The Trdd2 three-way contact heatmap showed that the deletion of EACBE resulted in a marked increase in interactions between INTs and TEAp with Trdd2 in DN cells (Figure 5A). Furthermore, the KO – WT subtraction heatmap demonstrates a significant enhancement in three-way interactions between INTs and Dad1 (Figure 5B), a pattern also observed in the Eα three-way contact heatmap (Supplementary Figures S4A, S4B). Examining the Trdv2–2 three-way contact heatmap, we observed that co-occurring interaction pairs are confined in a small region surrounding Trdv2–2 in WT DN cells and the EACBE deletion does not influence the three-way interaction from the viewpoint of Trdv2-2 (Supplementary Figure S4D). However, the sequences interacting with the Eα-INT2 combination were significantly reduced, including the three-way contact involving Eα-INT2-Trdv2-2 (Supplementary Figures S4A, S4B). These results indicate that EACBE deletion increases the insulation of INTs.
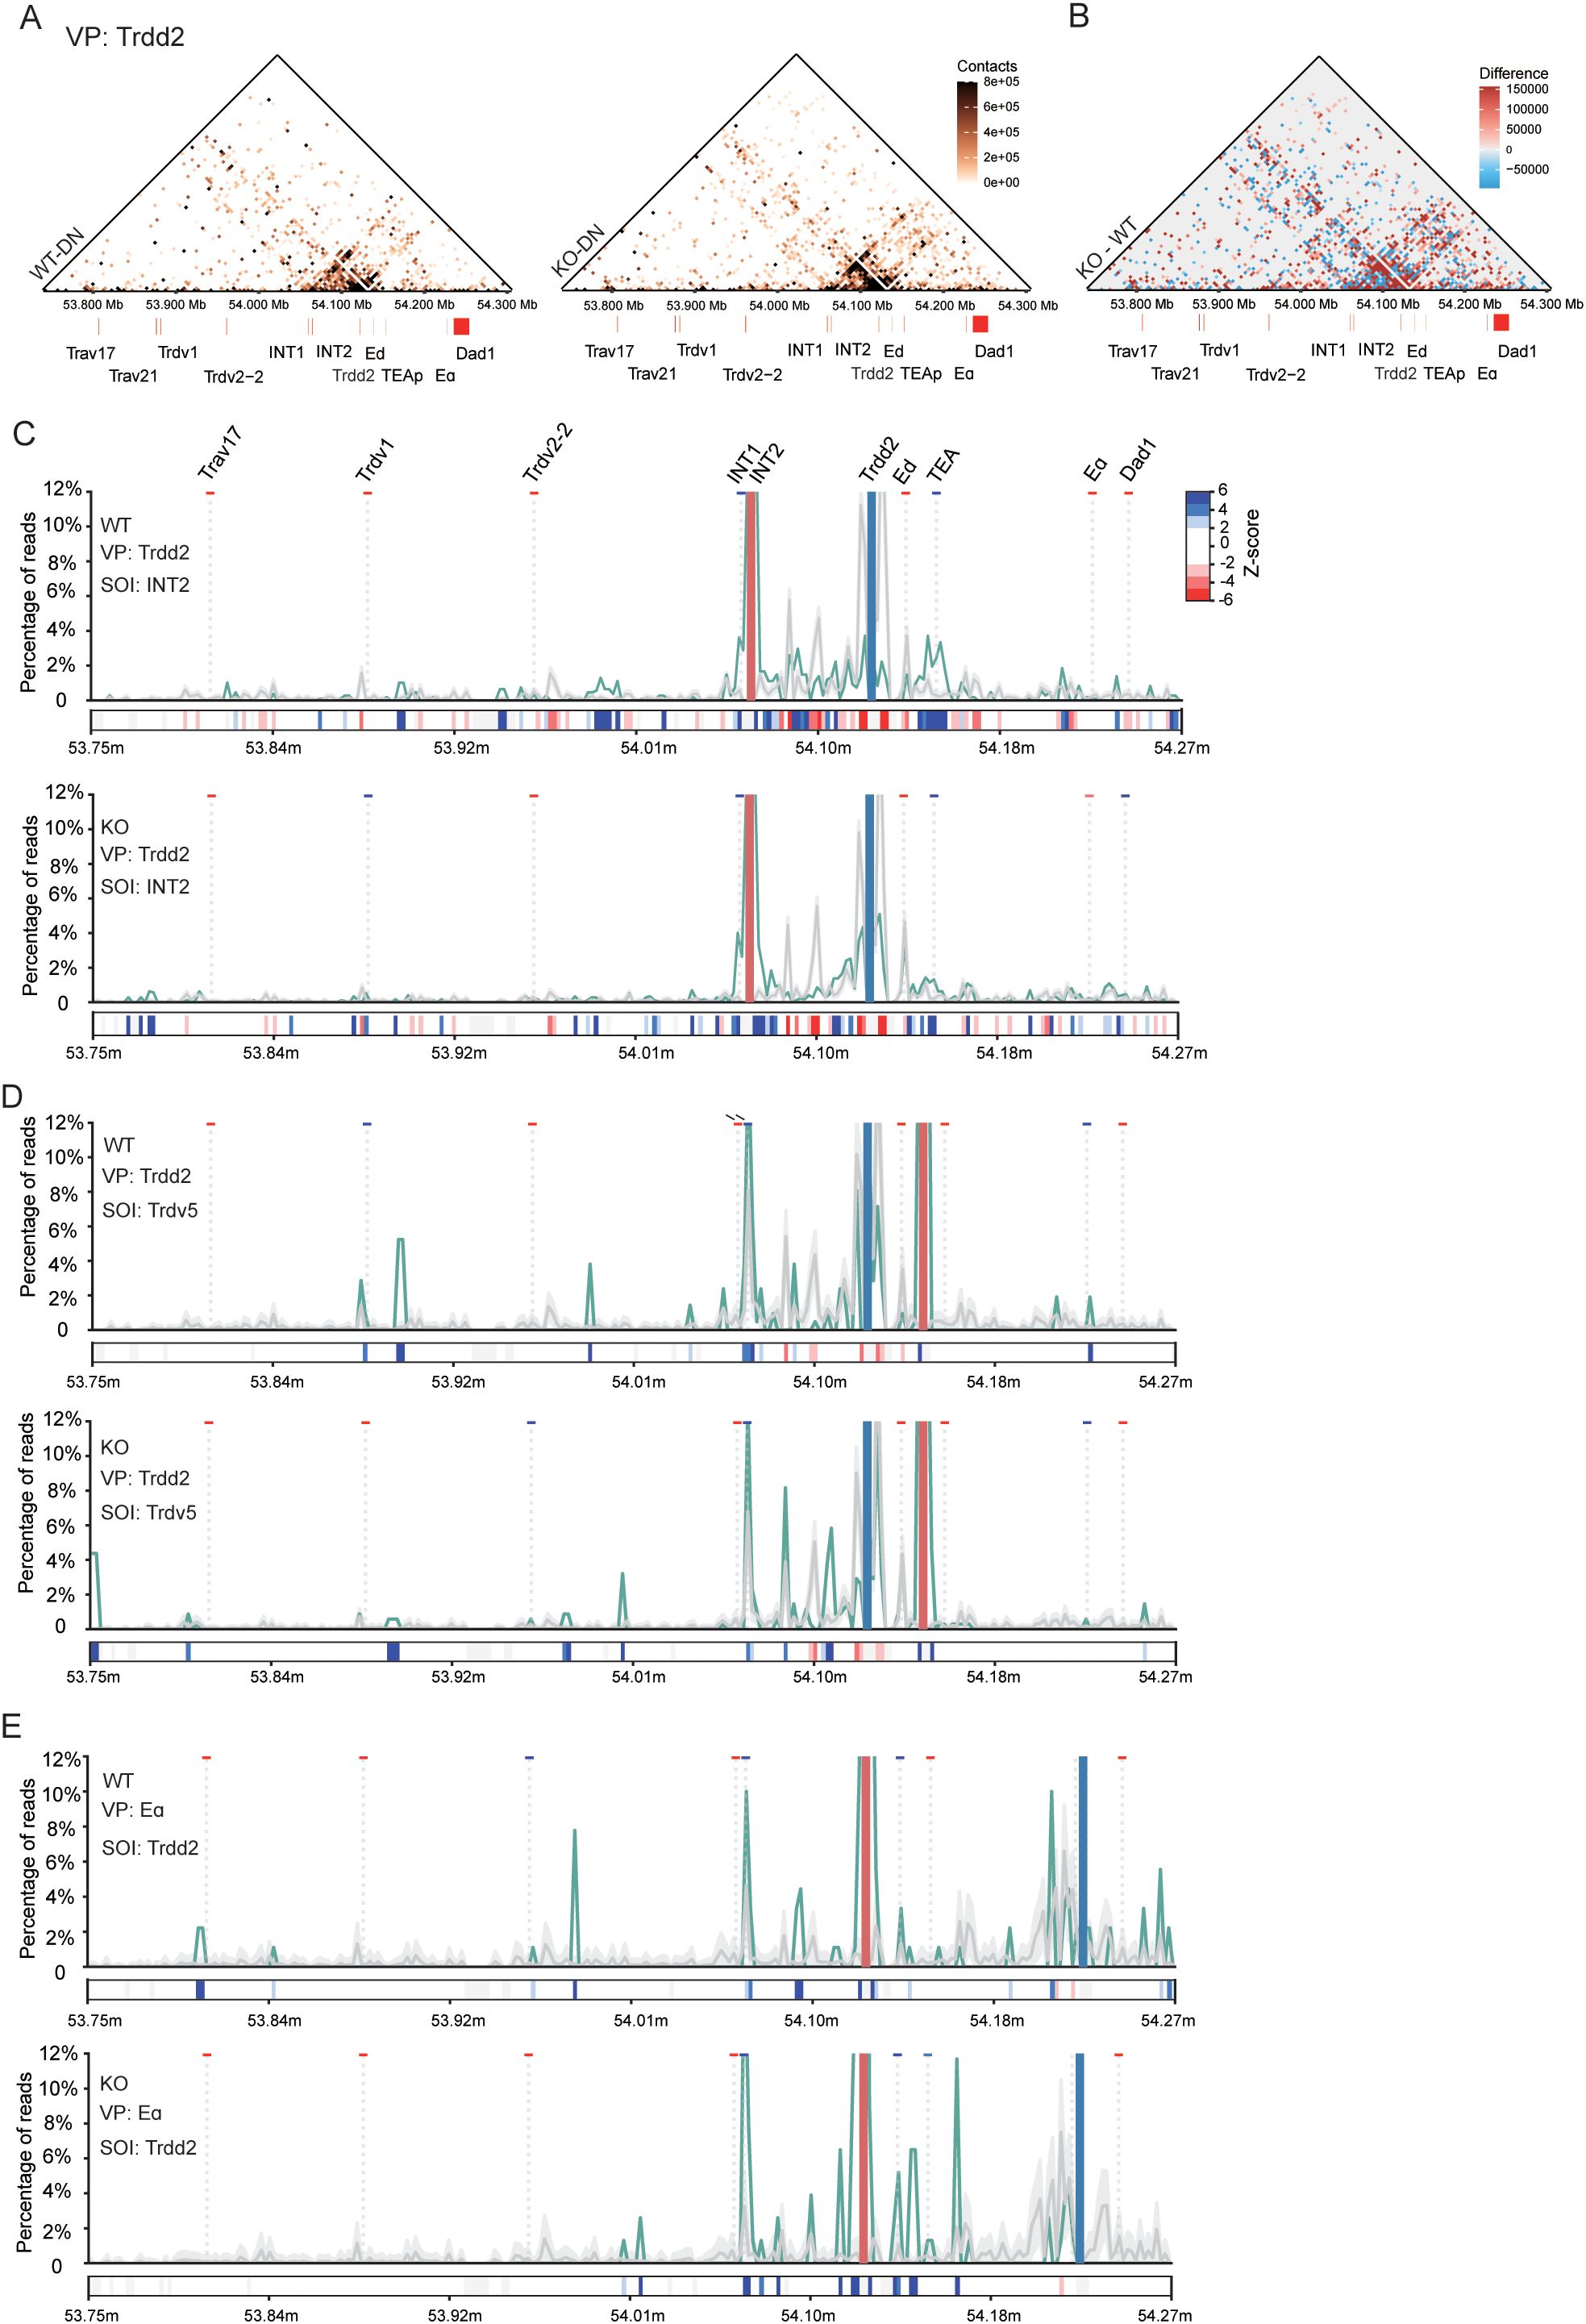
Figure 5. Effect of EACBE on higher-order chromatin structure of Tcrα-Tcrd locus in DN cells. (A) Heatmap showing three-way chromatin interactions in the 3’ portion of the Tcrα-Tcrd locus from the Trdd2 viewpoint in DN thymocytes from Rag1−/− (WT, up) and EACBE−/− Rag1−/−(KO, down) mice. The heatmap represents mean of three experimental replicates. Gene annotations are shown middle. Resolution: 5kb; Coordinates (mm10): chr14: 53738375-54282925. (B) EACBE-/- – WT subtraction heatmap (resolution: 5kb) showing the three-way contact differences from panel (A). (C) VP-SOI plots displaying co-occurrence contacts of sequences in the 3’ portion of the Tcra-Tcrd locus in the combination of the Trdd2 viewpoint (pale blue rectangle) and the SOI containing INT2 (pale red rectangle) in DN thymocytes from Rag1−/− and EACBE−/− Rag1−/− mice. The green line represents the observed co-occurrence frequency, and the gray line represents the expected frequency (mean ± s.d.) of sequences across the locus. z-scores (dark blue indicating significant enrichment, dark red indicating significant lack of a given site) are shown for SOIs in rectangles below each graph. Gene annotations are at the top. (D) VP-SOI plots displaying co-occurrence contacts of sequences in the 3’ portion of the Tcra-Tcrd locus in the combination of the Trdd2 viewpoint (pale blue rectangle) and the SOI containing Trdv5 (pale red rectangle) in DN thymocytes from Rag1−/− and EACBE−/− Rag1−/− mice. (E) VP-SOI plots displaying co-occurrence contacts of sequences in the 3’ portion of the Tcra-Tcrd locus in the combination of the Eα viewpoint (pale blue rectangle) and the SOI containing Trdd2 (pale red rectangle) in DN thymocytes from Rag1−/− and EACBE−/− Rag1−/− mice.
To elucidate the relationship between EACBE and INTs in DN cells, we performed a method developed by Allahyar et al. to analyze specific three-way contacts. This method employs a second Site of Interest (SOI) to distinguish between preferred and random or disfavored three-way contacts (31, 33). First, we examined the co-occurrence frequency of third sequences across the Tcra-Tcrd locus when Trdd2 interacts with INT2 as an SOI. Most sequences located between INTs and TEAp, such as Eδ, are disfavored in three-way contacts with the Trdd2-INT2 combination (Figure 5C). However, some sequences upstream of INTs and surrounding TEAp are favored in three-way contacts with the Trdd2-INT2 combination (Figure 5C). Notably, EACBE deletion leads to a reduction in synergistic interactions of upstream sequences of INTs with the Trdd2-INT2 combination (Figure 5C). When Trdd2 and Trdv5 are used as the viewpoint-SOI combination, the coordinated behavior of sequences upstream of INTs diminishes, accompanied by a shift in sequences between INTs and TEAp (Figure 5D). Furthermore, the viewpoint-SOI analysis reveals that EACBE deletion also facilitates the synergistic interaction of the sequences from INTs to TEAp with the Eα-Trdd2 or Eα-INT2 combinations (Figure 5E, Supplementary Figure S4C). These findings suggest that EACBE reduces the insulation of INTs, thereby facilitating the rearrangement of proximal Vδ segments.
4 Discussion
In this study, we investigated the role of the CTCF binding site EACBE in regulating Tcrd rearrangement and its subsequent effect on Tcra rearrangement. Our previous work demonstrated that EACBE, situated downstream of the Tcra-Tcrd locus, functions as a chromatin boundary that insulates the locus from the downstream region at the DP stage (28). We found that EACBE directly regulates Tcrd rearrangement during the DN stage. Specifically, EACBE facilitates the usage of proximal Vδ genes, such as Trdv2–2 and Trdv1, while reducing the usage of Trdv5 and distal Vδ genes. Additionally, the deletion of EACBE leads to increased rearrangement of Trav15 family members, which in turn enhances usage of central Vα genes during Tcra rearrangement (Supplementary Figure S5). These findings are consistent with a recent report by Danielle J et al., which found that the Trav15 family is a crucial contributor to Tcra repertoire diversity (27).
Notably, EACBE plays a crucial role in the diversity of Trav14-related TCRs. The Trav14 gene segments are located just upstream of the Trav15 family. Sleckman et al. reported that the Vα repertoires in peripheral T cells in Eα-deficient mice were markedly restricted, characterized by a predominance of Trav14-related TCRs, in contrast to the 5%–10% of Trav14 usage observed in WT mice that express Trav14 family members (30). Based on our findings, this skewed usage can be attributed to the unchanged Tcrd rearrangement in Eα-deficient DN cells. These cells frequently rearrange Trav15 segments but fail to differentiate into γδ T cells, instead progressing to DP cells. At the DP stage, rearranged Trav15 segments facilitate the spatial juxtaposition of Trav14 to Jα, thereby promoting Trav14 usage in Eα-deficient cells.
The effect of EACBE on Tcra rearrangement is complex. We previously reported that EACBE deletion affects the usage of Jα, which is mainly caused by affecting the initiation of primary rearrangement (28). However, the effect of EACBE on Vα usage is more complex and can be affected directly and indirectly. The indirect effect comes from Tcrd rearrangement. EACBE deletion increases the usage of Trav15, so that the primary rearrangement of Tcra has more chances to start from the upstream of Trav15. In addition, the effect of EACBE deletion on Tcra primary rearrangement may also affect Vα usage, increase the usage of Vα genes proximal upstream of Trav15, and reduce the usage of Vα segments distal upstream of Trav15. Since Tcra can undergo multiple rounds of rearrangement, secondary rearrangement also plays an important role in shaping Tcra repertoire. It is generally believed that in secondary rearrangement, the linear distance between Vα and Jα segments are close, and their rearrangement is less affected by chromatin conformation. However, we cannot answer whether EACBE affects secondary rearrangement here. It needs to construct rearranged Vα-Jα knockin on the EACBE deleted allele to answer this question.
EACBE also facilitates the rearrangement of proximal Vα by modulating interactions between Eα and proximal Vα segments in DP cells. In parallel, it can indirectly influence the rearrangement of central Vα segments by regulating Tcrd rearrangement at the DN stage. Nonetheless, it remains plausible that EACBE directly regulates the rearrangement of central Vα segments in alleles where the Tcrd gene is intact. Chen et al. previously showed that INTs function as insulators that segregate Trdv2-2, the most frequently used Vδ gene, from the Dδ-Jδ-Cδ region (26). This insulation promotes the usage of alternative Vδ segments, thereby contributing to the diversification of the Tcrd repertoire (34). These findings suggest that EACBE and INTs exert opposing influences on Tcrd rearrangement and indirectly shape the Tcra repertoire, thereby balancing the diversity of the Tcra and Tcrd repertoires.
Chromatin-organizing proteins such as cohesin and CTCF, along with their binding sites, are integral to the coordination of antigen receptor gene rearrangement. These proteins facilitate the generation of diverse antigen receptor repertoires by modulating the spatial conformation of chromatin (28, 41–43). Notably, no direct chromatin loop has been observed between Trdv2–2 and Trdd2. However, our analysis of higher-order chromatin structures revealed that EACBE can attenuate the insulation ability of INTs, thereby enhancing interactions between the Tcrd recombination center and the upstream region, ultimately facilitating the rearrangement of proximal Vδ segments. This effect may be attributed to cohesin extrusion from EACBE towards the upstream region, promoting interactions across the INTs boundary and reducing its insulation.
In this study, we showed that EACBE deletion results in a modest reduction in chromatin activity at Trdv2–2 and the Tcrd recombination center. Although Eα is not transcriptionally active during the DN stage, it is primed through the recruitment of constitutive transcription factors and the presence of the poised enhancer marker H3K4 mono-methylation (44–48). EACBE-mediated chromatin extrusion may facilitate the special proximity of Eα and its associated transcription factors to Trdv2-2, thereby enabling their engagement in the transcriptional regulation of Trdv2–2 and promoting its rearrangement.
In conclusion, this study examined the role of EACBE on the Tcrd rearrangement and chromatin conformation of the Tcra-Tcrd locus at the DN stage. Our results indicate that EACBE diminishes the insulating ability of INTs, thereby promoting the rearrangement of proximal Vδ segments. Given the observation that INTs facilitate the rearrangement of distal Vδ segments, we conclude that EACBE and INTs collaboratively regulate the diversity of the Tcrd repertoire and subsequently indirectly influence the diversity of the Tcra repertoire. This research offers novel insights into the role of two distinct CTCF binding sites in the regulation of V(D)J recombination of the antigen receptor locus.
Data availability statement
The datasets presented in this study can be found in online repositories. The names of the repository/repositories and accession number(s) can be found in the article/Supplementary Material.
Ethics statement
The animal study was approved by The Animal Care and Use Committee of Southern Medical University. The study was conducted in accordance with the local legislation and institutional requirements.
Author contributions
YZ: Conceptualization, Data curation, Formal Analysis, Investigation, Methodology, Writing – original draft, Writing – review & editing. RD: Data curation, Formal Analysis, Writing – review & editing, Visualization. HZ: Data curation, Writing – review & editing. JL: Data curation, Writing – review & editing. KL: Data curation, Writing – review & editing. WX: Data curation, Writing – review & editing. LQ: Data curation, Writing – review & editing. HP: Data curation, Writing – review & editing. SL: Funding acquisition, Supervision, Writing – review & editing. BH: Funding acquisition, Project administration, Supervision, Writing – original draft, Writing – review & editing.
Funding
The author(s) declare that financial support was received for the research and/or publication of this article. This work was supported by the National Natural Science Foundation of China (32170885 and 32370939 to B. Hao, 82371864 to S. Liao), Major Projects Jointly Constructed by Henan Province and Ministry of Science and Technology (SBGJ202101003 to S. Liao).
Acknowledgments
We thank Zhongxi Huang and Jiahong Wang in Cancer Research Institute, School of Basic Medical Sciences, Southern Medical University for research computing.
Conflict of interest
The authors declare that the research was conducted in the absence of any commercial or financial relationships that could be construed as a potential conflict of interest.
Generative AI statement
The author(s) declare that no Generative AI was used in the creation of this manuscript.
Publisher’s note
All claims expressed in this article are solely those of the authors and do not necessarily represent those of their affiliated organizations, or those of the publisher, the editors and the reviewers. Any product that may be evaluated in this article, or claim that may be made by its manufacturer, is not guaranteed or endorsed by the publisher.
Supplementary material
The Supplementary Material for this article can be found online at: https://www.frontiersin.org/articles/10.3389/fimmu.2025.1613621/full#supplementary-material
References
1. Rogers J, Bajur AT, Salaita K, and Spillane KM. Mechanical control of antigen detection and discrimination by T and B cell receptors. Biophys J. (2024) 123:2234–55. doi: 10.1016/j.bpj.2024.05.020
2. Proudhon C, Hao B, Raviram R, Chaumeil J, and Skok JA. Long-range regulation of V(D)J recombination. Adv Immunol. (2015) 128:123–82. doi: 10.1016/bs.ai.2015.07.003
3. Jung D, Giallourakis C, Mostoslavsky R, and Alt FW. Mechanism and control of V(D)J recombination at the immunoglobulin heavy chain locus. Annu Rev Immunol. (2006) 24:541–70. doi: 10.1146/annurev.immunol.23.021704.115830
4. Krangel MS. Mechanics of T cell receptor gene rearrangement. Curr Opin Immunol. (2009) 21:133–9. doi: 10.1016/j.coi.2009.03.009
5. Hao B and Krangel MS. Long-distance regulation of fetal V(Delta) gene segment trdv4 by the tcrd enhancer. J Immunol. (2011) 187:2484–91. doi: 10.4049/jimmunol.1100468
6. Hernandez-Munain C. Recent insights into the transcriptional control of the tcra/tcrd locus by distant enhancers during the development of T-lymphocytes. Transcription. (2015) 6:65–73. doi: 10.1080/21541264.2015.1078429
7. Li M, Gan J, Sun Y, Xu Z, Yang J, Sun Y, et al. Architectural proteins for the formation and maintenance of the 3d genome. Sci China Life Sci. (2020) 63:795–810. doi: 10.1007/s11427-019-1613-3
8. Ghirlando R and Felsenfeld G. Ctcf: making the right connections. Genes Dev. (2016) 30:881–91. doi: 10.1101/gad.277863.116
9. Kubo N, Ishii H, Xiong X, Bianco S, Meitinger F, Hu R, et al. Promoter-proximal ctcf binding promotes distal enhancer-dependent gene activation. Nat Struct Mol Biol. (2021) 28:152–61. doi: 10.1038/s41594-020-00539-5
10. Davidson IF, Barth R, Zaczek M, van der Torre J, Tang W, Nagasaka K, et al. Ctcf is a DNA-tension-dependent barrier to cohesin-mediated loop extrusion. Nature. (2023) 616:822–7. doi: 10.1038/s41586-023-05961-5
11. Nasmyth K and Haering CH. Cohesin: its roles and mechanisms. Annu Rev Genet. (2009) 43:525–58. doi: 10.1146/annurev-genet-102108-134233
12. Nagasaka K, Davidson IF, Stocsits RR, Tang W, Wutz G, Batty P, et al. Cohesin mediates DNA loop extrusion and sister chromatid cohesion by distinct mechanisms. Mol Cell. (2023) 83:3049–63 e6. doi: 10.1016/j.molcel.2023.07.024
13. Wendt KS, Yoshida K, Itoh T, Bando M, Koch B, Schirghuber E, et al. Cohesin mediates transcriptional insulation by ccctc-binding factor. Nature. (2008) 451:796–801. doi: 10.1038/nature06634
14. Parelho V, Hadjur S, Spivakov M, Leleu M, Sauer S, Gregson HC, et al. Cohesins functionally associate with ctcf on mammalian chromosome arms. Cell. (2008) 132:422–33. doi: 10.1016/j.cell.2008.01.011
15. Rao SS, Huntley MH, Durand NC, Stamenova EK, Bochkov ID, Robinson JT, et al. A 3d map of the human genome at kilobase resolution reveals principles of chromatin looping. Cell. (2014) 159:1665–80. doi: 10.1016/j.cell.2014.11.021
16. Vietri Rudan M, Barrington C, Henderson S, Ernst C, Odom DT, Tanay A, et al. Comparative hi-C reveals that ctcf underlies evolution of chromosomal domain architecture. Cell Rep. (2015) 10:1297–309. doi: 10.1016/j.celrep.2015.02.004
17. Nora EP, Goloborodko A, Valton AL, Gibcus JH, Uebersohn A, Abdennur N, et al. Targeted degradation of ctcf decouples local insulation of chromosome domains from genomic compartmentalization. Cell. (2017) 169:930–44 e22. doi: 10.1016/j.cell.2017.05.004
18. Rao SSP, Huang SC, Glenn St Hilaire B, Engreitz JM, Perez EM, Kieffer-Kwon KR, et al. Cohesin loss eliminates all loop domains. Cell. (2017) 171:305–20 e24. doi: 10.1016/j.cell.2017.09.026
19. Loguercio S, Barajas-Mora EM, Shih HY, Krangel MS, and Feeney AJ. Variable extent of lineage-specificity and developmental stage-specificity of cohesin and ccctc-binding factor binding within the immunoglobulin and T cell receptor loci. Front Immunol. (2018) 9:425. doi: 10.3389/fimmu.2018.00425
20. Seitan VC, Hao B, Tachibana-Konwalski K, Lavagnolli T, Mira-Bontenbal H, Brown KE, et al. A role for cohesin in T-cell-receptor rearrangement and thymocyte differentiation. Nature. (2011) 476:467–71. doi: 10.1038/nature10312
21. Shih HY, Verma-Gaur J, Torkamani A, Feeney AJ, Galjart N, and Krangel MS. Tcra gene recombination is supported by a tcra enhancer- and ctcf-dependent chromatin hub. Proc Natl Acad Sci U.S.A. (2012) 109:E3493–502. doi: 10.1073/pnas.1214131109
22. Guo C, Yoon HS, Franklin A, Jain S, Ebert A, Cheng HL, et al. Ctcf-binding elements mediate control of V(D)J recombination. Nature. (2011) 477:424–30. doi: 10.1038/nature10495
23. Birshtein BK. The role of ctcf binding sites in the 3’ Immunoglobulin heavy chain regulatory region. Front Genet. (2012) 3:251. doi: 10.3389/fgene.2012.00251
24. Lin SG, Guo C, Su A, Zhang Y, and Alt FW. Ctcf-binding elements 1 and 2 in the igh intergenic control region cooperatively regulate V(D)J recombination. Proc Natl Acad Sci U.S.A. (2015) 112:1815–20. doi: 10.1073/pnas.1424936112
25. Liang Z, Zhao L, Ye AY, Lin SG, Zhang Y, Guo C, et al. Contribution of the igcr1 regulatory element and the 3’igh ctcf-binding elements to regulation of igh V(D)J recombination. Proc Natl Acad Sci U.S.A. (2023) 120:e2306564120. doi: 10.1073/pnas.2306564120
26. Chen L, Carico Z, Shih HY, and Krangel MS. A discrete chromatin loop in the mouse tcra-tcrd locus shapes the tcrdelta and tcralpha repertoires. Nat Immunol. (2015) 16:1085–93. doi: 10.1038/ni.3232
27. Dauphars DJ, Mihai A, Wang L, Zhuang Y, and Krangel MS. Trav15-dv6 family tcrd rearrangements diversify the tcra repertoire. J Exp Med. (2022) 219(2):e20211581. doi: 10.1084/jem.20211581
28. Zhao H, Li Z, Zhu Y, Bian S, Zhang Y, Qin L, et al. A role of the ctcf binding site at enhancer ealpha in the dynamic chromatin organization of the tcra-tcrd locus. Nucleic Acids Res. (2020) 48:9621–36. doi: 10.1093/nar/gkaa711
29. Lauzurica P and Krangel MS. Temporal and lineage-specific control of T cell receptor alpha/delta gene rearrangement by T cell receptor alpha and delta enhancers. J Exp Med. (1994) 179:1913–21. doi: 10.1084/jem.179.6.1913
30. Sleckman BP, Bardon CG, Ferrini R, Davidson L, and Alt FW. Function of the tcr alpha enhancer in alphabeta and gammadelta T cells. Immunity. (1997) 7:505–15. doi: 10.1016/s1074-7613(00)80372-6
31. Dai R, Zhu Y, Li Z, Qin L, Liu N, Liao S, et al. Three-way contact analysis characterizes the higher order organization of the tcra locus. Nucleic Acids Res. (2023) 51:8987–9000. doi: 10.1093/nar/gkad641
32. Love MI, Huber W, and Anders S. Moderated estimation of fold change and dispersion for rna-seq data with deseq2. Genome Biol. (2014) 15:550. doi: 10.1186/s13059-014-0550-8
33. Allahyar A, Vermeulen C, Bouwman BAM, Krijger PHL, Verstegen M, Geeven G, et al. Enhancer hubs and loop collisions identified from single-allele topologies. Nat Genet. (2018) 50:1151–60. doi: 10.1038/s41588-018-0161-5
34. Carico ZM, Roy Choudhury K, Zhang B, Zhuang Y, and Krangel MS. Tcrd rearrangement redirects a processive tcra recombination program to expand the tcra repertoire. Cell Rep. (2017) 19:2157–73. doi: 10.1016/j.celrep.2017.05.045
35. Izraelson M, Nakonechnaya TO, Moltedo B, Egorov ES, Kasatskaya SA, Putintseva EV, et al. Comparative analysis of murine T-cell receptor repertoires. Immunology. (2018) 153:133–44. doi: 10.1111/imm.12857
36. Bories JC, Demengeot J, Davidson L, and Alt FW. Gene-targeted deletion and replacement mutations of the T-cell receptor beta-chain enhancer: the role of enhancer elements in controlling V(D)J recombination accessibility. Proc Natl Acad Sci U.S.A. (1996) 93:7871–6. doi: 10.1073/pnas.93.15.7871
37. McMurry MT and Krangel MS. Pillars article: A role for histone acetylation in the developmental regulation of V(D)J recombination. Science. (2000) 287:495–8. doi: 10.1126/science.287.5452.495
38. Matthews AG, Kuo AJ, Ramon-Maiques S, Han S, Champagne KS, Ivanov D, et al. Rag2 phd finger couples histone H3 lysine 4 trimethylation with V(D)J recombination. Nature. (2007) 450:1106–10. doi: 10.1038/nature06431
39. Ji Y, Little AJ, Banerjee JK, Hao B, Oltz EM, Krangel MS, et al. Promoters, enhancers, and transcription target rag1 binding during V(D)J recombination. J Exp Med. (2010) 207:2809–16. doi: 10.1084/jem.20101136
40. Schatz DG and Ji Y. Recombination centres and the orchestration of V(D)J recombination. Nat Rev Immunol. (2011) 11:251–63. doi: 10.1038/nri2941
41. Dai HQ, Hu H, Lou J, Ye AY, Ba Z, Zhang X, et al. Loop extrusion mediates physiological igh locus contraction for rag scanning. Nature. (2021) 590:338–43. doi: 10.1038/s41586-020-03121-7
42. Zhang Y, Zhang X, Dai HQ, Hu H, and Alt FW. The role of chromatin loop extrusion in antibody diversification. Nat Rev Immunol. (2022) 22:550–66. doi: 10.1038/s41577-022-00679-3
43. Allyn BM, Hayer KE, Oyeniran C, Nganga V, Lee K, Mishra B, et al. Locus folding mechanisms determine modes of antigen receptor gene assembly. J Exp Med. (2024) 221(2):e20230985. doi: 10.1084/jem.20230985
44. Hernandez-Munain C, Roberts JL, and Krangel MS. Cooperation among multiple transcription factors is required for access to minimal T-cell receptor alpha-enhancer chromatin in vivo. Mol Cell Biol. (1998) 18:3223–33. doi: 10.1128/MCB.18.6.3223
45. Hernandez-Munain C, Sleckman BP, and Krangel MS. A developmental switch from tcr delta enhancer to tcr alpha enhancer function during thymocyte maturation. Immunity. (1999) 10:723–33. doi: 10.1016/s1074-7613(00)80071-0
46. Spicuglia S, Payet D, Tripathi RK, Rameil P, Verthuy C, Imbert J, et al. Tcralpha enhancer activation occurs via a conformational change of a pre-assembled nucleo-protein complex. EMBO J. (2000) 19:2034–45. doi: 10.1093/emboj/19.9.2034
47. Del Blanco B, Roberts JL, Zamarreno N, Balmelle-Devaux N, and Hernandez-Munain C. Flexible stereospecific interactions and composition within nucleoprotein complexes assembled on the tcr alpha gene enhancer. J Immunol. (2009) 183:1871–83. doi: 10.4049/jimmunol.0803351
Keywords: CTCF binding element, T cell receptor, V(D)J recombination, chromatin architecture, chromatin activity
Citation: Zhu Y, Dai R, Zhao H, Luo J, Li K, Xue W, Qin L, Pan H, Liao S and Hao B (2025) The insulator EACBE regulates V(D)J recombination of Tcrd gene by modulating chromatin organization. Front. Immunol. 16:1613621. doi: 10.3389/fimmu.2025.1613621
Received: 17 April 2025; Accepted: 01 July 2025;
Published: 17 July 2025.
Edited by:
Dominik Filipp, Institute of Molecular Genetics (ASCR), CzechiaReviewed by:
Taku Naito, Toho University, JapanFilip Senigl, Institute of Molecular Genetics (ASCR), Czechia
Copyright © 2025 Zhu, Dai, Zhao, Luo, Li, Xue, Qin, Pan, Liao and Hao. This is an open-access article distributed under the terms of the Creative Commons Attribution License (CC BY). The use, distribution or reproduction in other forums is permitted, provided the original author(s) and the copyright owner(s) are credited and that the original publication in this journal is cited, in accordance with accepted academic practice. No use, distribution or reproduction is permitted which does not comply with these terms.
*Correspondence: Bingtao Hao, aGFvYnQxMjNAenp1LmVkdS5jbg==; Shixiu Liao, eWNoc2xzaHhAenp1LmVkdS5jbg==
†These authors have contributed equally to this work