 Chaochao Yu
 Chengqian Jia2†
 Yi Li
Yi Li Yingwen Zhang
- 1Department of Rehabilitation, Union Hospital, Tongji Medical College, Huazhong University of Science and Technology, Wuhan, Hubei, China
- 2Department of Pain, The Central Hospital of Wuhan, Tongji Medical College, Huazhong University of Science and Technology, Wuhan, Hubei, China
- 3Department of Hematology, Zhongnan Hospital of Wuhan University, Wuhan University, Wuhan, Hubei, China
- 4Department of Medical Oncology, First Affiliated Hospital of Nanchang University, Nanchang, Jiangxi, China
- 5Department of Radiation and Medical Oncology, Zhongnan Hospital of Wuhan University, Wuhan University, Wuhan, Hubei, China
- 6Department of Integrated Chinese and Western Medicine, Zhongnan Hospital of Wuhan University, Wuhan University, Wuhan, Hubei, China
Objective: This study aimed to examine the potential anticancer properties of Yiai Fuzheng decoction (YFD), along with its mechanism of action against triple-negative breast cancer (TNBC).
Methods: A TNBC mouse model was established by inoculating 4T1 cells into the 4th mammary fat pad. Micropositron emission tomography (micro-PET), hematoxylin and eosin (HE) staining, immunohistochemistry, immunofluorescence assays, flow cytometry, and western blotting were used to assess the therapeutic effects of YFD. The components of YFD were identified via UHPLC-Q/Orbitrap MS. Nontargeted metabolomic analysis was performed to identify changes in tumor metabolites via gas chromatography-time-of-flight mass spectrometry (GC-TOF/MS). The Illumina sequencing platform was used to identify differentially expressed genes in the tumors.
Results: A total of 20 bioactive components of YFD were screened and identified. We found that YFD treatment resulted in a substantial increase in CD4+ and CD8+ T cells, a reduction in myeloid-derived suppressor cells (MDSCs) and tumor-associated macrophages (TAMs), and an increase in the M1/M2 ratio of TAMs in tumors. These changes create a tumor-suppressive microenvironment that inhibits tumor growth and metastasis in TNBC mice. YFD can affect various immune regulatory pathways, such as inactivation of the mitogen-activated protein kinase kinase/extracellular signal-regulated kinase 1 and 2 (MEK/ERK1/2) pathway. Additionally, metabolomic analysis suggested that YFD could reprogram several altered metabolic pathways, including the urea cycle; metabolism of arginine and proline; pyruvate; the Warburg effect; D-arginine; and D-ornithine, glutamate, glycine, serine, and tryptophan, to suppress cancer progression.
Conclusion: Our findings provide preclinical evidence that supports the application of YFD in TNBC treatment.
Introduction
Breast cancer (BC) is the most frequently diagnosed cancer in women worldwide. In 2022, 287,850 new BC cases and 43,250 fatalities from BC occurred in the United States alone (1). A recent investigation revealed that BC surpassed lung cancer as the most common cancer globally (2). In 2020, there were more than 2 million new cases, accounting for 11.7% of all cancer cases, and 684,996 new fatalities, accounting for 6.9% of all cancer-related deaths (2). BC is highly heterogeneous with varying genetic profiles and histopathological changes. These subtypes are divided into luminal A, luminal B, human epidermal growth factor receptor 2 (HER2)-enriched, and triple-negative breast cancer (TNBC) subtypes (3). TNBC has unusual molecular characteristics, as it does not express any of the three major receptors: estrogen, progesterone, or HER2. It is aggressive and tends to spread to other areas of the body, such as the lungs, brain, and bones (4). Patients with TNBC have a poor prognosis and a high recurrence rate (5). TNBC is not sensitive to molecular-targeted or endocrine therapy (3). Currently, chemotherapy is the principal therapeutic option for TNBC (6). Currently, approved chemotherapeutics, such as taxanes and anthracyclines, have shown less satisfactory efficacy in TNBC owing to the heterogeneity and development of chemoresistance (7). Therefore, identifying an effective therapy that can slow disease progression and improve patient survival is crucial.
The tumor microenvironment (TME) plays a pivotal role in the malignant progression and therapeutic response of BC (8). It is composed of various components, including cancer cells, cancer stem cells, tumor-associated macrophages (TAMs), myeloid-derived suppressor cells (MDSCs), lymphocytes, natural killer cells, cancer-associated fibroblasts, the extracellular matrix, cytokines, and growth factors (9). The exponential proliferation of BC cells induces a highly hypoxic environment, which results in metabolic reprogramming of BC cells, immune cells, and other surrounding TME cells, thus driving tumor growth, angiogenesis, stemness, metastasis, and therapeutic resistance (10). Consequently, TME remodeling could be a promising method for treating TNBC (10). MDSCs are the predominant immunosuppressive cells in the TME (11). MDSCs are immature myeloid cells that can produce immunosuppressive cells, such as regulatory T cells and T helper 17 cells, and limit T-cell proliferation and activation (12). TAMs are the major types of tumor-infiltrating immune cells (13). They are divided into activated M1-like TAMs, which have antitumor effects, and activated M2-like TAMs, which promote cancer growth (14). The accumulation of MDSCs and TAMs can suppress antitumor immunity and contribute to BC progression (15, 16). Additionally, clinical studies have shown that an increased population of MDSCs or TAMs is associated with metastasis and decreased survival in patients with BC (17, 18). Thus, targeting MDSCs or TAMs to remodel the TME may be an encouraging approach for BC immunotherapy (12, 19).
An increasing body of evidence suggests that traditional Chinese herbal medicines and ingredients originating from medicinal plants have significant potential as adjuvant treatments for BC (20–24). Furthermore, studies have revealed that traditional Chinese medicine (TCM) can slow cancer growth by modifying the TME (25, 26). According to Li et al., the Chinese medicine decoction Aiduqing inhibits TAM/CXCL1-induced Treg differentiation and infiltration, thereby dramatically suppressing cancer growth and lung metastasis (27). Wang et al. demonstrated that the classical Chinese medicine formula Yu-Ping-Feng significantly extended the survival of mice with Lewis lung cancer by activating M1 macrophage polarization and increasing CD4+ T-cell cytotoxicity (28). However, there are few reports of effective Chinese herbal decoctions that can remodel the TME to prevent TNBC progression.
Yiai Fengzheng decoction (YFD) is a custom-made compound formula developed by Prof. Yingwen Zhang on the basis of TCM theory and long-term clinical experience. YFD can effectively decrease BC-related fatigue, reduce the incidence of cancer recurrence, prolong survival, and treat chemotherapy-related adverse reactions (29). Additionally, the YFD successfully obtained invention patent certification (30). Therefore, uncovering the underlying mechanisms by which YFD prevents BC progression and providing compelling data to support its wider therapeutic application are worthwhile. In recent years, omics research techniques, such as transcriptomics, metabolomics, proteomics, and phenomics, have been increasingly used to elucidate the biological mechanisms of TCM prescriptions for the treatment of diverse ailments from a systematic and holistic perspective (31, 32). Owing to the intricate pathophysiology and evolution of TNBC, multiomic profiling may be more appropriate for understanding the landscape of the TNBC microenvironment (33, 34). Accordingly, it is reasonable to assume that multiomic techniques may be more useful for understanding the mechanism of the antitumor actions of YFD and for identifying potential biomarkers for prognosis and treatment. In this study, multiomics technologies, including transcriptomic and metabolomic profiling, were used to elucidate the mechanisms through which YFD reshaped the TME in TNBC. UHPLC-Q/Orbitrap MS was used to identify bioactive ingredients in YFD. This study not only identified the bioactive components of YFD but also elucidated its anti-BC mechanisms from the perspective of systematic biology and TME remodeling, which have not been sufficiently reported.
The present study pioneers the role of YFD in MEK/ERK1/2 signaling-mediated immune microenvironment remodeling, metabolome-driven TAM polarization and MDSC inhibition. This study provides convincing experimental evidence supporting the application of YFD in treatment. The workflow is illustrated in Figure 1.
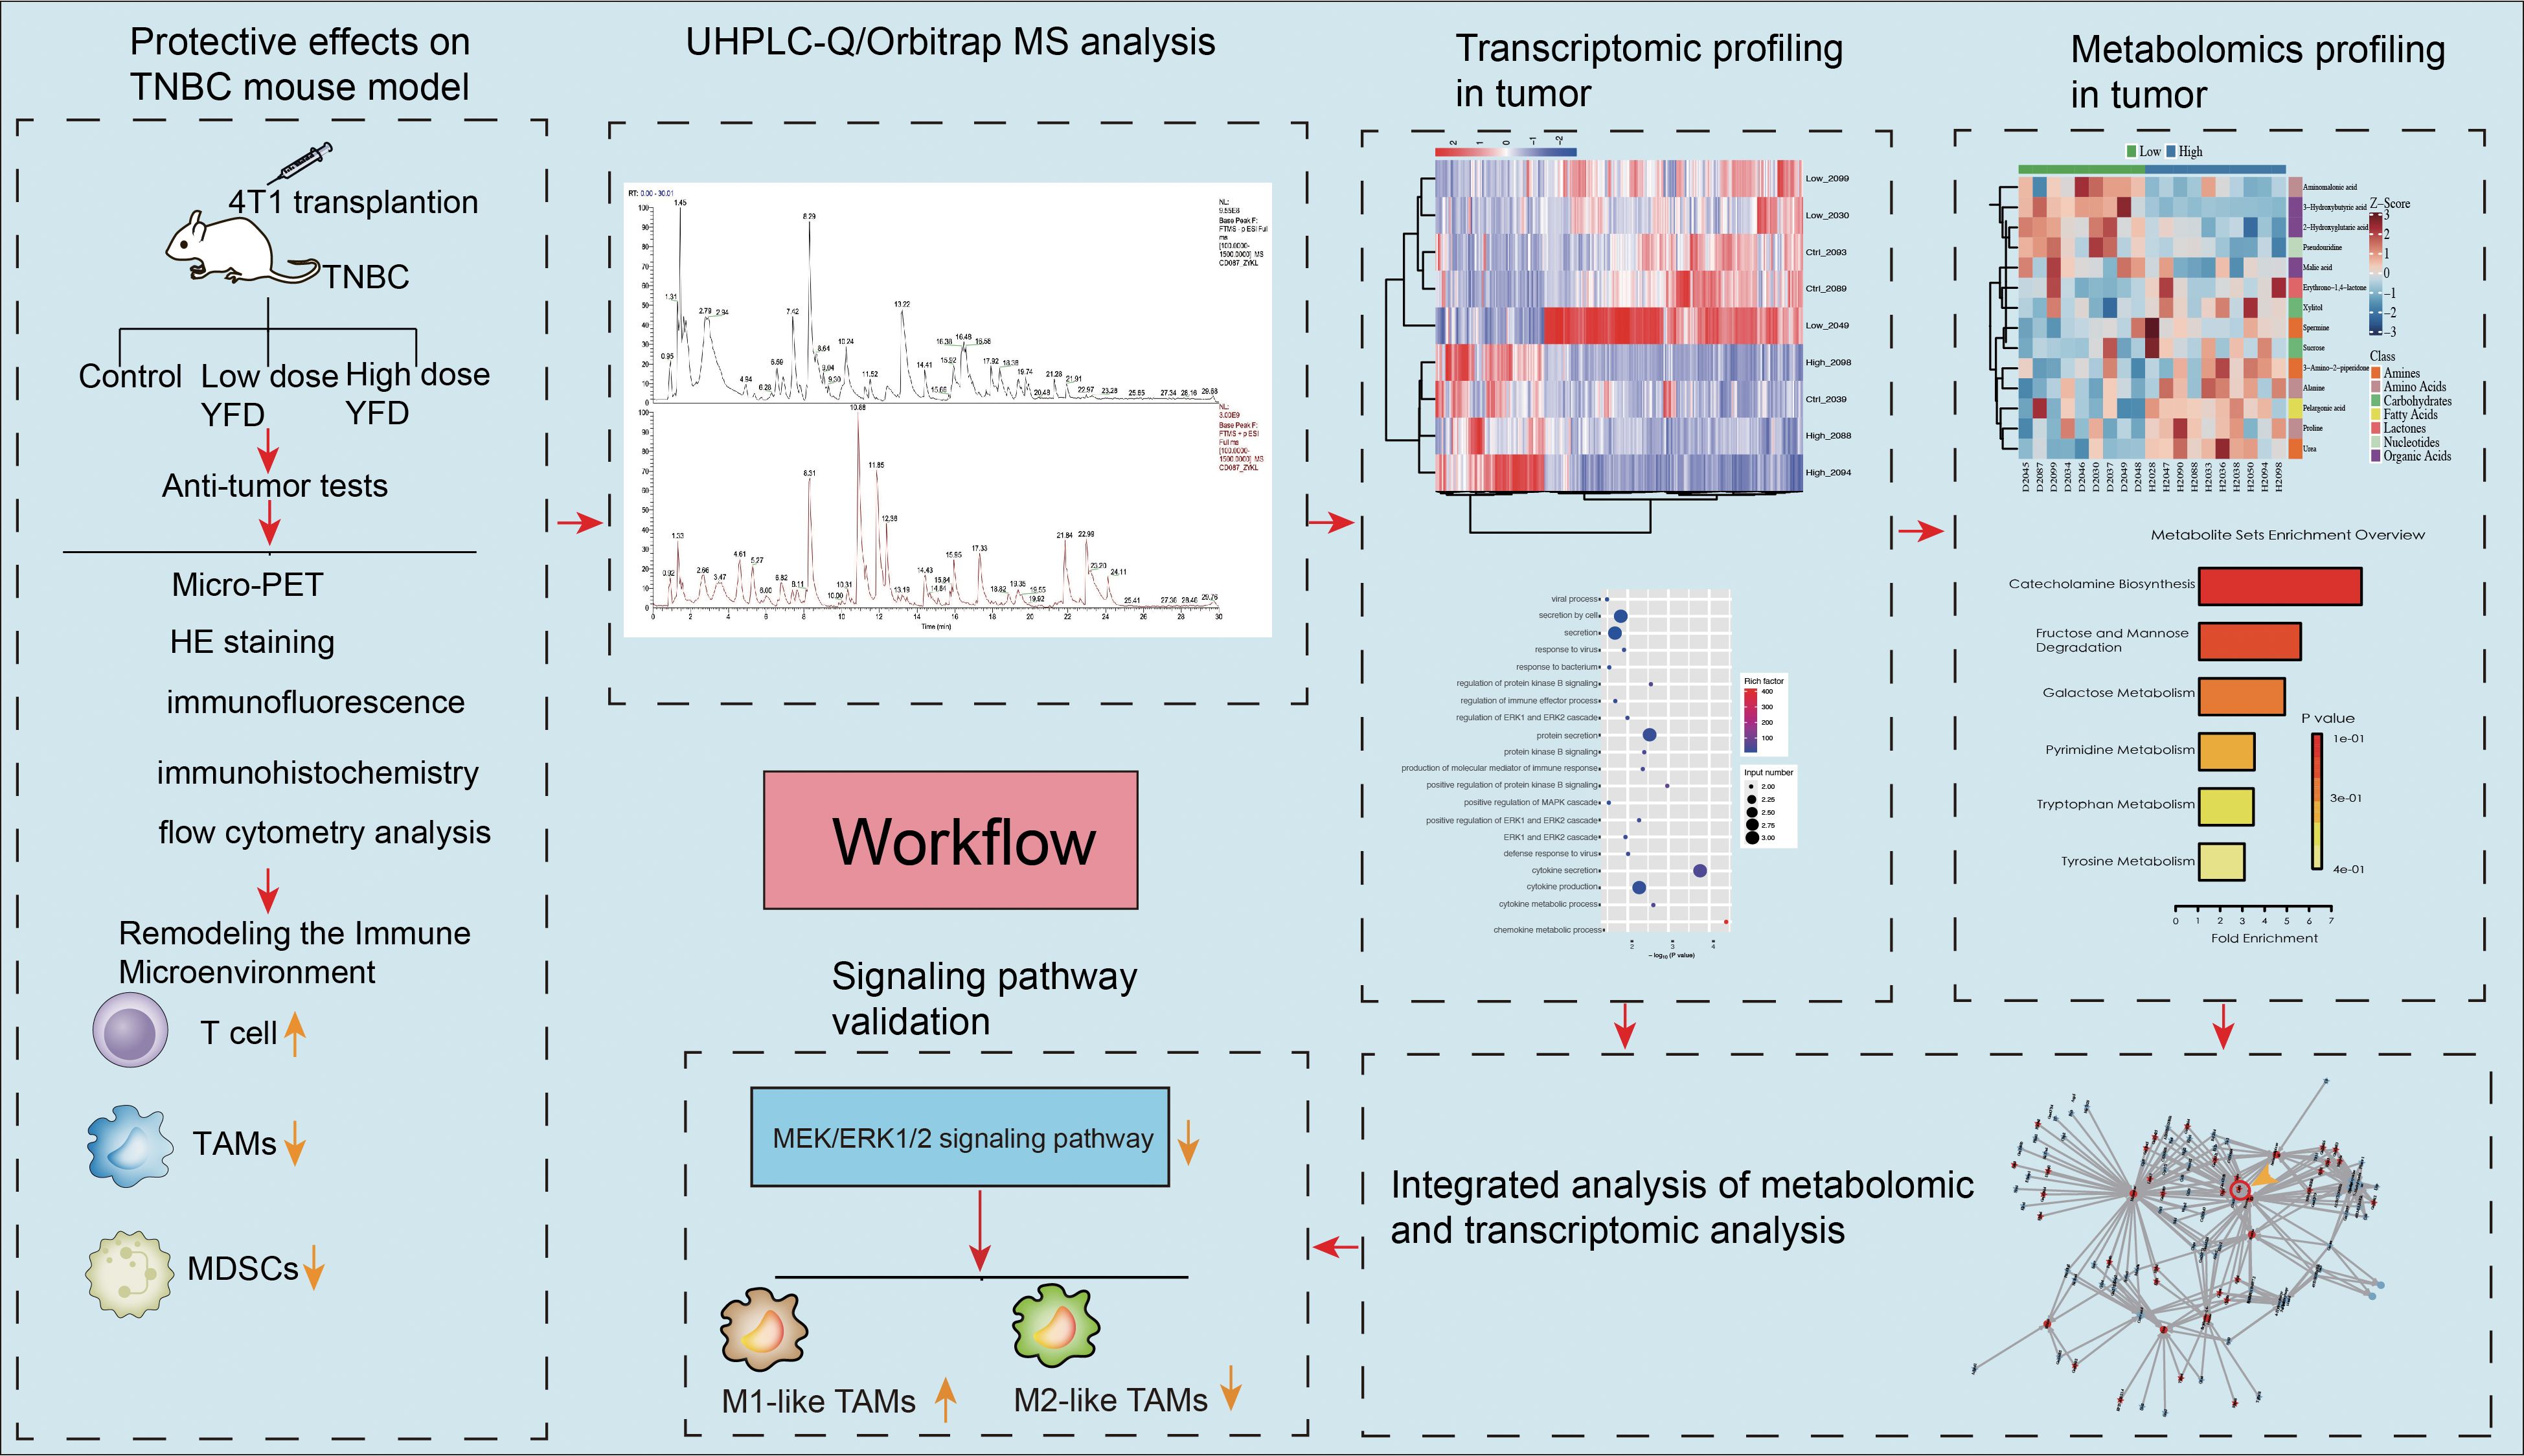
Figure 1. Workflow of the present study.
Materials and methods
Preparation of YFD decoction
All of the herbs were prepared by the pharmacy of Zhongnan Hospital of Wuhan University. All herbal components of YFD were purchased from Hubei Chenmei Chinese Traditional Medicine Co., Ltd. (Huanggang, China).The herbal material consisted of 15 medicinal herbs: 15 g Huang Qi (root of Astragalus membranaceus), 15 g Fu Ling (dried sclerotium of Poria cocos), 12 g Shen Jin Cao (whole dried Lycopodium japonicum Thunb), 15 g Si Gua Luo (vascular bundle of Luffa cylindrica Roem), 12 g Kun Bu (thallus of Laminaria japonica Aresch), 15 g Zhe Bei Mu (dry bulb part of Fritillaria thunbergii Miq), 15 g San Leng (dry tuber part of Sparganium stoloniferun Buch), 6 g Shui Zhi (whole dried body of Whitmania pigra Whitman), 15 g Yu Jin (tuberous root of Curcuma longa L), 15 g Xia Ku Cao (dry fruit cluster of Prunella vulgaris L), 15 g Bai Hua She She Cao (whole part of Oldenlandia diffusa), 15 g E Zhu (dry tuberous root of Curcuma phaeocaulis Valeton), 15 g Pu Gong Ying (whole part of dried Taraxacum mongolicum Hand), 15 g Zao Jiao Ci (dry caltrop of Gleditsia sinensis Linn), and 12 g Hong Teng (dry rattan of Sargentodoxa cuneata). All the herbs were soaked and washed in a 6-fold volume of water for half an hour, followed by boiling for 30 min. The final concentration of the herbal medicine solution was 4.4 g/ml. Finally, the decoction was stored at 4°C.
UHPLC-Q/orbitrap MS analysis of YFD
The freeze-dried YFD formulation (drug concentration: 6.37 g/g) was reconstituted in 30 mL of heated deionized water. A 100 μL aliquot of this mixture was subsequently mixed with 400 μL of methanol and vortexed for 10 min. After centrifugation (4°C, 13,000 ×g, 10 min), the resulting mixture was filtered and subjected to chromatographic analysis via an LC–MS system. The detailed LC–MS parameters are provided in Table 1 and Table 2. High-resolution LC–MS/MS datasets were computationally processed via Compound Discoverer 3.3 (CD 3.3) with reference to the McCloud metabolomic database for compound annotation.
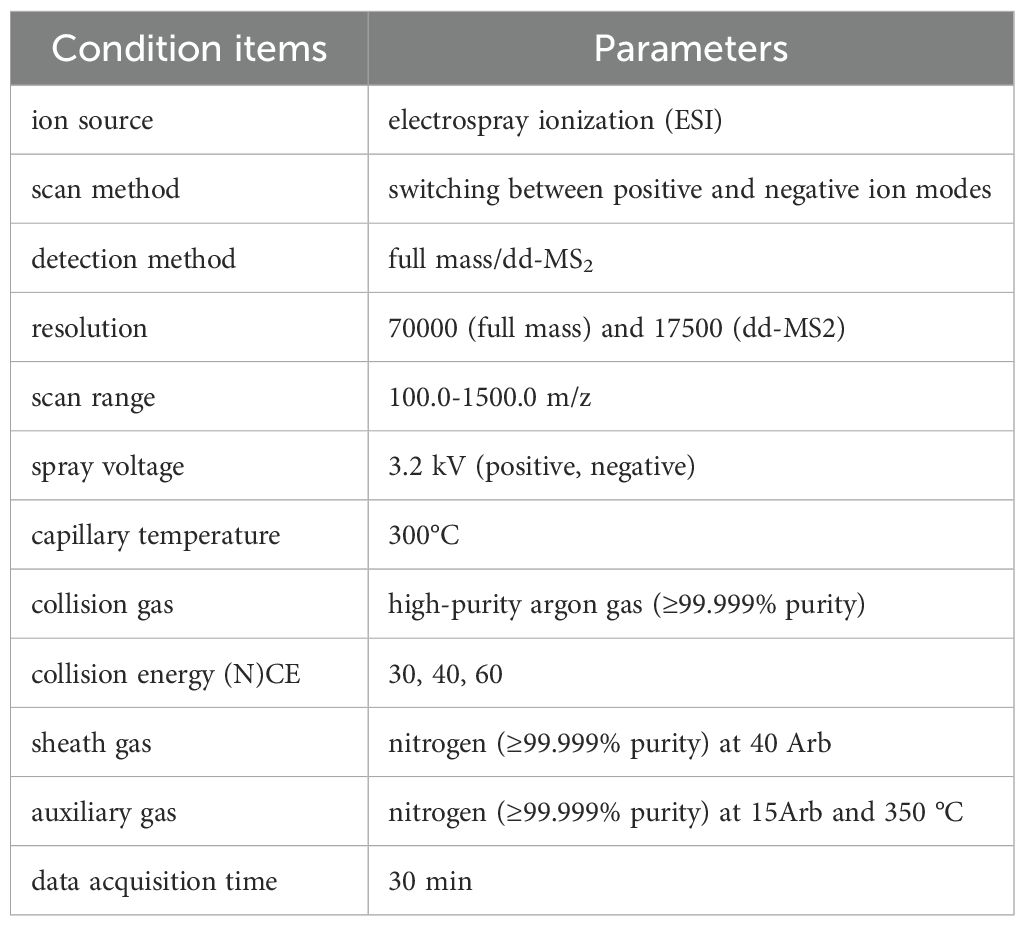
Table 1. The mass spectrometry conditions.
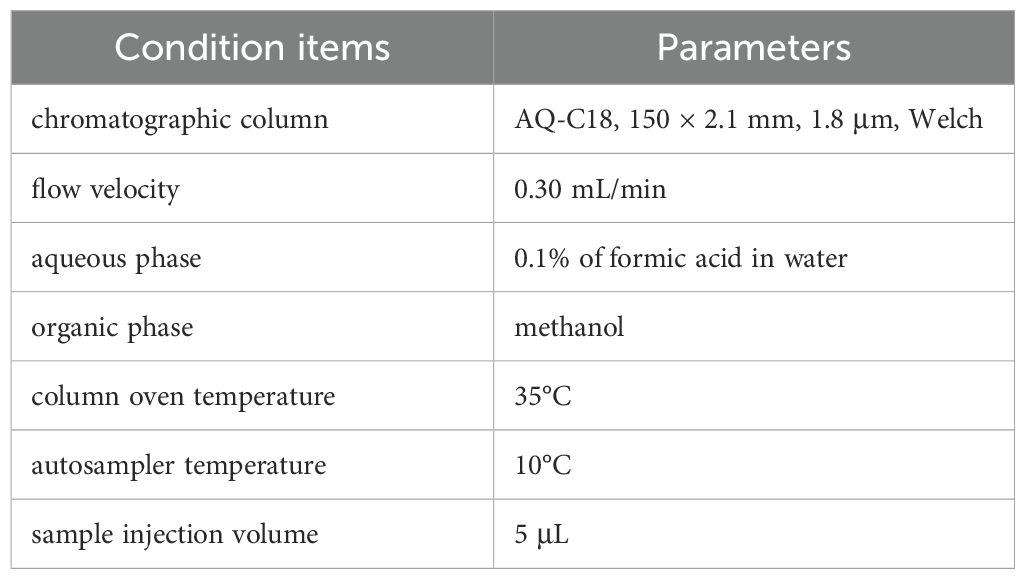
Table 2. The liquid chromatography conditions.
Ethics statement
All experimental procedures involving animals were approved by the Institutional Animal Ethical Review Board of Zhongnan Hospital, Wuhan University (Approval ID: ZN2022059). This study strictly complied with Wuhan University’s institutional guidelines for laboratory animal care and utilization throughout the experimental protocol.
Animal experiments
Female C57BL/6 mice (8 weeks old) were procured from SPF Biotechnology Co., Ltd. (Beijing; Certification: SCXK[Jing]2019-0010) and maintained under controlled environmental conditions (12-hour photocycle, 20 – 22°C, 30 – 70% relative humidity; Facility License: 110324220104570773SCXK-2020–100). After a 7-day acclimation period, TNBC models were surgically established via the orthotopic implantation of 1×10⁴ 4T1 cells into the fourth mammary fat pad. The tumor-bearing mice were randomized into three groups (n=10/group): the control, low-dose (YFDlow), and high-dose (YFDhigh) groups. Dosages were calculated via interspecies dose translation (animal equivalent dose = human dose × 12.3 km ratio) (35). YFD solutions (11.07 g/kg (YFDlow) and 44.28 g/kg (YFDhigh)) were administered intragastrically as previously reported. Our previous in vitro cytotoxicity tests demonstrated that different concentrations ranging from 15 – 60 mg/ml had few harmful effects (36). Biometric parameters (body mass and tumor dimensions) were recorded triweekly, and the tumor volume was calculated as 0.5×length×width². Pharmacological intervention commenced upon confirmed tumor engraftment (days 7 – 9 postimplantation), which consisted of daily oral gavage for 14 consecutive days.
Micropositron emission tomography imaging
A TransPE BioCaliburn LH instrument (RAYCAN, Suzhou, China) was used to performed the microPET scans. After anesthesia with 2% isoflurane, the mice were placed in the prone position, and 18F-fluorodeoxyglucose (FDG) was injected into the mice via the tail vein. Scanning was started 50 min after the injection. Each mouse was scanned for 30 min. Next, the microPET data were reconstructed via a 3D ordered subset expectation-maximum (OSEM) algorithm. The mean standardized uptake values (SUVs) were calculated via region-of-interest (ROI) analysis.
Sample collection and preparation
Following microPET imaging, tumor-bearing mice were anesthetized via inhalation of 2% isoflurane, followed by immediate procurement of the peripheral blood serum. Splenic, pulmonary, and neoplastic tissues were subjected to cryogenic storage (0 – 4°C). The harvested serum and splenic samples were processed for immunophenotypic profiling via flow cytometry. Concurrently, pulmonary and tumor tissue aliquots were flash-frozen in liquid nitrogen vapor for cryopreservation at -80°C, while residual tissue segments were immersed in a 4% paraformaldehyde (PFA) solution.
Flow cytometry analysis
First, we separated the peripheral blood lymphocytes and splenocytes. Next, the erythrocytes were subsequently lysed. Then, we incubated the obtained cell suspensions with anti-mouse CD16/32. To identify different subtypes of T cells, we stained the cells with PE-conjugated anti-CD8, FITC-conjugated anti-CD4, and APC-conjugated anti-CD3 antibodies. A flow cytometer was used to detect the labeled cells. FlowJo software (Tree Star Inc., Ashland, OR, USA) was used to calculate the number of labeled cells.
Hematoxylin and eosin staining and immunohistochemistry
Lung and tumor tissues were fixed in 4% paraformaldehyde for 24 h. The fixed tissues were dehydrated and embedded in paraffin. The embedded sections were cut into 5 µm thick slices. HE staining was used to detect metastatic nodules in the lungs, and a BX53 microscope was used to determine the area of the metastatic lesions (Olympus, Center Valley, PA, USA). Immunohistochemical analysis was performed to validate the effect of YFD on metastatic potential. The samples were subjected to antigen retrieval by heating in sodium citrate buffer, followed by endogenous peroxidase blocking. The sections were then incubated with N-cadherin (1:500, GB12135; Servicebio, Wuhan, China), vimentin (1:500, GB11192; Servicebio), and Ki67 (1:500, GB111141; Servicebio) antibodies at 4°C overnight. The slides were then incubated with a suitable secondary antibody for one hour at 37°C. Immunostaining was performed by incubation with diaminobenzidine and counterstaining with hematoxylin. Finally, a BX53 microscope was used to observe the staining results. ImageJ software (National Institutes of Health, Bethesda, MD, USA) was used for data analysis.
Immunofluorescence assay
The tumor tissue sections were subjected to an antigen retrieval procedure by heating in sodium citrate buffer and blocked for 1 h with 10% goat serum. To detect TAMs, the slides were incubated with an anti-F4/80 antibody (1:200, sc-377009, Santa Cruz Biotechnology, Santa Cruz, CA, USA) overnight at 4°C. The sections were then washed with PBS and incubated with secondary antibody (1:500, ab150116, Abcam, Inc., USA) for 1 h. Next, the slides were washed with PBS 4 times (5 min/wash) and blocked for 1 h with 10% goat serum. The slides were subsequently incubated with an anti-CD11b antibody (1:500, ab184308, Abcam, Inc., USA) at 4°C overnight. The cells were incubated with a secondary antibody (1:500, ab150116, Abcam, Inc., USA) for 1 h. After several washes with PBS, the nuclei were stained with DAPI. The procedure used to detect MDSCs was similar to that described above, but the labeling antibodies used were anti-Ly6G antibody (1:300, sc-53515, Santa Cruz, CA, USA) and anti-CD11b antibody. To detect T cells, the sections were incubated with an anti-CD3 antibody (1:300, sc-20047, Santa Cruz, CA, USA) and secondary antibodies (1:500, ab150116, Abcam, Inc., USA). To detect M1-type TAMs, the slides were incubated with anti-F4/80 and anti-CD86 antibodies (1:400, sc-28347, Santa Cruz, CA, USA). To detect M2-type TAMs, the slides were incubated with anti-F4/80 and anti-CD206 antibodies (1:300, sc-58986, Santa Cruz, CA, USA). The appropriate secondary antibodies were selected on the basis of the reactivity of the primary antibodies. A laser confocal fluorescence microscope (STELLARIS 5 SR, Leica, Mannheim, Germany) was used to observe the immunofluorescence results.
Western blot analysis
Tumor tissues from three mice in each group were randomly selected for western blot analysis. First, 10% SDS–PAGE gels were used to separate equal amounts of the loaded proteins. The isolated proteins were transferred onto polyvinylidene fluoride membranes. Next, the membranes were incubated overnight at 4 °C with the following primary antibodies: MEK-1/2 mouse mAb (1:500, sc-81504, Santa Cruz, CA, USA), phospho-MEK1/MEK2-S217/S221 rabbit mAb (1:500, AP1349, ABclonal, Wuhan, China), ERK1+ERK2 rabbit mAb (1:10000, ab184699, Abcam, Inc., USA), phospho-ERK1-T202/Y204+ERK2-T185/Y187 rabbit pAb (1:500, AP0472, ABclonal, Wuhan, China), LAD1 Rabbit pAb (1:500, AP17506, ABclonal, Wuhan, China), and TNFα mouse mAb (1:500, sc-52746, Santa Cruz, CA, USA).), IL-10 mouse mAb (1:500, sc-365858; Santa Cruz Biotechnology, CA, USA), and GAPDH (1:5000, HRP-60004; Proteintech, Wuhan, China). After incubation with the appropriate secondary antibodies, protein signals were detected via a ChemiDocXRS+Imaging System (Tanon-5200, Tanon, Shanghai, China.) and quantified via ImageJ software.
RNA extraction and sequencing
TRIzol was used to separate total RNA from the tumor tissues. After RNA was extracted by DNaseI, the DNA digestion procedure was performed. The RNA quality was then assessed via a NanodropTM OneC spectrophotometer (Thermo Fisher Scientific, Inc., MA, USA). Subsequently, 1.5% agarose gel electrophoresis was performed to assess RNA integrity. Additionally, qualifying RNAs were quantified via a Qubit 3.0 instrument with a QubitTM RNA Broad Range Assay Kit. A stranded RNA sequencing library was created with 2 µg of total RNA via the KCTM Stranded mRNA Library Prep Kit for Illumina® (catalog no. DR08402; Wuhan SeqHealth Co., Ltd. Wuhan, China). PCR products in the range of 200 – 500 bp were isolated and sequenced via a HiSeq × 10 sequencer.
RNA-seq data analysis
Using the STRA software and the default parameters, the acquired data were mapped to the reference genome of Homo sapiens (Homosapiens. GRCh38; ftp://ftp.ensembl.org/pub/release-87/fasta/homo_sapiens/dna/). Based on feature counts (Subread-1.5.1; Bioconductor), reads mapped to each gene’s exon regions were counted, and RPKMs were then computed. The edgeR program was used to identify the genes that were differentially expressed between groups. The statistical significance of variations in gene expression was assessed via a false discovery rate (FDR)-adjusted p value threshold of 0.05 and a fold change criterion of 2. On the basis of a corrected p value cutoff of 0.05, to determine statistically significant enrichment, KOBAS software was used to perform gene ontology (GO) and KEGG enrichment analyses for the DEGs. Alternative splicing events were identified via rMATS with an FDR value threshold of 0.05 and an absolute value of 0.05.
Metabolomic analysis
Untargeted metabolomic analysis across the control, low-, and high-dose cohorts was conducted via the XploreMET platform. Specifically, 50 mg of tumor samples from each group were homogenized with 25 mg of precooled zirconium oxide beads supplemented with 10 μL of DL-chlorophenylalanine (internal standard). This quality control marker was introduced prior to metabolite extraction to systematically quantify the technical variations arising from sample preparation and instrumental analysis. The overall coefficient of variation (CV), defined as the ratio of the standard deviation to the mean peak signal intensity, was assumed to be within 20% for each analytical block of 180 samples. After homogenization with 50% precooled methanol and centrifugation at 14000 rpm and 4°C for 20 min, the mixture was homogenized in 175 μL of precooled methanol/chloroform (v:v=3:1) for one more round of extraction, followed by centrifugation at 14000 rpm and 4°C for 20 min. The chloroform in the remaining supernatant was removed and lyophilized via a FreeZone freeze-dryer. A robotic multipurpose MPS2 sample with dual heads was used for sample derivatization and injection. Specifically, the dried sample was derivatized with 50 μL of methoxyamine (20 mg/mL in pyridine) at 30°C for 2 h, followed by the addition of 50 μL of MSTFA (1% TMCS) at 37.5°C for another 1 h via the sample preparation head. After derivatization, the samples were injected via a sample injection head. Quality control was conducted to ensure repeatability and stability.
A gas chromatography-time-of-flight mass spectrometry (GC-TOF/MS) machine (Pegasus HT, Leco Corp., St. Joseph, MO, USA) with an Agilent 7890 B gas chromatograph and a Gerstel multipurpose pattern MPS2 with dual heads (Gerstel, Muehlheim, Germany) was used for untargeted metabolic profiling. The parameters were set as follows: column, DB-5MS (5% diphenyl/95% dimethyl polysiloxane) 30 m (length) 250 μm I.D., 0.25-μm film thickness; oven programmed temperature, 80°C (2 minutes), 80 – 300°C (12°C/min), 300°C (8 minutes); inlet temperature, 270°C; injection volume, 1.0 μL (splitless); carrier gas, helium (99.9999%); transfer interface temperature, 270°C; flow rate, 1.0 mL/min; ionization mode electron energy, 70 EV; detector voltage, -1700 V; source temperature, 220°C; acquisition rate, 25 spectra/sec; and mass range, 50 – 500 Da.
ChromaTOF (v4.71, Leco Corp., St. Joseph, MO, USA) was used to process the raw data obtained by GC-TOF/MS. Metabolites were identified by comparison with the JiaLib metabolite database. Principal component analysis (PCA), projection to latent structure discriminant analysis (PLS-DA), and orthogonal PLS-DA (OPLS-DA) were used. The importance of variables in the projection (VIP) of each identified metabolite was subsequently calculated. Metabolites with VIP > 1, p< 0.05, and |log2fold change (FC)|≥0 were considered differentially abundant metabolites. Pathway-associated metabolite sets were used for pathway enrichment analysis. The KEGG database was used to conduct functional annotation and enrichment analyses of the differentially expressed metabolites.
Statistical analysis
The results are expressed as the means ± standard deviations (means ± SDs). The data were subjected to one-way analysis of variance via GraphPad software (version 8), followed by either Dunnett’s t test or Tukey’s test. Statistical significance was defined as a p value< 0.05.
Results
Components of YFD
The phytochemical components of YFD were studied via UHPLC-Q/Orbitrap MS in positive and negative ion modes. The total ion chromatograms are shown in Figure 2. The bioactive ingredients in YFD were identified by comparison with standard materials and chemical information obtained from the mzCloud mass spectrometry library. The top 20 bioactive compounds were screened and identified and are presented in Table 3.
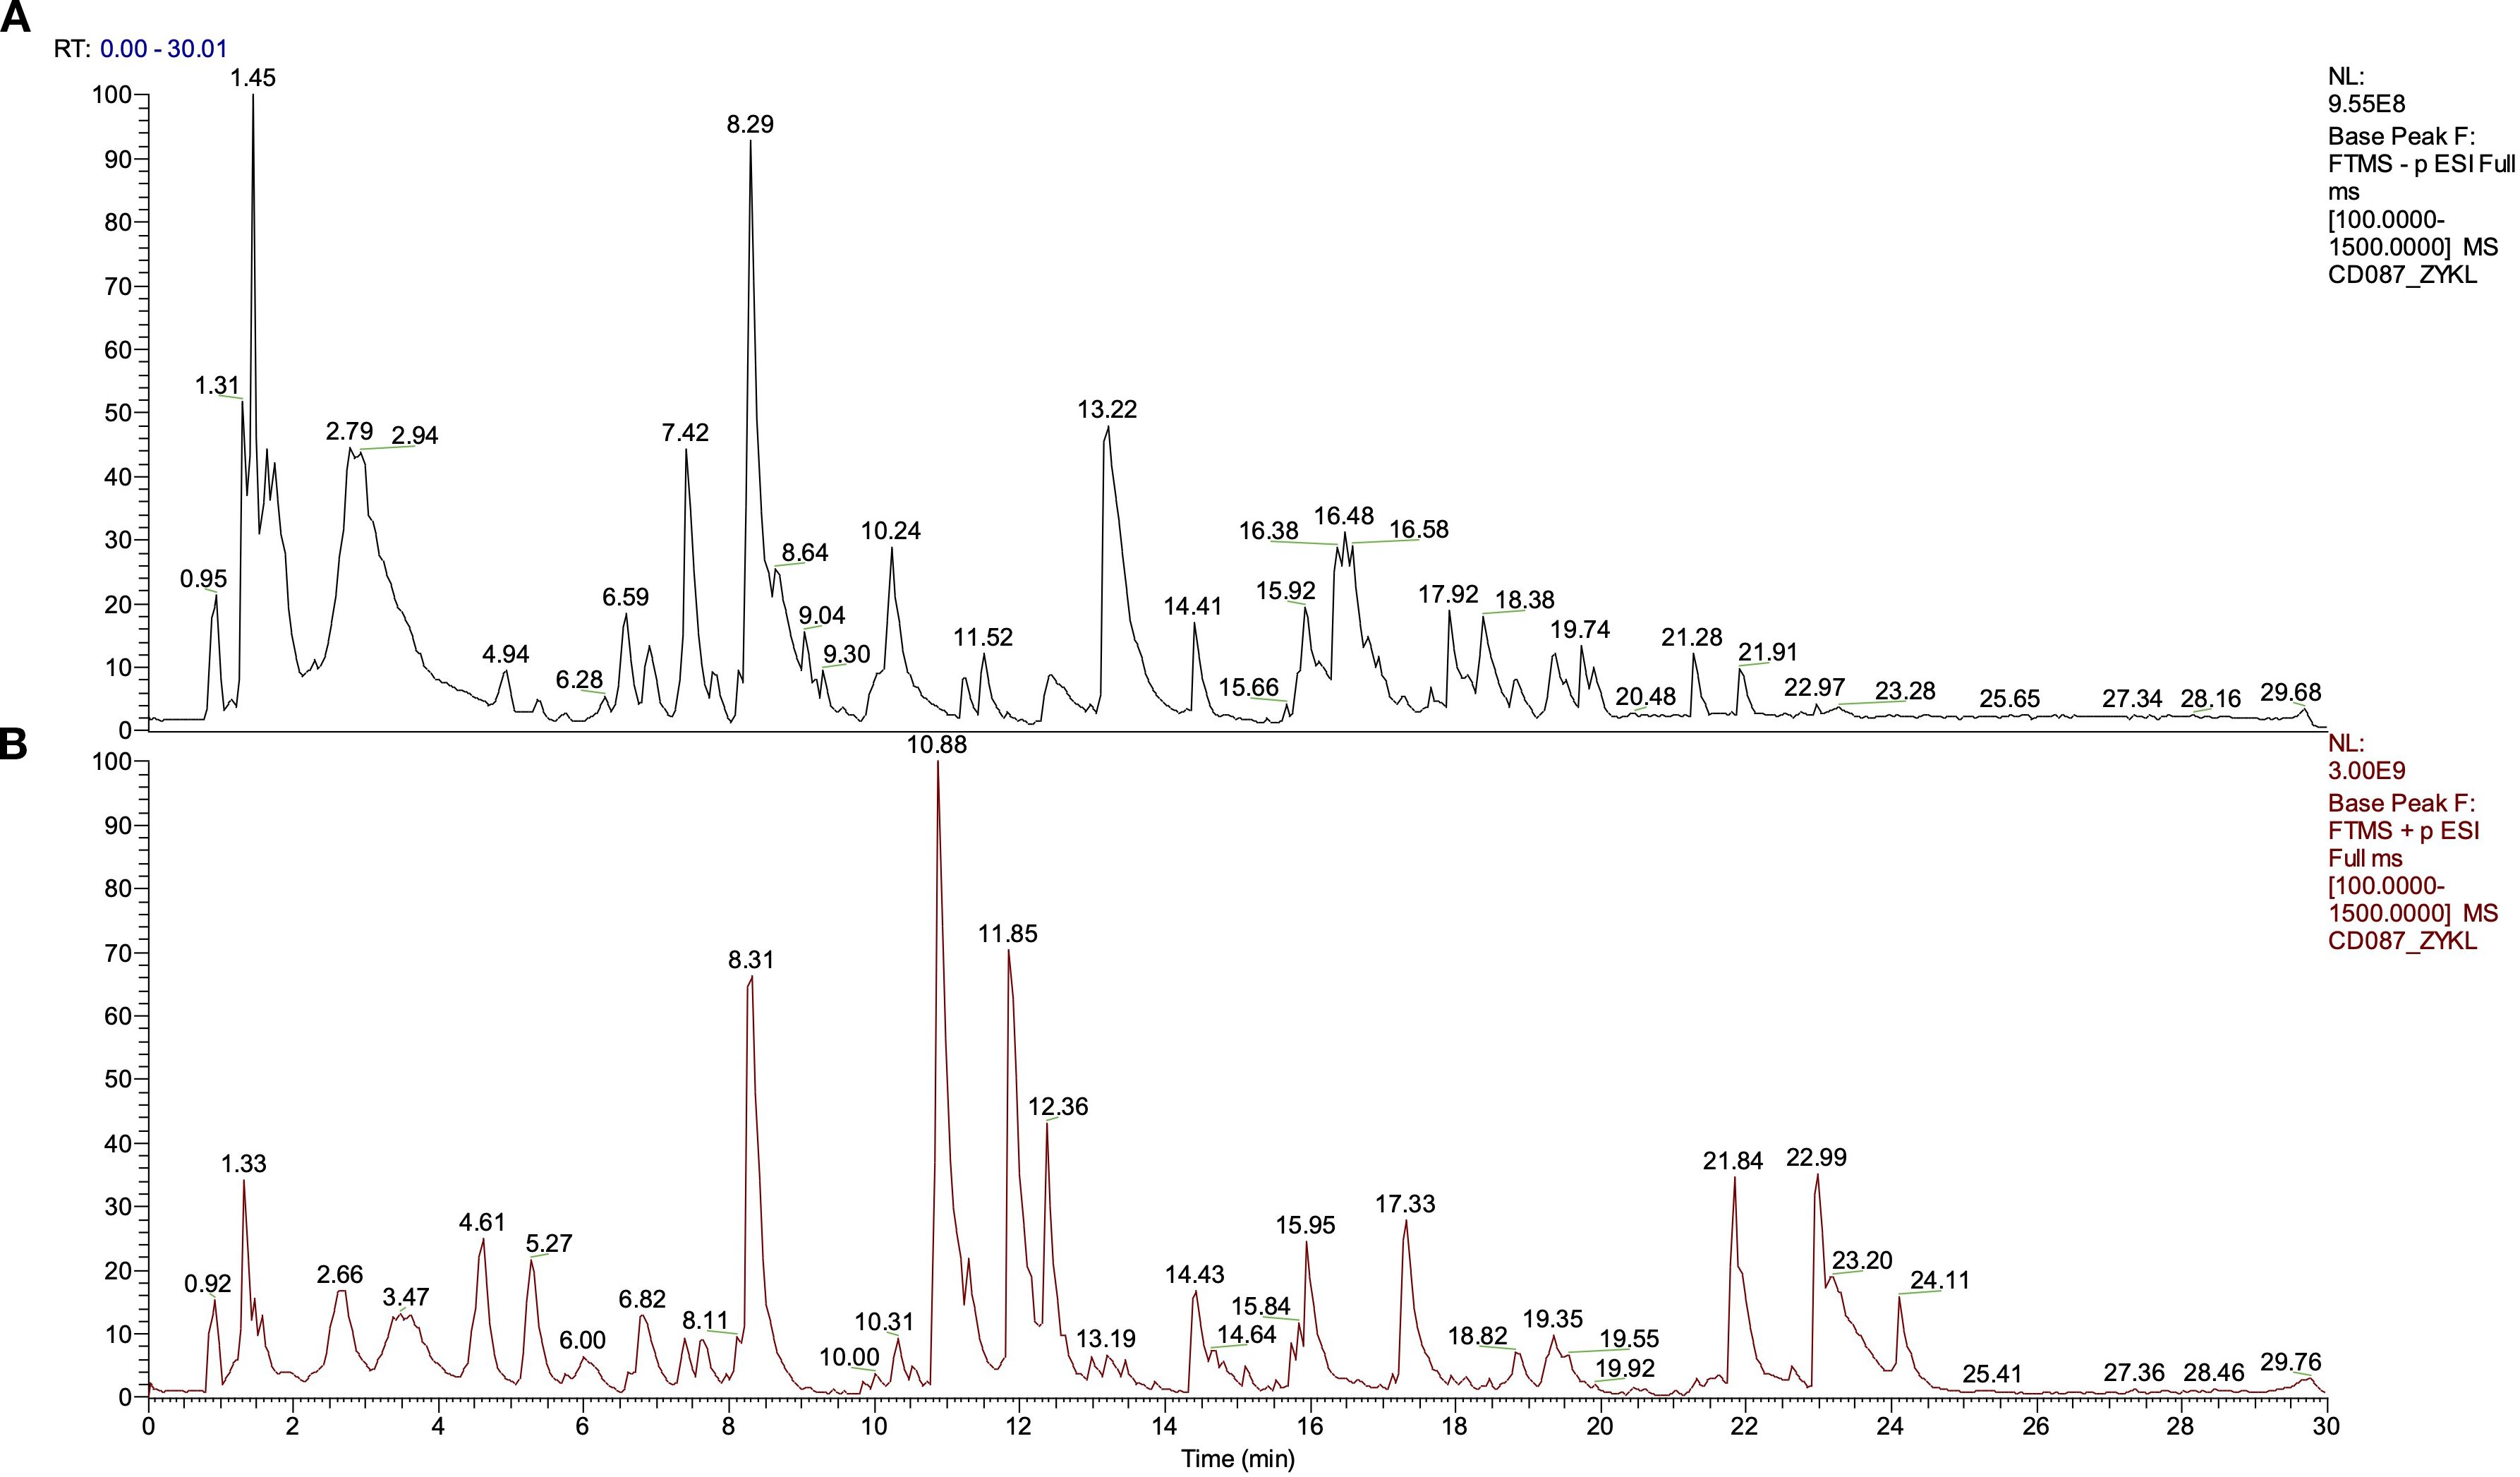
Figure 2. Total ion current diagram in positive and negative modes of Yiai Fengzheng decoction (YFD). (A) Negative ion mode of YFD. (B) Positive ion mode of YFD.
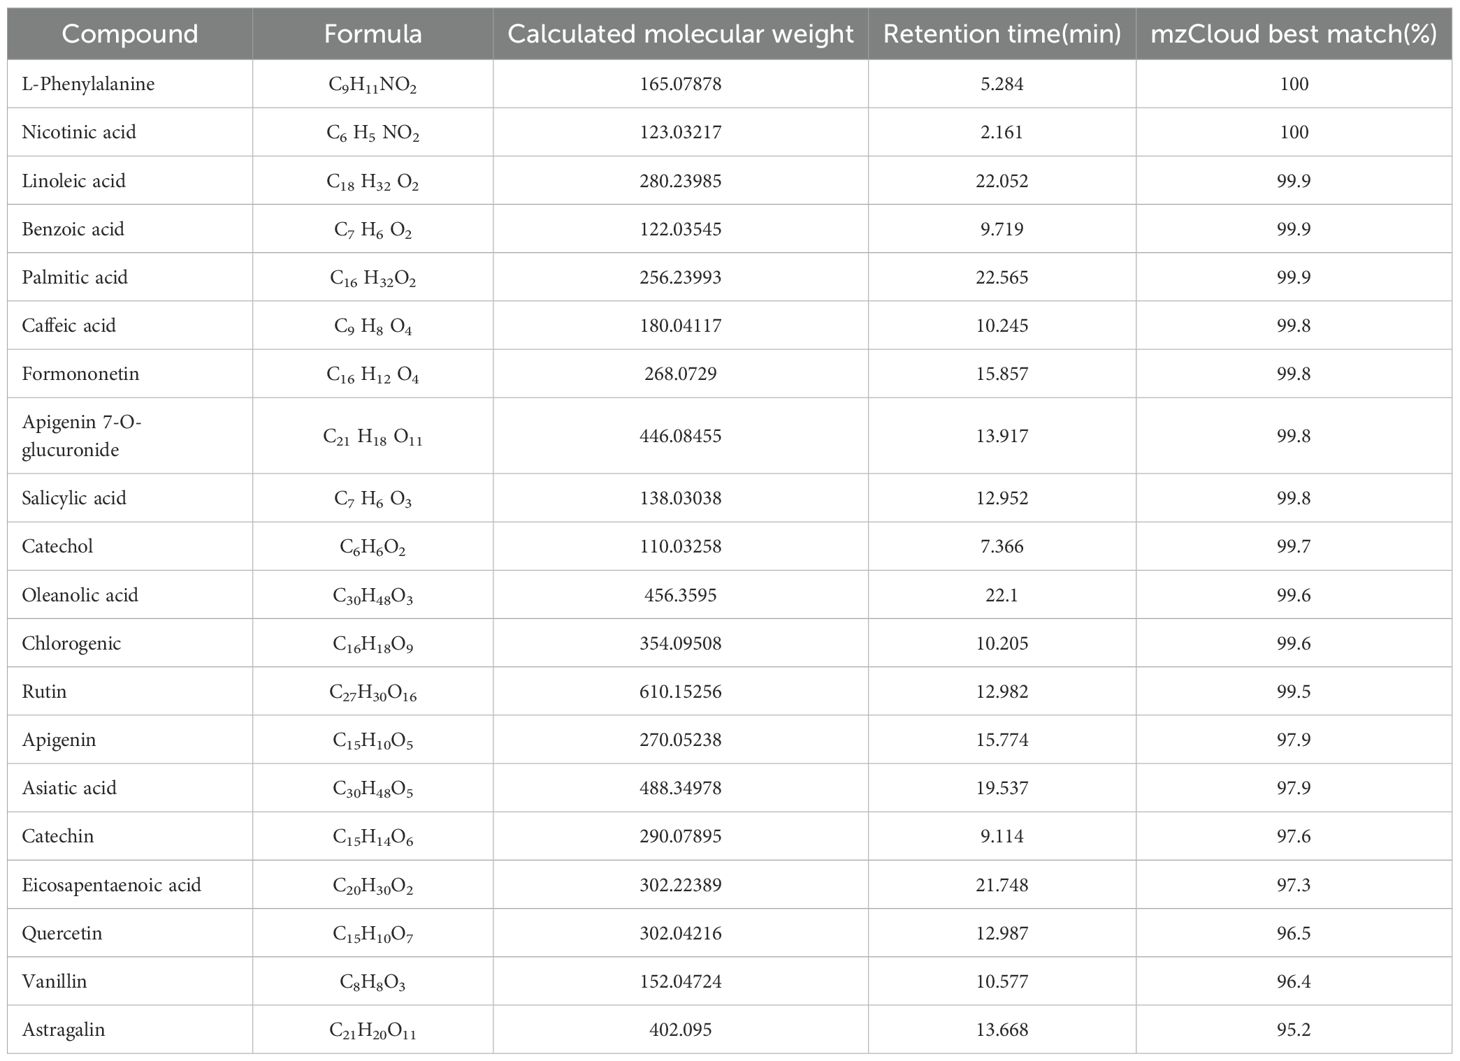
Table 3. Top 20 components of YFD.
YFD inhibited breast tumor growth and metastasis in vivo
A flowchart of the experiment is shown in Figure 3A. Tumor-bearing mice were orally administered YFD or saline once daily for two weeks, beginning in the second week after 4T1 breast cancer cells were inoculated. The body weights of the mice and the increase in tumor volume were measured every three days. During the treatment period, there was little significant variation in body weight among the groups (Figure 3C). Furthermore, the results from dynamic monitoring (Figures 3B, D) and microPET scanning (Figures 4A, C, D) revealed that YFD administration suppressed tumor development in a dose-dependent manner, with high-dose YFD treatment inhibiting tumor growth more than low-dose YFD treatment did. To assess the effects of YFD treatment on metastasis, immunohistochemistry was used to measure the levels of tumor metastasis-associated markers, including ki67, N-cadherin, and vimentin, in tumor tissues. The results showed that high-dose YFD therapy considerably decreased Ki67 and N-cadherin expression levels (Figures 3H, I) but had little effect on vimentin levels (Figures 3J). Furthermore, HE staining (Figures 3E-G) and microPET scanning (Figures 4B, E, F) revealed that YFD treatment reduced the number of metastatic lesions in the lungs. These findings strongly indicate that YFD inhibits breast tumor growth and lung metastasis.
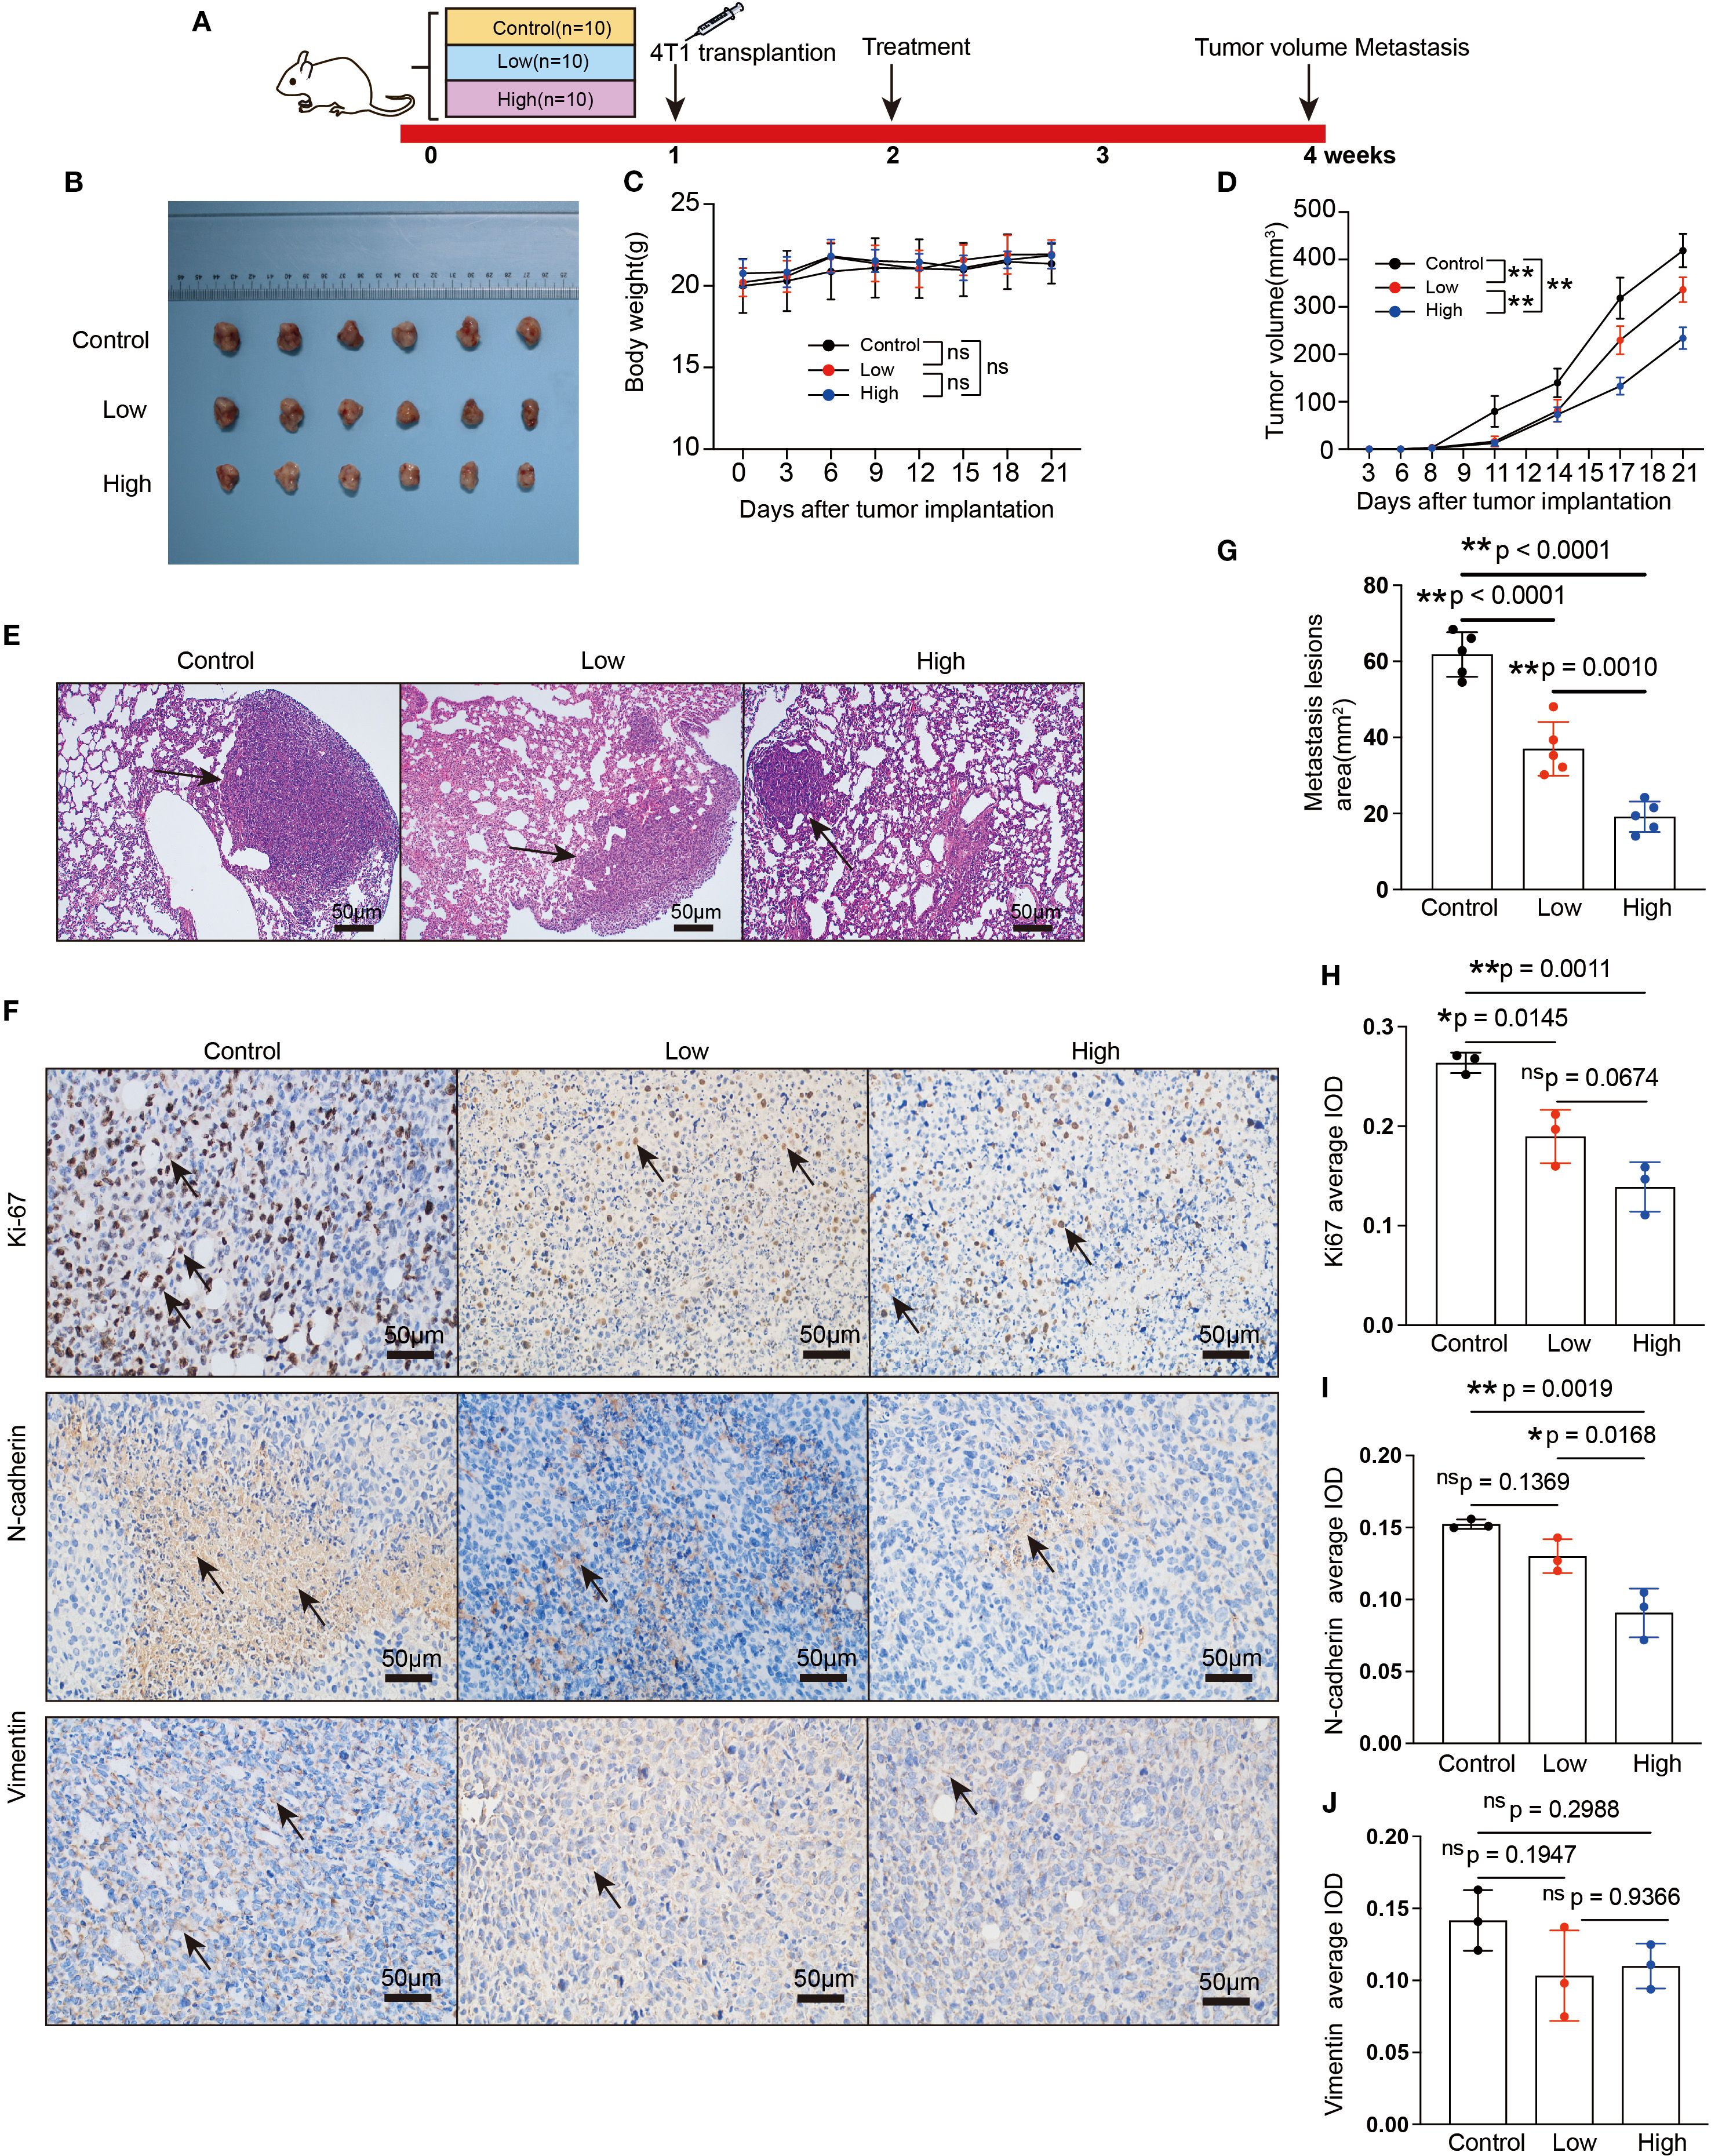
Figure 3. YFD inhibited breast cancer growth and metastasis in vivo. (A) Schematic flowchart of the experiment. The mice in the low- and high-dose groups received YFD orally once daily for 2 successive weeks, whereas the mice in the control group received saline. (B) Dissociated tumor tissues from each group. (C, D) Body weight changes and tumor growth curves (n=10). Weight and tumor growth were measured every 3 days. (E) Representative HE-stained images of lung sections from each group. The black arrows indicate metastatic lesions. (F) Representative immunohistochemistry images of Ki67, N-cadherin, and vimentin in tumor tissues. (G) Comparison of metastatic lesion areas in lung sections. (H-J) Expression levels of Ki67, N-cadherin, and vimentin in tumor tissues from each group. The data are expressed as the means ± SDs (n=3 for each group). *p< 0.05, **p< 0.01, nsp>0.05 compared with the intended group by ANOVA followed by Dunnett’s t post hoc test.
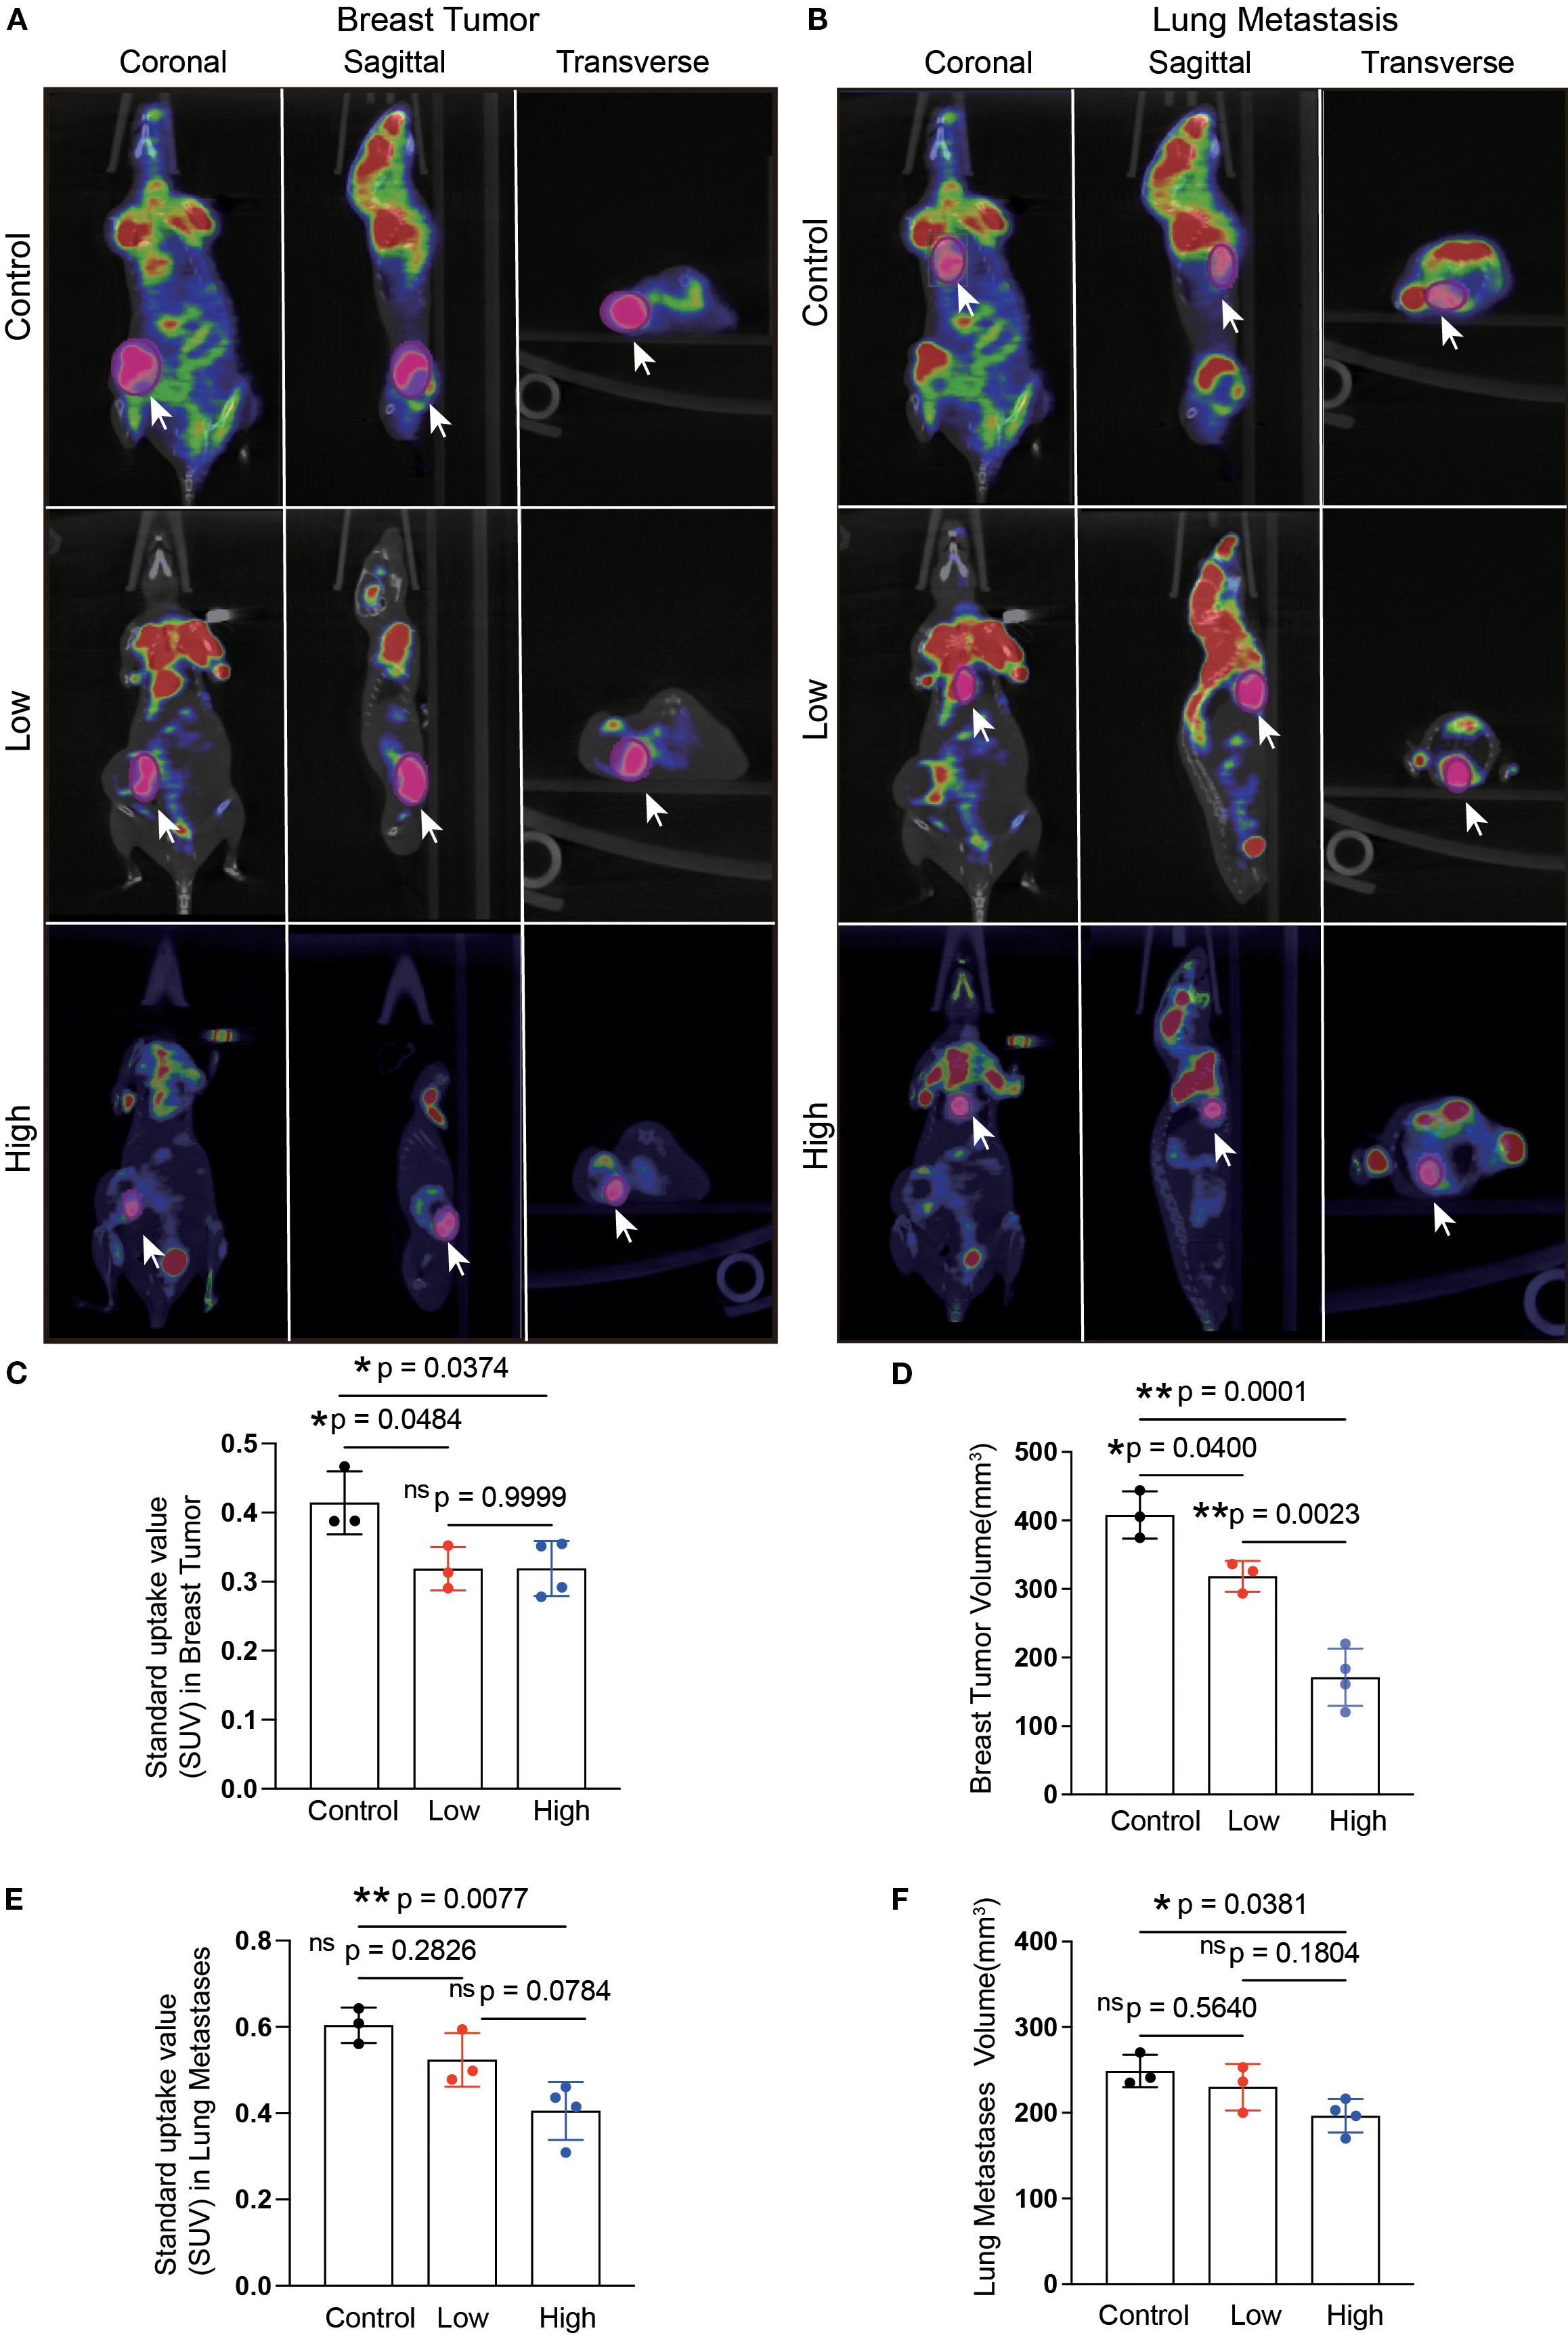
Figure 4. Microposition emission tomography (microPET) scanning after YFD treatment. (A, B) Representative microPET images of the breast tumors and lungs from each group. MicroPET scanning was used to evaluate the effects of YFD on tumor growth and lung metastasis. (C, D) Comparison of the calculated SUVs and breast tumor volumes among the groups. (E, F) Comparison of the calculated SUVs and lung metastasis volumes among the groups. The data are presented as the means ± SDs (n=3). *p< 0.05, **p< 0.01, nsp>0.05 compared with the intended group by ANOVA followed by Dunnett’s t post hoc test. *p< 0.05, **p< 0.01, nsp>0.05 compared with the intended group by ANOVA followed by Dunnett’s t post hoc test. SUV, standardized uptake value.
YFD reshaped the tumor immune microenvironment in breast cancer
Flow cytometry and immunofluorescence were used to examine the primary tumor-inhibiting and tumor-promoting leukocytes, respectively, to observe changes in the immunogenic microenvironment of TNBC mice. The results revealed that the ratio of CD3+ T cells in the peripheral blood increased (Figure 5A), but there were no statistically significant differences between the YFD-treated groups in terms of CD4+ and CD8+ T cells (Figures 5B, D). In contrast, the fractions of CD3+ and CD4+ T cells and CD8+ T cells in the spleen increased only with high-dose YFD treatment (Figures 5C, E), indicating that high-dose YFD increased the antitumor immune reaction.
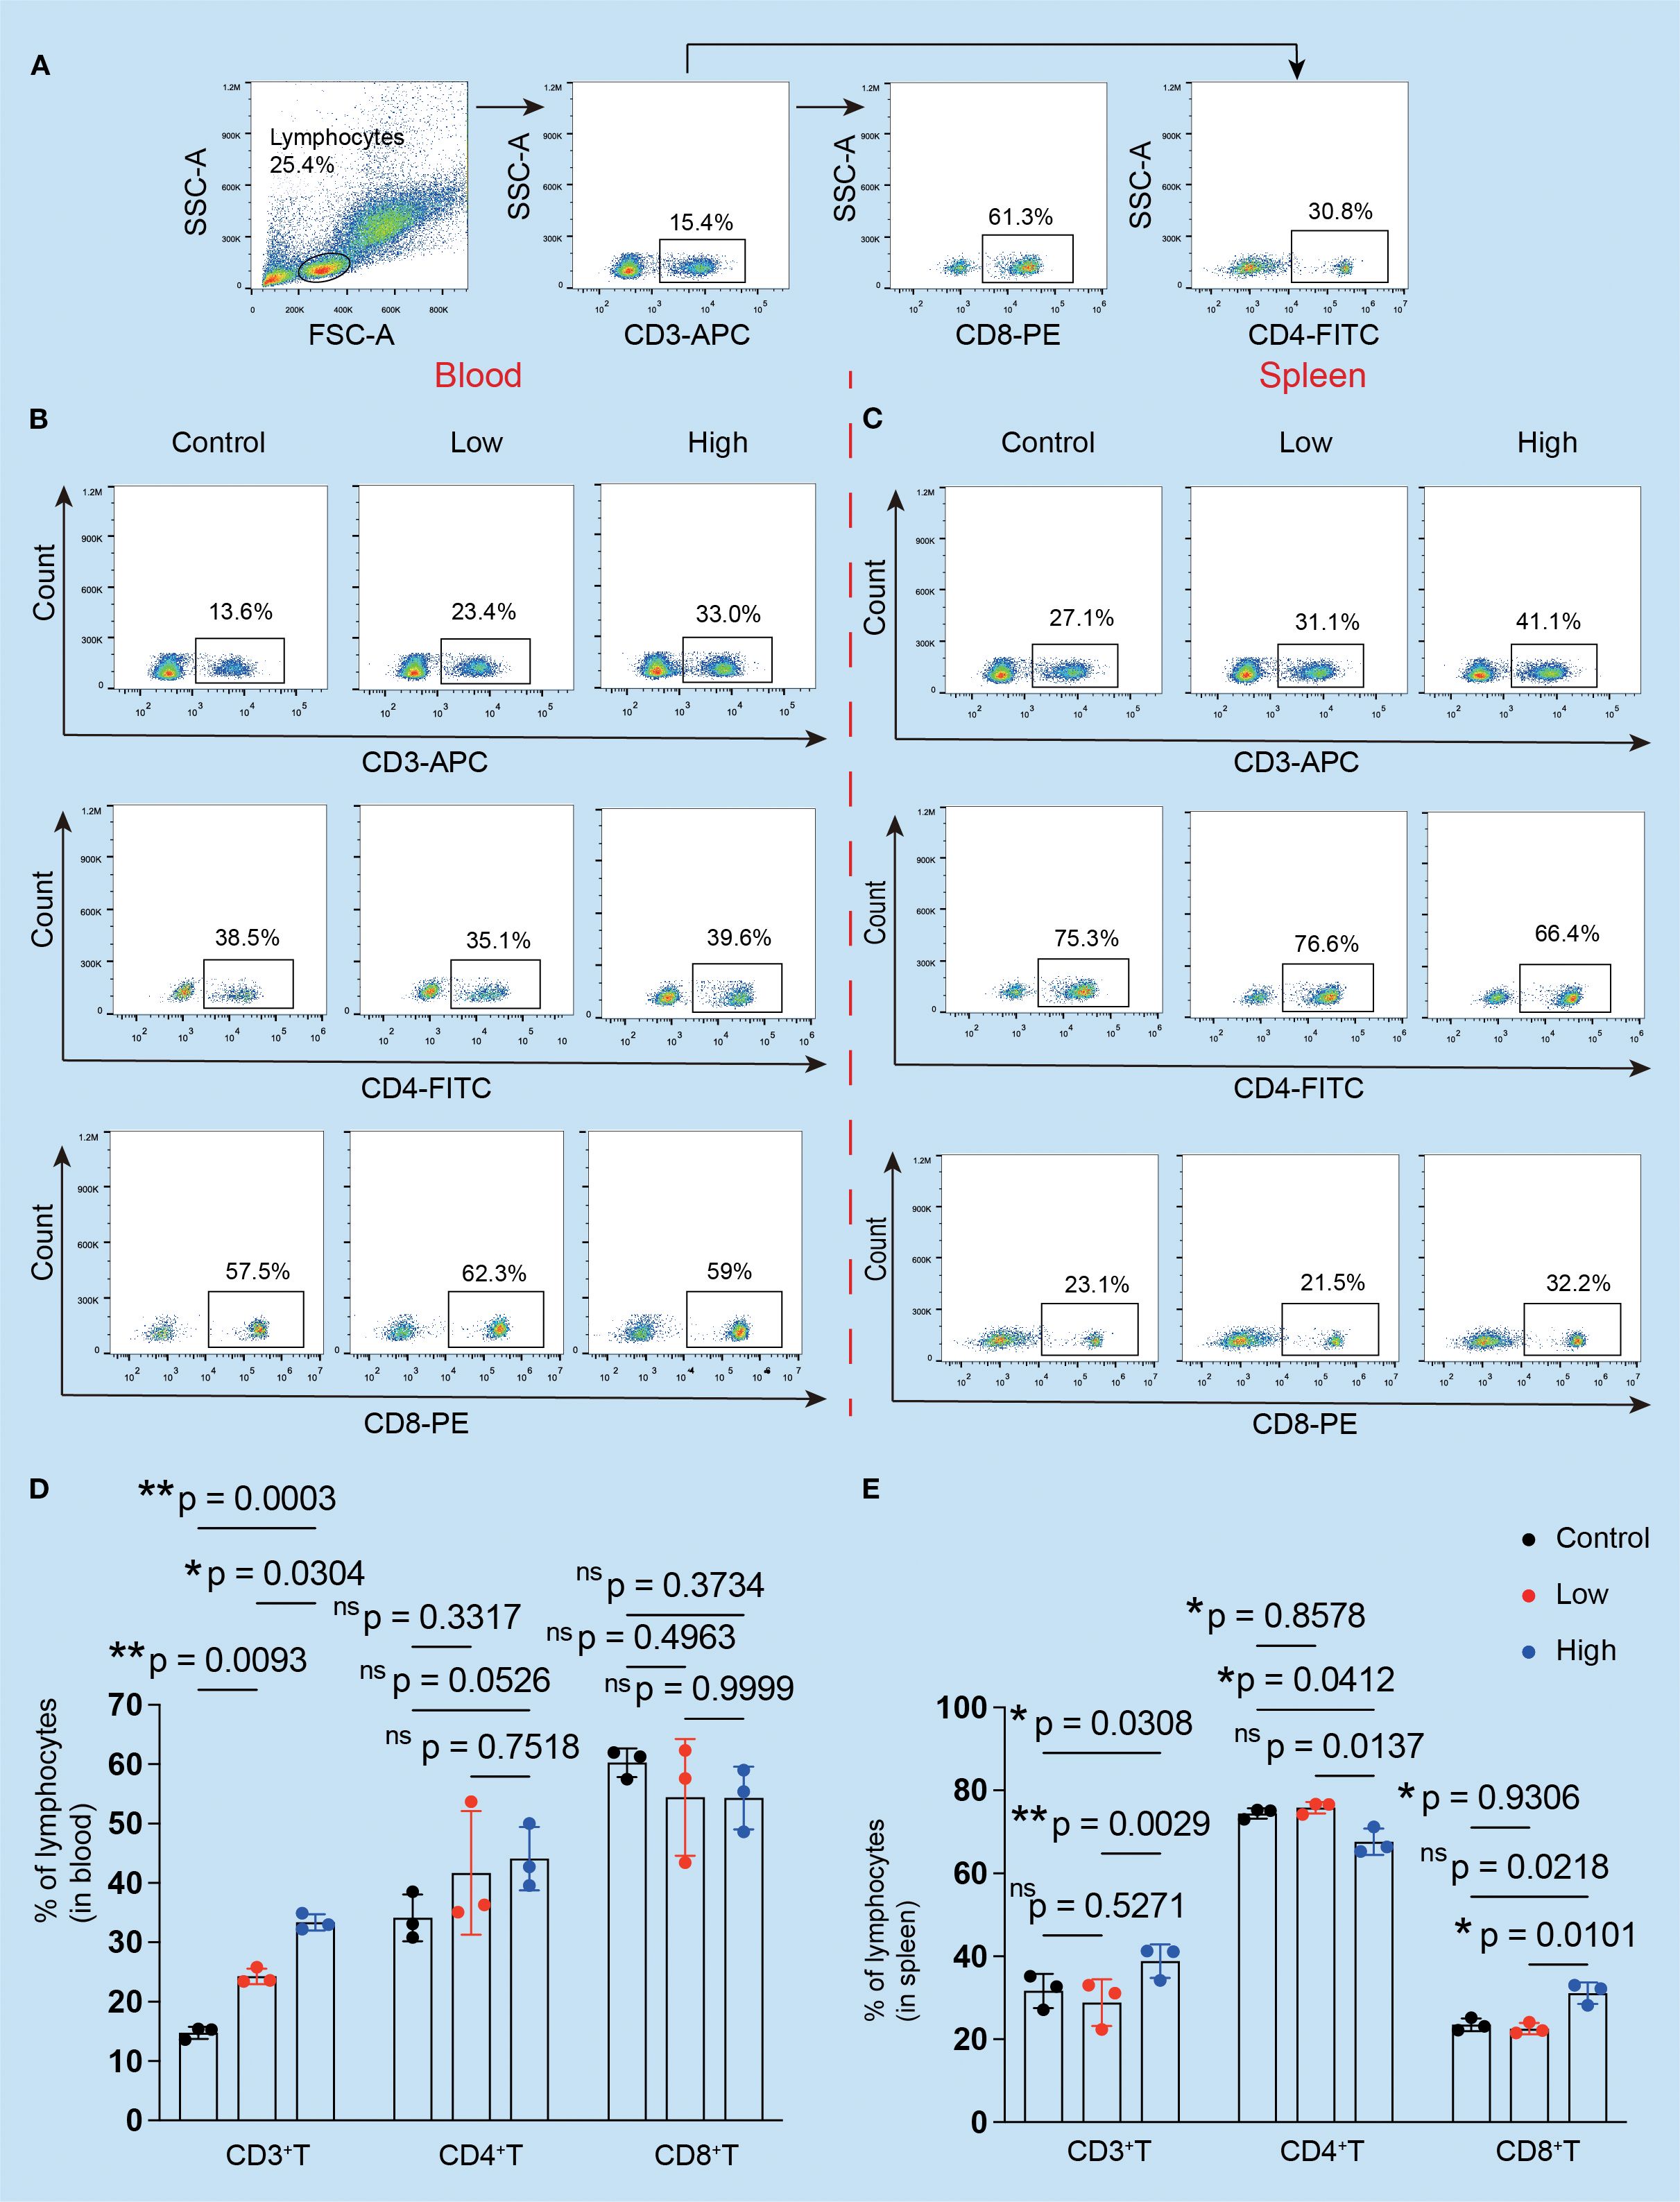
Figure 5. Effects of YFD treatment on the proportions of CD3+, CD4+, and CD8+ T cells. (A) The gating strategy. The peripheral serum and spleen tissues were subjected to flow cytometry analysis. (B, C) CD3+, CD4+, and CD8+ T cells in the blood and spleen were analyzed via flow cytometry. (D, E) Comparison of the proportions of CD3+, CD4+, and CD8+ T cells in the blood and spleen in each group (n=3 for each group). *p< 0.05, **p< 0.01, nsp>0.05 compared with the intended group by ANOVA followed by Dunnett’s t post hoc test.
It is commonly acknowledged that MDSCs and TAMs predominate within the immunosuppressive TME (9). High-dose YFD therapy consistently increased the proportion of CD3+ T cells (Figures 6B, E) and dramatically decreased the proportions of TAMs (CD11b+F4/80+) (Figures 6A, D) and polymorphonuclear MDSCs (CD11b+Ly6G+; a crucial MDSC subtype) (Figures 6C, F). Collectively, our results suggest that YFD can create a tumor-inhibiting immunogenic milieu in the TME by significantly increasing the number of T cells and reducing the number of TAMs and MDSCs. High-dose YFD treatment had greater tumor-inhibiting effects than did low-dose YFD treatment.
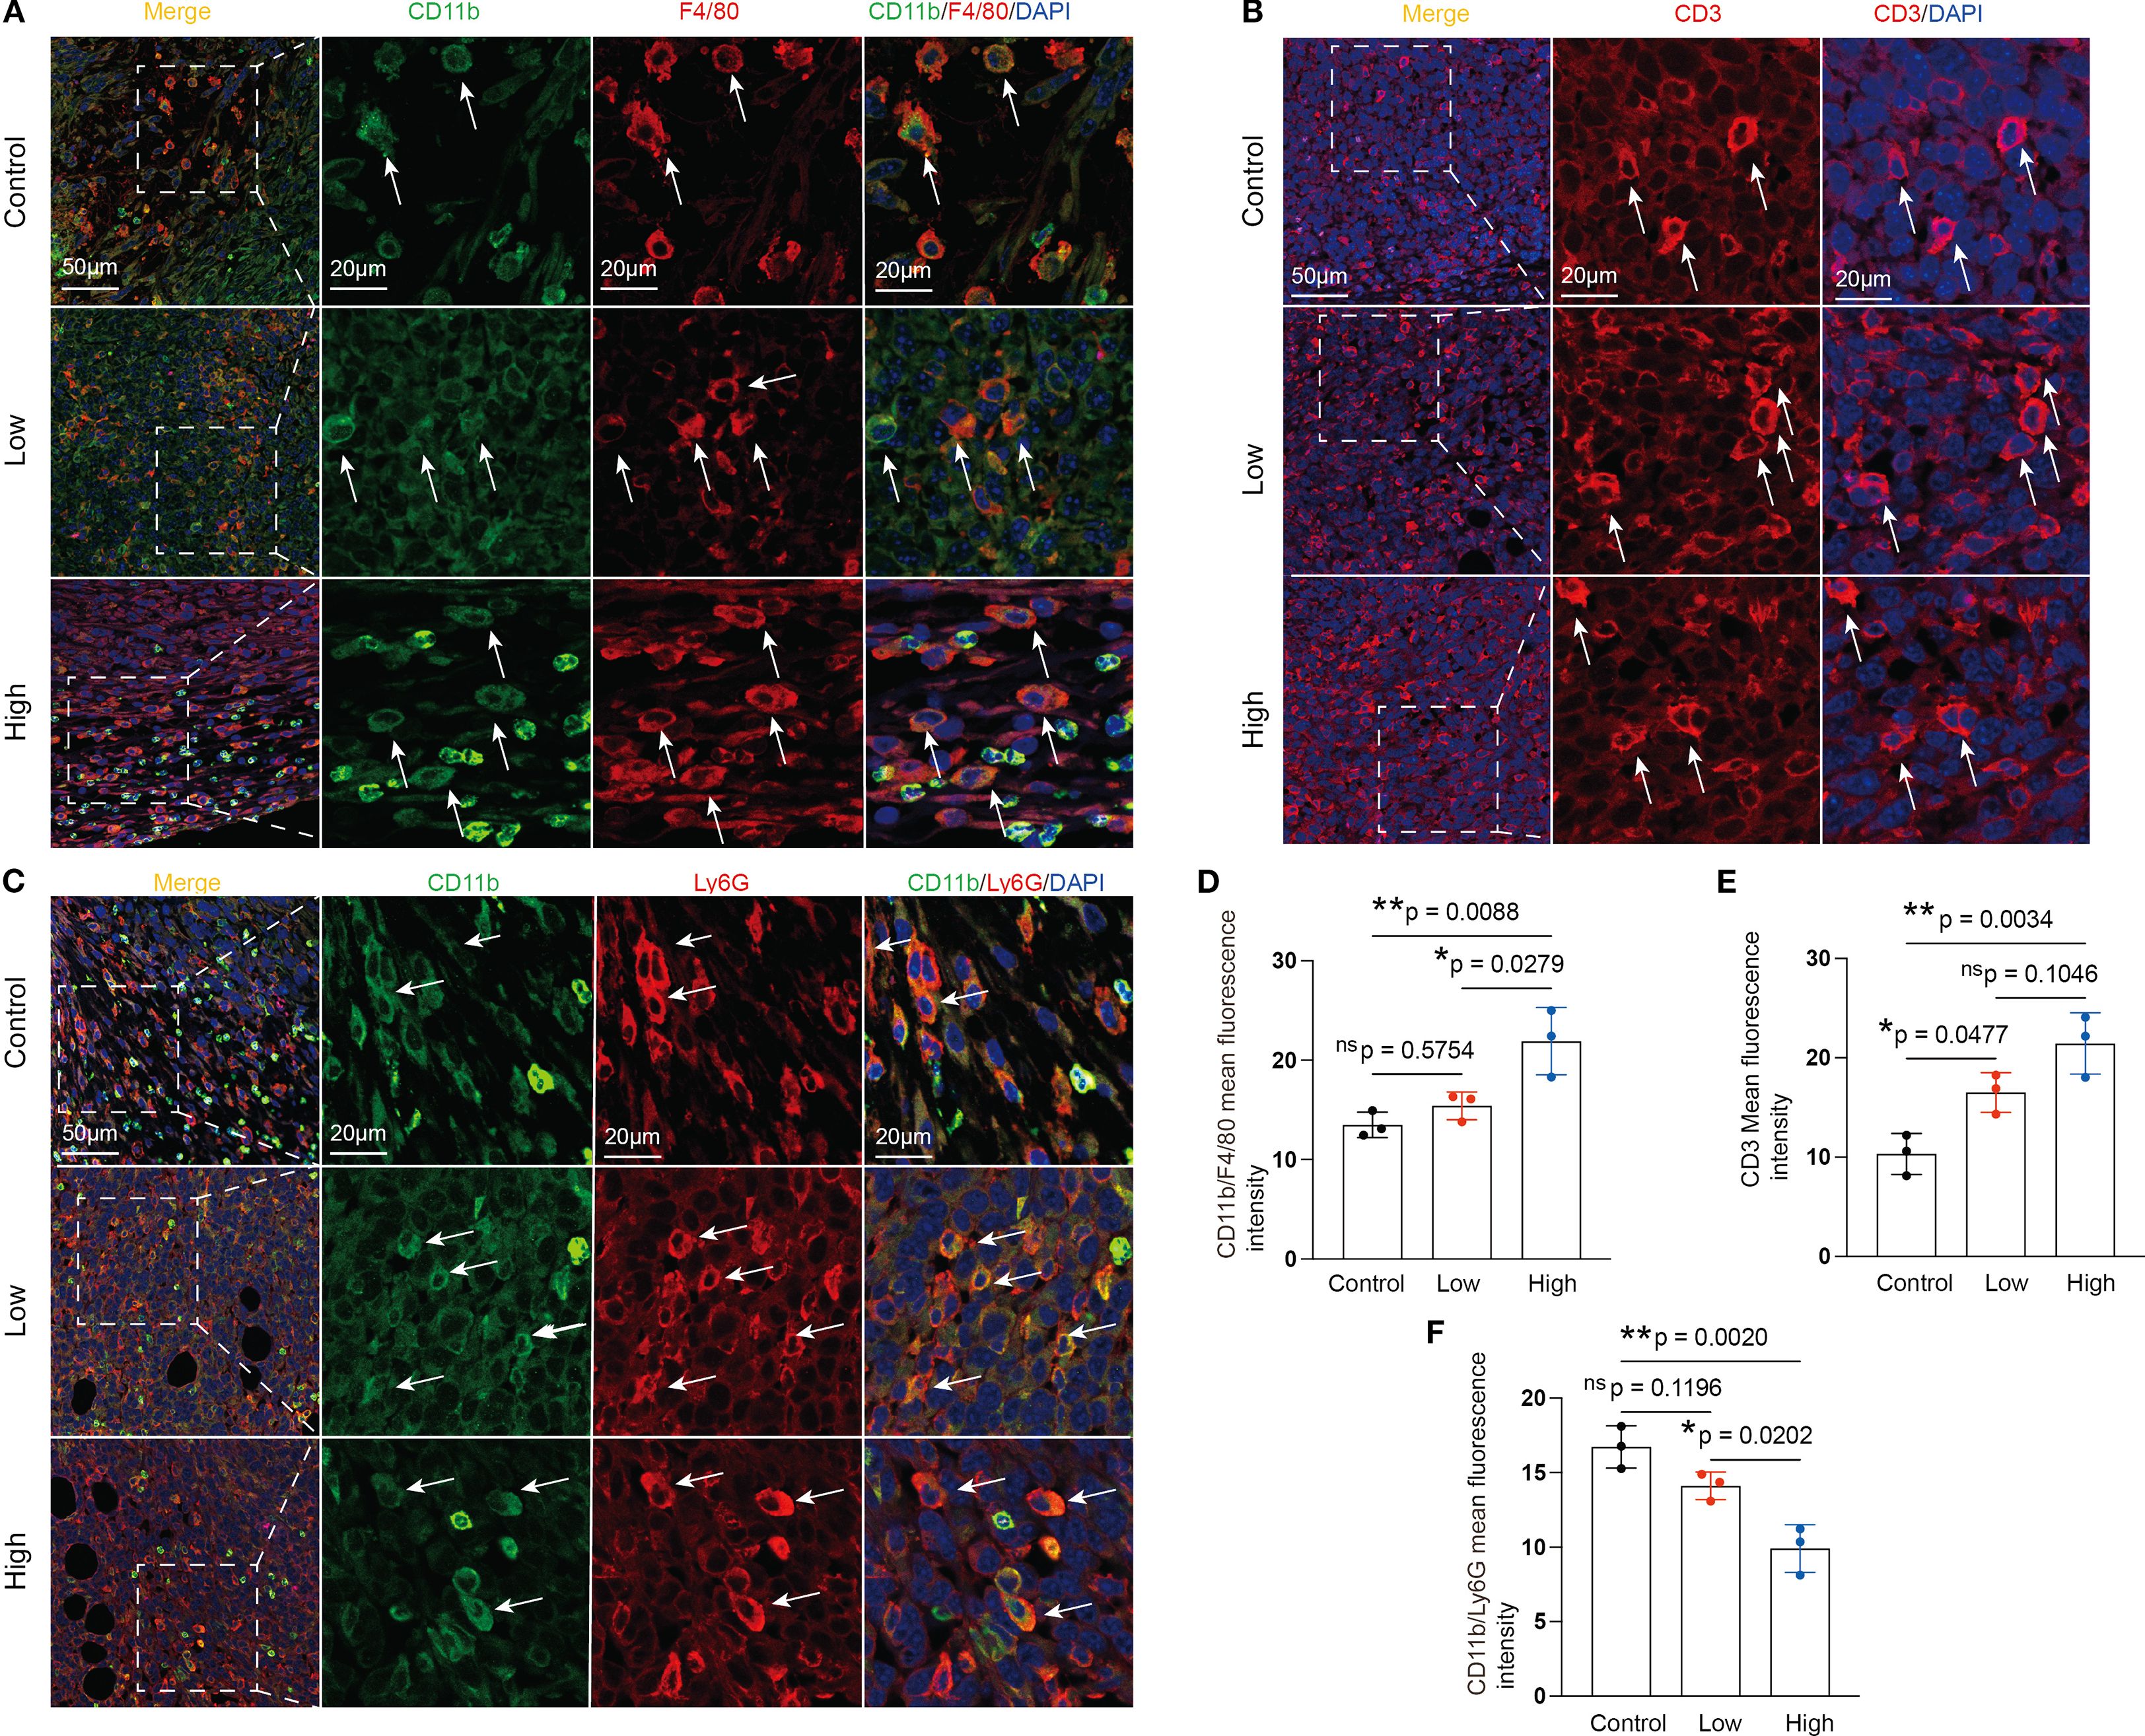
Figure 6. Effects of YFD treatment on tumor-associated macrophages (TAMs), myeloid-derived suppressor cells (MDSCs), and CD3+ T cells. (A-C) Representative images of IF-stained TAMs, CD3+ T cells, and MDSCs. TAMs were labeled with anti-F4/80 and anti-CD11b antibodies. MDSCs were labeled with anti-Ly6G and anti-CD11b antibodies. CD3+ T cells were labeled with an anti-CD3 antibody. (D-F) Immunofluorescence analysis of TAMs, CD3+ T cells, and MDSCs in tumor sections from each group. The data are presented as the means ± SDs (n=3). *p< 0.05, **p< 0.01, nsp>0.05 compared with the intended group by ANOVA followed by Dunnett’s t post hoc test.
YFD regulated tumor metabolomic profiling in the breast cancer mouse model
We utilized a metabolomic approach to study the changes in metabolites in the breast tumor tissues of mice, and multivariate analysis was combined with PCA and OPLS-DA to identify potential biomarkers. The representative GC-TOF/MS chromatograms and detailed spectral data for metabolite identification are provided in Supplementary File 2. The PCA score plots displayed in Figure 7A show the overall differences among the groups (control vs. low, control vs. high, and low vs. high). A score plot with aggregated quality control samples indicates good quality control and a stable detection process. Next, we performed OPLS-DA to maximize the covariance among the data to distinguish the metabolites between the groups. As shown in Figure 7B, each comparison had good prediction ability, with high R2Y and Q2 values. In the OPLS-DA model, the parameters were as follows: control vs. low, R2Y=0.887, Q2=-0.423; control vs. high, R2Y=0.911, Q2 = 0.439; and low vs. high, R2Y=0.888, Q2 = 0.334. The separation differences were substantial between the control vs. low, control vs. high, and low vs. high groups, indicating that YFD treatment had a significant effect on the metabolites. A volcano plot combining the strengths of both the variable contributions (variable importance in projection, VIP) and variable reliability (correlation coefficients (Figure 7C), Corr. coefficients) was used to screen for potential biomarkers. In this analysis, the threshold values for identifying different metabolites were set at p< 0.05 and |log2FC| ≥0.
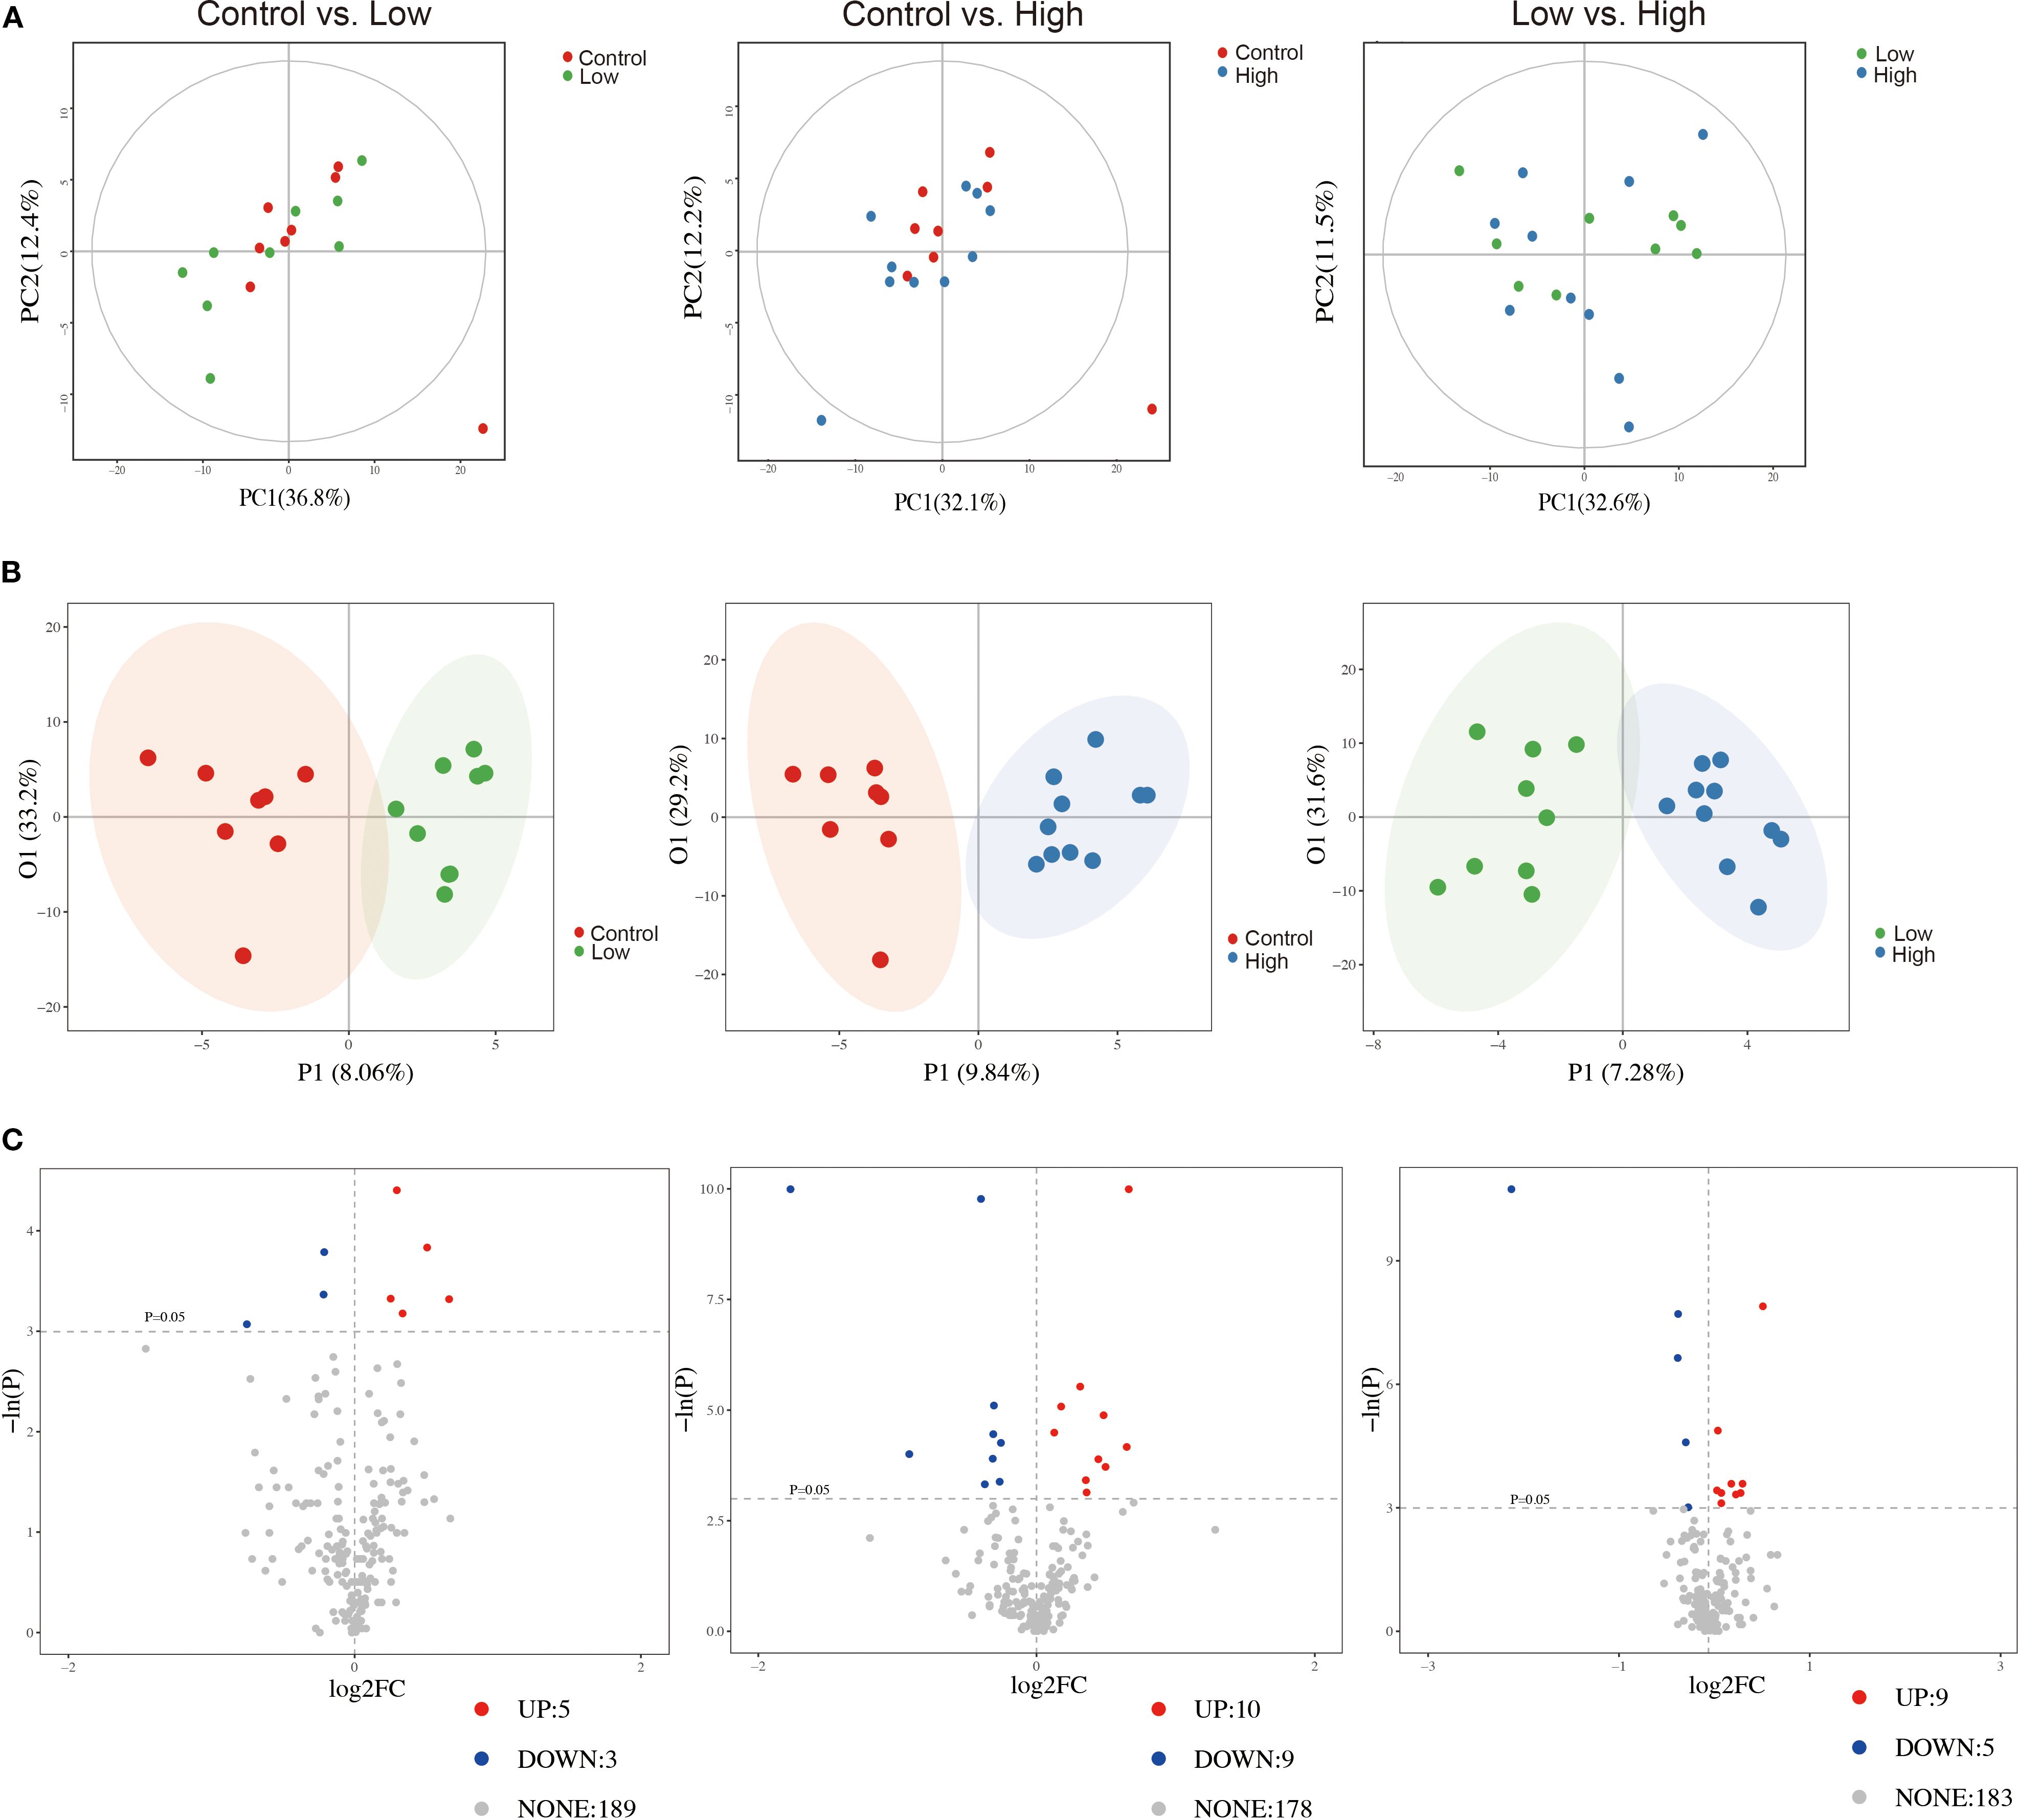
Figure 7. Comparisons of principal component analysis (PCA) score plots, orthogonal projections to latent structure-discriminant analysis (OPLS-DA) score plots, and volcano plots of metabolic profiles among the groups. (A) PCA score plots for the control group vs. low-dose group, control group vs. high-dose group, and low-dose group vs. high-dose group. (B) OPLS-DA score plots for the control group vs. low-dose group, control group vs. high-dose group, and low-dose group vs. high-dose group. (C) Volcano plots for the control group vs. the low-dose group, the control group vs. the high-dose group, and the low-dose group vs. the high-dose group.
According to the selection threshold, the low-dose YFD group presented five upregulated and three downregulated metabolites compared with the control group (Figure 8A), the majority of which fell within the categories of amides (oleamide), amino acids (kynurenine and methylcysteine), carbohydrates (ribitol and mannose), lactones (dehydroascorbic acid), nucleotides (thymidine), and organic acids (phosphoglycolic acid). Compared with those in the control group, ten upregulated and nine downregulated metabolites were detected in the high-dose YFD group, with the majority being amines (urea and melamine), amino acids (alanine, methylcysteine, aminoadipic acid, phosphoserine, and cystine), carbohydrates (dihydroxyacetone, xylitol, and ribitol), eicosanoids (prostaglandin E2), lactones (erythrono-1,4-lactone), nucleotides (7-methylxanthine and pseudouridine), and organic acids (3-hydroxybutyric acid, 2-hydroxyglutaric acid, citric acid, and 4-hydroxybutyric acid) (Figure 8B). Compared with the low-dose YFD group, the high-dose YFD group presented nine upregulated and five downregulated metabolites (Figure 8C). These metabolites include amines (urea, 3-amino-2-piperidone, and spermine), amino acids (alanine, proline, and aminomalonic acid), carbohydrates (xylitol and sucrose), fatty acids (pelargonic acid), lactones (erythrono-1,4-lactone), nucleotides (pseudouridine), and organic acids (3-hydroxybutyric acid, malic acid, and 2-hydroxyglutaric acid). Interestingly, as shown in Figures 8A, B, D, both low- and high-dose YFD increased the amount of ribitol and lowered the level of methylcysteine.
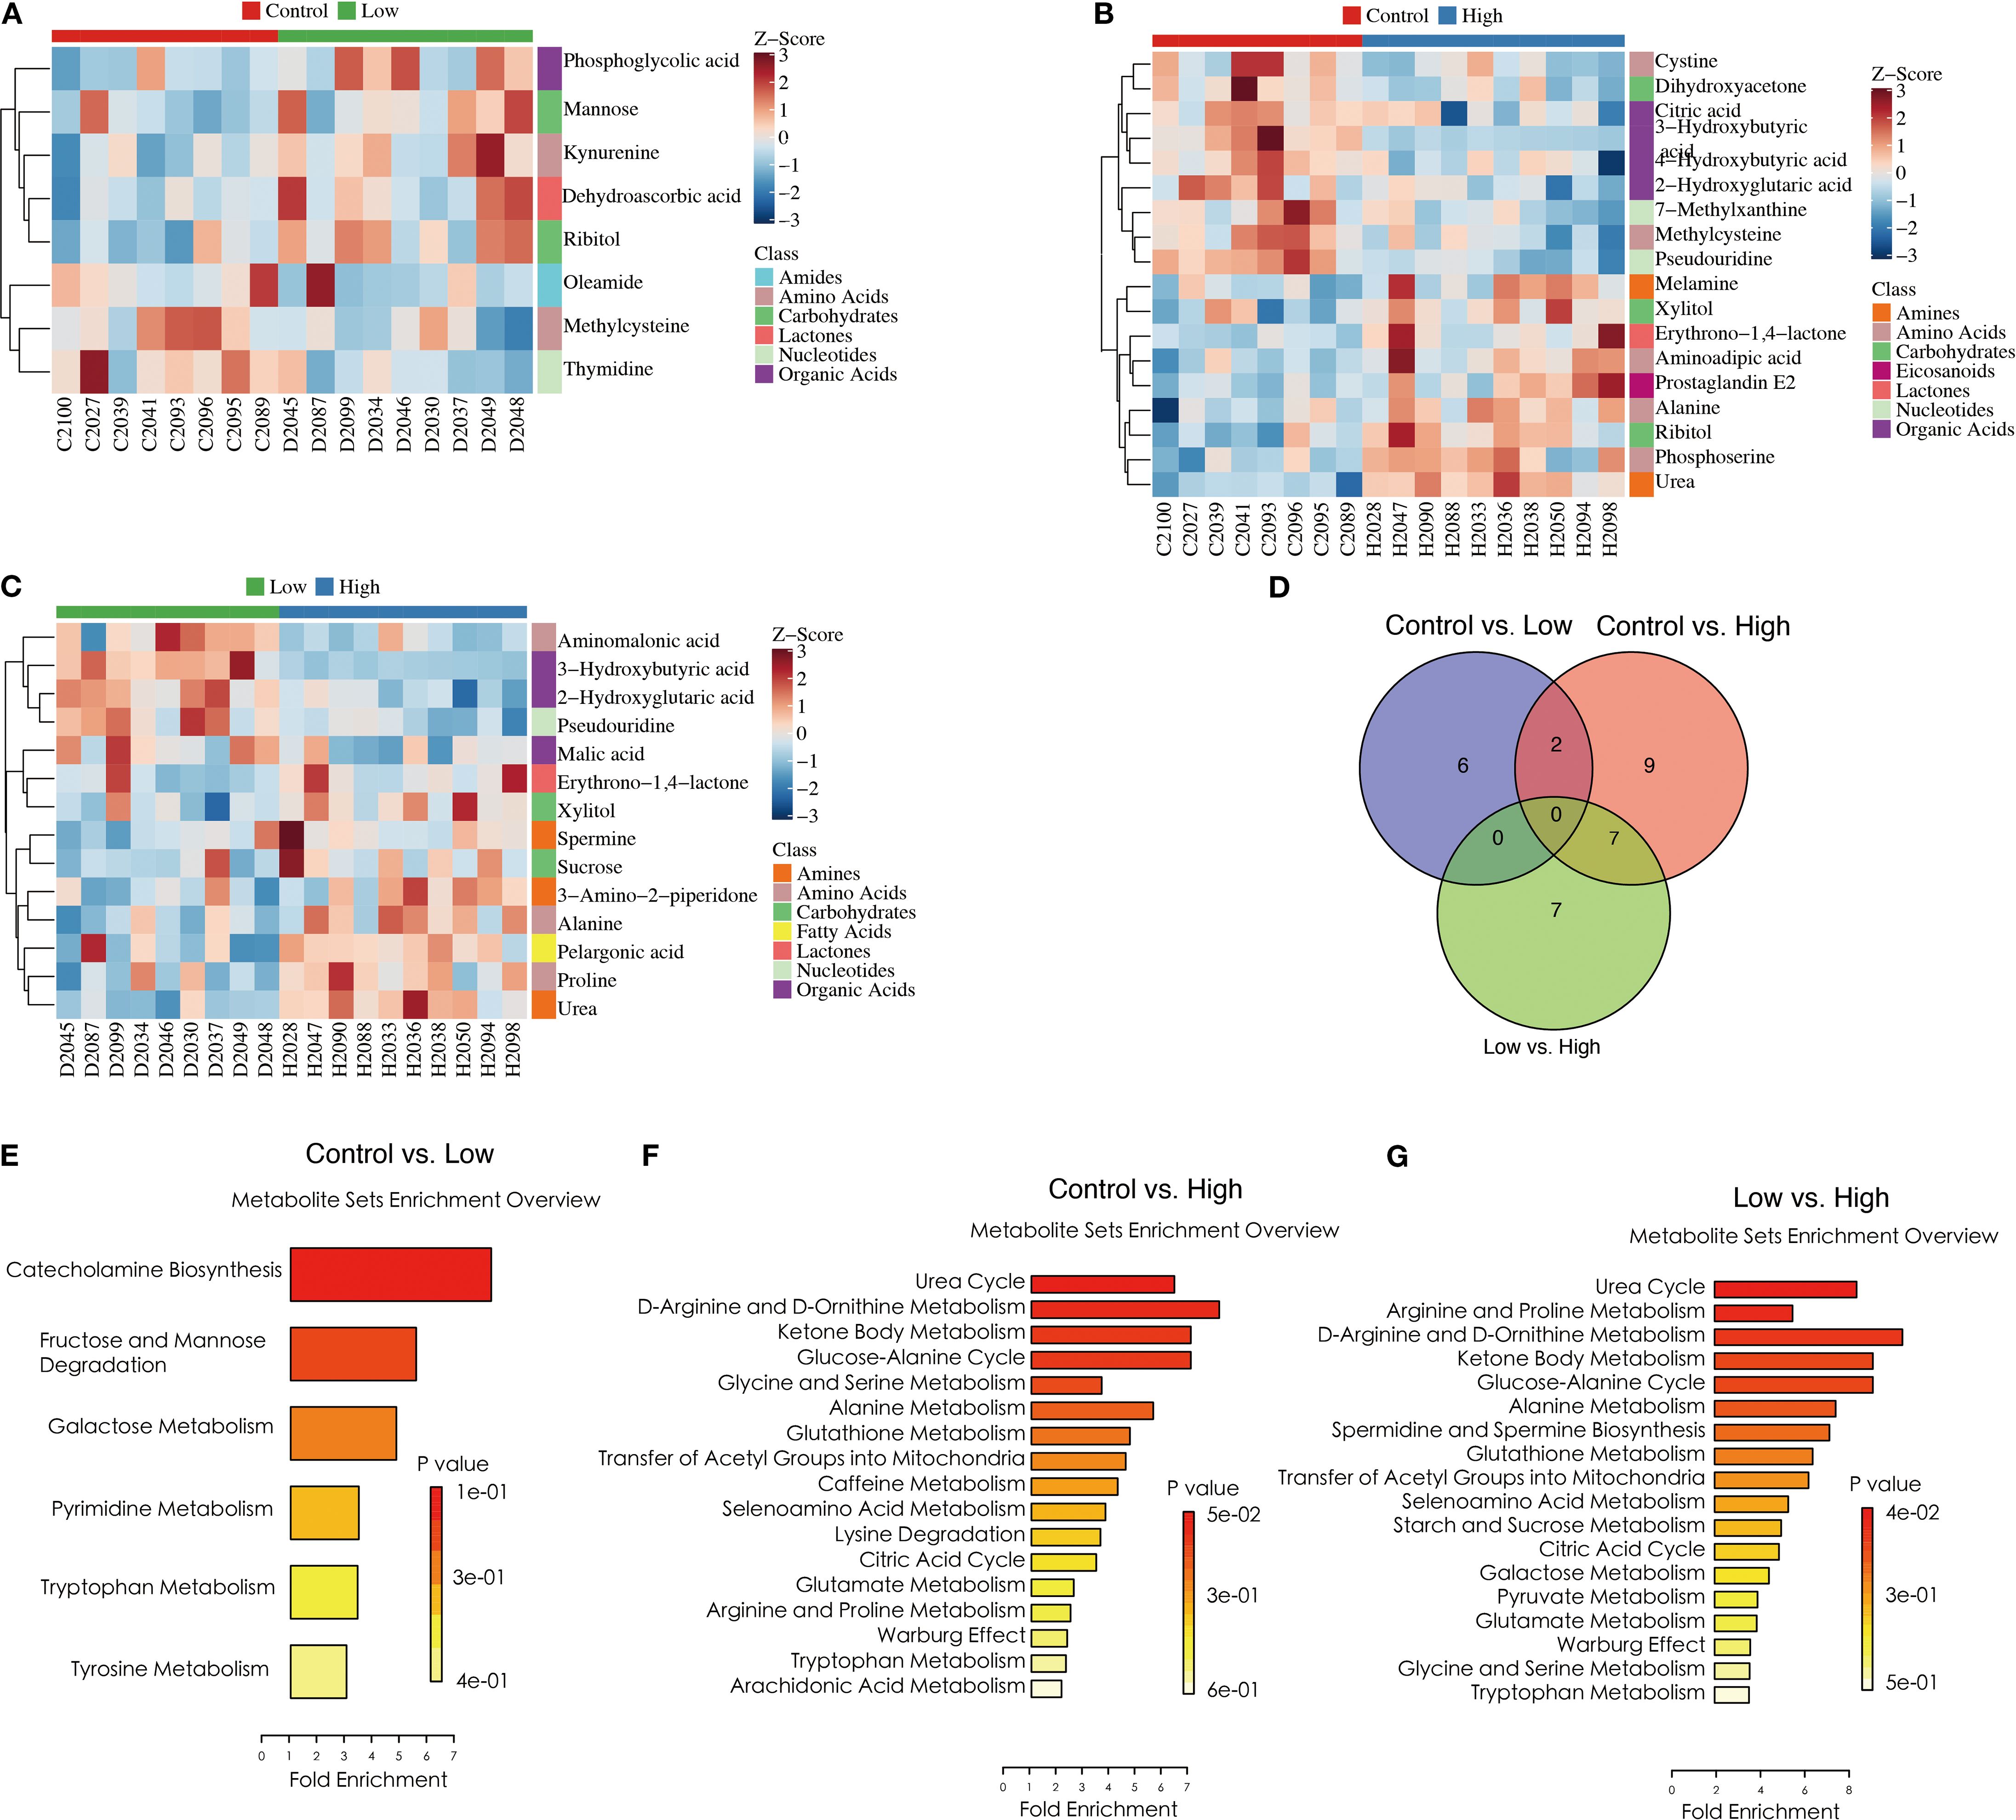
Figure 8. YFD-induced changes in metabolic profiles in a mouse model of breast cancer. (A-C) Heatmaps of potential biomarkers for each comparison, including the control group vs. the low-dose group, the control group vs. the high-dose group, and the low-dose group vs. the high-dose group. (D) Venn diagram of differentially abundant metabolites between the control group and the low-dose group, between the control group and the high-dose group, and between the low-dose group and the high-dose group. (E-G) Metabolite set enrichment in the control group vs. low-dose group, control group vs. high-dose group, and low-dose group vs. high-dose group.
Pathway enrichment analysis was performed on the identified differentially abundant metabolites via the pathway-associated metabolite set (SMPDB) database. Our results revealed that catecholamine biosynthesis; fructose and mannose degradation; and galactose, pyrimidine, tryptophan, and tyrosine metabolism were the key metabolic pathways that differed between the control and low-dose YFD groups (Figure 8E). The main metabolic pathways included the urea cycle; D-arginine and D-ornithine metabolism; ketone bodies; the glucose–alanine cycle; glycine and serine metabolism; alanine metabolism; glutathione metabolism; the transfer of acetyl groups into the mitochondria; caffeine metabolism; selenoamino acid metabolism; lysine degradation; the citric acid cycle; glutamate metabolism; arginine and proline metabolism; the Warburg effect; and tryptophan metabolism (Figure 8F).
In contrast, the urea cycle, arginine and proline metabolism, D-arginine and D-ornithine metabolism, ketone body metabolism, the glucose–alanine cycle, alanine metabolism, spermidine and spermine biosynthesis, glutathione metabolism, transfer of acetyl groups into mitochondria, and caffeine metabolism were the metabolic pathways that differed between the low-dose and high-dose YFD groups (Figure 8G). This may partially explain why high-dose YFD had more potent antitumor effects than did low-dose YFD.
YFD regulated the tumor transcriptome in BC mice
To investigate the molecular mechanisms underlying the reshaping of the immunogenic BC microenvironment by YFD treatment, we conducted a transcriptome analysis of the tumor tissue. The quality control data are presented in Supplementary Table 1. The average raw reads of all the samples were 45885130, with a mean effective rate of 83.60%. The clean Q20 ratios of these samples ranged from 98.97% to 99.12%, with an average ratio of 99.06%, and the clean Q30 ratios ranged from 95.51% to 96.12%, with a mean ratio of 95.89%. These data suggested that the RNA-Seq data were precise and could be used for subsequent analyses.
In this study, edge R was used to analyze the differentially expressed genes (DEGs), and the results are presented in Figure 9. Our findings indicate that low-dose YFD treatment resulted in 28 downregulated genes and nine upregulated genes compared with those in the control group (Figures 9A, D). Conversely, high-dose YFD treatment induced the downregulation of 35 genes and the upregulation of 68 genes (Figures 9B, D). In total, 207 DEGs were identified between the low- and high-dose YFD groups. Among these genes, 152 genes were upregulated and 55 genes were downregulated in the low-dose YFD group compared with the high-dose YFD group (Figures 9C, D). Notably, both low- and high-dose YFD treatments resulted in the downregulation of the ladinin-1 (LAD1) gene (Figure 9E), which has been associated with the metastatic potential of cancer (37, 38). We hypothesized that this gene could be the key gene responsible for the antigrowth and antimetastatic effects of YFD. High-dose YFD treatment also upregulated the expression of Ank3, Ube2ql1, Baalc, Thbs4, and Dsg2, which are known to participate in cancer growth and metastasis (39–43). These findings suggest that high-dose YFD may have stronger antitumor effects than low-dose YFD does. Additionally, a statistically significant difference in gene expression was observed among the three groups, as shown in the DEG heatmap (Figure 9F).
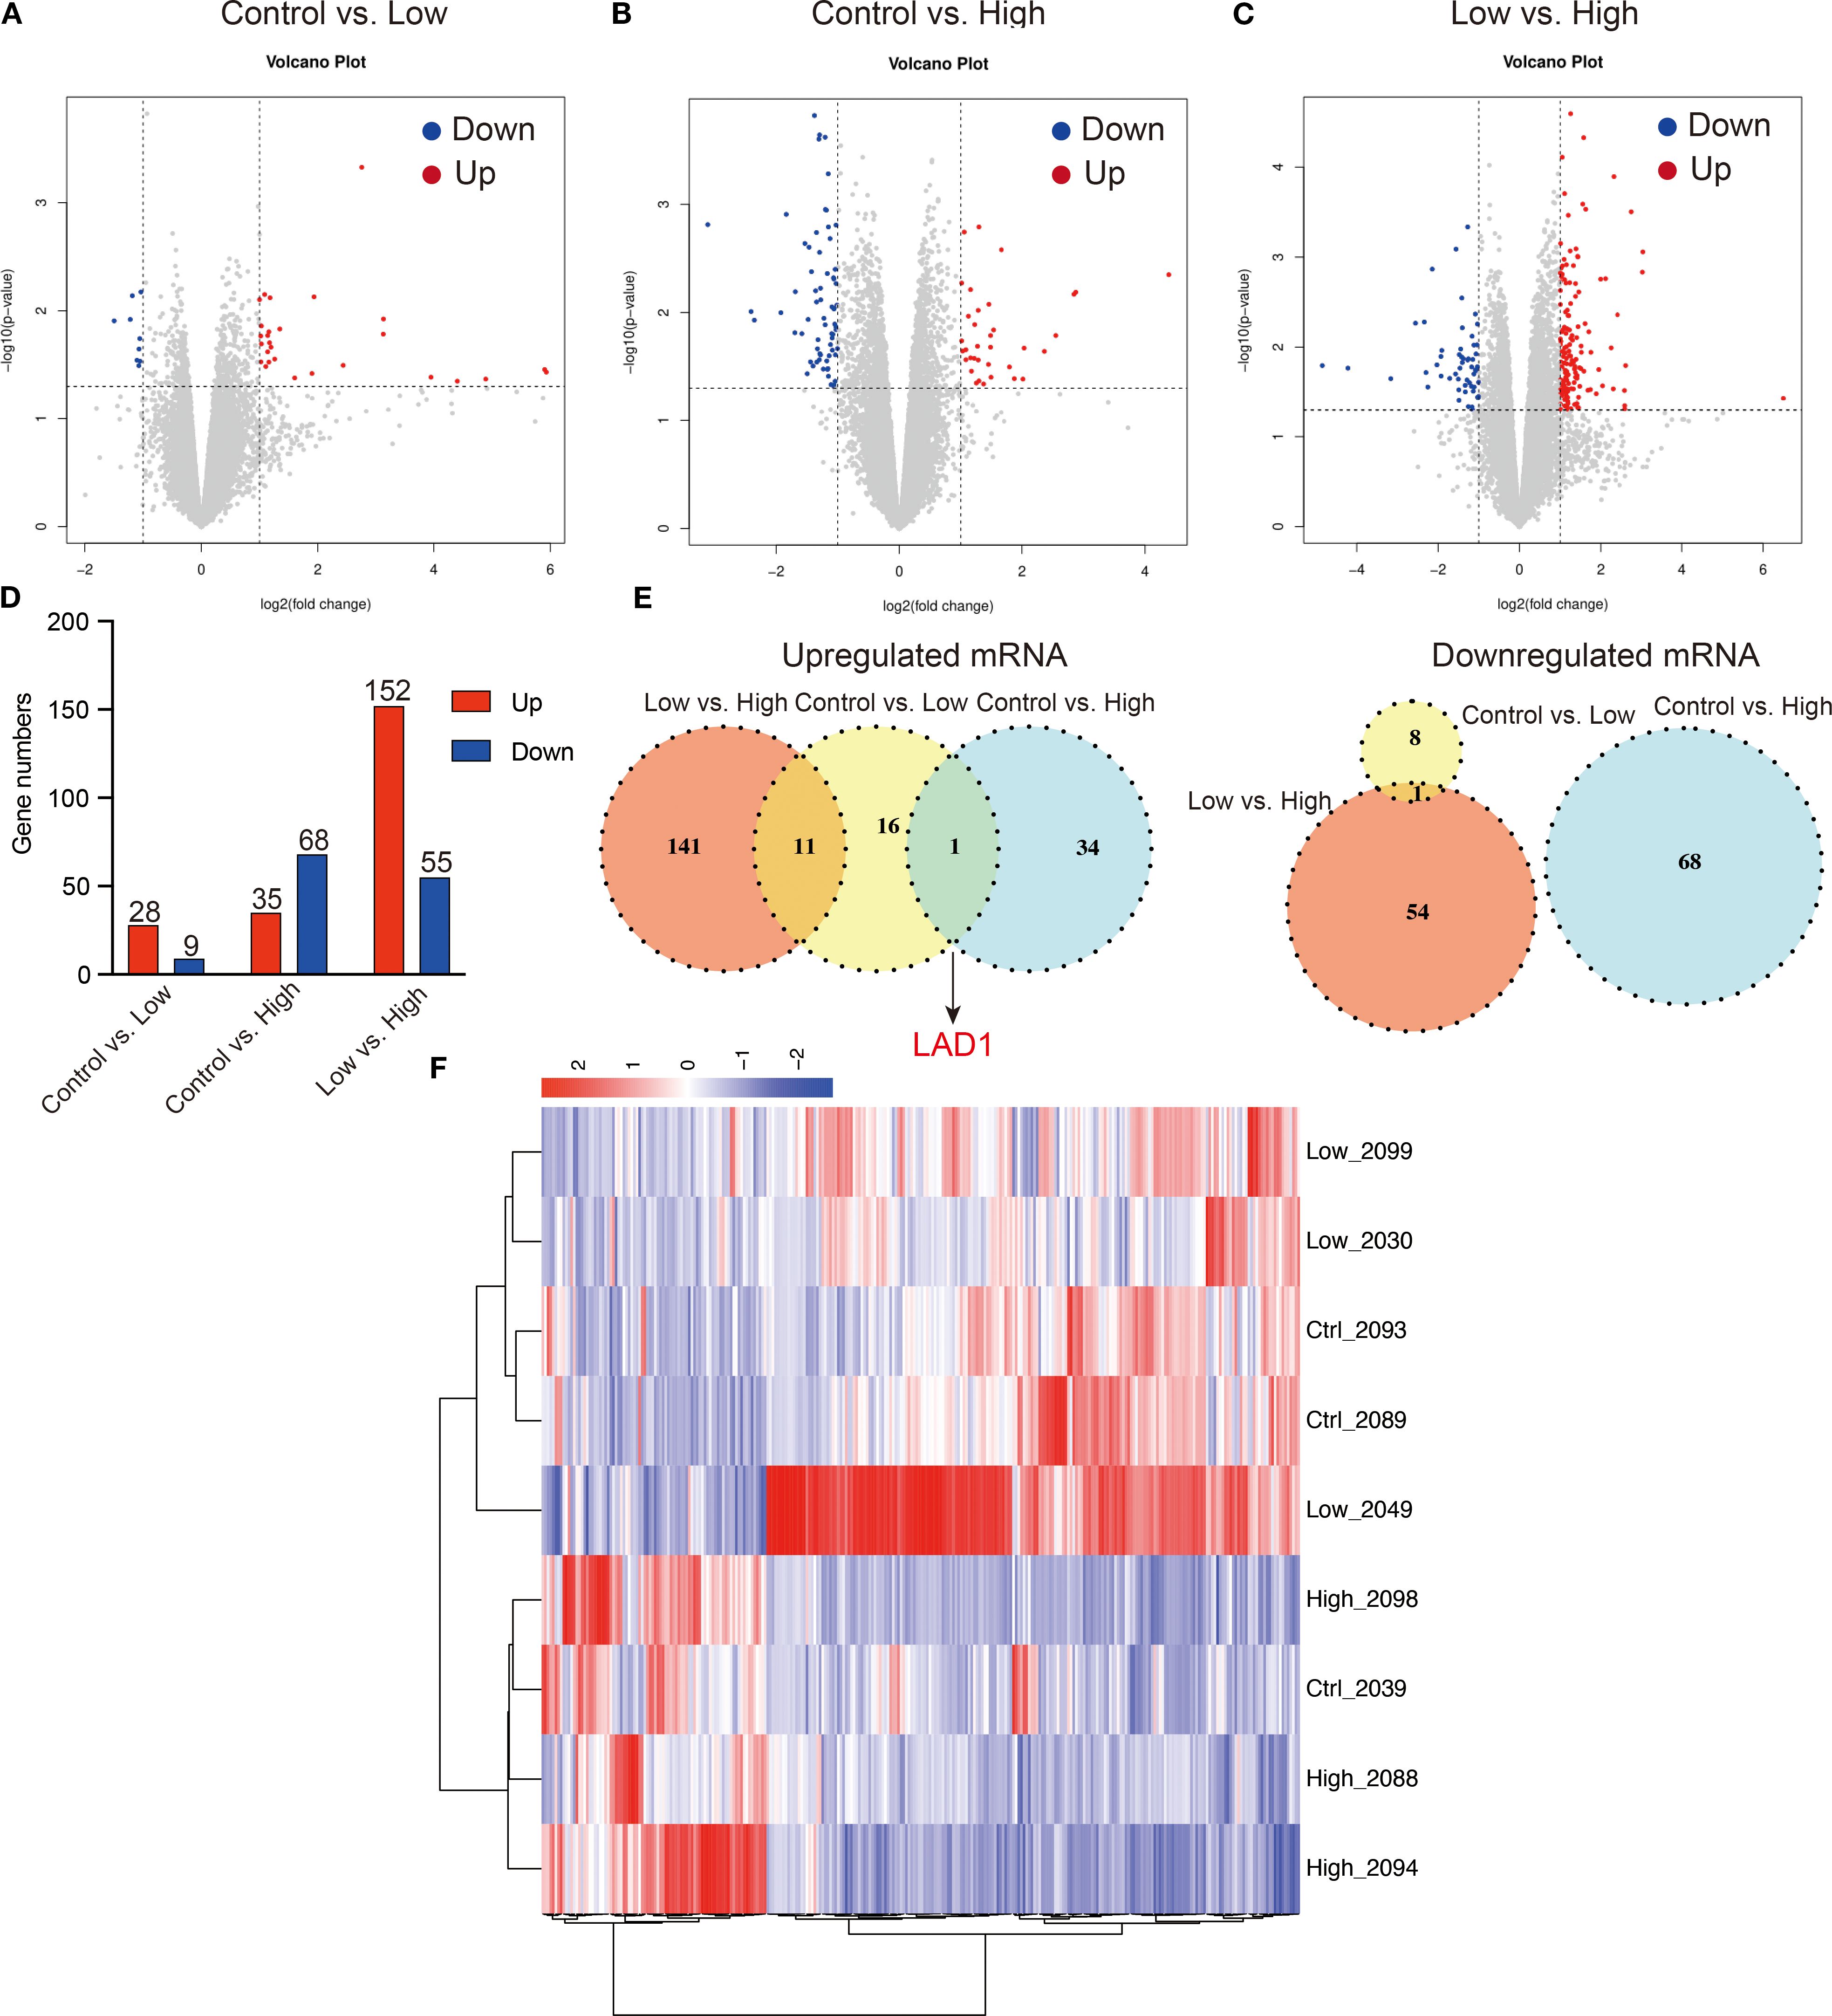
Figure 9. Differentially expressed genes (DEGs) among the groups. (A-D) Volcano plots for the control group vs. low-dose group, control group vs. high-dose group, and low-dose group vs. high-dose group. (E) Shared upregulated and downregulated DEGs among the groups. (F) DEG heatmap for the groups.
Furthermore, we performed functional annotation analysis of DEGs via the GO database and set the selection threshold for enriched GO terms at p< 0.05. Compared with the low-dose YFD group, the control group presented increased defense responses to viruses, protein kinase B signaling, the MAPK cascade, and ERK signaling (Figure 10A) and decreased regulation of immune system processes, lymphocytes, leukocytes, B cells, and extracellular regions (Figure 10B). The DEGs were enriched in five pathways: primary immunodeficiency, hematopoietic cell lineage, Epstein–Barr virus infection, complement and coagulation cascades, and the B-cell receptor signaling pathway (Figure 10G).
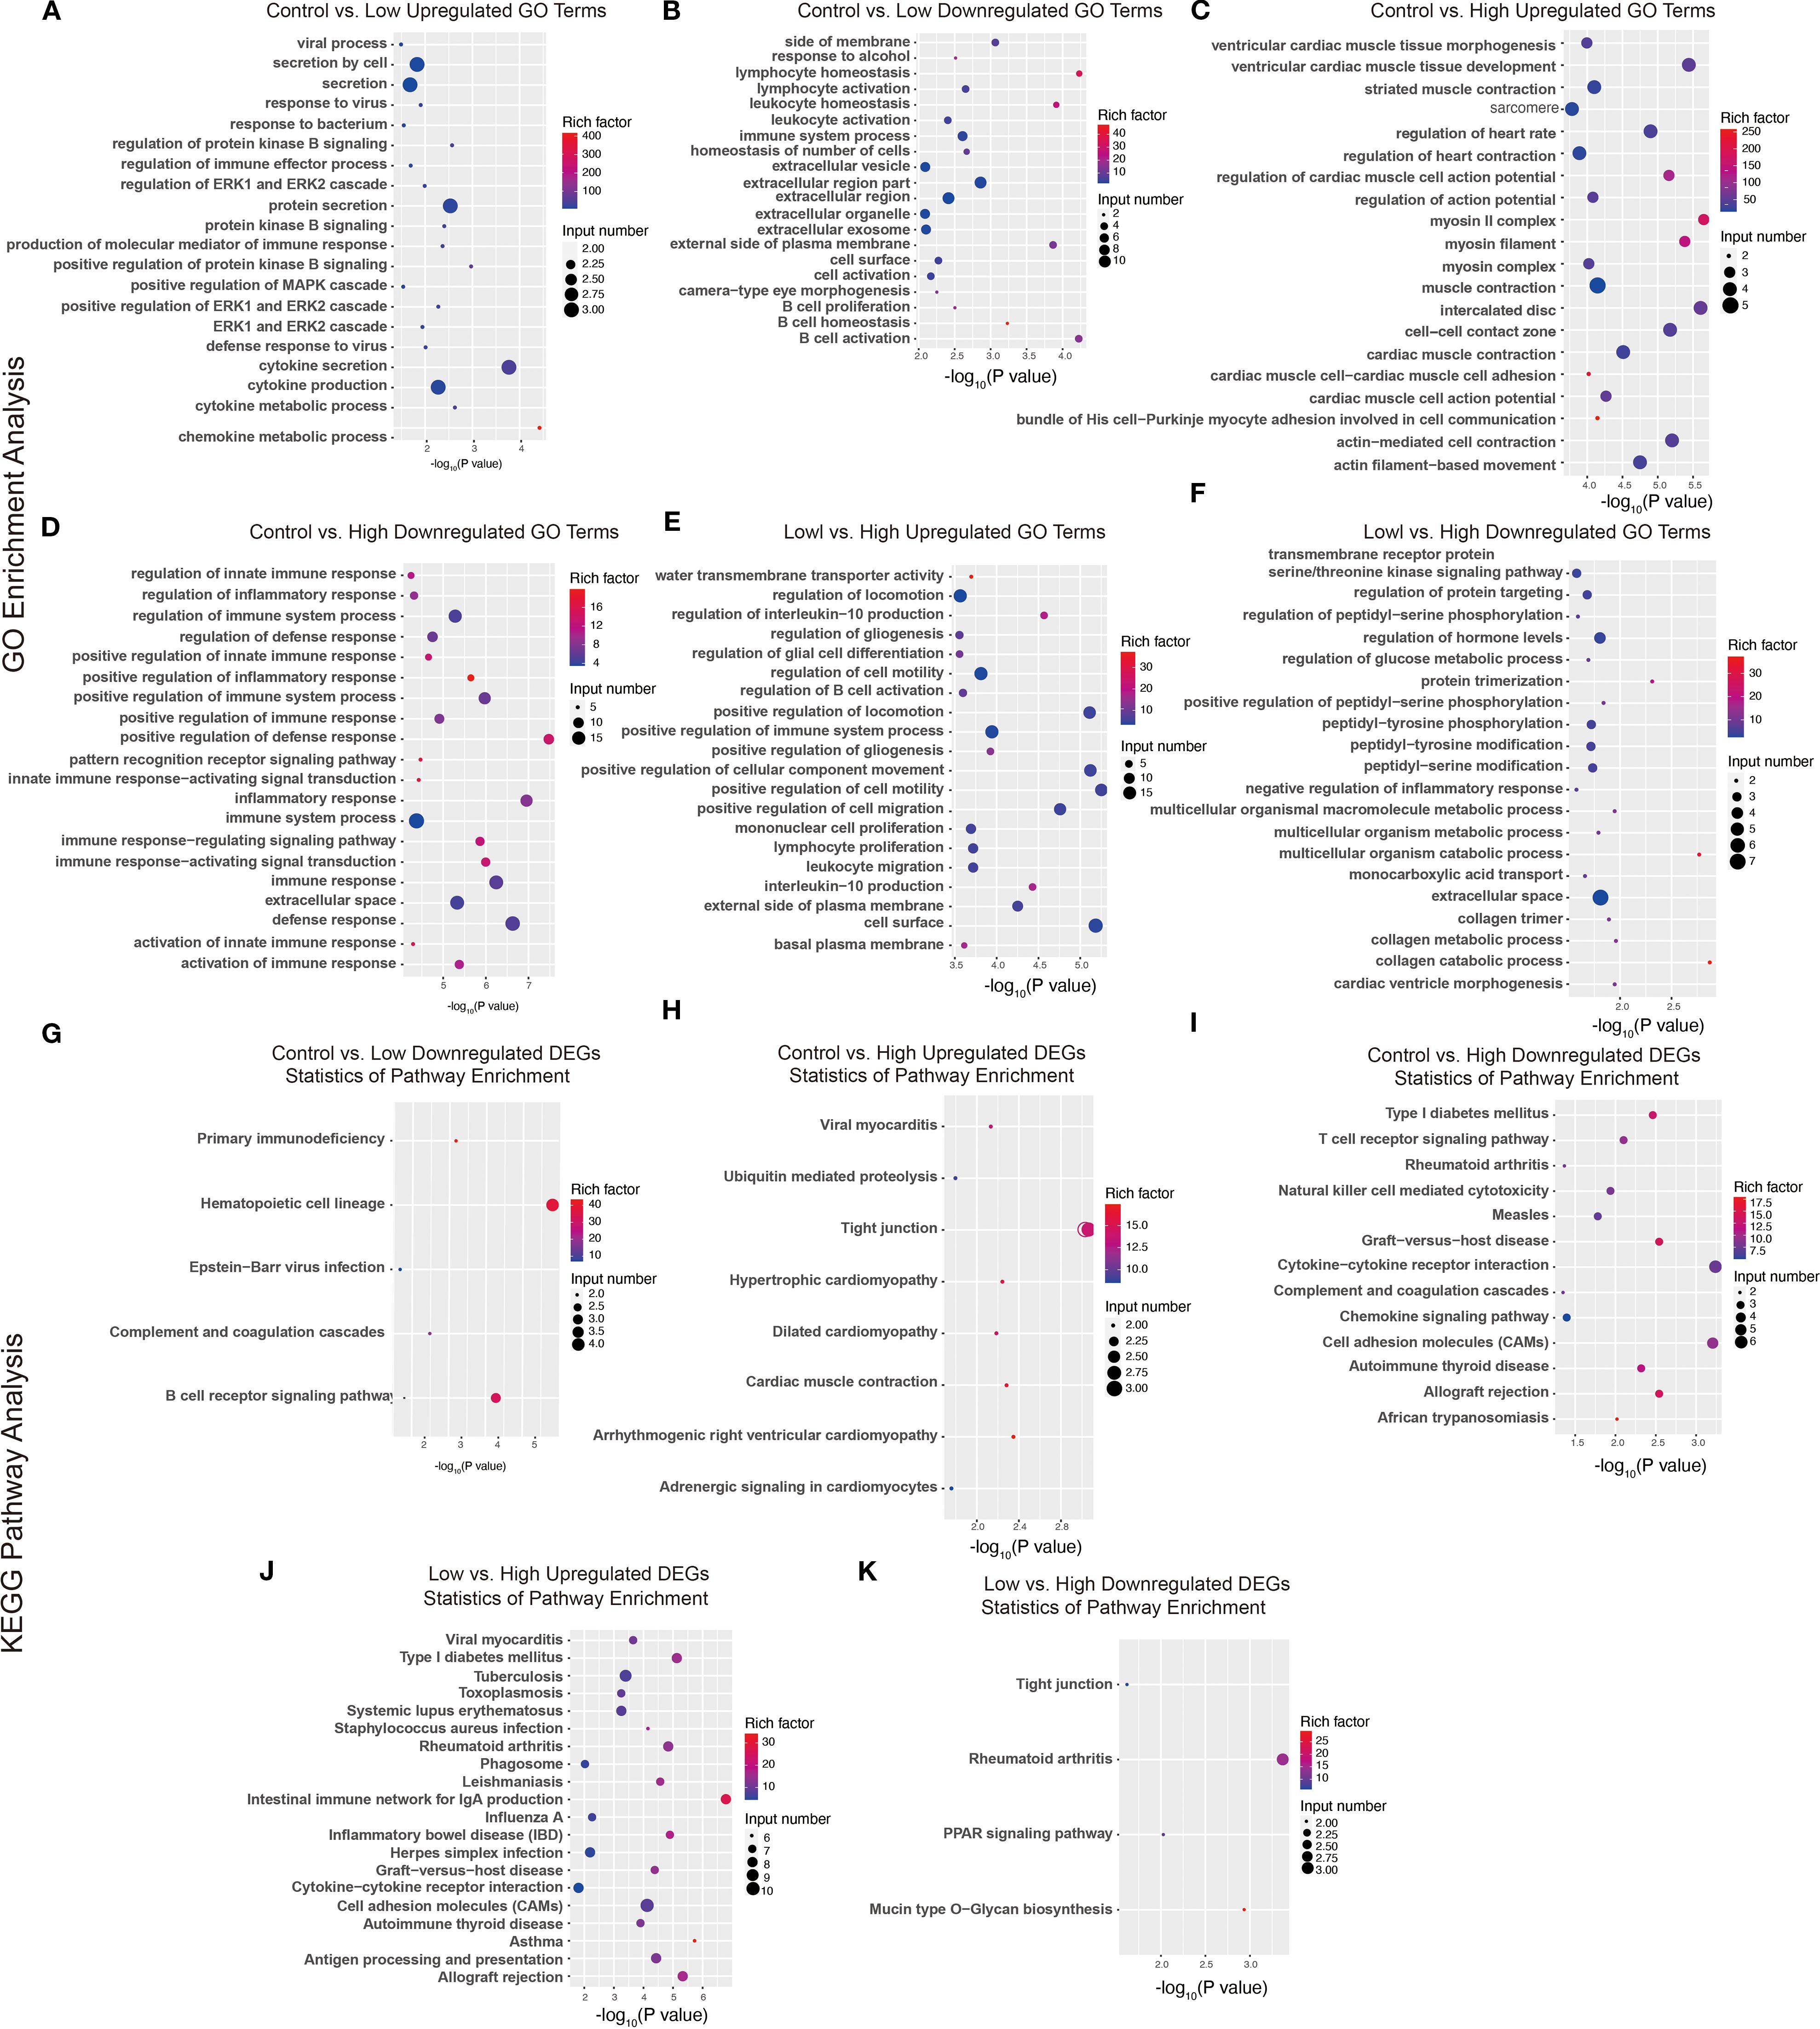
Figure 10. GO terms and KEGG pathways of DEGs. (A-F) GO terms enriched with upregulated and downregulated genes from the comparisons between the control group and the low-dose group, between the control group and the high-dose group, and between the low-dose group and the high-dose group. (G-K) KEGG pathways enriched with upregulated and downregulated DEGs between the control group and the low-dose group, between the control group and the high-dose group, and between the low-dose group and the high-dose group.
Compared with the high-dose YFD group, the control group presented an increase in GO terms related to the regulation of cardiac muscle function and heart rate (Figure 10C). In contrast, the GO terms related to the positive regulation of the innate immune response, inflammatory response, and immune response-regulating signaling pathways were downregulated in the control group (Figure 10D). These DEGs were enriched in tight junctions, hypertrophic cardiomyopathy, type I diabetes mellitus, the T-cell receptor signaling pathway, natural killer cell-mediated cytotoxicity, cytokine–cytokine receptor interactions, the chemokine signaling pathway, and cell adhesion molecules (Figures 10H, I).
Compared with the high-dose YFD group, the low-dose YFD group presented increased expression of GO terms such as regulation of interleukin-10 production, regulation of gliogenesis, regulation of B-cell activation, positive regulation of cell migration, and positive regulation of cell motility (Figure 10E). Conversely, the main downregulated GO terms were transmembrane receptor protein serine/threonine kinase signaling pathway, regulation of protein targeting, peptidyl-serine phosphorylation, glucose metabolic process, and collagen metabolic process (Figure 10F). These DEGs were enriched predominantly in pathways such as Type I diabetes mellitus, tuberculosis, rheumatoid arthritis, cytokine–cytokine receptor interaction, tight junctions, and the PPAR signaling pathway (Figures 10J-K).
Integrative analysis of the metabolome and transcriptome
Next, we analyzed the correlations between the identified genes and their metabolites. The correlation coefficient was measured via the Spearman correlation coefficient method with the Cor function of R language. A correlation coefficient greater than 0.8 and a p value 0.05 were used to determine a significant correlation between the metabolites and genes. An interaction network of gene–metabolite expression was constructed, and the igraph package of the R language was used to draw the network diagram. The molecular types (genes and metabolites) are marked on the network icon, and a line was drawn between the interacting molecules. The arrow represents the default direction of regulation from the gene to the metabolite. Our results revealed that both high and low doses of YFD upregulated LAD1 expression in mice with TNBC. This leads to reduced expression of methylcysteine and increased expression of mannose, ribitol, melamine, alanine, aminoadipic acid, and prostaglandin E2 (Figure 11).
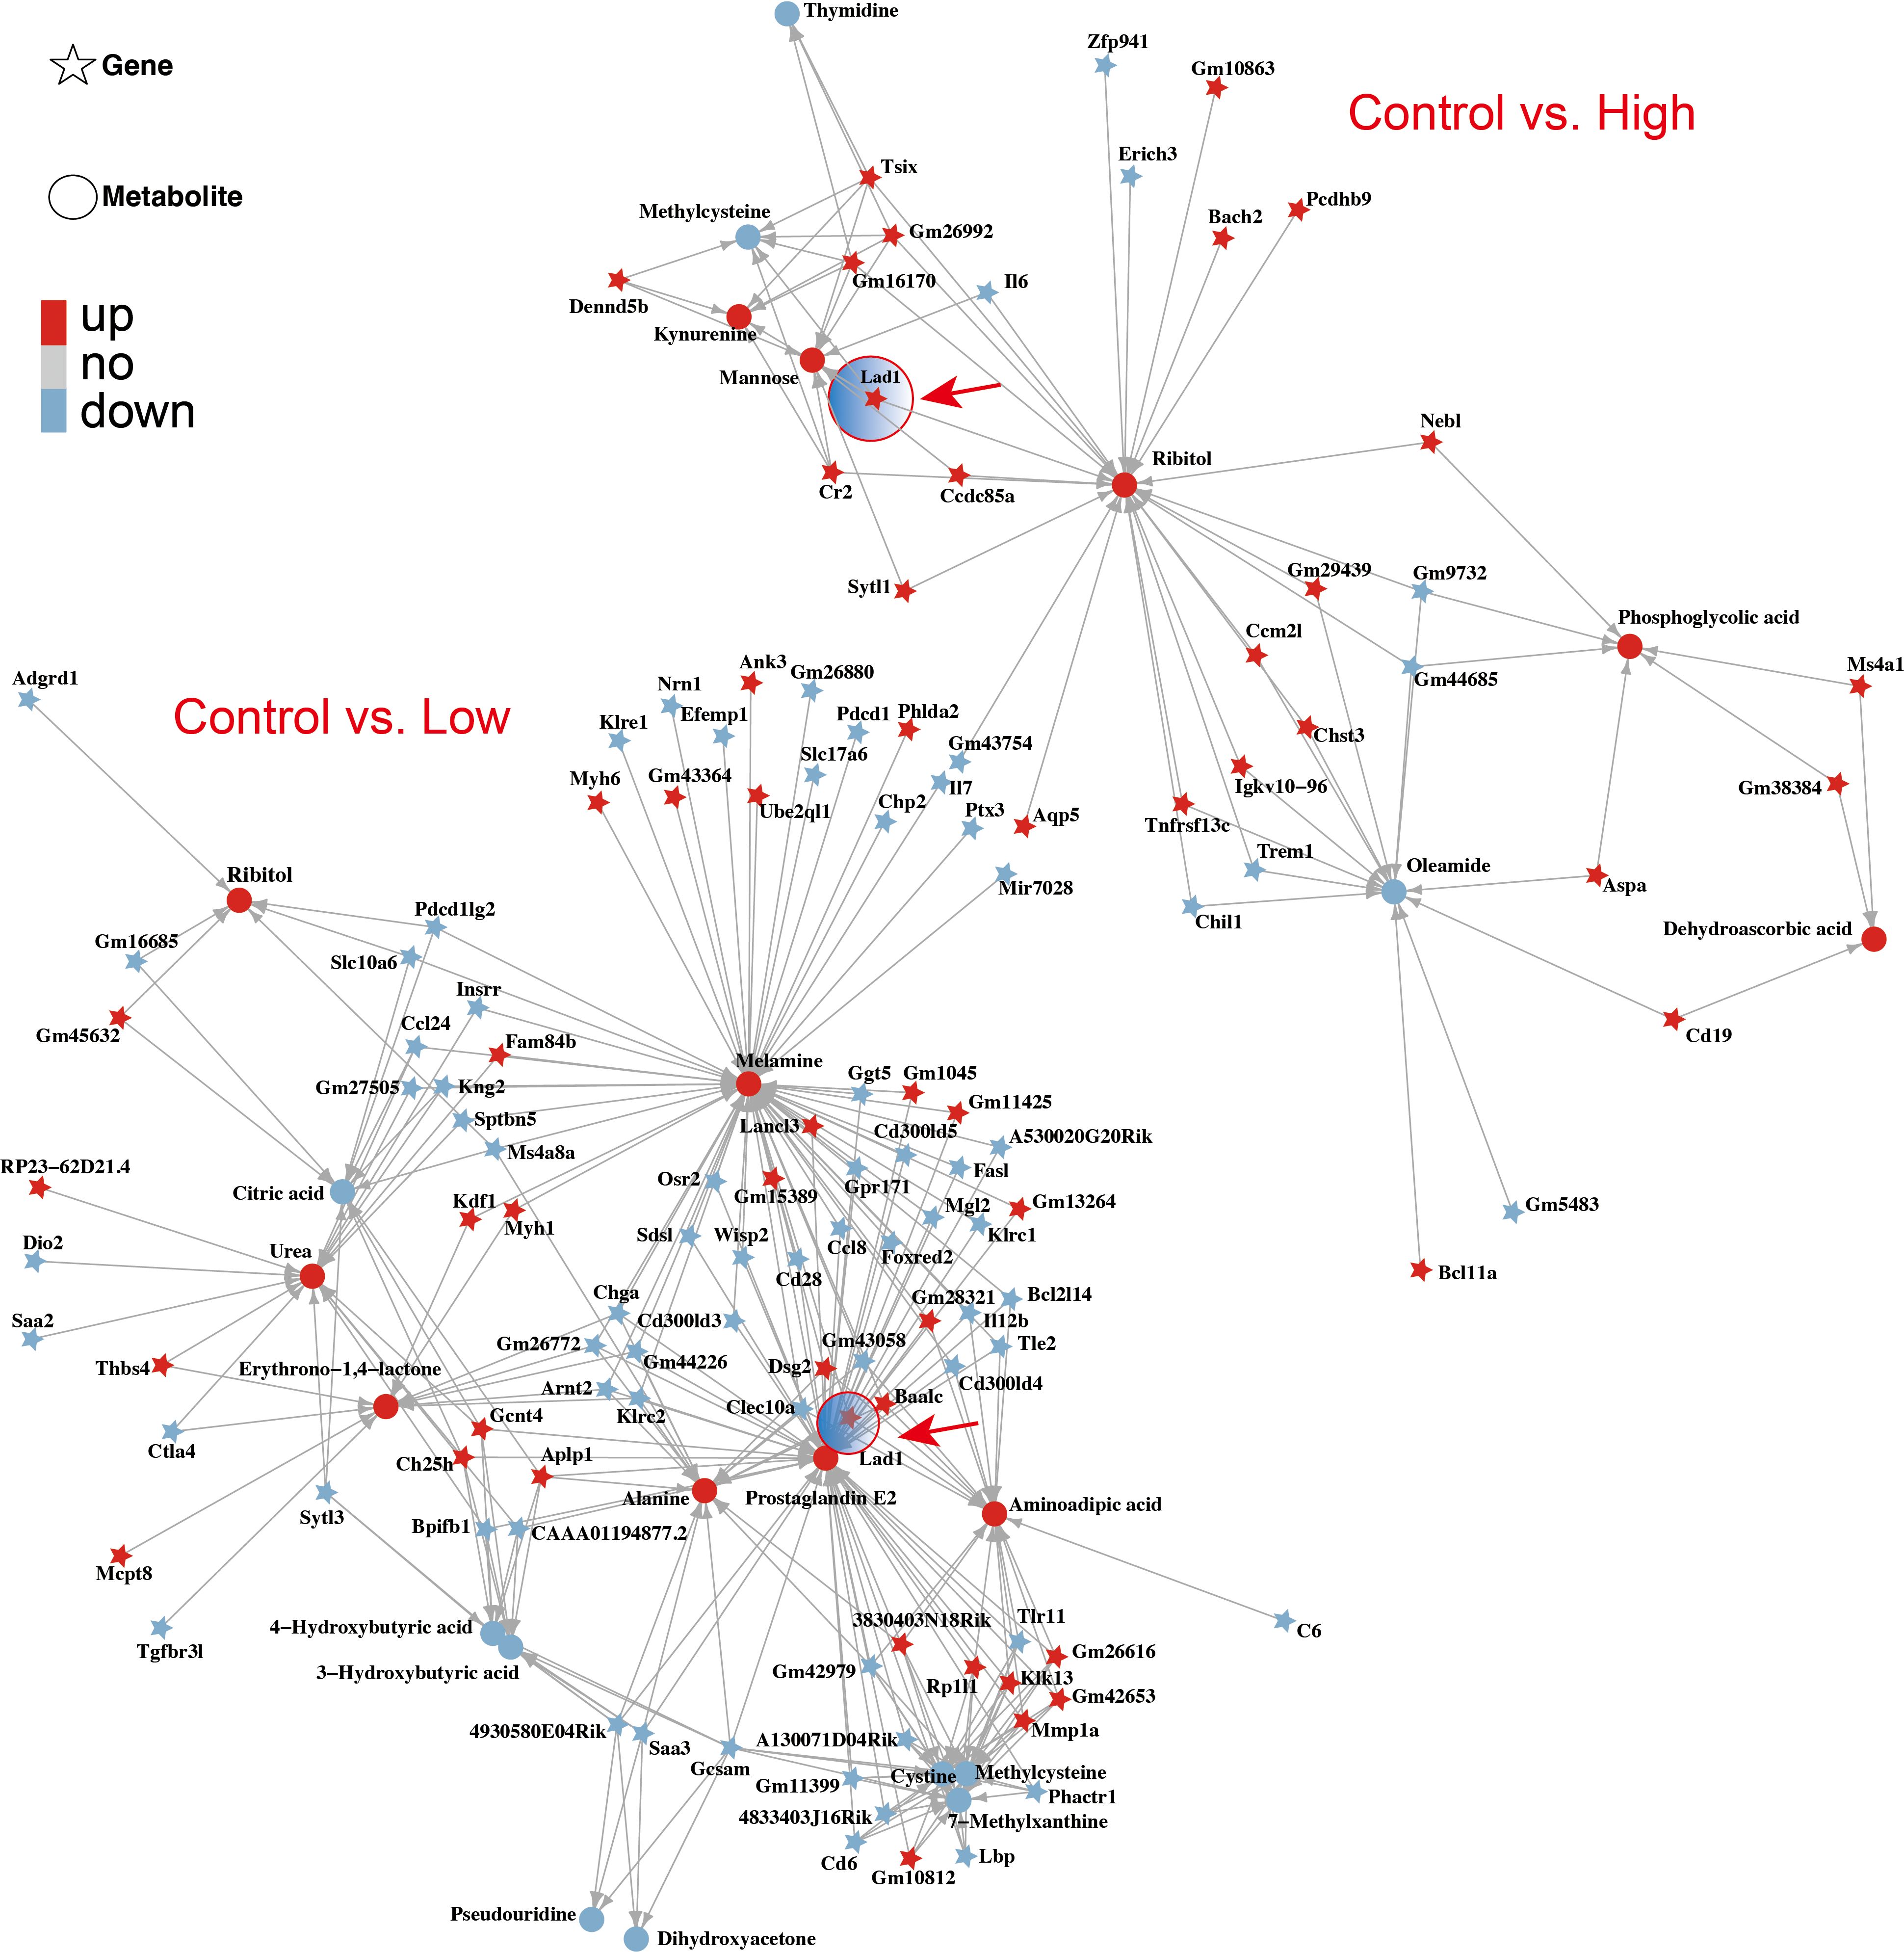
Figure 11. Interaction network of genes and metabolites affected by YFD. The correlation coefficient between genes and metabolites was measured via the Spearman correlation coefficient. The arrow direction represents the direction of regulation from the gene to the metabolite. Both low-dose and high-dose YFD treatment upregulated the LAD1 gene.
YFD induced M1 macrophage polarization and inhibited M2 macrophages, likely by inactivating the MEK/ERK1/2 pathway
Enrichment analysis of the RNA-seq data revealed that, compared with the control group, the YFD treatment groups presented significant enrichment of terms related to the MAPK cascade, ERK signaling, and regulation of the inflammatory response. These findings indicate that the antitumor effects of YFD may be mediated through the MAPK and ERK pathways, which regulate the immune response. Recent studies have shown that LAD1 can be affected by the EGFR/MEK/ERK1/2 cascade, which affects the invasion and migration of BC cells (38). Additionally, TAMs with an M2-like phenotype are correlated with an immunosuppressive TME and cancer metastases (14). To measure the levels of M1- and M2-like TAM markers, we analyzed the activated phenotype via the expression levels of F4/80/CD86 (M1-like marker) and F4/80/CD206 (M2-like marker). Our immunofluorescence results revealed a significant increase in the fluorescence intensity of M1-like TAMs and a decrease in that of M2-like TAMs in the YFD-treated groups (Figures 12A-D). YFD treatment resulted in a substantial increase in TNF-α and a decrease in IL-10 expression (Figures 13A, B). Additionally, we observed a decrease in the expression of MEK/ERK1/2 signaling pathway proteins and LAD1 following YFD administration (Figures 13A, B). Overall, these results suggest that YFD treatment induces M1 macrophage polarization and inhibits M2 macrophage polarization by partially inactivating the MEK/ERK1/2 pathway.
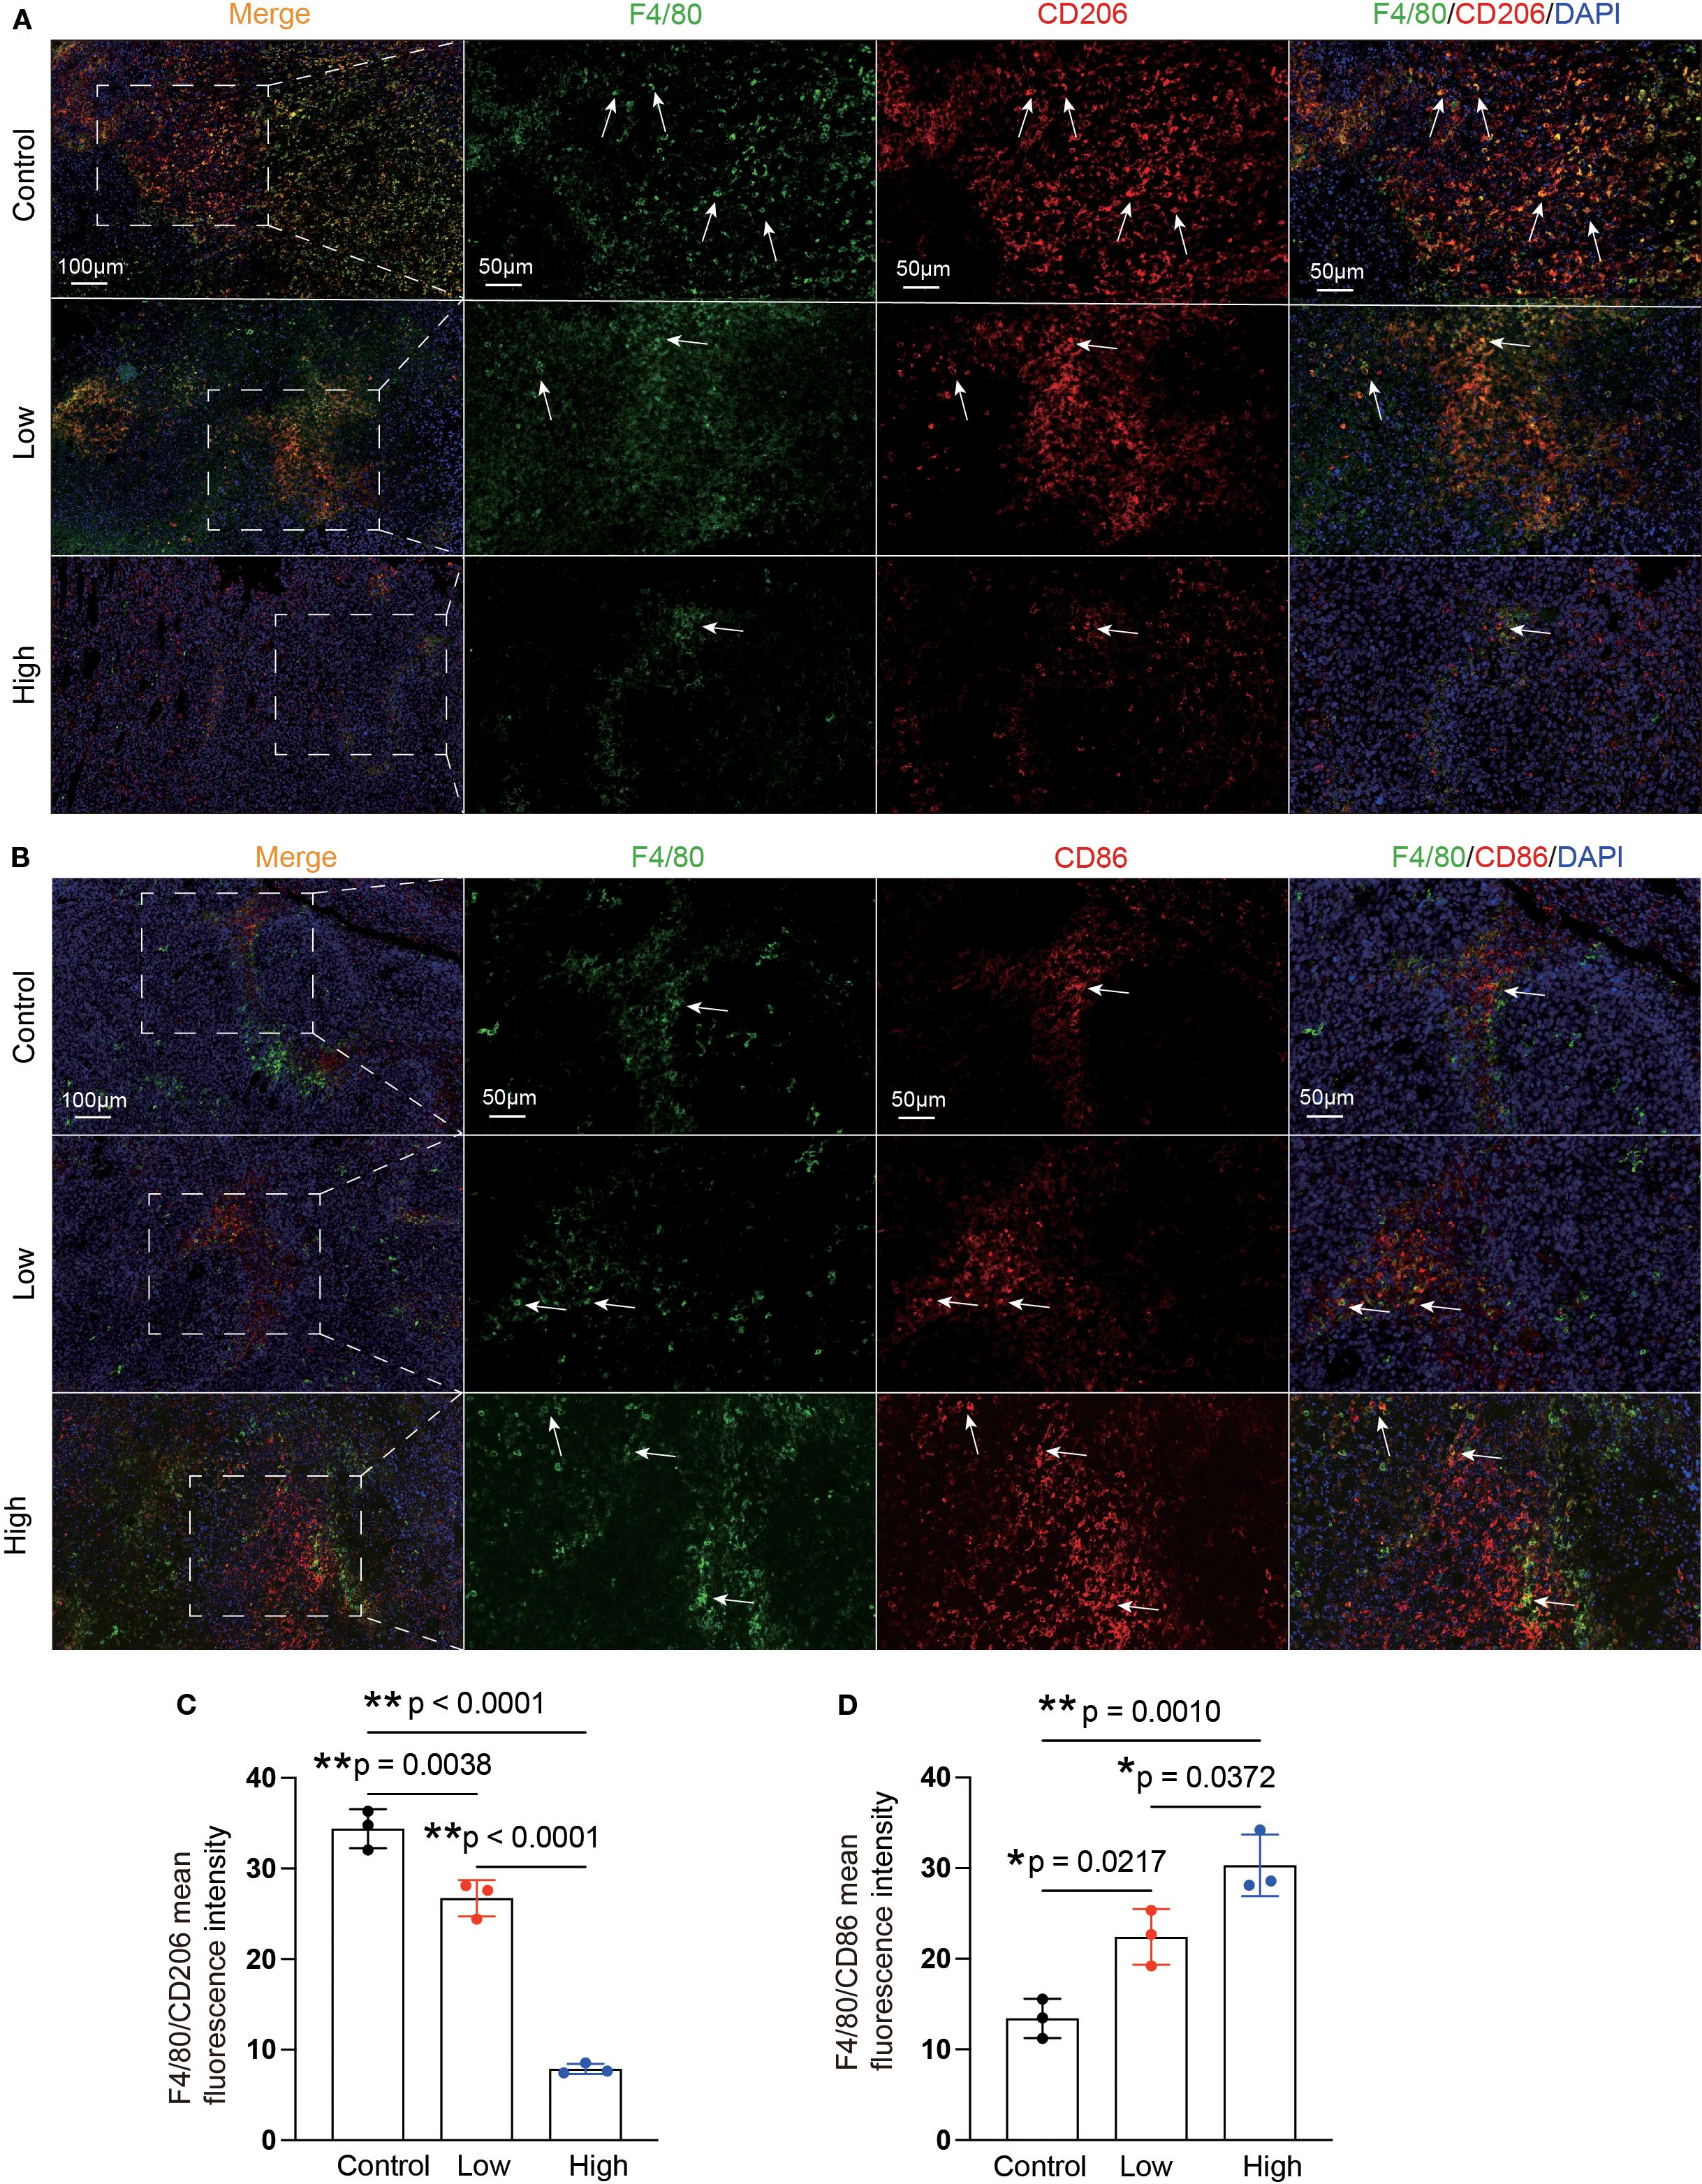
Figure 12. YFD can remodel the polarization phenotypes of TAMs. (A, B) Representative immunofluorescence images of M1-type TAMs and M2-type TAMs in tumor sections from each group. The white arrows indicate macrophages. (C, D) Immunofluorescence analysis of M1- and M2-like macrophages in tumor sections from each group. The data are presented as the means ± SDs (n=3). *p< 0.05, **p< 0.01, nsp>0.05 compared with the intended group by ANOVA followed by Dunnett’s t post hoc test.
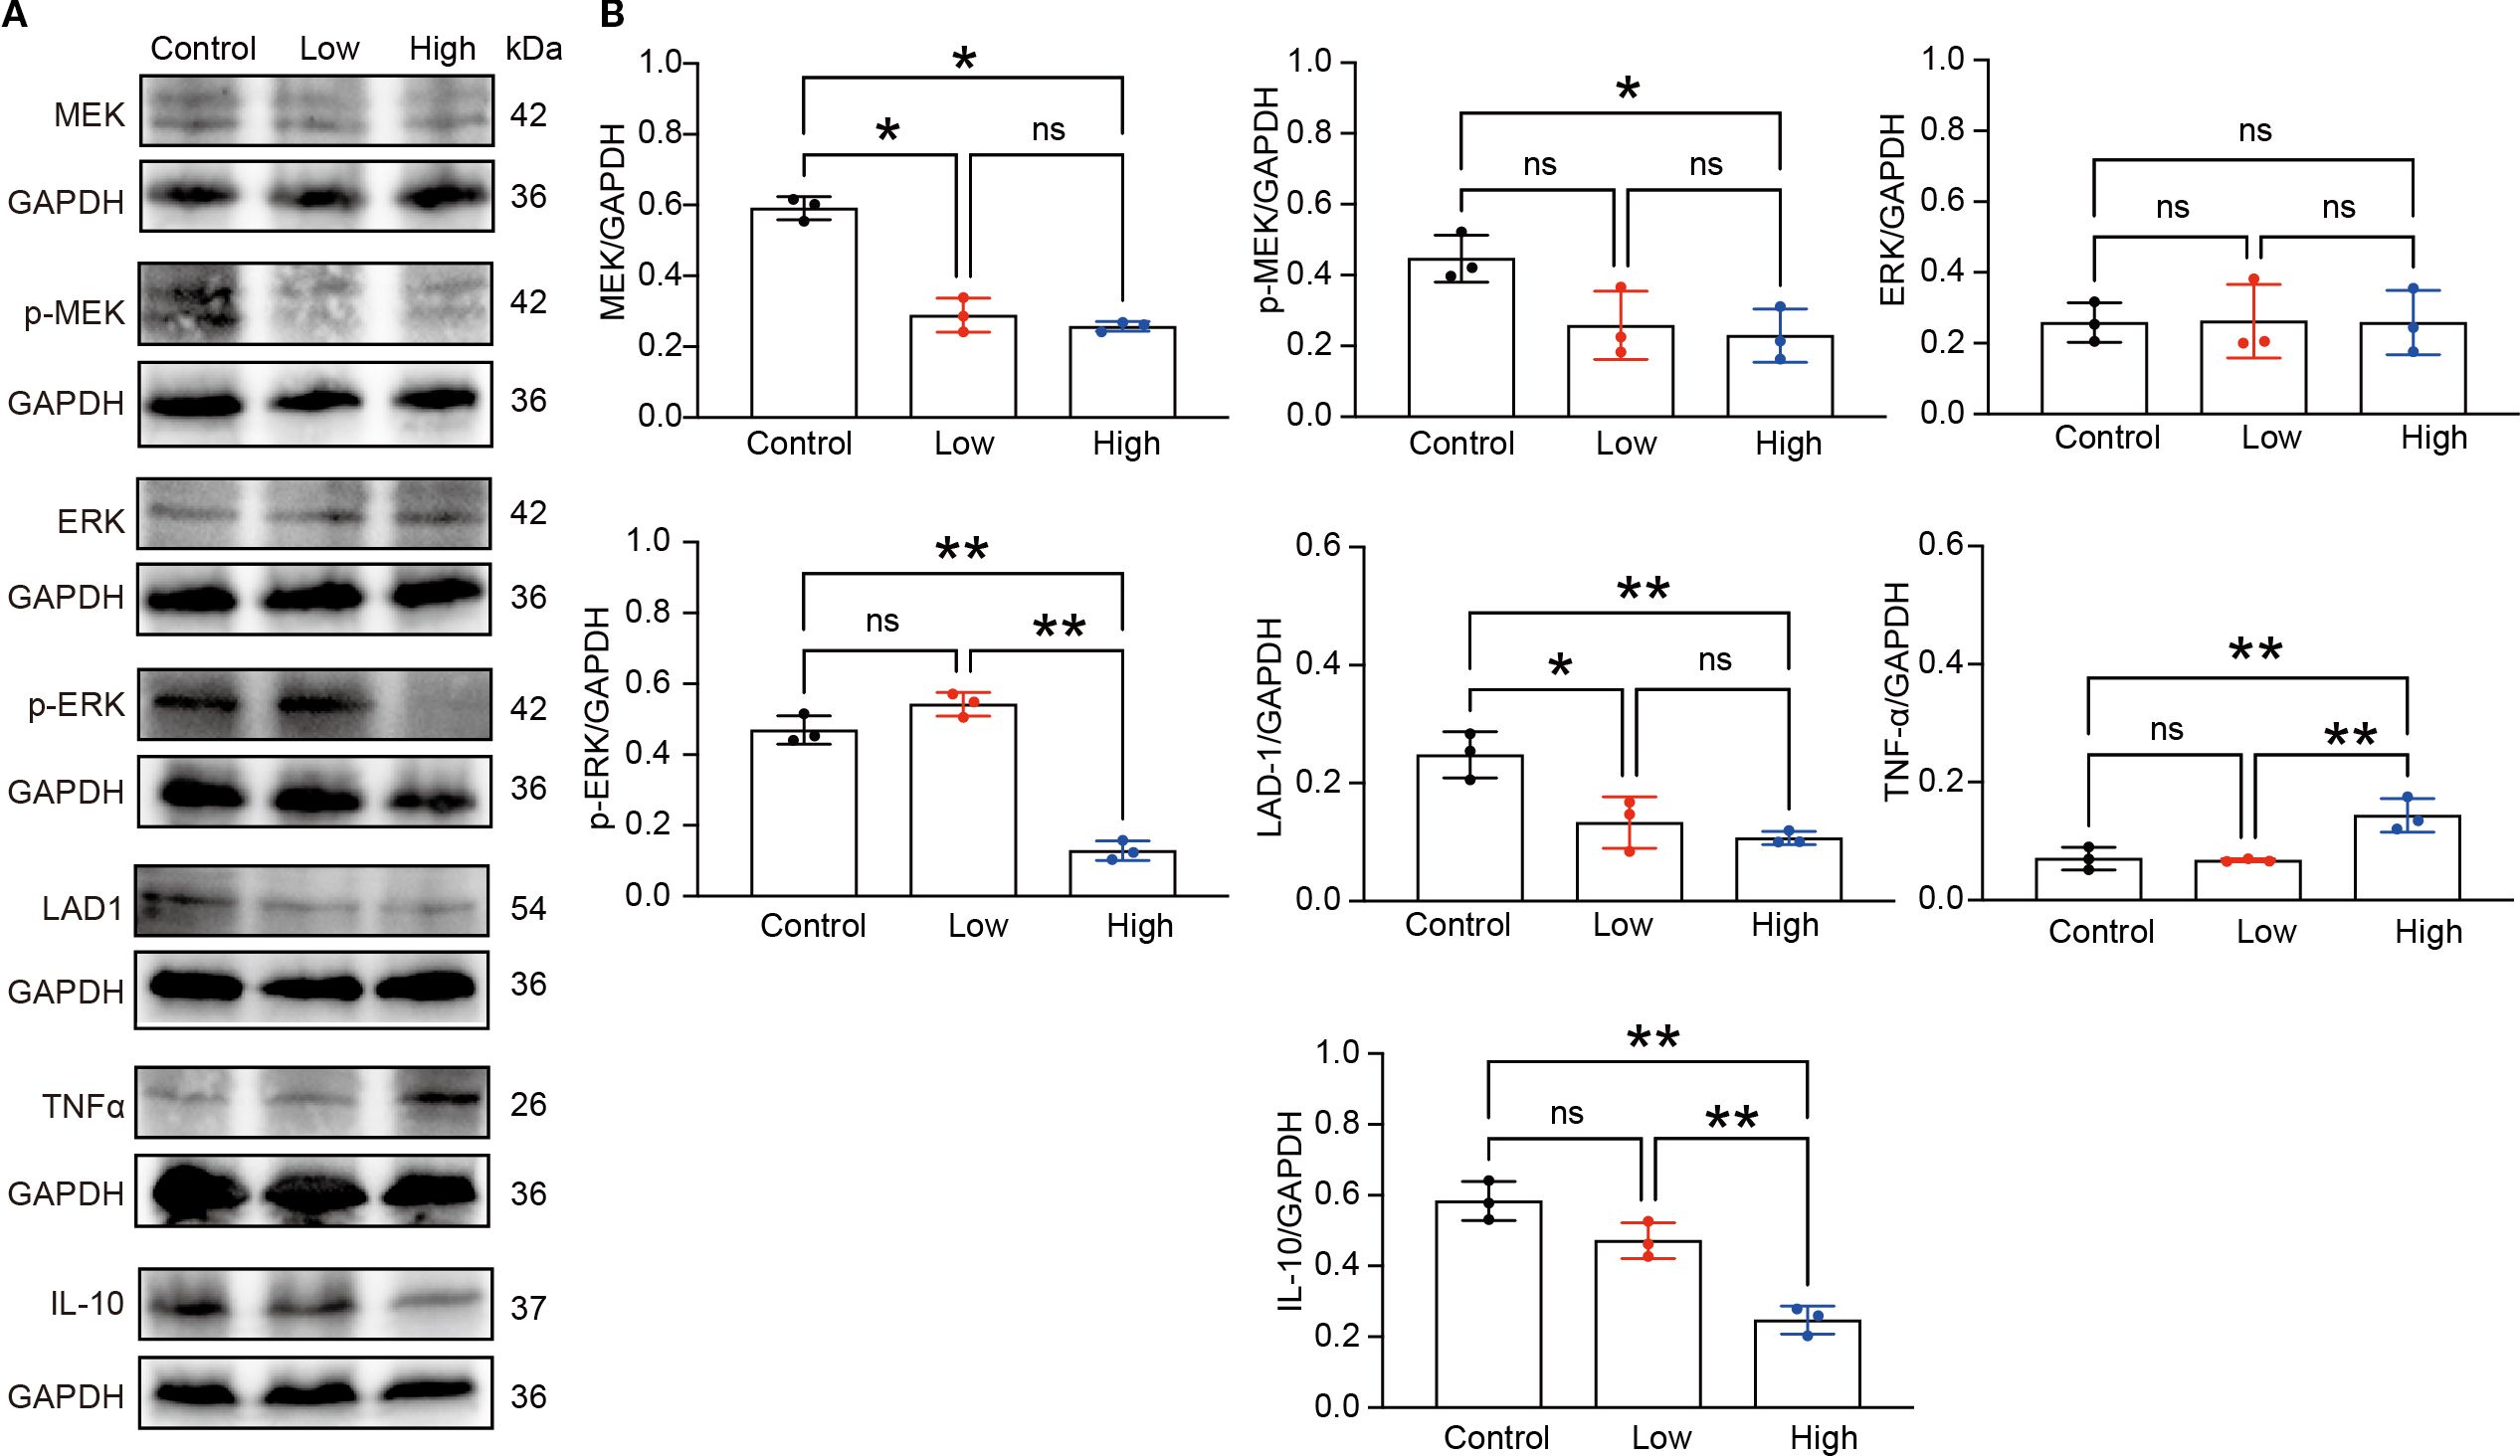
Figure 13. YFD inhibited the MEK/ERK1/2 pathway. (A) Expression of LAD1, TNFα, IL-10, and MEK/ERK1/2 signaling proteins in tumor tissues from each group, as measured by Western blot analysis. (B) Densitometry values for the proteins were normalized to those of GAPDH. All the data represent the means ± SDs of three independent experiments performed in triplicate. *p< 0.05, **p< 0.01, nsp>0.05 compared with the intended group by ANOVA followed by Dunnett’s t post hoc test.
Discussion
The relationship between the TME and the progression of various solid cancers, such as lung, breast, gastric, and colorectal cancers, is widely accepted (9, 44). TNBC, a highly aggressive and metastatic subtype of BC, lacks specific targets or targeted therapeutics (3). Therefore, reshaping the components of the TME, including immunosuppressive cells and metabolites, may be a promising therapeutic approach for TNBC (45). Our study aimed to validate the bioactive ingredients, anticancer effects, and underlying mechanisms of action of the multitarget Chinese medicine formula YFD in TNBC mice via a comprehensive approach.
Twenty compounds were identified, including l-phenylalanine, nicotinic acid, linoleic acid, benzoic acid, palmitic acid, caffeic acid, formononetin, apigenin 7-O-glucuronide, salicylic acid, catechol, oleanolic acid, chlorogenic acid, rutin, apigenin, asiatic acid, catechin, eicosapentaenoic acid, quercetin, vanillin, and astragalin. Our findings indicated that YFD significantly suppressed breast tumor growth and lung metastasis in a dose-dependent manner, with high-dose YFD treatment resulting in stronger antitumor effects. Importantly, YFD significantly affected the TME by increasing the number of T cells and decreasing the number of TAMs and MDSCs. Furthermore, YFD was found to target important immune regulatory pathways, including the LAD1 gene, and promote the polarization of M1 macrophages while inhibiting M2 macrophage polarization and MDSC accumulation by inactivating the MEK/ERK1/2 pathway. Metabolomic analysis demonstrated that YFD affects various metabolic pathways related to immune response regulation. Recently, several studies have validated the anticancer mechanisms of ancient and classical Chinese medicine decoctions, such as the Tao Hong Si Wu decoction (46), Gegen Qinlian Decoction (47), Siwu Decoction (48), Liujunzi Decoction (49), and Banxia Xiexin Decoction (50), but less emphasis has been placed on their effects on the TME. In the present study, we demonstrated that YFD can inhibit TNBC progression by remodeling the TME. In addition, the material basis, effects on TME remodeling, and transcriptomic and metabolomic characteristics of the decoction were validated via combined and systematic approaches, in accordance with the holistic view of TCM.
Mounting evidence has shown that the identified components of YFD exert significant anticancer effects. Patients with BC who received L-phenylalanine mustard demonstrated prolonged disease-free survival and a significant survival benefit compared with those who received placebo (51). Meng et al. reported that a copolymer of L-phenylalanine and salicylic acid significantly inhibited the lung metastasis of BC (52). Additionally, derivatives of benzoic acid retard tumor growth and metastasis by inhibiting the TNFα/NF-κB and iNOS/NO pathways (53). A recent study revealed that palmitic acid-modified human serum albumin paclitaxel nanoparticles significantly polarized macrophages to the M1 type, thus reshaping the TME and inhibiting BC metastasis (54). Quercetin and astragalin are known to exert strong anticancer effects (55, 56). Nicotinic acid (57), linoleic acid (58), caffeic acid (59), oleanolic acid (60), chlorogenic acid (61), rutin (62), apigenin (63), asiatic acid (64), catechin (65), eicosapentaenoic acid (66), vanillin (67), and formononetin (68) are also considered promising anticancer agents.
There is significant evidence that TAMs and MDSCs are primarily responsible for immune suppression and evasion in cancer (69–72) and that they play a vital role in tumor growth and metastasis (73, 74). MDSCs can increase the expression of the immune checkpoint molecule PD-L1, which suppresses the T-cell response by interacting with PD-1 on T cells (75, 76). Furthermore, the production of ARG1 by MDSCs can lead to increased consumption of extracellular l-arginine, which is essential for T-cell metabolism and function, ultimately resulting in T-cell inhibition (77). Additionally, the increased secretion of nitric oxide, oxygen radicals, and reactive nitrogen species from MDSCs can impair T-cell function (77–79). Therefore, targeting immunosuppressive cells is a potential therapeutic approach for cancer treatment (11). Mounting evidence suggests that TCM may effectively inhibit tumor growth by suppressing MDSCs. One major biocomponent of TCM, icariin, reduces MDSCs and restores IFN-γ production in CD8+ T cells, ultimately leading to tumor growth (80). In addition, Gansui-Banxia decoction, a TCM formula, has notable antitumor effects by reducing the accumulation of MDSCs, which in turn inhibits the AKT/STAT3/ERK pathway (81). Consistently, in this study, a reduced accumulation of MDSCs in tumors was observed.
Similarly, we found that YFD reduced the proportion of TAMs in tumors. In addition, the inhibition of M2 polarization and promotion of M1 polarization of TAMs by YFD were observed. TAMs are closely associated with a poor prognosis in multiple cancers (82–84). M1-like macrophages generally have high levels of CD80, CD86, TNF-α, IL-6, and iNOS, which exert antitumorigenic effects. In contrast, M2-like macrophages usually express CD163, CD206, IL-10, and arginase 1, which are considered protumorigenic (85). Mounting evidence suggests that an increase in M2-like TAMs creates a microenvironment that promotes tumor progression within the TME. This increase in the number of M2-like TAMs is correlated with tumor growth and metastasis. Conversely, an increase in M1-like TAMs is closely associated with less aggressive tumors (86, 87). Switching from the M2-like phenotype to the M1-like phenotype has been shown to inhibit tumor angiogenesis and metastasis in BC (88). Transcriptomic analysis was conducted to investigate the mechanisms underlying the YFD-mediated reduction in TAMs and MDSCs in breast tumors. The RNA-seq data revealed that the GO terms related to the regulation of immune processes were enriched in the low- and high-dose YFD treatment groups compared with the control group. Additionally, several signaling pathways, including protein kinase B signaling, the ERK1/2 cascade, and the MAPK pathway, are involved in the immune-regulating properties of YFD (89, 90). The YFD treatment group presented decreased expression of LAD1. LAD1 is an anchoring filament protein in mammalian epidermal cells (91, 92) and has been implicated in the metastatic potential of breast (38), prostate (93), and colorectal cancers (37). A recent study explored genomic profiles and identified LAD1 as a potential target for TNBC therapy (94). Additionally, high levels of LAD1 transcripts have been linked to a poor prognosis in patients with BC (38). LAD1 is a downstream target of the EGFR/MEK/ERK1/2 signaling pathway, which affects actin polymerization and cross-linking, ultimately controlling BC cell migration and proliferation. LAD1 depletion reduces the invasion and migration of BC cells, and similar results have been reported in colorectal cancer cells (37). We also found that LAD1 transcription and expression were increased in TNBC mice but were restored by YFD administration, possibly through inhibition of the MEK/ERK1/2 signaling pathway.
The MEK/ERK/1/2 signaling pathway is a widely known MAPK pathway that plays crucial roles in apoptosis, cell proliferation, and the immune response (95). Studies have shown that this pathway is also involved in tumor invasion and metastasis (96, 97). Preclinical studies have revealed that the MEK/ERK pathway is hyperactivated in TNBC, suggesting that targeting this pathway may be an effective treatment strategy for TNBC (98, 99). Zhang et al. reported that the activation of EGFR/MEK/ERK signaling contributes to BC progression (100). Conversely, inhibition of the RAS/RAF/MEK/ERK and PI3K/AKT/mTOR signaling pathways suppressed the growth of BC cells (101). The activation of MEK/ERK1/2 signaling can reverse TAM polarization from the tumor-inhibiting M1-like phenotype to the tumor-promoting M2-like phenotype, leading to increased metastatic potential. However, Kang et al. demonstrated that puerarin, a major bioactive component of the TCM herb Ge-gen (Radix Puerariae), not only inhibits M2-like macrophage polarization but also suppresses tumor growth and metastasis. This was achieved through the partial inactivation of MEK/ERK1/2 signaling in a non-small cell lung carcinoma xenograft model (102, 103). ERK signaling cascades are involved in regulating MDSCs in cancer cells. Liu et al. reported that activation of the MEK/ERK1/2 pathway could increase MDSC recruitment to the spleen and tumor tissues of tumor-bearing mice. This ultimately promotes tumor growth and metastasis (104). A recent study revealed that the inhibitor SCH772984 induced apoptosis in MDSCs and increased the ratio of M1-like phenotype TAMs (105). Ras/MEK-dependent CXCL1/2 expression mediates the recruitment of immunosuppressive MDSCs to TNBC (106). A reduction in MDSC infiltration was partially achieved through the suppression of IL-6 via the inhibition of MEK (107). Our observations indicated that activation of the MEK/ERK1/2 signaling pathway led to increased accumulation of MDSCs and M2-like TAMs in TNBC mice, which was effectively reversed by YFD treatment. Therefore, we speculated that inactivation of MEK/ERK1/2 could play a role in the remodeling of the immune landscape by YFD.
We also investigated the metabolomic pathways affected by YFD administration in TNBC mice. Our findings revealed significant changes in various metabolic pathways, including the urea cycle, arginine and proline metabolism, D-arginine and D-ornithine metabolism, glutamate metabolism, the glucose–alanine cycle, alanine metabolism, the transfer of acetyl groups into the mitochondria, pyruvate metabolism, the Warburg effect, glycine and serine metabolism, and tryptophan metabolism. These changes may be responsible for the antitumor effects observed in YFD-treated mice.
Aberrant metabolism is correlated with the immune response in various cancers, including breast (108), lung (109), gastric, and colorectal cancers (110). The urea cycle (UC) in the liver converts excess nitrogen waste into disposable urea. Enzymes involved in UC, such as ornithine transcarbamylase (OTC), argininosuccinate synthase, argininosuccinate lyase, and arginase (ARG), are the primary sources of endogenous arginine, ornithine, and citrulline in the liver. These enzymes meet cellular needs (111). Changes in UC gene expression may contribute to cancer development and progression by affecting the expression of UC-related metabolites. Research has demonstrated that the overexpression of ARG1 and OTC leads to the accumulation of ammonia, which is often observed in cancer cells (112). This excess ammonia can be utilized and recycled by cancer cells through glutamate dehydrogenase to synthesize amino acids and nucleic acids, which fuel tumor growth (112). Moreover, modifications of UC enzymes within cancer cells can alter the TME, ultimately affecting the immune response and the initiation of metastasis.
Ovarian cancer cells reportedly secrete extracellular vesicles containing ARG1, thus suppressing antigen-specific T-cell proliferation. This leads to immune suppression and enhanced tumor growth (113). Cytoplasmic ornithine, an intermediate product of UC, is a substrate for ornithine decarboxylase (ODC) and plays a significant role in putrescine synthesis (114). Dysregulated ornithine metabolism and subsequently elevated polyamine biosynthesis have been linked to tumor growth (115). The inhibition of polyamine metabolism can result in decreased tumor growth by increasing T-cell infiltration and the accumulation of antitumorigenic M1-like TAMs (116, 117). Dysregulated biosynthesis of glycine, serine, and tryptophan, which are essential for the synthesis of proteins, nucleic acids, and lipids, has been implicated in immune function and cancer progression (118–120). A recent study reported that itaconate production by MDSCs inhibits the proliferation and function of CD8+ T cells by suppressing serine and glycine biosynthesis. This ultimately leads to increased tumor growth (121). Additionally, a study revealed that microbial indole production via tryptophan metabolism can activate aryl hydrocarbon receptors in TAMs. This leads to tumor-promoting polarization of TAMs and suppresses inflammatory CD8+ T-cell infiltration in the TME, ultimately promoting pancreatic ductal adenocarcinoma growth (122). Reprogramming the urea cycle; arginine, ornithine, and glutamate metabolism; and glycine, serine, and tryptophan metabolism could offer new perspectives for the development of anticancer therapies. Our study also revealed that YFD administration induced changes in metabolic profiles, which could explain the antitumor effects of YFD.
Several studies have demonstrated that abnormal glucose, amino acid, glutamine, and lipid metabolism are typical hallmarks of cancer (123) and can be used to predict the prognosis of patients with cancer (124–127). Tumor-derived exosomes can induce macrophages in a premetastatic environment to adopt an M2-like phenotype. This is achieved through the activation of NF-κB, which increases glycolysis and lactate production. These changes ultimately facilitate tumor metastasis (128). Aerobic glycolysis (the Warburg effect) has been shown to facilitate tumor invasion and metastasis by producing lactate, which plays a vital role as a proinflammatory and immunosuppressive mediator (129). Chen et al. reported that an acidic microenvironment caused by the Warburg effect can have a significant effect on the macrophage-mediated immunosurveillance of cancer cells. This was due to a shift from an M1-like phenotype to an M2-like phenotype (130). A recent study revealed that M2-like TAMs exhibit increased glucose uptake, leading to O-GlcNAcylation and the promotion of cancer metastasis and chemoresistance (73). Our study revealed that YFD administration could recondition aerobic glycolysis; however, further investigation is needed to understand the underlying mechanisms involved. Single-cell RNA transcriptomic and bioinformatics analyses can be used to screen for potential changes in the genes and pathways associated with TAMs and MDSCs induced by YFD.
We utilized a gene–metabolite expression interaction network to illustrate the relationships between the identified genes and metabolites. Correlation analysis revealed that the target gene LAD1 may affect methylcysteine, mannose, ribitol, melamine, alanine, aminoadipic acid, and prostaglandin E2 levels. Among these metabolites, mannose, ribitol, alanine, and prostaglandin E2 are associated with immune regulation and tumor growth (131–134). However, the direct and indirect effects of LAD1 on these metabolites remain to be elucidated.
This study has several limitations. First, although the bioactive components with anticancer properties of YFD were identified, the main ingredients that can reshape the TME and their targets or signaling pathways could not be validated. In the future, an approach combining integrated network pharmacology, molecular docking, and proteomics should be used to reveal the relationships underlying the component–target–action network. Second, the effects of YFD on TAMs and MDSCs should be tested in other breast cancer cell lines. This study primarily utilized the 4T1 syngeneic mouse model, which limits generalizability to other TNBC subtypes. Future work will validate YFD efficacy in additional models (e.g., MDA-MB-231 xenografts). Third, although YFD can recondition a wide range of metabolic pathways involved in cancer progression, the primary metabolic pathways involved in the anticancer effects of YFD on the TME have not been investigated. Finally, the limited efficacy observed at the low YFD dose (e.g., absence of a PET–CT metabolic response) suggests potential bioavailability thresholds (e.g., intestinal absorption barriers) and pharmacodynamic thresholds (e.g., insufficient target engagement). As this study prioritized validation of the formula’s holistic efficacy, systematic pharmacokinetic investigations (e.g., plasma exposure-AUC quantification) and dose-escalation experiments were not conducted, precluding a precise definition of the minimal effective dose and maximum tolerated dose. Future studies should quantify tumor drug concentrations via patient-derived xenograft (PDX) models coupled with LC–MS/MS and predict human dose–exposure relationships via physiologically based pharmacokinetic modeling. In addition, biomarker-guided dose exploration should be implemented to optimize the clinical therapeutic window of YFD.
Conclusion
In the present study, we used UHPLC-Q/Orbitrap MS and metabolomic and transcriptomic approaches to investigate the components and potential mechanisms of YFD in YFD treatment. These results suggest that YFD may target various immune regulatory pathways, leading to reshaping of the TME. This effect may be achieved by inactivating the MEK/ERK1/2 and LAD1 genes. Additionally, YFD may reprogram a wide range of altered metabolic pathways involved in cancer progression, such as the urea cycle and the metabolism of arginine, proline, D-arginine, D-ornithine, glutamate, pyruvate, the Warburg effect, glycine, serine, and tryptophan. Although YFD has been found to induce TME remodeling in BC, the underlying mechanisms require further investigation and validation. Specifically, the regulation of the urea cycle; aerobic glycolysis; and glycine, serine, tryptophan, and ornithine metabolism should be studied in more detail.
Data availability statement
The raw data supporting the conclusions of this article will be made available by the authors, without undue reservation.
Ethics statement
The animal study was approved by Institutional Animal Ethical Review Board of Zhongnan Hospital, Wuhan University. The study was conducted in accordance with the local legislation and institutional requirements.
Author contributions
CY: Writing – original draft. CJ: Investigation, Data curation, Writing – review & editing. GC: Writing – review & editing, Investigation. YL: Writing – review & editing, Investigation. YXL: Writing – review & editing, Investigation. YZ: Writing – review & editing, Funding acquisition.
Funding
The author(s) declare financial support was received for the research and/or publication of this article. This study was supported by the Chinese Medicine Key Project, Hubei Administration of Traditional Chinese Medicine, China (No. ZY2023Z009).
Conflict of interest
The authors declare that the research was conducted in the absence of any commercial or financial relationships that could be construed as a potential conflict of interest.
Generative AI statement
The author(s) declare that no Generative AI was used in the creation of this manuscript.
Any alternative text (alt text) provided alongside figures in this article has been generated by Frontiers with the support of artificial intelligence and reasonable efforts have been made to ensure accuracy, including review by the authors wherever possible. If you identify any issues, please contact us.
Publisher’s note
All claims expressed in this article are solely those of the authors and do not necessarily represent those of their affiliated organizations, or those of the publisher, the editors and the reviewers. Any product that may be evaluated in this article, or claim that may be made by its manufacturer, is not guaranteed or endorsed by the publisher.
Supplementary material
The Supplementary Material for this article can be found online at: https://www.frontiersin.org/articles/10.3389/fimmu.2025.1615631/full#supplementary-material
References
1. Siegel RL, Miller KD, Fuchs HE, and Jemal A. Cancer statistics, 2022. CA Cancer J Clin. (2022) 72:7–33. doi: 10.3322/caac.21708
2. Sung H, Ferlay J, Siegel RL, Laversanne M, Soerjomataram I, Jemal A, et al. Global cancer statistics 2020: GLOBOCAN estimates of incidence and mortality worldwide for 36 cancers in 185 countries. CA Cancer J Clin. (2021) 71:209–49. doi: 10.3322/caac.21660
3. Yin L, Duan JJ, Bian XW, and Yu SC. Triple-negative breast cancer molecular subtyping and treatment progress. Breast Cancer Res. (2020) 22:61. doi: 10.1186/s13058-020-01296-5
4. Borri F and Granaglia A. Pathology of triple negative breast cancer. Semin Cancer Biol. (2021) 72:136–45. doi: 10.1016/j.semcancer.2020.06.005
5. Lara-Medina F, Pérez-Sánchez V, Saavedra-Pérez D, Blake-Cerda M, Arce C, Motola-Kuba D, et al. Triple-negative breast cancer in Hispanic patients: high prevalence, poor prognosis, and association with menopausal status, body mass index, and parity. Cancer. (2011) 117:3658–69. doi: 10.1002/cncr.25961
6. Bianchini G, De Angelis C, Licata L, and Gianni L. Treatment landscape of triple-negative breast cancer-expanded options, evolving needs. Nat Rev Clin Oncol. (2022) 19:91–113. doi: 10.1038/s41571-021-00565-2
7. Ferrari P, Scatena C, Ghilli M, Bargagna I, Lorenzini G, and Nicolini A. Molecular mechanisms, biomarkers and emerging therapies for chemotherapy resistant TNBC. Int J Mol Sci. (2022) 23(3):1665. doi: 10.3390/ijms23031665
8. Deepak KGK, Vempati R, Nagaraju GP, Dasari VR, S N, Rao DN, et al. Tumor microenvironment: Challenges and opportunities in targeting metastasis of triple negative breast cancer. Pharmacol Res. (2020) 153:104683. doi: 10.1016/j.phrs.2020.104683
9. Xiao Y and Yu D. Tumor microenvironment as a therapeutic target in cancer. Pharmacol Ther. (2021) 221:107753. doi: 10.1016/j.pharmthera.2020.107753
10. Mehraj U, Ganai RA, Macha MA, Hamid A, Zargar MA, Bhat AA, et al. The tumor microenvironment as driver of stemness and therapeutic resistance in breast cancer: New challenges and therapeutic opportunities. Cell Oncol (Dordr). (2021) 44:1209–29. doi: 10.1007/s13402-021-00634-9
11. Li K, Shi H, Zhang B, Ou X, Ma Q, Chen Y, et al. Myeloid-derived suppressor cells as immunosuppressive regulators and therapeutic targets in cancer. Signal Transduct Target Ther. (2021) 6:362. doi: 10.1038/s41392-021-00670-9
12. Wu Y, Yi M, Niu M, Mei Q, and Wu K. Myeloid-derived suppressor cells: an emerging target for anticancer immunotherapy. Mol Cancer. (2022) 21:184. doi: 10.1186/s12943-022-01657-y
13. Basak U, Sarkar T, Mukherjee S, Chakraborty S, Dutta A, Dutta S, et al. Tumor-associated macrophages: an effective player of the tumor microenvironment. Front Immunol. (2023) 14:1295257. doi: 10.3389/fimmu.2023.1295257
14. Pan Y, Yu Y, Wang X, and Zhang T. Tumor-associated macrophages in tumor immunity. Front Immunol. (2020) 11:583084. doi: 10.3389/fimmu.2020.583084
15. Hubert P, Roncarati P, Demoulin S, Pilard C, Ancion M, Reynders C, et al. Extracellular HMGB1 blockade inhibits tumor growth through profoundly remodeling immune microenvironment and enhances checkpoint inhibitor-based immunotherapy. J Immunother Cancer. (2021) 9(3):e001966. doi: 10.1136/jitc-2020-001966
16. Deng Y, Hu JC, He SH, Lou B, Ding TB, Yang JT, et al. Sphingomyelin synthase 2 facilitates M2-like macrophage polarization and tumor progression in a mouse model of triple-negative breast cancer. Acta Pharmacol Sin. (2021) 42:149–59. doi: 10.1038/s41401-020-0419-1
17. Bergenfelz C, Roxå A, Mehmeti M, Leandersson K, and Larsson AM. Clinical relevance of systemic monocytic-MDSCs in patients with metastatic breast cancer. Cancer Immunol Immunother. (2020) 69:435–48. doi: 10.1007/s00262-019-02472-z
18. Sousa S, Brion R, Lintunen M, Kronqvist P, Sandholm J, Mönkkönen J, et al. Human breast cancer cells educate macrophages toward the M2 activation status. Breast Cancer Res. (2015) 17:101. doi: 10.1186/s13058-015-0621-0
19. Xiang X, Wang J, Lu D, and Xu X. Targeting tumor-associated macrophages to synergize tumor immunotherapy. Signal Transduct Target Ther. (2021) 6:75. doi: 10.1038/s41392-021-00484-9
21. Yang Z, Zhang Q, Yu L, Zhu J, Cao Y, and Gao X. The signaling pathways and targets of traditional Chinese medicine and natural medicine in triple-negative breast cancer. J Ethnopharmacol. (2021) 264:113249. doi: 10.1016/j.jep.2020.113249
22. Jiang H, Li M, Du K, Ma C, Cheng Y, Wang S, et al. Traditional Chinese Medicine for adjuvant treatment of breast cancer: Taohong Siwu Decoction. Chin Med. (2021) 16:129. doi: 10.1186/s13020-021-00539-7
23. Peng F, Wang L, Xiong L, Tang H, Du J, and Peng C. Maackiain modulates miR-374a/GADD45A axis to inhibit triple-negative breast cancer initiation and progression. Front Pharmacol. (2022) 13:806869. doi: 10.3389/fphar.2022.806869
24. Ganesan K, Xu C, Wu J, Du B, Liu Q, Sui Y, et al. Ononin inhibits triple-negative breast cancer lung metastasis by targeting the EGFR-mediated PI3K/Akt/mTOR pathway. Sci China Life Sci. (2024) 67(9):1849–66. doi: 10.1007/s11427-023-2499-2
25. Su L, Zhang F, Liu MX, Li H, Li Q, Zhu YZ, et al. The Tian-Men-Dong decoction suppresses the tumour-infiltrating G-MDSCs via IL-1β-mediated signalling in lung cancer. J Ethnopharmacol. (2023) 313:116491. doi: 10.1016/j.jep.2023.116491
26. Wang T, Wu L, Wang S, Shi X, Liu H, and Deng W. Chang Wei Qing Decoction enhances the anti-tumor effect of PD-1 inhibitor therapy by regulating the immune microenvironment and gut microbiota in colorectal cancer. Chin J Nat Med. (2023) 21:333–45. doi: 10.1016/S1875-5364(23)60451-0
27. Li J, Wang S, Wang N, Zheng Y, Yang B, Wang X, et al. Aiduqing formula inhibits breast cancer metastasis by suppressing TAM/CXCL1-induced Treg differentiation and infiltration. Cell Commun Signal. (2021) 19:89. doi: 10.1186/s12964-021-00775-2
28. Wang L, Wu W, Zhu X, Ng W, Gong C, Yao C, et al. The ancient chinese decoction yu-ping-feng suppresses orthotopic lewis lung cancer tumor growth through increasing M1 macrophage polarization and CD4(+) T cell cytotoxicity. Front Pharmacol. (2019) 10:1333. doi: 10.3389/fphar.2019.01333
29. Zhang Y. Aizheng xinzhifa-yiai fuzheng pingheng liaofa. Wuhan: Hubei Science & Technology Press (2019).
31. Guo R, Luo X, Liu J, Liu L, Wang X, and Lu H. Omics strategies decipher therapeutic discoveries of traditional Chinese medicine against different diseases at multiple layers molecular-level. Pharmacol Res. (2020) 152:104627. doi: 10.1016/j.phrs.2020.104627
32. Zihao Z, Raorao L, Yu C, Hui Y, Martin F, Qiaochu W, et al. Integration of traditional, complementary, and alternative medicine with modern biomedicine: the scientization, evidence, and challenges for integration of traditional Chinese medicine. Acupuncture Herbal Med. (2024) 4:68–78. doi: 10.1097/HM9.0000000000000089
33. Lehmann BD, Colaprico A, Silva TC, Chen J, An H, Ban Y, et al. Multi-omics analysis identifies therapeutic vulnerabilities in triple-negative breast cancer subtypes. Nat Commun. (2021) 12:6276. doi: 10.1038/s41467-021-26502-6
34. Xiao Y, Ma D, Zhao S, Suo C, Shi J, Xue MZ, et al. Multi-omics profiling reveals distinct microenvironment characterization and suggests immune escape mechanisms of triple-negative breast cancer. Clin Cancer Res. (2019) 25:5002–14. doi: 10.1158/1078-0432.CCR-18-3524
35. Nair A, Morsy MA, and Jacob S. Dose translation between laboratory animals and human in preclinical and clinical phases of drug development. Drug Dev Res. (2018) 79:373–82. doi: 10.1002/ddr.21461
36. Li R, Ke H, Liu P, Yang Q, Li Y, Ke L, et al. Mechanisms of Yiai Fuzheng formula in the treatment of triple-negative breast cancer based on UPLC-Q-Orbitrap-HRMS, network pharmacology, and experimental validation. Heliyon. (2024) 10:e36579. doi: 10.1016/j.heliyon.2024.e36579
37. Moon B, Yang SJ, Park SM, Lee SH, Song KS, Jeong EJ, et al. LAD1 expression is associated with the metastatic potential of colorectal cancer cells. BMC Cancer. (2020) 20:1180. doi: 10.1186/s12885-020-07660-0
38. Roth L, Srivastava S, Lindzen M, Sas-Chen A, Sheffer M, Lauriola M, et al. SILAC identifies LAD1 as a filamin-binding regulator of actin dynamics in response to EGF and a marker of aggressive breast tumors. Sci Signal. (2018) 11(515):eaan0949. doi: 10.1126/scisignal.aan0949
39. Kurozumi S, Joseph C, Raafat S, Sonbul S, Kariri Y, Alsaeed S, et al. Utility of ankyrin 3 as a prognostic marker in androgen-receptor-positive breast cancer. Breast Cancer Res Treat. (2019) 176:63–73. doi: 10.1007/s10549-019-05216-w
40. Zhang X, Groen K, Morten BC, Steffens Reinhardt L, Campbell HG, Braithwaite AW, et al. Effect of p53 and its N-terminally truncated isoform, Δ40p53, on breast cancer migration and invasion. Mol Oncol. (2022) 16:447–65. doi: 10.1002/1878-0261.13118
41. Li S, Wu D, Jia H, and Zhang Z. Long non-coding RNA LRRC75A-AS1 facilitates triple negative breast cancer cell proliferation and invasion via functioning as a ceRNA to modulate BAALC. Cell Death Dis. (2020) 11:643. doi: 10.1038/s41419-020-02821-2
42. Guo D, Zhang D, Ren M, Lu G, Zhang X, He S, et al. THBS4 promotes HCC progression by regulating ITGB1 via FAK/PI3K/AKT pathway. FASEB J. (2020) 34:10668–81. doi: 10.1096/fj.202000043R
43. Chang PH, Chen MC, Tsai YP, Tan GYT, Hsu PH, Jeng YM, et al. Interplay between desmoglein2 and hypoxia controls metastasis in breast cancer. Proc Natl Acad Sci U.S.A. (2021) 118(3):e2014408118. doi: 10.1073/pnas.2014408118
44. Hinshaw DC and Shevde LA. The tumor microenvironment innately modulates cancer progression. Cancer Res. (2019) 79:4557–66. doi: 10.1158/0008-5472.CAN-18-3962
45. So JY, Ohm J, Lipkowitz S, and Yang L. Triple negative breast cancer (TNBC): Non-genetic tumor heterogeneity and immune microenvironment: Emerging treatment options. Pharmacol Ther. (2022) 237:108253. doi: 10.1016/j.pharmthera.2022.108253
46. Huang S, Yao D, Shan C, Du X, Pan L, Wang N, et al. The protective mechanism of Tao Hong Si Wu decoction against breast cancer through regulation of EGFR/ERK1/2 signaling. J Ethnopharmacol. (2024) 332:118339. doi: 10.1016/j.jep.2024.118339
47. Lin X, Xu L, Gu M, Shao H, Yao L, and Huang X. Gegen Qinlian Decoction reverses oxaliplatin resistance in colorectal cancer by inhibiting YTHDF1-regulated m6A modification of GLS1. Phytomedicine. (2024) 133:155906. doi: 10.1016/j.phymed.2024.155906
48. Feng Z, Chan YT, Lu Y, Wu J, Xing T, Yuan H, et al. Siwu decoction suppress myeloid-derived suppressor cells through tumour cells necroptosis to inhibit hepatocellular carcinoma. Phytomedicine. (2024) 133:155913. doi: 10.1016/j.phymed.2024.155913
49. Han Y, Fan X, Fan L, Wu Y, Zhou Z, Wang G, et al. Liujunzi decoction exerts potent antitumor activity in oesophageal squamous cell carcinoma by inhibiting miR-34a/STAT3/IL-6R feedback loop, and modifies antitumor immunity. Phytomedicine. (2023) 111:154672. doi: 10.1016/j.phymed.2023.154672
50. Wang Y, Zhao T, Huang C, Liu F, Zhang Y, Kong D, et al. Effect and mechanism of Banxia Xiexin decoction in colorectal cancer: A network pharmacology approach. Phytomedicine. (2024) 123:155174. doi: 10.1016/j.phymed.2023.155174
51. Fisher B, Fisher ER, and Redmond C. Ten-year results from the National Surgical Adjuvant Breast and Bowel Project (NSABP) clinical trial evaluating the use of L-phenylalanine mustard (L-PAM) in the management of primary breast cancer. J Clin Oncol. (1986) 4:929–41. doi: 10.1200/JCO.1986.4.6.929
52. Meng Y, Han S, Yin J, and Wu J. Therapeutic copolymer from salicylic acid and l-phenylalanine as a nanosized drug carrier for orthotopic breast cancer with lung metastasis. ACS Appl Mater Interfaces. (2023) 15:41743–54. doi: 10.1021/acsami.3c08608
53. Girouard J, Belgorosky D, Hamelin-Morrissette J, Boulanger V, D’orio E, Ramla D, et al. Molecular therapy with derivatives of amino benzoic acid inhibits tumor growth and metastasis in murine models of bladder cancer through inhibition of TNFα/NFκB and iNOS/NO pathways. Biochem Pharmacol. (2020) 176:113778. doi: 10.1016/j.bcp.2019.113778
54. Xiang L, Fang C, Feng J, Tan Y, Wu Q, Zhou X, et al. Palmitic acid-modified human serum albumin paclitaxel nanoparticles targeting tumor and macrophages against breast cancer. Eur J Pharm Biopharm. (2023) 183:132–41. doi: 10.1016/j.ejpb.2022.12.016
55. Reyes-Farias M and Carrasco-Pozo C. The anti-cancer effect of quercetin: molecular implications in cancer metabolism. Int J Mol Sci. (2019) 20(13):3177. doi: 10.3390/ijms20133177
56. Chen J, Zhong K, Qin S, Jing Y, Liu S, Li D, et al. Astragalin: a food-origin flavonoid with therapeutic effect for multiple diseases. Front Pharmacol. (2023) 14:1265960. doi: 10.3389/fphar.2023.1265960
57. Jain N, Utreja D, Kaur K, and Jain P. Novel derivatives of nicotinic acid as promising anticancer agents. Mini Rev Med Chem. (2021) 21:847–82. doi: 10.2174/1389557520666201116144756
58. Zhou Y, Wang T, Zhai S, Li W, and Meng Q. Linoleic acid and breast cancer risk: a meta-analysis. Public Health Nutr. (2016) 19:1457–63. doi: 10.1017/S136898001500289X
59. Mirzaei S, Gholami MH, Zabolian A, Saleki H, Farahani MV, Hamzehlou S, et al. Caffeic acid and its derivatives as potential modulators of oncogenic molecular pathways: New hope in the fight against cancer. Pharmacol Res. (2021) 171:105759. doi: 10.1016/j.phrs.2021.105759
60. Žiberna L, Šamec D, Mocan A, Nabavi SF, Bishayee A, Farooqi AA, et al. Oleanolic acid alters multiple cell signaling pathways: implication in cancer prevention and therapy. Int J Mol Sci. (2017) 18(3):643. doi: 10.3390/ijms18030643
61. Gupta A, Atanasov AG, Li Y, Kumar N, and Bishayee A. Chlorogenic acid for cancer prevention and therapy: Current status on efficacy and mechanisms of action. Pharmacol Res. (2022) 186:106505. doi: 10.1016/j.phrs.2022.106505
62. Nouri Z, Fakhri S, Nouri K, Wallace CE, Farzaei MH, and Bishayee A. Targeting multiple signaling pathways in cancer: the rutin therapeutic approach. Cancers (Basel). (2020) 12(8):2276. doi: 10.3390/cancers12082276
63. Rahmani AH, Alsahli MA, Almatroudi A, Almogbel MA, Khan AA, Anwar S, et al. The potential role of apigenin in cancer prevention and treatment. Molecules. (2022) 27(18):6051. doi: 10.3390/molecules27186051
64. Wiciński M, Fajkiel-Madajczyk A, Kurant Z, Gajewska S, Kurant D, Kurant M, et al. Can asiatic acid from centella asiatica be a potential remedy in cancer therapy?-A review. Cancers (Basel). (2024) 16(7):1317. doi: 10.3390/cancers16071317
65. Farhan M. Green tea catechins: nature’s way of preventing and treating cancer. Int J Mol Sci. (2022) 23(18):10713. doi: 10.3390/ijms231810713
66. Vandersluis L, Mazurak VC, Damaraju S, and Field CJ. Determination of the relative efficacy of eicosapentaenoic acid and docosahexaenoic acid for anti-cancer effects in human breast cancer models. Int J Mol Sci. (2017) 18(12):2607. doi: 10.3390/ijms18122607
67. Bezerra DP, Soares AK, and De Sousa DP. Overview of the role of vanillin on redox status and cancer development. Oxid Med Cell Longev. (2016) 2016:9734816. doi: 10.1155/2016/9734816
68. Tay KC, Tan LT, Chan CK, Hong SL, Chan KG, Yap WH, et al. Formononetin: A review of its anticancer potentials and mechanisms. Front Pharmacol. (2019) 10:820. doi: 10.3389/fphar.2019.00820
69. Steggerda SM, Bennett MK, Chen J, Emberley E, Huang T, Janes JR, et al. Inhibition of arginase by CB-1158 blocks myeloid cell-mediated immune suppression in the tumor microenvironment. J Immunother Cancer. (2017) 5:101. doi: 10.1186/s40425-017-0308-4
70. De Cicco P, Ercolano G, and Ianaro A. The new era of cancer immunotherapy: targeting myeloid-derived suppressor cells to overcome immune evasion. Front Immunol. (2020) 11:1680. doi: 10.3389/fimmu.2020.01680
71. Fang W, Zhou T, Shi H, Yao M, Zhang D, Qian H, et al. Progranulin induces immune escape in breast cancer via up-regulating PD-L1 expression on tumor-associated macrophages (TAMs) and promoting CD8(+) T cell exclusion. J Exp Clin Cancer Res. (2021) 40:4. doi: 10.1186/s13046-020-01786-6
72. Yang H, Zhang Q, Xu M, Wang L, Chen X, Feng Y, et al. CCL2-CCR2 axis recruits tumor associated macrophages to induce immune evasion through PD-1 signaling in esophageal carcinogenesis. Mol Cancer. (2020) 19:41. doi: 10.1186/s12943-020-01165-x
73. Shi Q, Shen Q, Liu Y, Shi Y, Huang W, Wang X, et al. Increased glucose metabolism in TAMs fuels O-GlcNAcylation of lysosomal Cathepsin B to promote cancer metastasis and chemoresistance. Cancer Cell. (2022) 40:1207–1222.e1210. doi: 10.1016/j.ccell.2022.08.012
74. Varikuti S, Singh B, Volpedo G, Ahirwar DK, Jha BK, Saljoughian N, et al. Ibrutinib treatment inhibits breast cancer progression and metastasis by inducing conversion of myeloid-derived suppressor cells to dendritic cells. Br J Cancer. (2020) 122:1005–13. doi: 10.1038/s41416-020-0743-8
75. Noman MZ, Desantis G, Janji B, Hasmim M, Karray S, Dessen P, et al. PD-L1 is a novel direct target of HIF-1α, and its blockade under hypoxia enhanced MDSC-mediated T cell activation. J Exp Med. (2014) 211:781–90. doi: 10.1084/jem.20131916
76. Antonios JP, Soto H, Everson RG, Moughon D, Orpilla JR, Shin NP, et al. Immunosuppressive tumor-infiltrating myeloid cells mediate adaptive immune resistance via a PD-1/PD-L1 mechanism in glioblastoma. Neuro Oncol. (2017) 19:796–807. doi: 10.1093/neuonc/now287
77. Rodriguez PC, Ernstoff MS, Hernandez C, Atkins M, Zabaleta J, Sierra R, et al. Arginase I-producing myeloid-derived suppressor cells in renal cell carcinoma are a subpopulation of activated granulocytes. Cancer Res. (2009) 69:1553–60. doi: 10.1158/0008-5472.CAN-08-1921
78. Lu T, Ramakrishnan R, Altiok S, Youn JI, Cheng P, Celis E, et al. Tumor-infiltrating myeloid cells induce tumor cell resistance to cytotoxic T cells in mice. J Clin Invest. (2011) 121:4015–29. doi: 10.1172/JCI45862
79. Nagaraj S, Gupta K, Pisarev V, Kinarsky L, Sherman S, Kang L, et al. Altered recognition of antigen is a mechanism of CD8+ T cell tolerance in cancer. Nat Med. (2007) 13:828–35. doi: 10.1038/nm1609
80. Zhou J, Wu J, Chen X, Fortenbery N, Eksioglu E, Kodumudi KN, et al. Icariin and its derivative, ICT, exert anti-inflammatory, anti-tumor effects, and modulate myeloid derived suppressive cells (MDSCs) functions. Int Immunopharmacol. (2011) 11:890–8. doi: 10.1016/j.intimp.2011.01.007
81. Feng XY, Chen BC, Li JC, Li JM, Li HM, Chen XQ, et al. Gansui-Banxia Decoction extraction inhibits MDSCs accumulation via AKT/STAT3/ERK signaling pathways to regulate antitumor immunity in C57bl/6 mice. Phytomedicine. (2021) 93:153779. doi: 10.1016/j.phymed.2021.153779
82. Xu Y, Zeng H, Jin K, Liu Z, Zhu Y, Xu L, et al. Immunosuppressive tumor-associated macrophages expressing interlukin-10 conferred poor prognosis and therapeutic vulnerability in patients with muscle-invasive bladder cancer. J Immunother Cancer. (2022) 10(3):e003416. doi: 10.1136/jitc-2021-003416
83. Hwang I, Kim JW, Ylaya K, Chung EJ, Kitano H, Perry C, et al. Tumor-associated macrophage, angiogenesis and lymphangiogenesis markers predict prognosis of non-small cell lung cancer patients. J Transl Med. (2020) 18:443. doi: 10.1186/s12967-020-02618-z
84. Väyrynen JP, Haruki K, Lau MC, Väyrynen SA, Zhong R, Dias Costa A, et al. The prognostic role of macrophage polarization in the colorectal cancer microenvironment. Cancer Immunol Res. (2021) 9:8–19. doi: 10.1158/2326-6066.CIR-20-0527
85. Vitale I, Manic G, Coussens LM, Kroemer G, and Galluzzi L. Macrophages and metabolism in the tumor microenvironment. Cell Metab. (2019) 30:36–50. doi: 10.1016/j.cmet.2019.06.001
86. Meng Z, Zhang R, Wang Y, Zhu G, Jin T, Li C, et al. miR-200c/PAI-2 promotes the progression of triple negative breast cancer via M1/M2 polarization induction of macrophage. Int Immunopharmacol. (2020) 81:106028. doi: 10.1016/j.intimp.2019.106028
87. Xiao H, Guo Y, Li B, Li X, Wang Y, Han S, et al. M2-like tumor-associated macrophage-targeted codelivery of STAT6 inhibitor and IKKβ siRNA induces M2-to-M1 repolarization for cancer immunotherapy with low immune side effects. ACS Cent Sci. (2020) 6:1208–22. doi: 10.1021/acscentsci.9b01235
88. Wu K, Lin K, Li X, Yuan X, Xu P, Ni P, et al. Redefining tumor-associated macrophage subpopulations and functions in the tumor microenvironment. Front Immunol. (2020) 11:1731. doi: 10.3389/fimmu.2020.01731
89. Roskoski R Jr. Targeting ERK1/2 protein-serine/threonine kinases in human cancers. Pharmacol Res. (2019) 142:151–68. doi: 10.1016/j.phrs.2019.01.039
90. Zhang Z, Richmond A, and Yan C. Immunomodulatory properties of PI3K/AKT/mTOR and MAPK/MEK/ERK inhibition augment response to immune checkpoint blockade in melanoma and triple-negative breast cancer. Int J Mol Sci. (2022) 23(13):7353. doi: 10.3390/ijms23137353
91. Motoki K, Megahed M, Laforgia S, and Uitto J. Cloning and chromosomal mapping of mouse ladinin, a novel basement membrane zone component. Genomics. (1997) 39:323–30. doi: 10.1006/geno.1996.4507
92. Teixeira JC, De Filippo C, Weihmann A, Meneu JR, Racimo F, Dannemann M, et al. Long-term balancing selection in LAD1 maintains a missense trans-species polymorphism in humans, chimpanzees, and bonobos. Mol Biol Evol. (2015) 32:1186–96. doi: 10.1093/molbev/msv007
93. Li J, Wang Z, and Tie C. High expression of ladinin-1 (LAD1) predicts adverse outcomes: a new candidate docetaxel resistance gene for prostatic cancer (PCa). Bioengineered. (2021) 12:5749–59. doi: 10.1080/21655979.2021.1968647
94. Wang X and Guda C. Integrative exploration of genomic profiles for triple negative breast cancer identifies potential drug targets. Med (Baltimore). (2016) 95:e4321. doi: 10.1097/MD.0000000000004321
95. Roberts PJ and Der CJ. Targeting the Raf-MEK-ERK mitogen-activated protein kinase cascade for the treatment of cancer. Oncogene. (2007) 26:3291–310. doi: 10.1038/sj.onc.1210422
96. Barbosa R, Acevedo LA, and Marmorstein R. The MEK/ERK network as a therapeutic target in human cancer. Mol Cancer Res. (2021) 19:361–74. doi: 10.1158/1541-7786.MCR-20-0687
97. Marampon F, Ciccarelli C, and Zani BM. Biological rationale for targeting MEK/ERK pathways in anti-cancer therapy and to potentiate tumour responses to radiation. Int J Mol Sci. (2019) 20(10):2530. doi: 10.3390/ijms20102530
98. Mirzoeva OK, Das D, Heiser LM, Bhattacharya S, Siwak D, Gendelman R, et al. Basal subtype and MAPK/ERK kinase (MEK)-phosphoinositide 3-kinase feedback signaling determine susceptibility of breast cancer cells to MEK inhibition. Cancer Res. (2009) 69:565–72. doi: 10.1158/0008-5472.CAN-08-3389
99. Hoeflich KP, O’brien C, Boyd Z, Cavet G, Guerrero S, Jung K, et al. In vivo antitumor activity of MEK and phosphatidylinositol 3-kinase inhibitors in basal-like breast cancer models. Clin Cancer Res. (2009) 15:4649–64. doi: 10.1158/1078-0432.CCR-09-0317
100. Zhang X, Gao D, Fang K, Guo Z, and Li L. Med19 is targeted by miR-101-3p/miR-422a and promotes breast cancer progression by regulating the EGFR/MEK/ERK signaling pathway. Cancer Lett. (2019) 444:105–15. doi: 10.1016/j.canlet.2018.12.008
101. Dong Q, Yang B, Han JG, Zhang MM, Liu W, Zhang X, et al. A novel hydrogen sulfide-releasing donor, HA-ADT, suppresses the growth of human breast cancer cells through inhibiting the PI3K/AKT/mTOR and Ras/Raf/MEK/ERK signaling pathways. Cancer Lett. (2019) 455:60–72. doi: 10.1016/j.canlet.2019.04.031
102. Zhou YX, Zhang H, and Peng C. Puerarin: a review of pharmacological effects. Phytother Res. (2014) 28:961–75. doi: 10.1002/ptr.5083
103. Kang H, Zhang J, Wang B, Liu M, Zhao J, Yang M, et al. Puerarin inhibits M2 polarization and metastasis of tumor-associated macrophages from NSCLC xenograft model via inactivating MEK/ERK 1/2 pathway. Int J Oncol. (2017) 50:545–54. doi: 10.3892/ijo.2017.3841
104. Liu Q, Zhu H, Zhang C, Chen T, and Cao X. Small GTPase RBJ promotes cancer progression by mobilizing MDSCs via IL-6. Oncoimmunology. (2017) 6:e1245265. doi: 10.1080/2162402X.2016.1245265
105. Yu J, Li H, Zhang Z, Lin W, Wei X, and Shao B. Targeting the MDSCs of tumors in situ with inhibitors of the MAPK signaling pathway to promote tumor regression. Front Oncol. (2021) 11:647312. doi: 10.3389/fonc.2021.647312
106. Franklin DA, Sharick JT, Ericsson-Gonzalez PI, Sanchez V, Dean PT, Opalenik SR, et al. MEK activation modulates glycolysis and supports suppressive myeloid cells in TNBC. JCI Insight. (2020) 5(15):e134290. doi: 10.1172/jci.insight.134290
107. Yang B, Li X, Fu Y, Guo E, Ye Y, Li F, et al. MEK inhibition remodels the immune landscape of mutant KRAS tumors to overcome resistance to PARP and immune checkpoint inhibitors. Cancer Res. (2021) 81:2714–29. doi: 10.1158/0008-5472.CAN-20-2370
108. Zhang D, Xu X, and Ye Q. Metabolism and immunity in breast cancer. Front Med. (2021) 15:178–207. doi: 10.1007/s11684-020-0793-6
109. Eltayeb K, La Monica S, Tiseo M, Alfieri R, and Fumarola C. Reprogramming of lipid metabolism in lung cancer: an overview with focus on EGFR-mutated non-small cell lung cancer. Cells. (2022) 11(3):413. doi: 10.3390/cells11030413
110. Li Z and Zhang H. Reprogramming of glucose, fatty acid and amino acid metabolism for cancer progression. Cell Mol Life Sci. (2016) 73:377–92. doi: 10.1007/s00018-015-2070-4
111. Hajaj E, Sciacovelli M, Frezza C, and Erez A. The context-specific roles of urea cycle enzymes in tumorigenesis. Mol Cell. (2021) 81:3749–59. doi: 10.1016/j.molcel.2021.08.005
112. Mavri-Damelin D, Eaton S, Damelin LH, Rees M, Hodgson HJ, and Selden C. Ornithine transcarbamylase and arginase I deficiency are responsible for diminished urea cycle function in the human hepatoblastoma cell line HepG2. Int J Biochem Cell Biol. (2007) 39:555–64. doi: 10.1016/j.biocel.2006.10.007
113. Czystowska-Kuzmicz M, Sosnowska A, Nowis D, Ramji K, Szajnik M, Chlebowska-Tuz J, et al. Small extracellular vesicles containing arginase-1 suppress T-cell responses and promote tumor growth in ovarian carcinoma. Nat Commun. (2019) 10:3000. doi: 10.1038/s41467-019-10979-3
114. Cervelli M, Pietropaoli S, Signore F, Amendola R, and Mariottini P. Polyamines metabolism and breast cancer: state of the art and perspectives. Breast Cancer Res Treat. (2014) 148:233–48. doi: 10.1007/s10549-014-3156-7
115. Casero RA Jr., Murray Stewart T, and Pegg AE. Polyamine metabolism and cancer: treatments, challenges and opportunities. Nat Rev Cancer. (2018) 18:681–95. doi: 10.1038/s41568-018-0050-3
116. Chia TY, Zolp A, and Miska J. Polyamine immunometabolism: central regulators of inflammation, cancer and autoimmunity. Cells. (2022) 11(5):896. doi: 10.3390/cells11050896
117. Latour YL, Gobert AP, and Wilson KT. The role of polyamines in the regulation of macrophage polarization and function. Amino Acids. (2020) 52:151–60. doi: 10.1007/s00726-019-02719-0
118. Geeraerts SL, Heylen E, De Keersmaecker K, and Kampen KR. The ins and outs of serine and glycine metabolism in cancer. Nat Metab. (2021) 3:131–41. doi: 10.1038/s42255-020-00329-9
119. Platten M, Nollen E, Röhrig UF, Fallarino F, and Opitz CA. Tryptophan metabolism as a common therapeutic target in cancer, neurodegeneration and beyond. Nat Rev Drug Discov. (2019) 18:379–401. doi: 10.1038/s41573-019-0016-5
120. Parajuli G, Tekguc M, Wing JB, Hashimoto A, Okuzaki D, Hirata T, et al. Arid5a promotes immune evasion by augmenting tryptophan metabolism and chemokine expression. Cancer Immunol Res. (2021) 9:862–76. doi: 10.1158/2326-6066.CIR-21-0014
121. Zhao H, Teng D, Yang L, Xu X, Chen J, Jiang T, et al. Myeloid-derived itaconate suppresses cytotoxic CD8(+) T cells and promotes tumour growth. Nat Metab. (2022) 4:1660–73. doi: 10.1038/s42255-022-00676-9
122. Hezaveh K, Shinde RS, Klötgen A, Halaby MJ, Lamorte S, Ciudad MT, et al. Tryptophan-derived microbial metabolites activate the aryl hydrocarbon receptor in tumor-associated macrophages to suppress anti-tumor immunity. Immunity. (2022) 55:324–340.e328. doi: 10.1016/j.immuni.2022.01.006
123. Zhu L, Zhu X, and Wu Y. Effects of glucose metabolism, lipid metabolism, and glutamine metabolism on tumor microenvironment and clinical implications. Biomolecules. (2022) 12(4):580. doi: 10.3390/biom12040580
124. Zimbalist AS, Caan BJ, Chen WY, Mittendorf EA, Dillon D, Quesenberry C, et al. Metabolic abnormalities and survival among patients with non-metastatic breast cancer. BMC Cancer. (2022) 22:1361. doi: 10.1186/s12885-022-10430-9
125. Liu J, Shen H, Gu W, Zheng H, Wang Y, Ma G, et al. Prediction of prognosis, immunogenicity and efficacy of immunotherapy based on glutamine metabolism in lung adenocarcinoma. Front Immunol. (2022) 13:960738. doi: 10.3389/fimmu.2022.960738
126. Dai YW, Wen ZK, Wu ZX, Wu HD, Lv LX, Yan CZ, et al. Amino acid metabolism-related lncRNA signature predicts the prognosis of breast cancer. Front Genet. (2022) 13:880387. doi: 10.3389/fgene.2022.880387
127. Chen E, Yi J, Jiang J, Zou Z, Mo Y, Ren Q, et al. Identification and validation of a fatty acid metabolism-related lncRNA signature as a predictor for prognosis and immunotherapy in patients with liver cancer. BMC Cancer. (2022) 22:1037. doi: 10.1186/s12885-022-10122-4
128. Morrissey SM, Zhang F, Ding C, Montoya-Durango DE, Hu X, Yang C, et al. Tumor-derived exosomes drive immunosuppressive macrophages in a pre-metastatic niche through glycolytic dominant metabolic reprogramming. Cell Metab. (2021) 33:2040–2058.e2010. doi: 10.1016/j.cmet.2021.09.002
129. Reinfeld BI, Rathmell WK, Kim TK, and Rathmell JC. The therapeutic implications of immunosuppressive tumor aerobic glycolysis. Cell Mol Immunol. (2022) 19:46–58. doi: 10.1038/s41423-021-00727-3
130. Chen J, Cao X, Li B, Zhao Z, Chen S, Lai SWT, et al. Warburg effect is a cancer immune evasion mechanism against macrophage immunosurveillance. Front Immunol. (2020) 11:621757. doi: 10.3389/fimmu.2020.621757
131. Tucker JD, Doddapaneni R, Lu PJ, and Lu QL. Ribitol alters multiple metabolic pathways of central carbon metabolism with enhanced glycolysis: A metabolomics and transcriptomics profiling of breast cancer. PloS One. (2022) 17:e0278711. doi: 10.1371/journal.pone.0278711
132. Gonzalez PS, O’prey J, Cardaci S, Barthet VJA, Sakamaki JI, Beaumatin F, et al. Mannose impairs tumour growth and enhances chemotherapy. Nature. (2018) 563:719–23. doi: 10.1038/s41586-018-0729-3
133. Sousa CM, Biancur DE, Wang X, Halbrook CJ, Sherman MH, Zhang L, et al. Pancreatic stellate cells support tumour metabolism through autophagic alanine secretion. Nature. (2016) 536:479–83. doi: 10.1038/nature19084
Keywords: Yiai Fuzheng decoction, triple-negative breast cancer, tumor microenvironment, transcriptomic profiling, metabonomic profiling
Citation: Yu C, Jia C, Chen G, Li Y, Liu Y and Zhang Y (2025) Yiai Fuzheng decoction inhibits triple-negative breast cancer by remodeling the immune microenvironment. Front. Immunol. 16:1615631. doi: 10.3389/fimmu.2025.1615631
Received: 21 April 2025; Accepted: 08 September 2025;
Published: 30 September 2025.
Edited by:
Mohamad Taleuzzaman, Maulana Azad University, IndiaReviewed by:
Wenjia Tian, Peking University People’s Hospital, ChinaB Tazneem, Deccan School of Pharmacy, India
Copyright © 2025 Yu, Jia, Chen, Li, Liu and Zhang. This is an open-access article distributed under the terms of the Creative Commons Attribution License (CC BY). The use, distribution or reproduction in other forums is permitted, provided the original author(s) and the copyright owner(s) are credited and that the original publication in this journal is cited, in accordance with accepted academic practice. No use, distribution or reproduction is permitted which does not comply with these terms.
*Correspondence: Yingwen Zhang, aGhhbzM4MzhAc2luYS5jb20=
†These authors have contributed equally to this work