 Wenwang Lang
 Liuyong Mei2
- 1Department of Pharmacy, Nanxishan Hospital of Guangxi Zhuang Autonomous Region, Guilin, China
- 2Department of Oncology, Nanxishan Hospital of Guangxi Zhuang Autonomous Region, Guilin, China
- 3Department of Spine Surgery, Nanxishan Hospital of Guangxi Zhuang Autonomous Region, Guilin, China
Background: Cadonilimab, a bispecific antibody targeting programmed cell death protein 1 (PD-1) and cytotoxic T-lymphocyte-associated protein 4 (CTLA-4), was the first agent of its class to demonstrate promising therapeutic efficacy in combination with chemotherapy for patients diagnosed with advanced gastric or gastroesophageal junction adenocarcinoma (GC/GEJC). This economic evaluation aimed to determine whether cadonilimab plus chemotherapy offers cost-effective benefits compared to chemotherapy alone from both the U.S. and Chinese healthcare payer perspectives. In addition, we estimated the pricing thresholds at which cadonilimab would be considered economically viable as a first-line treatment.
Methods: We constructed a Markov model comprising three health states, progression-free survival (PFS), progressive disease (PD), and death, spanning a 10-year time horizon. The clinical efficacy data were sourced from the randomized phase 3 COMPASSION-15 trial. The cost and utility parameters were derived from existing literature. The model calculates total costs, quality-adjusted life-years (QALYs), and incremental cost-effectiveness ratios (ICERs). Subgroup, scenario, and sensitivity analyses were performed, and price simulations explored cost-effective thresholds at defined willingness-to-pay (WTP) levels.
Results: In the base-case analysis, the cadonilimab plus chemotherapy provided an incremental gain of 0.33 QALYs at an additional cost of $16,797.61, resulting in an ICER of $50,582.10 per QALY, above the WTP threshold of China of $40,354.27 per QALY. In the U.S. setting, although the combination therapy achieved a slightly higher incremental QALY gain of 0.35 QALYs, the substantial additional cost of $101,275.06 resulted in an unfavorable ICER of $290,498.45 per QALY, exceeding the U.S. WTP threshold of $150,000.00. Among Chinese patients with a PD-L1 combined positive score (CPS) ≥5, the ICER was lower at $37,499.27/QALY, rendering the therapy cost-effective. Simulations identified cadonilimab pricing below $209.54/125 mg (China) and $826.46/125 mg (the U.S.) as necessary for cost-effectiveness.
Conclusion: Cadonilimab combined with chemotherapy may be cost-effective in Chinese patients with elevated PD-L1 expression. However, its broader use in other patient subgroups or countries requires significant price reductions. These findings provide important guidance for future reimbursements and pricing decisions.
Introduction
Gastric cancer (GC), including tumors located at the gastroesophageal junction (GEJC), is the fourth most prevalent malignancy globally and is a major contributor to cancer-related mortality (1). In 2020, it accounted for approximately 1.1 million new cases and over 768,000 deaths worldwide (2). Epidemiological data reveal substantial regional disparities in disease burden: China reports roughly 358,700 new GC/GEJC cases and more than 260,400 annual deaths (3), while the United States reports around 30,300 new cases and over 10,780 deaths each year (4). A critical shared challenge in both regions is that most patients are diagnosed at an advanced stage, which severely restricts treatment options and undermines long-term prognosis. The most common histological type of gastric cancer is adenocarcinoma, with the majority being human epidermal growth factor receptor 2 (HER2)-negative (5, 6). Despite advances in medical technology, more than 50% of patients with gastric cancer present with metastatic and unresectable tumors at diagnosis. Anti-programmed cell death protein-1 (PD-1) and programmed death ligand 1 (PD-L1) inhibitors combined with chemotherapy have become the standard of care for first-line treatment of HER2-negative, unresectable locally advanced or metastatic gastric or gastroesophageal junction (GC/GEJ) adenocarcinoma (7–11). Although the addition of a PD-1 inhibitor to chemotherapy improves outcomes, survival benefits remain limited in patients with low PD-L1 expression.
Cadonilimab is a human tetravalent bispecific IgG1 antibody with a symmetric IgG single-chain variable fragment (scFv) structure and an Fc-null design to eliminate antibody-dependent cellular cytotoxicity (ADCC), antibody-dependent cellular phagocytosis (ADCP), complement-dependent cytotoxicity (CDC), and cytokine release. Fc receptor-mediated effector functions can eliminate or impair lymphocytes expressing PD-1 and cytotoxic T-lymphocyte-associated protein 4 (CTLA-4), thereby reducing their antitumor activity (Supplementary Figure 1). Moreover, immune-related adverse events (irAEs) induced by checkpoint inhibitors have been associated with the recruitment of immune cells bearing Fc receptors (12, 13). Cadonilimab has shown promising clinical activity and manageable safety in patients with gastric or GEJ adenocarcinoma, regardless of PD-L1 expression (14).
In the phase 3 COMPASSION-15 trial (15), both progression-free survival (PFS) and overall survival (OS) significantly improved in the cadonilimab group. In the intention-to-treat (ITT) population, the median OS was 15.0 months versus 10.8 months; in patients with PD-L1 combined positive score (CPS) ≥5, the median OS was not reached versus 10.6 months; and in those with PD-L1 CPS <5, it was 14.8 months versus 11.1 months. The median PFS was 7.0 months in the cadonilimab group compared to 5.3 months in the placebo group. Among patients with PD-L1 CPS ≥5, PFS was 6.9 months with cadonilimab and 4.6 months with placebo, while in the PD-L1 CPS <5 group, PFS was 6.9 months versus 5.5 months.
Cadonilimab is the world’s first PD-1/CTLA-4 bispecific antibody tumor immunotherapy drug developed independently in China and provides critical evidence supporting updates to clinical practice guidelines for gastric cancer. Despite its clinical potential, there is no comprehensive evidence of its economic value. Cadonilimab has been granted orphan drug status and fast-track designation by the U.S. FDA and is expected to receive market approval as early as 2026. As a next-generation immunotherapy agent, it is projected to be a key component of the global oncology market, which is valued at nearly USD 100 billion. However, its high price triggered two rounds of price reductions in China, from $1,856.30 to $865.80, and then to $261.17 per 125 mg, raising concerns about affordability and cost-effectiveness. The absence of pricing information in the U.S. further complicates economic evaluations. Additionally, cadonilimab may soon be included in National Comprehensive Cancer Network (NCCN) Guidelines (16), underscoring the need for cost-effectiveness data to inform clinical and policy decisions in both regions.
This study aimed to assess the cost-effectiveness of cadonilimab in combination with chemotherapy versus chemotherapy alone as first-line treatment for advanced GC/GEJC from both U.S. and Chinese healthcare payer perspectives, thereby informing future drug pricing and reimbursement decisions.
Methods
Patient enrollment and intervention
This study followed the Consolidated Health Economic Evaluation Reporting Standards (CHEERS) guidelines (17). Eligible patients were between 18 and 75 years of age and had histologically confirmed, locally advanced, unresectable, or metastatic GC/GEJC. None of the patients had previously received systemic therapy for advanced disease. Patient characteristics and inclusion criteria were consistent with those described in the COMPASSION-15 clinical trial.
The participants were randomly assigned to receive either cadonilimab (10 mg/kg, administered intravenously) or a placebo every 21 days for up to 24 months. Both groups received concurrent chemotherapy with capecitabine (1,000 mg/m² orally, twice daily on days 1–14) and oxaliplatin (130 mg/m² intravenously on day 1), repeated in 21-day cycles for up to six cycles (XELOX regimen). Following the combination phase, the patients continued with cadonilimab or placebo as monotherapy.
Subsequent treatments, including PD-1 inhibitors, targeted agents, chemotherapy, or best supportive care, were performed in accordance with the NCCN (16) and Chinese Society of Clinical Oncology (CSCO) guidelines for gastric cancer (18) and were consistent with post-treatment strategies used in the COMPASSION-15 trial (15). Tumor assessments were performed every six weeks during the first 54 weeks after enrollment and every nine weeks thereafter.
Adverse events (AEs) were monitored with a particular focus on severe (grade ≥3) events occurring in more than 3% of patients. These included anemia, neutropenia, thrombocytopenia, and hypokalemia (Table 1).
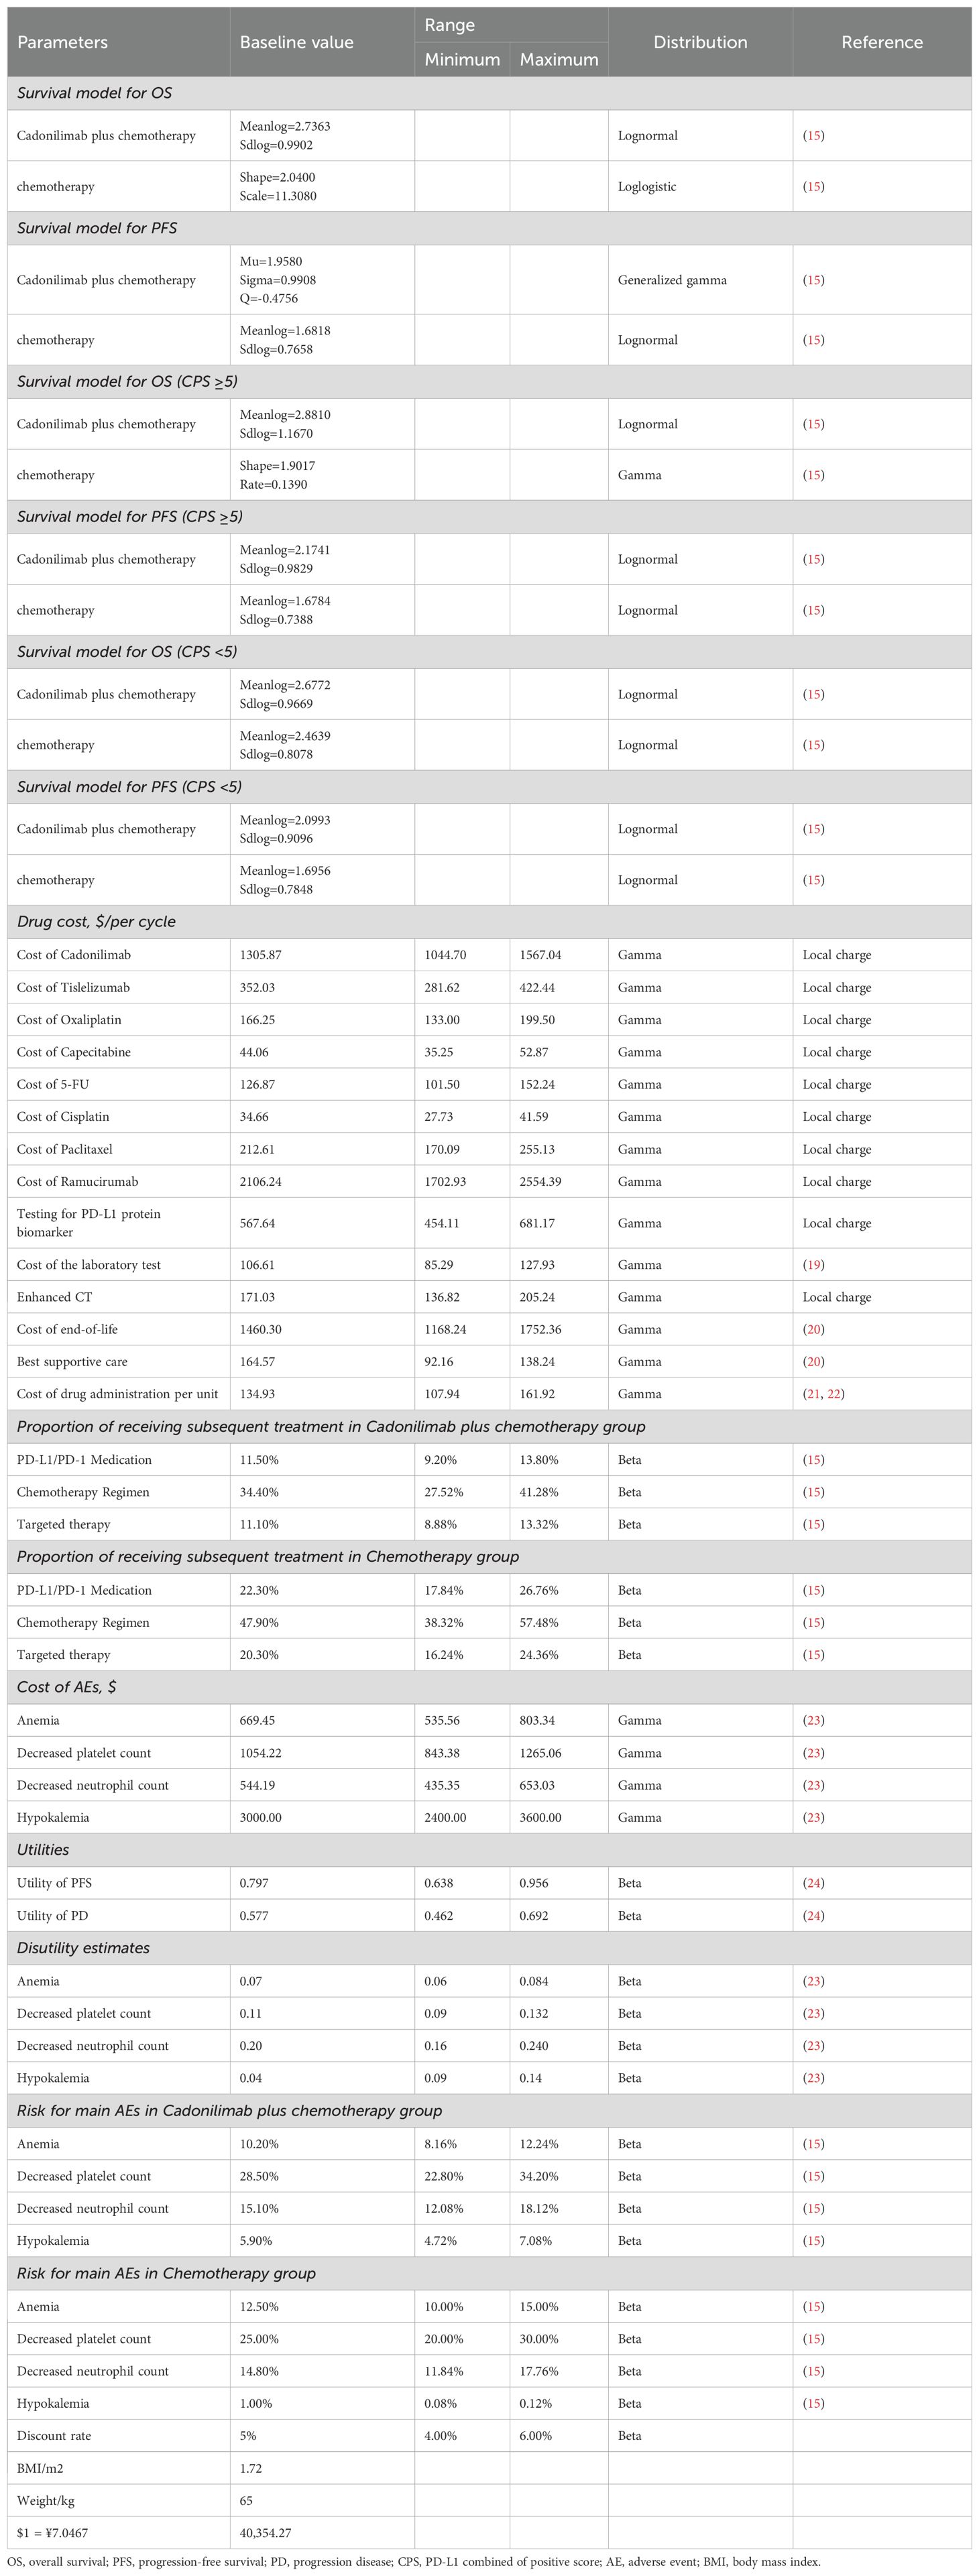
Table 1. Key clinical input data.
Model structure
A three-state Markov model was constructed using TreeAge Pro 2022 (Williamstown, MA, USA) and R version 4.2.4 (Vienna, Austria). Health states included PFS, progressive disease (PD), and death (Figure 1). The model employed a 3-week cycle length over a 10-year time horizon, representing the lifetime of the patient population and capturing over 99% mortality.
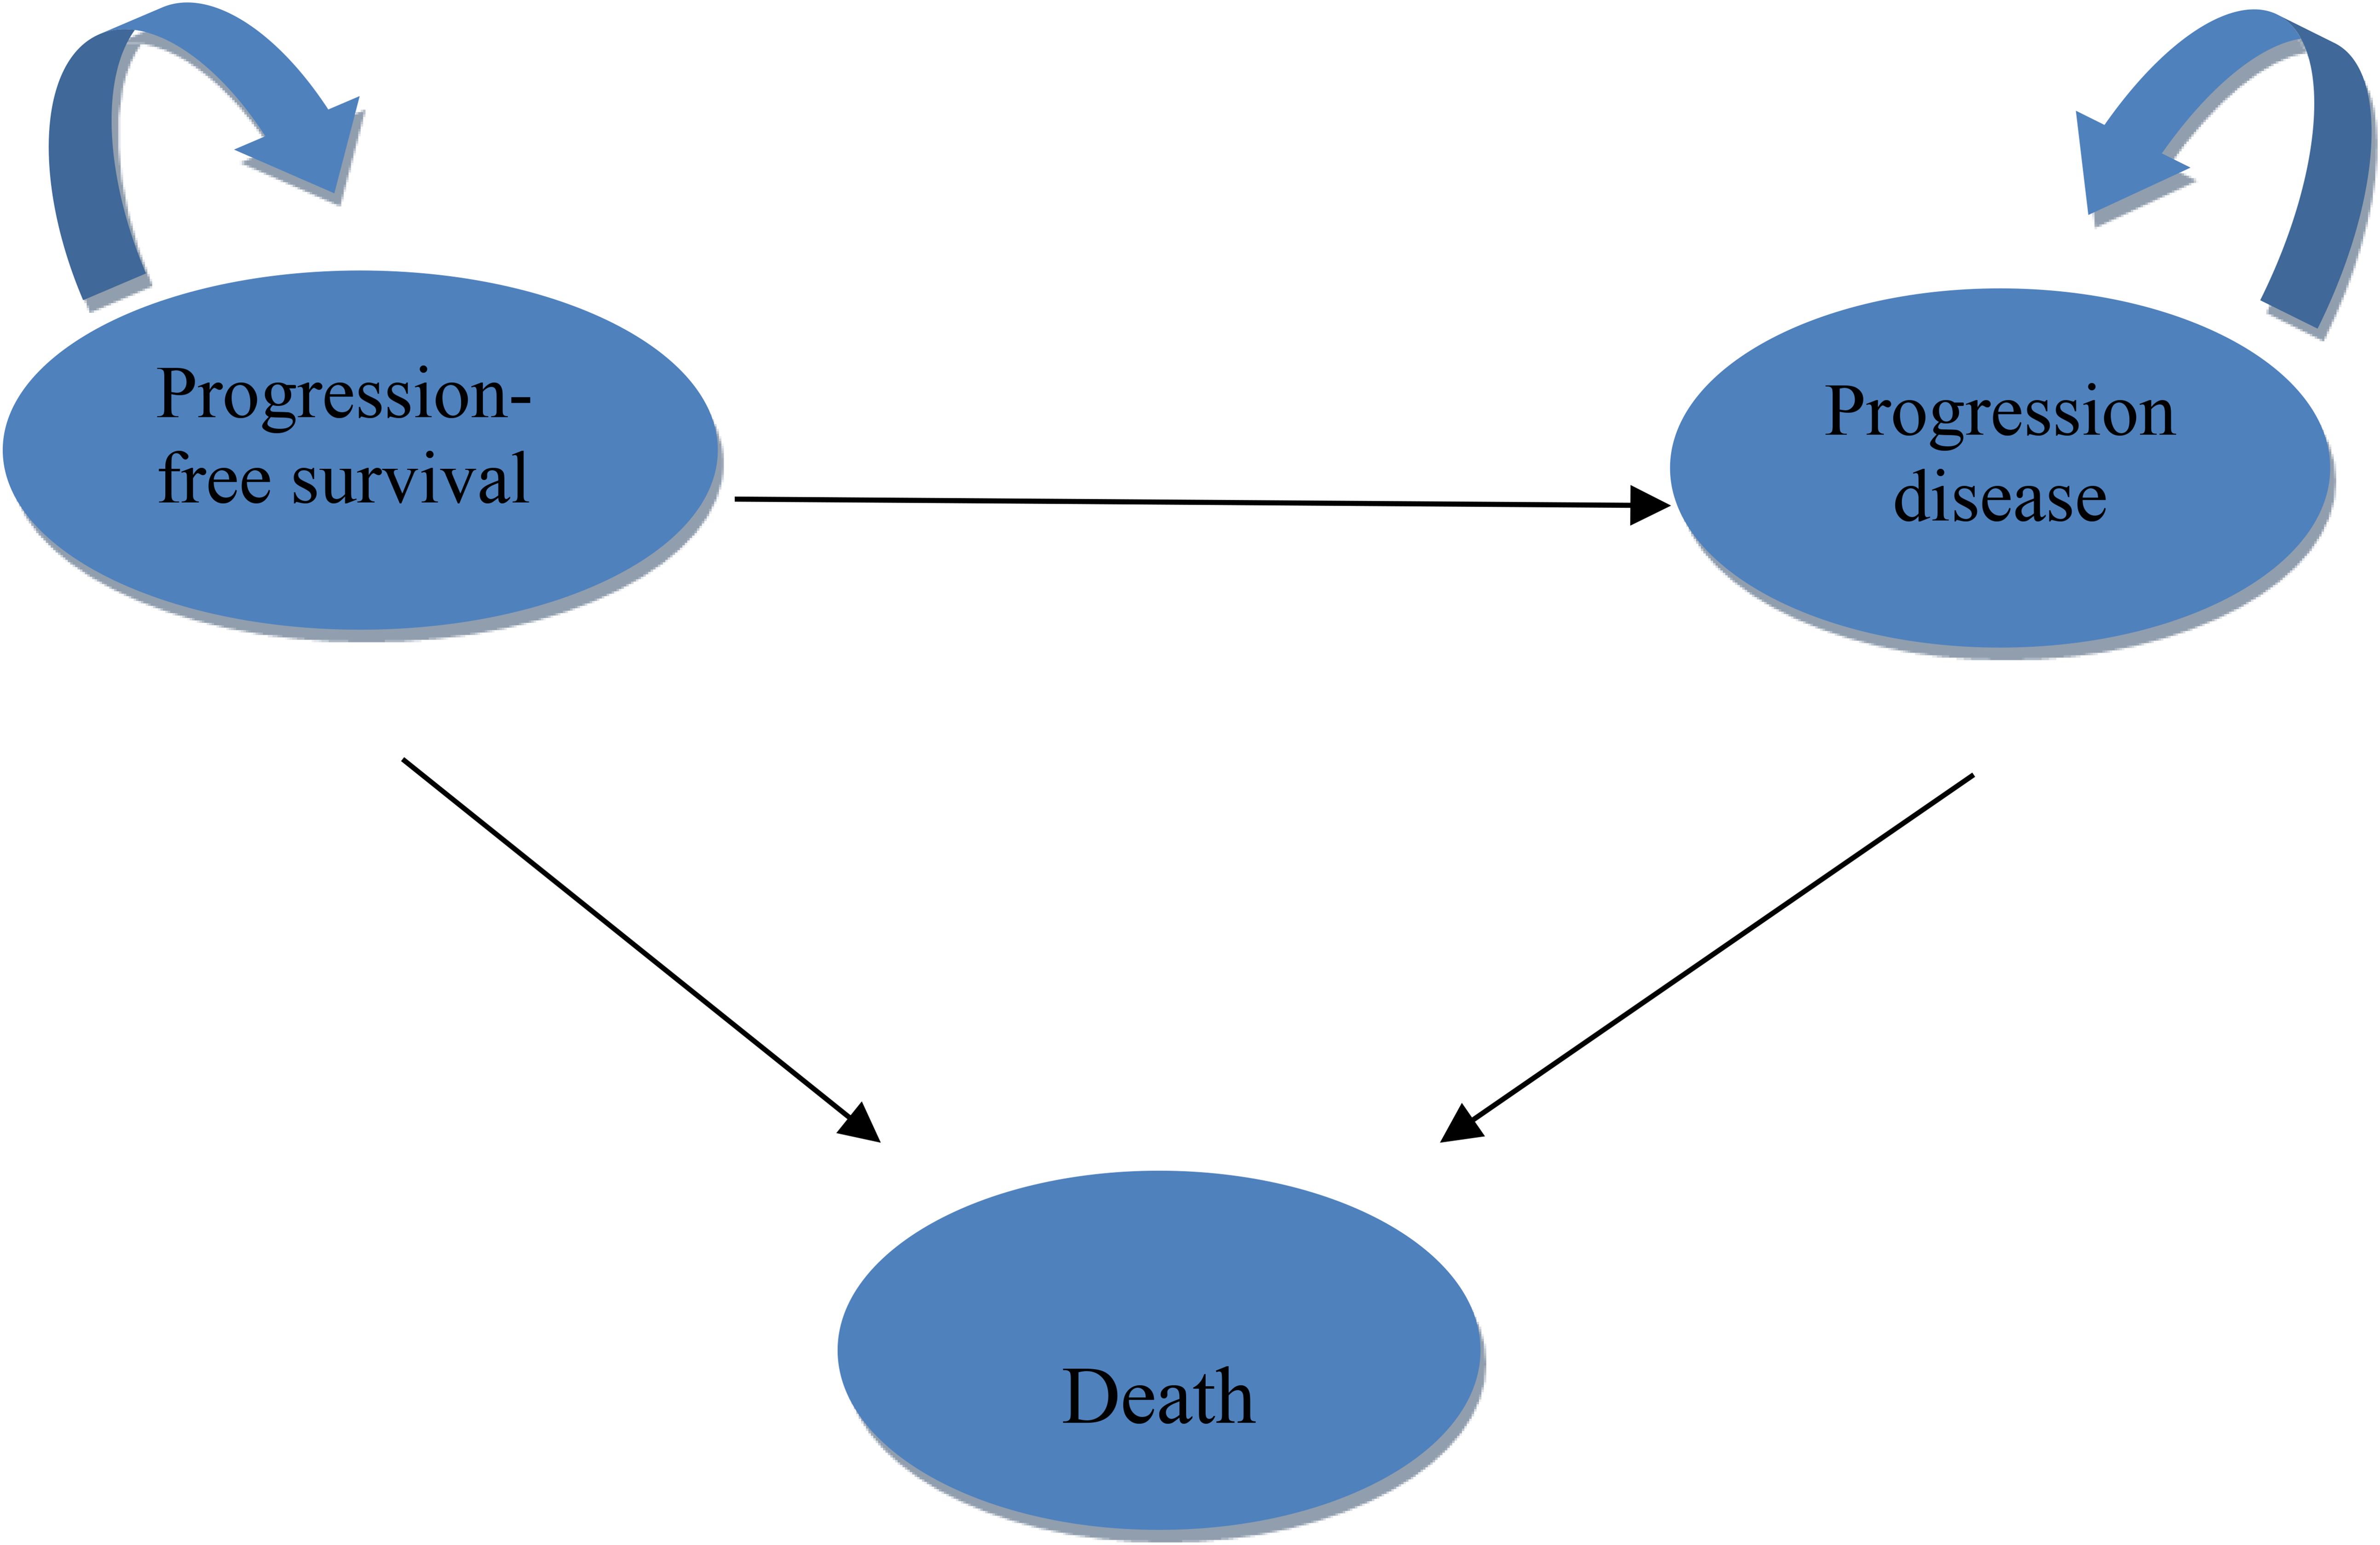
Figure 1. Markov model structure.
The analysis was conducted from the perspective of healthcare payers in both China and the United States. The Chinese model adopted a system-wide healthcare payer perspective, whereas the U.S. analysis focused on direct medical costs relevant to both public and private payers (25).
Outcomes
The model evaluated total life years, quality-adjusted life years (QALYs), incremental cost-effectiveness ratios (ICERs), incremental net health benefits (INHB), and incremental net monetary benefits (INMB). Annual discount rates were applied to both costs and utilities—3% for the U.S. and 5% for China—in accordance with established pharmacoeconomic guidelines (26, 27).
Chinese cost data were converted to 2024 U.S. dollars using an exchange rate of $1 = ¥7.1217 and were adjusted for inflation using the local consumer price index. The willingness-to-pay (WTP) thresholds were set at $40,354.27 per QALY in China (three times the national gross domestic product per capita) and $150,000 per QALY in the U.S., consistent with standards established by the WHO and U.S. healthcare payers (28).
Clinical data inputs
Probabilities for OS and PFS were extracted from Kaplan–Meier (KM) curves in the ASTRUM-005 trial using the GetData Graph Digitizer (http://getdata-graph-digitizer.com), and individual patient data were reconstructed following the method described by Guyot et al. (29).
Due to limited follow-up, extrapolation was required to extend survival estimates across the model’s full time horizon (30). The reconstructed time-to-event data were then fitted with a series of parametric models, including classic models (exponential, Weibull, Gompertz, gamma, log-logistic, log-normal, and generalized gamma).
Model selection was guided by a combination of statistical goodness-of-fit based on the Akaike information criterion (AIC), extrapolation performance based on log likelihood (LogLik), and visual inspection. Using this framework, the most suitable parametric model was chosen to extrapolate KM curves for OS and PFS beyond the follow-up period of the COMPASSION-15 trial (consistent with the trial referenced earlier for treatment protocols) (Figures 2–4). Before implementing the Cox proportional hazards (PH) model, the PH assumption—a core prerequisite for valid model inference—was validated using two complementary methods: visual inspection of log-log survival curves and quantitative assessment of Schoenfeld residuals (31, 32). While the PH assumption yielded p-values > 0.05 for both OS and PFS across all patient groups (nominally suggesting the assumption was satisfied), two critical observations indicated potential violation: crossing cumulative hazard curves between the treatment and control arms, and a non-horizontal trend in the smoothed Schoenfeld residuals. The variation in predicted hazards across different parameter distributions is shown in Figures 5–7. The corresponding survival function parameters are detailed in Tables 2–4.
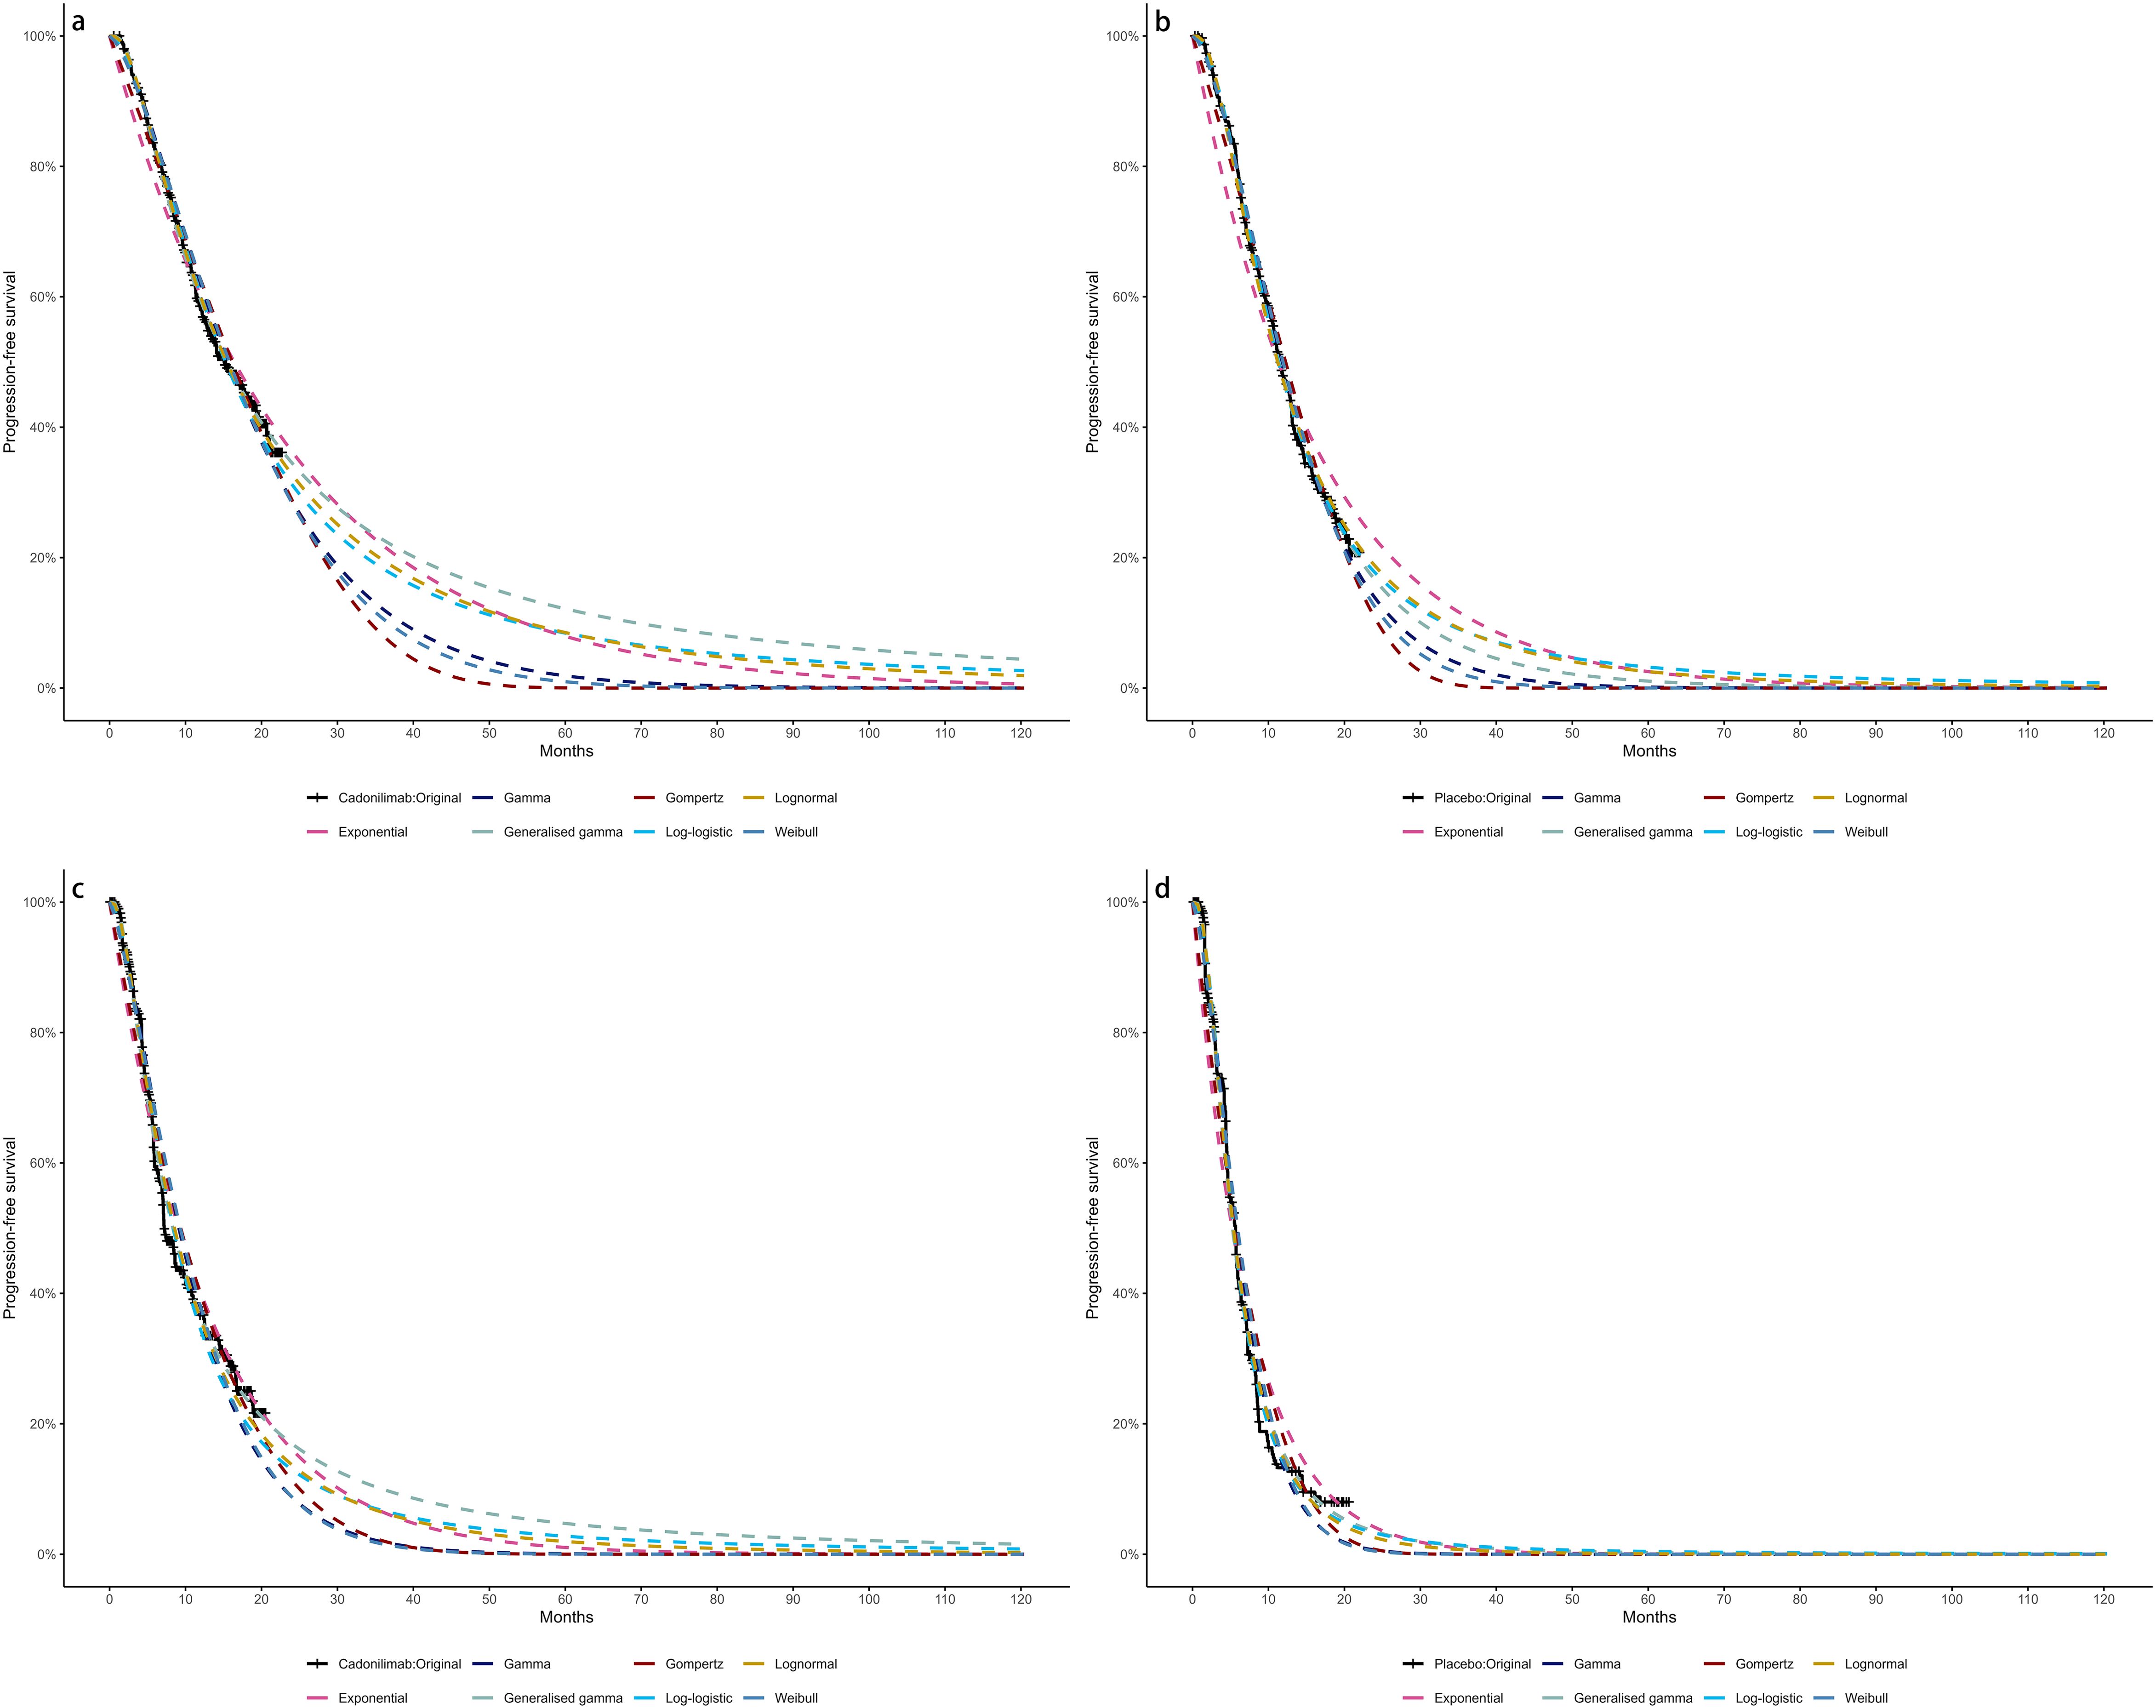
Figure 2. The Kaplan-Meier: (A) overall survival curves of Cadonilimab plus chemotherapy group, (B) overall survival curves of Chemotherapy group, (C) progression-free survival curves of Cadonilimab plus chemotherapy group, (D) progression-free survival curves of Chemotherapy group.
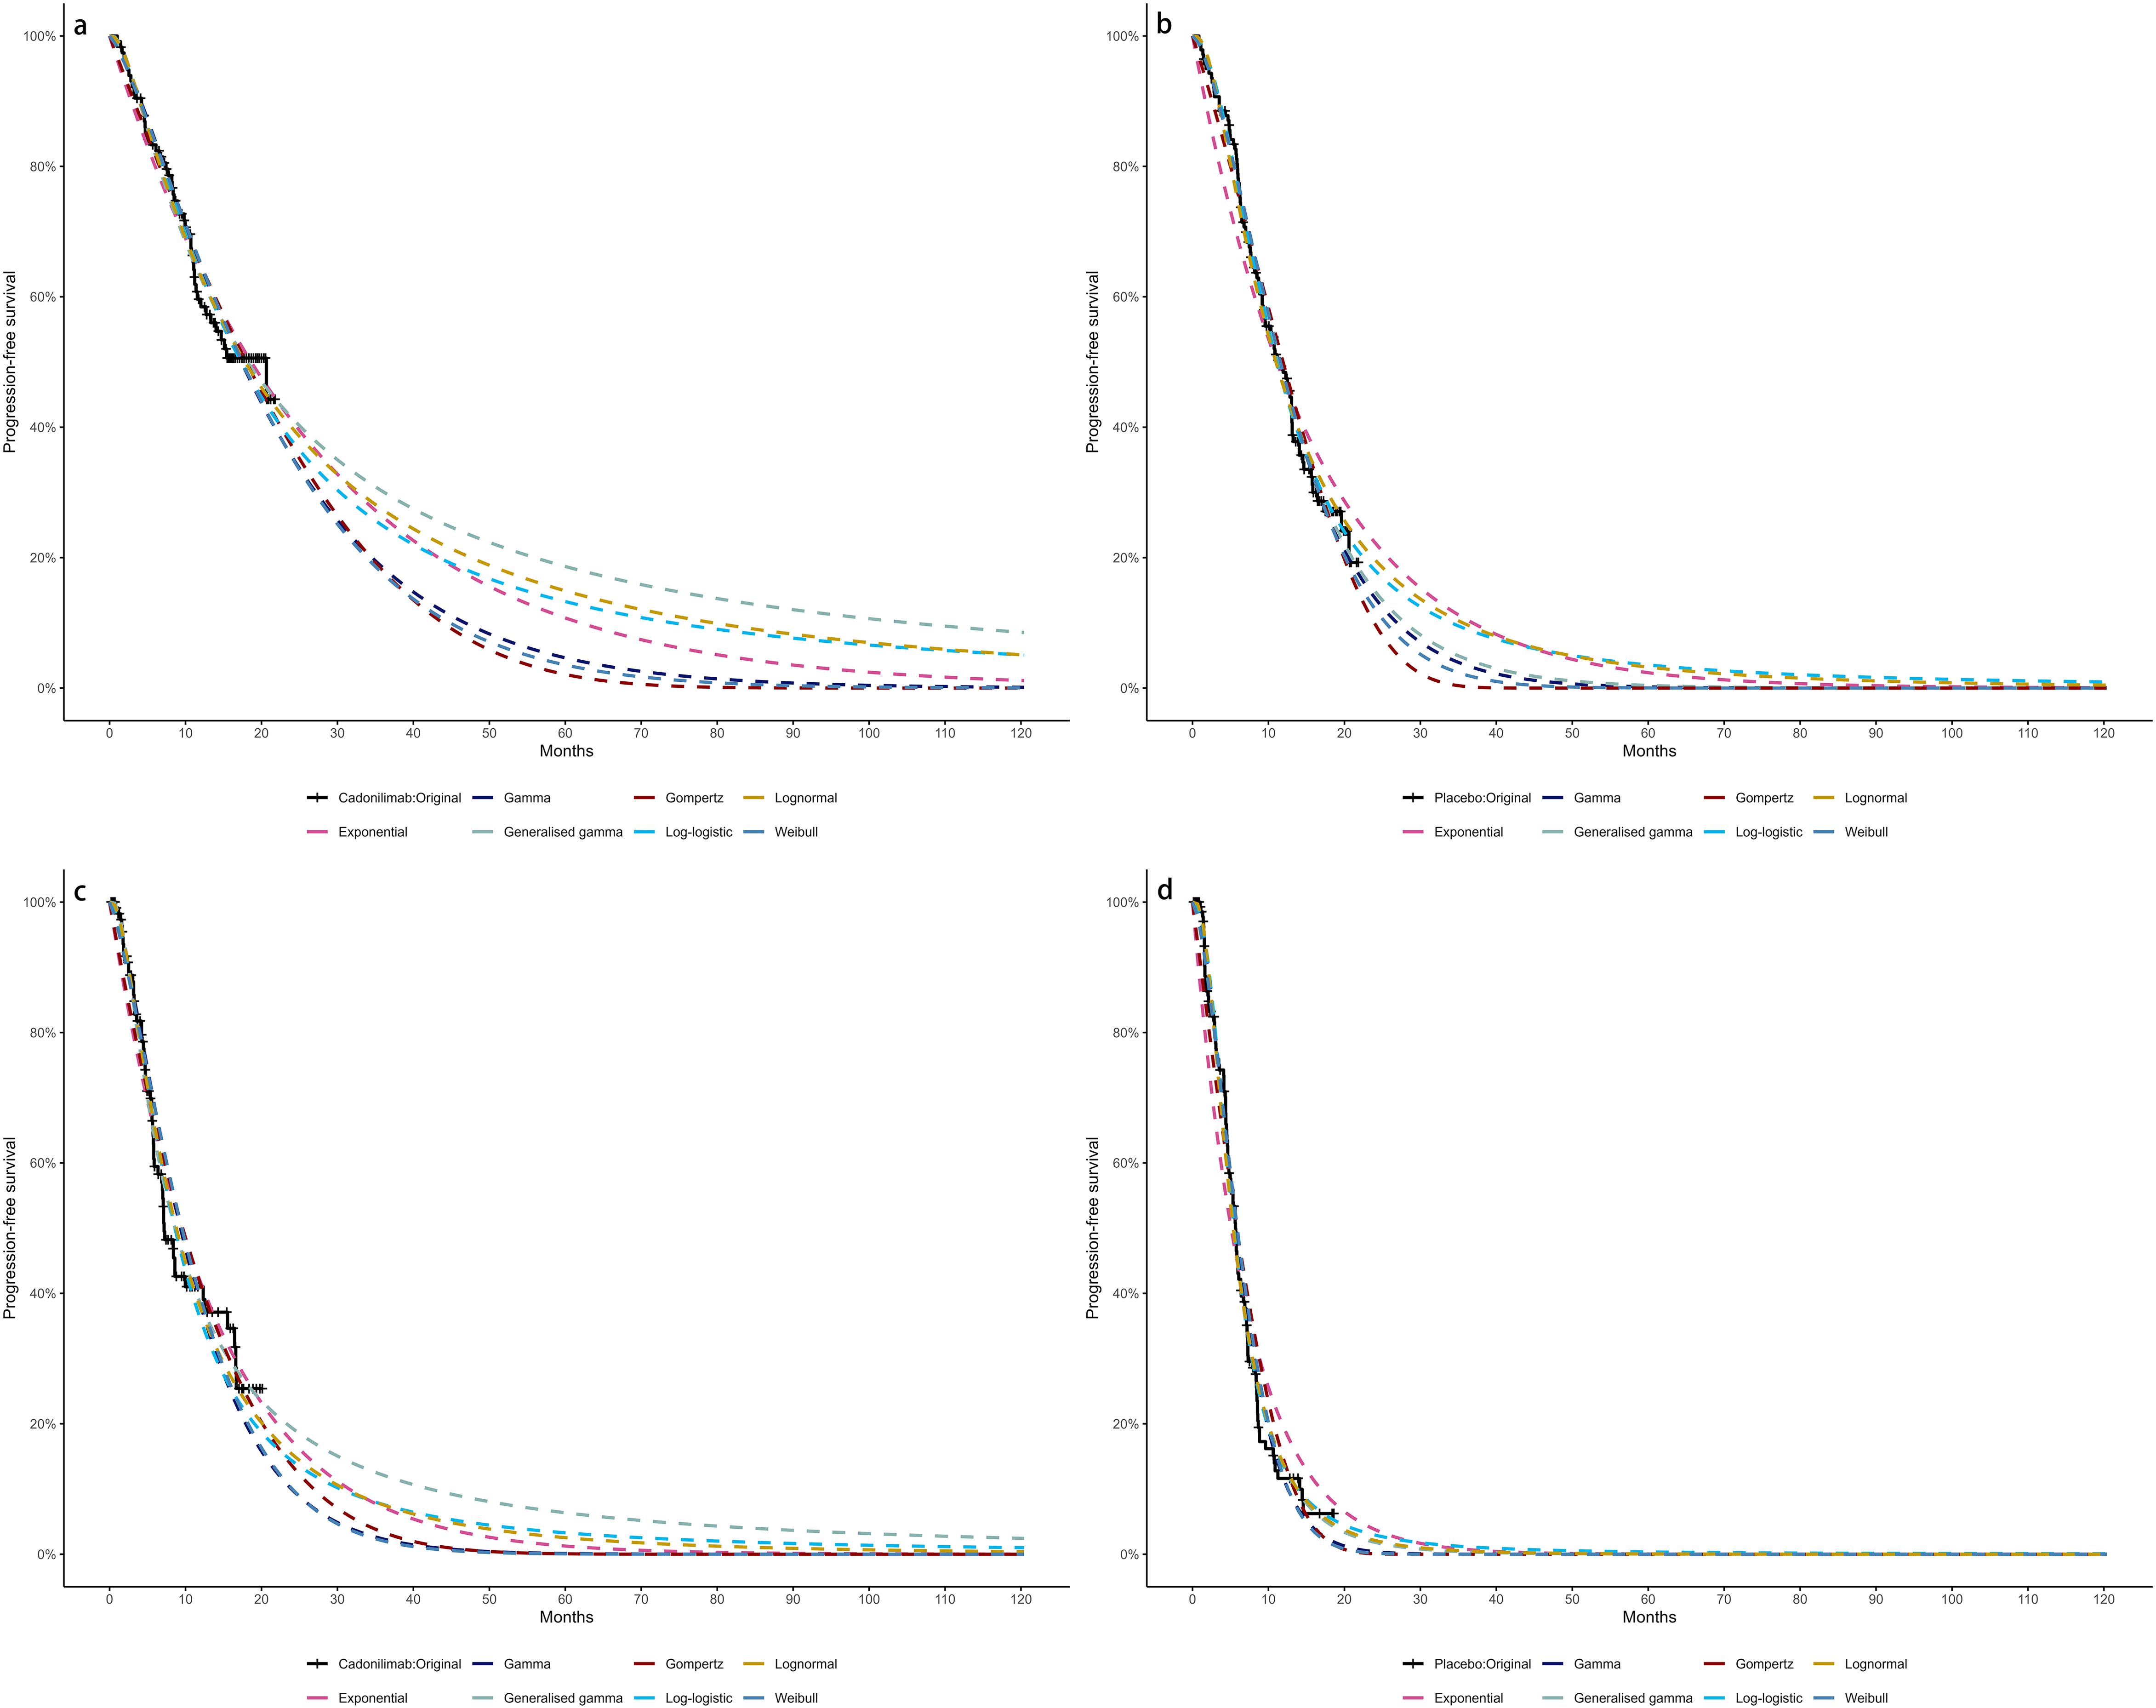
Figure 3. The Kaplan-Meier of CPS ≥ 5: (A) overall survival curves of Cadonilimab plus chemotherapy group, (B) overall survival curves of Chemotherapy group, (C) progression-free survival curves of Cadonilimab plus chemotherapy group, (D) progression-free survival curves of Chemotherapy group.
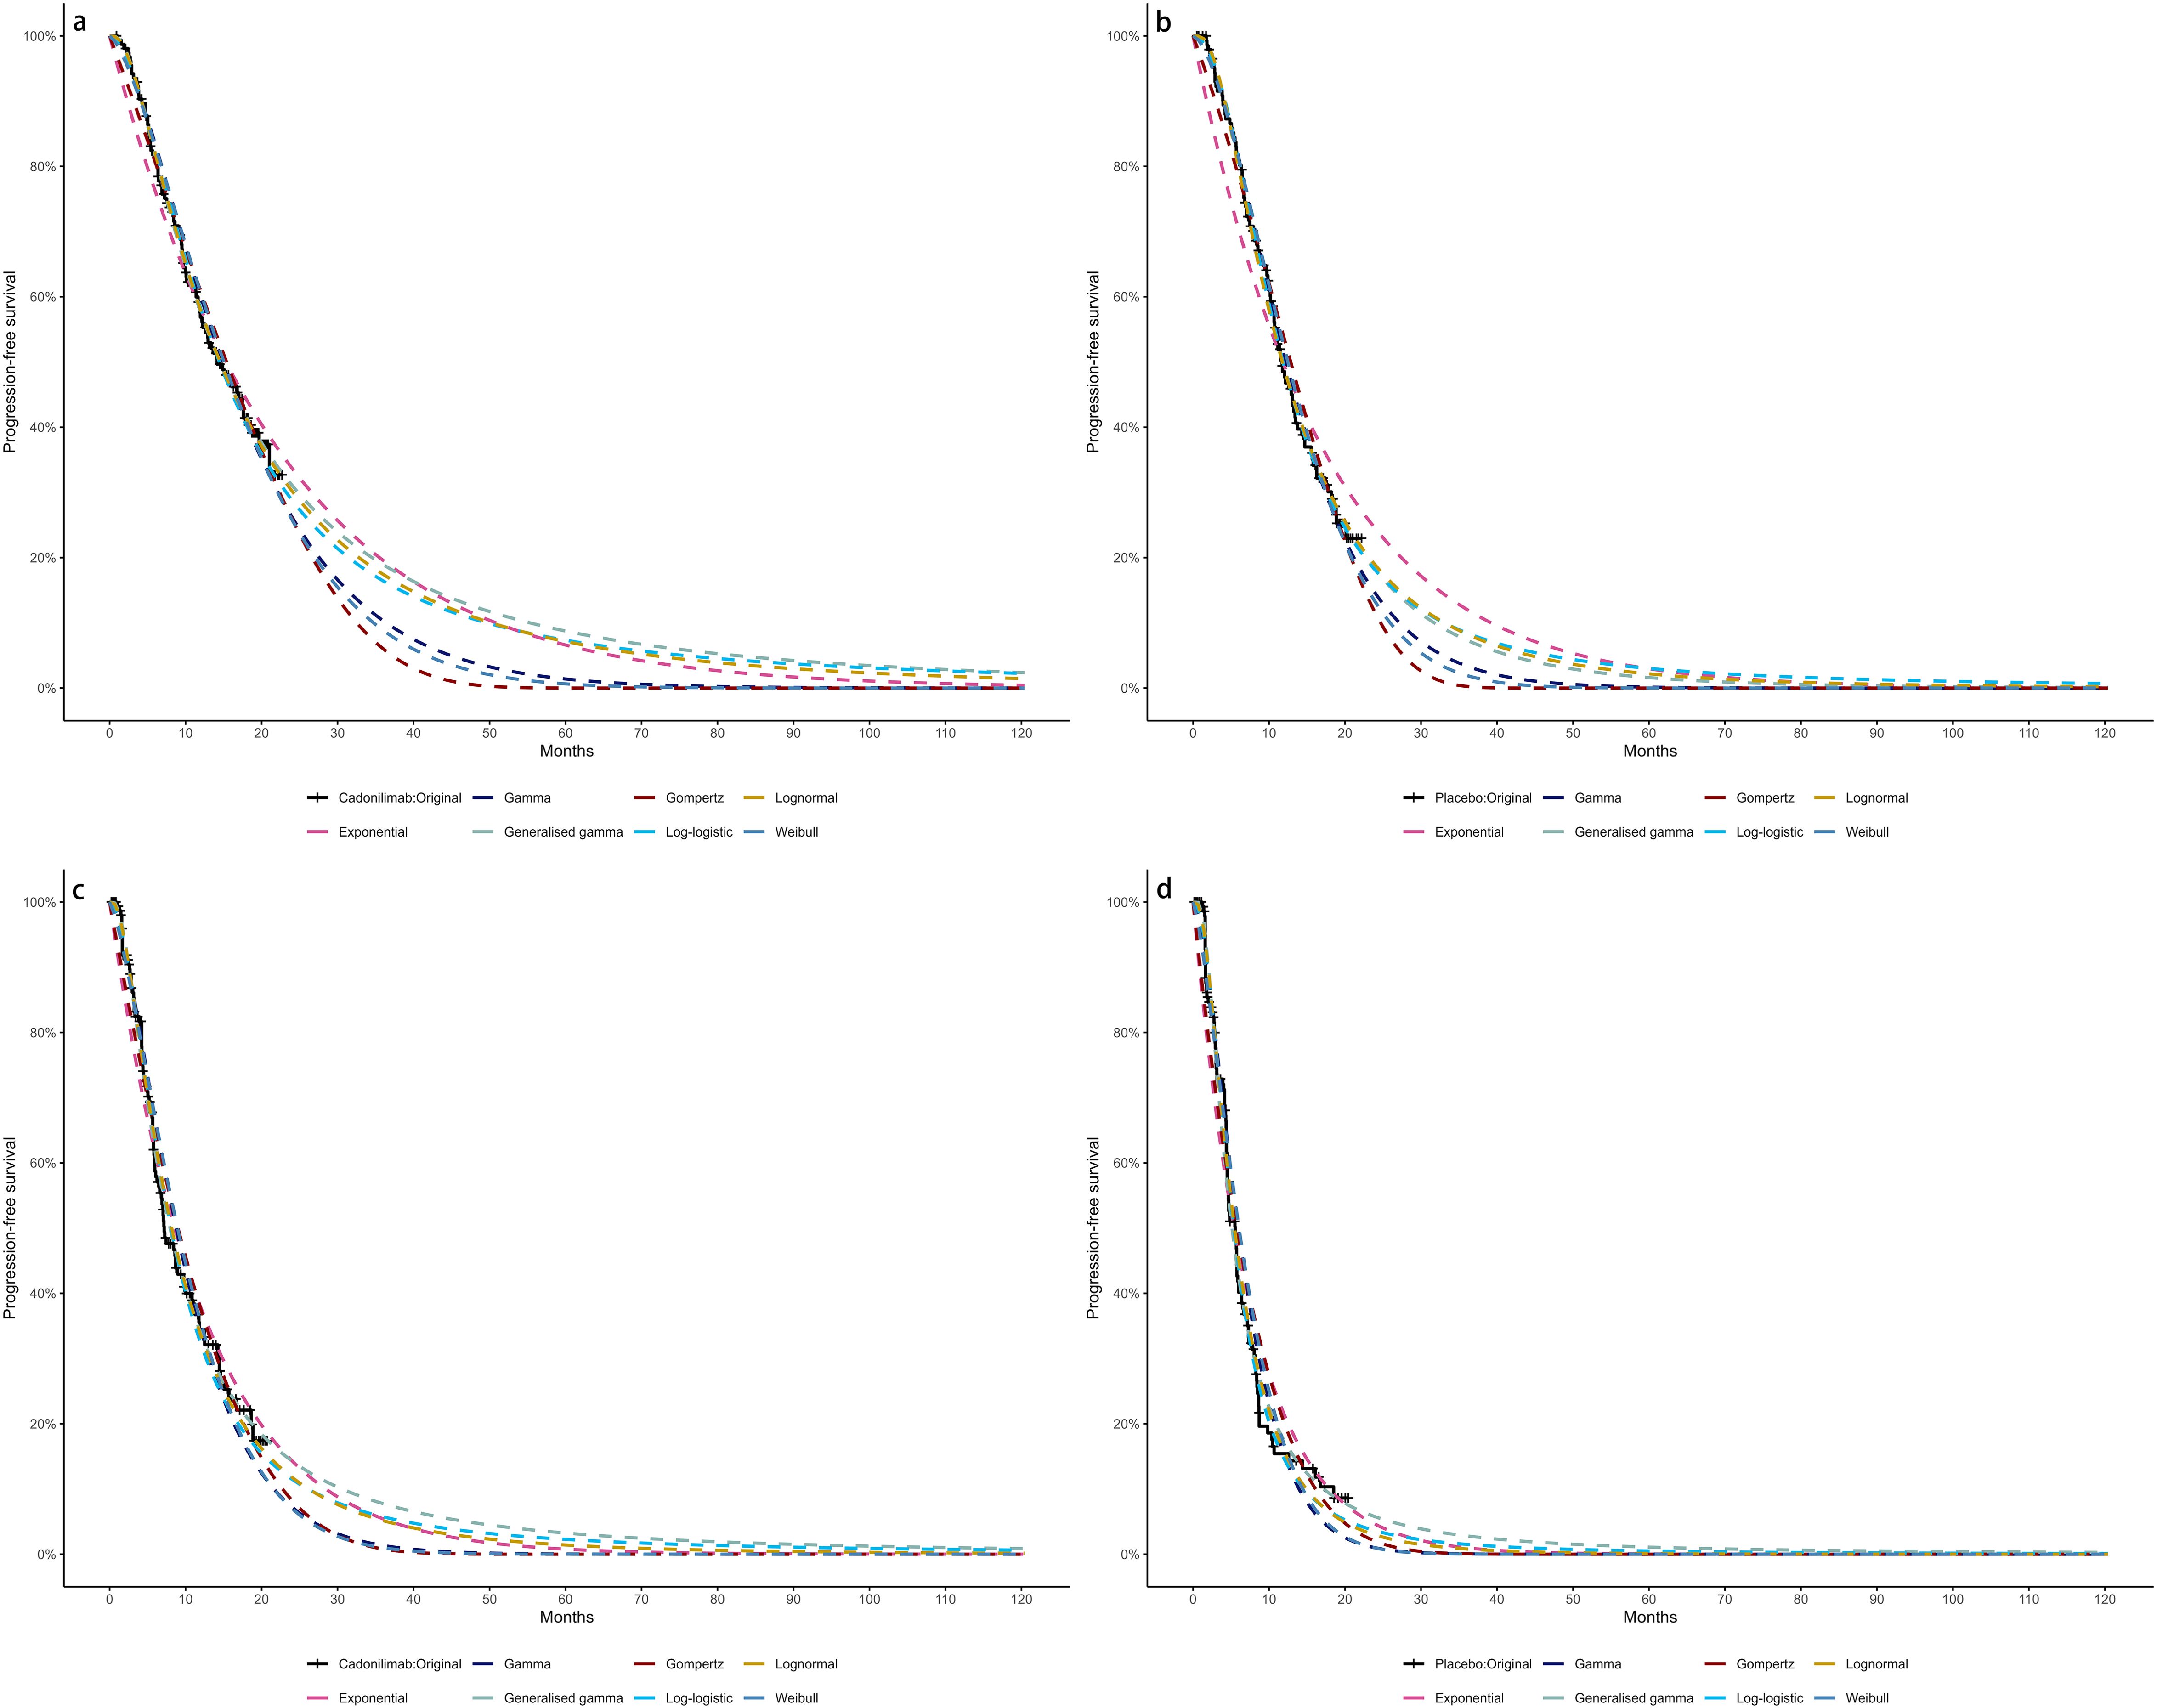
Figure 4. The Kaplan-Meier of CPS <5: (A) overall survival curves of Cadonilimab plus chemotherapy group, (B) overall survival curves of Chemotherapy group, (C) progression-free survival curves of Cadonilimab plus chemotherapy group, (D) progression-free survival curves of Chemotherapy group.
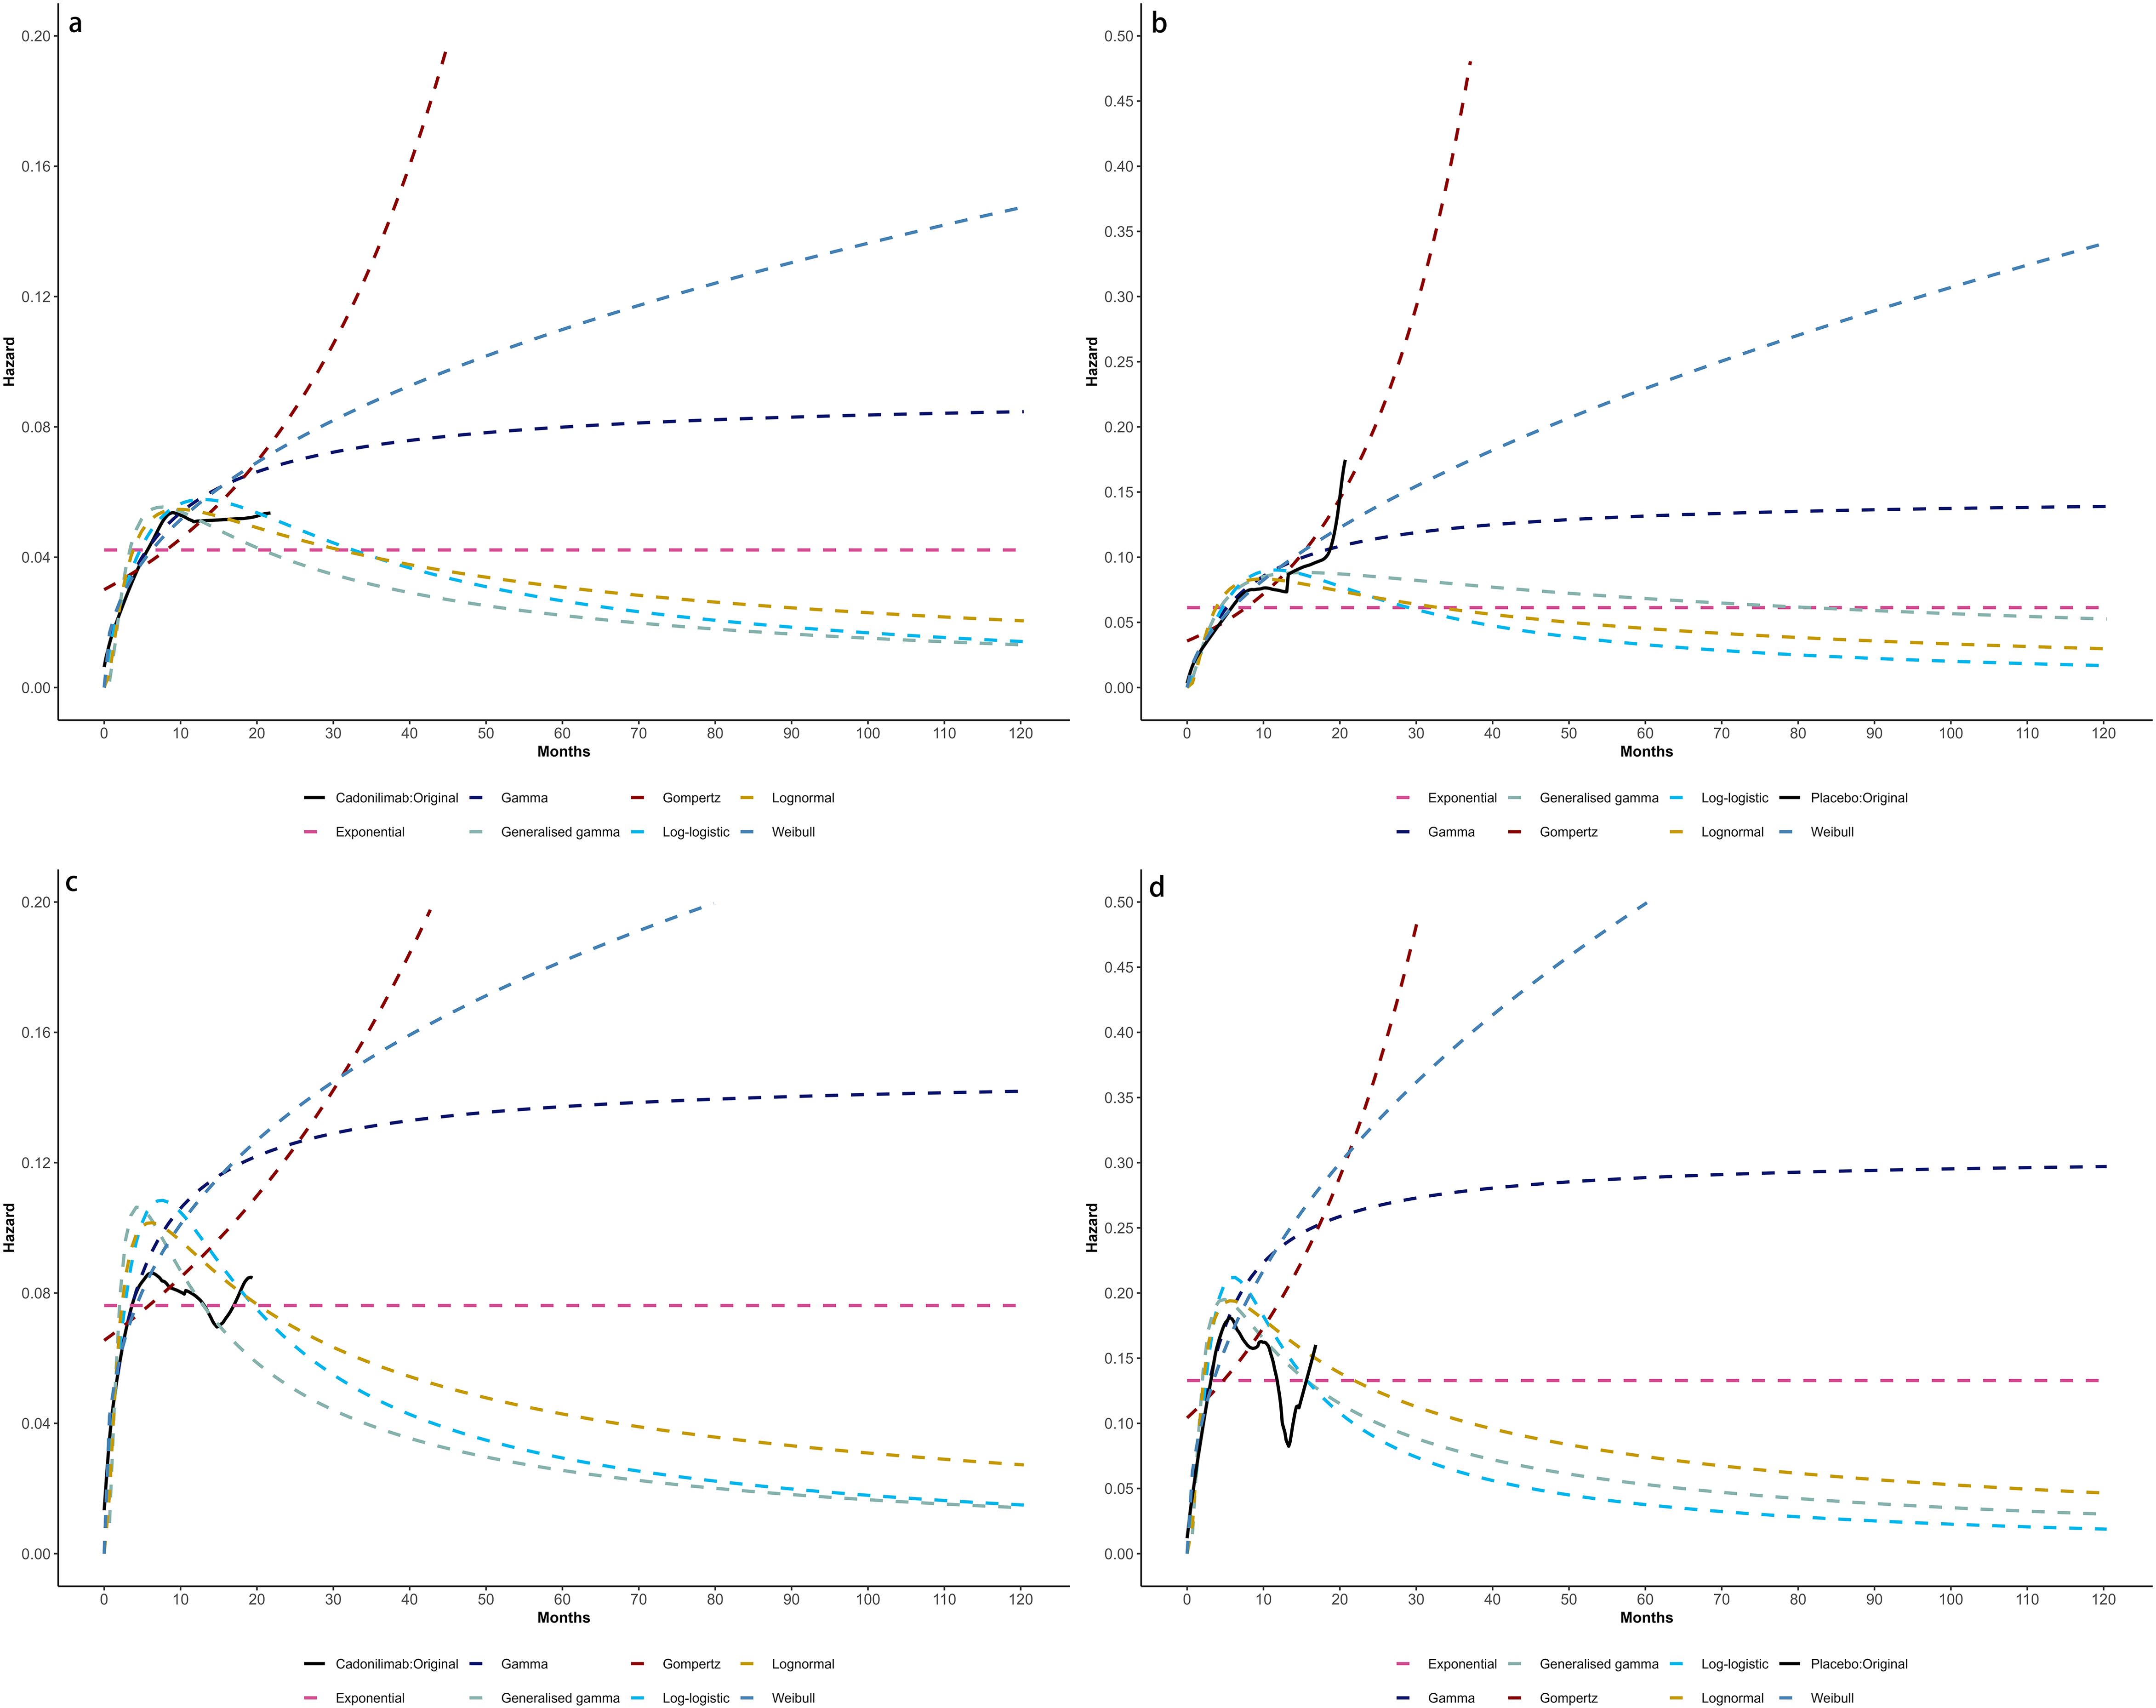
Figure 5. Comparison of fitted proportional hazards survival models with observed kaplan–meier curves: (A) overall survival curves of Cadonilimab plus chemotherapy group, (B) overall survival curves of Chemotherapy group, (C) progression-free survival curves of Cadonilimab plus chemotherapy group, (D) progression-free survival curves of Chemotherapy group.
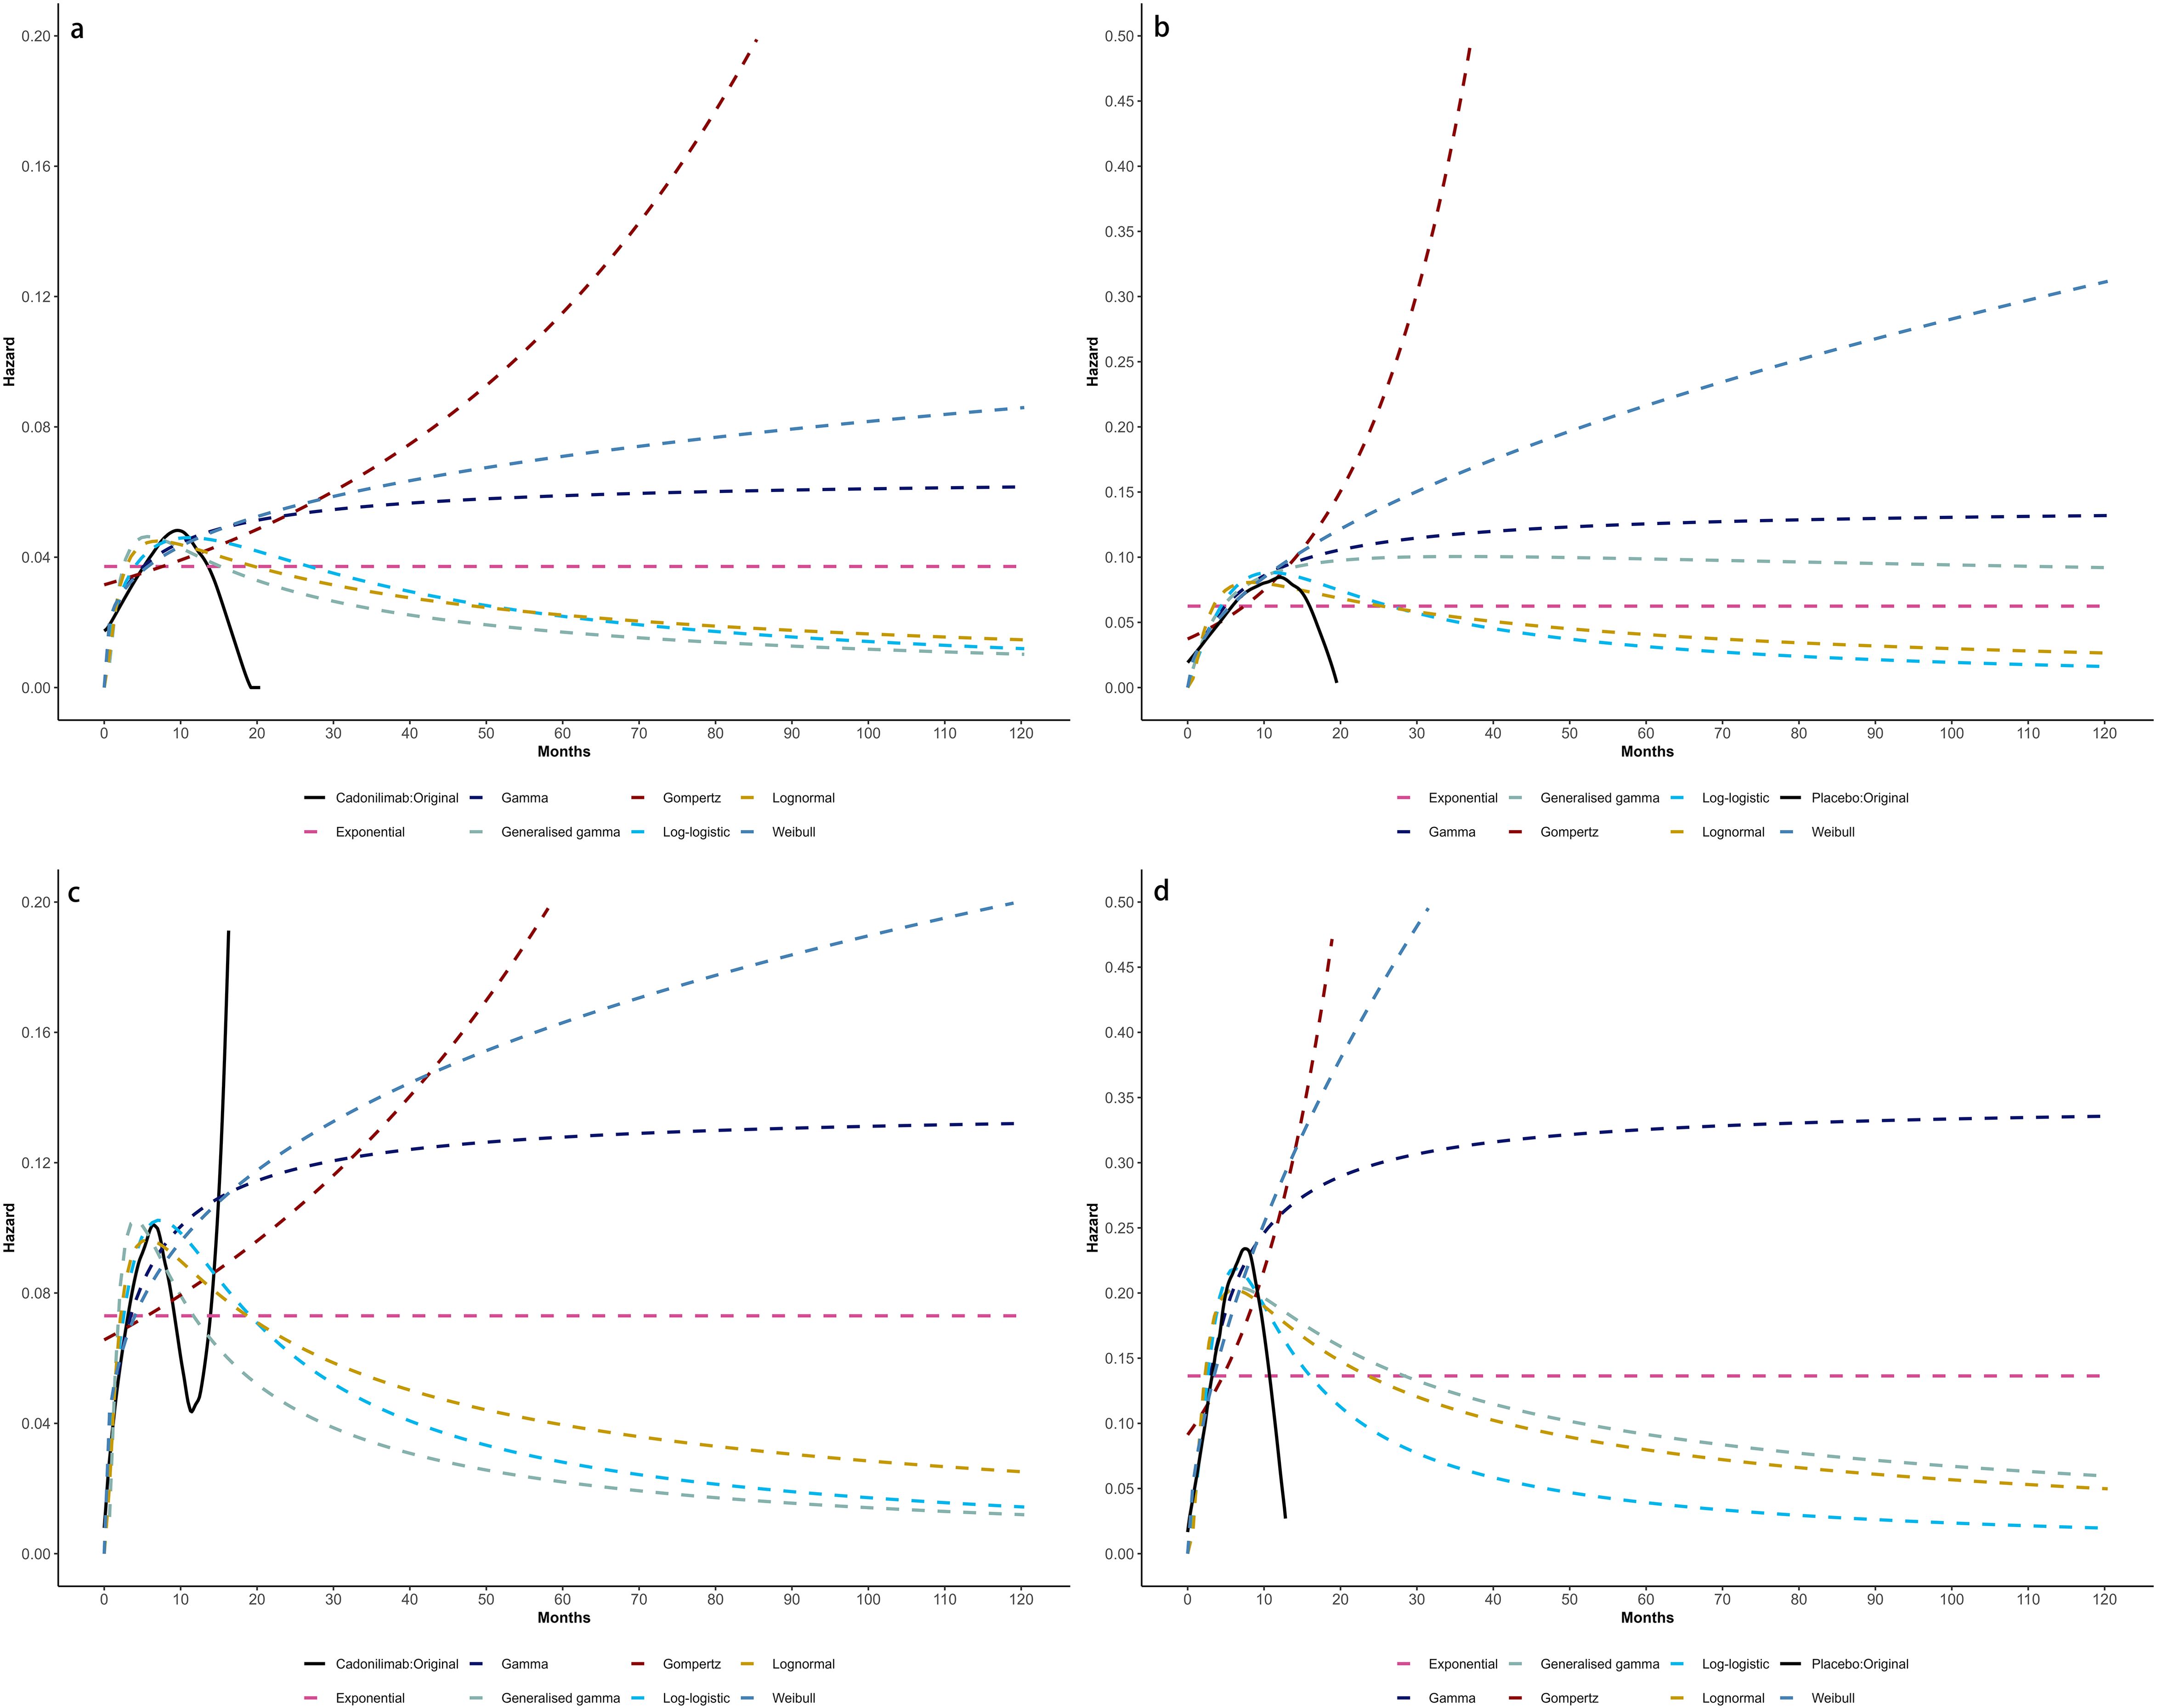
Figure 6. Comparison of fitted proportional hazards survival models with observed kaplan–meier curves of CPS ≥ 5: (A) overall survival curves of Cadonilimab plus chemotherapy group, (B) overall survival curves of Chemotherapy group, (C) progression-free survival curves of Cadonilimab plus chemotherapy group, (D) progression-free survival curves of Chemotherapy group.
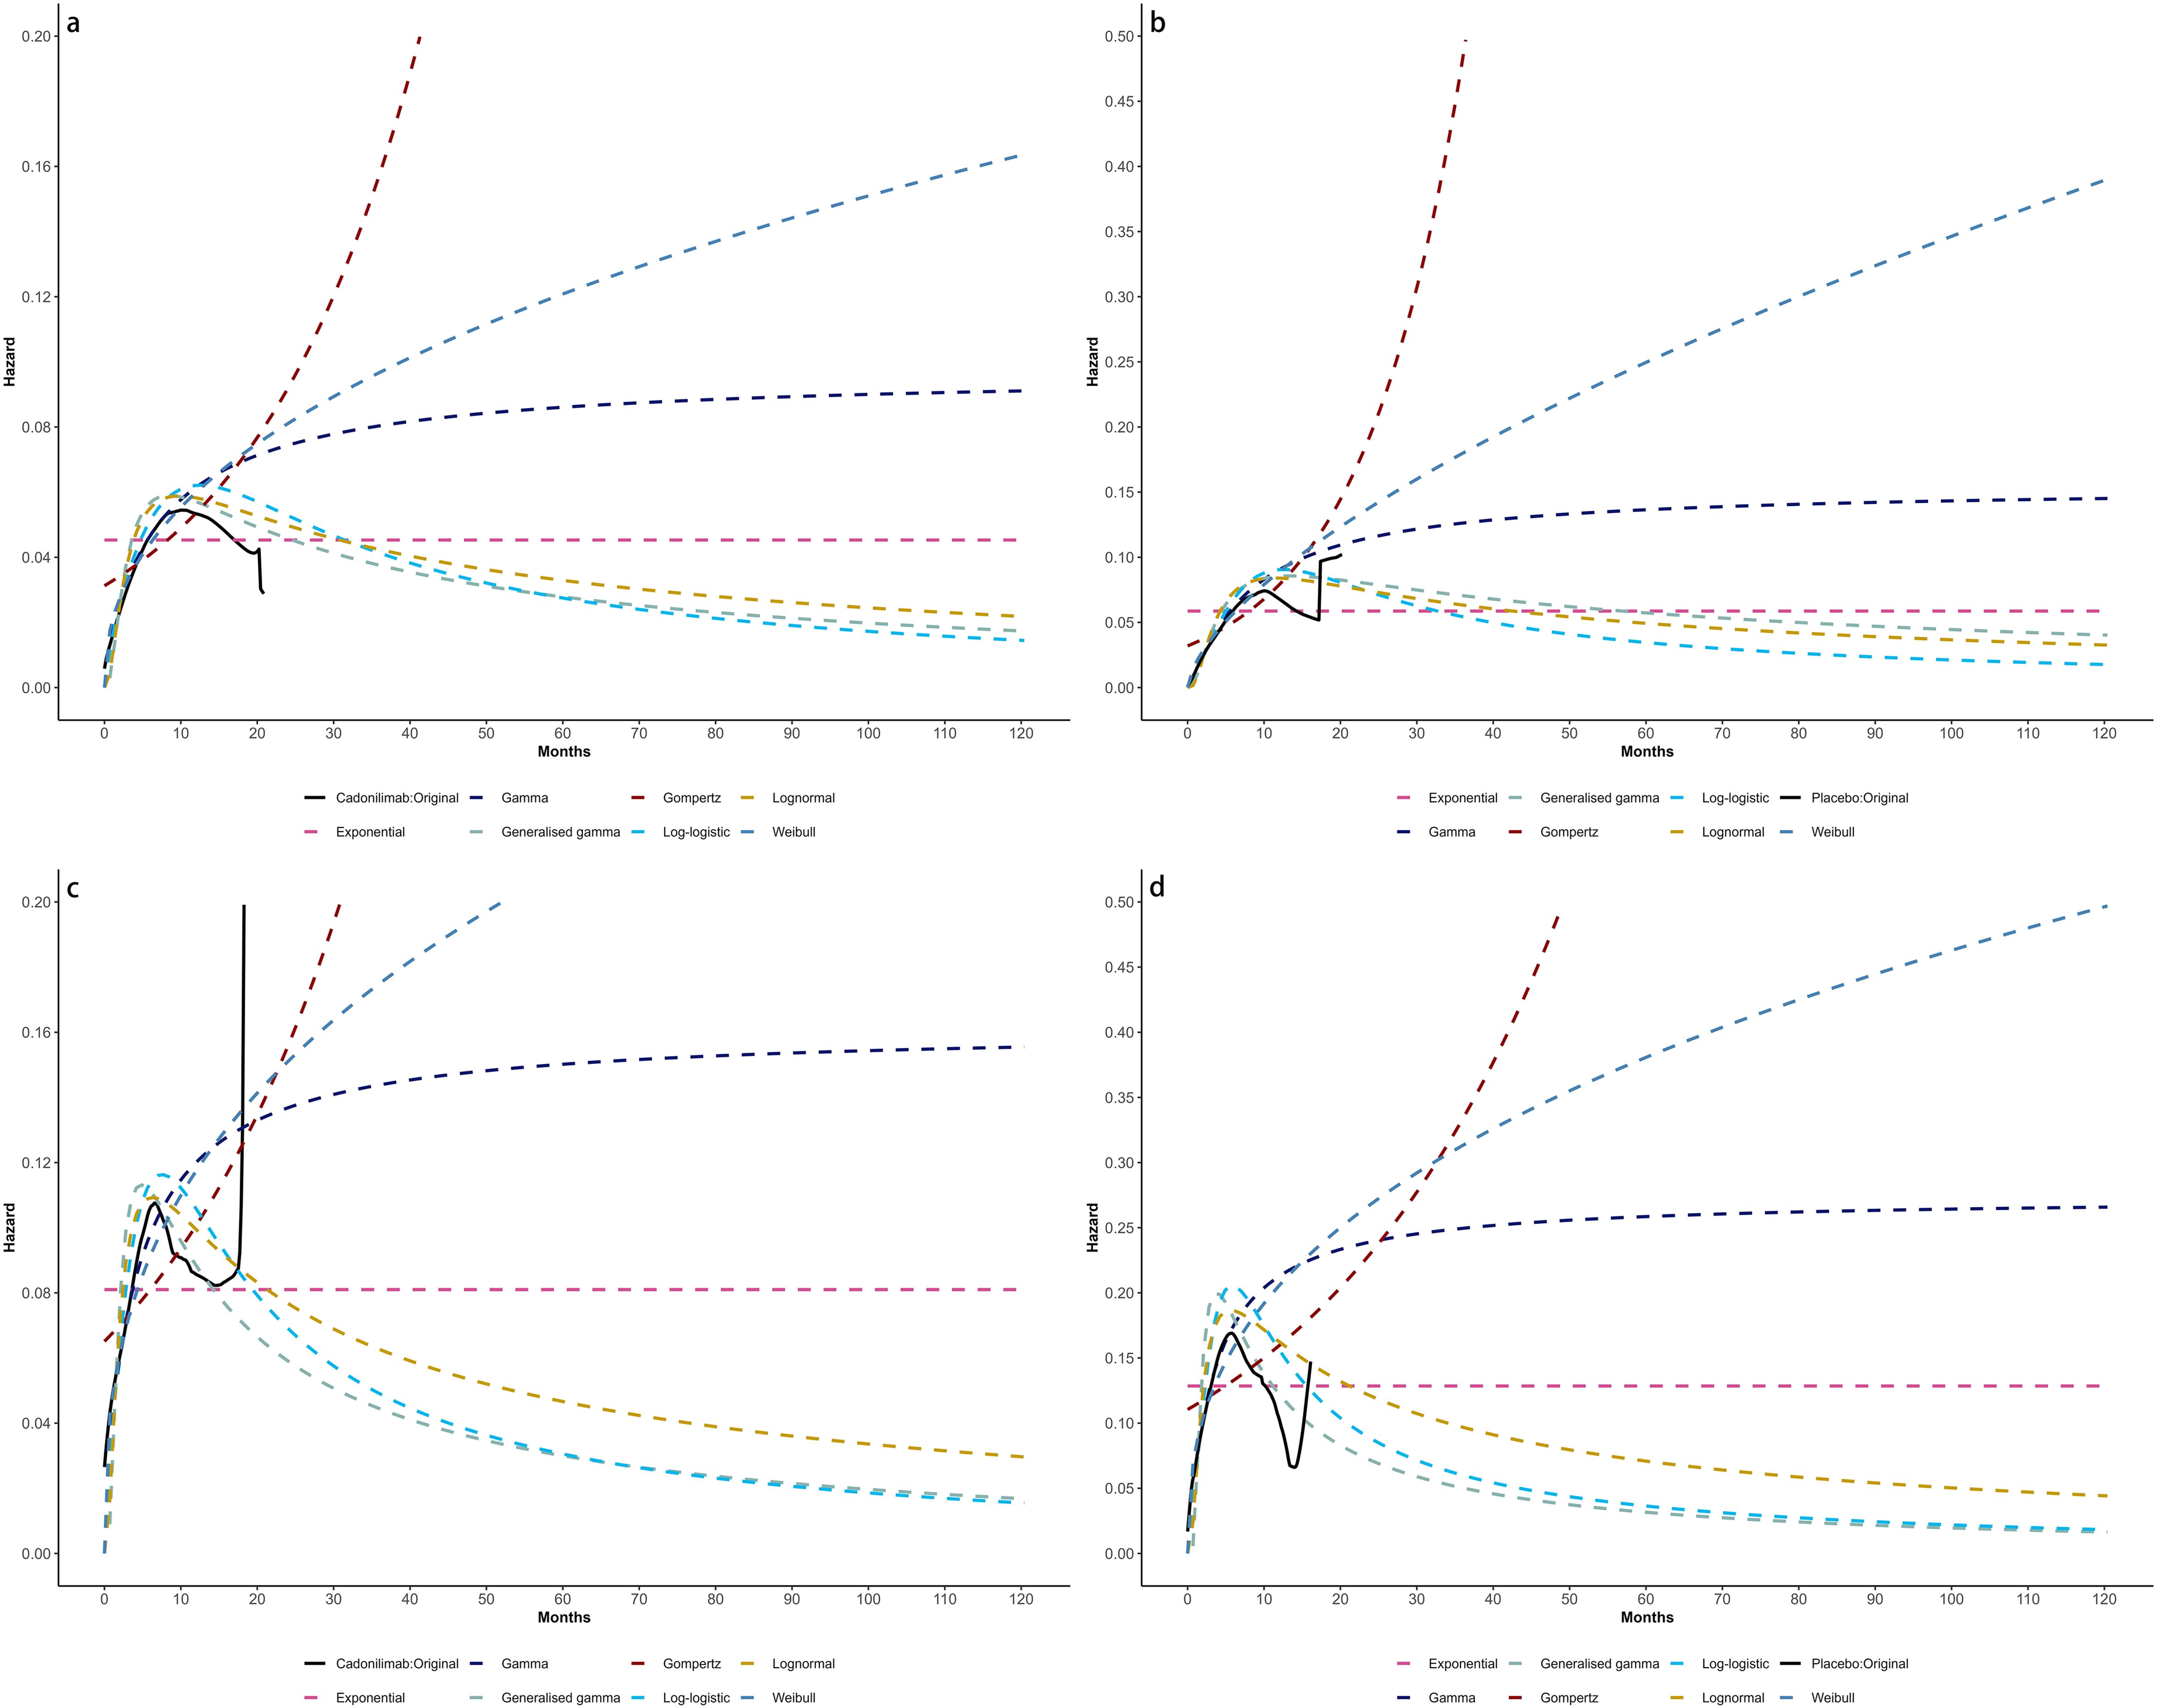
Figure 7. Comparison of fitted proportional hazards survival models with observed kaplan–meier curves of CPS <5: (A) overall survival curves of Cadonilimab plus chemotherapy group, (B) overall survival curves of Chemotherapy group, (C) progression-free survival curves of Cadonilimab plus chemotherapy group, (D) progression-free survival curves of Chemotherapy group.
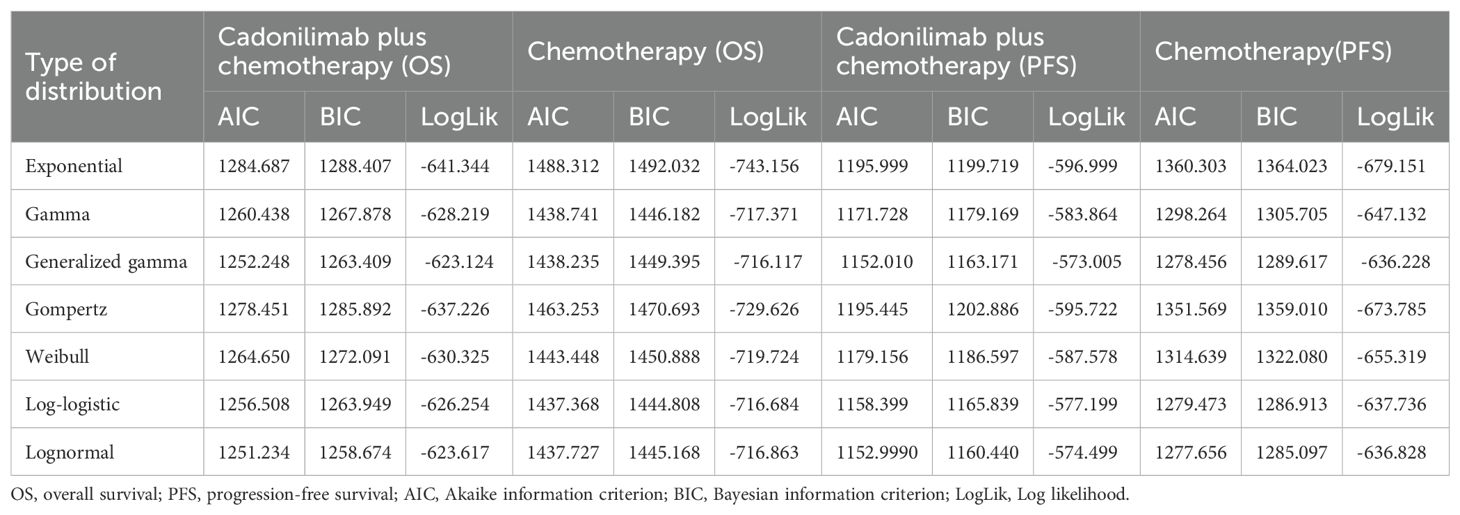
Table 2. The Akaike information criteria (AIC), Bayesian information criteria (BIC) and Log likelihood (LogLik).
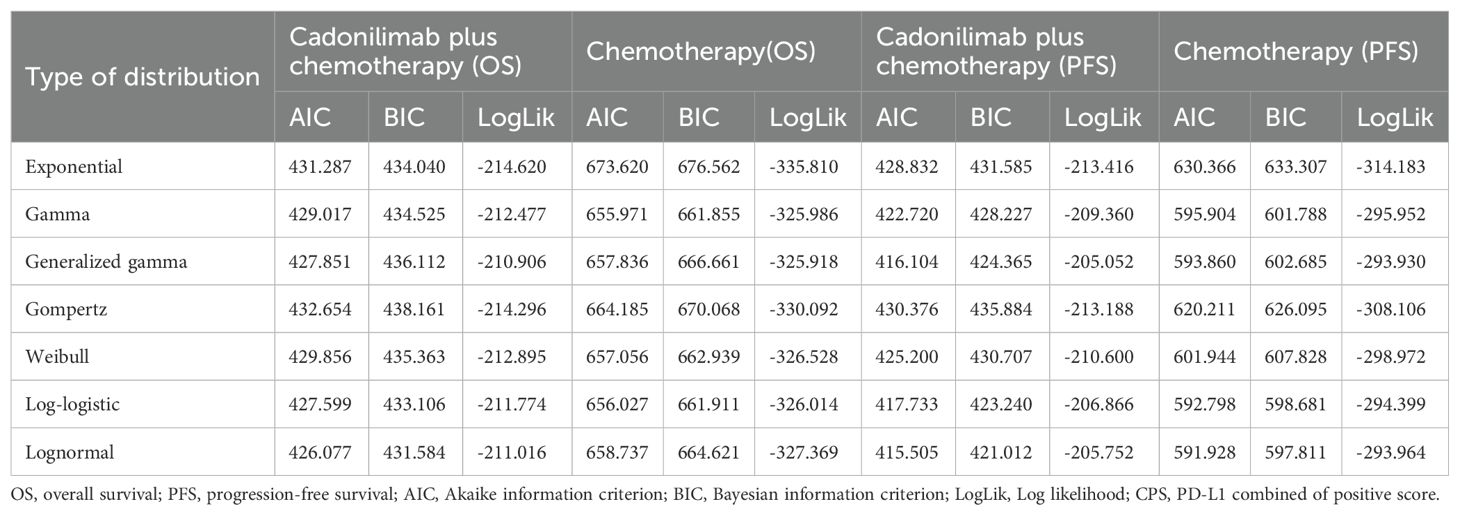
Table 3. The Akaike information criteria (AIC), Bayesian information criteria (BIC) and Log likelihood (LogLik) (CPS ≥5).
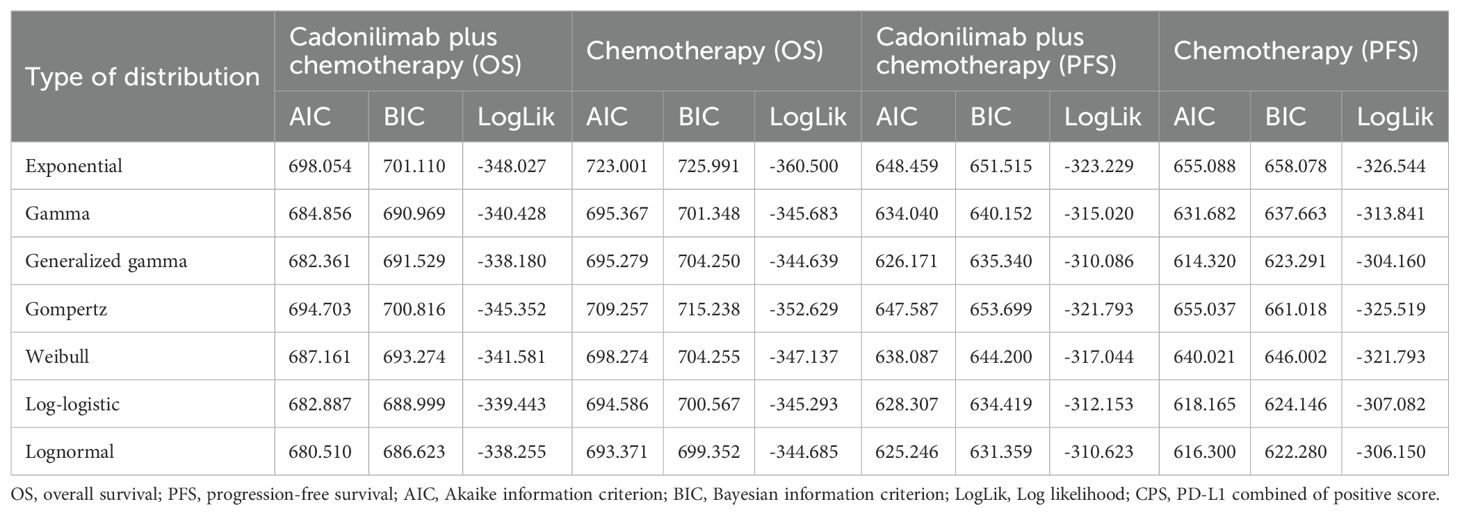
Table 4. The Akaike information criteria (AIC), Bayesian information criteria (BIC) and Log likelihood (LogLik) (CPS <5).
Cost inputs
This analysis focused exclusively on the direct medical costs associated with the management of GC/GEJC. These costs include drug acquisition, laboratory testing, enhanced computed tomography (CT), intravenous drug administration, subsequent therapies, best supportive care, end-of-life care, and management of severe adverse events (grade 3 or 4). Medication prices were obtained from public Chinese databases and institutional pricing schedules, whereas other cost components were derived from published economic evaluations and relevant literature.
Owing to the absence of a listed market price for cadonilimab in the United States, its cost was estimated using a comparative approach. Specifically, pricing was approximated based on analogous immunotherapies such as toripalimab and tislelizumab (33). Drug prices for both China and the U.S. were converted to U.S. dollars and adjusted using a price index to ensure cross-national comparability. Tables 1 and 5 summarize the clinical and cost parameters used in this analysis (19–23, 28, 34, 35).
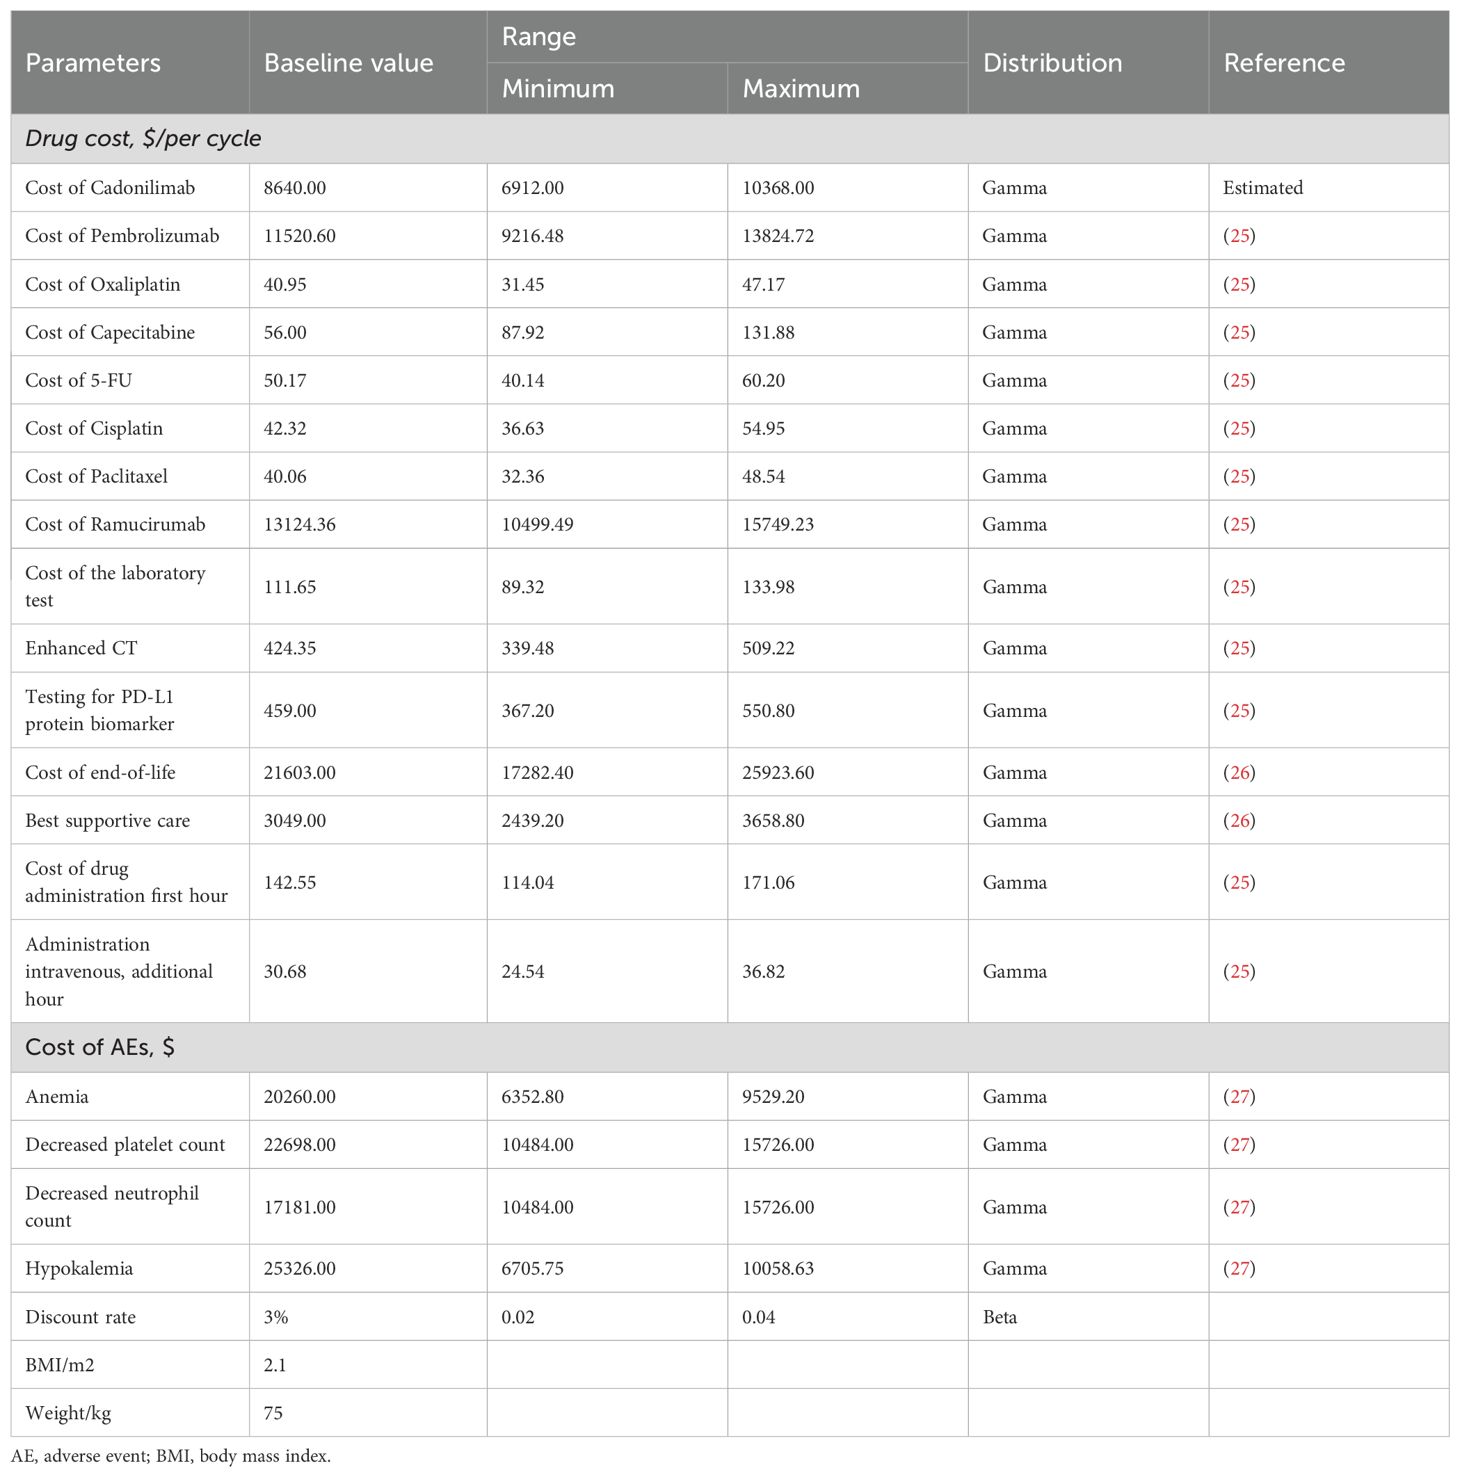
Table 5. Key clinical input data (US).
Quality-of-life inputs
Health outcomes in the model were adjusted using utility values obtained from previously published sources, as EQ-5D-5L (European Quality of Life-5 Dimension-5 Level) data were not directly reported in the COMPASSION-15 trial. Utility values were anchored on a scale ranging from 0 (representing death) to 1 (representing perfect health).
For patients in the PFS state, the utility was set at 0.797 based on data from the TOGA trial and calculated using the Japanese EuroQol (EQ-5D) scoring algorithm (24). The utility for patients in the PD state was 0.577, derived from evaluations conducted by the National Institute for Health and Clinical Excellence (NICE). Quality-of-life decrements (disutilities) associated with severe adverse events, including anemia, thrombocytopenia, neutropenia, and hypokalemia, were also incorporated into the model (24). All AEs were assumed to occur during the initial treatment cycle, with detailed incidence rates provided in Table 1.
Subgroup analyses
To explore heterogeneity in cost-effectiveness outcomes, subgroup analyses were performed for patients with PD-L1 CPS ≥5 and CPS <5 in both China and the United States. These analyses employed the same modeling structure and assumptions as those used in the base-case scenario. Due to the lack of subgroup-specific data on follow-up treatments, adverse event rates, or healthcare resource utilization in the COMPASSION-15 trial, these parameters were assumed to be consistent with those observed in the overall study population.
Price simulation
Owing to uncertainties in the key input parameters, particularly drug pricing, scenario analyses were conducted to evaluate a range of potential pricing outcomes. In the Chinese context, cost-effectiveness was assessed with and without the inclusion of a patient assistance program. The price of cadonilimab varied between $0 and $2,000 per 625 mg dose, and outcomes were compared against the country-specific WTP threshold of $40,354.27 per QALY.
In the United States, where a formal list price for cadonilimab is currently unavailable, an estimated cost of $8,600 per 750 mg dose was used. This estimate was based on price comparisons with other anti-PD-1 agents, including toripalimab and tislelizumab. Scenario analyses in the U.S. setting varied the price from $0 to $10,000 per dose to identify the maximum price at which cadonilimab would remain cost-effective under a $150,000 WTP threshold.
Scenario analysis
To address potential inconsistencies between the base-case discount rates (3% for the U.S., 5% for China) and World Health Organization (WHO) recommendations, an additional scenario was run where China’s discount rate was lowered to 3% (matching the U.S. rate). This analysis evaluated how aligning discount rates across regions would impact cost-effectiveness conclusions, particularly for long-term survival outcomes. Given the volatility of the yuan–dollar exchange rate in 2024–2025, a second scenario incorporated Purchasing Power Parity (PPP) adjustments to currency conversion—replacing the base-case market exchange rate with 2024 International Monetary Fund (IMF) PPP values (¥1 = $0.2825, equivalent to ¥3.54 = $1). Concurrently, China’s WTP threshold was adjusted to $20,243.85 per QALY to align with PPP-adjusted economic benchmarks, ensuring cross-country comparability of cost-effectiveness results under a standardized economic metric.
Sensitivity analysis
The robustness of the model outcomes was evaluated using one-way sensitivity analysis (OWSA) and probabilistic sensitivity analysis (PSA). In the OWSA, each key parameter was independently varied by ±20% from its base-case value to determine its influence on the ICER. The results were visualized using tornado diagrams to identify the most influential variables.
For the PSA, all model inputs were sampled simultaneously based on appropriate probability distributions, beta for probabilities and utility values, and gamma for cost parameters. A total of 10,000 Monte Carlo simulations were performed to quantify the uncertainty in ICER estimates and to calculate the likelihood that cadonilimab plus chemotherapy would be deemed cost-effective at different WTP thresholds.
Results
Base-case analysis
Over a 10-year time horizon, the base-case analysis indicated that patients receiving cadonilimab in combination with chemotherapy achieved 1.01 QALYs at a total cost of $28,528.60. In contrast, those treated with chemotherapy alone accrued 0.67 QALYs at a cost of $11,730.98. This resulted in an incremental gain of 0.33 QALYs and an additional cost of $16,797.61, yielding an ICER of $5,0582.10 per QALY for the combination therapy (Table 6).
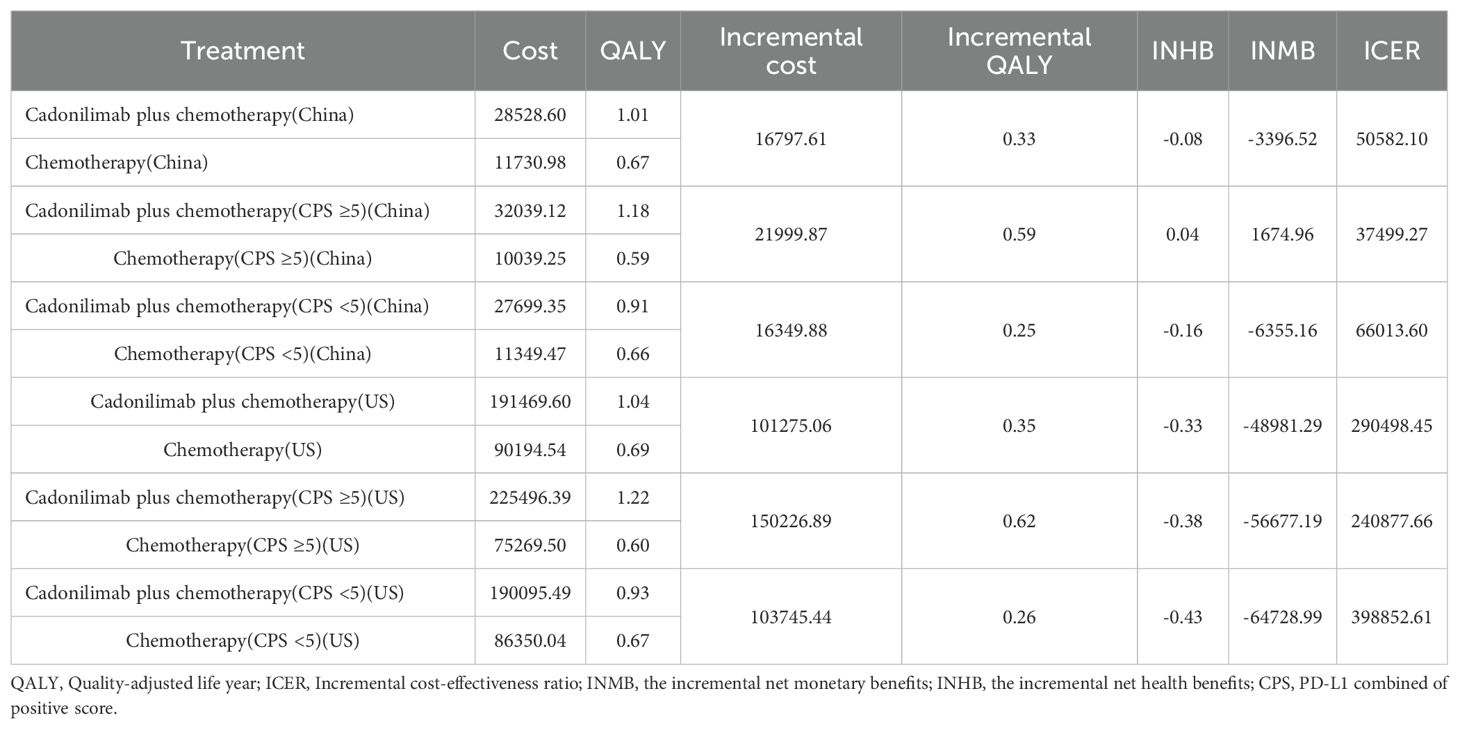
Table 6. The base case analysis.
When compared to China’s WTP threshold of $40,354.27 per QALY, this ICER exceeded the acceptable limit. Consequently, the incremental net health benefit (INHB) was -0.08 QALYs, and the incremental net monetary benefit (INMB) was -$3,396.52, suggesting that cadonilimab plus chemotherapy is not cost-effective in the Chinese healthcare setting (Table 6).
In the U.S. scenario, the ICER for cadonilimab plus chemotherapy was estimated at $347,127.52 per QALY—well above the U.S. WTP threshold of $150,000.00. The corresponding INHB and INMB values were -0.41 QALYs and -$61,121.30, respectively, further supporting the conclusion that the combination regimen is not economically favorable under the current U.S. pricing assumptions (Table 6).
Subgroup analysis
Among patients with a PD-L1 CPS ≥5, the ICER for cadonilimab plus chemotherapy was $37,499.27 per QALY—below China’s WTP threshold of $40,354.27 (Table 6). The corresponding INHB and INMB were 0.04 QALYs and $1,674.96, respectively, indicating that cadonilimab was cost-effective in this clinically responsive subgroup.
In contrast, for patients with a PD-L1 CPS <5, the ICER was $66,013.60 per QALY, exceeding the WTP threshold. The INHB was –0.16 QALYs and the INMB was –$6,355.16, suggesting that cadonilimab was not cost-effective in this lower PD-L1 expression group (Table 6).
In the U.S. setting, the ICER for cadonilimab plus chemotherapy reached $240,877.66 per QALY in the PD-L1 CPS ≥5 group and $398,852.61 per QALY in the CPS <5 group, both of which far exceeded the WTP threshold of $150,000.00 (Table 6). The corresponding INHBs were -0.38 and -0.43 QALYs, while the INMBs were -$56,677.19 and -$64,728.99, respectively. These findings indicate that cadonilimab was not cost-effective in either subgroup within the U.S. healthcare context, despite differential clinical responsiveness.
Price simulation
Figure 8 illustrated the results of the price simulation analysis across a range of cadonilimab pricing scenarios. In China, the ICER increased proportionally as the price varied from $0 to $2,000 per 625 mg dose. A similar trend was observed in the United States, where the price range examined ranged from $0 to $10,000 per 750 mg dose.
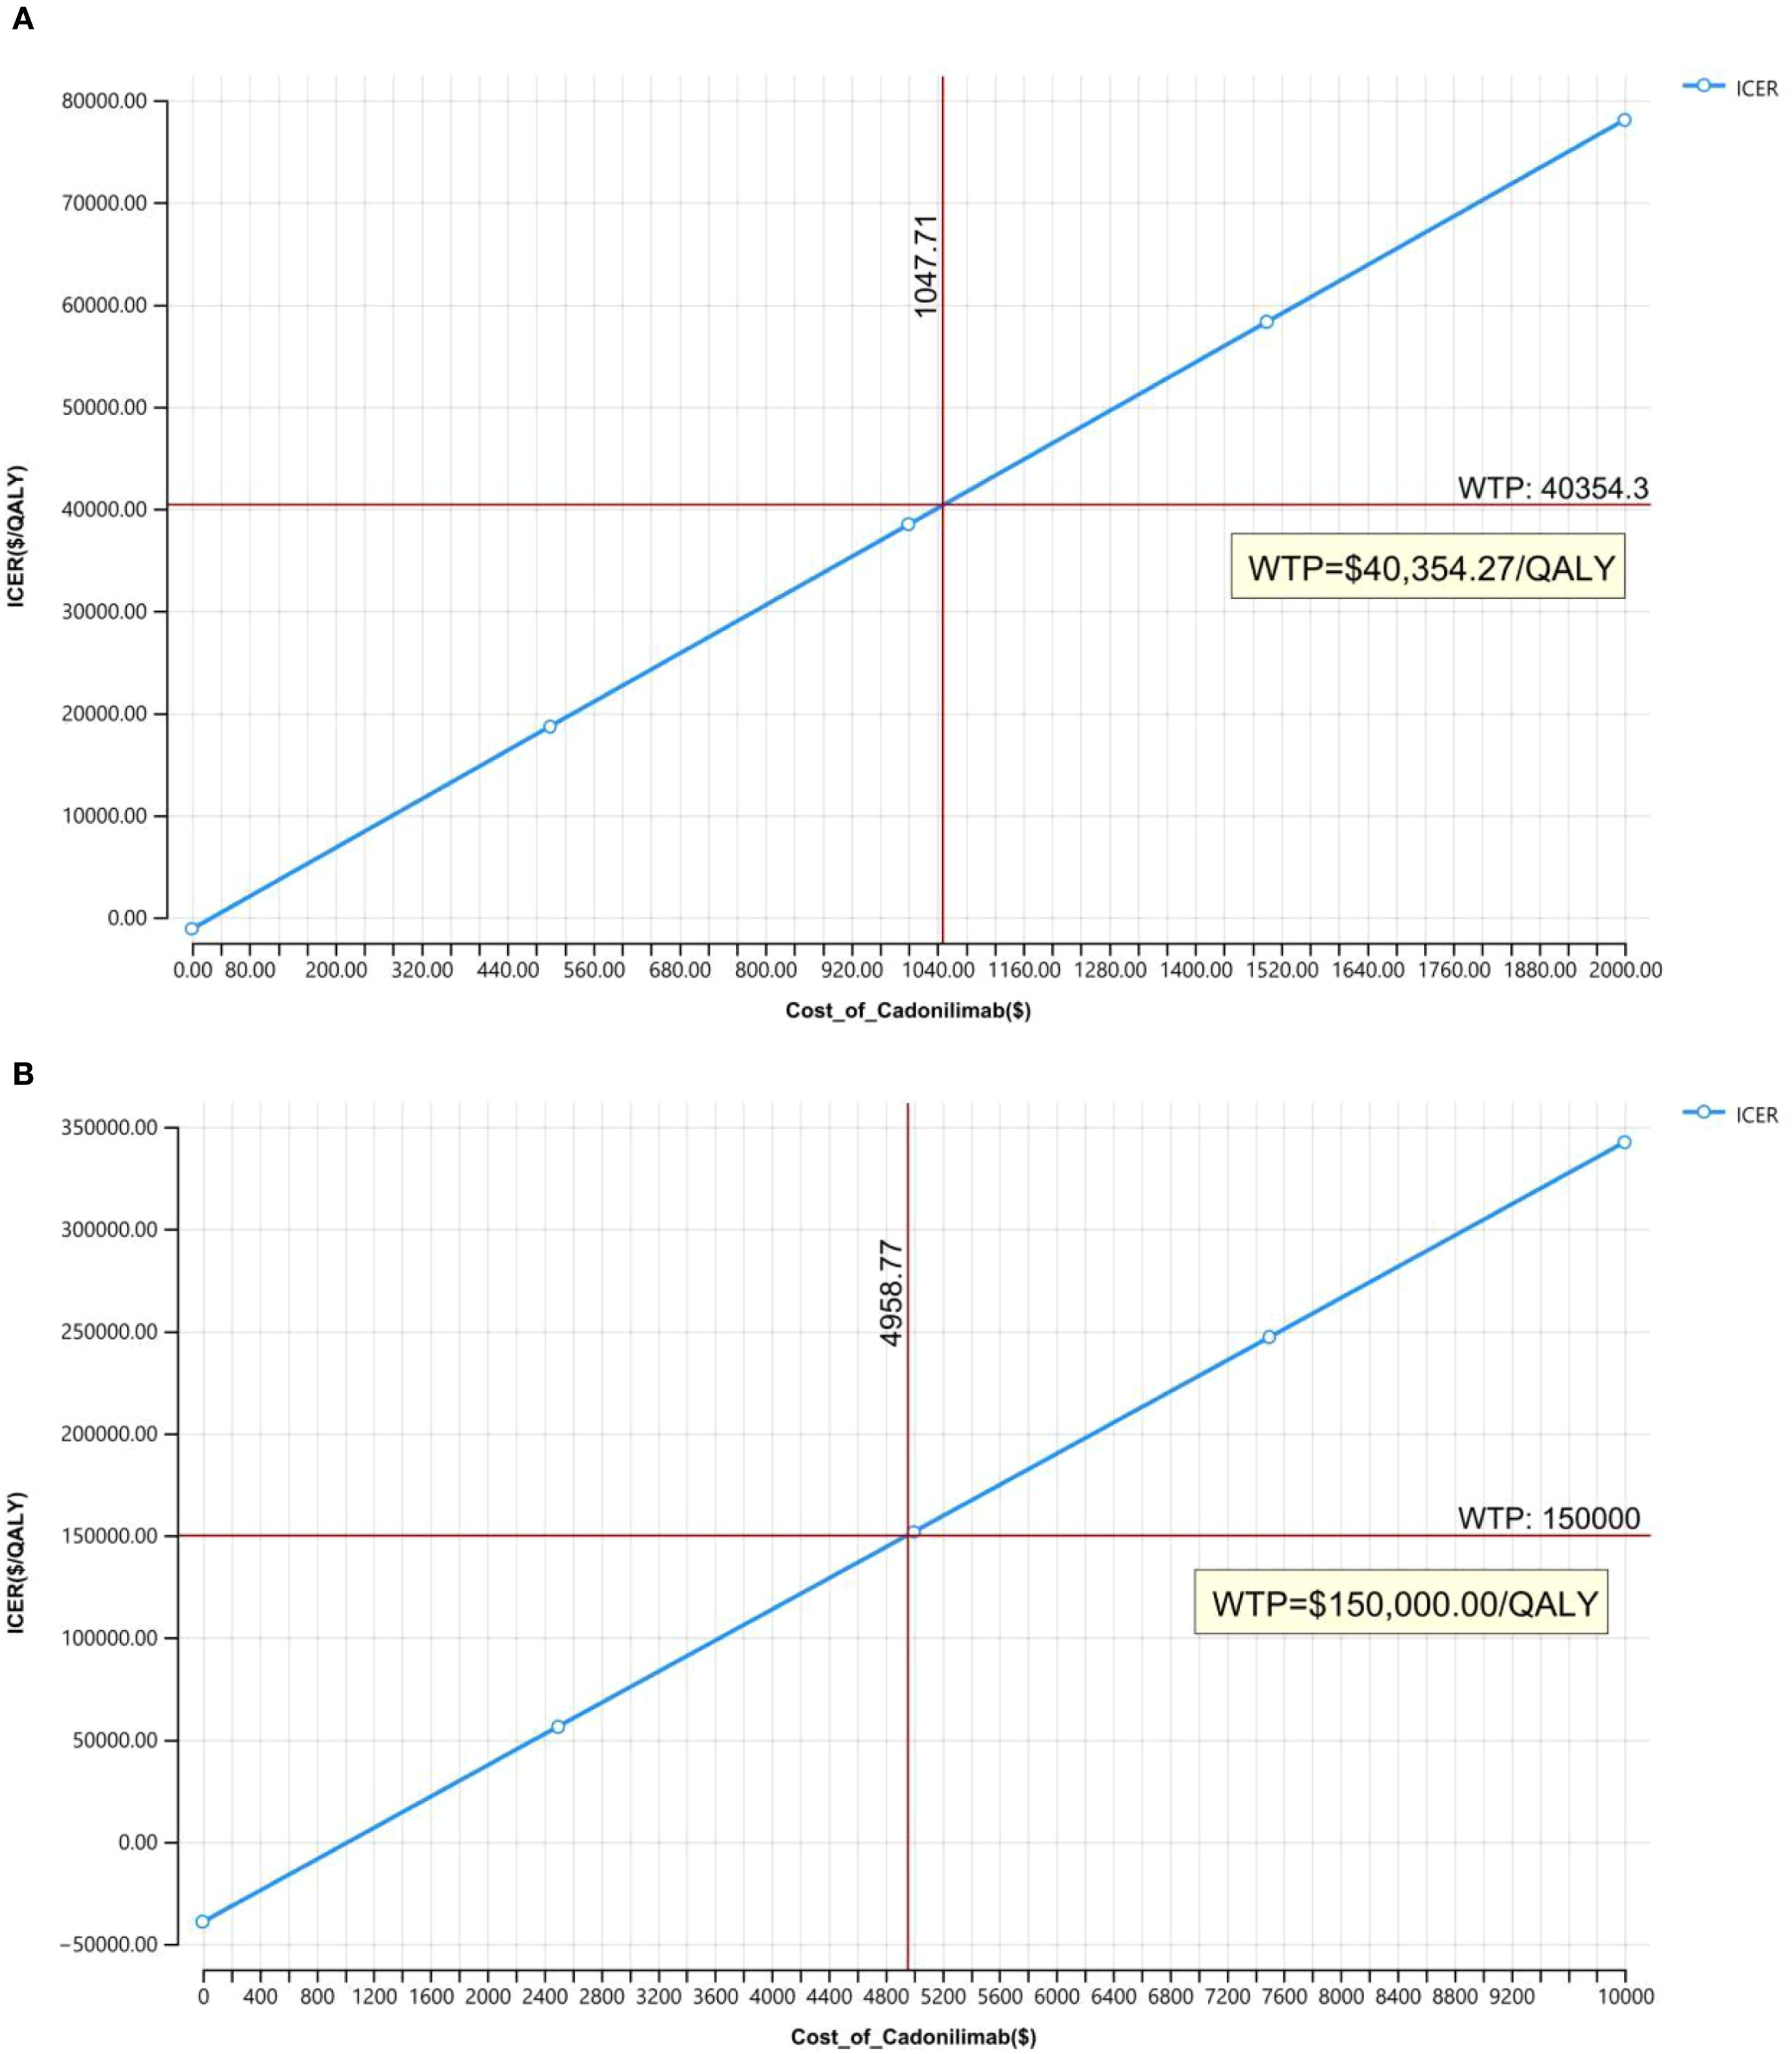
Figure 8. Price simulation: (A) China, (B) The U.S.
According to the respective WTP thresholds, cadonilimab would be considered cost-effective in China if the price was below $209.54 per 125 mg. In the U.S., the threshold for cost-effectiveness was $826.46 per 125 mg.
Scenario analysis
Scenario analysis evaluating a 3% discount rate for China showed the ICER of cadonilimab plus chemotherapy decreased to $48,678.70 per QALY, though the reduction was minimal (Table 7). For this scenario, PSA results indicated a 29.57% probability that the regimen would be cost-effective at China’s defined WTP threshold. Under PPP-adjusted currency conversion, the ICER of the combination regimen was 25,374.68 per QALY—still exceeding the PPP−aligned WTP of 20,243.85 per QALY (Table 7). PSA findings for this scenario showed a 24.86% probability of cost-effectiveness at the defined WTP threshold.
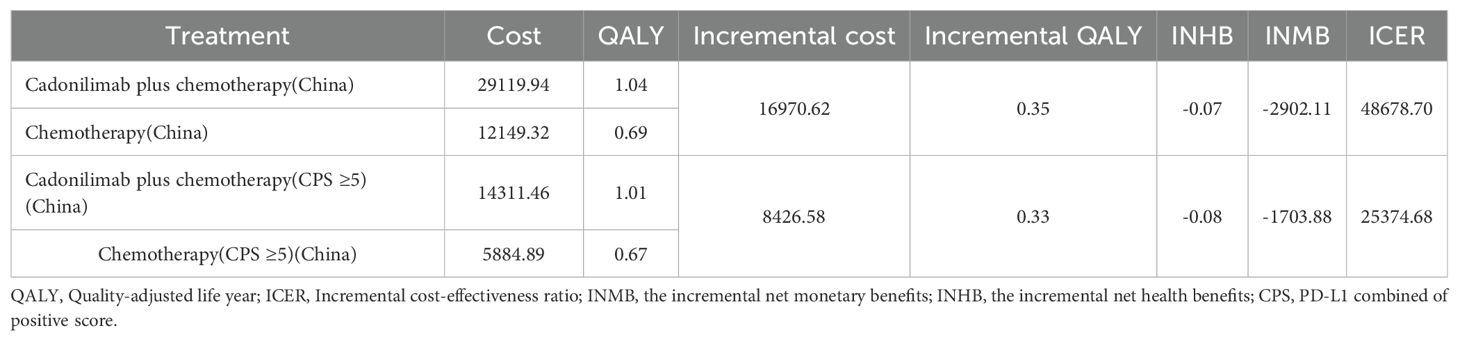
Table 7. Scenario analysis.
Sensitivity analysis
The OWSA results for the overall population and all subgroups in both China and the U.S. are presented in Figures 9–11. The ICER was most sensitive to variations in the cost of cadonilimab, utility values for the PFS and PD health states, and the proportion of patients receiving targeted therapy during subsequent treatment. Despite these sensitivities, the differences in health outcomes between treatment strategies were sufficiently large that parameter variations did not alter the overall conclusions, except in the CPS ≥5 subgroup in China, where the ICER was influenced by changes in drug cost and health state utilities.
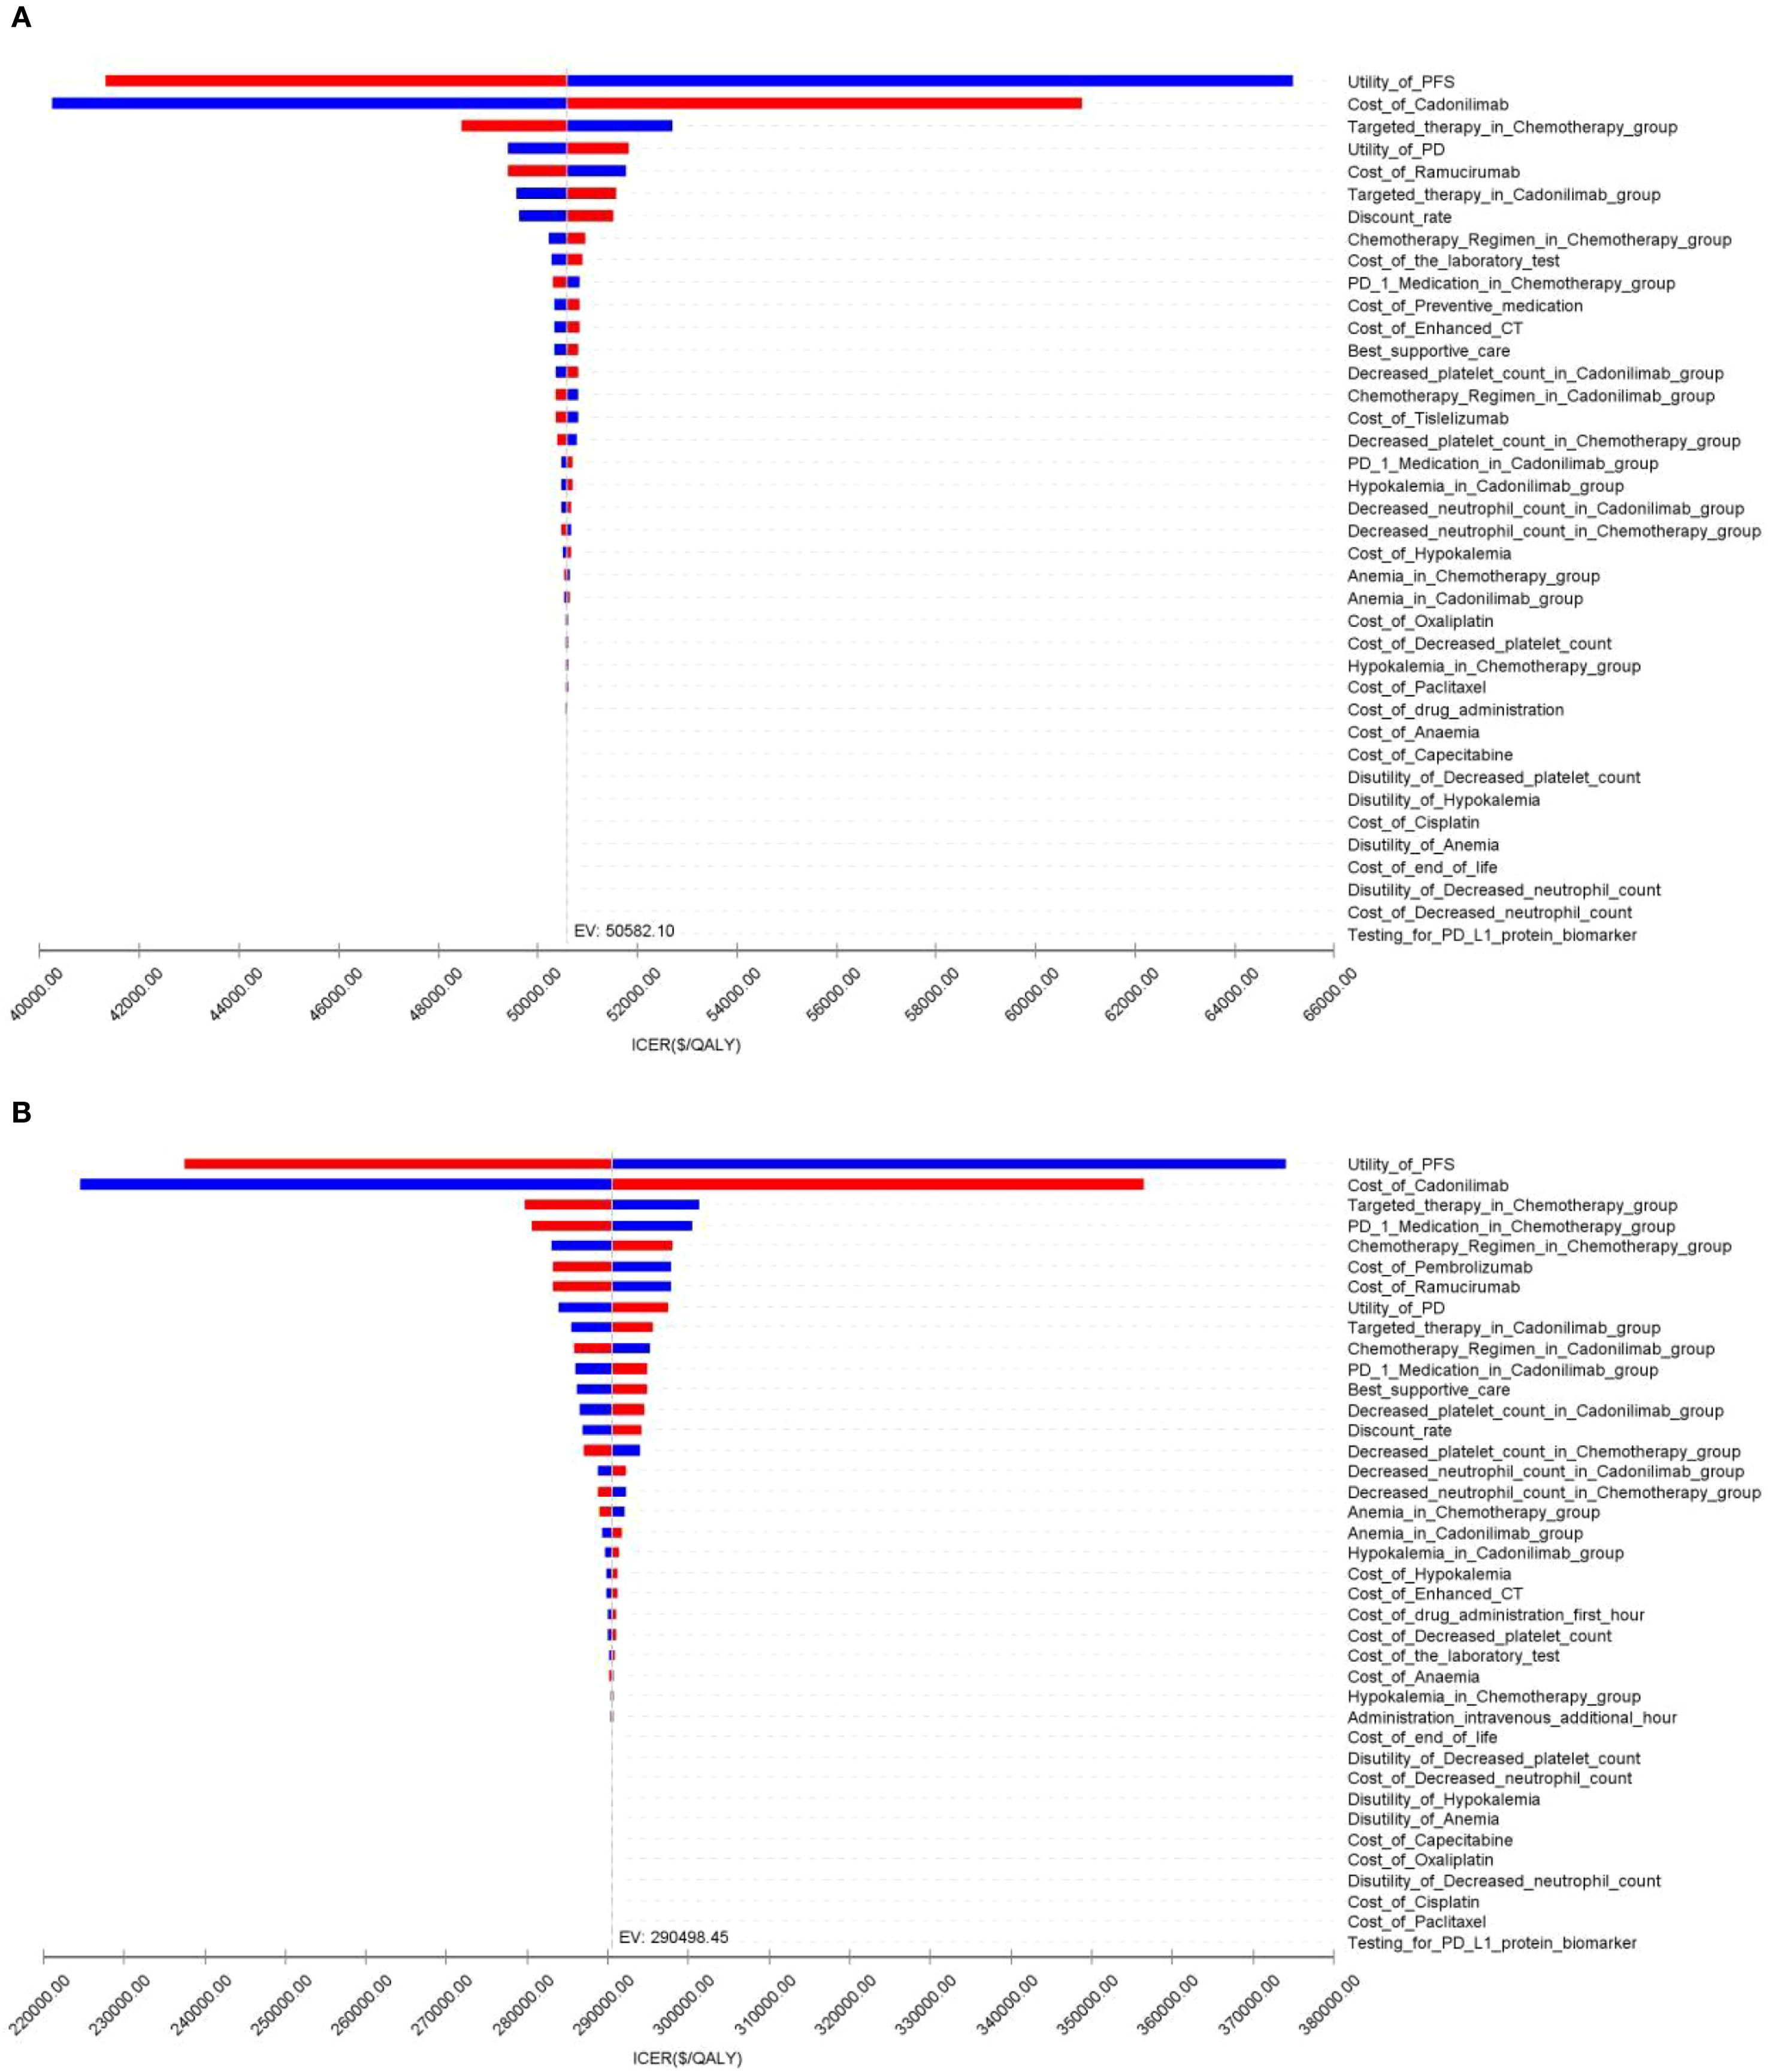
Figure 9. The tornado diagram of one-way sensitivity analysis: (A) China, (B) The U.S.
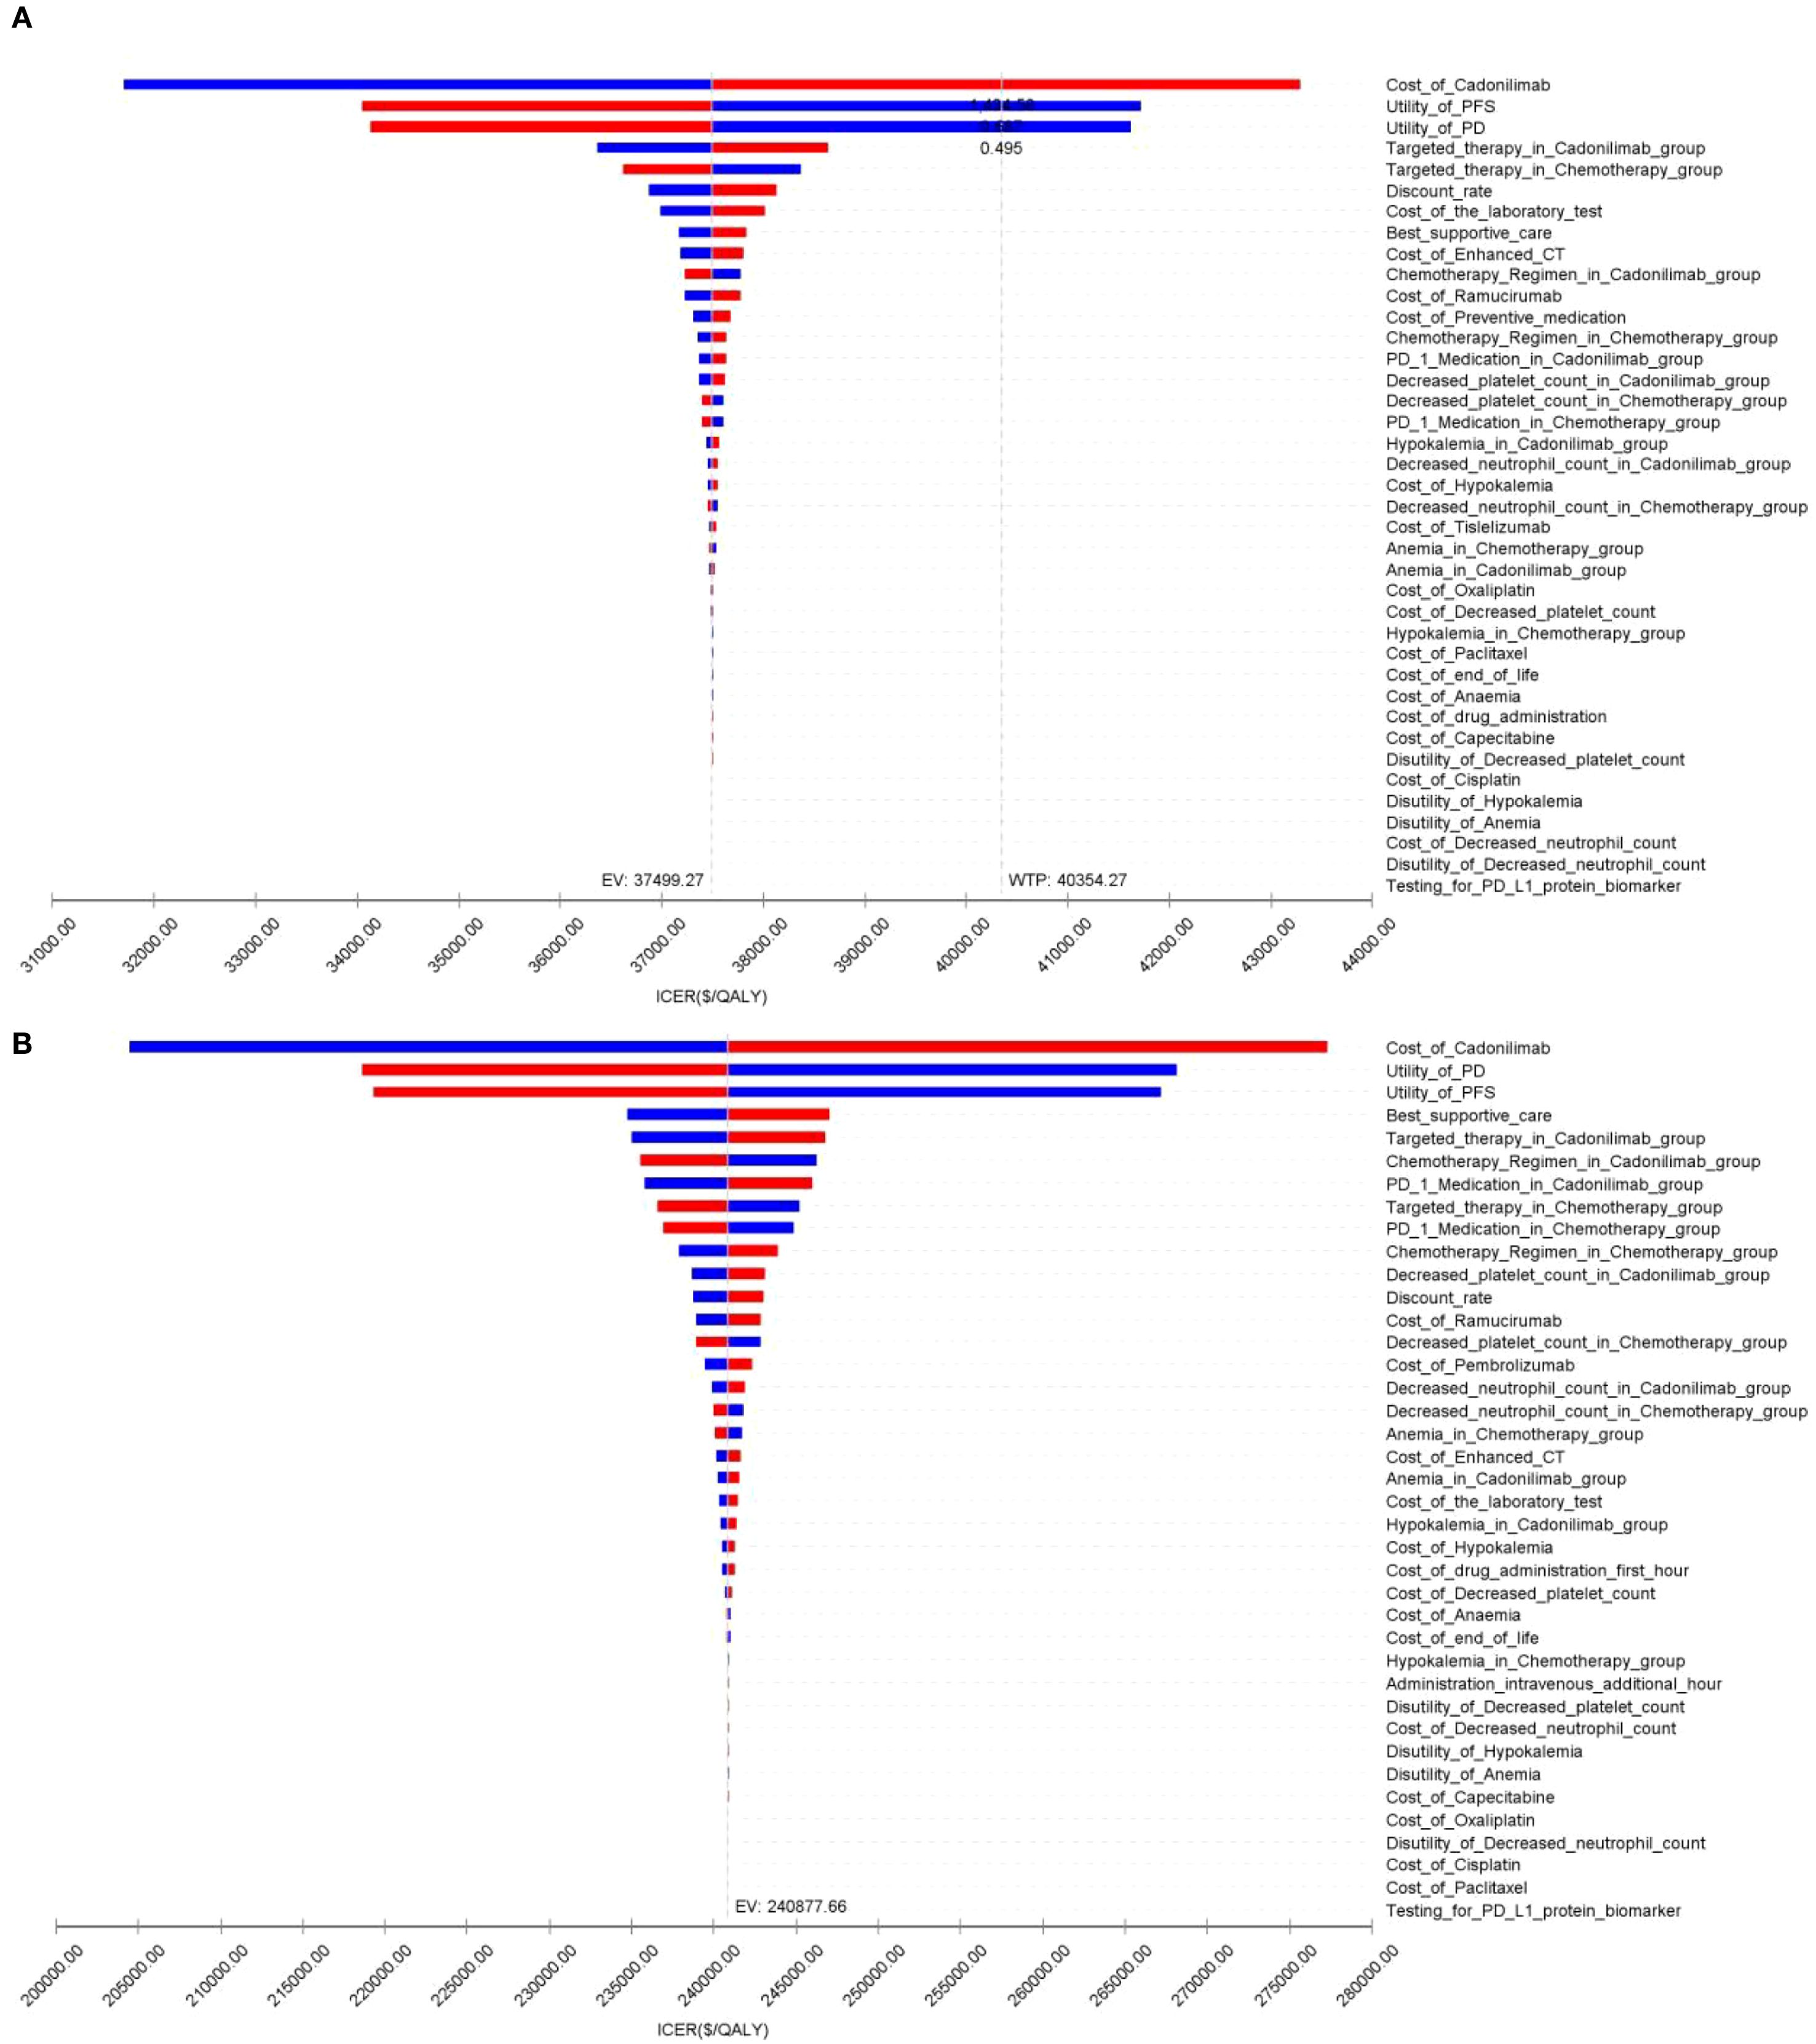
Figure 10. The tornado diagram of one-way sensitivity analysis in CPS ≥5 group: (A) China, (B) The U.S.
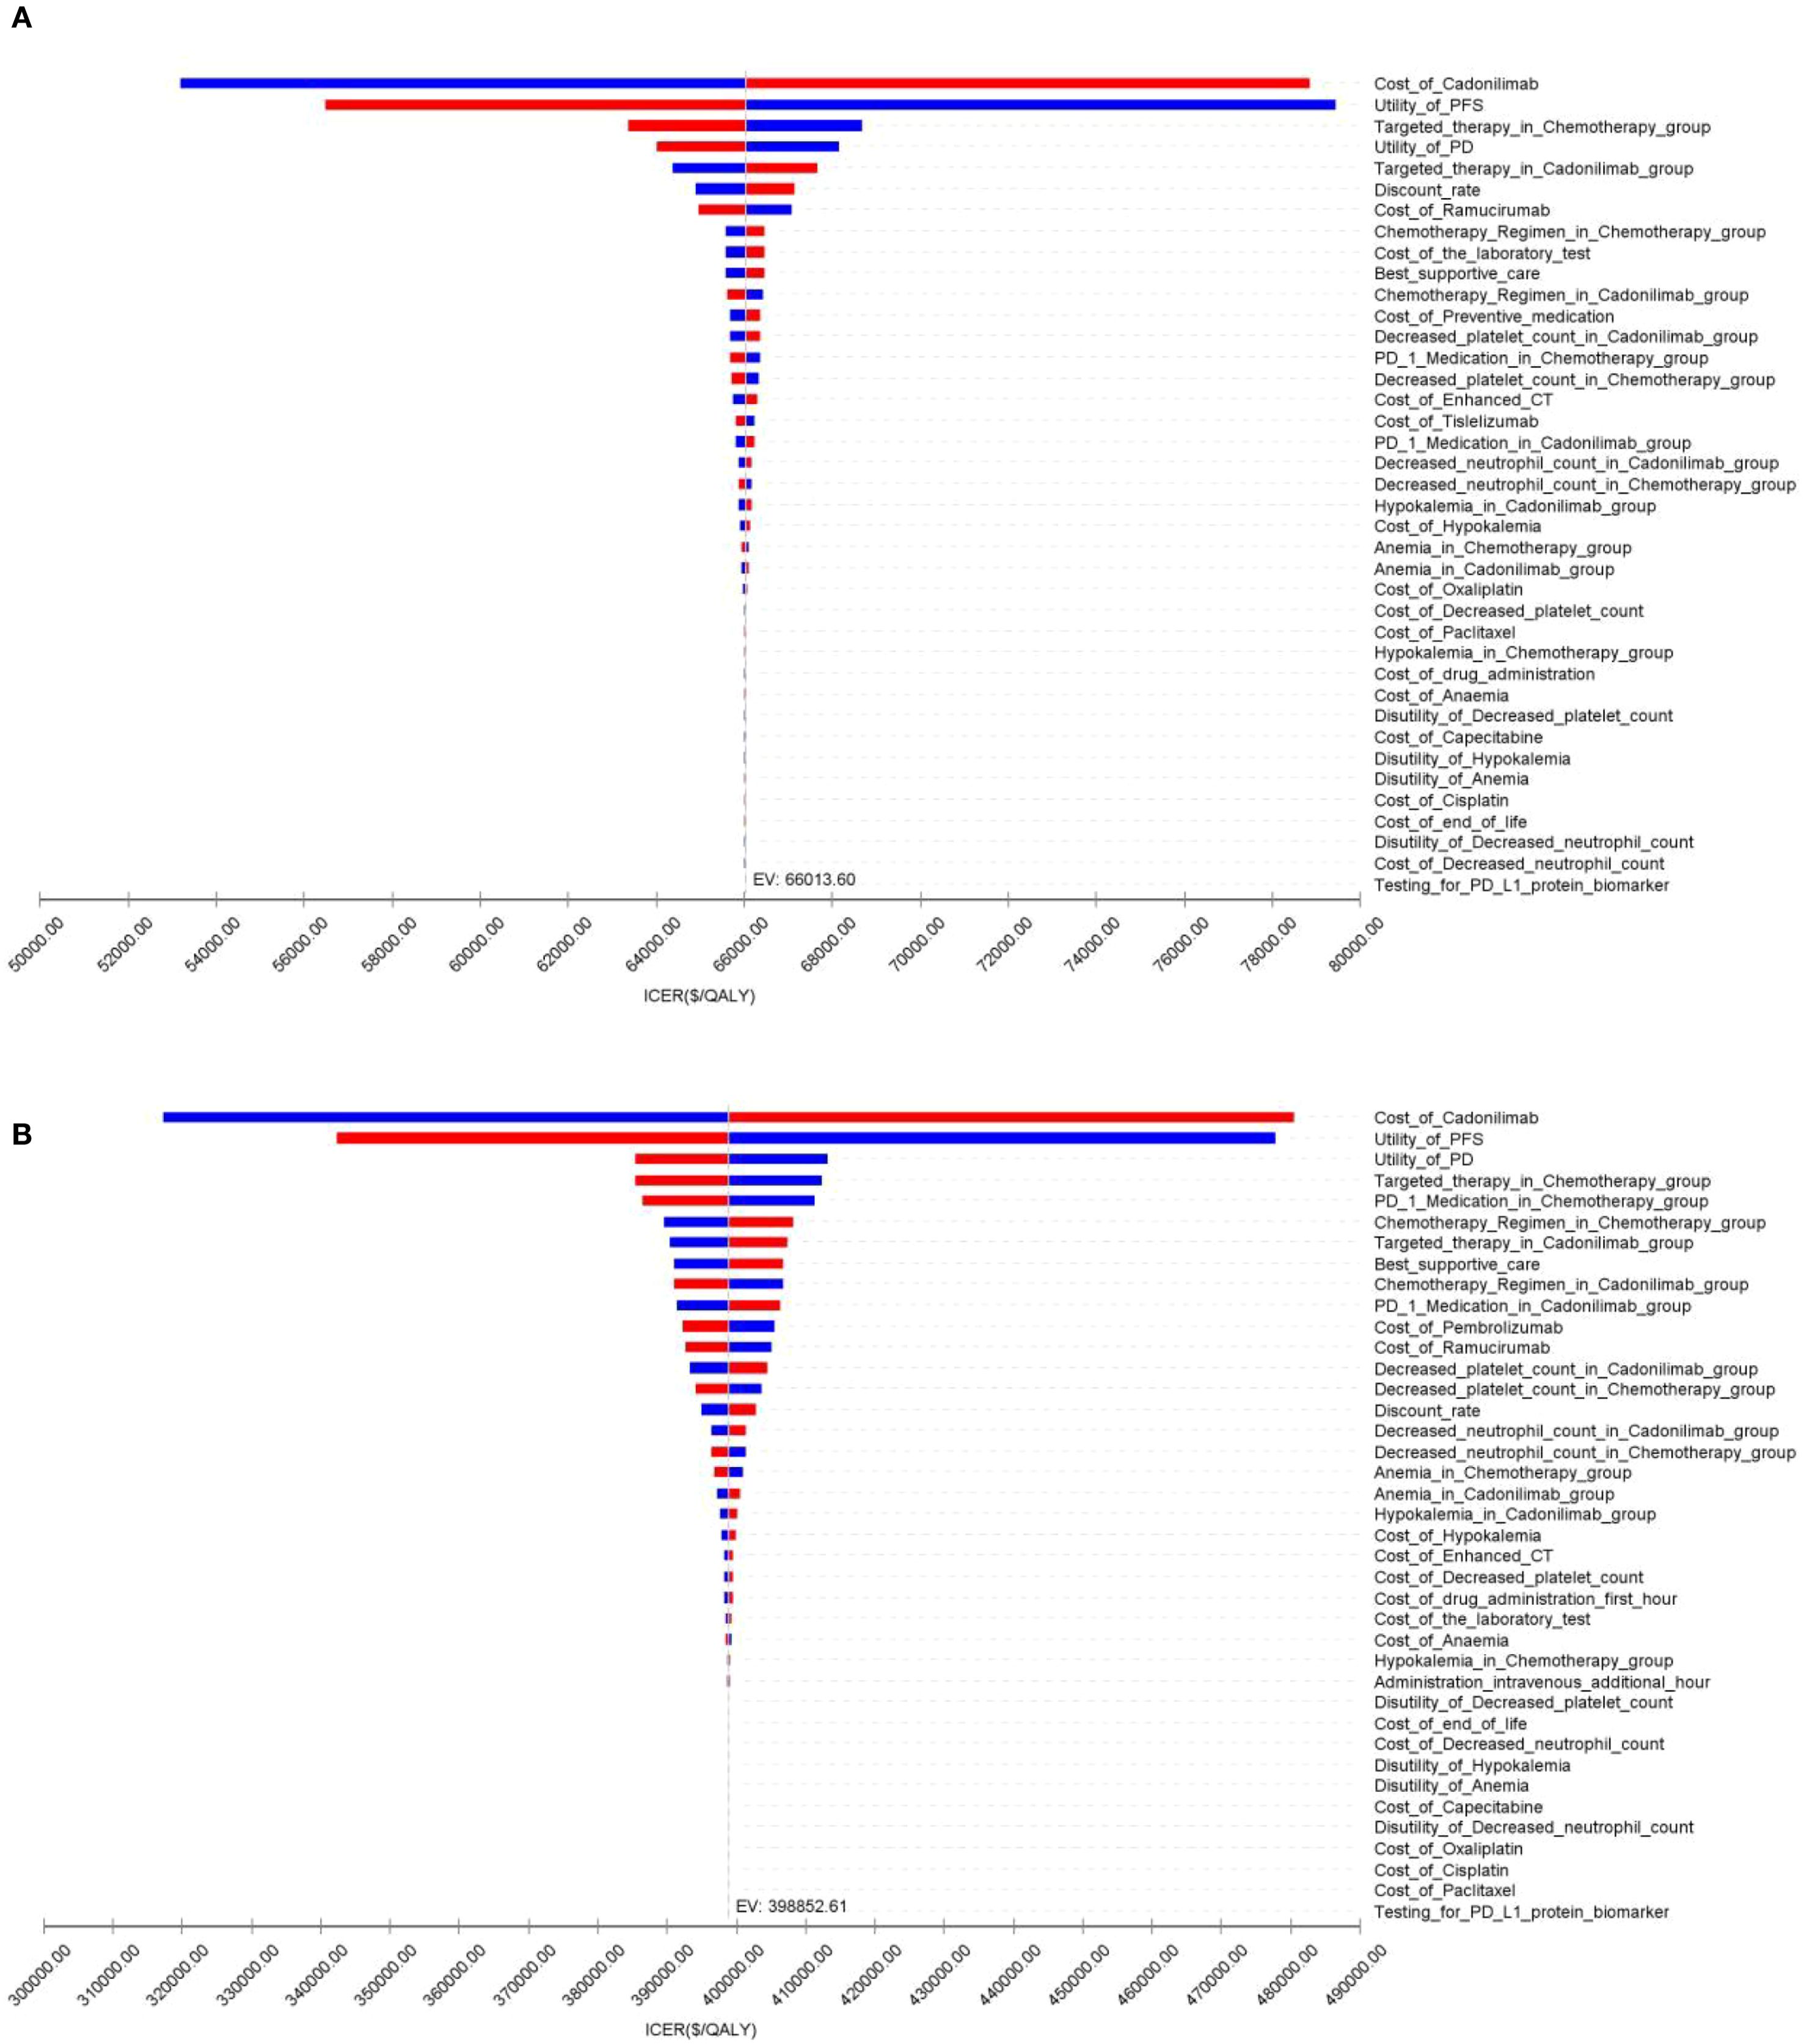
Figure 11. The tornado diagram of one-way sensitivity analysis in CPS <5 group: (A) China, (B) The U.S.
The PSA findings are shown in Figures 12–17. In a Chinese setting, the probability that cadonilimab plus chemotherapy would be cost-effective at the defined WTP threshold was 23.35% for the overall cohort, 64.37% for the CPS ≥5 subgroup, and 3.20% for the CPS <5 subgroup. In the U.S., the corresponding probabilities were 2.30% for the overall cohort, 1.48% for the CPS ≥5 subgroup, and 0.09% for the CPS <5 subgroup. These results further support the conclusion that cadonilimab plus chemotherapy offers limited economic value at the current price.
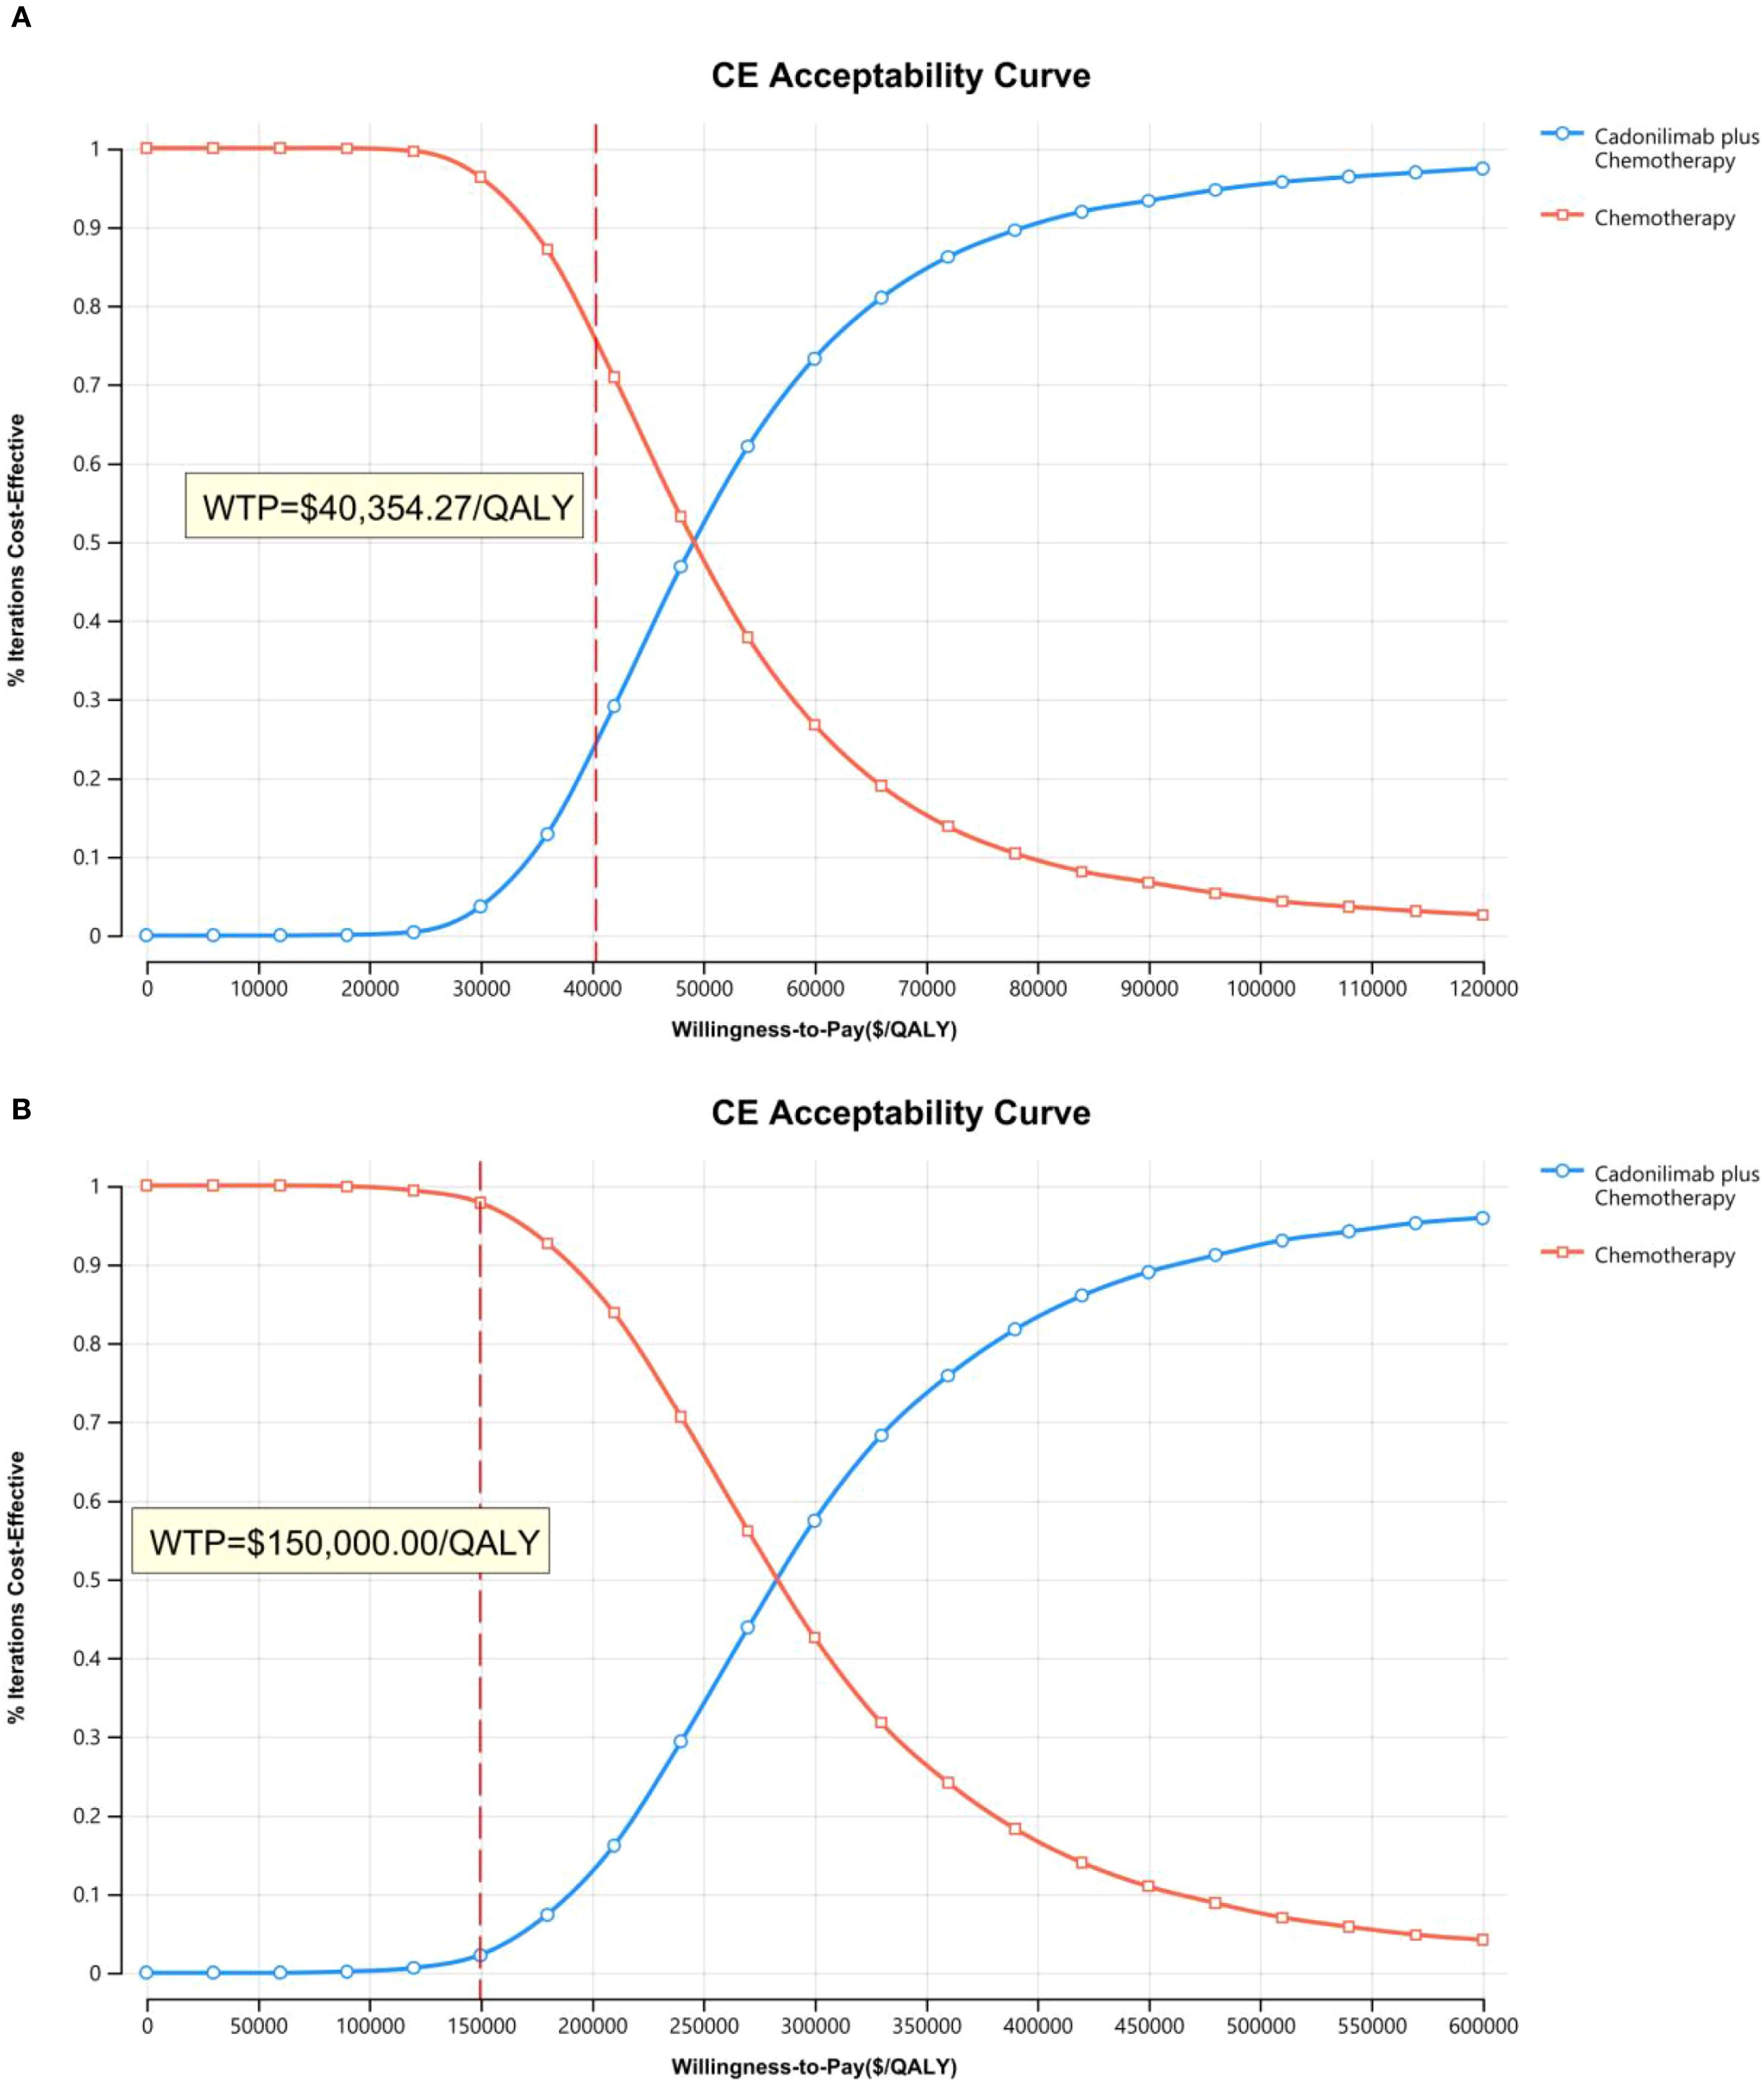
Figure 12. The cost-effectiveness acceptability curve: (A) China, (B) The U.S.
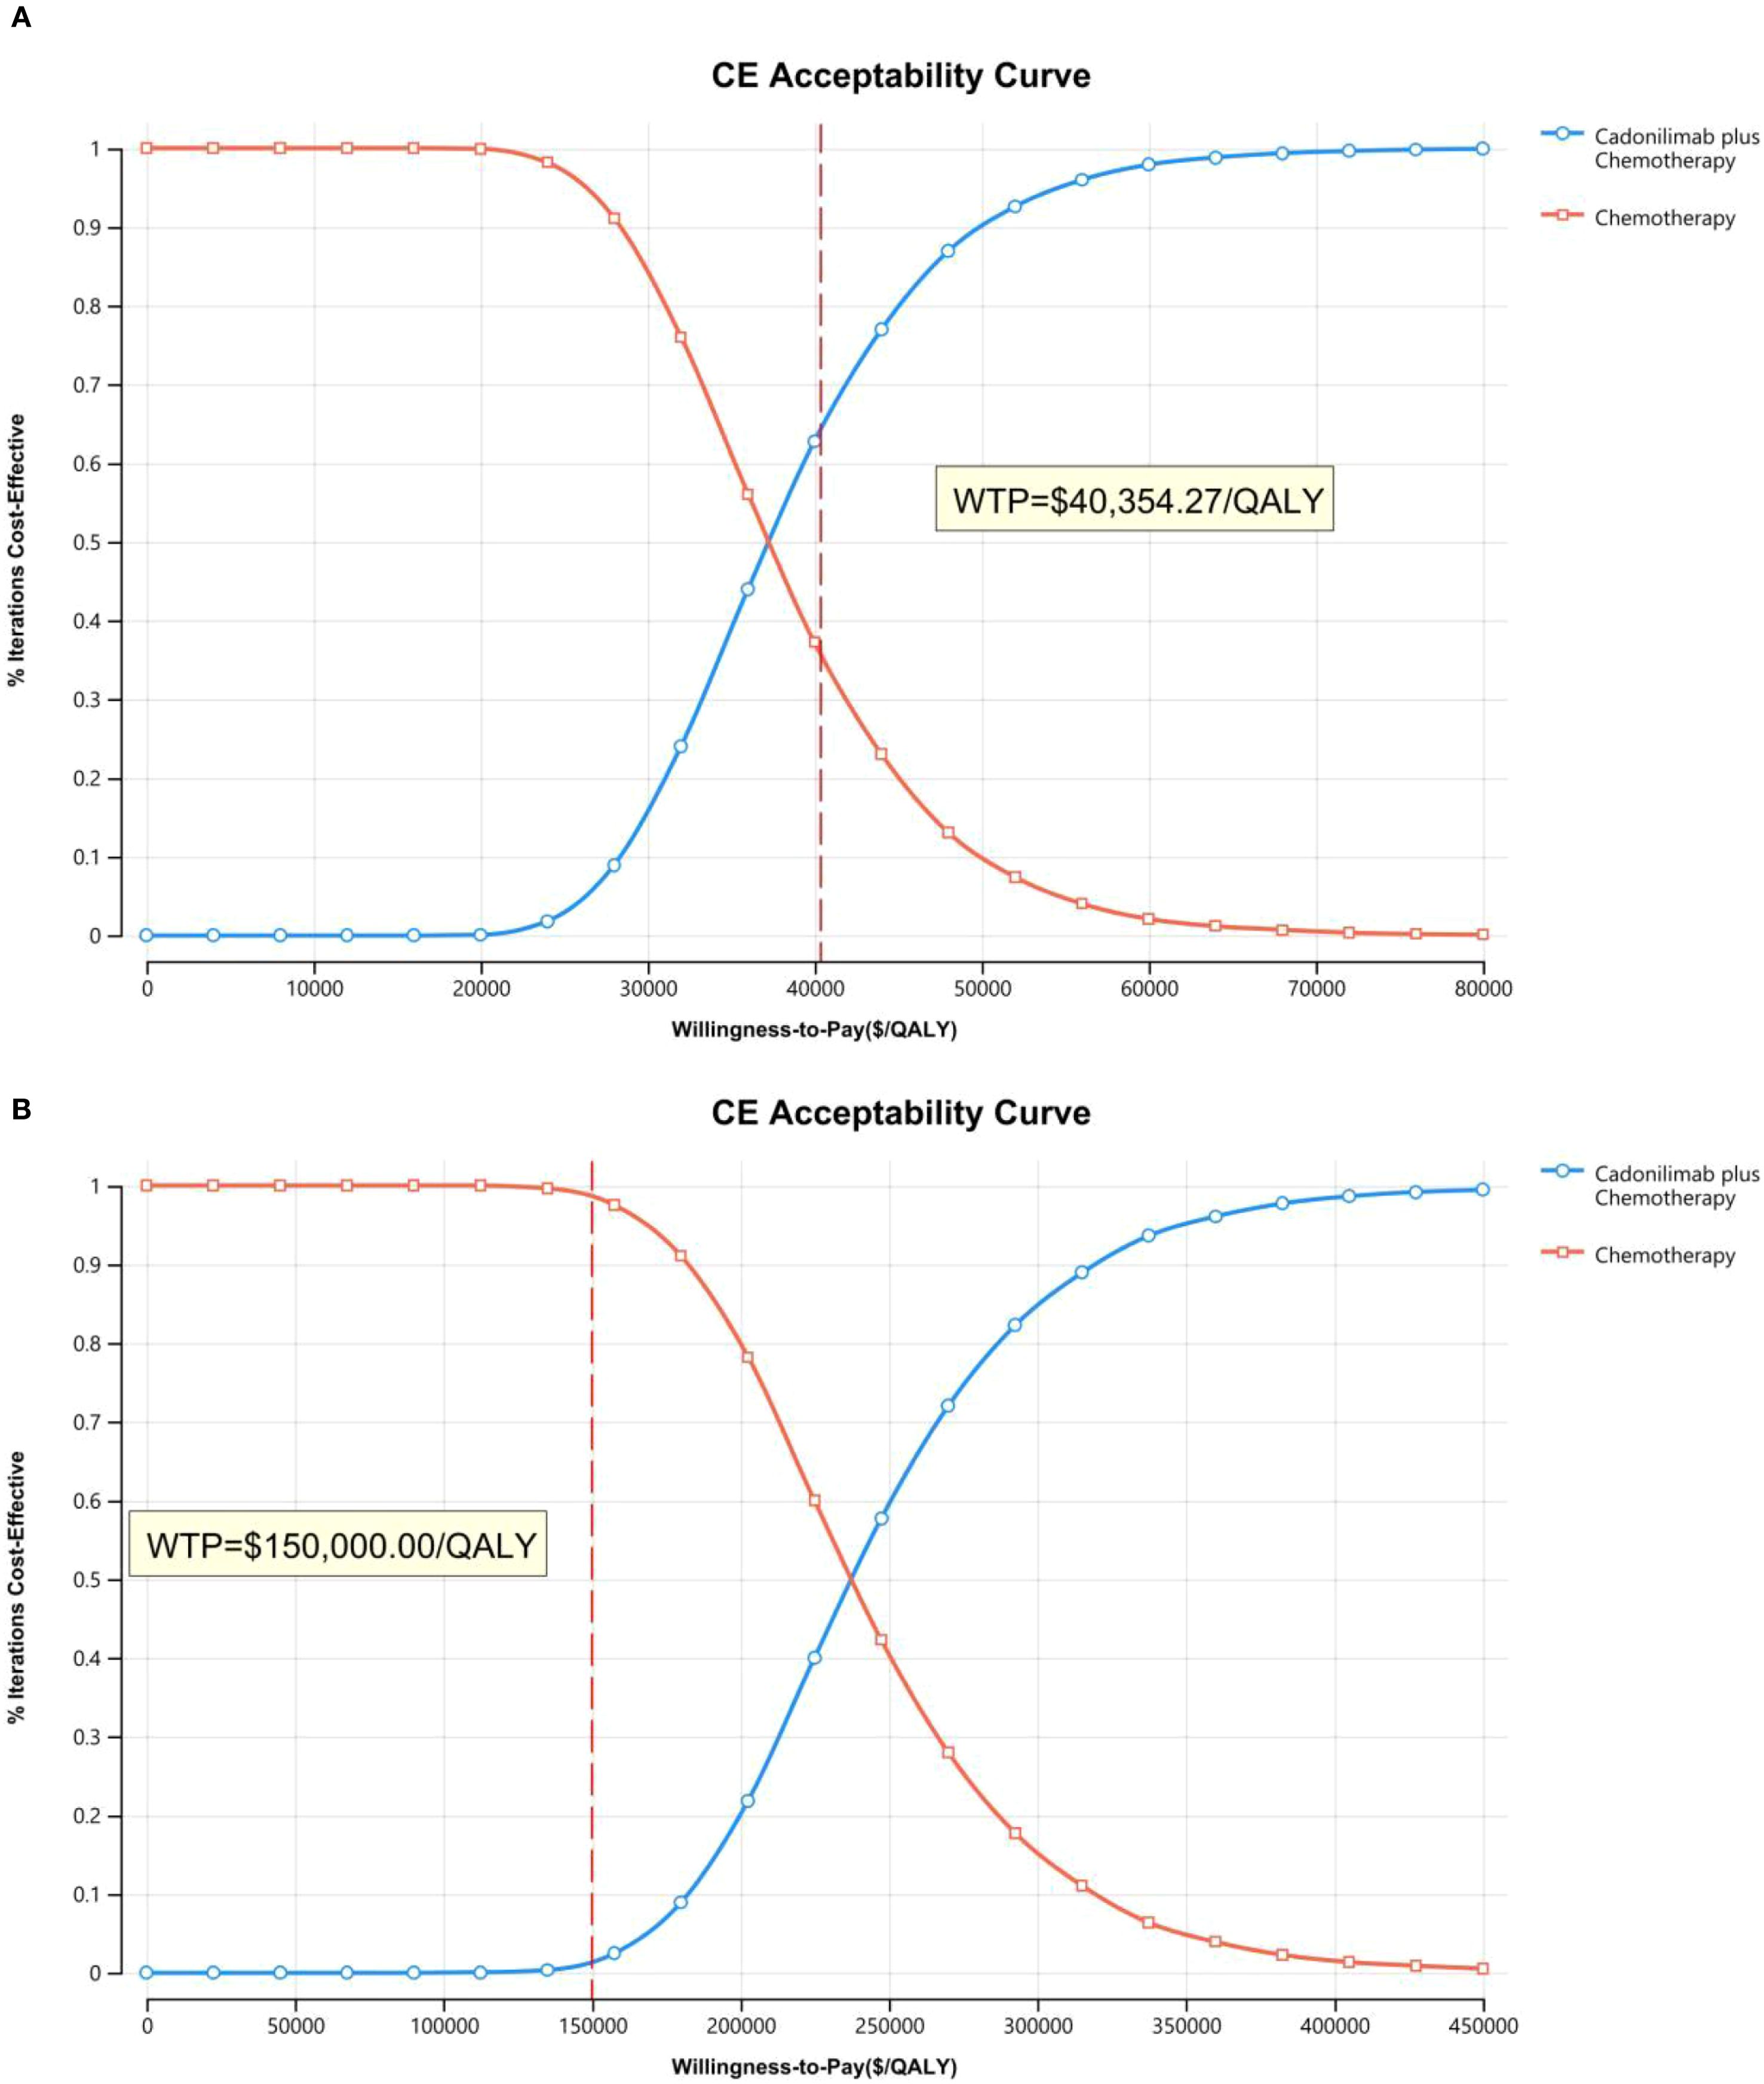
Figure 13. The cost-effectiveness acceptability curve in CPS ≥5 group: (A) China, (B) The U.S.
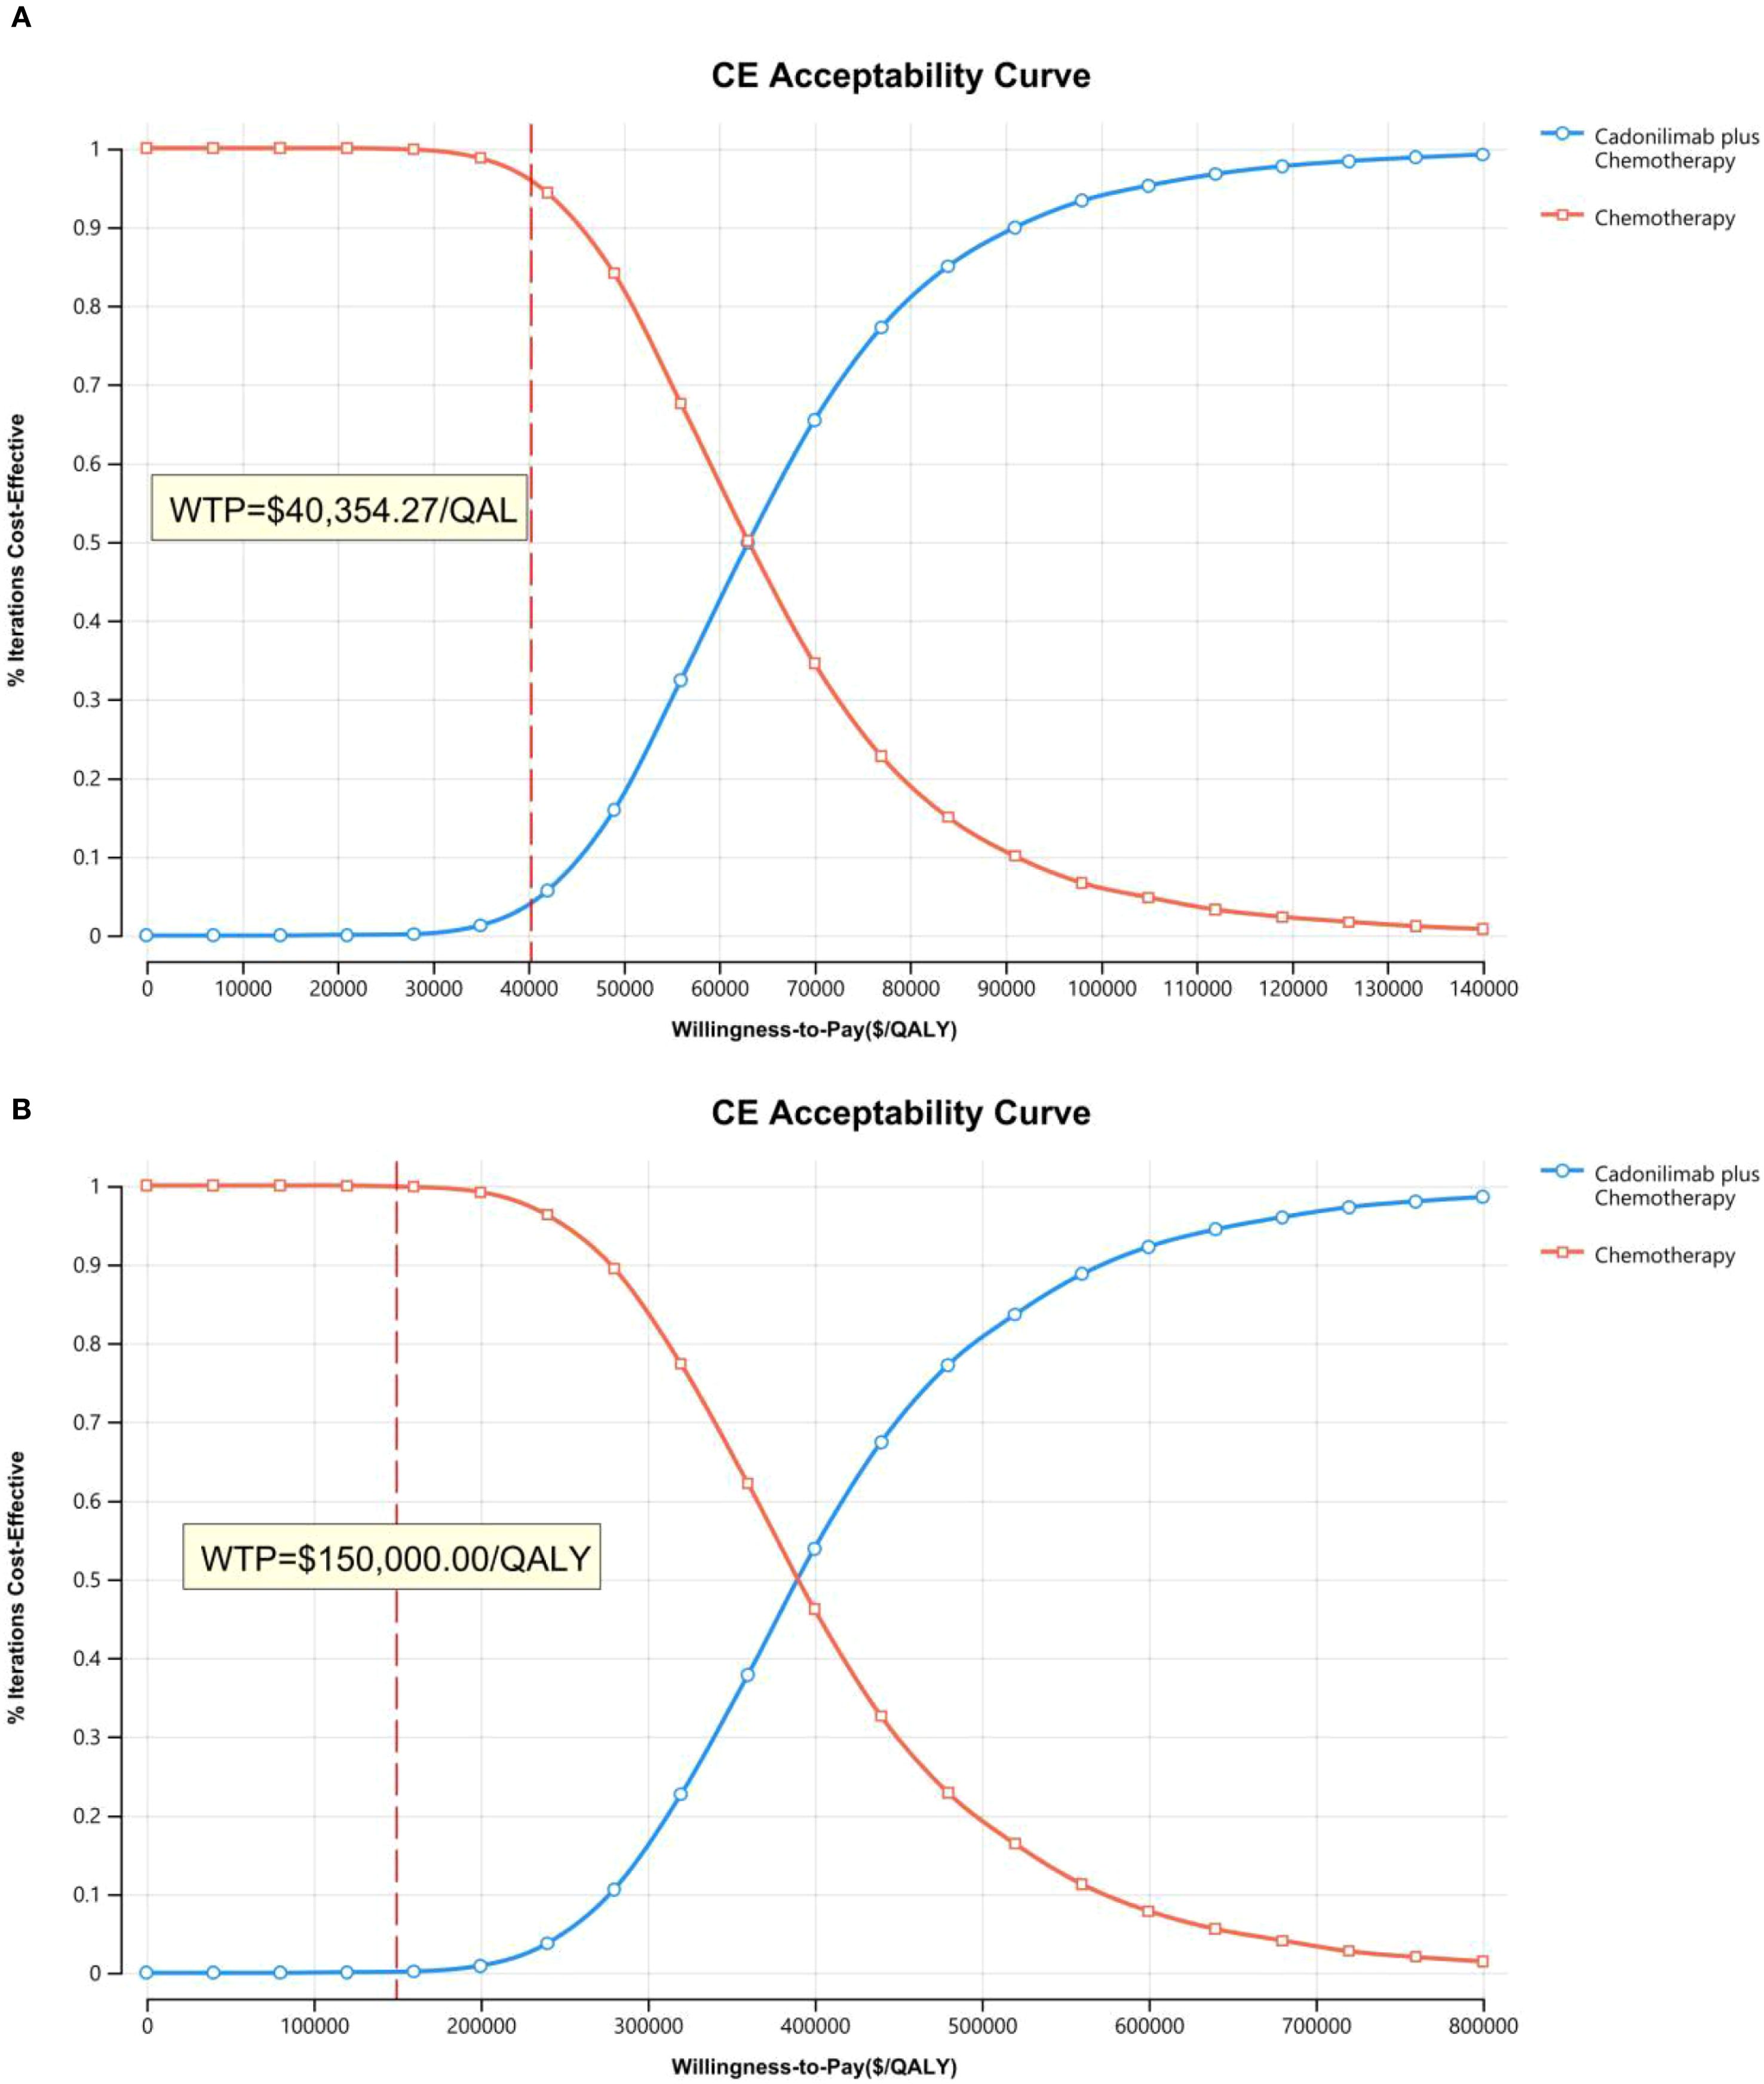
Figure 14. The cost-effectiveness acceptability curve in CPS <5 group: (A) China, (B) The U.S.
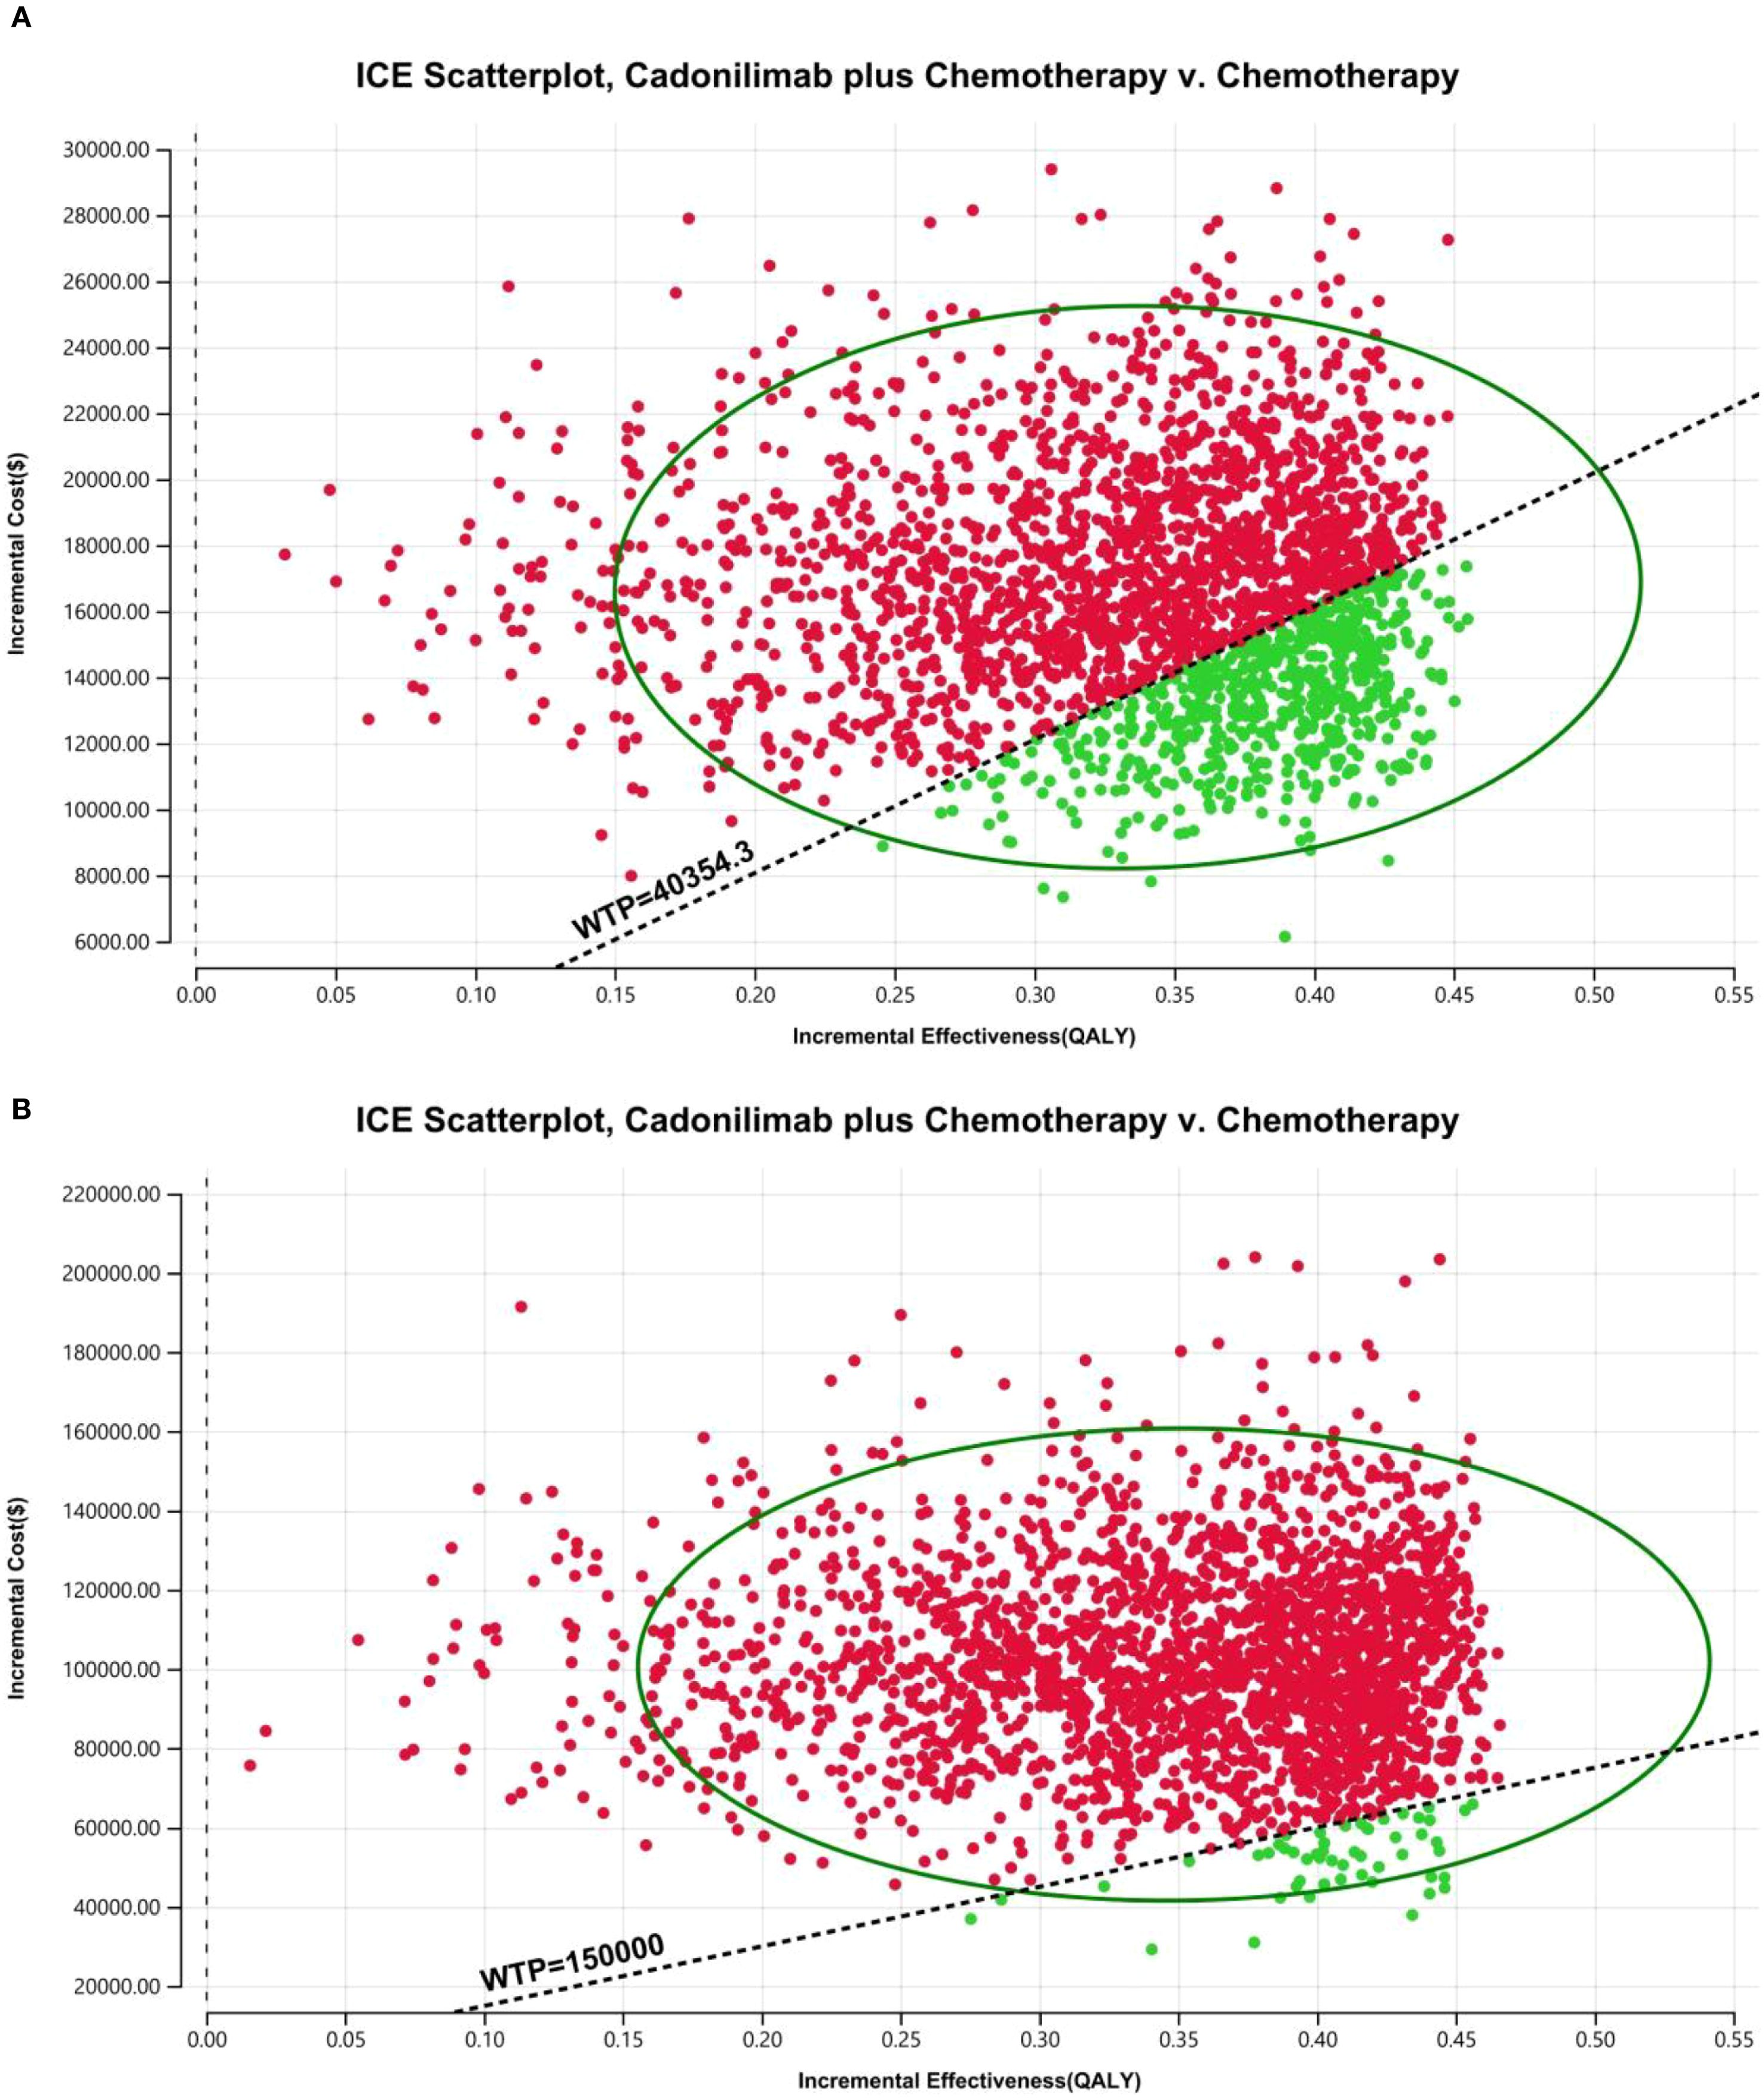
Figure 15. The cost-effectiveness probabilistic scatter plot: (A) China, (B) The U.S.
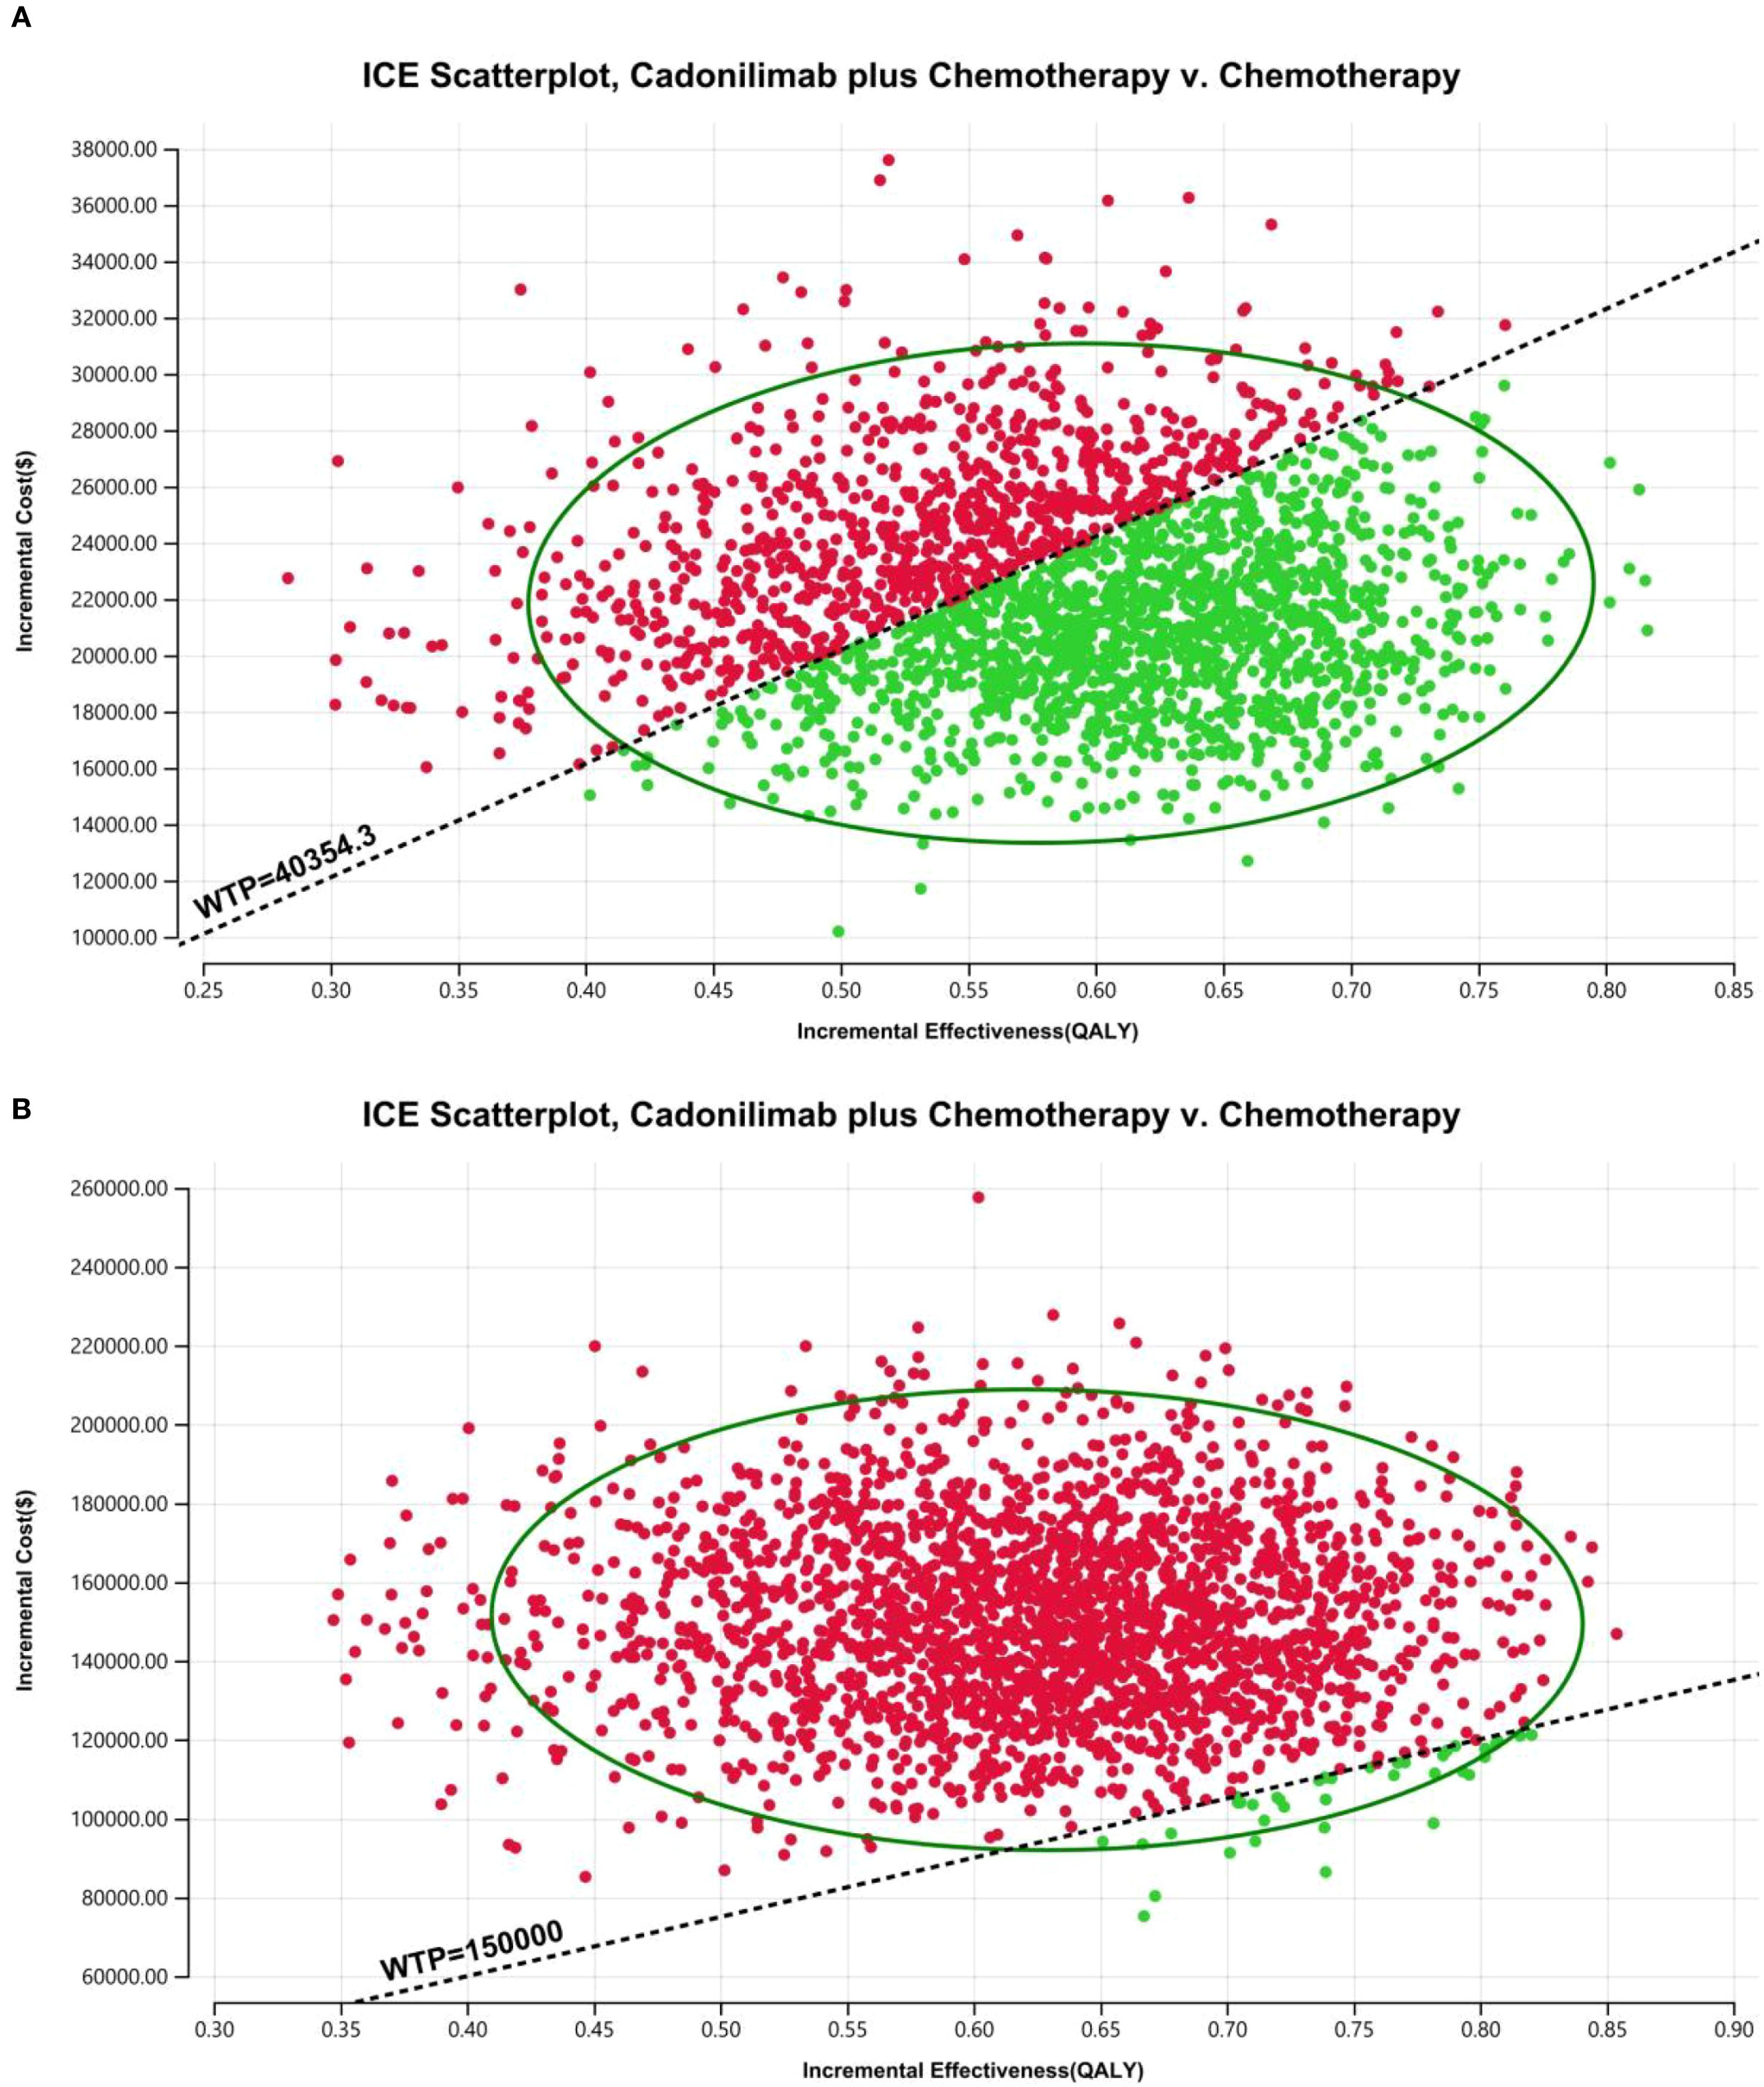
Figure 16. The cost-effectiveness probabilistic scatter plot in CPS ≥5 group: (A) China, (B) The U.S.
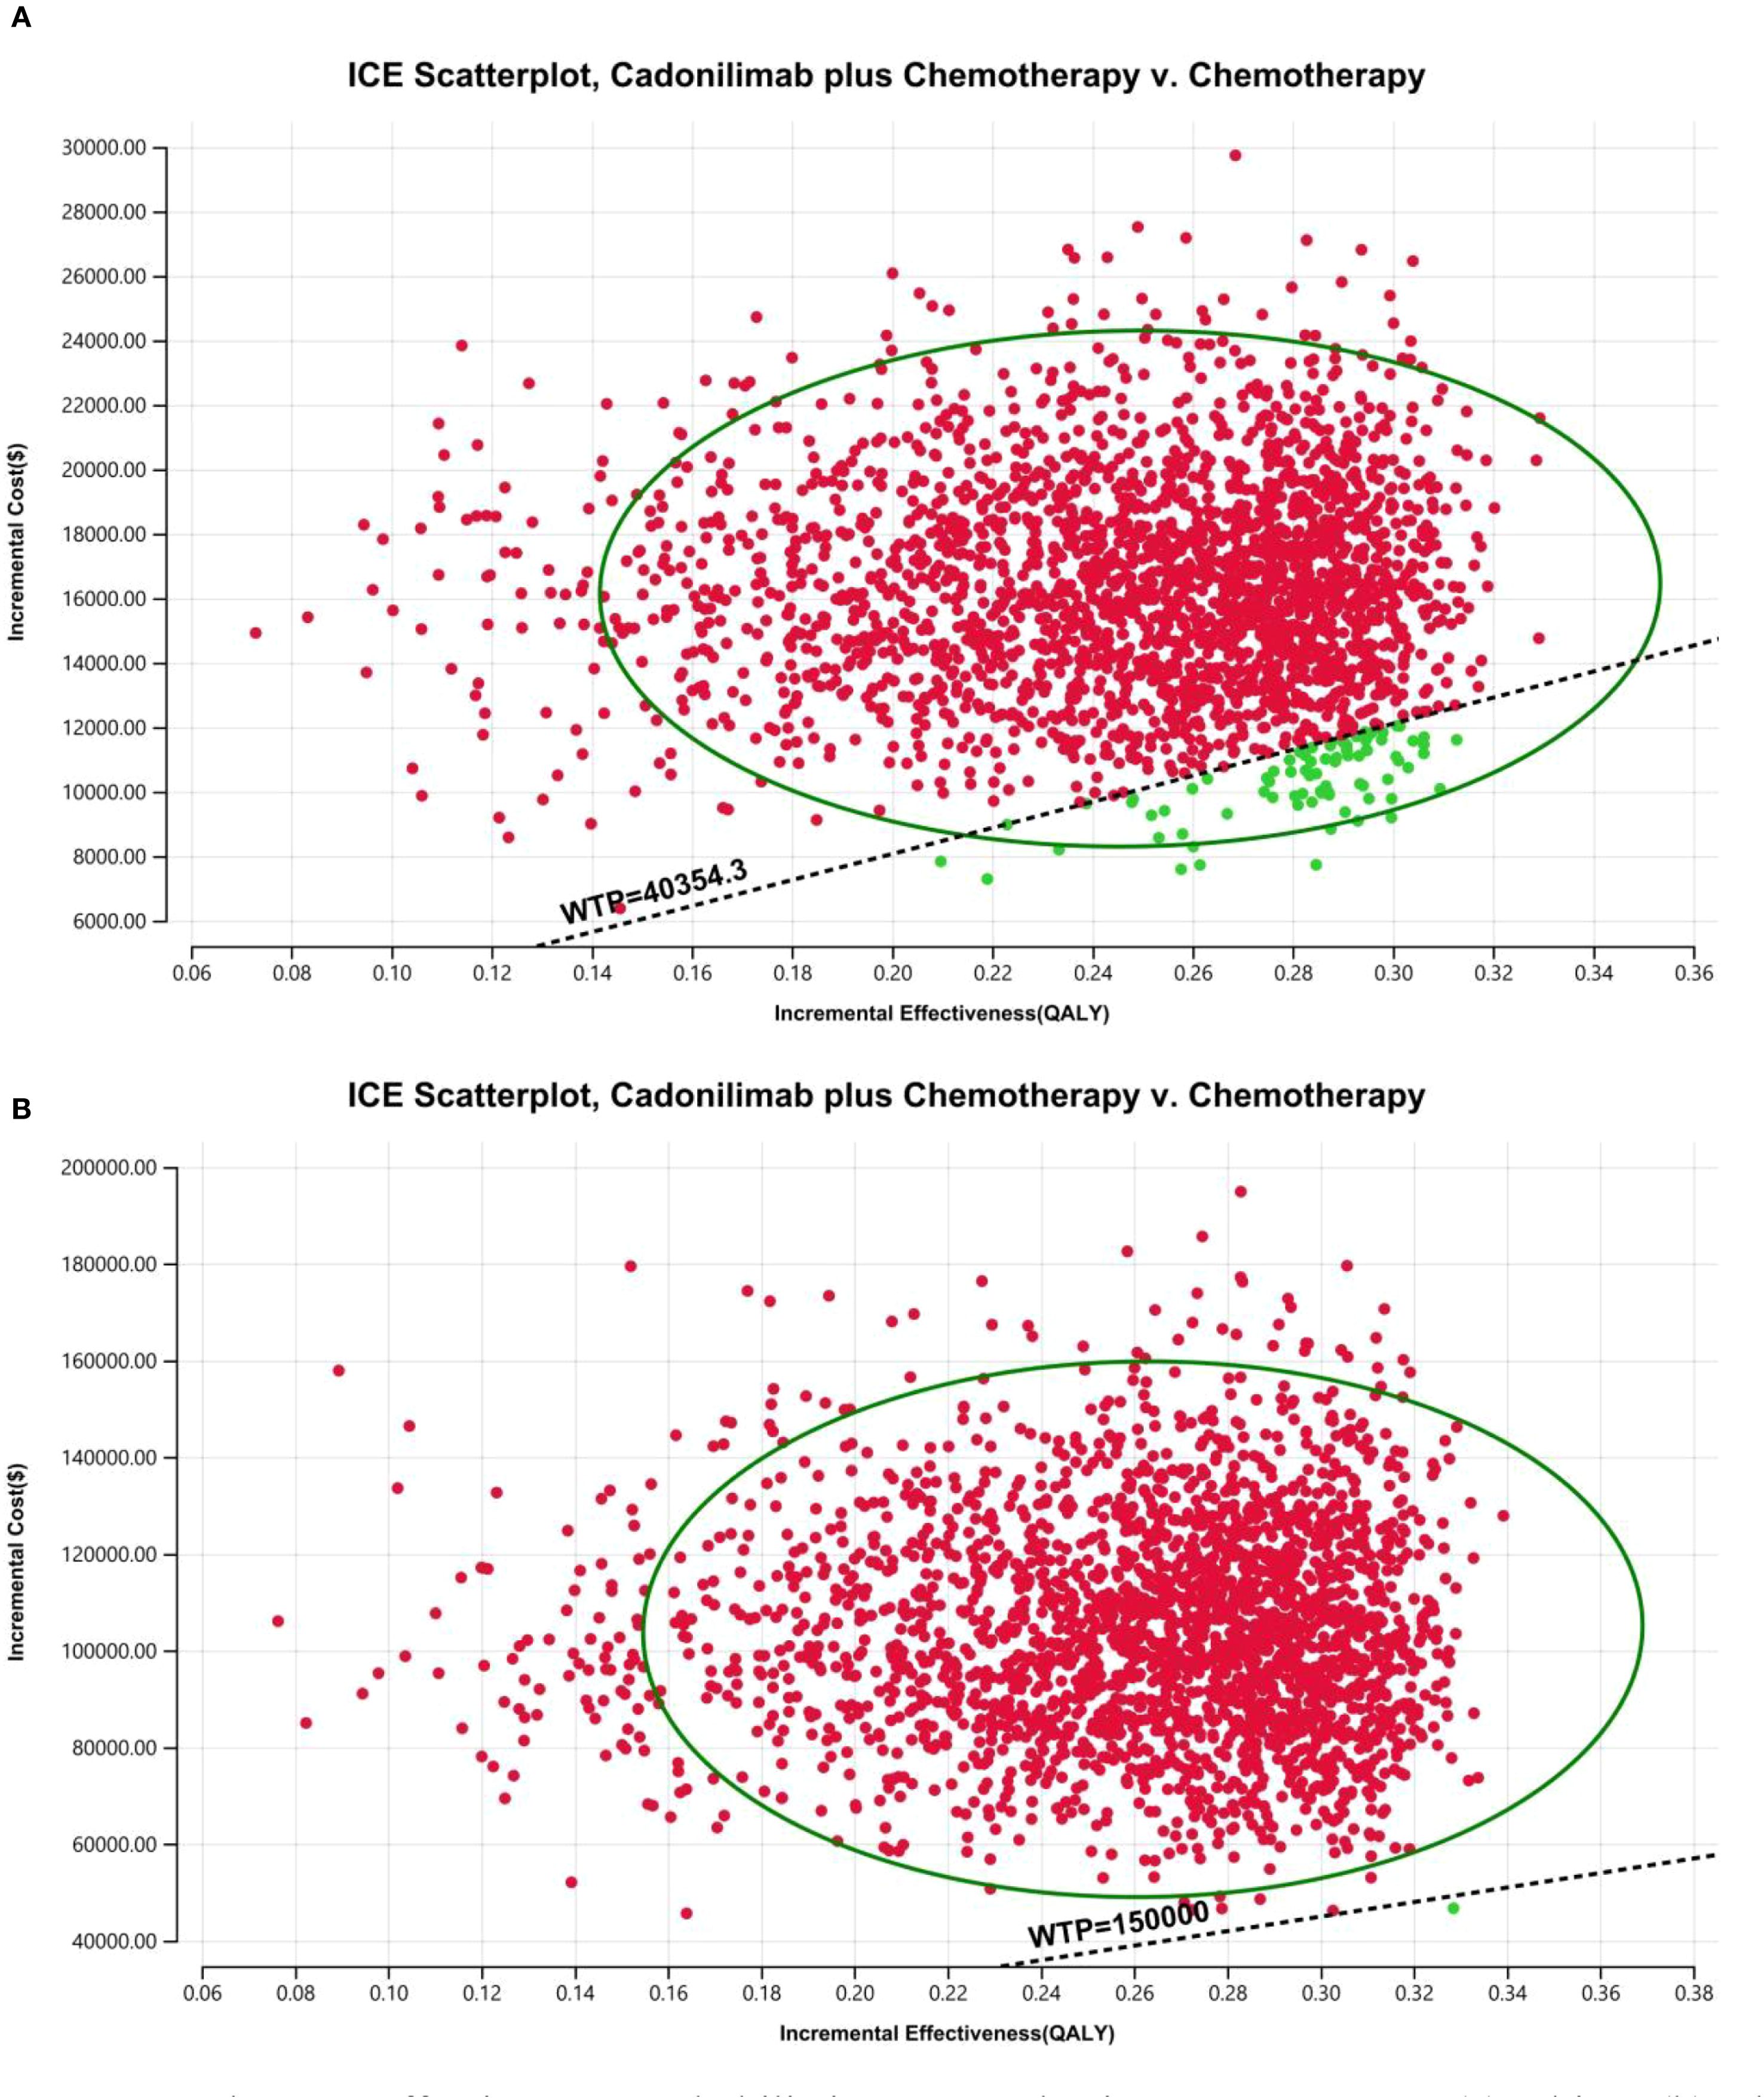
Figure 17. The cost-effectiveness probabilistic scatter plot in CPS <5 group: (A) China, (B) The U.S.
Discussion
Cadonilimab, the first PD-1/CTLA-4 bispecific antibody approved for solid tumors, demonstrated notable clinical efficacy in improving both OS and PFS in patients with unresectable or metastatic GC/GEJC, as shown in the COMPASSION-15 trial. Results from a Bayesian network meta-analysis further supported its superiority: cadonilimab plus chemotherapy offered the greatest OS and PFS benefits among various ICI-based regimens, including nivolumab, pembrolizumab, sintilimab, tislelizumab, and sugemalimab, for HER2-negative GC/GEJC patients with positive PD-L1 CPS (36). This advancement marks a significant milestone in the era of bispecific antibodies for solid tumor immunotherapy and may reshape the global immunotherapy landscape.
Despite this clinical promise, our cost-effectiveness analysis revealed that cadonilimab plus chemotherapy is not economically viable as first-line treatment for most GC/GEJC patient groups in China under current or projected pricing. This conclusion was validated by scenario analyses: both PPP-adjusted currency conversion and a 3% discount rate (as a sensitivity check) confirmed the robustness of the base-case findings. Notably, however, the combination regimen was cost-effective in the PD-L1 CPS ≥5 subgroup—with an ICER of $37,499.27 per QALY, below China’s WTP threshold of $40,354.27. Corresponding INHB and INMB values were also positive, further supporting the use of cadonilimab in this clinically responsive population.
This subgroup-specific value is particularly relevant in the Chinese healthcare context, where cadonilimab has already undergone significant price reductions: following the 2024 national medical insurance negotiations, it was included in the 2025 national medical insurance catalog for cervical cancer (effective January 1, 2025). While GC/GEJC were not included in this round due to timing constraints, the rapid approval and price reduction of cadonilimab offer meaningful hope for GC/GEJC patients. Our findings provide strong evidence to support its future inclusion in medical insurance for GC/GEJC. This aligns with the broader landscape of ICIs’ cost-effectiveness analysis in China: nivolumab and pembrolizumab have been shown to be uneconomical (37–39), while the economic value of tislelizumab, sugemalimab, and sintilimab remains controversial (33, 40–44) —consistent with our results.
Conversely, in the United States, the ICERs were $290,498.45, $240,877.66, and $398,852.61 per QALY for the overall population, CPS ≥5, and CPS <5 groups, respectively—all well above the $150,000.00 WTP threshold. This is consistent with prior findings that pembrolizumab, nivolumab, and tislelizumab also lack economic viability in the U.S. GC/GEJC setting (39, 45–47). Notably, our ICER for cadonilimab is relatively closer to the U.S. WTP threshold than other ICIs, suggesting that further Network Meta-analyses or real-world studies may help clarify its comparative economic value.
Although cadonilimab has already undergone significant price reductions in China, its price remains undetermined in many other markets. Ongoing global trade tensions and tariff policies, particularly between China and the U.S., add to pricing uncertainty, potentially limiting access to high-value cancer therapies. Our price simulation provides important insights into pricing thresholds that could render cadonilimab cost-effective: below $1,047.71 per cycle in China and $4,958.77 per cycle in the U.S. Clinically, given its demonstrated safety and efficacy advantages (and lack of obvious economic disadvantages in select subgroups), we recommend that physicians tailor treatment plans to patients’ disease profiles (e.g., PD-L1 status) and financial capacities—prioritizing the most effective regimens when affordable. These findings can inform health insurance reimbursement adjustments and guide drug tiering in clinical practice guidelines.
Sensitivity analyses identified the cost of cadonilimab and utility values for PFS and PD as the most influential parameters on the ICER, highlighting the critical role of drug pricing and patient quality of life in determining economic value. The very low cost-effectiveness probabilities observed in the PSA further validated the robustness of our base-case conclusions.
To our knowledge, this study is the first to assess the cost-effectiveness of cadonilimab, a second-generation PD-1 inhibitor, combined with chemotherapy as a first-line therapy for GC/GEJC from both the U.S. and Chinese payer perspectives. Importantly, key model parameters (e.g., utility values, costs of best supportive care, and end-of-life care) were derived from GC/GEJC-specific studies to minimize input uncertainty.
Nonetheless, this study has several limitations that must be acknowledged. First, the clinical trial data used for modeling were derived exclusively from a Chinese population, which may limit their applicability to U.S. healthcare systems. Second, the model was based on data from a controlled clinical trial, which introduced inherent uncertainty. Although real-world patients often receive multiple lines of therapy, our model incorporates only up to second-line treatment, potentially introducing bias. Lastly, subsequent treatment proportions were reported at the single-agent level, which may have affected the accuracy of the post-progression cost estimates. Future studies that incorporate broader real-world data are required to validate and refine these findings.
Conclusions
In China, cadonilimab combined with chemotherapy was cost-effective in patients with PD-L1 CPS ≥5, with an ICER of $37,499.27 per QALY—below the national WTP threshold of $40,354.27 per QALY. However, at current or projected prices, the therapy exceeded the WTP thresholds for all other subgroups in both China and the United States. These findings highlight the need to align clinical innovations with economic value to inform rational and equitable oncological treatment decisions.
Data availability statement
The raw data supporting the conclusions of this article will be made available by the authors, without undue reservation.
Author contributions
WL: Writing – review & editing, Supervision, Investigation, Data curation, Methodology, Software, Conceptualization, Writing – original draft, Resources, Project administration, Validation, Funding acquisition, Formal analysis, Visualization. LM: Conceptualization, Software, Writing – original draft, Data curation. QX: Conceptualization, Writing – original draft, Data curation, Methodology. ZZ: Visualization, Conceptualization, Writing – review & editing, Data curation, Supervision. HJ: Conceptualization, Writing – original draft, Methodology, Formal analysis, Data curation. XZ: Methodology, Data curation, Software, Conceptualization, Writing – original draft.
Funding
The author(s) declare that no financial support was received for the research and/or publication of this article.
Conflict of interest
The authors declare that the research was conducted in the absence of any commercial or financial relationships that could be construed as a potential conflict of interest.
Generative AI statement
The author(s) declare that no Generative AI was used in the creation of this manuscript.
Any alternative text (alt text) provided alongside figures in this article has been generated by Frontiers with the support of artificial intelligence and reasonable efforts have been made to ensure accuracy, including review by the authors wherever possible. If you identify any issues, please contact us.
Publisher’s note
All claims expressed in this article are solely those of the authors and do not necessarily represent those of their affiliated organizations, or those of the publisher, the editors and the reviewers. Any product that may be evaluated in this article, or claim that may be made by its manufacturer, is not guaranteed or endorsed by the publisher.
Supplementary material
The Supplementary Material for this article can be found online at: https://www.frontiersin.org/articles/10.3389/fimmu.2025.1618726/full#supplementary-material
References
1. Smyth EC, Nilsson M, Grabsch HI, van Grieken NC, and Lordick F. Gastric cancer. Lancet. (2020) 396:635–48. doi: 10.1016/s0140-6736(20)31288-5
2. Sung H, Ferlay J, Siegel RL, Laversanne M, Soerjomataram I, Jemal A, et al. Global cancer statistics 2020: globocan estimates of incidence and mortality worldwide for 36 cancers in 185 countries. CA Cancer J Clin. (2021) 71:209–49. doi: 10.3322/caac.21660
3. Han B, Zheng R, Zeng H, Wang S, Sun K, Chen R, et al. Cancer incidence and mortality in China, 2022. J Natl Cancer Cent. (2024) 4:47–53. doi: 10.1016/j.jncc.2024.01.006
4. Siegel RL, Kratzer TB, Giaquinto AN, Sung H, and Jemal A. Cancer statistics, 2025. CA Cancer J Clin. (2025) 75:10–45. doi: 10.3322/caac.21871
5. Van Cutsem E, Bang YJ, Feng-Yi F, Xu JM, Lee KW, Jiao SC, et al. Her2 screening data from toga: targeting her2 in gastric and gastroesophageal junction cancer. Gastric Cancer. (2015) 18:476–84. doi: 10.1007/s10120-014-0402-y
6. Abrahao-MaChado LF and Scapulatempo-Neto C. Her2 testing in gastric cancer: an update. World J Gastroenterol. (2016) 22:4619–25. doi: 10.3748/wjg.v22.i19.4619
7. Rha SY, Oh DY, Yañez P, Bai Y, Ryu MH, Lee J, et al. Pembrolizumab plus chemotherapy versus placebo plus chemotherapy for her2-negative advanced gastric cancer (Keynote-859): A multicentre, randomised, double-blind, phase 3 trial. Lancet Oncol. (2023) 24:1181–95. doi: 10.1016/s1470-2045(23)00515-6
8. Qiu MZ, Oh DY, Kato K, Arkenau T, Tabernero J, Correa MC, et al. Tislelizumab plus chemotherapy versus placebo plus chemotherapy as first line treatment for advanced gastric or gastro-oesophageal junction adenocarcinoma: rationale-305 randomised, double blind, phase 3 trial. Bmj. (2024) 385:e078876. doi: 10.1136/bmj-2023-078876
9. Zhang X, Wang J, Wang G, Zhang Y, Fan Q, Lu C, et al. First-line sugemalimab plus chemotherapy for advanced gastric cancer: the gemstone-303 randomized clinical trial. Jama. (2025) 333:1305–14. doi: 10.1001/jama.2024.28463
10. Janjigian YY, Shitara K, Moehler M, Garrido M, Salman P, Shen L, et al. First-line nivolumab plus chemotherapy versus chemotherapy alone for advanced gastric, gastro-oesophageal junction, and oesophageal adenocarcinoma (Checkmate 649): A randomised, open-label, phase 3 trial. Lancet. (2021) 398:27–40. doi: 10.1016/s0140-6736(21)00797-2
11. Xu J, Jiang H, Pan Y, Gu K, Cang S, Han L, et al. Sintilimab plus chemotherapy for unresectable gastric or gastroesophageal junction cancer: the orient-16 randomized clinical trial. Jama. (2023) 330:2064–74. doi: 10.1001/jama.2023.19918
12. Pang X, Huang Z, Zhong T, Zhang P, Wang ZM, Xia M, et al. Cadonilimab, a tetravalent pd-1/ctla-4 bispecific antibody with trans-binding and enhanced target binding avidity. MAbs. (2023) 15:2180794. doi: 10.1080/19420862.2023.2180794
13. Gao X, Xu N, Li Z, Shen L, Ji K, Zheng Z, et al. Safety and antitumour activity of cadonilimab, an anti-pd-1/ctla-4 bispecific antibody, for patients with advanced solid tumours (Compassion-03): A multicentre, open-label, phase 1b/2 trial. Lancet Oncol. (2023) 24:1134–46. doi: 10.1016/s1470-2045(23)00411-4
14. Gao X, Ji K, Jia Y, Shan F, Chen Y, Xu N, et al. Cadonilimab with chemotherapy in her2-negative gastric or gastroesophageal junction adenocarcinoma: the phase 1b/2 compassion-04 trial. Nat Med. (2024) 30:1943–51. doi: 10.1038/s41591-024-03007-5
15. Shen L, Zhang Y, Li Z, Zhang X, Gao X, Liu B, et al. First-line cadonilimab plus chemotherapy in her2-negative advanced gastric or gastroesophageal junction adenocarcinoma: A randomized, double-blind, phase 3 trial. Nat Med. (2025) 31:1163–70. doi: 10.1038/s41591-024-03450-4
16. Ajani JA, D’Amico TA, Bentrem DJ, Corvera CU, Das P, Enzinger PC, et al. Gastric cancer, version 2.2025, nccn clinical practice guidelines in oncology. J Natl Compr Canc Netw. (2025) 23:169–91. doi: 10.6004/jnccn.2025.0022
17. Husereau D, Drummond M, Augustovski F, de Bekker-Grob E, Briggs AH, Carswell C, et al. Consolidated health economic evaluation reporting standards 2022 (Cheers 2022) statement: updated reporting guidance for health economic evaluations. Clin Ther. (2022) 44:158–68. doi: 10.1016/j.clinthera.2022.01.011
18. Wang FH, Zhang XT, Tang L, Wu Q, Cai MY, Li YF, et al. The chinese society of clinical oncology (Csco): clinical guidelines for the diagnosis and treatment of gastric cancer, 2023. Cancer Commun (Lond). (2024) 44:127–72. doi: 10.1002/cac2.12516
19. Zhang M, Wen F, He X, Zhang W, Hu J, and Li Q. Adjuvant chemoradiotherapy for gastric cancer: efficacy and cost-effectiveness analysis. Front Oncol. (2019) 9:1357. doi: 10.3389/fonc.2019.01357
20. Wu B, Li T, Cai J, Xu Y, and Zhao G. Cost-effectiveness analysis of adjuvant chemotherapies in patients presenting with gastric cancer after D2 gastrectomy. BMC Cancer. (2014) 14:984. doi: 10.1186/1471-2407-14-984
21. Liu L, Wang L, Chen L, Ding Y, Zhang Q, and Shu Y. Cost-effectiveness of sintilimab plus chemotherapy versus chemotherapy alone as first-line treatment of locally advanced or metastatic oesophageal squamous cell carcinoma. Front Immunol. (2023) 14:1092385. doi: 10.3389/fimmu.2023.1092385
22. Zhu Y, Liu K, Zhu H, and Wu H. Immune checkpoint inhibitors plus chemotherapy for her2-negative advanced gastric/gastroesophageal junction cancer: A cost-effectiveness analysis. Therap Adv Gastroenterol. (2023) 16:17562848231207200. doi: 10.1177/17562848231207200
23. Meng R, Zhang X, Zhou T, Luo M, and Qiu Y. Cost-effectiveness analysis of donafenib versus lenvatinib for first-line treatment of unresectable or metastatic hepatocellular carcinoma. Expert Rev Pharmacoecon Outcomes Res. (2022) 22:1079–86. doi: 10.1080/14737167.2022.2079498
24. Shiroiwa T, Fukuda T, and Shimozuma K. Cost-effectiveness analysis of trastuzumab to treat her2-positive advanced gastric cancer based on the randomised toga trial. Br J Cancer. (2011) 105:1273–8. doi: 10.1038/bjc.2011.390
25. Dieleman JL, Cao J, Chapin A, Chen C, Li Z, Liu A, et al. Us health care spending by payer and health condition, 1996-2016. Jama. (2020) 323:863–84. doi: 10.1001/jama.2020.0734
26. Su D, Wu B, and Shi L. Cost-effectiveness of atezolizumab plus bevacizumab vs sorafenib as first-line treatment of unresectable hepatocellular carcinoma. JAMA Netw Open. (2021) 4:e210037. doi: 10.1001/jamanetworkopen.2021.0037
27. Yue X, Li Y, Wu J, and Guo JJ. Current development and practice of pharmacoeconomic evaluation guidelines for universal health coverage in China. Value Health Reg Issues. (2021) 24:1–5. doi: 10.1016/j.vhri.2020.07.580
28. Shao T, Zhao M, Liang L, and Tang W. Serplulimab plus chemotherapy vs chemotherapy for treatment of us and chinese patients with extensive-stage small-cell lung cancer: A cost-effectiveness analysis to inform drug pricing. BioDrugs. (2023) 37:421–32. doi: 10.1007/s40259-023-00586-6
29. Murray CJ, Evans DB, Acharya A, and Baltussen RM. Development of who guidelines on generalized cost-effectiveness analysis. Health Econ. (2000) 9:235–51. doi: 10.1002/(sici)1099-1050(200004)9:3<235::aid-hec502>3.0.co;2-o
30. Latimer NR. Survival analysis for economic evaluations alongside clinical trials–extrapolation with patient-level data: inconsistencies, limitations, and a practical guide. Med Decis Making. (2013) 33:743–54. doi: 10.1177/0272989x12472398
31. Rulli E, Ghilotti F, Biagioli E, Porcu L, Marabese M, D’Incalci M, et al. Assessment of proportional hazard assumption in aggregate data: A systematic review on statistical methodology in clinical trials using time-to-event endpoint. Br J Cancer. (2018) 119:1456–63. doi: 10.1038/s41416-018-0302-8
32. Chueh CH, Tsai YW, Chen ZR, Shiu MN, Wen YW, and Chiang NJ. Cost-effectiveness analysis of a new second-line treatment regimen for advanced intrahepatic cholangiocarcinoma: biomarker-driven targeted therapy of pemigatinib versus 5-fu chemotherapy. Pharmacoeconomics. (2023) 41:307–19. doi: 10.1007/s40273-022-01227-6
33. Lang W, Ai Q, Zhang W, Jiang Q, He Y, and Ouyang M. Cost-effectiveness analysis of tislelizumab plus chemotherapy versus placebo plus chemotherapy as first-line treatment for advanced gastric or gastroesophageal junction adenocarcinoma: perspectives from the United States and China. Front Pharmacol. (2024) 15:1461571. doi: 10.3389/fphar.2024.1461571
34. Centers_for_Medicare_and_Medicaid_Services. Medicare Physician Fee Schedule Look-up Tool: Centers for Medicare and Medicaid Services (2025). Available online at: https://www.cms.gov/medicare/physicianfee-schedule/search (Accessed January 17, 2025).
35. Wong W, Yim YM, Kim A, Cloutier M, Gauthier-Loiselle M, Gagnon-Sanschagrin P, et al. Assessment of costs associated with adverse events in patients with cancer. PLoS One. (2018) 13:e0196007. doi: 10.1371/journal.pone.0196007
36. Zhang W, Guo K, and Zheng S. Immunotherapy combined with chemotherapy in the first-line treatment of advanced gastric cancer: systematic review and bayesian network meta-analysis based on specific pd-L1 cps. Curr Oncol. (2025) 32(2):Epub 20250216. doi: 10.3390/curroncol32020112
37. Jiang Y, Li Y, and Wang LXW. Cost-effectiveness analysis of nivolumab plus standard chemotherapy versus chemotherapy alone for the first-line treatment of unresectable advanced or metastatic gastric cancer, gastroesophageal junction cancer, and esophageal adenocarcinoma. Int J Clin Pharm. (2022) 44:499–506. doi: 10.1007/s11096-021-01372-6
38. Lang Y, Lin Y, Li D, Liu J, and Liu X. Pembrolizumab alone or in combination with chemotherapy versus chemotherapy for advanced gastric cancer: A cost-effectiveness analysis. Cancer Med. (2023) 12:18447–59. doi: 10.1002/cam4.6389
39. Lang W, Deng L, Lu M, and Ouyang M. Cost-effectiveness analysis of pembrolizumab plus chemotherapy versus placebo plus chemotherapy for her2-negative advanced gastric/gastroesophageal junction cancer in the chinese healthcare system. Expert Rev Pharmacoecon Outcomes Res. (2024) 24:1027–42. doi: 10.1080/14737167.2024.2378983
40. Li W, Wan L, and Zhang J. Cost-effectiveness of tislelizumab plus chemotherapy vs chemotherapy as first-line treatment of pd-L1 positive advanced gastric or gastroesophageal junction adenocarcinoma from a chinese perspective. Expert Rev Gastroenterol Hepatol. (2024) 18:293–301. doi: 10.1080/17474124.2024.2373730
41. Tang L, Zhu L, Zhan S, Chen Y, and Feng PF. Cost-effectiveness analysis of sugemalimab combined with chemotherapy as first-line treatment for advanced gastric cancer. Front Public Health. (2025) 13:1620663. doi: 10.3389/fpubh.2025.1620663
42. Xu L, Long Y, Yao L, Wang H, and Ge W. Updated cost-effectiveness analysis of tislelizumab in combination with chemotherapy for the first-line treatment of advanced gastric cancer or gastroesophageal junction adenocarcinoma. Front Oncol. (2024) 14:1477722. doi: 10.3389/fonc.2024.1477722
43. Xiang Z, Ma L, Fu Y, and Pan Y. Cost-effectiveness analysis of first-line sintilimab plus chemotherapy vs. Chemotherapy alone for unresectable advanced or metastatic gastric or gastroesophageal junction cancer in China. Front Pharmacol. (2024) 15:1411571. doi: 10.3389/fphar.2024.1411571
44. Zheng Z, Song X, Cai H, and Zhu H. Pembrolizumab combined with chemotherapy versus placebo combined with chemotherapy for her2-negative advanced gastric cancer in China: A cost-effectiveness analysis. Expert Rev Pharmacoecon Outcomes Res. (2024) 24:1017–25. doi: 10.1080/14737167.2024.2378986
45. Cao X, Zhang M, Li N, Zheng B, Liu M, Song X, et al. First-line nivolumab plus chemotherapy versus chemotherapy alone for advanced gastric cancer, gastroesophageal junction cancer, and esophageal adenocarcinoma: A cost-effectiveness analysis. Ther Adv Med Oncol. (2023) 15:17588359231171038. doi: 10.1177/17588359231171038
46. Marupuru S, Arku D, Axon DR, Villa-Zapata L, Yaghoubi M, Slack MK, et al. Cost-effectiveness analysis of nivolumab-chemotherapy as first-line therapy for locally advanced/metastatic gastric cancer: A United States payer perspective. Expert Rev Pharmacoecon Outcomes Res. (2023) 23:831–41. doi: 10.1080/14737167.2023.2219448
Keywords: cost-effectiveness, cadonilimab, PD-1/CTLA-4, gastric cancer, Markov model
Citation: Lang W, Mei L, Xiao Q, Zhou Z, Jiang H and Zhao X (2025) Cost-effectiveness of cadonilimab plus chemotherapy vs chemotherapy alone for advanced gastric cancer: evidence to inform drug pricing in the U.S. and China. Front. Immunol. 16:1618726. doi: 10.3389/fimmu.2025.1618726
Received: 26 April 2025; Accepted: 10 September 2025;
Published: 14 October 2025.
Edited by:
Stavros P. Papadakos, Laiko General Hospital of Athens, GreeceReviewed by:
Palash Mandal, Charotar University of Science and Technology, IndiaMehmet Emin Arayici, Dokuz Eylül University, Türkiye
Copyright © 2025 Lang, Mei, Xiao, Zhou, Jiang and Zhao. This is an open-access article distributed under the terms of the Creative Commons Attribution License (CC BY). The use, distribution or reproduction in other forums is permitted, provided the original author(s) and the copyright owner(s) are credited and that the original publication in this journal is cited, in accordance with accepted academic practice. No use, distribution or reproduction is permitted which does not comply with these terms.
*Correspondence: Wenwang Lang, MjkwNzAyMDYyQHFxLmNvbQ==