 Shufa Tan
 Xiaoqing Yang2†
 Yao Wang
 Yuwei Li
 Yuhong Bian
 Chen Xu
- 1School of Integrative Medicine, Tianjin University of Traditional Chinese Medicine, Tianjin, China
- 2Tianjin Institute of Urology, the 2nd Hospital of Tianjin Medical University, Tianjin, China
- 3Department of Colorectal Surgery, Tianjin Union Medical Center, The First Affiliated Hospital of Nankai University, Tianjin, China
Background: The neutrophil-to-lymphocyte ratio (NLR), platelet-to-lymphocyte ratio (PLR), and lymphocyte-to-monocyte ratio (LMR) are peripheral serum markers commonly utilized as cost-effective indicators of inflammation. However, their efficacy as predictors of clinical disease activity in inflammatory bowel disease (IBD), including ulcerative colitis (UC) and Crohn’s disease (CD), remains uncertain. To address this ambiguity, we conducted a meta-analysis to evaluate the clinical significance of NLR, PLR, and LMR in patients with IBD.
Methods: A comprehensive search was conducted in the PubMed, Embase, Web of Science, and Cochrane databases, with the last search date being October 2024. Baseline values of NLR, PLR, and LMR during active and remission phases, as well as moderate and severe conditions, were analyzed as primary endpoints in patients with IBD compared to healthy populations, using risk ratios (WMD) and corresponding 95% confidence interval (CI) estimates.
Results: Twenty-three cohort studies involving 3550 IBD patients and 1010 healthy people were finally included in this meta-analysis. The results of the meta-analysis showed that peripheral serum NLR and PLR were significantly higher in IBD patients than in the healthy population NLR [WMD=1.57,95%CI(1.14,2.01),P<0.001], PLR [WMD=60.66,95%CI(51.68,69.64),P<0.001]; NLR in active versus remission stage of IBD, PLR, LMR had significant differences NLR [WMD=1.50,95%CI(1.23,1.78),P<0.001], PLR [WMD=69.02,95%CI(39.66,98.39,P<0.001], LMR [WMD=-1.14,95%CI(-1.43,-0.86,P<0.001]; IBD active period and remission period NLR, PLR and LMR had significant differences. 0.001]; there were significant differences in NLR and PLR between moderate and severe IBD NLR [WMD=-1.41,95%CI(-2.13,-0.69),P<0.001], PLR [WMD=-112.03,95%CI(-143.87,-80.19),P<0.001]; the diagnostic accuracy of markers in predicting the clinical activity of IBD was relatively good. The diagnostic accuracy of markers in predicting IBD clinical activity was more favorable AUC [ES=0.72,95%CI(0.69,0.75),P<0.001].
Conclusion: In patients with IBD, elevated NLR and PLR are associated with increased disease activity and severity in UC and CD. Conversely, an elevated LMR is linked to reduced disease activity in IBD. Based on diagnostic accuracy results, inflammatory markers NLR and PLR serve as effective biomarkers for assessing IBD activity, thereby providing valuable insights for treatment decisions in IBD patients. However, LMR may not be a reliable independent marker due to conflicting or non-significant results. We anticipate that further high-quality prospective studies will validate our findings in the future.
Systematic review registration: https://www.crd.york.ac.uk/PROSPERO/, identifier CRD42024608118.
1 Introduction
IBD is a chronic, nonspecific inflammatory condition of the gastrointestinal tract that includes both UC and CD. UC typically presents with continuous lesions that extend from the proximal colon to the rectum and are confined to the mucosal layer. In contrast, CD can affect any part of the gastrointestinal tract, with inflammation often involving the entire bowel wall and manifesting in a patchy, segmental pattern. Both diseases share primary clinical manifestations, including recurrent abdominal pain, diarrhea, abdominal masses, mucus and bloody stools, intestinal obstruction, perforation, and weight loss. These symptoms fluctuate between episodes of relapse and remission. The exact etiology of IBD remains unclear; however, it is likely influenced by a combination of genetic, immune, environmental, and microbial factors (1). In recent years, the global incidence of inflammatory bowel disease (IBD) has been rising, with a prevalence exceeding 0.3% in North America, Oceania, and much of Europe. Currently, more than 10 million people worldwide are affected by IBD, which places a significant burden on healthcare systems and the global economy (2, 3). Although most patients achieve long-term symptom control through medication, these treatments often fail to fully suppress intestinal inflammation and are associated with various complications that substantially impact patients’ quality of life. At present, no effective cure exists for the disease (4). Furthermore, IBD is the third most significant risk factor for colorectal cancer (CRC). Studies indicate that approximately 18% of CRC cases occur in patients with IBD who have had the disease for fewer than eight years (5). With the evolving treatment paradigm for inflammatory bowel disease (IBD), achieving symptom relief and endoscopic remission has become a key therapeutic goal, which is associated with improved patient prognosis. Endoscopic cross-sectional imaging offers an accurate assessment of current intestinal inflammation and is essential for diagnosing IBD, evaluating disease severity, monitoring treatment response, and predicting relapse. However, both endoscopy and histopathology are invasive procedures that necessitate repeated colonoscopies, pathology reviews, and imaging assessments. These interventions can be costly, time-consuming, and may be hindered by low patient compliance (6). In addition, approximately one-third of patients in remission from UC experience gastrointestinal symptoms, such as abdominal pain and diarrhea, due to visceral hypersensitivity, despite the absence of disease activity on endoscopy (7). Consequently, there is an urgent need to identify non-invasive and easily accessible biomarkers for monitoring disease severity and tailoring therapeutic interventions. While white blood cell count (WBC), C-reactive protein (CRP), erythrocyte sedimentation rate (ESR), and fecal calreticulin (FC) have been proposed as clinical markers for assessing disease severity, their accuracy remains limited (8). Among the currently available markers, C-reactive protein (CRP) and erythrocyte sedimentation rate (ESR) are the most commonly used; however, they may occasionally remain normal in the presence of active inflammation (9), and their sensitivity and specificity are limited. Studies have demonstrated that the sensitivity and specificity of laboratory markers used to assess UC range from 50% to 60%, thereby limiting their clinical utility (10). In contrast, other markers, such as fecal calprotectin and lactoferrin, exhibit higher sensitivity and specificity. A meta-analysis conducted by Rokkas et al (11) reported that fecal calprotectin reflected a sensitivity of 82.4% and a specificity of 72.1% in relation to endoscopic activity in CD, with an area under the ROC curve of 0.84. Despite these promising results, fecal calprotectin has not yet achieved widespread availability due to the technical demands of the assay and its associated high costs. This situation underscores the necessity for a simpler, more user-friendly, effective, and cost-efficient biomarker capable of differentiating between quiescent and active disease states in inflammatory bowel disease (IBD), assessing mucosal recovery, predicting disease recurrence, and evaluating treatment response. They are useful in assessing the severity of many chronic diseases such as COPD (12)、hepatic encopresis (13)、rheumatoid arthritis (14)、glomerulonephritis (15) and many inflammatory disorders. Torun et al (16) observed that in patients with active ulcerative colitis (UC), elevated neutrophil-to-lymphocyte ratio (NLR) was correlated with leukocyte counts and erythrocyte sedimentation rate (ESR). Additionally, in patients with active UC, the NLR decreased significantly following the resolution of intestinal inflammation. Although numerous studies have demonstrated the potential value of peripheral blood NLR, platelet-to-lymphocyte ratio (PLR), and lymphocyte-to-monocyte ratio (LMR) in assessing the severity and progression of inflammatory bowel disease (IBD), their clinical utility remains controversial due to variations in demographic characteristics, study design, and sample size. In Cherfane’s retrospective case-control study (17), NLR effectively differentiated between active UC and controls, but not between active and inactive UC. Therefore, we conducted this meta-analysis to summarize the available evidence and explore the clinical value of peripheral serum inflammatory markers—NLR, PLR, and LMR—in patients with IBD.
2 Materials and methods
The protocol has been registered in the International Prospective Register of Systematic Reviews data base (PROSPERO: CRD42024608118).
2.1 Literature search strategy
Two researchers (TSF, YXQ) independently searched using Pubmed, Embase, Web Of Science, and Cochrane databases. Mesh words in PubMed were used to broaden the search, and search terms included “UC”, “ulcerative colitis”, “CD”, “Crohn’s disease”, “IBD”, “Inflammatory Bowel Disease”, “Neutrophil to lymphocyte ratio”, “NLR”, “Platelet to lymphocyte ratio”, “PLR”, “Lymphocyte to monocyte ratio”, “LMR”. The search formula is: ((((((ulcerative colitis) OR (Crohn’s disease)) OR (Inflammatory Bowel Disease)) OR (UC)) OR (CD)) OR (IBD)) AND ((((((Neutrophil to lymphocyte ratio) OR (Platelet to lymphocyte ratio)) OR (Lymphocyte to monocyte ratio)) OR (NLR)) OR (PLR)) OR (LMR)). The search strategy did not restrict language or study type, and the search time frame was from 2000 to October 2024. Two researchers screened the articles based on the title, abstract, and inclusion/exclusion criteria. The two researchers performed the extraction and review of data on basic information of relevant literature, study objectives, outcomes and follow-up, and in case of disagreement, the data were judged by third-party experts. Systematic evaluation was performed according to the Preferred Reporting Items for Systematic Evaluation and Meta-Analysis (PRISMA) guidelines (18).
2.2 Inclusion and exclusion criteria
Inclusion criteria were as follows:
1. Clinically confirmed diagnosis of inflammatory bowel disease (ulcerative colitis, Crohn’s disease).
2. Studies reporting the expression of inflammatory markers NLR, PLR, and LMR in different periods of IBD using risk ratios (WMD) and 95% confidence intervals (CI).
3. Grouping according to exposure into exposed group (high expression of inflammatory markers) and non-exposed group (low expression of inflammatory markers).
4. Literature in both Chinese and English.
5. Endpoint indicators were expression of markers in IBD patients versus healthy population, expression in active versus remission disease, expression in moderate versus severe disease, and diagnostic accuracy AUC.
6. Included study designs were randomized controlled trials, observational studies, cross-sectional studies, retrospective studies or prospective studies.
The exclusion criteria were as follows:
1. Disease study type or intervention approach not met.
2. Information on outcome indicators was not available.
3. Endpoint indicators could not be extracted.
4. Duplicate publications or incomplete information.
5. Non-comparative studies, animal experiments, reviews, letters, guidelines, case reports, pathomechanisms, conference abstracts, expert opinions, editorials, commentaries.
6. Literature in other languages.
2.3 Data extraction
Two researchers independently screened the literature according to the inclusion and exclusion criteria, information was independently extracted using a standardized data extraction form, cross-checked individually by the two researchers, and disagreements were resolved through discussion. Studies were excluded if relevant data were not available. For each study, the following information was collected: (1) study characteristics: first author, country, year of publication, type of study, type of IBD, type of predictor, duration of disease, cut-off value, diagnostic criteria; (2) patient baseline: number of patients, age, gender; (3) study outcomes: expression of markers in IBD patients versus healthy populations, and expression of markers in active versus remission phases of disease, expression of moderate versus severe disease, and diagnostic accuracy AUC.
2.4 Literature quality assessment
The quality of the included cohort studies was independently assessed using the Newcastle-OttawaScale (NOS), which consists of three metrics: cohort selection, comparability, and outcome assessment. The modified NOS is a 9-point scale, with low quality studies scoring 1-3, moderate quality 4-6, and high quality 7-9. Scoring was done independently by two investigators, and third-party experts were consulted to resolve any large differences between their scores or if this affected the study’s inclusion in the final analysis.
2.5 Statistic analysis
StataSE16.0 software was used for statistical analysis to calculate the combined WMD and 95% confidence intervals (95% CI), and P<0.05 showed a significant difference between the two groups. Heterogeneity was evaluated using I² values,I²≤30%,30%<I²<75% and ≥75% were considered to indicate low, medium and high heterogeneity, respectively.I²<50% was analyzed using a fixed-effects model, while I²≥50% was analyzed using a random-effects model. Sensitivity analyses were performed for outcomes with high heterogeneity, excluding a study in the merger one by one, evaluating the combined effect values and changes in heterogeneity in the remaining literature, and analyzing the sources of heterogeneity, and assessing whether there was publication bias using Begg’s funnel plot and Egger’s test, with P > 0.05 indicating that there was no publication bias.
3 Results
3.1 Literature search results
In the initial literature search, a total of 3156 articles were searched. 325 duplicate studies were excluded; After reading the title and abstract of the article, 2776 studies were excluded according to the inclusion criteria, and 55 studies were initially included. We then read the full text and excluded 32 studies that did not meet the inclusion criteria. Finally, 23 studies were included in the meta-analysis. The literature screening process and results are shown in Figure 1:
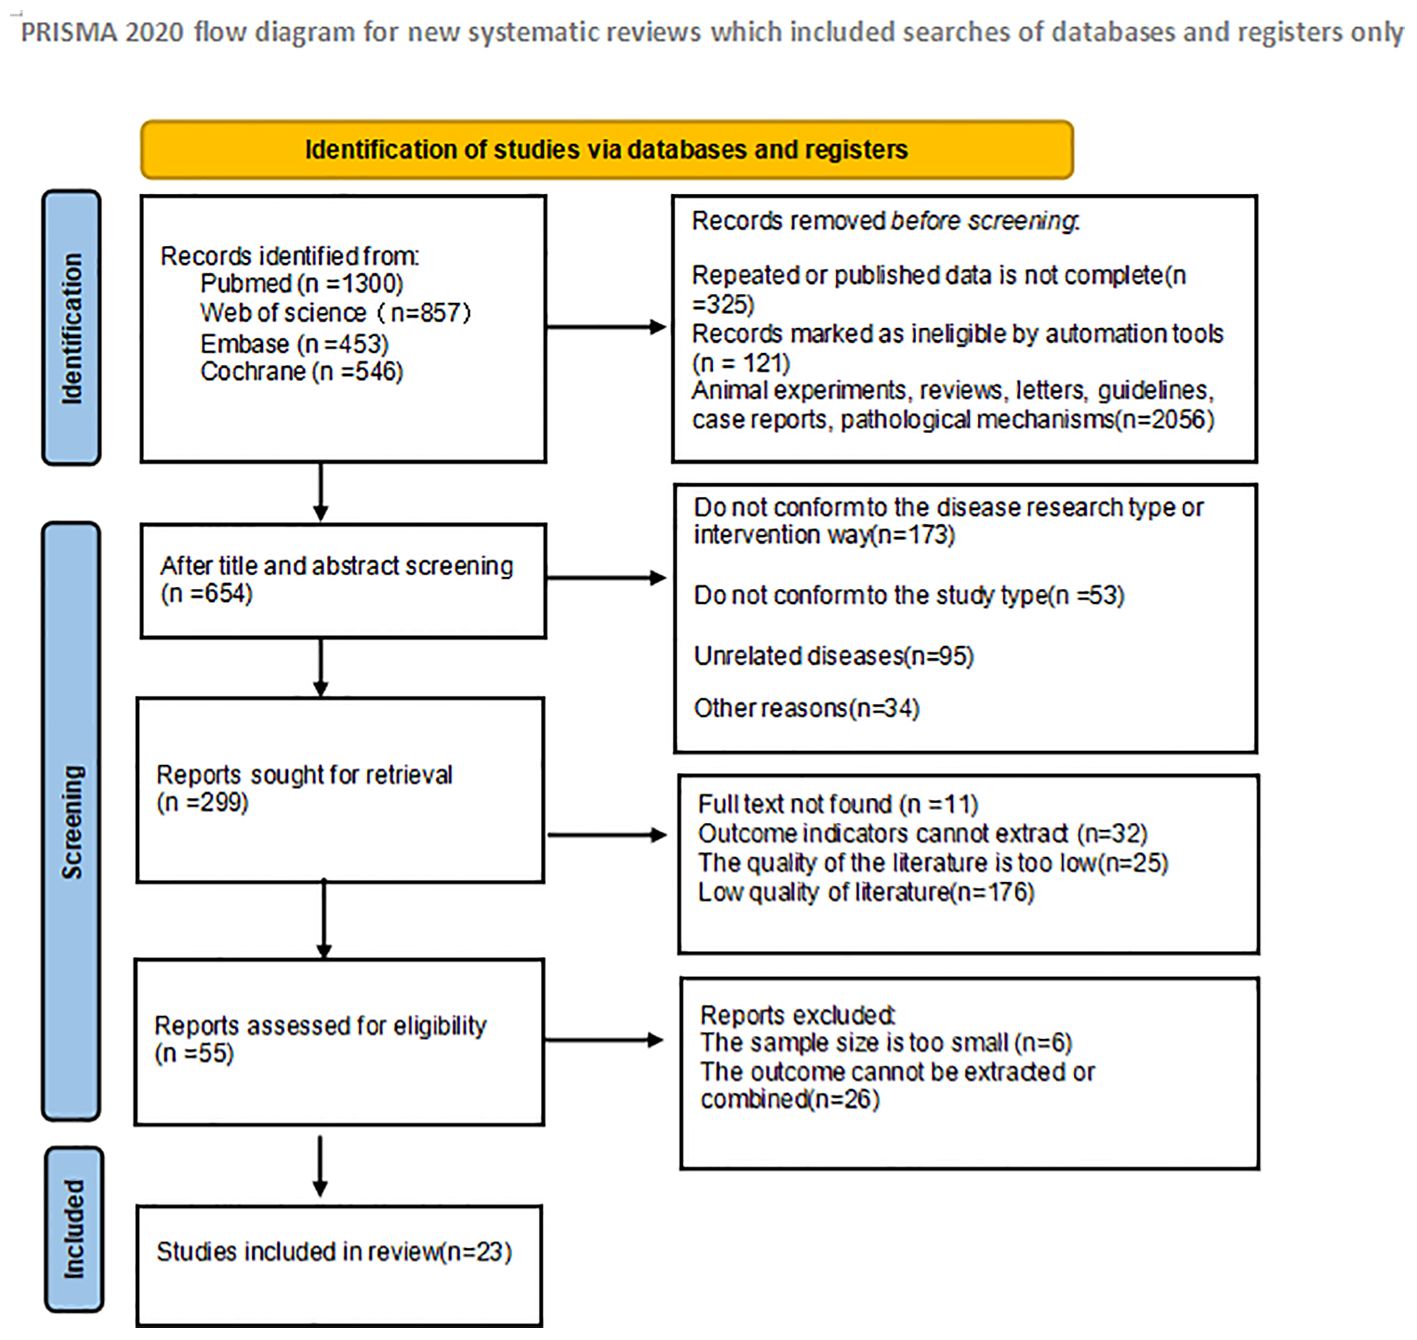
Figure 1. Schematic diagram of literature search criteria and including studies in meta-analyses.
3.2 Basic characteristics of the included studies
As shown in Table 1, among the 23 studies included, 3550 patients with IBD and 1010 healthy people were involved. All 23 studies were cohort studies, including 18 retrospective cohort studies and 5 prospective cohort studies. Multiple inflammatory markers were studied in one study in the included literature, so we numbered different inflammatory markers in the same literature. Study characteristics, patient baseline, and study results of the included studies are shown in Table 1.
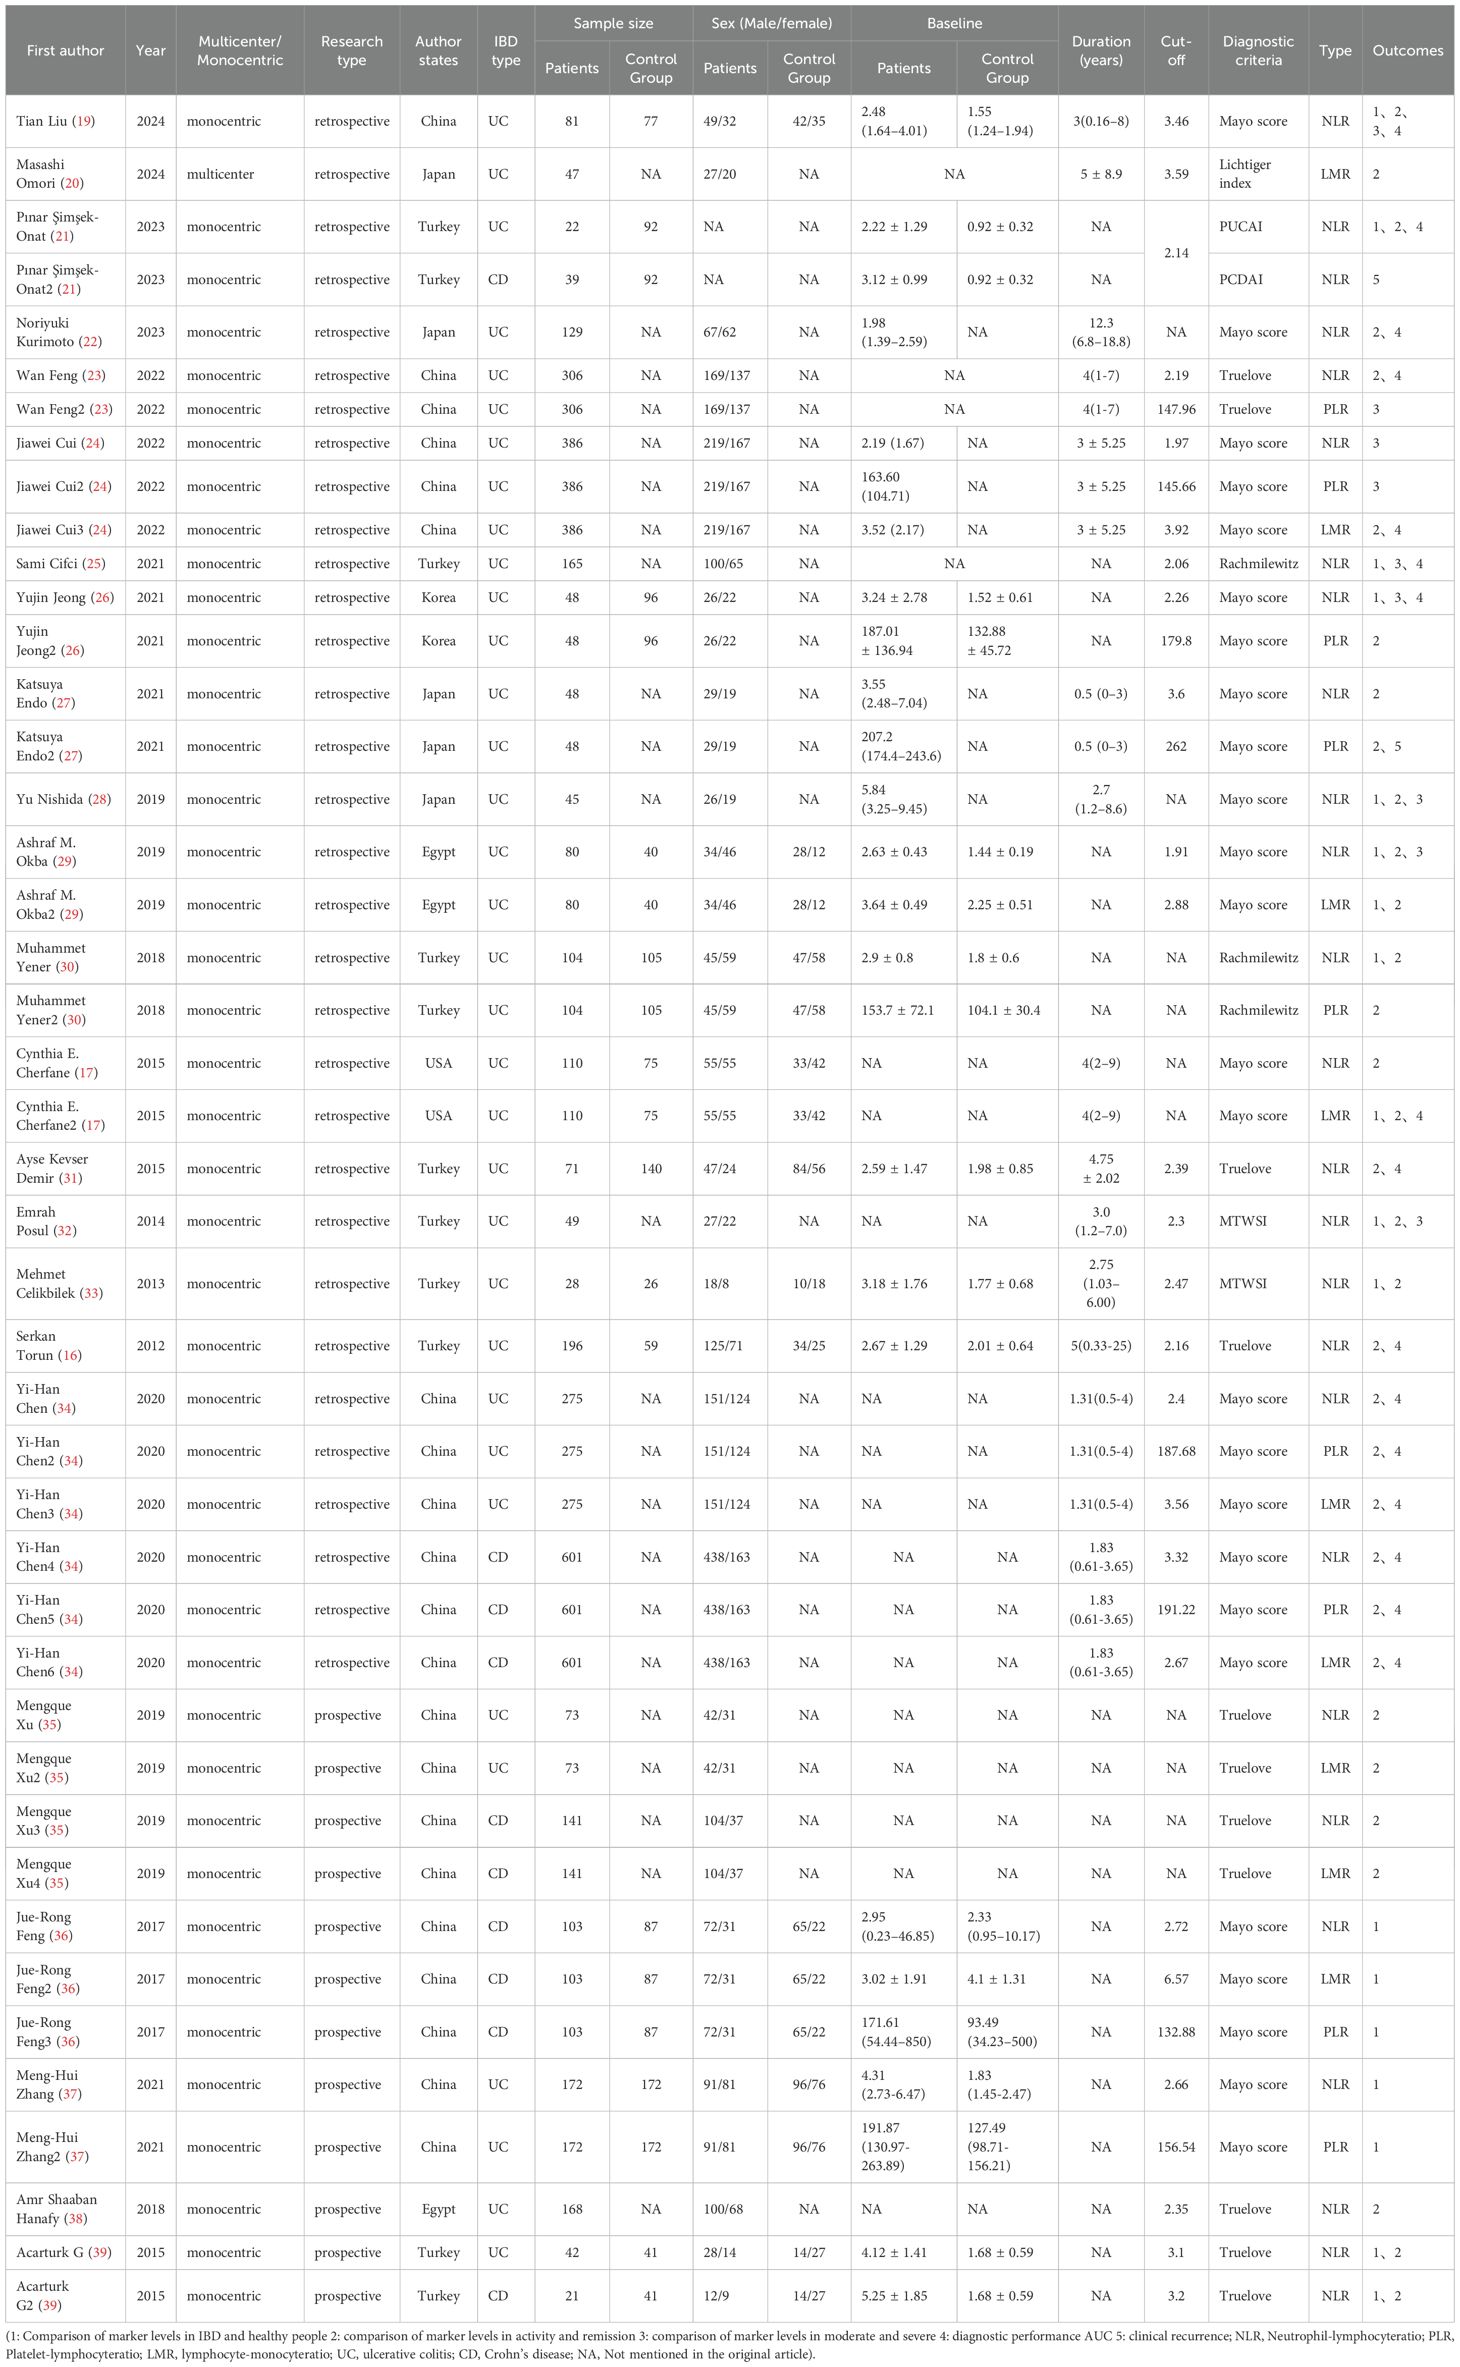
Table 1. Clinical and demographic characteristics of studies included in the meta-analysis.
3.3 The quality assessment of the included studies
The quality of the included cohort studies was evaluate during the Newcastle-OttawaScale(NOS) for quality and the overall quality was rate dasgood, with the results shown in Table 2.
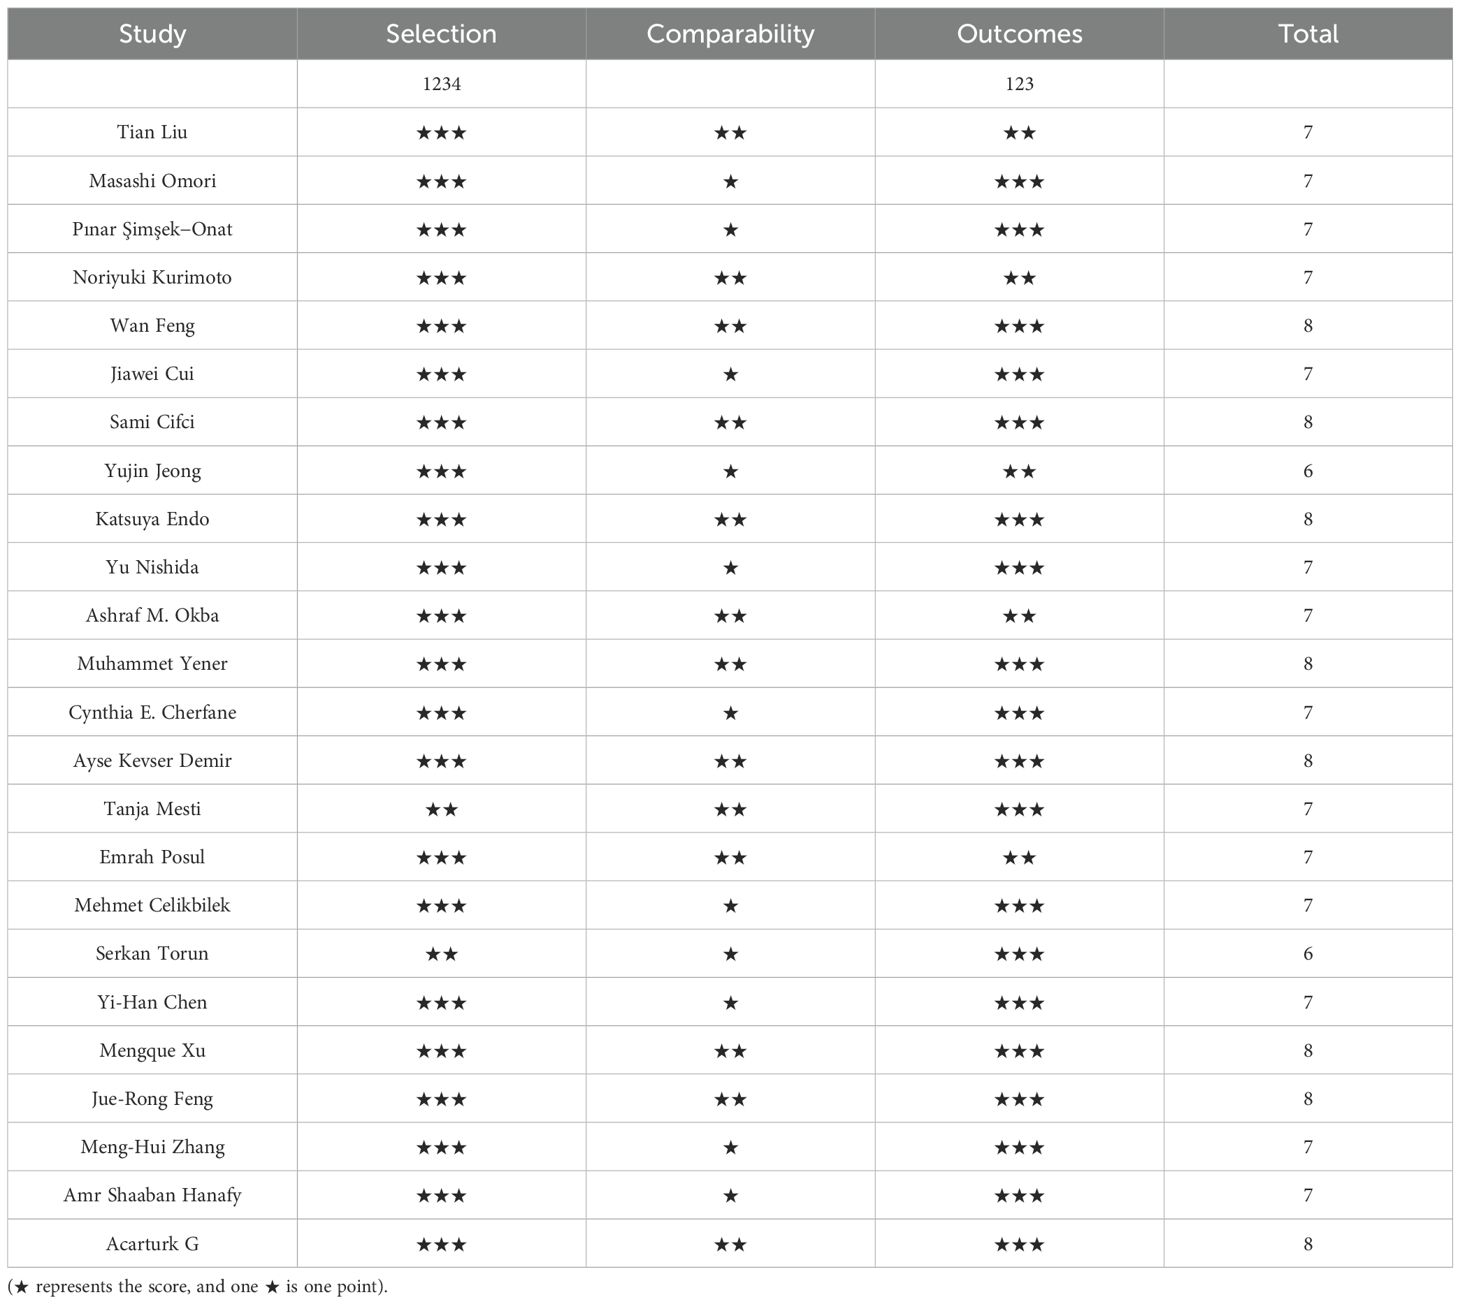
Table 2. NOS quality evaluation table.
3.4 Meta-analysis results
3.4.1 IBD and NLR levels in healthy people
IBD and NLR levels in healthy people were reported in 11 studies. Figure 2 shows the risk-ratio forest plots identified in 11 studies. Considering the large heterogeneity between studies (P < 0.001,I²=97%), a random effects model was used for meta-analysis. Analysis results showed that high levels of NLR were significantly expressed in both UC and CD patients: UC[WMD=1.37,95%CI(0.91,1.84),P < 0.001], CD[WMD=2.44,95%CI(1.22,3.67),P < 0.001]. Considering the existence of large heterogeneity, sensitivity analysis was performed. When each study was excluded in turn, there was no substantial change in the aggregated WMD (Figure 3). Therefore, subgroup analysis and regression analysis were conducted to explore the sources of heterogeneity (Tables 3, 4).
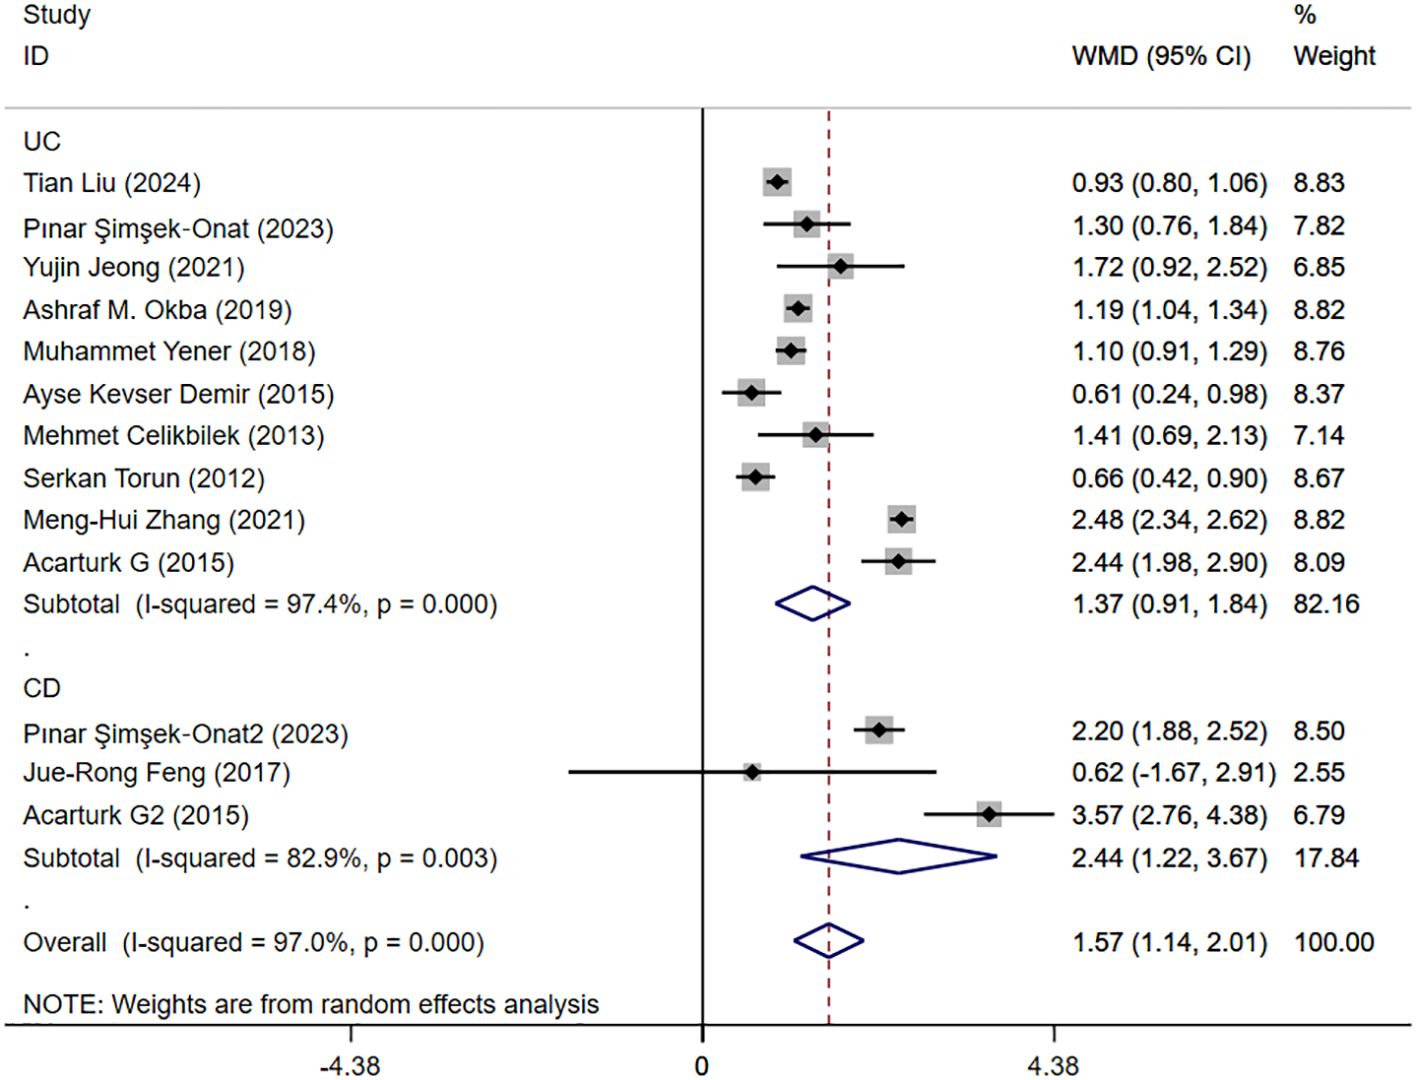
Figure 2. The study’s forest maps evaluated NLR levels in IBD patients versus healthy people (CD, Crohn’s disease; UC, ulcerative colitis; WMD, standard mean difference).
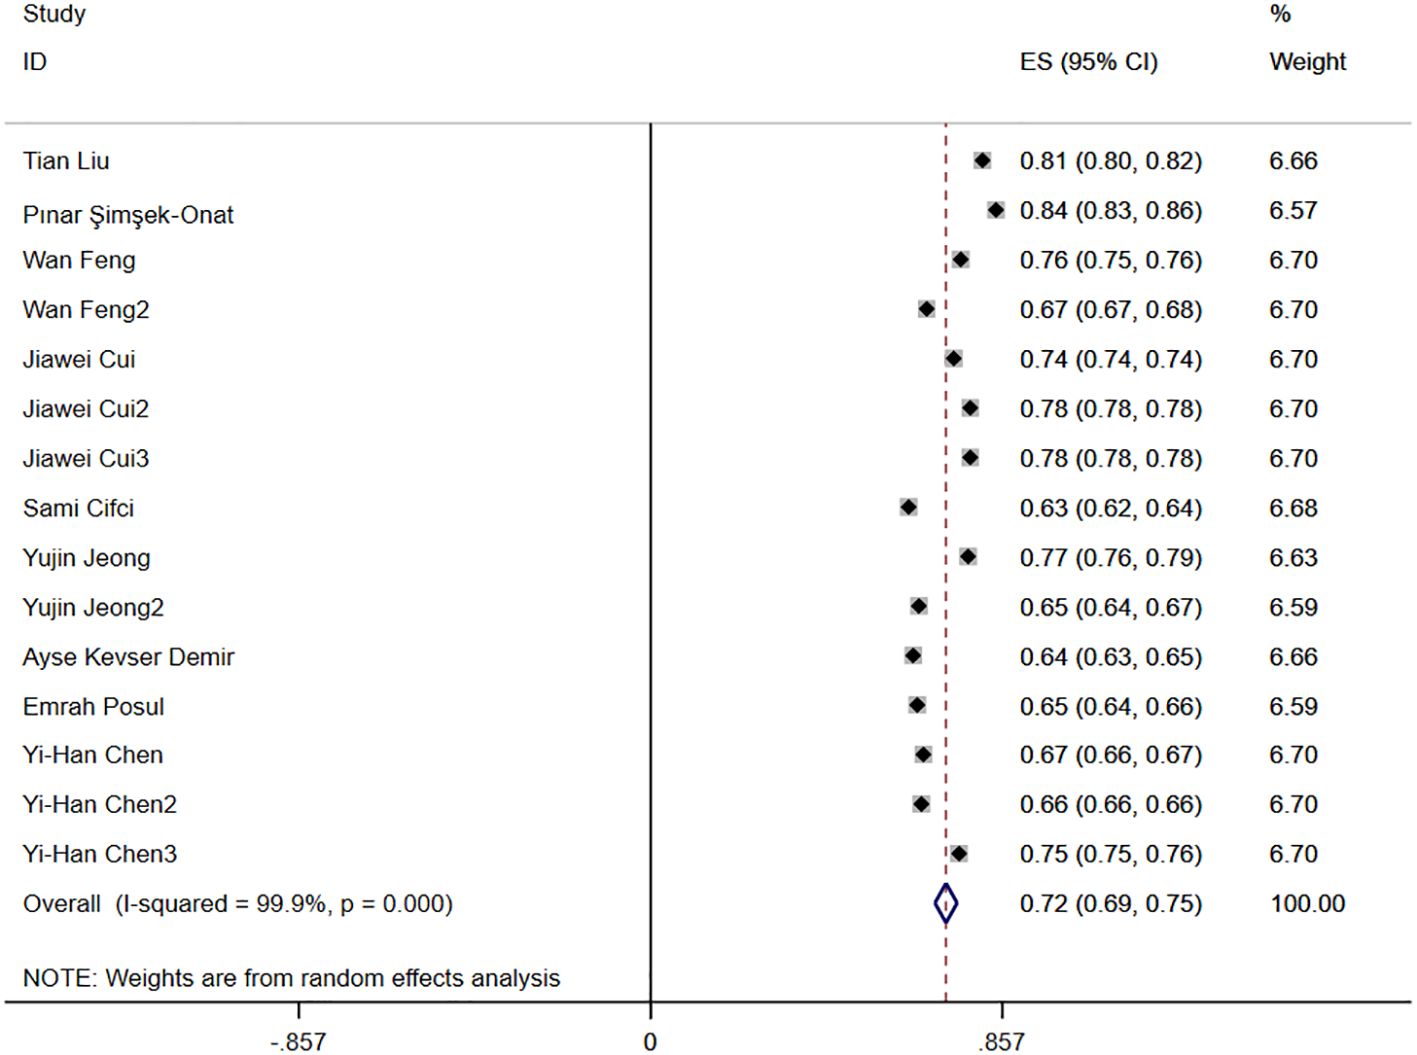
Figure 3. Merged AUC forest map.
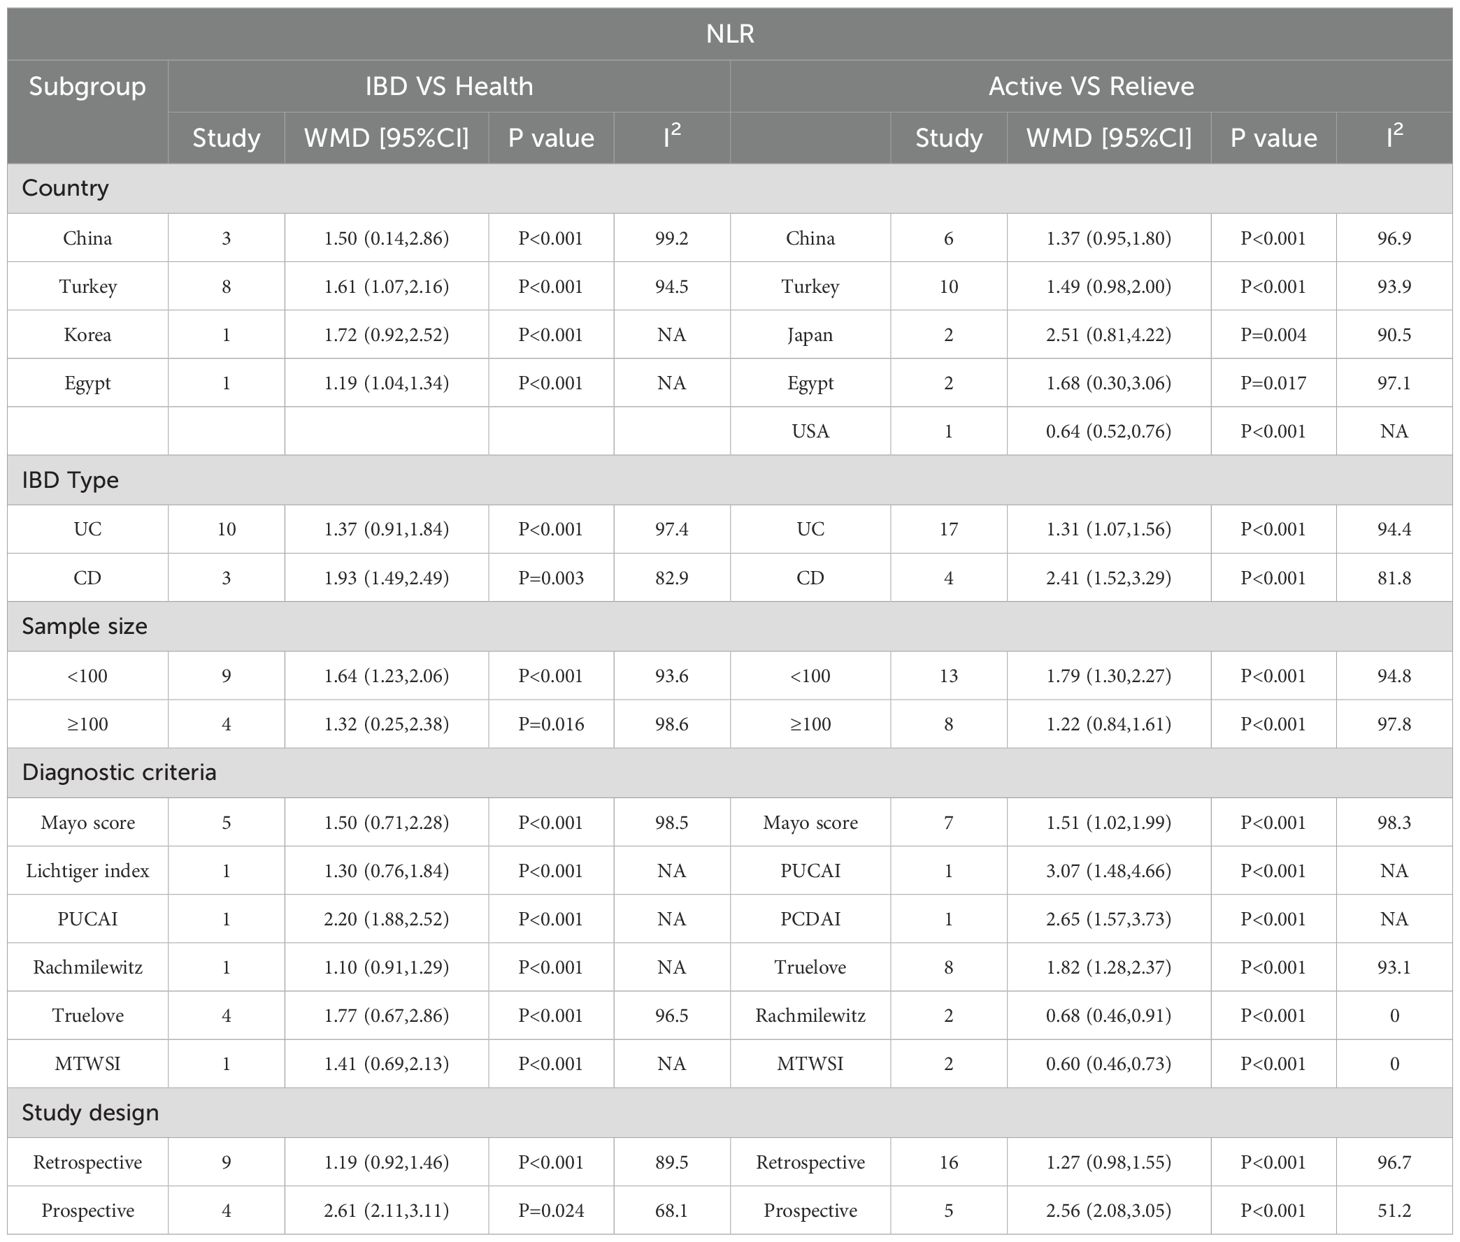
Table 3. NLR merges for subgroup analysis.
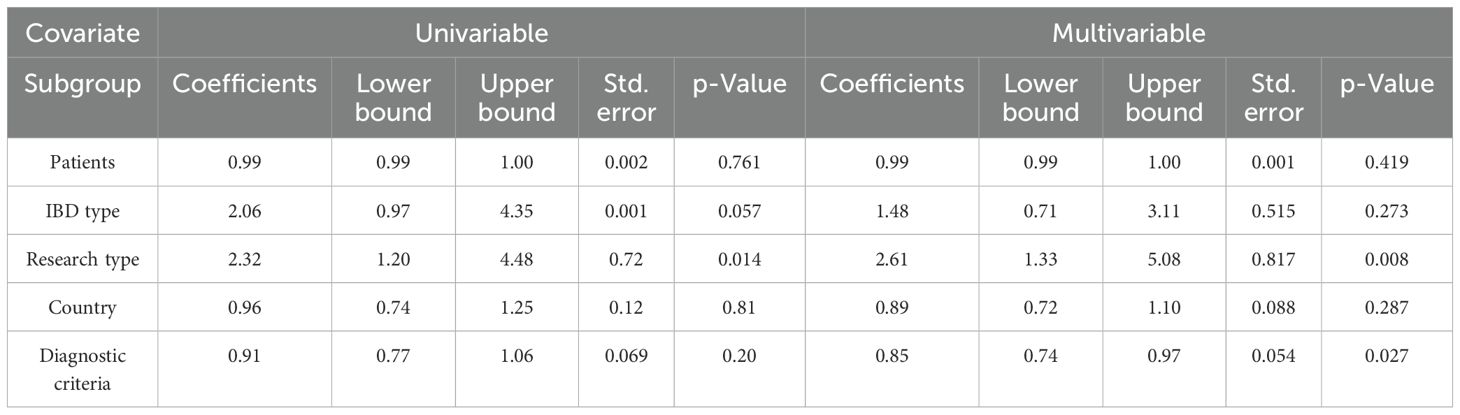
Table 4. Meta-regression analysis.
3.4.2 Activity and remission NLR levels in patients with IBD
Seventeen studies reported activity and remission NLR levels in patients with IBD. Figure 4 shows the risk-ratio forest plots identified in 17 studies. Considering the large heterogeneity between studies (P < 0.01,I²=96.5%), a random effects model was used for meta-analysis. Analysis results showed that serum NLR levels in active IBD patients were significantly higher than those in remission: UC[WMD=1.31,95%CI(1.07,1.56),P < 0.001], CD[WMD=2.41,95%CI(1.52,3.29),P < 0.001]. Considering the existence of large heterogeneity, sensitivity analysis was performed. When each study was excluded in turn, there was no substantial change in the aggregated WMD (Figure 5). Therefore, subgroup analysis and regression analysis were conducted to explore the sources of heterogeneity (Tables 3, 4).
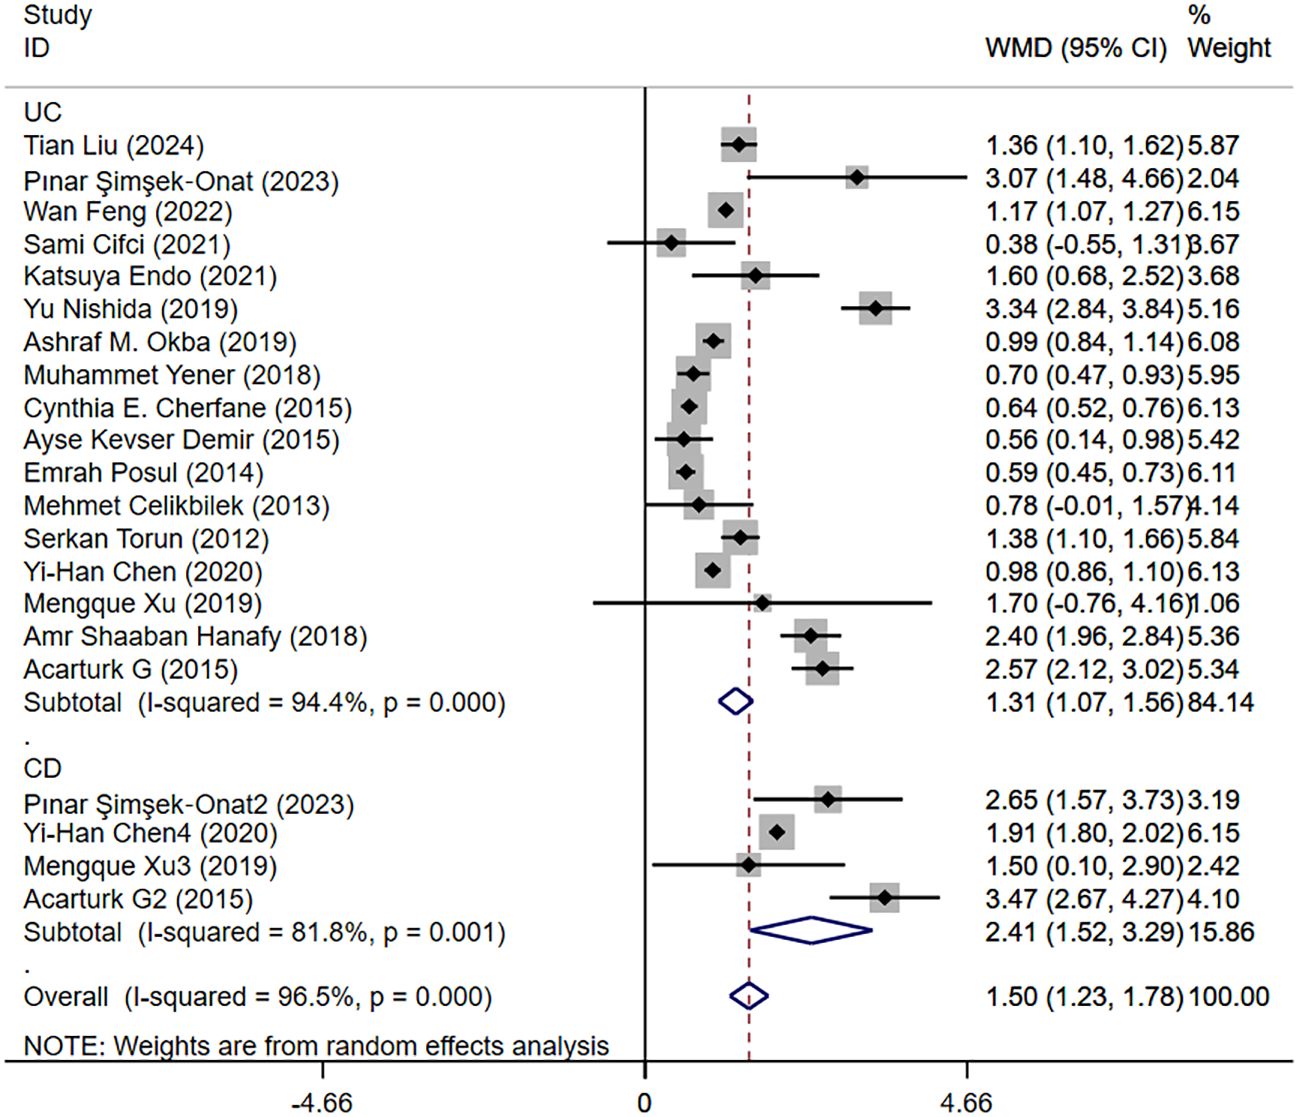
Figure 4. The study’s forest map assessed activity and remission NLR levels in patients with IBD (CD, Crohn’s disease; UC, ulcerative colitis; WMD, standard mean difference).
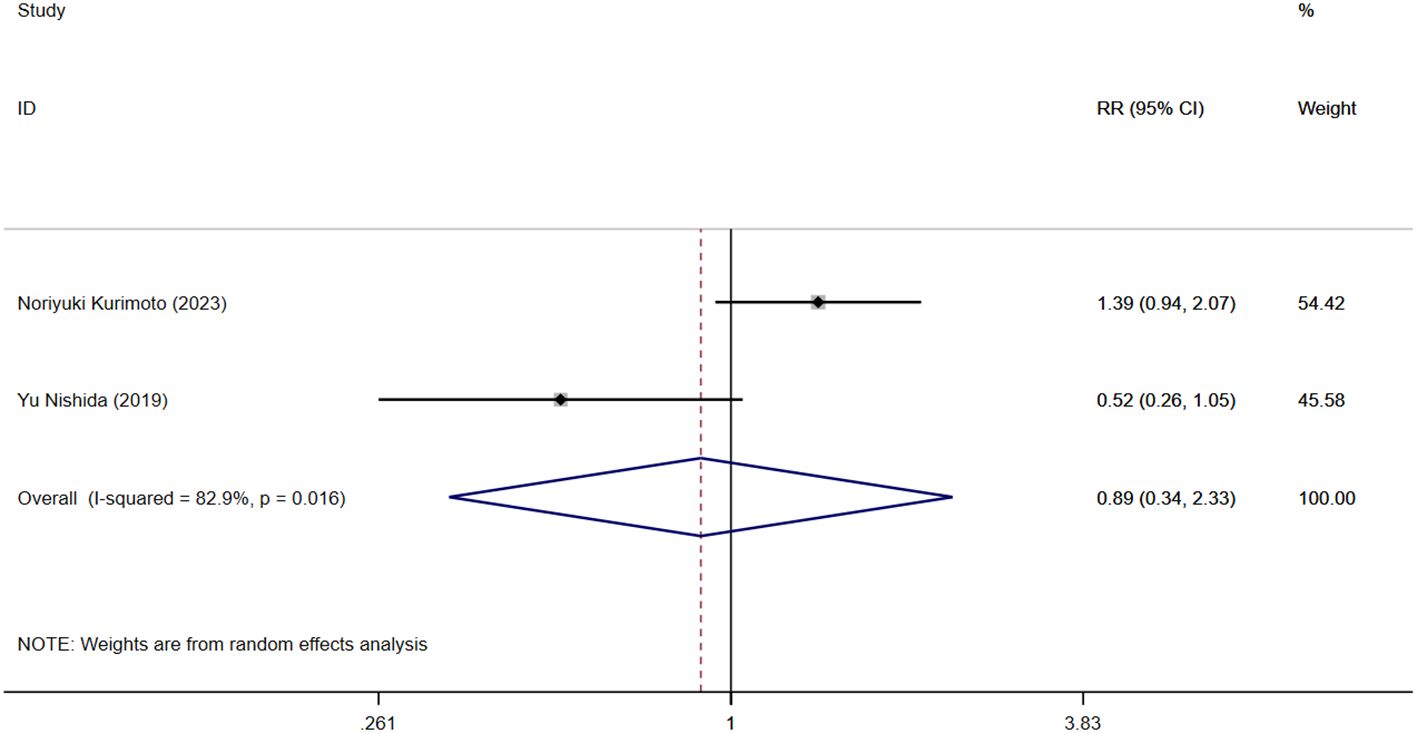
Figure 5. Forest map of NLR levels against recurrence rates.
3.4.3 Moderate and severe NLR levels in patients with IBD
Five studies reported moderate and severe NLR levels in patients with IBD. Figure 6 shows the risk-ratio forest plots identified in the five studies. Considering the large heterogeneity between the studies (P < 0.001,I²=91.8%), a random effects model was used for meta-analysis. Analysis results showed that the severity of UC patients was positively correlated with the level of NLR: [WMD=-1.41,95%CI(-2.13,-0.69), P < 0.001].
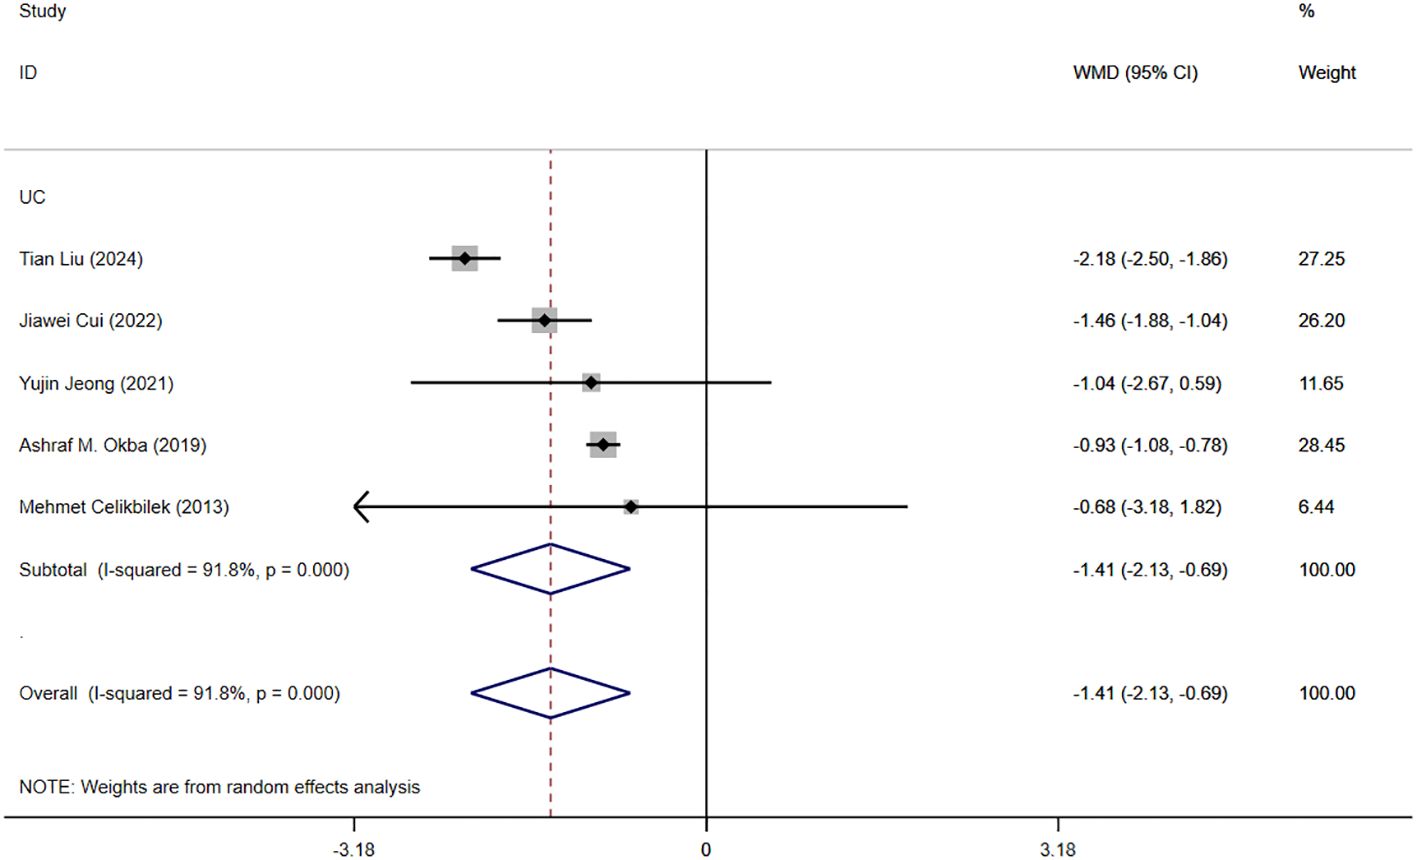
Figure 6. The study’s forest map assessed severe and moderate NLR levels in patients with IBD (CD, Crohn’s disease; UC, ulcerative colitis; WMD, standard mean difference).
3.4.4 PLR levels in IBD patients
Eight studies reported PLR levels in patients with IBD, and Figure 7 shows the risk-ratio forest plots identified in the eight studies, using a random effects model for meta-analysis. The results showed that there were significant differences in serum PLR between IBD patients and healthy people [WMD=60.66,95%CI(51.68,69.64),P < 0.001]. The serum PLR level of IBD patients in active stage was significantly higher than that in remission stage [WMD=69.02,95%CI(39.66,98.39),P < 0.001]. The severity of IBD was positively correlated with PLR level [WMD=-112.03,95%CI(-143.87,-80.19), P < 0.001].
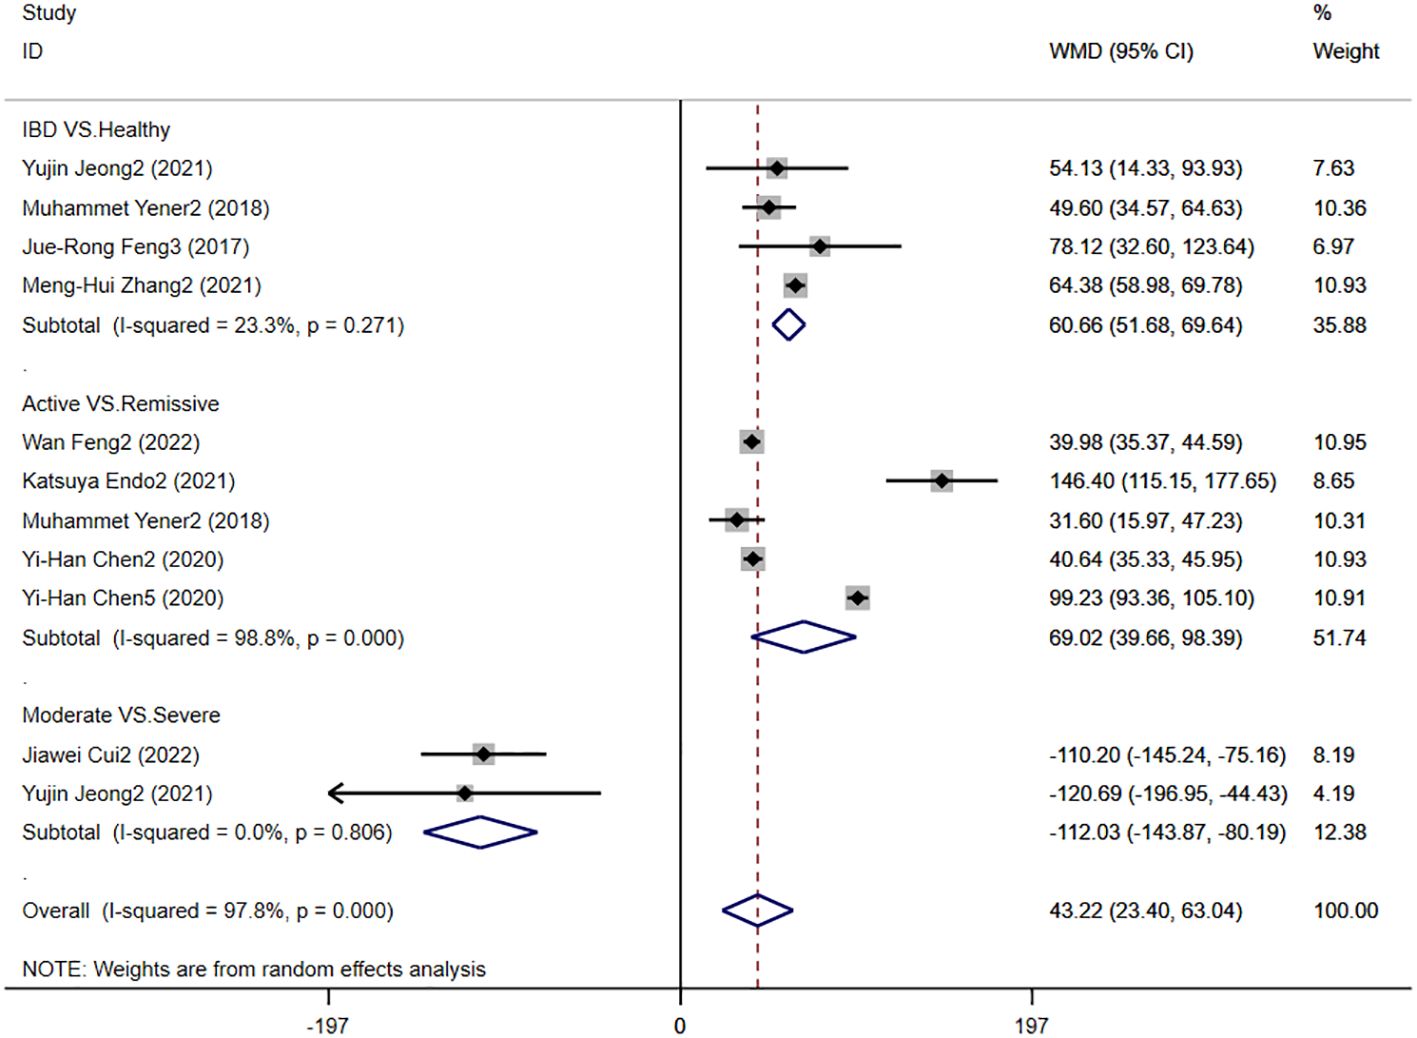
Figure 7. The study’s forest map assessed PLR levels in patients with IBD (CD, Crohn’s disease; UC, ulcerative colitis; WMD, standard mean difference).
3.4.5 LMR levels in patients with IBD
Six studies reported LMR levels in patients with IBD, and Figure 8 shows the hazard ratio forest plot determined in the six studies, using a random effects model for meta-analysis. The results showed that there was no significant difference in serum LMR between IBD patients and healthy people [WMD=0.16,95%CI(-2.26,69.2.58), P < 0.001]. The serum LMR level of IBD patients in active stage was significantly lower than that in remission stage [WMD=-1.14,95%CI(-1.43,-0.86),P < 0.001]. There was no significant difference between LMR level and disease severity in IBD patients [WMD=1.22,95%CI(-0.64,3.07), P < 0.001].
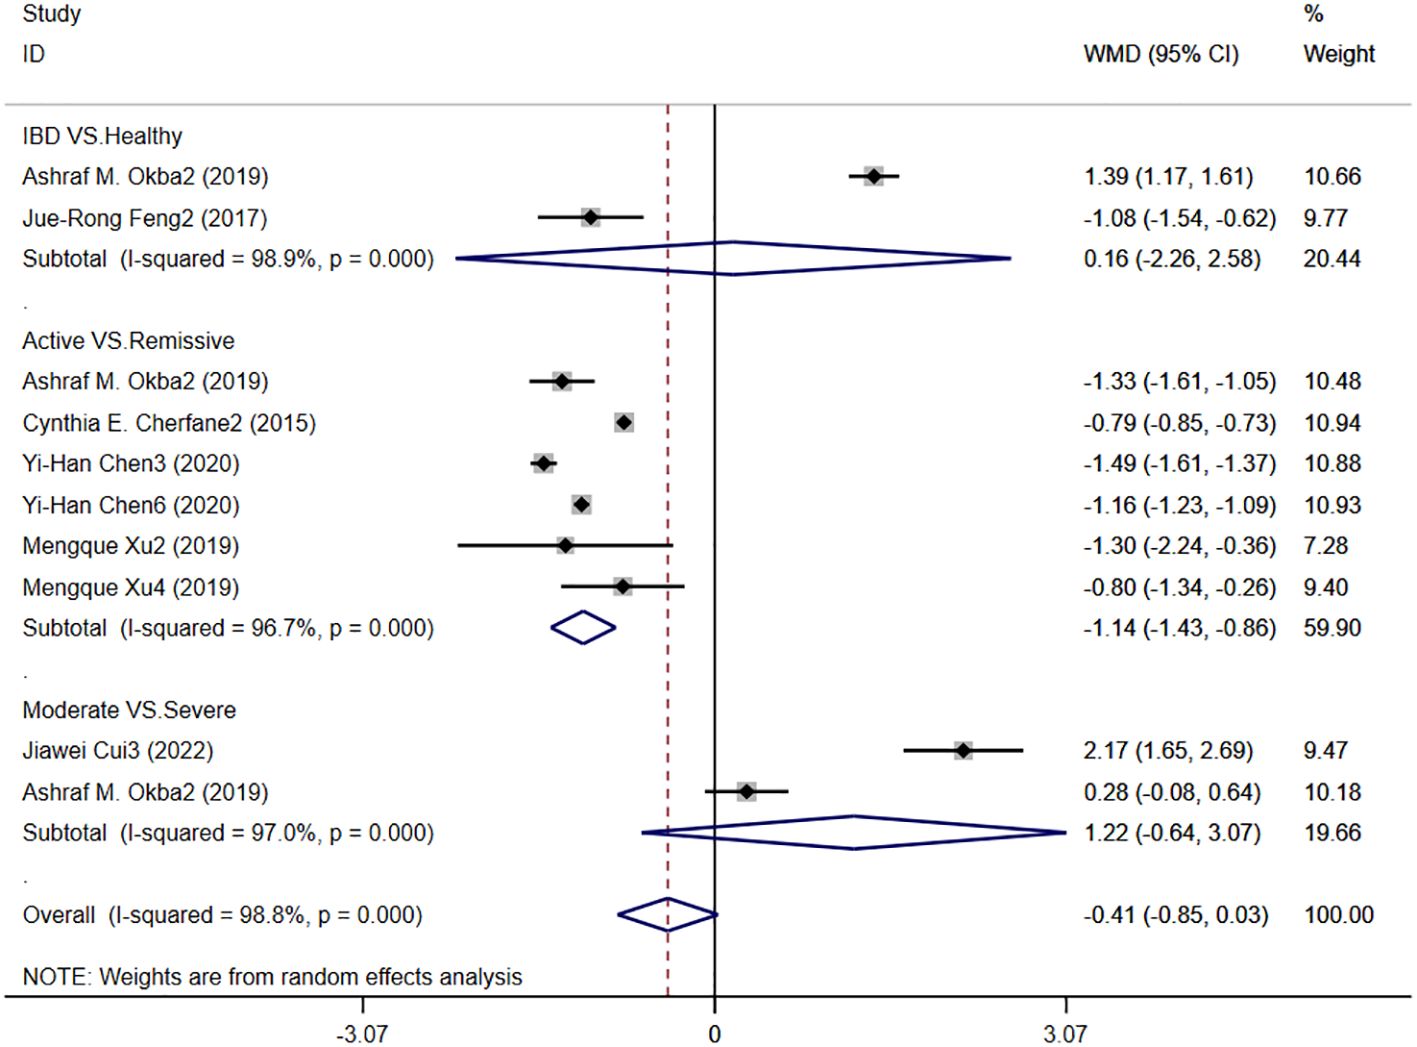
Figure 8. The study’s forest map assessed LMR levels in patients with IBD (CD, Crohn’s disease; UC, ulcerative colitis; WMD, standard mean difference).
3.4.6 AUC
Nine studies reported the diagnostic accuracy of NLR, and Figure 3 shows the hazard ratio forest plots determined in the nine studies, using a random effects model for meta-analysis. Analysis results showed that NLR had good accuracy in diagnosing IBD [ES=0.72,95%CI(0.69,0.75), P < 0.001].
3.4.7 Clinical recurrence
Two studies reported that NLR levels were associated with clinical recurrence of IBD. Figure 5 shows the risk-ratio forest plots determined by the two studies. Meta-analysis was conducted using a random effects model. The results showed that high level of NLR and low level of NLR had no statistical significance on IBD recurrence rate [RR=0.892,95%CI(0.342,2.327), P = 0.815].
3.5 Sensitive analysis
Figure 9 shows the sensitivity analysis of NLR levels in IBD patients and healthy people. When each study was excluded in turn, the aggregated WMD did not change substantially, and the model was robust and reliable. Figure 10 shows the sensitivity analysis of IBD patients’ activity and NLR levels in remission. When each study was excluded in turn, the aggregated WMD did not change substantially, indicating that the model was robust and reliable.
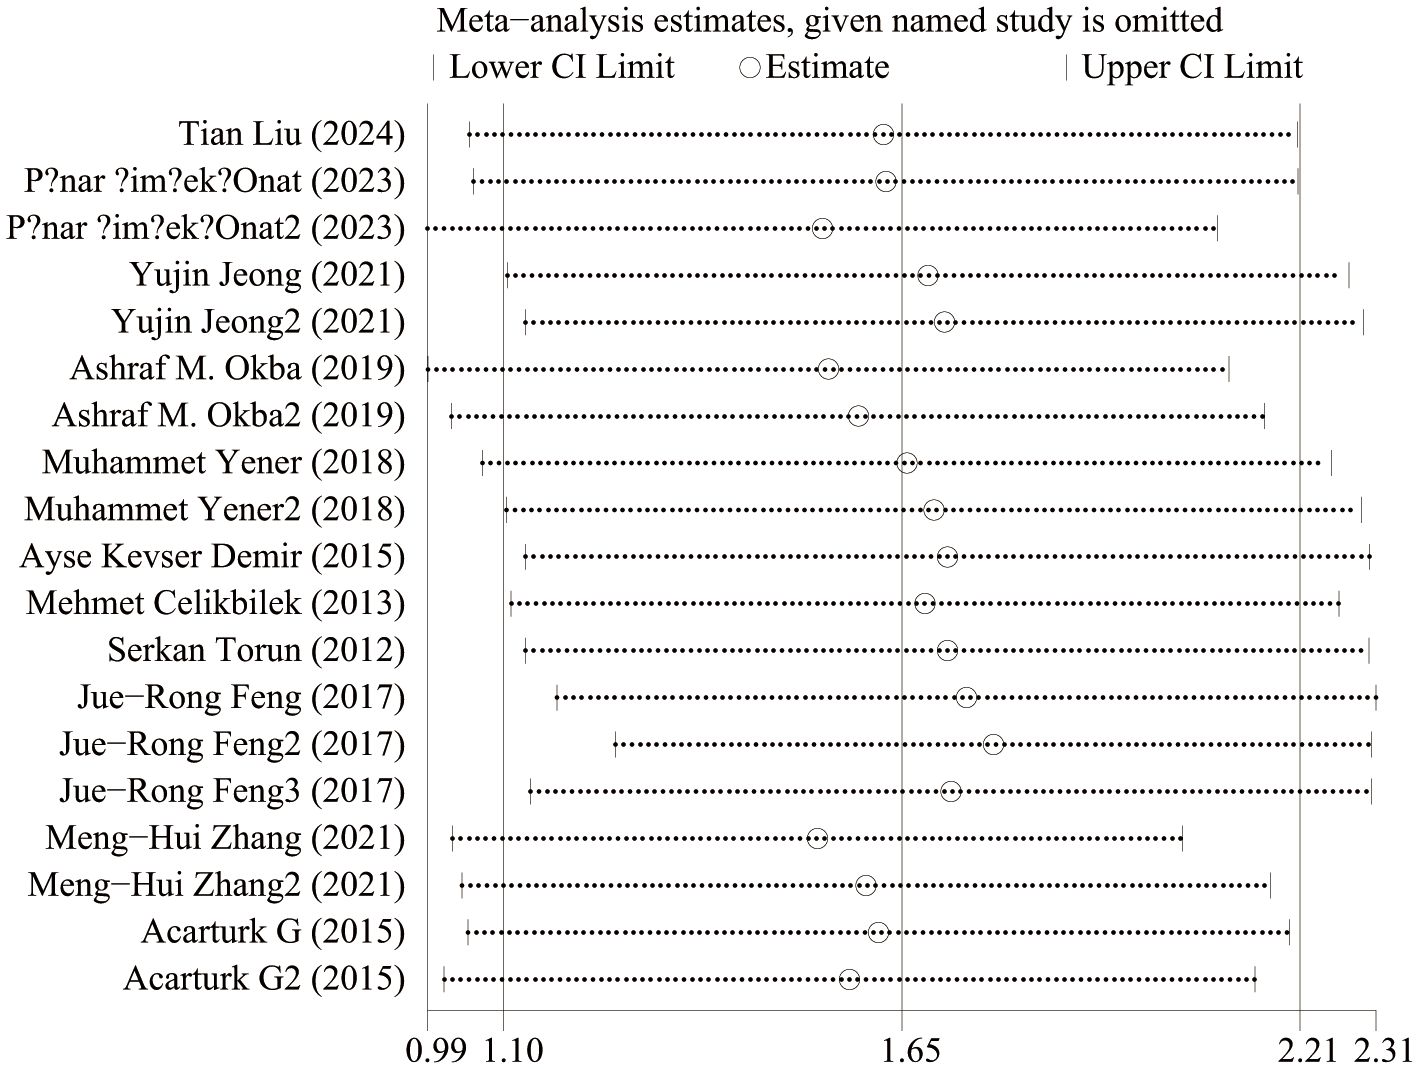
Figure 9. Sensitivity analysis of NLR levels in IBD patients and healthy people.
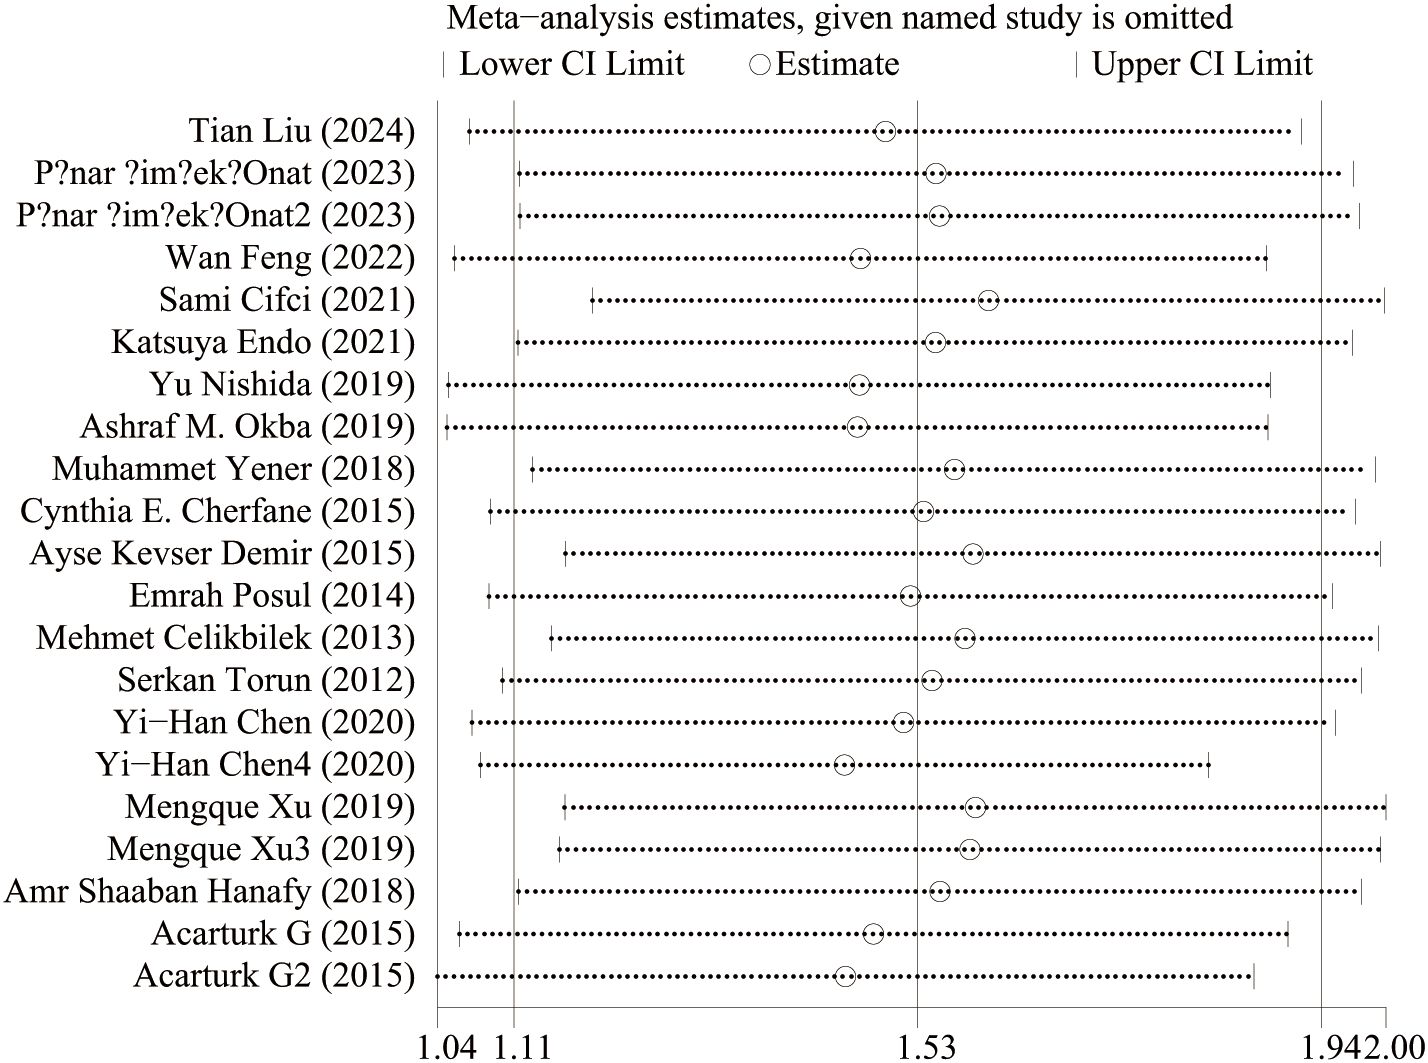
Figure 10. Sensitivity analysis of activity and remission NLR levels in IBD patients.
3.6 Publication bias
A funnel plot was drawn to evaluate publication bias between the NLR level of IBD patients and healthy people and between the NLR level of IBD patients’ activity and remission period. The results showed that the NLR level of IBD patients and healthy people (Figure 11) Egger’s P=0.749 and Begg’s P=0.246, indicating no significant publication bias. There was no significant asymmetry in the shape of the funnel plot, and all studies were within 95%CI range. The activity level of IBD patients and the NLR level in remission (Figure 12) Egger’s P=0.254, Begg’s P=0.174 indicate no significant publication bias (P > 0.05). There was no significant asymmetry in the shape of the funnel plot, and all studies were within 95%CI range.

Figure 11. Funnel plot for the evaluation of publication bias for NLR levels in IBD patients and healthy people.
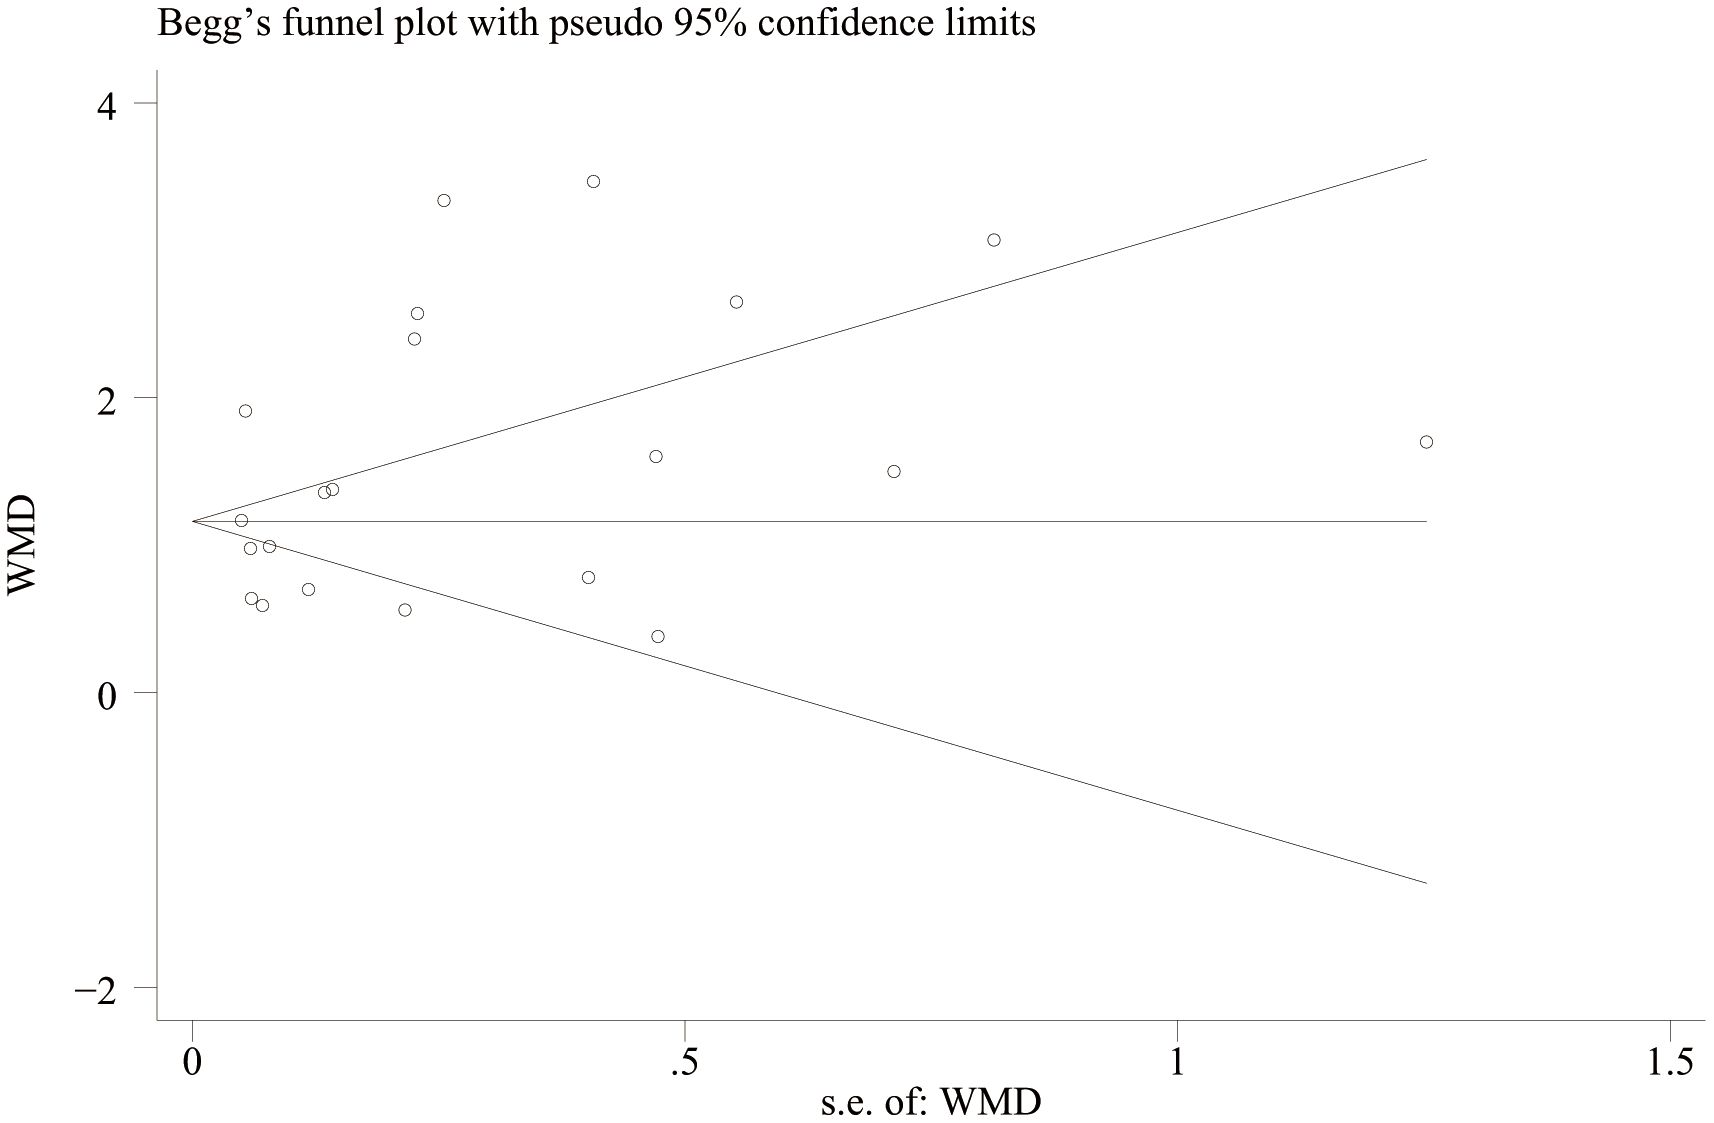
Figure 12. Funnel plot for the evaluation of publication bias for activity and remission NLR levels in IBD patients.
3.7 Subgroup analysis
To determine the source of heterogeneity, we performed a subgroup analysis. The results showed that high NLR was an important prognostic factor for the onset and progression of IBD, regardless of country, sample size, IBD type, study type, and diagnostic criteria. The subgroup analysis results were shown in Table 3.
3.8 Meta regression
We conducted a meta-regression analysis of IBD activity and NLR level in remission. Table 4 shows univariate and multivariate meta-regression results. Univariate regression analysis results show that IBD patients, IBD type, study region and diagnostic criteria have no influence on patients’ NLR level. The results of multivariate analysis showed that the difference of study type and diagnostic criteria may be the source of heterogeneity (P < 0.05).
4 Discussion
Inflammatory bowel disease encompassing UC and CD, is a chronic inflammatory condition affecting the colorectal region, characterized by alternating periods of activity and remission. The assessment of disease activity and the prediction of treatment outcomes have become essential components of personalized management for patients with UC. Evaluating the activity of UC and CD involves a combination of clinical signs, laboratory indices, endoscopy, and histopathology. Currently, disease surveillance methods predominantly rely on colonoscopy, which is invasive, uncomfortable, time-consuming, and costly. This reliance may hinder patient compliance, and colonoscopy has been ranked as the least acceptable disease surveillance test among patients with CD (40, 41). Simple, non-invasive biomarkers are essential for mitigating the risks associated with invasive diagnostic procedures. Biomarkers previously studied for predicting inflammatory bowel disease (IBD) activity include serum markers such as C-reactive protein (CRP) and erythrocyte sedimentation rate (ESR), as well as fecal markers like calprotectin and lactoferrin. While CRP and ESR demonstrate high sensitivity in detecting IBD activity, their specificity is relatively low; these markers can be elevated not only due to IBD but also as a result of other extraintestinal inflammatory processes. Furthermore, genetic variability among individuals contributes to differences in CRP production, complicating accurate differentiation (42). The ESR is utilized less frequently than CRP due to its slower response to fluctuations in disease activity (43). Levels of the fecal marker calprotectin are proportional to neutrophil migration through the inflamed intestinal wall into the mucosa, and studies have demonstrated a correlation between calprotectin levels and endoscopic activity in patients with CD (44). Levels of fecal markers may be influenced by gut microbiota, as microbial diversity and quantity can affect marker expression and detection. Their routine use is further limited by high costs, lengthy sample processing times, and the challenges associated with fecal sample collection, which render them accessible to only a small proportion of patients with CD. Increasing evidence suggests that the pathology of IBD largely involves the progression of immunological lesions characterized by significant cellular infiltration, primarily by neutrophils, lymphocytes, macrophages, and plasma cells. Various systemic inflammatory markers, including the NLR, PLR, and LMR, derived from complete blood counts, have been reported as diagnostic and predictive indicators for IBD. While these markers are less costly and more easily accessible, their accuracy remains controversial. In response to this issue, we conducted a meta-analysis to evaluate the predictive value of peripheral blood inflammatory markers (NLR, PLR, and LMR) for IBD activity. The results showed that the level of NLR was significantly expressed in both UC and CD patients compared with the healthy population: (1) Compared with healthy individuals, the NLR levels of IBD patients were significantly elevated. The serum NLR level of IBD patients during the active phase was significantly higher than that during the remission phase. (2) The severity of IBD patients was positively correlated with the NLR and PLR levels. (3) There were no significant differences in serum LMR and LMR levels between IBD patients and healthy individuals, but the serum LMR level during the active phase of IBD patients was significantly lower than that during the remission phase. Finally, our study structure showed that NLR had better accuracy in diagnosing IBD AUC[ES=0.72,95%CI(0.69,0.75),P < 0.001].To address the high heterogeneity observed in the analyses, we conducted subgroup analyses and univariate/multivariate meta-regression analyses, which indicated that differences in study type and diagnostic criteria may contribute to this variability. The final results indicate that peripheral serum biomarkers such as the NLR and the PLR can serve as effective markers for predicting the activity of IBD. However, LMR levels did not demonstrate statistically significant differences between IBD patients and healthy individuals, nor among varying severities of IBD. Furthermore, LMR levels were significantly lower during the active phase of IBD compared to the remission phase, which introduces uncertainty and controversy regarding the predictive capability of LMR given these conflicting and non-significant results. These discrepancies may arise from limitations in the number of available studies; specifically, six studies reported differences in LMR levels between active and remission phases in IBD patients, while only two studies addressed the remaining two results. This limitation may have affected the outcomes of data pooling. We hope that future high-quality studies will further explore LMR levels at different stages of IBD, and we will continue to monitor research developments in this field.
The NLR was first identified as a marker of systemic inflammation in 2001 and has since been extensively studied in both malignant and non-malignant diseases (45). The NLR combines neutrophil and lymphocyte counts to provide a comprehensive view of the body’s immune-inflammatory status. Neutrophils are the first immune cells recruited to sites of inflammation, serving as the primary defense against pathogenic microorganisms and playing a crucial role in the innate immune system. In mucosal colon biopsies, the presence of neutrophils is associated with an increased risk of IBD recurrence and a poorer prognosis. Neutrophils are recruited from the circulatory system to areas of intestinal inflammation, where they eliminate pathogens by promoting inflammation through direct phagocytosis or by releasing NETs. These mechanisms contribute to mucosal healing and the resolution of inflammation (46, 47). Excessive neutrophil extracellular traps (NETs) can secrete inflammatory cytokines such as IL-1β and TNF-α, which amplify the inflammatory cascade and significantly contribute to the dysregulation of the immune-inflammatory response in the intestinal mucosa of patients with UC. Angelidou et al. (48) demonstrated that the activation of the REDD1/autophagy/NETs/IL-1β signaling pathway, which produces IL-1β, plays a crucial role in mediating intestinal inflammation and mucosal damage in UC. Furthermore, patients with IBD exhibit elevated levels of TNF-α, IL-1β, IL-16, and interferon-γ (IFN-γ) compared to healthy individuals (49, 50). When neutrophils (NEUs) are exposed to antigens, specific antigens bind to the ‘Fcγ receptor I/specific immunoglobulin G complex’ formed on the surface of sensitized NEUs. This binding stimulates the release of pro-inflammatory cytokines, such as TNF-α, which activates the protein kinase and NF-κB pathways. Ultimately, this activation leads to cellular differentiation, proliferation, and an increased production of pro-inflammatory cytokines, contributing to mucosal barrier defects in patients with UC (51, 52). The primary pathways for IL-1β production include the neutrophil serine protease pathway and the inflammasome-dependent caspase-1 pathway. In UC, IL-1β is produced both in the bloodstream and locally within the inflamed intestinal tract, contributing to tissue damage and inflammation (53). Conversely, neutrophils become “over-activated” in this pathological state. The increased expression of the anti-apoptotic protein A1 delays or reduces neutrophil apoptosis, significantly prolonging their lifespan and enhancing their activation. This over-activation results in the release of protein particles and reactive oxygen species, which disrupt the integrity of tight and adherens junctions, leading to dysfunction of the intestinal epithelial barrier. Such dysfunction further exacerbates tissue damage and results in typical UC mucosal manifestations, including cryptitis, mucosal erosion, and ulcer formation (54, 55). In addition, neutrophils upregulate pro-inflammatory chemokines, such as C-X-C motif chemokine ligand (CXCL) 1 (CXCL1), CXCL3, and CXCL8, which perpetuate the inflammatory cycle in colitis (56). CD inflammation can affect the entire intestinal tract, with the distal ileum being the most commonly involved site. Elevated levels of TNF-α, IL-1β, and IL-6 are also observed in patients with CD (57). TNF-α enhances the immune response of Th17 cells and promotes the secretion of cytokines such as interferon-γ (IFN-γ), while IL-6 facilitates the differentiation of Th17 cells, further mediating the destructive inflammatory response (58). The inflammatory response in Crohn’s disease (CD) is primarily sustained by the migration of Th17 lymphocytes and regulatory T (Treg) cells to the site of inflammation, mediated through interactions with integrins, such as α4β7 integrin, and other adhesion molecules, including leukocyte MacCAM-1 (59). Lymphocytes are crucial for antimicrobial defense and also play significant roles in organ development, tissue protection, regeneration, and mucosal homeostasis. Although these cells are components of the adaptive immune system, they originate from the same lymphoid progenitor cell population as other lymphocytes (60). Furthermore, lymphocytes are instrumental in the early phases of the immune response and in maintaining intestinal mucosal homeostasis by rapidly responding to cytokines and other signals produced by surrounding cells (61). Studies on Crohn’s disease and ulcerative colitis have identified lymphocyte dysfunction and abnormalities at both peripheral and mucosal levels, primarily characterized by a diminished response to mitogenic phytohemagglutinin and a tendency towards reduced absolute lymphocyte counts (31). The low lymphocyte counts observed in patients with active ulcerative colitis may stem from various factors, including mucosal lymphocyte infiltration, autoimmune-related apoptosis, malnutrition, and colonic bleeding or leakage. Platelets, which are essential for coagulation, are among the first cells recruited to the vascular endothelium at infection sites during both acute and chronic inflammation. They facilitate the recruitment of inflammatory cells by adhering to the endothelium or subendothelial space, regulating cell adhesion and extravasation, and activating monocytes, neutrophils, and endothelial cells. Furthermore, platelets synthesize and release substantial amounts of pro-inflammatory cytokines and chemokines (28, 62). During acute inflammation, cytokines such as IL-6 stimulate platelet differentiation, resulting in the release of activated platelets that contribute to both inflammation and thrombosis (30). Inflammatory mediators are released following intestinal microthrombosis in patients with IBD. Elevated platelet counts and activated platelets can trigger a series of inflammatory responses by increasing vascular permeability and promoting leukocyte migration, which exacerbates ischemia in the intestinal mucosa and may lead to irreversible intestinal damage (27). Additionally, platelets contain IL-8, which induces neutrophil aggregation and the release of superoxide; this process is mediated by adhesion molecules, resulting in platelet-neutrophil aggregation (30). Maugeri (63) found that platelets activate neutrophils through the release of HMGB1-containing platelet microparticles, which promotes the formation of an extracellular trapping network of neutrophils. Furthermore, monocytes can differentiate into macrophages and dendritic cells within tissues. In patients with active inflammatory bowel disease (IBD), elevated platelet counts result partly from an intestinal inflammatory response that promotes platelet maturation in the bone marrow. Concurrently, inflammatory factors drive continuous platelet consumption, which further stimulates platelet production and raises peripheral blood platelet counts. During inflammation, pro-inflammatory cytokines and chemokines stimulate monocyte production in the bone marrow and recruit these cells to sites of inflammation, where they differentiate into tissue-resident macrophages and dendritic cells. Consequently, sustained monocyte activation and a defective innate immune response play crucial roles in the pathogenesis of IBD (64). A substantial body of research indicates that elevated neutrophil and platelet counts, along with reduced lymphocyte counts, reflect the intensity of immunoinflammation in UC. Notably, elevated neutrophil levels can be observed even during clinical remission, provided that other infectious factors affecting leukocyte subtypes are excluded. Crispino et al. (65) reported that the NLR can be utilized in clinical practice to predict the response to anti-TNF-α therapy in patients with CD. Additionally, a recent study found that NLR and PLR levels can predict mucosal healing and the outcomes of anti-TNF-α monotherapy in patients with UC. These findings suggest that these markers could enhance the management of IBD in clinical settings (66).
This study represents the first meta-analysis to evaluate the predictive value of peripheral serum biomarkers, specifically the NLR, PLR, LMR, for Inflammatory Bowel Disease (IBD). The literature search conducted was comprehensive, and the statistical analysis applied was rigorous. However, our study is limited by a high degree of heterogeneity in the results. To address this limitation, we employed subgroup analysis and regression analysis to identify the sources of heterogeneity. The findings suggest that variations in study types and diagnostic criteria may contribute to this heterogeneity. (1) There were discrepancies in the definitions and assessment criteria for IBD activity among the original studies included. Currently, various tools are utilized in both clinical practice and research to define disease activity, and a globally accepted gold standard does not exist. The studies incorporated in this meta-analysis utilized diverse scoring systems, including the Mayo score, Lichtiger index, Pediatric Ulcerative Colitis Activity Index (PUCAI), Pediatric Crohn’s Disease Activity Index (PCDAI), Truelove & Witts criteria, Rachmilewitz index, and the Modified Truelove & Witts Severity Index (MTWSI).The clinical, endoscopic, and laboratory indicators included in each scale vary, as do the weighting and scoring criteria for the same indicators (such as the frequency of bloody stools and endoscopic findings) across different scales. Furthermore, these scales exhibit inconsistent definitions of remission and severity. For instance, a patient classified as ‘moderately active’ by the Mayo score may be categorized as ‘mild’ or ‘severe’ when evaluated using the Lichtiger Index or Rachmilewitz Index. This ‘tool diversity’ in defining and assessing disease activity leads to substantial differences in the inclusion criteria for study populations. Despite the significant heterogeneity observed in the studies, we found that all 23 included studies demonstrated that the NLR and PLR during the active phase were higher than those during the remission phase, or that NLR and PLR in IBD patients were elevated compared to healthy individuals (as illustrated in Figures 2, 4, which show no cross-quadrant studies). This indicates that heterogeneity primarily affects the magnitude of the effect size rather than the direction of the conclusion. (2) The heterogeneity observed in this study may also be partially attributed to differences in the types of study designs included (prospective cohort studies versus retrospective cohort studies). Prospective studies, which adhere to predefined protocols, standardized data collection, and active follow-up, can more reliably assess baseline disease activity, control for confounding factors, and reduce bias. In contrast, retrospective studies rely on historical medical records and often encounter issues such as missing critical data, insufficient standardization, and incomplete follow-up, which directly impact the reliability and comparability of study results, thereby contributing to heterogeneity in meta-analyses.(3)There are notable differences in the cutoff values for NLR, PLR, and LMR across various regions. The observed range for NLR is between 1.91 and 3.6, while the range for PLR spans from 132.88 to 191.22. Studies employing lower cutoff values may categorize a greater proportion of patients into the ‘high exposure’ group, which could result in variations in the actual severity and composition of the ‘high NLR, PLR’ population across different studies. Furthermore, some studies did not specify their cutoff values. Given the limited number of studies and the fact that, although a few reported extreme values, most cutoff values were relatively concentrated within a specific range, we were unable to conduct subgroup analyses on cutoff values. Considering these factors, we anticipate that future high-quality prospective studies will further assess the predictive efficacy of NLR, PLR, and LMR for Inflammatory Bowel Disease (IBD), standardize diagnostic criteria, and narrow the range of cutoff values to mitigate bias.
5 Conclusion
In conclusion, we believe that NLR and PLR can be used as auxiliary indicators for clinical diagnosis of IBD and for assessing the activity of IBD. These indicators are simple to obtain, inexpensive, practical, have low operational difficulty, and have high patient compliance and clinical application value. Considering that LMR showed conflicting or insignificant results in several comparisons, LMR may not be a reliable independent marker. We still need more high-quality studies for further verification, which also provides a research direction for our subsequent studies.
Data availability statement
The original contributions presented in the study are included in the article/supplementary material. Further inquiries can be directed to the corresponding author.
Author contributions
ST: Supervision, Methodology, Validation, Writing – review & editing, Data curation, Conceptualization, Investigation, Software, Writing – original draft, Formal Analysis, Resources, Visualization, Project administration. XY: Software, Funding acquisition, Writing – review & editing, Methodology, Writing – original draft, Data curation. XM: Writing – review & editing, Methodology, Data curation, Writing – original draft. SL: Writing – original draft, Data curation, Writing – review & editing. YW: Writing – original draft, Writing – review & editing, Supervision. YL: Writing – review & editing, Supervision, Writing – original draft, Funding acquisition. YB: Writing – review & editing, Supervision, Writing – original draft. CX: Writing – review & editing, Methodology, Funding acquisition, Writing – original draft, Supervision, Conceptualization.
Funding
The author(s) declare that financial support was received for the research and/or publication of this article. Funding by Tianjin Key Medical Discipline(Specialty) Construction Project(NO : TJYXZDXK-044A). Funding by National Natural Science Foundation of China (NO:82104671).
Acknowledgments
We would like to thank the researchers and study participants for their contributions.
Conflict of interest
The authors declare that the research was conducted in the absence of any commercial or financial relationships that could be construed as a potential conflict of interest.
Correction note
30 July 2025 This article has been corrected with minor changes. These changes do not impact the scientific content of the article.
12 August 2025 A correction has been made to this article. Details can be found at: 10.3389/fimmu.2025.1676750.
Generative AI statement
The author(s) declare that no Generative AI was used in the creation of this manuscript.
Publisher’s note
All claims expressed in this article are solely those of the authors and do not necessarily represent those of their affiliated organizations, or those of the publisher, the editors and the reviewers. Any product that may be evaluated in this article, or claim that may be made by its manufacturer, is not guaranteed or endorsed by the publisher.
References
1. Agrawal M, Allin KH, Petralia F, Colombel JF, and Jess T. Multiomics to elucidate inflammatory bowel disease risk factors and pathways. Nat Rev Gastroenterol Hepatol. (2022) 19(6):399–409. doi: 10.1038/s41575-022-00593-y, PMID: 35301463
2. Larsen L, Karachalia Sandri A, Fallingborg J, Jacobsen BA, Jacobsen HA, Bøgsted M, et al. Has the incidence of inflammatory bowel disease peaked? Evidence from the population-based NorDIBD cohort 1978-2020. Am J Gastroenterol. (2023) 118:501–10. doi: 10.14309/ajg.0000000000002187, PMID: 36728238
3. Ng SC, Shi HY, Hamidi N, Underwood FE, Tang W, Benchimol EI, et al. Worldwide incidence and prevalence of inflammatory bowel disease in the 21st century: a systematic review of population-based studies. Lancet. (2018) 390:2769–78. doi: 10.1016/S0140-6736(17)32448-0, PMID: 29050646
4. Wang M, Shi J, Yu C, Zhang X, Xu G, Xu Z, et al. Emerging strategy towards mucosal healing in inflammatory bowel disease: what the future holds? Front Immunol. (2023) 14:1298186. doi: 10.3389/fimmu.2023.1298186, PMID: 38155971
5. Klepp P, Brackmann S, Cvancarova M, Hoivik ML, Hovde Ø, Henriksen M, et al. Risk of colorectal cancer in a population-based study 20 years after diagnosis of ulcerative colitis: results from the IBSEN study. BMJ Open Gastroenterol. (2020) 7:e000361. doi: 10.1136/bmjgast-2019-000361, PMID: 32337058
6. DeRoche TC, Xiao SY, and Liu X. Histological evaluation in ulcerative colitis. Gastroenterol Rep (Oxf). (2014) 2:178–92. doi: 10.1093/gastro/gou031, PMID: 24942757
7. Minderhoud IM, Oldenburg B, Wismeijer JA, van Berge Henegouwen GP, and Smout AJ. IBS-like symptoms in patients with inflammatory bowel disease in remission; relationships with quality of life and coping behavior. Dig Dis Sci. (2004) 49:469–74. doi: 10.1023/b:ddas.0000020506.84248.f9, PMID: 15139501
8. Ge C, Lu Y, Shen H, and Zhu L. Monitoring of intestinal inflammation and prediction of recurrence in ulcerative colitis. Scand J Gastroenterol. (2022) 57:513–24. doi: 10.1080/00365521.2021.2022193, PMID: 34994661
9. Takaki Y, Mizuochi T, Eda K, Ishihara J, and Yamashita Y. Laboratory values in Japanese children with newly diagnosed inflammatory bowel disease. Pediatr Int. (2019) 61:720–5. doi: 10.1111/ped.13892, PMID: 31102555
10. Lewis JD. The utility of biomarkers in the diagnosis and therapy of inflammatory bowel disease. Gastroenterology. (2011) 140:1817–26.e2. doi: 10.1053/j.gastro.2010.11.058, PMID: 21530748
11. Rokkas T, Portincasa P, and Koutroubakis IE. Fecal calprotectin in assess ing inflammatory bowel disease endoscopic activity: a diagnostic accu racy meta-analysis. J Gastrointestin Liver Dis. (2018) 27:299–306. doi: 10.15403/jgld.2014.1121.273.pti, PMID: 30240474
12. Cai C, Zeng W, Wang H, and Ren S. Neutrophil-to-lymphocyte ratio (NLR), platelet-to-lymphocyte ratio (PLR) and monocyte-to-lymphocyte ratio (MLR) as biomarkers in diagnosis evaluation of acute exacerbation of chronic obstructive pulmonary disease: A retrospective, observational study. Int J Chron Obstruct Pulmon Dis. (2024) 19:933–43. doi: 10.2147/COPD.S452444, PMID: 38646605
13. Kartal M, Aksungur N, Korkut E, Altundaş N, Kara S, and Öztürk G. Significance of the neutrophil-to-lymphocyte ratio, platelet-to-lymphocyte ratio, and preoperative nutritional index as predictors of morbidity in patients who underwent liver resection for alveolar echinococcosis. Cureus. (2023) 15:e44842. doi: 10.7759/cureus.44842, PMID: 37809135
14. Zhou E, Wu J, Zhou X, and Yin Y. The neutrophil-lymphocyte ratio predicts all-cause and cardiovascular mortality among U.S. adults with rheumatoid arthritis: results from NHANES 1999-2020. Front Immunol. (2023) 14:1309835. doi: 10.3389/fimmu.2023.1309835, PMID: 38045692
15. Toraman A, Neşe N, Özyurt BC, and Kürşat S. Association between neutrophil-lymphocyte & platelet lymphocyte ratios with prognosis & mortality in rapidly progressive glomerulonephritis. Indian J Med Res. (2019) 150:399–406. doi: 10.4103/ijmr.IJMR_1234_17, PMID: 31823922
16. Torun S, Tunc BD, Suvak B, Yildiz H, Tas A, Sayilir A, et al. Assessment of neutrophil-lymphocyte ratio in ulcerative colitis: a promising marker in predicting disease severity. Clin Res Hepatol Gastroenterol. (2012) 36:491–7. doi: 10.1016/j.clinre.2012.06.004, PMID: 22841412
17. Cherfane CE, Gessel L, Cirillo D, Zimmerman MB, and Polyak S. Monocytosis and a low lymphocyte to monocyte ratio are effective biomarkers of ulcerative colitis disease activity. Inflammation Bowel Dis. (2015) 21:1769–75. doi: 10.1097/MIB.0000000000000427, PMID: 25993688
18. Long GV, Swetter SM, Menzies AM, Gershenwald JE, and Scolyer RA. Cutaneous melanoma. Lancet. (2023) 402:485–502. doi: 10.1016/S0140-6736(23)00821-8, PMID: 37499671
19. Liu T, Qin Z, Yang Z, and Feng X. Predictive value of MHR and NLR for ulcerative colitis disease activity. Int J Gen Med. (2024) 17:685–92. doi: 10.2147/IJGM.S446723, PMID: 38435113
20. Omori M, Shibuya T, Ishino H, Fukuo Y, Odakura R, Koma M, et al. Remission factors for ustekinumab treatment of ulcerative colitis: A multicenter retrospective study of real-world data in Japan. Biomedicines. (2024) 12:1119. doi: 10.3390/biomedicines12051119, PMID: 38791081
21. Şimşek-Onat P, Hizarcioglu-Gulsen H, Ergen YM, Gumus E, Özen H, Demir H, et al. Neutrophil-to-lymphocyte ratio: an easy marker for the diagnosis and monitoring of inflammatory bowel disease in children. Dig Dis Sci. (2023) 68:233–9. doi: 10.1007/s10620-022-07547-z, PMID: 35579794
22. Kurimoto N, Nishida Y, Hosomi S, Itani S, Kobayashi Y, Nakata R, et al. Neutrophil-to-lymphocyte ratio may predict clinical relapse in ulcerative colitis patients with mucosal healing. PloS One. (2023) 18:e0280252. doi: 10.1371/journal.pone.0280252, PMID: 36634124
23. Feng W, Liu Y, Zhu L, Xu L, and Shen H. Evaluation of neutrophil-to-lymphocyte ratio and platelet-to-lymphocyte ratio as potential markers for ulcerative colitis: a retrospective study. BMC Gastroenterol. (2022) 22:485. doi: 10.1186/s12876-022-02571-9, PMID: 36424535
24. Cui J, Li X, Zhang Z, Gao H, and Li J. Common laboratory blood test immune panel markers are useful for grading ulcerative colitis endoscopic severity. BMC Gastroenterol. (2022) 22:540. doi: 10.1186/s12876-022-02634-x, PMID: 36572872
25. Cifci S and Ekmen N. Prediction of mucosal health by NLR, CRP x NLR and MPV in ulcerative colitis: can their availability change according to treatment options? Cureus. (2021) 13:e19942. doi: 10.7759/cureus.19942, PMID: 34984116
26. Jeong Y, Jeon SR, Kim HG, Moon JR, Lee TH, Jang JY, et al. The role of platelet to lymphocyte ratio and neutrophil to lymphocyte ratio in ulcerative colitis. Intest Res. (2021) 19:62–70. doi: 10.5217/ir.2019.09156, PMID: 32375208
27. Endo K, Satoh T, Yoshino Y, Kondo S, Kawakami Y, Katayama T, et al. Neutrophil-to-lymphocyte and platelet-to-lymphocyte ratios as noninvasive predictors of the therapeutic outcomes of systemic corticosteroid therapy in ulcerative colitis. Inflammation Intest Dis. (2021) 6:218–24. doi: 10.1159/000520523, PMID: 35083287
28. Nishida Y, Hosomi S, Yamagami H, Yukawa T, Otani K, Nagami Y, et al. Neutrophil-to-lymphocyte ratio for predicting loss of response to infliximab in ulcerative colitis. PloS One. (2017) 12:e0169845. doi: 10.1371/journal.pone.0169845, PMID: 28076386
29. Okba AM, Amin MM, Abdelmoaty AS, Ebada HE, Kamel AH, Allam AS, et al. Neutrophil/lymphocyte ratio and lymphocyte/monocyte ratio in ulcerative colitis as non-invasive biomarkers of disease activity and severity. Auto Immun Highlights. (2019) 10:4. doi: 10.1186/s13317-019-0114-8, PMID: 32257060
30. Akpinar MY, Ozin YO, Kaplan M, Ates I, Kalkan IH, Kilic ZMY, et al. Platelet-to-lymphocyte ratio and neutrophil-to-lymphocyte ratio predict mucosal disease severity in ulcerative colitis. J Med Biochem. (2018) 37:155–62. doi: 10.1515/jomb-2017-0050, PMID: 30581352
31. Demir AK, Demirtas A, Kaya SU, Tastan I, Butun I, Sagcan M, et al. The relationship between the neutrophil-lymphocyte ratio and disease activity in patients with ulcerative colitis. Kaohsiung J Med Sci. (2015) 31:585–90. doi: 10.1016/j.kjms.2015.10.001, PMID: 26678939
32. Posul E, Yilmaz B, Aktas G, and Kurt M. Does neutrophil-to-lymphocyte ratio predict active ulcerative colitis? Wien Klin Wochenschr. (2015) 127:262–5. doi: 10.1007/s00508-014-0683-5, PMID: 25576331
33. Celikbilek M, Dogan S, Ozbakır O, Zararsız G, Kücük H, Gürsoy S, et al. Neutrophil-lymphocyte ratio as a predictor of disease severity in ulcerative colitis. J Clin Lab Anal. (2013) 27:72–6. doi: 10.1002/jcla.21564, PMID: 23292894
34. Chen YH, Wang L, Feng SY, Cai WM, Chen XF, and Huang ZM. The relationship between C-reactive protein/albumin ratio and disease activity in patients with inflammatory bowel disease. Gastroenterol Res Pract. (2020) 2020:3467419. doi: 10.1155/2020/3467419, PMID: 32655630
35. Xu M, Cen M, Chen X, Chen H, Liu X, and Cao Q. Correlation between serological biomarkers and disease activity in patients with inflammatory bowel disease. BioMed Res Int. (2019) 2019:6517549. doi: 10.1155/2019/6517549, PMID: 31950048
36. Feng JR, Qiu X, Wang F, Chen PF, Gao Q, Peng YN, et al. Diagnostic value of neutrophil-to-lymphocyte ratio and platelet-to-lymphocyte ratio in Crohn’s disease. Gastroenterol Res Pract. (2017) 2017:3526460. doi: 10.1155/2017/3526460, PMID: 28798770
37. Zhang MH, Wang H, Wang HG, Wen X, and Yang XZ. Effective immune-inflammation index for ulcerative colitis and activity assessments. World J Clin Cases. (2021) 9:334–43. doi: 10.12998/wjcc.v9.i2.334, PMID: 33521101
38. Hanafy AS, Monir MH, Abdel Malak H, and Desoky Aiad M. A simple noninvasive score predicts disease activity and deep remission in ulcerative colitis. Inflammation Intest Dis. (2018) 3:16–24. doi: 10.1159/000490795, PMID: 30505838
39. Acarturk G, Acay A, Demir K, Ulu MS, Ahsen A, and Yuksel S. Neutrophil-to-lymphocyte ratio in inflammatory bowel disease - as a new predictor of disease severity. Bratisl Lek Listy. (2015) 116:213–7. doi: 10.4149/bll_2015_041, PMID: 25773946
40. Baert F, Moortgat L, Van Assche G, Caenepeel P, Vergauwe P, De Vos M, et al. Belgian Inflammatory Bowel Disease Research Group; North-Holland Gut Club. Mucosal healing predicts sustained clinical remission in patients with early-stage Crohn’s disease. Gastroenterology. (2010) 138:463–8; quiz e10-1. doi: 10.1053/j.gastro.2009.09.056, PMID: 19818785
41. Shah SC, Colombel JF, Sands BE, and Narula N. Systematic review with meta-analysis: mucosal healing is associated with improved long-term outcomes in Crohn’s disease. Aliment Pharmacol Ther. (2016) 43:317–33. doi: 10.1111/apt.13475, PMID: 26607562
42. Vermeire S, Van Assche G, and Rutgeerts P. Laboratory markers in IBD: useful, magic, or unnecessary toys? Gut. (2006) 55:426–31. doi: 10.1136/gut.2005.069476, PMID: 16474109
43. Fagan EA, Dyck RF, Maton PN, Hodgson HJ, Chadwick VS, Petrie A, et al. Serum levels of C-reactive protein in Crohn’s disease and ulcerative colitis. Eur J Clin Invest. (1982) 12:351–9. doi: 10.1111/j.1365-2362.1982.tb02244.x, PMID: 6814926
44. van Rheenen PF, Van de Vijver E, and Fidler V. Faecal calprotectin for screening of patients with suspected inflammatory bowel disease: diagnostic meta-analysis. BMJ. (2010) 341:c3369. doi: 10.1136/bmj.c3369, PMID: 20634346
45. Lei L, Lv T, Wang L, and Liu X. Predictive value of serum markers for mucosal healing in patients with inflammatory bowel disease. Am J Transl Res. (2024) 16(8):3723–32. doi:10.62347/LXBG8588, PMID: 39262732
46. Kaluz na A, Olczyk P, and Komosi nska-Vassev K. The role of in nate and adaptive immune cells in the pathogenesis and de velopment of the inflammatory response in ulcerative colitis. J Clin Med. (2022) 11:400. doi: 10.3390/jcm11020400, PMID: 35054093
47. Dinallo V, Marafini I, Di Fusco D, Laudisi F, Franzè E, Di Grazia A, et al. Neutrophil extracellular traps sustain inflammatory signals in ulcerative colitis. J Crohns Colitis. (2019) 13:772–84. doi: 10.1093/ecco-jcc/jjy215, PMID: 30715224
48. Angelidou I, Chrysanthopoulou A, Mitsios A, Arelaki S, Arampatzioglou A, Kambas K, et al. REDD1/autophagy pathway is associated with neutrophil-driven IL-1β inflammatory response in active ulcerative colitis. J Immunol. (2018) 200(12):3950–61. doi: 10.4049/jimmunol.1701643, PMID: 29712770
49. Souza RF, Caetano MAF, Magalhães HIR, and Castelucci P. Study of tumor necrosis factor receptor in the inflammatory bowel disease. World J Gastroenterol. (2023) 29:2733–46. doi: 10.3748/wjg.v29.i18.2733, PMID: 37274062
50. Voshagh Q, Anoshiravani A, Karimpour A, Goodarzi G, Tehrani SS, Tabatabaei-Malazy O, et al. Investigating the association between the tissue expression of miRNA-101, JAK2/STAT3 with TNF-α, IL-6, IL-1β, and IL-10 cytokines in the ulcerative colitis patients. Immun Inflammation Dis. (2024) 12:e1224. doi: 10.1002/iid3.1224, PMID: 38517042
51. Gomes RG, Brito CAA, Martinelli VF, Santos RND, Gomes FODS, Peixoto CA, et al. HLA-G is expressed in intestinal samples of ulcerative colitis and Crohn’s disease patients and HLA-G5 expression is differentially correlated with TNF and IL-10 cytokine expression. Hum Immunol. (2018) 79(6):477–84. doi: 10.1016/j.humimm.2018.03.006, PMID: 29588183
52. Li Y, Zhang YY, Yang LT, Liu JQ, Zhou C, Liu ZQ, et al. FcγRI plays a critical role in patients with ulcerative colitis relapse. Eur J Immunol. (2021) 51(2):459–70. doi: 10.1002/eji.202048622, PMID: 33078845
53. Ranson N, Veldhuis M, Mitchell B, Fanning S, Cook AL, and Eri R. NLRP3-dependent and-independent processing of interleukin (IL)-1β in active ulcerative colitis. Int J Mol Sci. (2018) 20(1):57. doi: 10.3390/ijms20010057, PMID: 30583612
54. Lin EY, Lai HJ, Cheng YK, Leong KQ, Cheng LC, Chou YC, et al. Neutrophil extracellular traps impair intestinal barrier function during experimental colitis. Biomedicines. (2020) 8:275. doi: 10.3390/biomedicines8080275, PMID: 32764411
55. Muthas D, Reznichenko A, Balendran CA, Böttcher G, Clausen IG, Kärrman Mårdh C, et al. Neutrophils in ulcerative colitis: a review of selected biomarkers and their potential therapeutic implications. Scand J Gastroenterol. (2017) 52:125–35. doi: 10.1080/00365521.2016.1235224, PMID: 27610713
56. O’Brien CL, Summers KM, Martin NM, Carter-Cusack D, Yang Y, Barua R, et al. The relationship between extreme inter-individual variation in macrophage gene expression and genetic susceptibility to inflammatory bowel disease. Hum Genet. (2024) 143:233–61. doi: 10.1007/s00439-024-02642-9, PMID: 38421405
57. Li M, Zhao Y, Zhang J, Jiang W, Peng S, Hu J, et al. Deubiquitinase USP14 is upregulated in Crohn’s disease and inhibits the NOD2 pathway mediated inflammatory response in vitro. Eur J Histochem. (2024) 68:4101. doi: 10.4081/ejh.2024.4101, PMID: 39252535
58. Padoan A, Musso G, Contran N, and Basso D. Inflammation, autoinflammation and autoimmunity in inflammatory bowel diseases. Curr Issues Mol Biol. (2023) 45:5534–57. doi: 10.3390/cimb45070350, PMID: 37504266
59. Yang F, Ni B, Liu Q, He F, Li L, Zhong X, et al. Human umbilical cord-derived mesenchymal stem cells ameliorate experimental colitis by normalizing the gut microbiota. Stem Cell Res Ther. (2022) 13:475. doi: 10.1186/s13287-022-03118-1, PMID: 36104756
60. Ignacio A, Breda CNS, and Camara NOS. Innate lymphoid cells in tissue homeostasis and diseases. World J Hepatol. (2017) 9:979–89. doi: 10.4254/wjh.v9.i23.979, PMID: 28878863
61. Diefenbach A, Gnafakis S, and Shomrat O. Innate lymphoid cell-epithelial cell modules sustain intestinal homeostasis. Immunity. (2020) 52:452–63. doi: 10.1016/j.immuni.2020.02.016, PMID: 32187516
62. Kang Y, Amoafo EB, Entsie P, Beatty GL, and Liverani E. A role for platelets in metabolic reprogramming of tumor-associated macrophages. Front Physiol. (2023) 14:1250982. doi: 10.3389/fphys.2023.1250982, PMID: 37693009
63. Maugeri N, Capobianco A, Rovere-Querini P, Ramirez GA, Tombetti E, Valle PD, et al. Platelet microparticles sustain autophagy-associated activation of neutrophils in systemic sclerosis. Sci Transl Med. (2018) 10:eaao3089. doi: 10.1126/scitranslmed.aao3089, PMID: 30045975
64. MacDonald TT, Monteleone I, Fantini MC, and Monteleone G. Regulation of homeostasis and inflammation in the intestine. Gastroenterology. (2011) 140:1768–75. doi: 10.1053/j.gastro.2011.02.047, PMID: 21530743
65. Crispino F, Grova M, Maida M, Renna S, Mocciaro F, Casà A, et al. Blood-based prognostic biomarkers in Crohn’s Disease patients on biologics: a promising tool to predict endoscopic outcomes. Expert Opin Biol Ther. (2021) 21:1133–41. doi: 10.1080/14712598.2021.1935857, PMID: 34042009
66. Bertani L, Rossari F, Barberio B, Demarzo MG, Tapete G, Albano E, et al. Novel prognostic biomarkers of mucosal healing in ulcerative colitis patients treated with anti-TNF: neutrophil-to-lymphocyte ratio and platelet-to-lymphocyte ratio. Inflammation Bowel Dis. (2020) 26:1579–87. doi: 10.1093/ibd/izaa062, PMID: 32232392
Keywords: inflammatory bowel disease, disease activity, NLR, PLR, LMR, meta-analysis
Citation: Tan S, Yang X, Mu X, Liu S, Wang Y, Li Y, Bian Y and Xu C (2025) The predictive role of peripheral serum inflammatory markers NLR, PLR, and LMR in ulcerative colitis and Crohn’s disease: a systematic review and meta-analysis. Front. Immunol. 16:1623899. doi: 10.3389/fimmu.2025.1623899
Received: 06 May 2025; Accepted: 09 July 2025;
Published: 25 July 2025.
Edited by:
Arianna Dal Buono, Humanitas Research Hospital, ItalyReviewed by:
Imene Soufli, University Of Science And Technology Houari Boumediene, AlgeriaDilek Menekse Beser, TC Saglik Bakanligi Ankara Dr Nafiz Korez Sincan Devlet Hastanesi, Türkiye
Copyright © 2025 Tan, Yang, Mu, Liu, Wang, Li, Bian and Xu. This is an open-access article distributed under the terms of the Creative Commons Attribution License (CC BY). The use, distribution or reproduction in other forums is permitted, provided the original author(s) and the copyright owner(s) are credited and that the original publication in this journal is cited, in accordance with accepted academic practice. No use, distribution or reproduction is permitted which does not comply with these terms.
*Correspondence: Chen Xu, eGMxOTgxMjlAMTYzLmNvbQ==; Yuhong Bian, Ymlhbnl1aG9uZ18yMDEyQDE2My5jb20=
†These authors have contributed equally to this work