 Megan E. Huber
 Emily A. Larson3
 Melanie J. Harriff
- 1Department of Molecular Microbiology and Immunology, Oregon Health & Science University, Portland, OR, United States
- 2Division of Pulmonary, Allergy, and Critical Care Medicine, Oregon Health & Science University, Portland, OR, United States
- 3Portland Veterans Affairs Research Foundation, Portland, OR, United States
- 4Veterans Affairs Portland Health Care System, Portland, OR, United States
Introduction: Antigen presentation molecules play key roles in T cell immunity. Multiple complementary pathways are known to regulate classical MHC-I molecules at transcriptional, translational, and post-translational levels. Intracellular trafficking mechanisms dictating post-transcriptional regulation of MR1, the MHC-I-like molecule which restricts MAIT cells, have been an area of focus; however, little is known about MR1 transcriptional regulation. We demonstrate that interferons regulate MR1 transcription.
Methods: Primary human airway epithelial cells (AEC) were treated with recombinant interferons or co-cultured with MAIT cell clones and antigen sources. MR1 expression was analyzed by RT-qPCR and flow cytometry. MAIT cell activity was quantified by ELISPOT.
Results: Treatment of AECs with IFNβ or IFNγ variably increased MR1 transcripts, while only IFNγ significantly increased surface MR1 expression and enhanced antigen presentation to MAIT cells. The MR1 promoter contains binding motifs for interferon regulatory factor 1 (IRF1), an important MHC-I transcription factor. IRF1 knockout reduced IFNγ-stimulated MR1 transcription, surface expression, and antigen presentation. Conversely, knockout of Nod-like Receptor family CARD domain-containing 5 (NLRC5), a critical component of MHC-I transcription, did not significantly impact MR1 expression. These findings were corroborated with IFNγ-treated primary AEC. MAIT cells in co-culture with Streptococcus pneumoniae-infected AEC produced sufficient IFNγ to stimulate MR1 expression.
Conclusion: Our data support a model where IFNγ from activated MAIT cells or another source stimulates IRF1-dependent MR1 expression and antigen presentation, leading to greater MAIT cell activation. A robust MR1-dependent MAIT cell response may be beneficial for early infection responses, allowing minimal antigen stimulus to generate greater proinflammatory activity.
Introduction
Mucosal-associated invariant T (MAIT) cells, an innate-like subset of T lymphocytes that comprise a relatively large proportion of the total CD8+ T cell population in human blood and lungs, play key roles in clearing respiratory bacterial, fungal, and viral infections (1–3). Upon antigen presentation, MAIT cells are capable of immediate effector function and release inflammatory cytokines like interferon-γ (IFNγ) and tumor necrosis factor (TNFα) (2–5). This rapid activation primes MAIT cells to coordinate early infection response, but also necessitates tight regulation of antigen presentation to prevent inappropriate MAIT cell activation to inappropriate stimuli.
MAIT cells are restricted by the MHC class I-related molecule MR1, which presents small molecule metabolite antigens such as those generated during bacterial riboflavin biosynthesis (2, 3, 6, 7). There is a large pool of potential MR1 ligands produced by commensal airway flora in addition to pathogenic respiratory microbes. MR1 mRNA is expressed across cell types and tissues, and MR1 proteins primarily reside in intracellular compartments like the ER and endosomal compartments (7–11). The basal intracellular location of MR1 and ligand-induced translocation to the cell surface play critical parts in regulation of MAIT activation (as reviewed in (12–14)).
The intracellular trafficking mechanisms dictating post-transcriptional regulation of MR1 have been an area of research focus; however, little is known about MR1 transcriptional regulation. Multiple complementary pathways regulate classical MHC-Ia molecules at transcriptional, translational, and post-translational levels (15, 16). Interferons (IFNs) like IFNβ and IFNγ drive transcription of MHC-Ia through expression of downstream transcription factors like Interferon Regulatory Factor 1 (IRF1) and Nod-like receptor family CARD domain containing 5 (NLRC5), which in turn bind to the HLA promoter to induce transcription (15–19). Although the MR1 gene resides on human chromosome 1, outside the chromosome 6 HLA locus (7), these pathways may provide insight into transcriptional regulation of MR1. Recent research links MR1 expression with disease pathology (e.g. meningeal tuberculosis (20), glioma (21), and COPD (22–24)), although specific mechanisms controlling MR1 transcription remain unclear.
Here, we investigated the role of IFNγ in stimulating MR1 expression in human airway epithelial cells (AEC). We found IFNγ promotes MR1 transcription, antigen presentation, and MAIT cell responses. While NLRC5 and IRF1 were both important for IFNγ-induced HLA-A transcription, NLRC5 was largely dispensable for MR1 transcription. Finally, we demonstrate that MAIT cells, activated in co-culture with infected AEC, produce sufficient IFNγ to stimulate MR1 transcription. Taken together, our data support a model in which IFNγ from activated immune cells induces MR1 expression and antigen presentation, leading to greater MAIT cell activation. These results establish an additional level of MR1 regulation, informing our understanding of MAIT cell activation and dysregulation in infection and disease.
Results
MR1 expression increases in infected AECs co-cultured with MAIT cells
First, we asked if co-culture with activated MAIT cells could impact MR1 expression and function in airway epithelial cells (AEC). To address this, we examined MR1 mRNA expression of primary human AEC co-cultured with the human MAIT cell clone D426G11 alone or in the context of Streptococcus pneumoniae (Sp) infection.
We noticed significantly increased MR1 mRNA expression in AEC from healthy donors when infected with Sp and cultured with MAIT cells (Figure 1A, Supplementary Figure 1A, Supplementary Table 1). Infection with Sp or co-culture with MAIT cells alone did not stimulate a significant response. We replicated this system using a model bronchial epithelial cell line (BEAS-2B cells) infected with Mycobacterium smegmatis (Ms). Similarly, we observed increased MR1 expression in the Ms-infected BEAS-2B cells co-cultured with MAIT cells, with no impact of either condition alone (Figure 1B, Supplementary Figure 1B, Supplementary Table 1). Using flow cytometry to quantify surface MR1 protein expression, we likewise found increased MR1 expression with both Ms infection and MAIT cell co-culture compared to either condition alone (Figure 1C, Supplementary Figure 1C). These data suggest that MAIT cells, when activated by presentation of bacterial antigens, could lead to increased MR1 mRNA or surface protein expression in the infected cell.
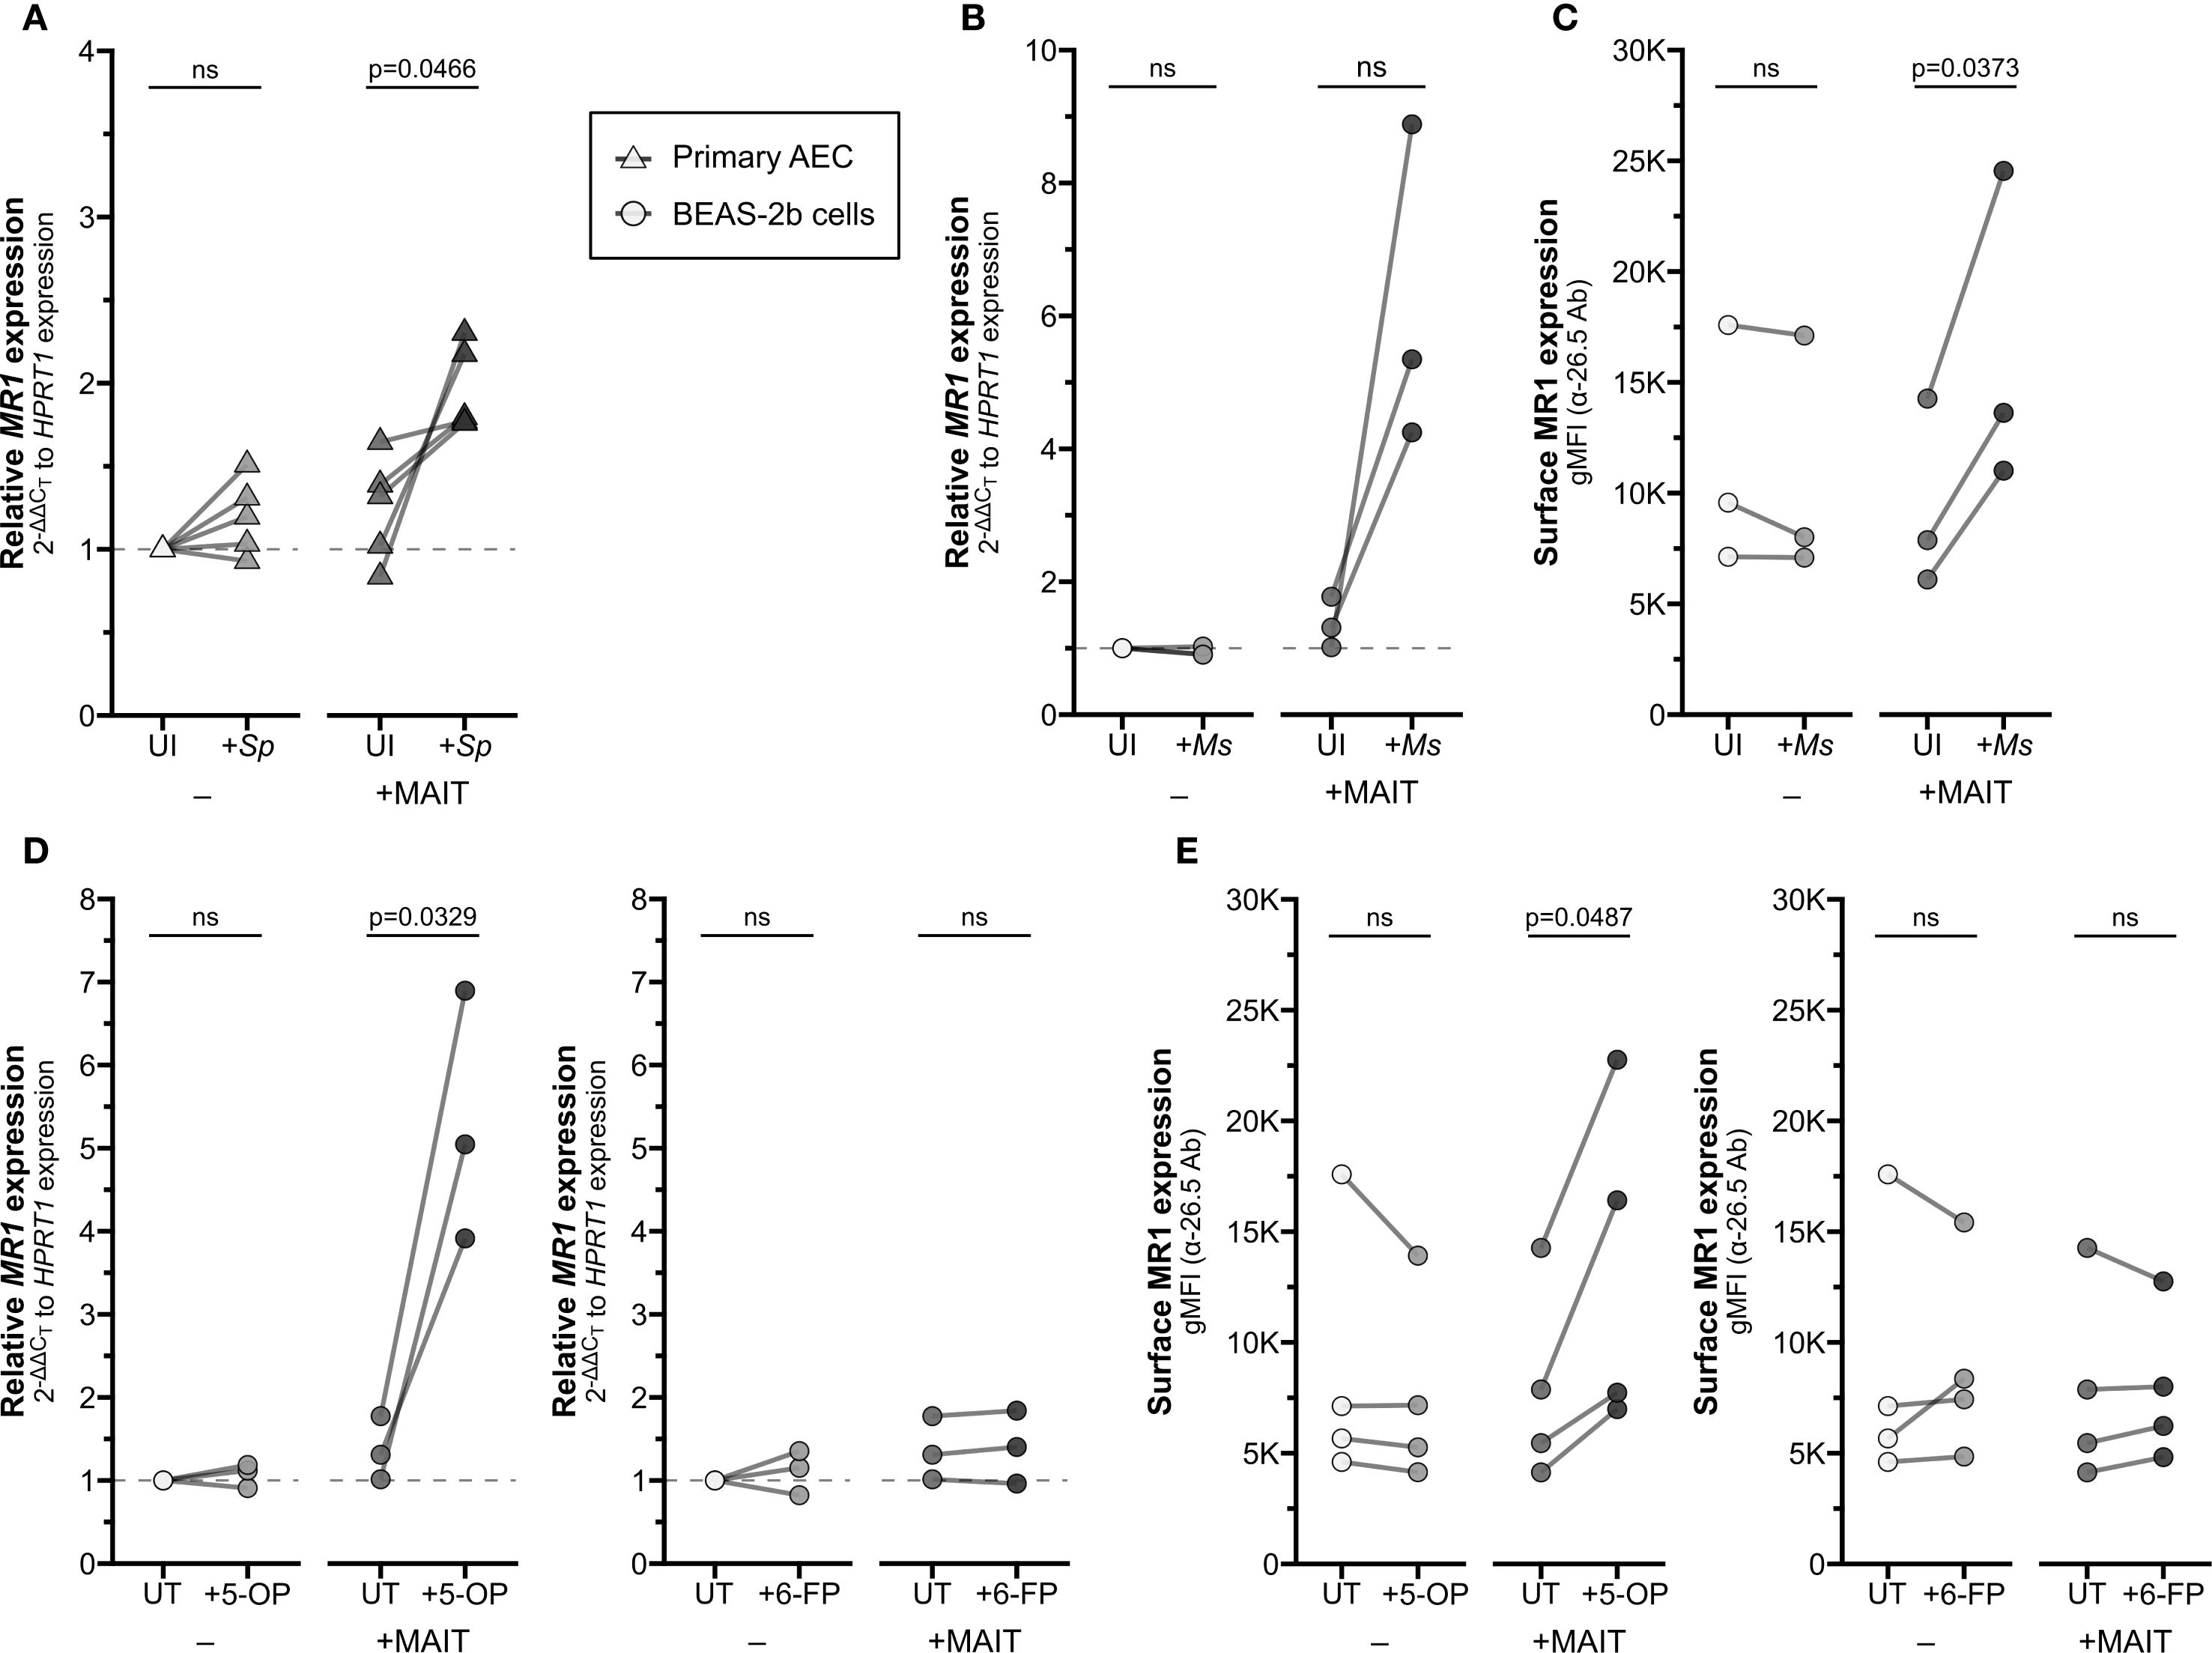
Figure 1. Increased MR1 expression following MAIT cell activation. (A) RT-qPCR of RNA isolated from primary human AECs (n=5) infected with S. pneumoniae (Sp) for one hour and incubated overnight with MAIT cell clone. MR1 expression was calculated relative to HPRT1 expression and uninfected no-MAIT (UI-) controls, paired by individual donor. MR1 (B) mRNA and (C) surface expression of BEAS-2B cells infected with M. smegmatis (Ms) for one hour and incubated overnight with MAIT cell clone. (B) RT-qPCR of MR1 expression was calculated relative to HPRT1 expression and UI- control, paired by experimental replicate. (C) Geometric mean fluorescence intensity (gMFI) of surface MR1 stained with α-MR1 26.5 Ab, paired by experimental replicate. MR1 (D) mRNA and (E) surface expression of BEAS-2B cells treated with 5-OP-RU (left, “5−OP”) or 6-FP (right) for one hour and incubated overnight with MAIT cell clone. (D) RT-qPCR of MR1 expression was calculated relative to HPRT1 expression and UT- control, paired by experimental replicate. (E) gMFI of surface MR1 stained with α-26.5 Ab, paired by experimental replicate. Pairwise statistical analyses are in Supplementary Table 1. Triangles represent data from primary AEC and circles represent data from BEAS-2B cells. The symbol 'ns' refers to comparisons with p-values < 0.05.
We next asked whether microbial infection is required for this transcriptional increase or if the presence of MR1 ligand alone is sufficient. We treated BEAS-2B cells with either the stimulatory antigen 5-(2-oxopropylideneamino)-6-d-ribitylaminouracil (5-OP-RU) or the non-stimulatory ligand 6-formylpterin (6-FP) and measured expression of MR1. Neither 5-OP-RU nor 6-FP increased MR1 expression alone (Figures 1D, E). In co-culture with MAIT cells, however, MR1 mRNA expression increased when BEAS-2B cells were treated with 5-OP-RU, while treatment with 6-FP had no impact on MR1 expression (Figures 1D, E, Supplementary Figures 1D, E). These data demonstrate that the upregulation of MR1 mRNA expression requires activation of MAIT cells, and this may be stimulated by antigen presentation alone or bacterial infection.
IFNγ stimulates MR1 expression and antigen presentation
Among the effector molecules produced by activated MAIT cells, IFNγ is well known to stimulate transcription of MHC Class I molecules (15–17). We hypothesized MR1 expression could be regulated through similar mechanisms, despite the differences in chromosomal location and gene arrangement from classical HLA genes. To test if IFNγ alone is sufficient to stimulate MR1 expression, we treated primary AEC with recombinant human IFNγ. IFNγ treatment significantly increased MR1 transcription (Figure 2A, left). As expected, IFNγ also increased expression of positive control HLA-A (Figure 2A, right). In BEAS-2B cells treated with IFNγ, we also observed significant increases in both MR1 and HLA-A mRNA expression (Figure 2B).
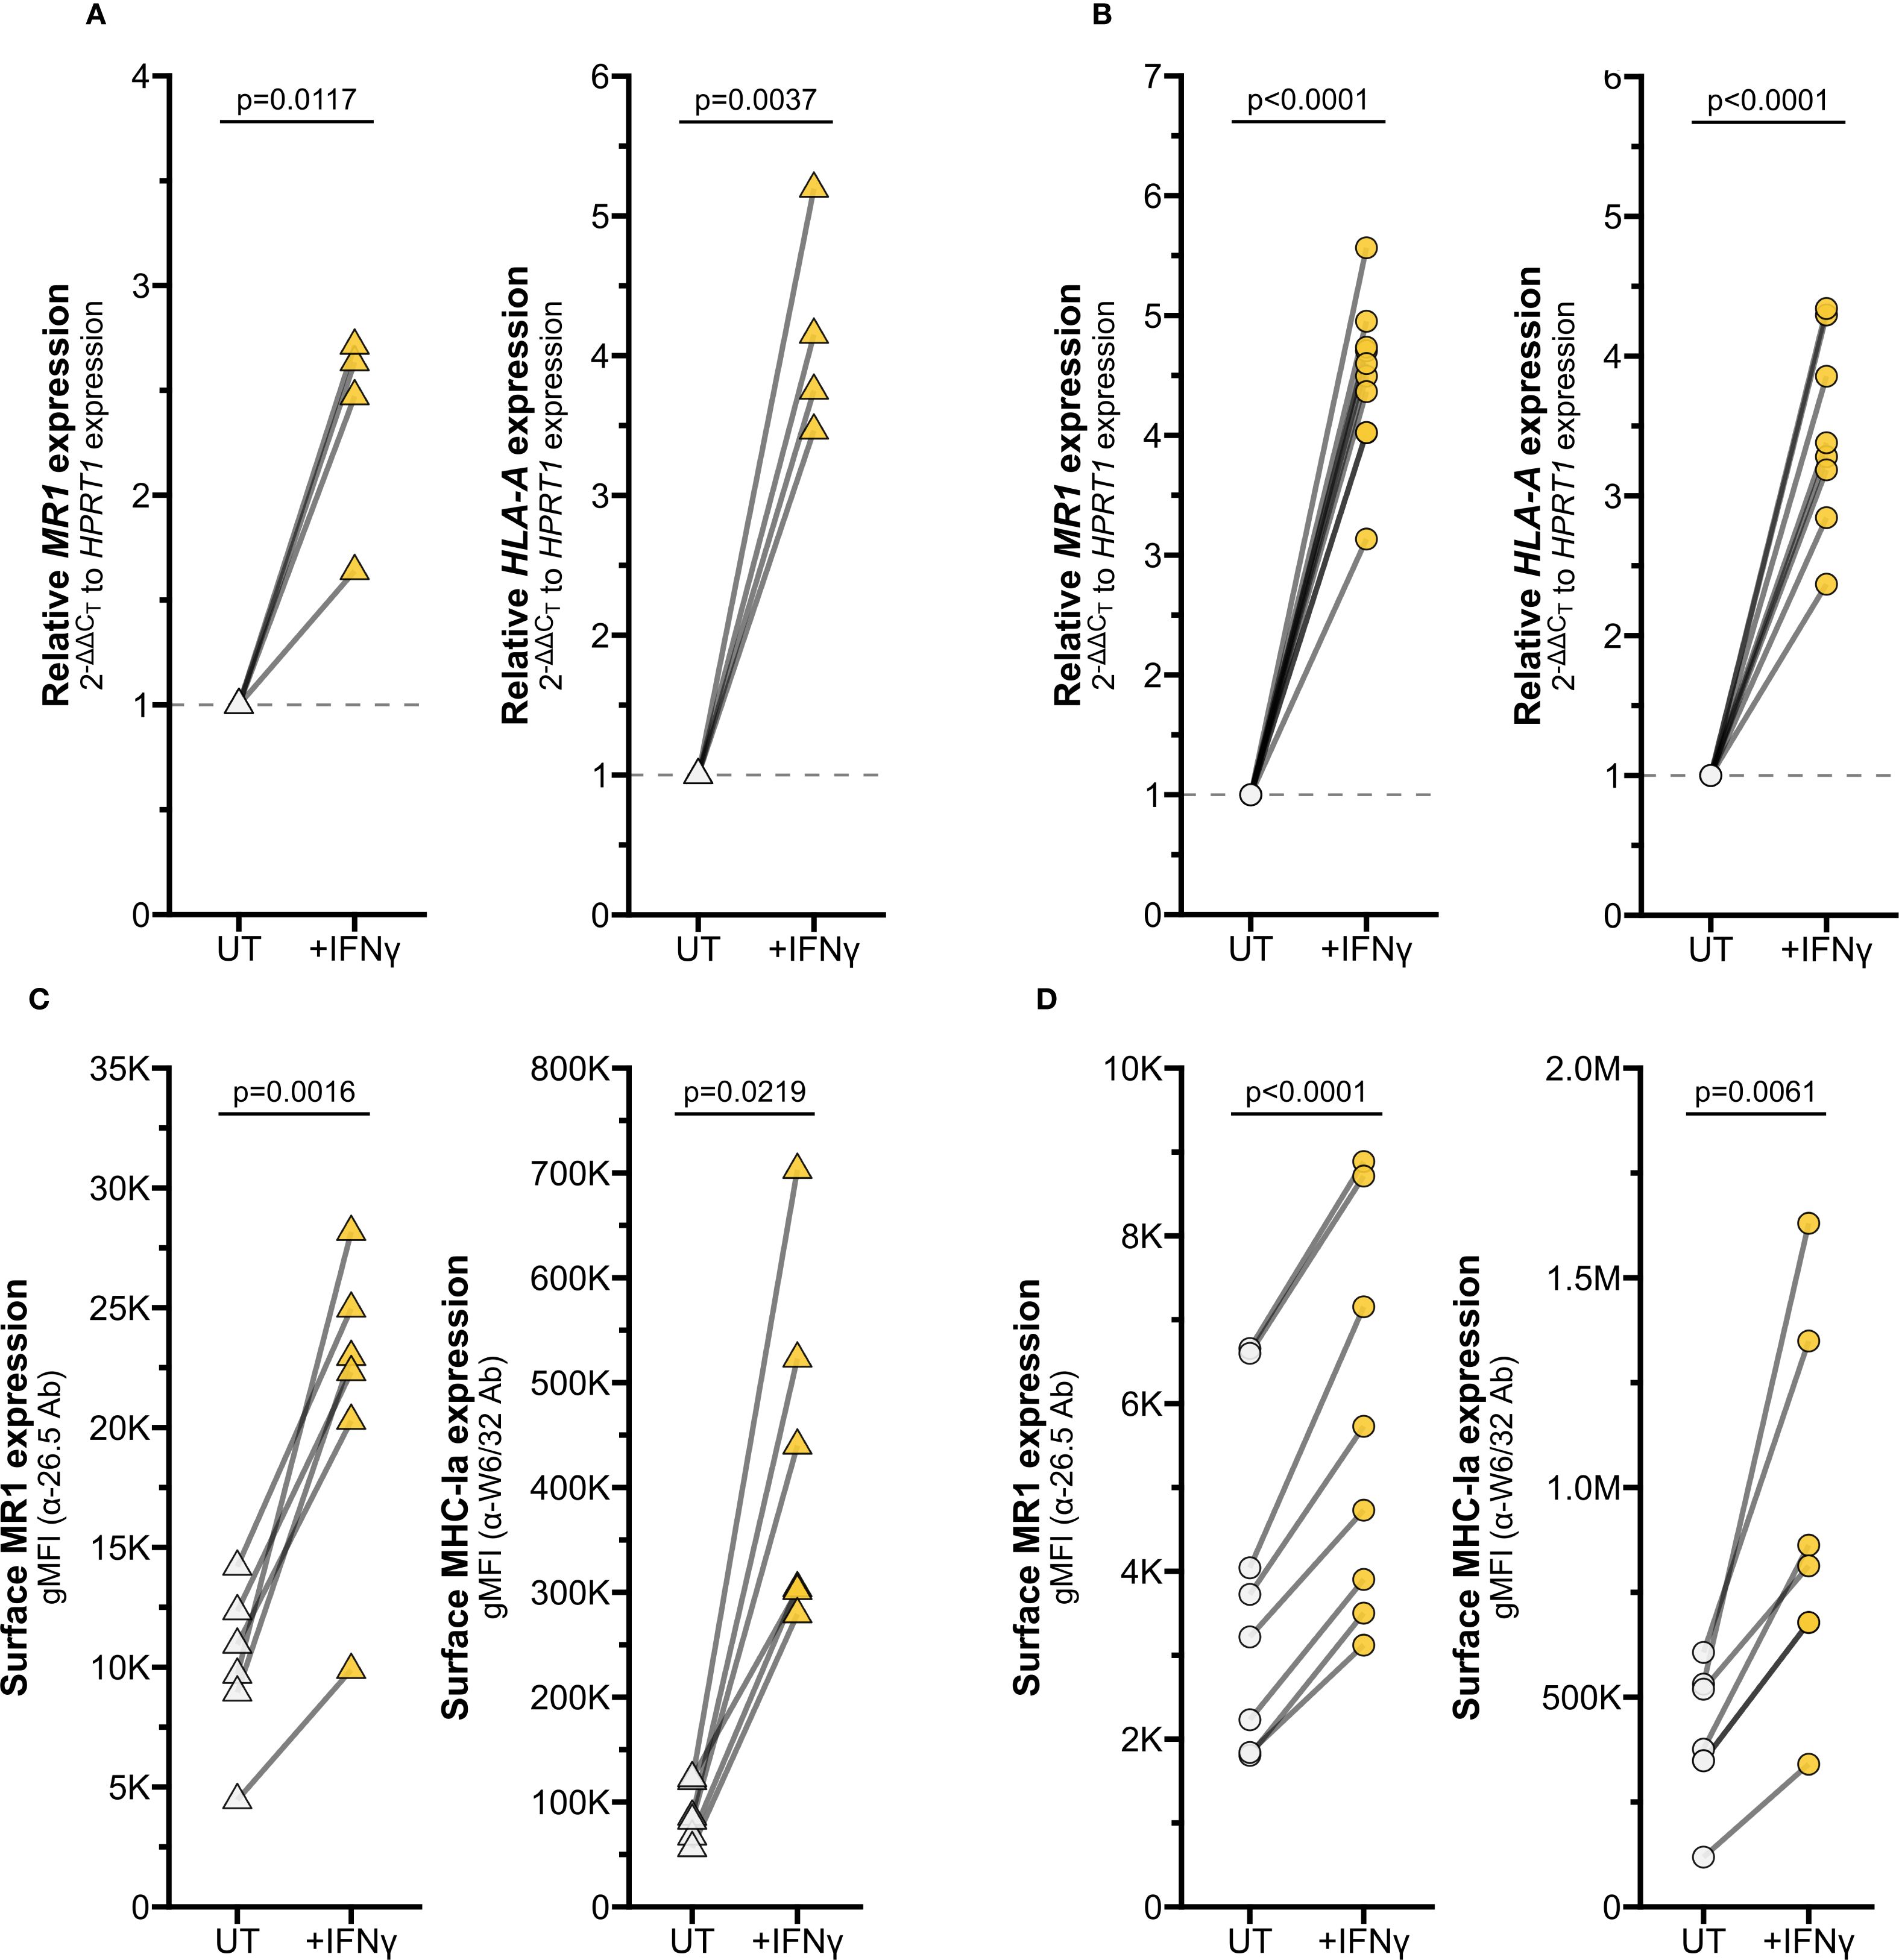
Figure 2. IFNγ induces MR1 expression and function. RT-qPCR of (A) primary human AECs or (B) BEAS-2B cells treated with media control (UT) or recombinant IFNγ for 12 hours. MR1 (left) and HLA-A (right) expression were calculated relative to HPRT1 expression and UT control, paired by individual donor or experimental replicate. Flow cytometry of (C) primary AECs or (D) BEAS-2B cells treated with recombinant IFNγ for 12 hours. gMFI of surface MR1 (left, α-26.5 Ab) and MHC-Ia (right, α-W6/32 Ab) are paired by individual donor or experimental replicate. Pairwise T tests were performed by donor (A, C) or experiment (B, D). Triangles represent data from primary AEC and circles represent data from BEAS-2B cells. Yellow symbols indicate IFNγ treatment.
To quantify MR1 protein expression, we measured surface MR1 expression by flow cytometry. We found that IFNγ treatment also significantly increased surface MR1 expression and control MHC-I expression in primary AEC and BEAS-2B cells (Figures 2C, D, Supplementary Figure 1F). This approach does not distinguish between 1) increased surface expression of MR1 proteins due to increased MR1 transcription and translation or 2) increased translocation of existing MR1 molecules and stabilization on the cell surface. To determine if IFNγ signaling impacts post-transcriptional protein stability of MR1, we utilized BEAS-2B cells expressing MR1-GFP under a doxycycline-inducible promoter (11). IFNγ treatment did not increase expression of MR1 mRNA, total MR1-GFP gMFI, or surface MR1 in these doxycycline-treated cells (Figure 3A-C). As expected, IFNγ treatment increased MHC-Ia surface expression and 6-FP treatment induced significant stabilization of total MR1-GFP protein expression and surface translocation (Figures 3C, D). Together, these data indicate that increased surface MR1 in IFNγ-treated wildtype cells resulted from stimulation of MR1 transcription rather than protein-level impacts.
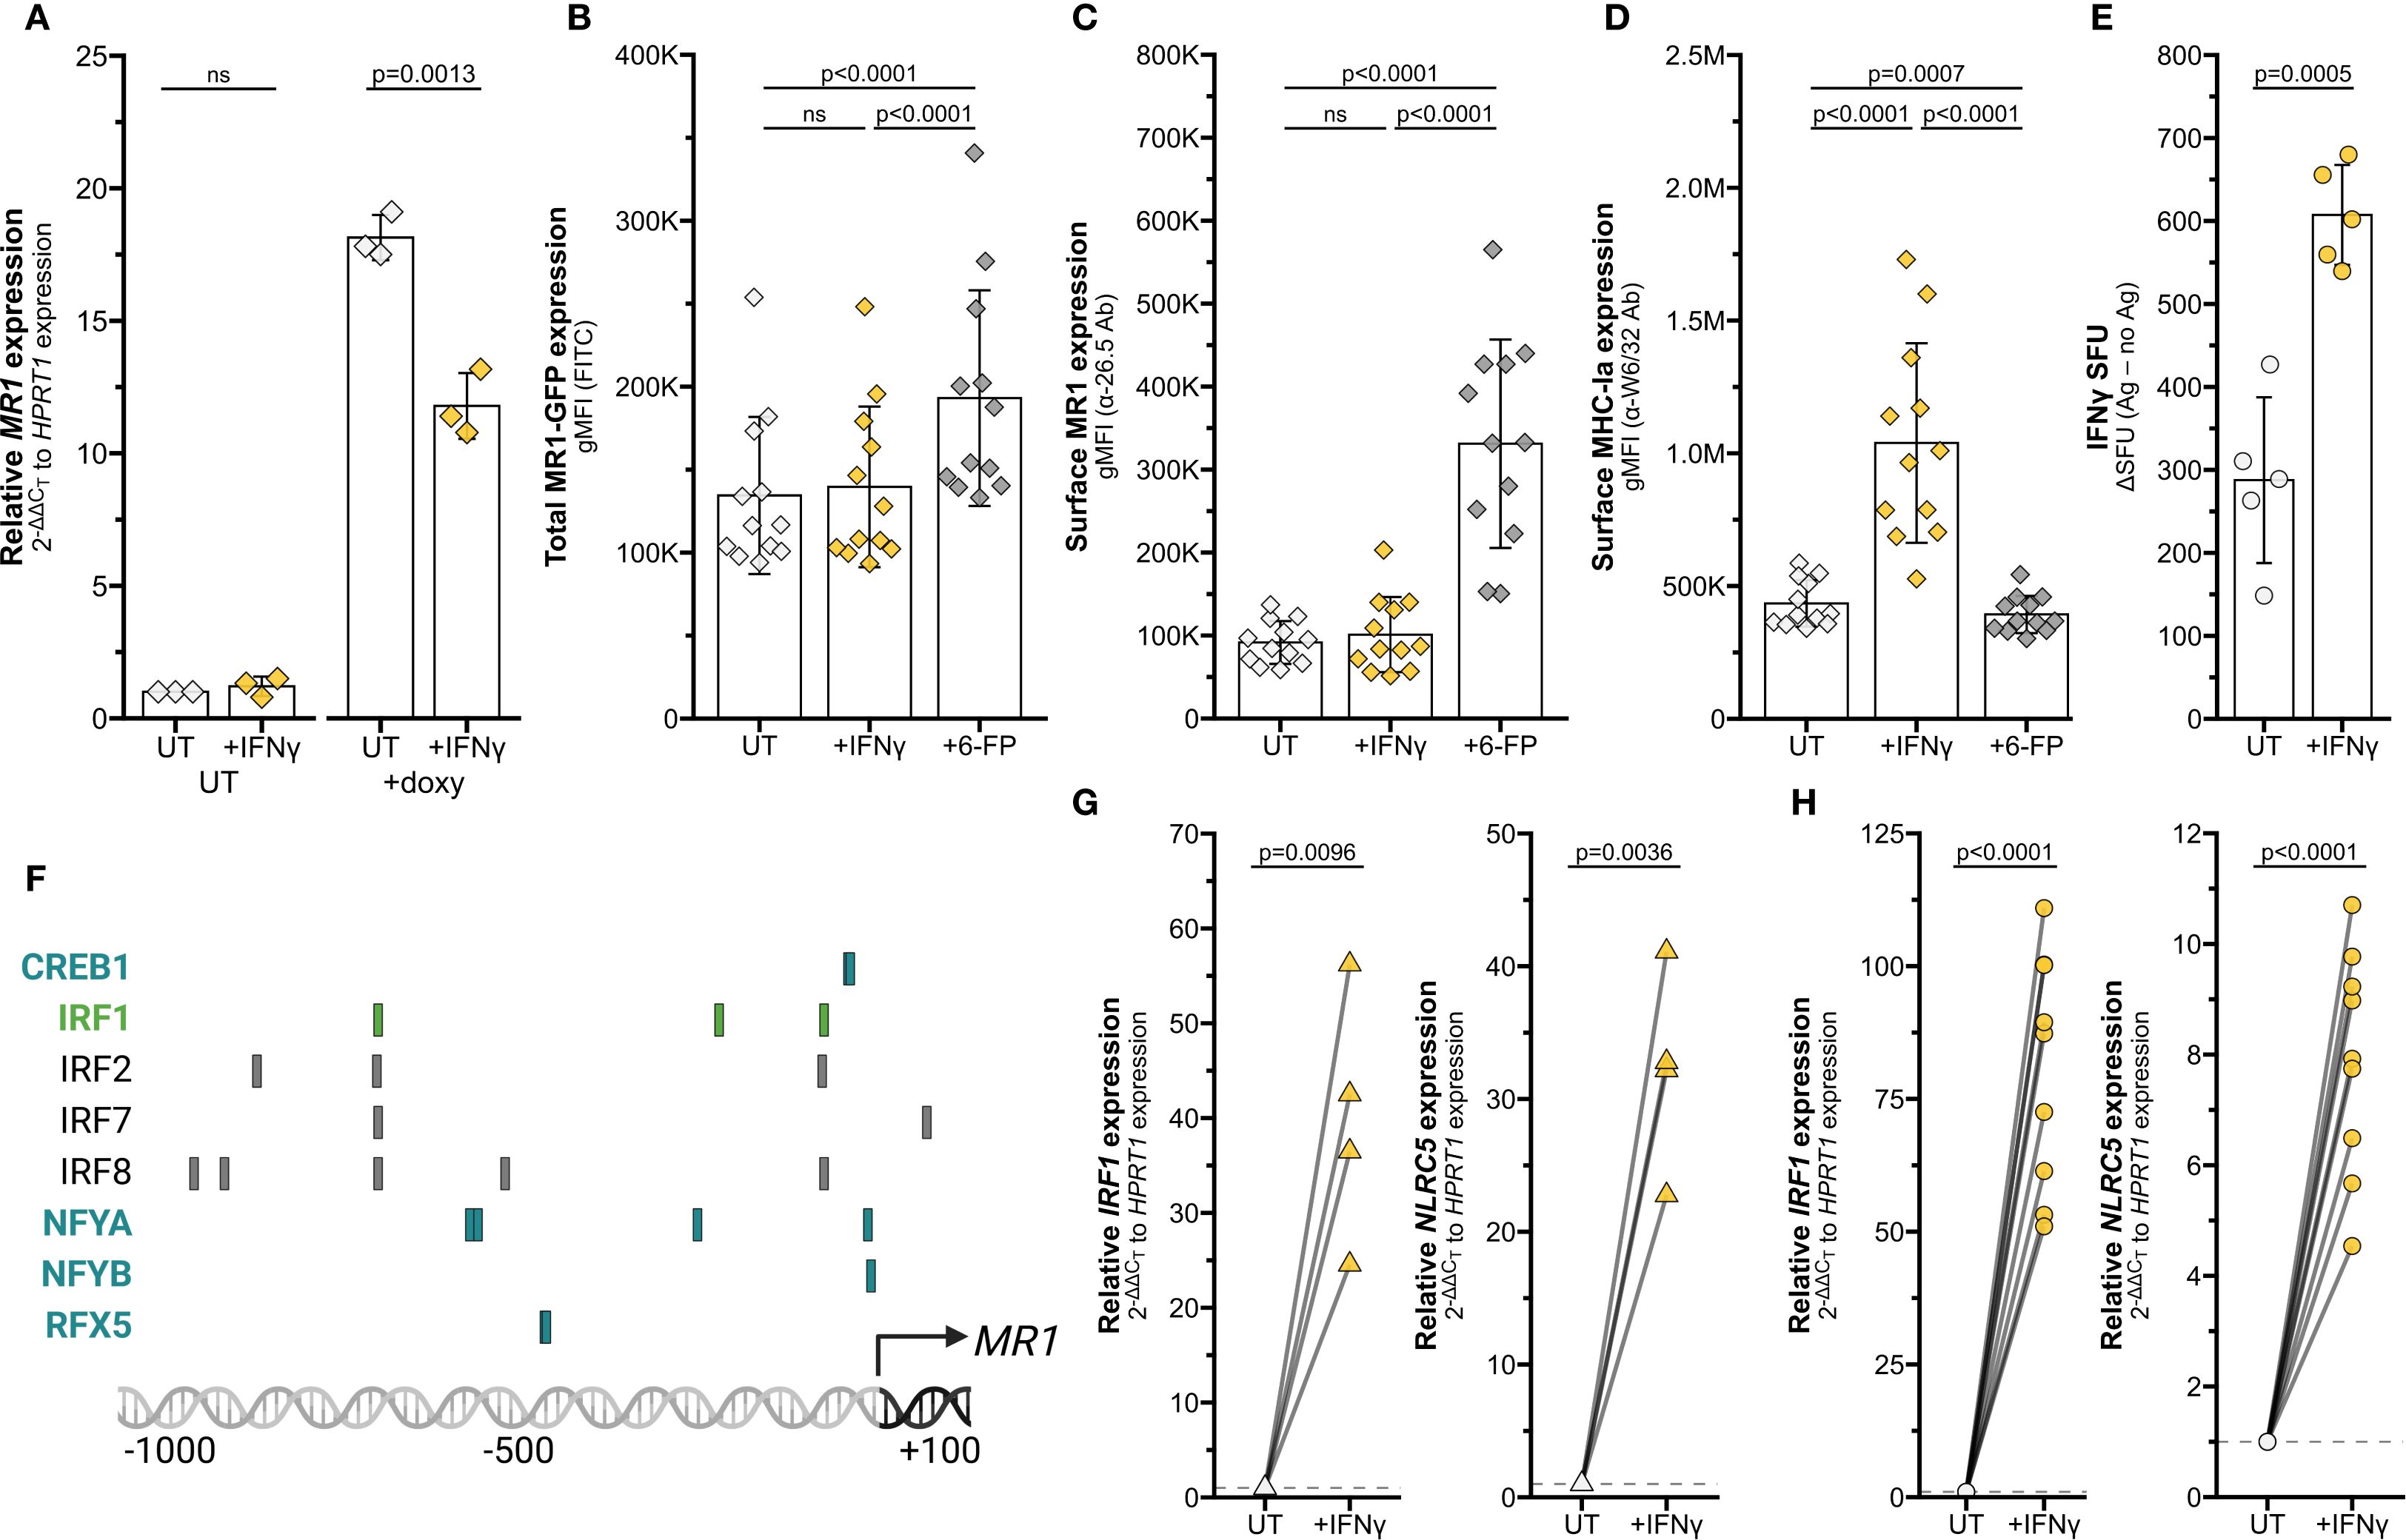
Figure 3. Transcriptional stimulation of MR1 by IFNγ. (A–D) BEAS-2B:doxMR1-GFP cells were treated with doxycycline, IFNγ, and/or 6-FP overnight. (A) MR1 expression was calculated relative to HPRT1 expression and UT control, paired by experimental replicate. gMFI of (B) MR1-GFP, (C) surface MR1 α-26.5 stain, and (D) surface MHC-Ia α-W6/32 stain. Data are experimental replicates. (E) ELISPOT of BEAS-2B cells treated with filtered M. smegmatis supernatant and MAIT cells. Data points are experimental replicates of no-antigen background-subtracted IFNγ spot-forming units (SFU). Subtracting the background SFU (average 15.6 SFU for UT and 33.7 SFU for IFNγ-treated cells) did not impact statistical significance. (F) Putative transcription factor binding sites were acquired through the Eukaryotic Promoter Database browser using the Search Motif Tool to perform on-the-fly scanning for transcription factor motifs using the FindM tool from the Signal Search Analysis (SSA) Server toolkit (28, 102–104). Highlighted proteins are involved in IRF1- (green) or NLRC5 enhanceosome- (blue) mediated HLA transcription. RT-qPCR of (G) primary human AECs or (H) BEAS-2B cells treated with recombinant IFNγ for 12 hours. IRF1 (left) and NLRC5 (right) expression were calculated relative to HPRT1 expression and UT control, paired by individual donor or experimental replicate. Pairwise T tests were performed by experiment (A–E, H) or donor (G). Diamonds represent data from BEAS-2B:doxMR1-GFP cells, triangles represent data from primary AEC, and circles represent data from BEAS-2B cells. Yellow symbols indicate IFNγ treatment.
MR1 antigen presentation and MAIT cell responses are increased in MR1 over-expression systems (10, 11, 25). We next investigated if the IFNγ-dependent increase in MR1 expression similarly enhanced MAIT cell responses to wildtype cells. BEAS-2B cells were treated with IFNγ for 12 hours, thoroughly washed to remove excess soluble IFNγ, then used as antigen-presenting cells in an IFNγ ELISPOT assay to quantify MAIT cell activation. Filtered M. smegmatis supernatant was used as the antigen source to avoid potential confounding impacts of IFNγ treatment on bacterial infection. MAIT cell responses to IFNγ pre-treated BEAS-2B cells were significantly increased compared to UT controls (Figure 3E). Therefore, IFNγ treatment is sufficient to stimulate MR1 transcription, leading to increased protein expression and antigen presentation to MAIT cells.
IFNγ stimulates MR1 transcription via transcription factor IRF1, not NLRC5
Using MHC-Ia transcription pathways as a starting point, we queried the JASPAR CORE 2018 Vertebrates database to determine if the MR1 promoter contained binding motifs for known IFNγ-induced transcription factors (26–28). We highlighted notable predicted elements on this region, including those common with IFNγ-mediated HLA transcription factor sites (Figure 3F). For example, we found putative binding motifs for IRF1 and members of the NLRC5 enhanceosome complex (18, 19, 29–31). This targeted search suggested that IRF1 and NLRC5 could be of interest in IFNγ-mediated MR1 transcription.
We first validated that IFNγ signaling induces IRF1 and NLRC5 mRNA expression in our cells. Transcripts of both these genes were significantly increased by IFNγ treatment of both primary human AEC and BEAS-2B cells (Figures 3G, H).
To determine if IRF1 or NLRC5 are required for the IFNγ-mediated increase in MR1 transcription, we first used siRNA to knock down the genes separately or together in BEAS-2B cells. IRF1 KD alone significantly decreased IFNγ-stimulated MR1 mRNA expression compared to missense controls (Figure 4A, Supplementary Table 2). Although IRF1 siRNA significantly reduced IRF1 expression, we were unable to sufficiently knock down NLRC5 expression by siRNA (Supplementary Figures 2A, B). Therefore, we generated monoclonal NLRC5-/- BEAS-2B cell lines by CRISPR/Cas9. Loss of NLRC5 did not lead to any significant impact to IFNγ-induced MR1 mRNA expression (Figure 4B). We did observe a decrease in HLA-A expression with NLRC5 knockout, although not significant (Figure 4C).
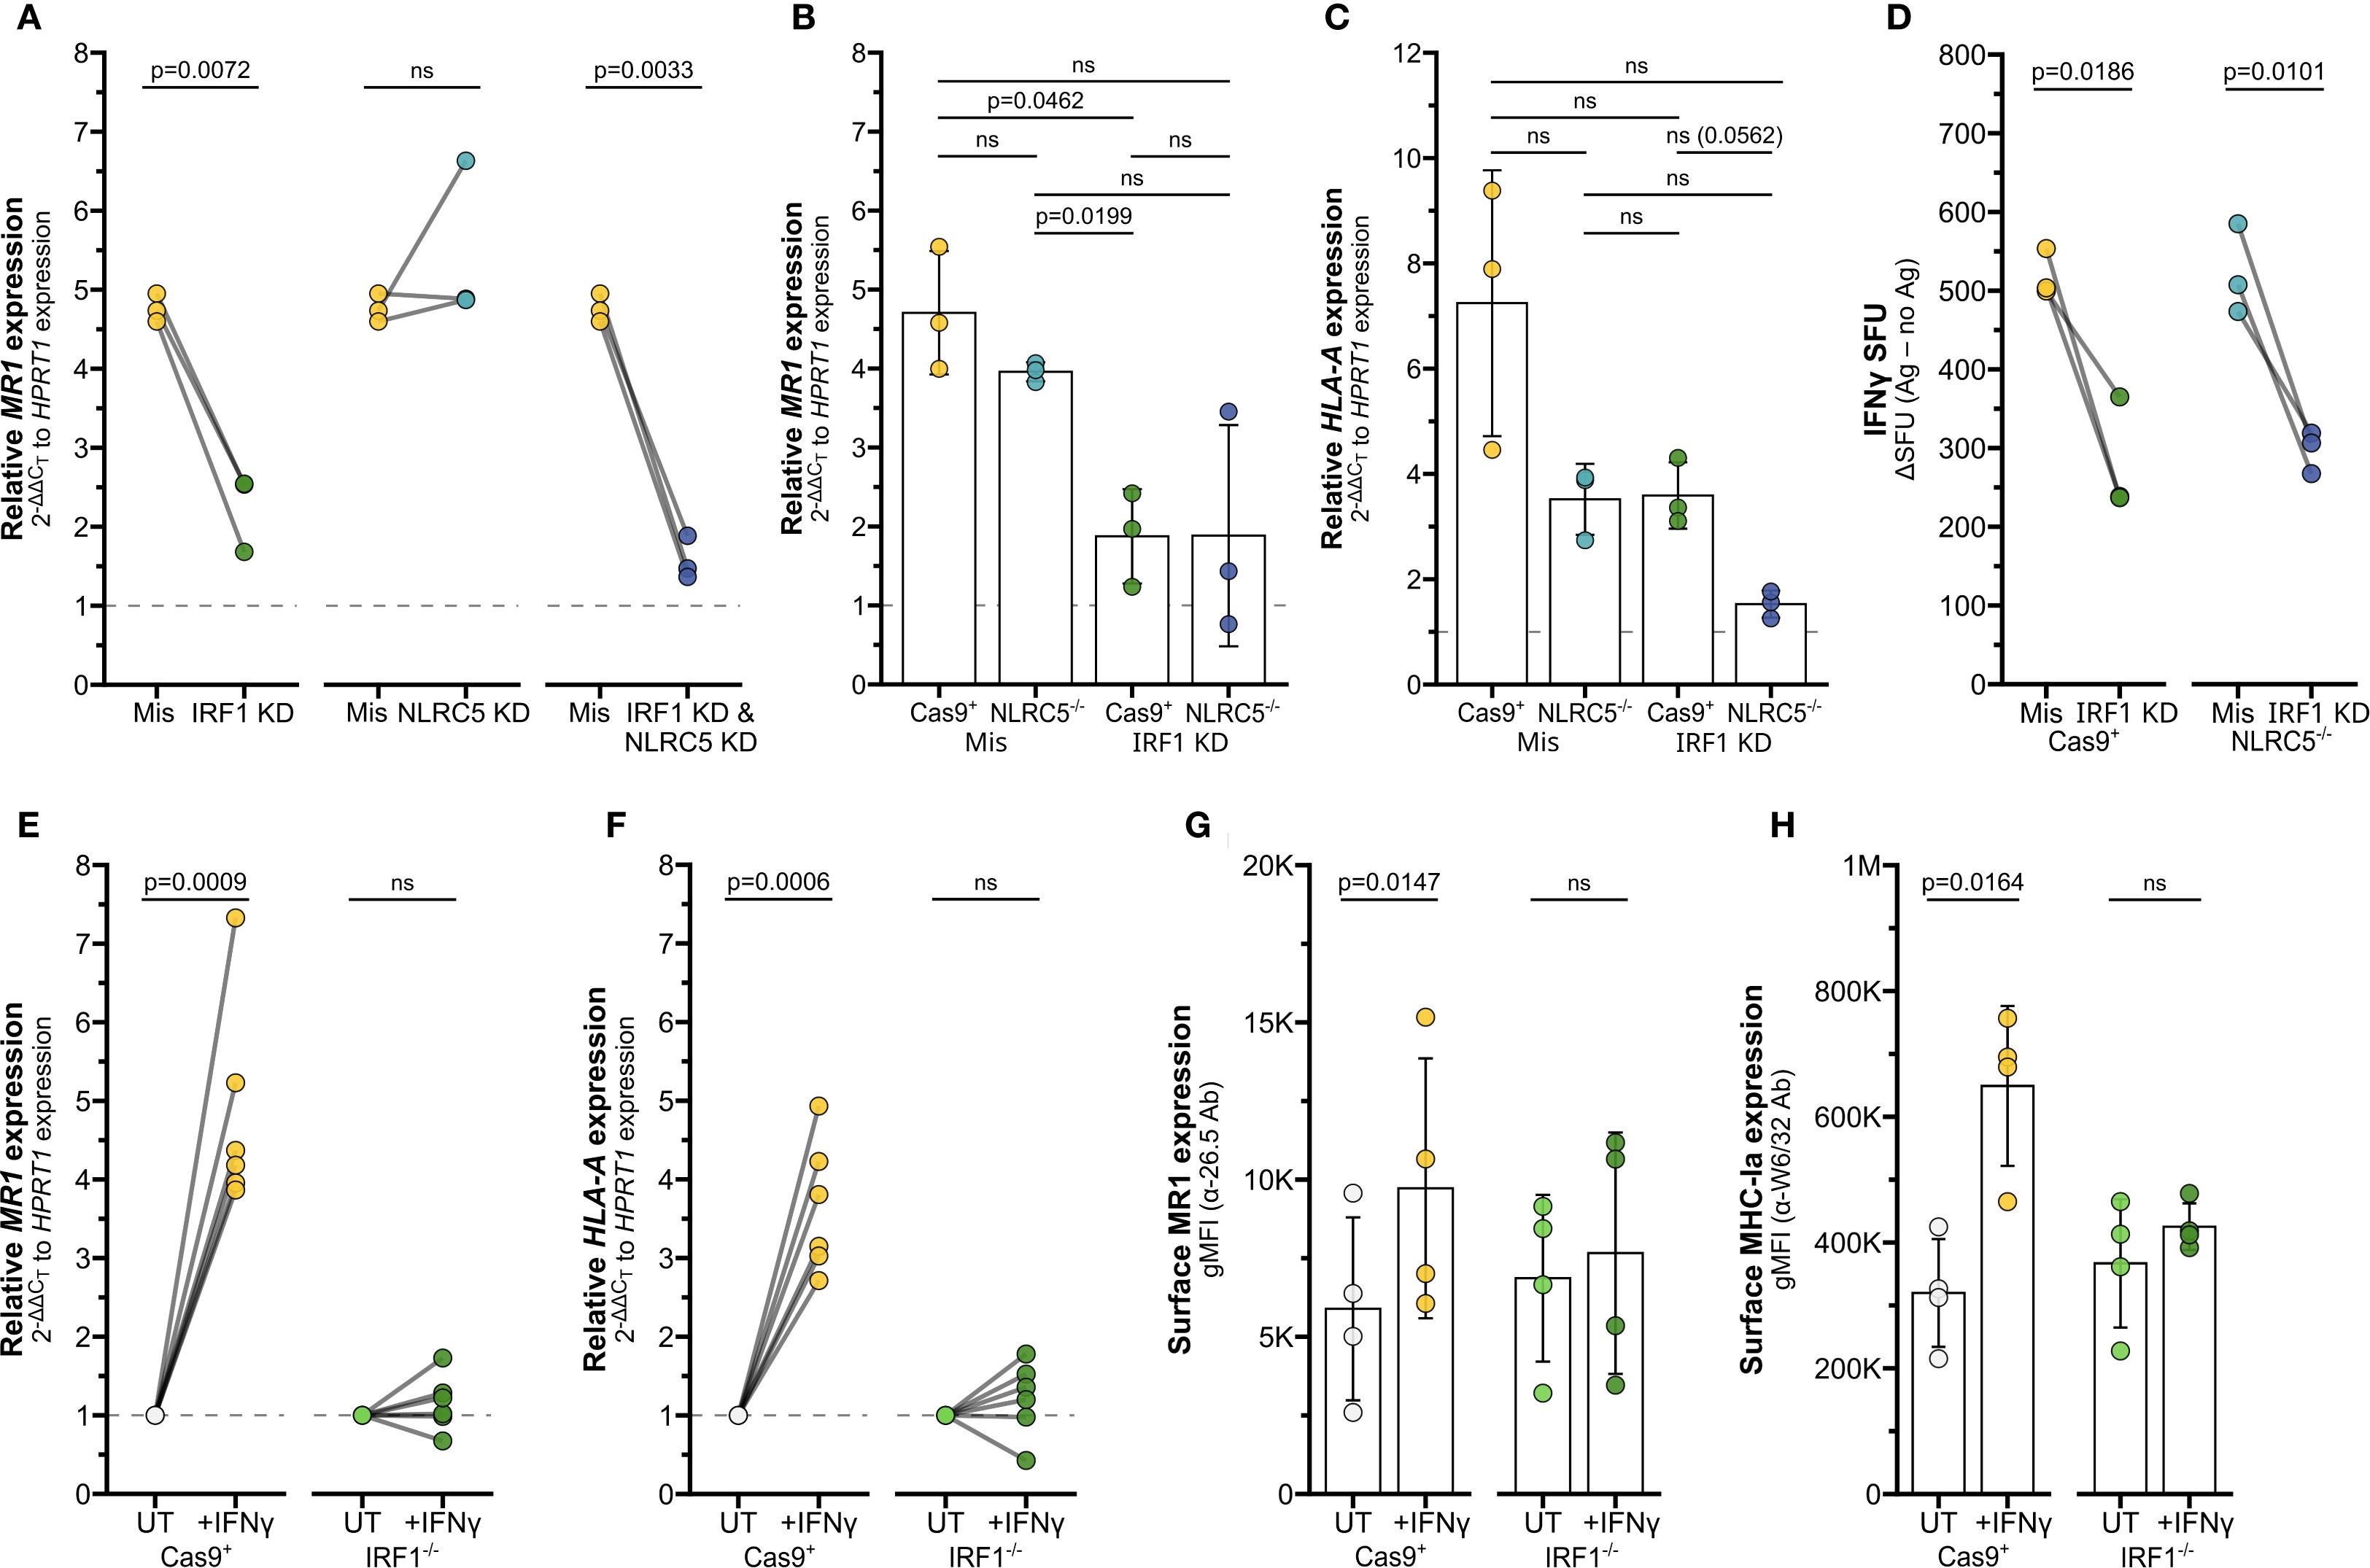
Figure 4. IRF1 mediates IFNγ-induced MR1 transcription. (A) RT-qPCR of BEAS-2B cells treated with IRF1, NLRC5, and/or missense siRNA as labeled for 36 hours, then incubated with IFNγ for 12 hours. MR1 expression was calculated relative to HPRT1 expression and missense UT control, paired by experimental replicate. (B, C) RT-qPCR of Cas9+ or NLRC5-/- clone #1 BEAS-2B cells treated with IRF1 or missense siRNA for 36 hours, then incubated with IFNγ for 12 hours. (B) MR1 and (C) HLA-A expression were calculated relative to HPRT1 expression and Cas9+ or NLRC5-/- clone #1 missense UT controls, paired by experimental replicate. (D) Cells in (B, C) were used as antigen-presenting cells in ELISPOT assay, with filtered M. smegmatis supernatant as the antigen source. Data points are experimental replicates of Cas9+ or NLRC5-/- clone #1 missense control no-antigen background-subtracted IFNγ SFU. Subtracting the background SFU (averages: Cas9+ missense 31.3 SFU, Cas9+ IRF1 KD 18.3 SFU, NLRC5-/- missense 22.0 SFU, NLRC5-/- IRF1 KD 13.9 SFU) did not impact statistical significance. (E, F) RT-qPCR of Cas9+ or IRF1-/- clone #2 BEAS-2B cells treated with IFNγ for 12 hours. (E) MR1 and (F) HLA-A expression were calculated relative to HPRT1 expression and Cas9+ or IRF1-/- clone #2 UT controls, paired by experimental replicate. (G, H) Flow cytometry of Cas9+ or IRF1-/- clone #1 BEAS-2B cells treated with IFNγ for 12 hours. gMFI of (G) surface MR1 (α-26.5 Ab) and (H) MHC-Ia (α-W6/32 Ab) are paired by experimental replicate. Statistical analyses are in Supplementary Table 2. Yellow symbols indicate IFNγ treatment alone. For visual clarity, silencing of IRF1 (green), NLRC5 (teal), or both (dark blue) are also indicated. In (E-H), light green distinguishes media control IRF1-/- cells from IFNγ-treated IRF1-/- cells (dark green). The symbol 'ns' refers to comparisons with p-values < 0.05.
We used siRNA to silence IRF1 expression in the Cas9+ and NLRC5-/- cells (Supplementary Figure 2C). MR1 expression was significantly impacted by IRF1 knockdown in Cas9+ control cells (Figure 4B), agreeing with the previous siRNA results in wildtype BEAS-2b cells. A trend in reduced MR1 expression was also observed in two clones of NLRC5-/- cells treated with IRF1 siRNA (Figure 4B, Supplementary Figure 2D). Expression of surface MR1 proteins in IFNγ-treated cells was similarly decreased with IRF1 silencing and unaffected by NLRC5 knockout (Supplementary Figure 2E). Finally, we used ELISPOT assays to quantify if loss of NLRC5 and/or IRF1 would impact the IFNγ-stimulated boost in MR1 antigen presentation to MAIT cells. IRF1 siRNA knockdown significantly reduced MAIT cell responses to both Cas9+ cells and NLRC5-/- cells (Figure 4D). The missense-treated NLRC5-/- cells stimulated similar MAIT cell activity as the Cas9+ control cells in response to IFNγ (Figure 4D, Supplementary Table 2). Together, these results indicate that IRF1 expression is required for IFNγ stimulation of MR1 expression and antigen presentation function, while NLRC5 does not appear to impact this pathway.
We next used CRISPR/Cas9 knockout to generate monoclonal IRF1-/- BEAS-2B cell lines to confirm this finding. IFNγ-mediated stimulation of MR1 mRNA and MR1 surface expression was impaired in IRF1-/- cells compared to Cas9+ cells (Figures 4E,G, Supplementary Figures 2F, G). Expression of HLA-A mRNA or MHC-Ia surface proteins were likewise impaired in the IRF1-/- cells following IFNγ treatment (Figures 4F,H; Supplementary Figure 2G, right). Together the siRNA knockdown and CRISPR knockout results indicate that IRF1 mediates the IFNγ signaling pathway leading to MR1 transcription, surface expression, and antigen presentation, likely through mechanisms independent of the NLRC5 enhanceosome.
MAIT cells produce sufficient IFNγ to induce MR1 transcription pathways
To validate this mechanism in a physiologically relevant system, we returned to our co-culture experiments. We first demonstrated that co-culture of infected AEC with MAIT cells led to upregulation of IFNγ-stimulated pathways by staining phosphorylated STAT1 (pSTAT1). Ligation of the IFNGR activates Janus kinase (JAK) dimer 1/2, which in turn phosphorylates STAT1 (17, 32). As expected, pSTAT1 staining was significantly increased in AEC infected with S. pneumoniae and co-cultured with MAIT cells, along with AEC treated with recombinant IFNγ (Figures 5A, B, Supplementary Figure 3A, Supplementary Table 3).
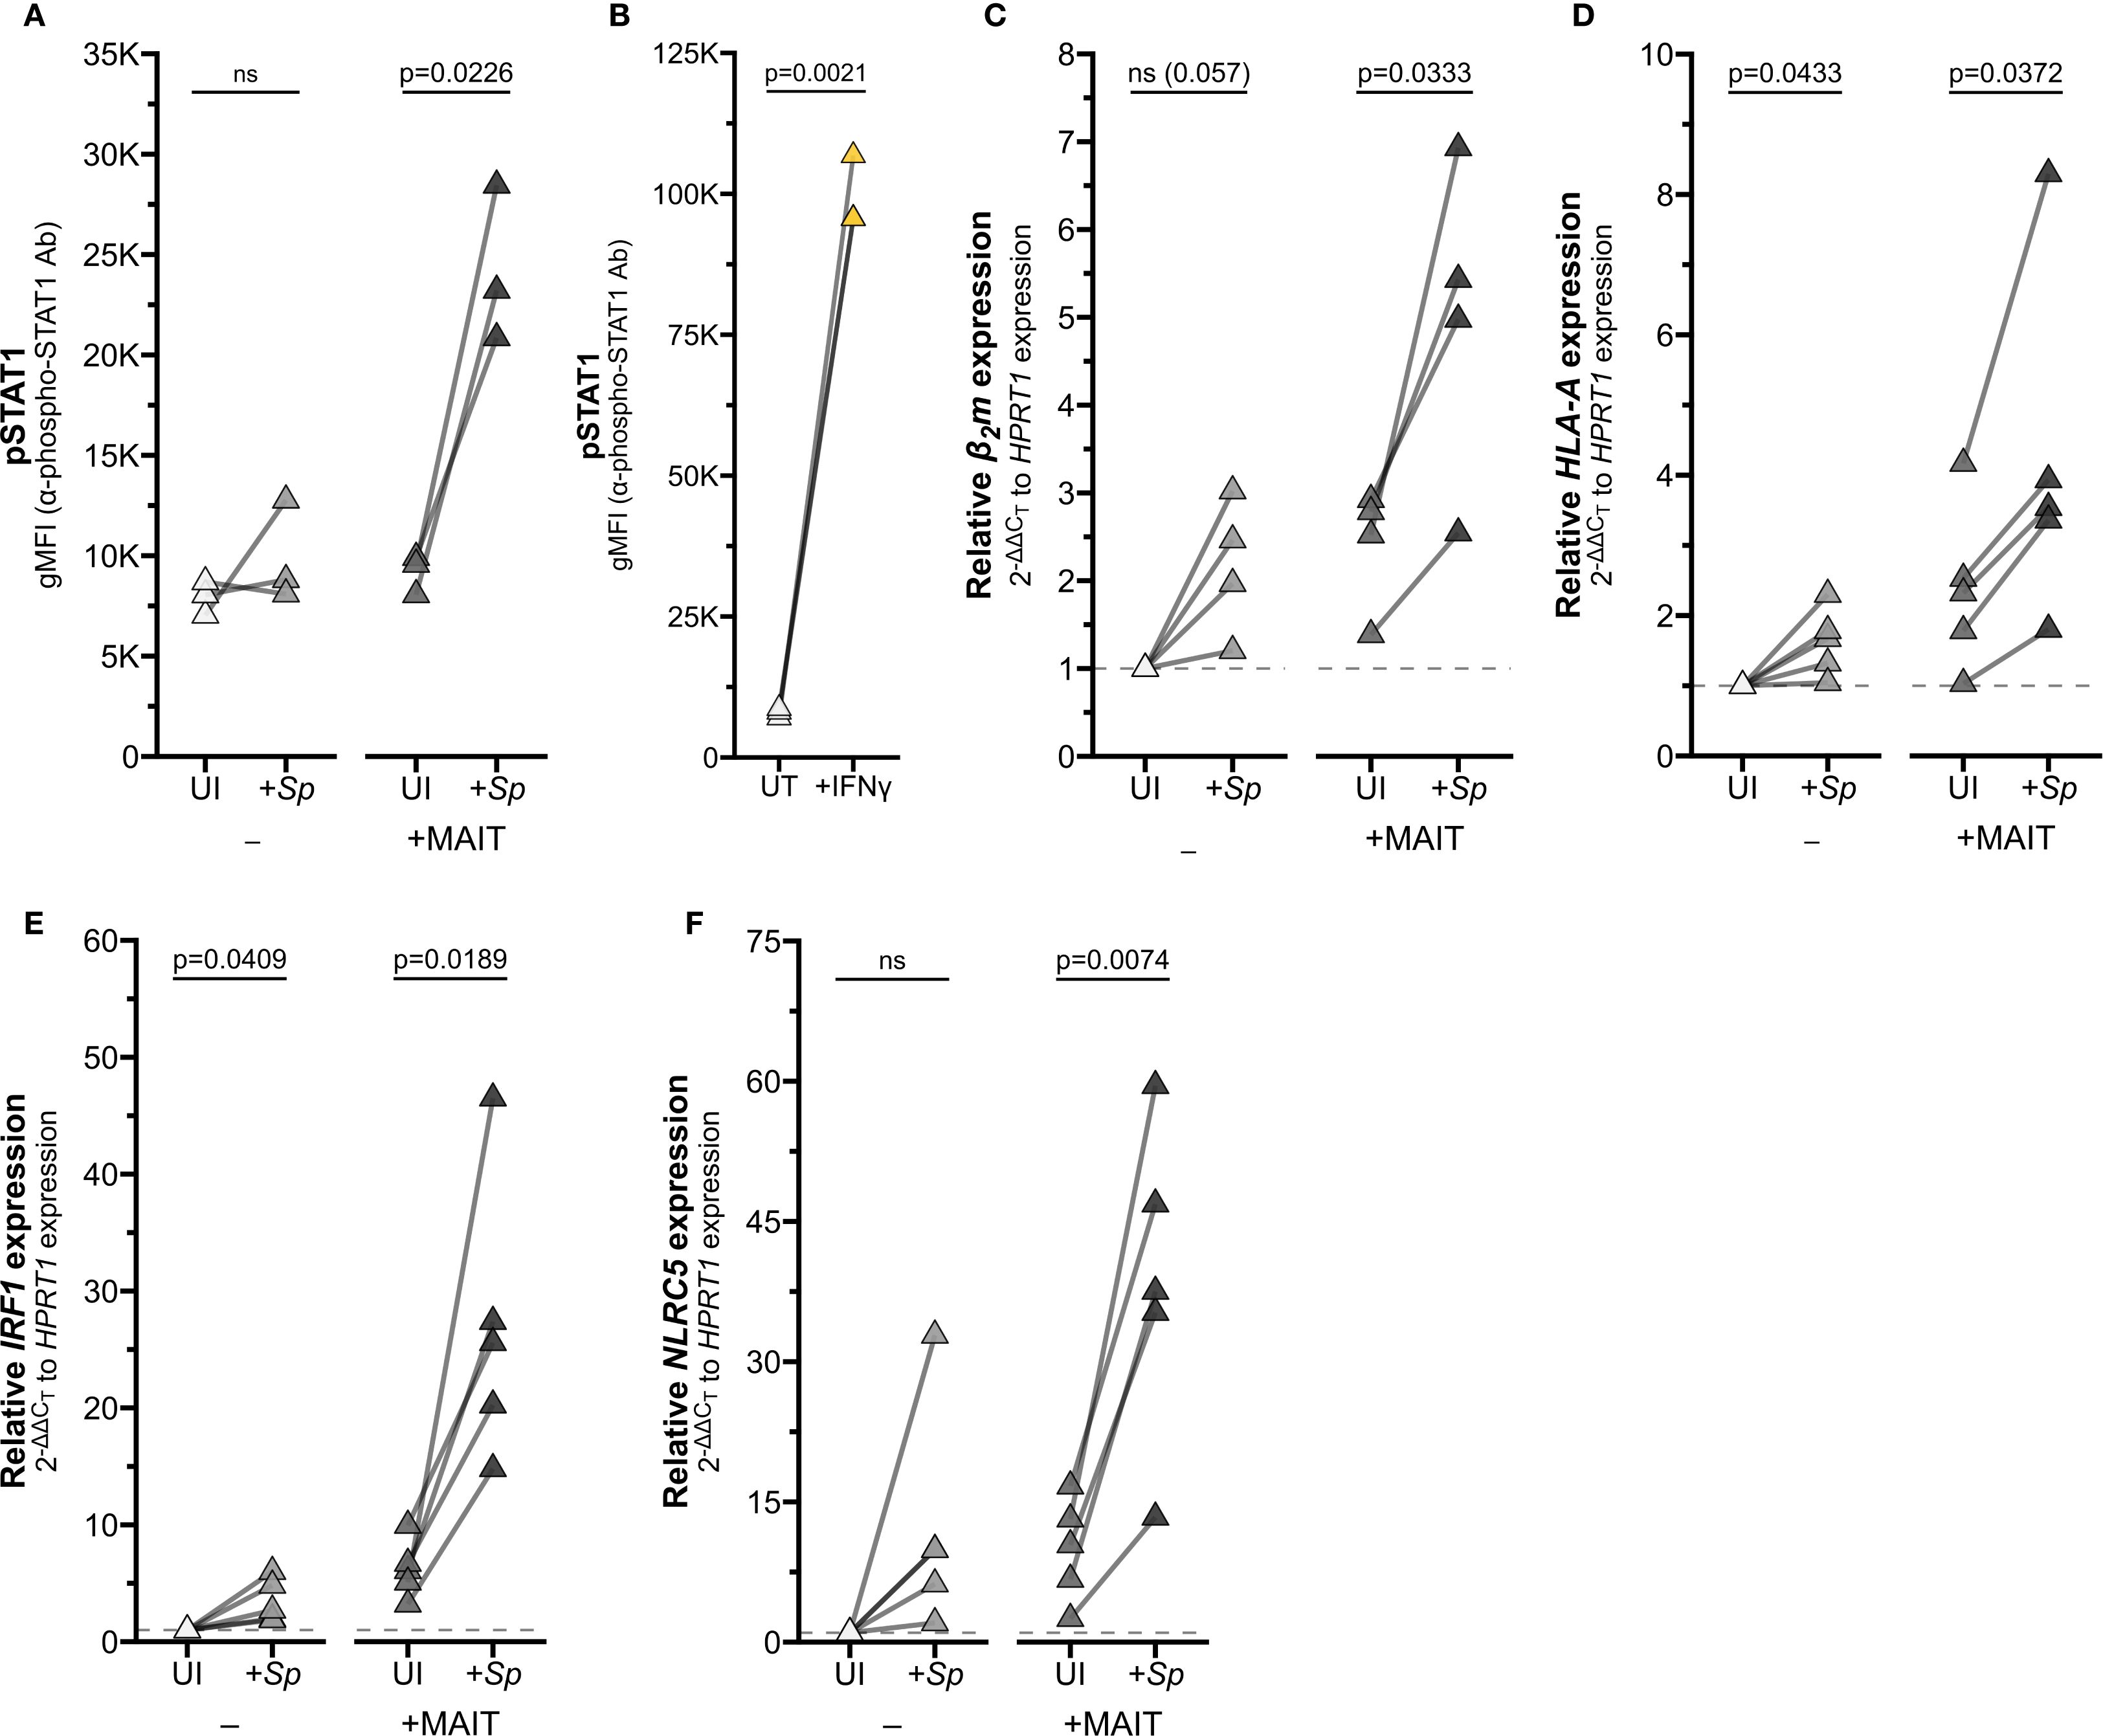
Figure 5. Reciprocal IFNγ signaling in Sp-infected AEC co-cultured with MAIT cells. (A, B) Flow cytometry of (A) primary human AECs infected with S. pneumoniae (Sp) for one hour and incubated overnight with MAIT cell clone (n=3), or (B) AECs treated with IFNγ for 12 hours (n=3). gMFI of stained pSTAT1 expression is paired by individual donor. (C–F) RT-qPCR of primary human AECs infected with S. pneumoniae (Sp) for one hour and incubated overnight with MAIT cell clone. Expression of (C) β2m, (D) HLA-A (E) IRF1, and (F) NLRC5 were calculated relative to HPRT1 expression and UI- control, paired by individual donor (n=4 (C) or n=5 (D–F) donors). Pairwise statistical analyses are in Supplementary Table 3. Yellow symbols indicate IFNγ treatment. The symbol 'ns' refers to comparisons with p-values < 0.05.
To confirm that activation of MAIT cells in co-culture is sufficient to drive IFNγ signaling, we next assessed expression of IFNγ-stimulated genes. Co-culture of Sp-infected primary AEC with MAIT cells significantly induced expression of HLA-A, B2m, IRF1, and NLRC5 (Figures 5C–F; Supplementary Figures 3B–D, G; Supplementary Table 3). We observed increased expression of these genes in AEC incubated with either Sp or MAIT cells alone, which may indicate the contribution of other inflammatory signaling pathways in AEC. However, the combined co-culture induced significantly greater expression for almost all genes, pointing to the role of Ag-induced MAIT cell activation in driving inflammatory gene expression.
BEAS-2B infected with Ms significantly induced expression of HLA-A and IRF1 only in combination with MAIT cell co-culture (Figures 6A, C; Supplementary Figures 3E, H; Supplementary Table 3). We next used 5-OP-RU as the antigen source to confirm that MR1 antigen presentation alone is sufficient to stimulate MAIT cell IFNγ production and subsequent inflammatory gene expression, absent other microbial stimuli. As expected, HLA-A and IRF1 expression were significantly increased in 5-OP-RU-treated BEAS-2B cells when MAIT cells were present, but not stimulated by treatment with 5−OP−RU alone or MAIT cell co-culture with untreated BEAS-2B cells (Figures 6B, D; Supplementary Figures 3F, I; Supplementary Table 3). Non-stimulatory presentation of 6-FP ligands failed to significantly induce either gene alone or in combination with MAIT cells. Together, these results indicate that activated MAIT cells produce sufficient IFNγ to stimulate expression of downstream genes.
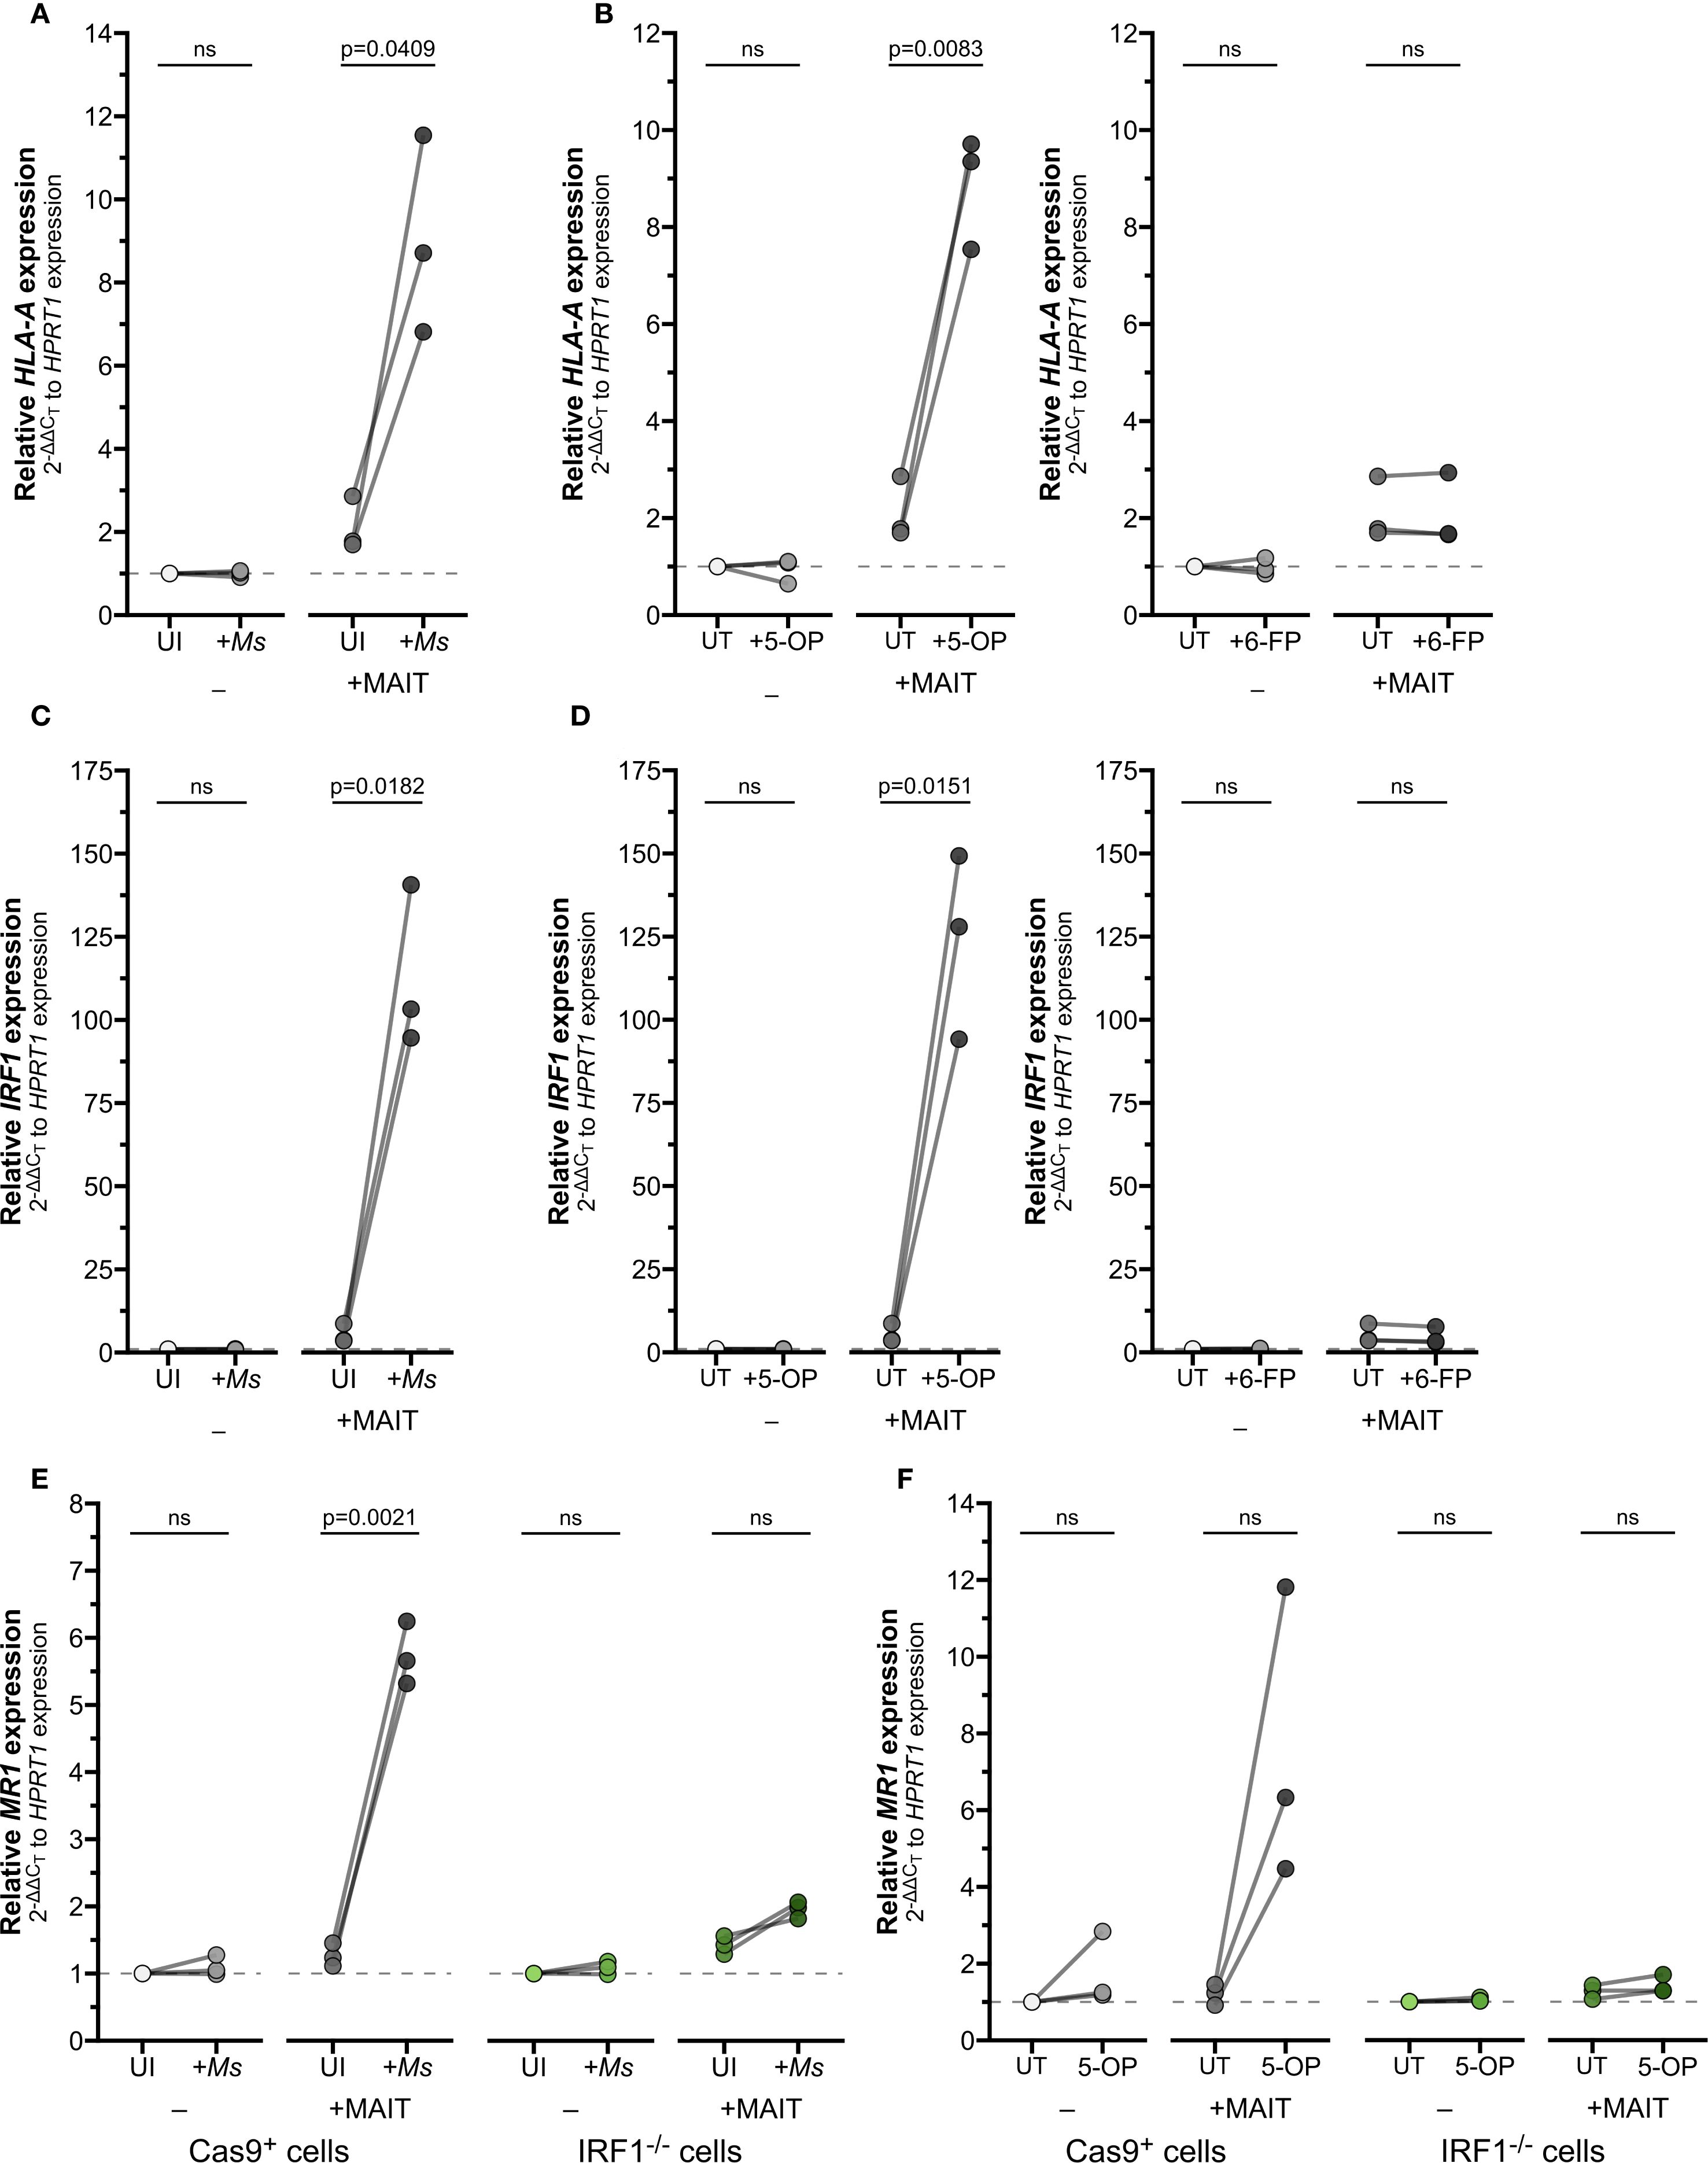
Figure 6. IFNγ produced by activated MAIT cells drives IRF1-dependent MR1 transcription. (A–D) RT-qPCR of wildtype BEAS-2B cells treated as indicated below. Gene expression was calculated relative to HPRT1 expression and UI- or UT- controls, paired by experiment. (A) HLA-A and (C) IRF1 expression of BEAS-2B cells infected with M. smegmatis (Ms) for one hour and incubated overnight with MAIT cell clone. (B) HLA-A and (D) IRF1 expression of BEAS-2B cells treated with 5-OP-RU (left, “5-OP”) or 6-FP (right) for one hour and incubated overnight with MAIT cell clone. (E, F) RT-qPCR of Cas9+ or IRF1-/- clone #1 BEAS-2B cells (E) infected with M. smegmatis or (F) treated with 5-OP-RU for one hour, then incubated overnight with MAIT cell clone. MR1 expression was calculated relative to HPRT1 expression and Cas9+ or IRF1-/- UT- controls, paired by experimental replicate. Pairwise statistical analyses are in Supplementary Table 4. In (E, F), green symbols distinguish IRF1-/- cells from Cas9+ cells (gray) as labeled. The symbol 'ns' refers to comparisons with p-values < 0.05.
Finally, we used our IRF1-/- cells in this co-culture setting to demonstrate the role of IFNγ in mediating MR1 expression, antigen presentation, and MAIT cell activation. IRF1-/- cells infected with Ms and co-cultured with MAIT cells failed to exhibit the increase in MR1 expression seen in the Cas9+ control cells (Figure 6E, Supplementary Table 4). We then used exogenous 5-OP-RU treatment to directly test the role of IRF1 following MR1-dependent MAIT cell activation. MR1 transcription was enhanced in Cas9+ cells with 5-OP-RU and MAIT cell co-culture, confirming that TCR-stimulated MAIT cells directly led to increased MR1 transcription (Figure 6F, Supplementary Table 4). In contrast, the IRF1-/- cells treated with 5-OP-RU did not express greater MR1 transcripts in co-culture, confirming the importance of IRF1 in this pathway.
IFNγ and IFNβ stimulate MR1 transcription by distinct mechanisms
Our data have shown thus far that IFNγ stimulates MR1 transcription; however other inflammatory cytokines can also induce transcription. Type I interferons like IFNβ stimulate IRF1 and NLRC5 to induce MHC-Ia transcription (15–19, 33, 34). Activated MAIT cells may also produce TNFα and IL-17, which have been demonstrated to stimulate transcription of inflammatory genes including IRF1 and HLA-A (35–37). To assess whether the IFNγ-induced increase in MR1 transcription is representative of general inflammatory signaling mechanisms or specific to IFNγ stimulus, we treated BEAS-2B cells with recombinant human inflammatory cytokines IFNβ, IFNγ, IFNλ, TNFα, and IL-17. Of these cytokines, only IFNβ and IFNγ elicited a significant increase in MR1 transcription compared to untreated controls (Figures 7A, B, Supplementary Table 5).
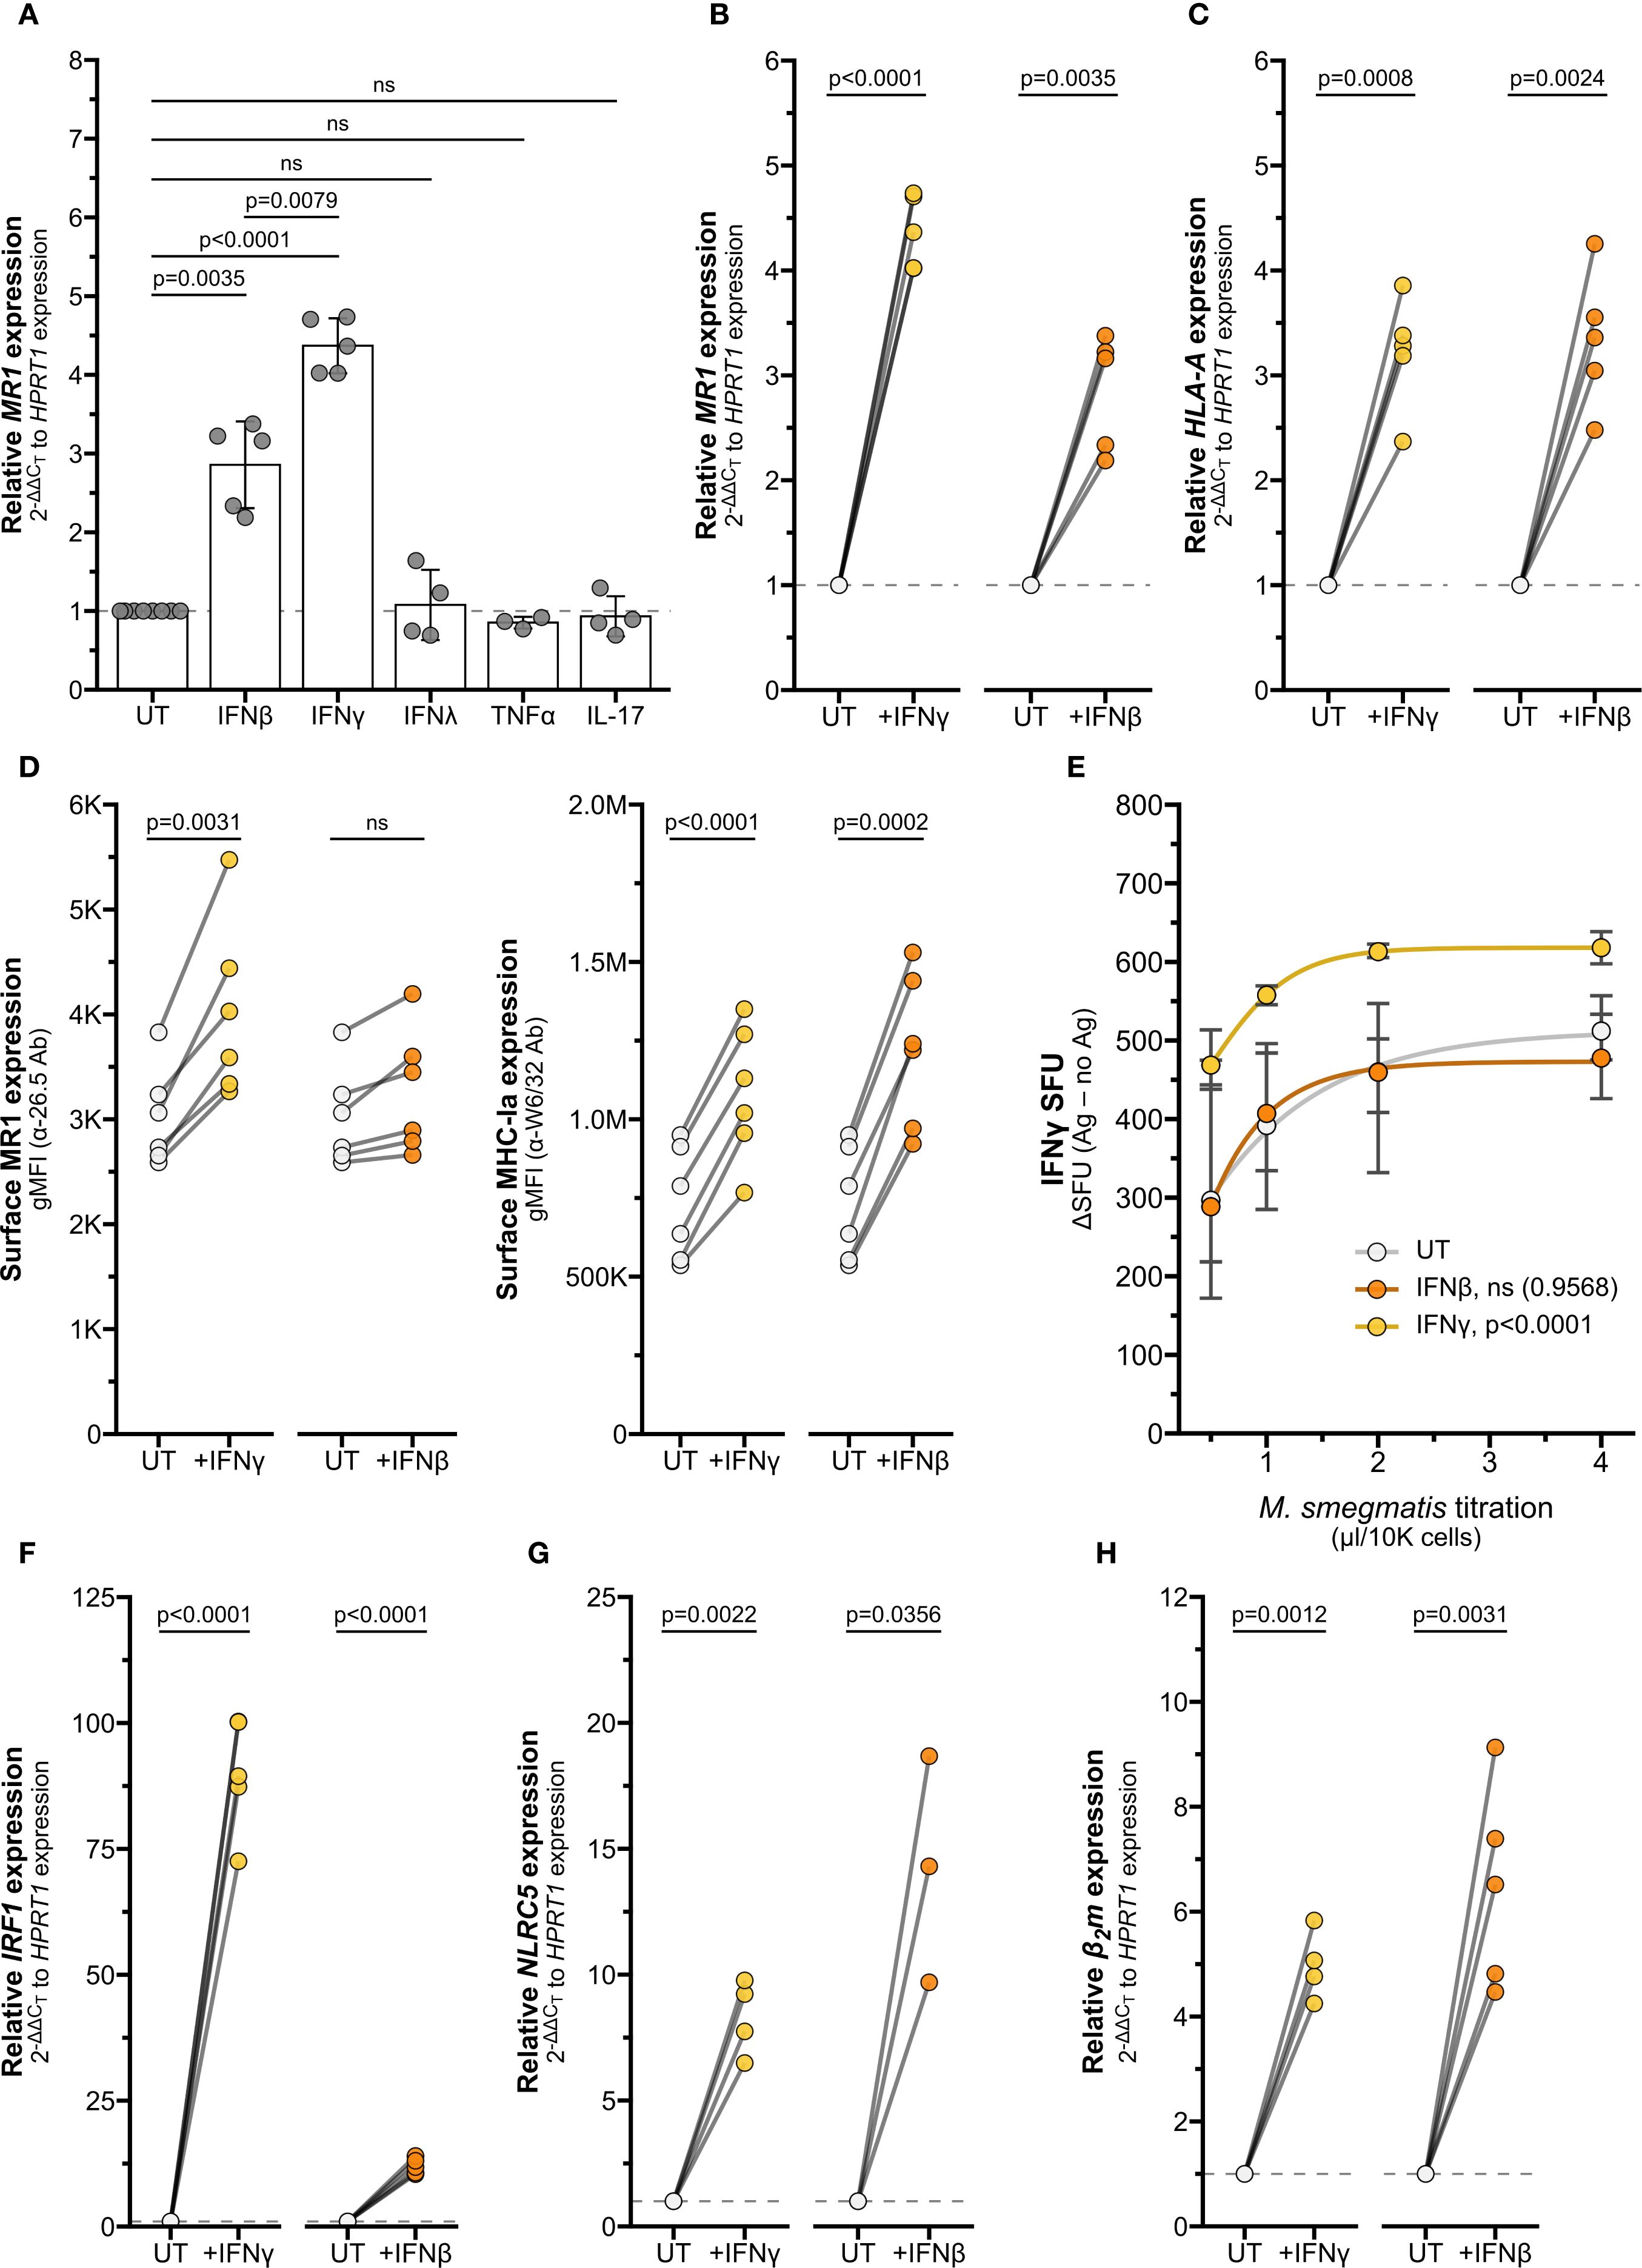
Figure 7. Interferons stimulate MR1 and MHC-Ia transcription through different pathways. (A) RT-qPCR of wildtype BEAS-2B cells treated with recombinant human cytokines for 12 hours. MR1 expression was calculated relative to HPRT1 expression and UT controls. (B, C, F–H) RT-qPCR of BEAS-2B cells treated with IFNγ or IFNβ for 12 hours. Expression of (B) MR1, (C) HLA-A (F) IRF1, (G) NLRC5, and (H) β2m were calculated relative to HPRT1 and UT control, paired by experiment. (D) Flow cytometry of BEAS-2B cells treated with IFNγ or IFNβ for 12 hours. gMFI of surface MR1 (left, α-26.5 Ab) and MHC-Ia (right, α-W6/32 Ab) are paired by experimental replicate. (E) ELISPOT of BEAS-2B cells treated with IFNγ or IFNβ for 12 hours, infected with a titration of M. smegmatis for one hour, then incubated with MAIT cells overnight. Data points are average SFU of no-antigen background-subtracted IFNγ SFU. Nonlinear regression agonist response curves were computed in GraphPad Prism 10.4.0 and analyzed with extra sum-of-squares F test to compare with UT control. Statistical analyses are in Supplementary Table 5. Yellow symbols indicate IFNγ treatment, orange symbols indicate IFNβ treatment, and white symbols indicate UT controls. The symbol 'ns' refers to comparisons with p-values < 0.05.
Interestingly, the IFNγ-mediated increase in MR1 expression was significantly greater than the increase due to IFNβ treatment, while expression of HLA-A and B2m were similarly induced by both IFNγ and IFNβ treatment (Figures 7A–C, Supplementary Figure 4, Supplementary Table 5). We further investigated the role of type I and II IFNs in mediating expression of MR1 and MHC-Ia. While both IFNβ and IFNγ increased surface expression of MHC-Ia, only IFNγ led to a significant increase in surface MR1 protein expression (Figure 7D). BEAS-2B cells pre-treated with IFNγ induced significantly greater MAIT cell responses to Ms infection than control UT cells, while IFNβ pre-treatment did not generate a significantly different dose-response curve (Figure 7E). These data indicate that IFNγ plays the largest role in stimulating MR1 expression and function.
We quantified IRF1 and NLRC5 transcripts to further explore how MR1 and MHC-I expression are differentially stimulated by IFNβ and IFNγ. Although both IFNγ and IFNβ increased IRF1 expression, the relative fold change was significantly greater with IFNγ than IFNβ (Figure 7F, Supplementary Figure 4, Supplementary Table 5). Both interferons induced significant increases in NLRC5 and B2m expression (Figures 7G, H, Supplementary Figure 4, Supplementary Table 5). In light of our finding that IFNγ stimulates MR1 transcription through IRF1 and not NLRC5, this magnitude of IRF1 induction may relate to the specific induction of MR1 surface expression and antigen presentation by IFNγ and not IFNβ. Further, these results indicate that transcription of MR1 and HLAA occur via distinct IFNγ-stimulated mechanisms.
Together, our data support a feed-forward model of inflammatory signaling (Figure 8). MR1 antigen presentation by an infected cell activates a MAIT cell to release IFNγ, which then acts on the airway epithelial cell to stimulate IRF1 expression through a pSTAT1 pathway. IRF1 then binds to the MR1 promoter to induce MR1 transcription, leading to more MR1 protein available for antigen presentation and subsequent MAIT cell activation.
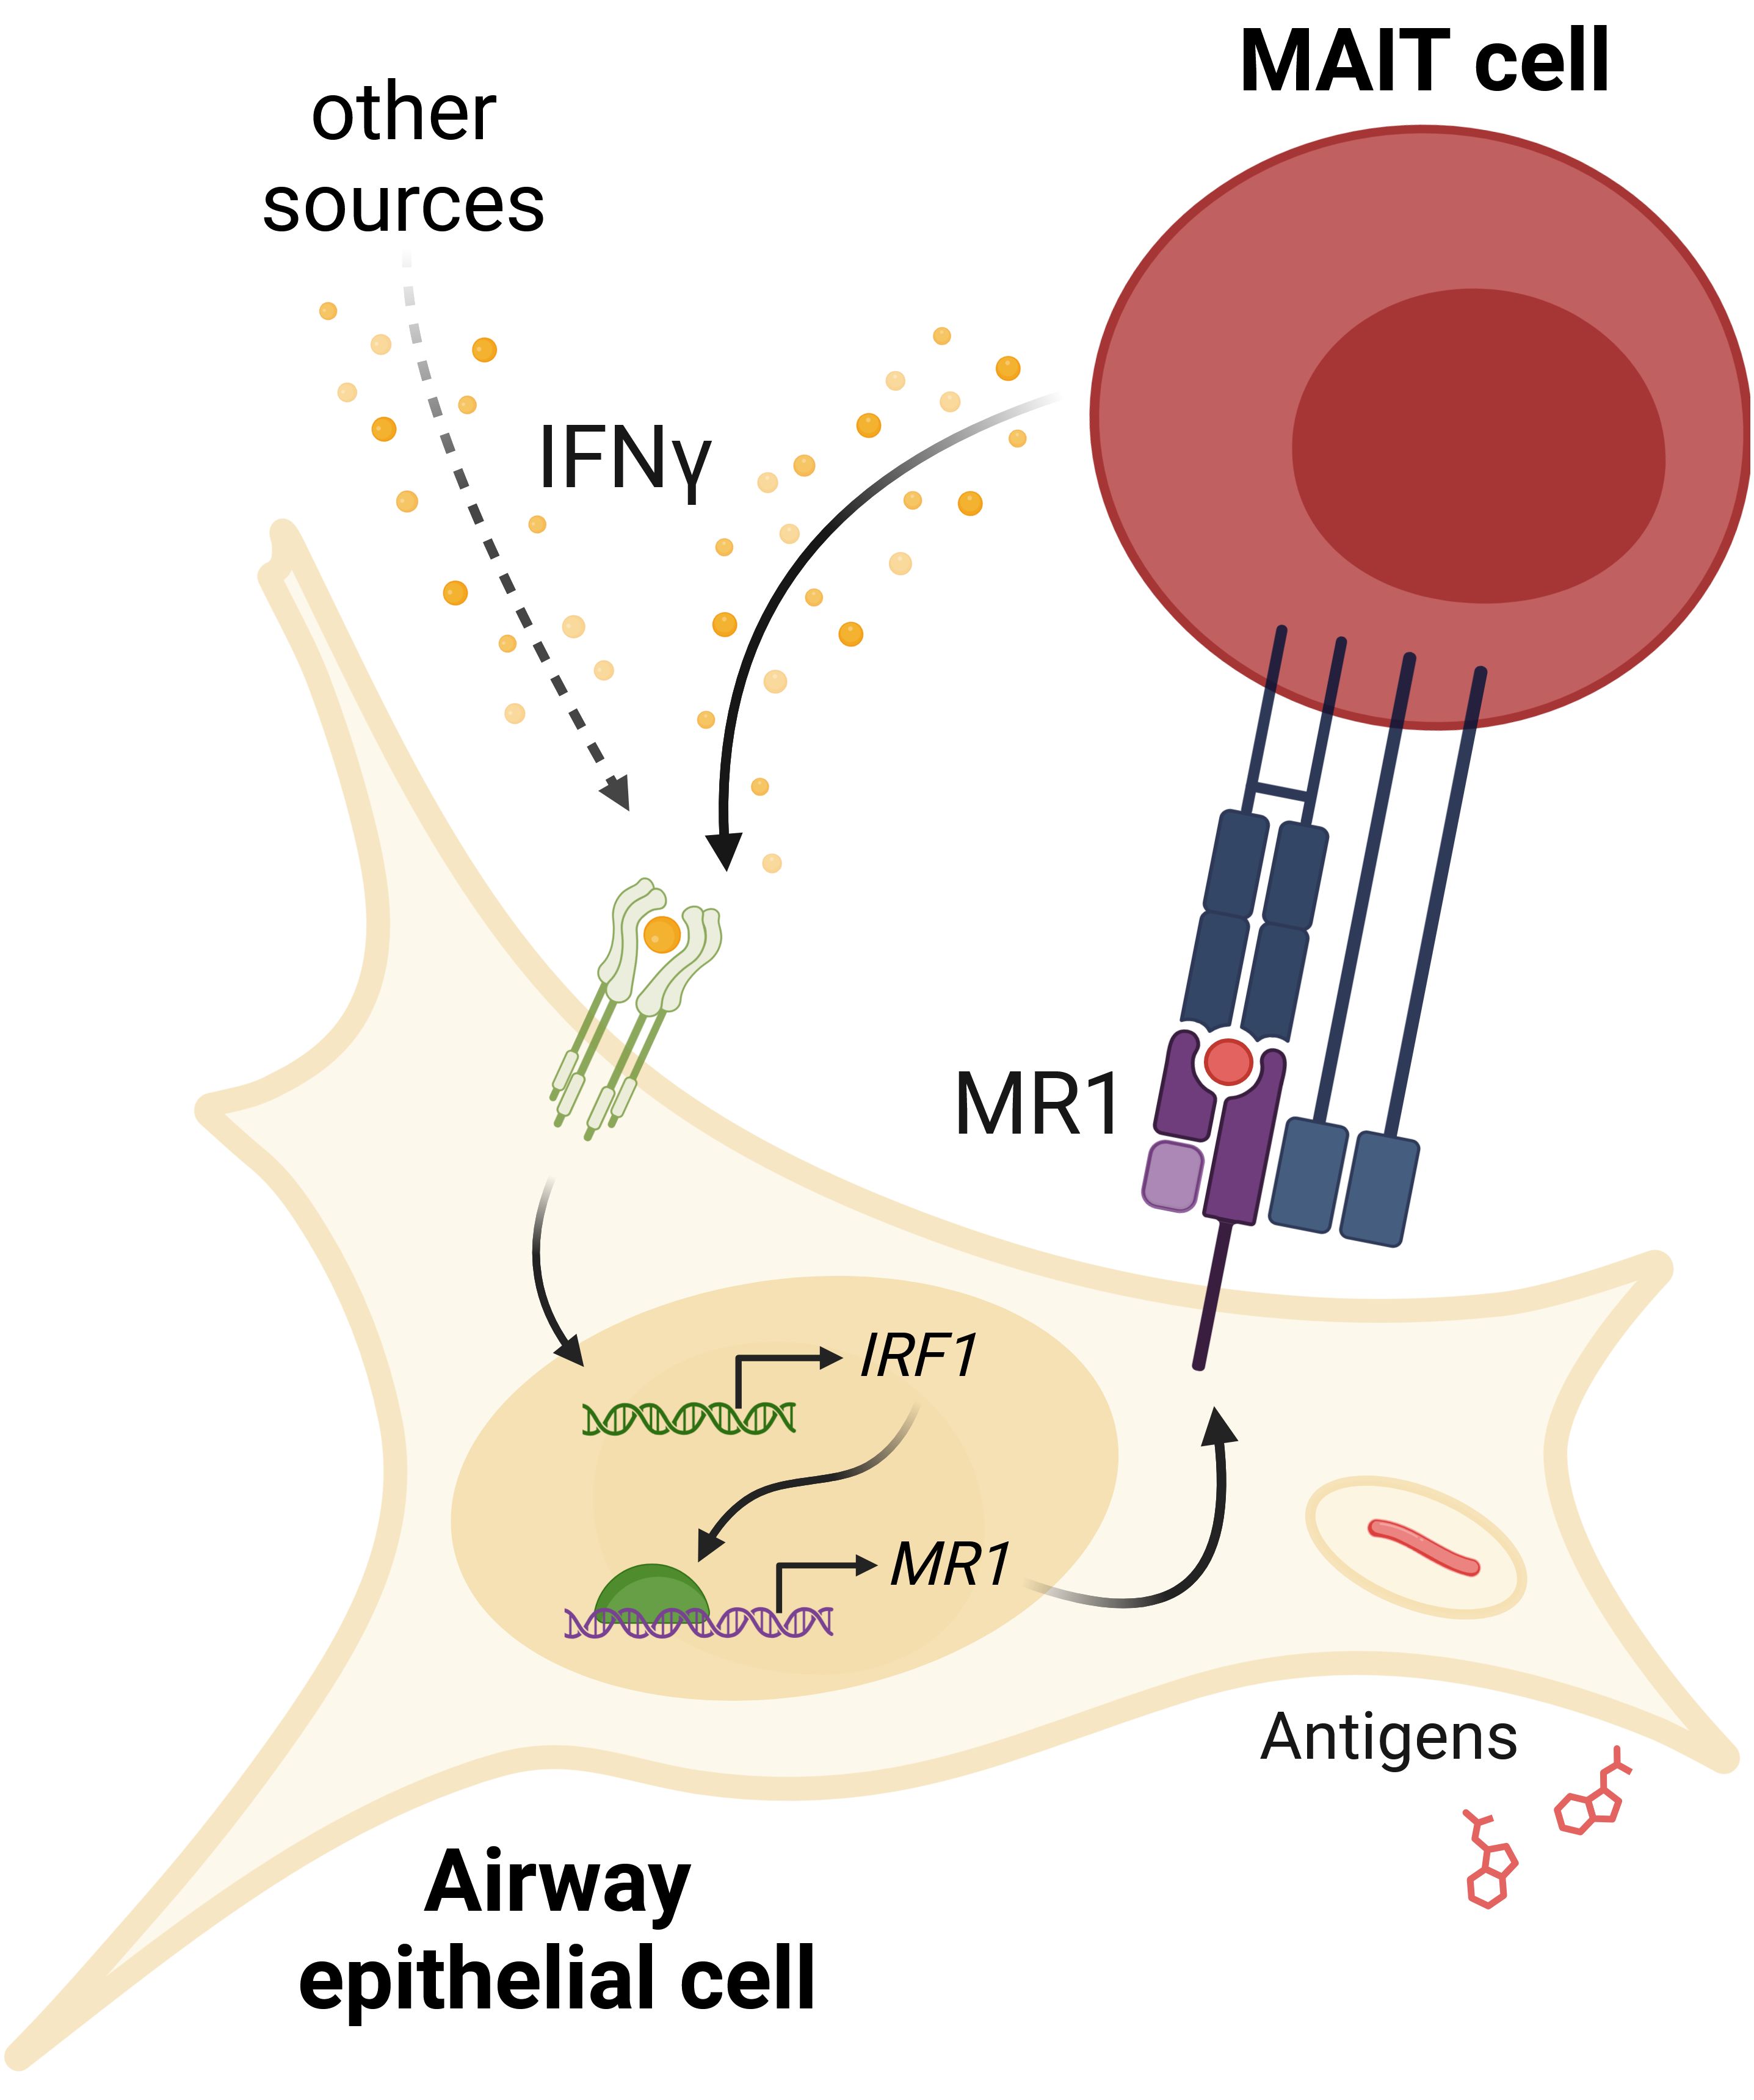
Figure 8. IFNγ signaling induces MR1 expression and MAIT cell activation. IFNγ from MAIT cells or other cellular sources induces IRF1 expression and subsequent increase in MR1 transcription. Increased MR1 expression and antigen presentation enhances MAIT cell responses to antigens from exogenous sources or pathogens like S. pneumoniae or M. smegmatis.
Discussion
MAIT cells are key components of early infection responses. The variety of pathogens producing MR1 antigens and rapid MAIT cell effector function poise MAIT cells to bridge innate and adaptive immune responses. Strict regulation of MAIT cell activation is required to prevent inflammatory damage. Research over the past decade has defined many complementary pathways regulating MR1 intracellular localization, antigen binding, surface translocation, and protein recycling (12–14). These studies affirm that defining the mechanisms that regulate MR1 is critical to understanding regulation of MAIT cells themselves. Only recently have we begun to appreciate the role of epigenetic regulation in controlling MR1 expression and antigen presentation. Studies of MR1 DNA methylation and RNA expression suggest that MR1 transcription is increased during infection (38–41), although effector molecules from herpes simplex viruses were shown to degrade MR1 transcripts (42–44). Altered epigenetic regulation of MR1 in respiratory inflammation (22–24, 45) and cancer (21, 46) illustrate the complex interplay of activation and repression signals in these diseases.
Here, we demonstrate for the first time that IFNγ stimulates MR1 transcription. We investigated the role of two IFNγ-stimulated transcription factors, IRF1 and NLRC5, in regulating MR1 transcription. In-silico analysis of the MR1 promoter revealed potential binding sites for IRF1 and components of the NLRC5 enhanceosome (18, 19). Using both siRNA knockdown and CRISPR/Cas9 knockout systems, we observed that IFNγ-induced MR1 transcription was dependent on IRF1, but not NLRC5. Treatment with IFNγ failed to increase MR1 surface expression and antigen presentation in IRF1-/- cells. These results pointed to IRF1 as the primary driver of IFNγ-induced MR1 transcription in our experimental conditions. The rapid increase in IRF1 expression after IFNγ treatment is consistent with established models of IRF1 kinetics (18, 47). Recently, Rosain and colleagues performed a comprehensive characterization of two young patients with IRF1-inactivating mutations (48). MR1 was among the genes upregulated in primary fibroblasts from healthy controls after 8 hours of IFNγ treatment, while MR1 was not upregulated in IFNγ-treated fibroblasts with IRF1-inactivation, STAT1-deficiency, or loss of IFNGR1/2 (48). Our co-culture experiments showed that antigen-activated MAIT cells produced sufficient IFNγ to induce IRF1 expression in both primary AEC and BEAS-2B cells. In similar conditions with Ms infection or 5-OP-RU treatment and MAIT cell co-culture, IRF1-/- cells failed to replicate the increase in MR1 mRNA expression seen with control Cas9+ cells. We therefore concluded that MAIT cell activation acts through IRF1 to promote MR1 transcription. The case study of IRF1-deficient patients observed only slightly lower blood MAIT cell frequencies in one individual (48). However, both experienced persistent early childhood infections from weakly-infectious Mycobacterium avium and/or breakthrough infection from the BCG vaccine, consistent with impaired IFNγ immunity (48). Although many factors may contribute to reduced immune function in these individuals, MAIT cells have been tightly linked to anti-mycobacterial immunity (49, 50). A case study of a T-bet-deficient individual with very low MAIT cells underscored the specific importance of IFNγ production by innate-like lymphocytes in controlling Mtb infection (51). It is therefore possible that loss of IRF1 function could foster mycobacterial susceptibility through weaker induction of MR1 transcription and delayed MAIT cell responses. Directly characterizing the dynamics of MR1 expression in these individuals would shed light on this hypothesis.
We were surprised to observe that NLRC5 was not required for the IFNγ-induced increase in MR1 expression or antigen presentation, given the importance of NLRC5 in mediating HLA transcription (15, 16, 19). Although MR1 is an MHC-I-like molecule and they share broad structural homology, the genes reside on different chromosomes and have distinct promoter features (7). We confirmed that HLA-A expression was reduced in NLRC5-/- cells. Since IRF1 can also induce NLRC5 transcription, we considered whether IRF1 and NLRC5 play a synergistic role in regulating MR1 expression. While the combined loss of IRF1 and NLRC5 reduces Class I mRNA expression, we saw no further impact to MR1 expression or antigen presentation. These results prompted us to explore how MHC-Ia and MR1 transcription signaling pathways diverge. Both type I and type II IFNs are known to stimulate expression of IRF1 and MHC-Ia (15–18, 33, 34). We explored whether IFNβ might induce MR1 transcription similarly to IFNγ. Although both interferons increased MR1 mRNA expression, IFNγ stimulated a significantly greater increase in MR1 transcription than IFNβ. Furthermore, only IFNγ induced MR1 surface protein expression and antigen presentation to MAIT cells. Previously, Ussher et al. demonstrated that MAIT cell responses to fixed intact E. coli were significantly increased when THP1 cells were incubated with either IFNα or IFNγ overnight (52). This type I IFN increase does not match our results. However, several other groups observed that directly stimulating MAIT cells with IFNβ or IFNα led to increased TCR-dependent and -independent MAIT cell responses to influenza virus and Klebsiella pneumoniae infection (53–55). Therefore, type I interferon-induced signaling within MAIT cells may be the primary driver of the observed increase in MAIT cell responses (52). Type III interferons signal through similar pathways as type I interferons and are critical to some mucosal inflammatory responses (56). We failed to measure any notable increase in MR1 or HLA-A expression following IFNλ treatment. We observed significant increases in IRF1 and β2m expression with IFNλ; however, these increases were significantly weaker than any IFNγ- or IFNβ-induced IRF1 or β2m expression. This result is consistent with research from Forero et al., who found that IFNλ primarily induces tissue repair pathways and fails to stimulate IRF1 expression (57, 58).
Others have shown that IFNγ, not IFNβ, is the primary driver of IRF1 expression (48). We quantified the relative increase in IRF1 transcripts following stimulation by IFNγ or IFNβ and likewise observed the increase in IRF1 expression was significantly higher with IFNγ compared to IFNβ. In contrast, both interferons led to similar ranges of NLRC5 expression. One possible model of this data suggests that IFNγ signaling induces sufficient IRF1 expression to promote MR1 transcription. IFNβ induces less IRF1 transcription, leading to expression of NLRC5, MHC-Ia, and β2m, but not enough to stimulate MR1 expression and function. It is tempting to speculate that the specificity of MR1 stimulation by IFNγ may help to compartmentalize immune responses to innate signaling and prevent simultaneous overstimulation of both MHC-Ia and MR1.
We also observed a slight increase in IRF1 expression following TNFα treatment, yet no increase in HLAA, β2m, or MR1 expression. It was surprising that TNFα did not stimulate any significant increase in IRF1-induced genes. The TNF receptor-associated factor 6 (TRAF6) works with cellular inhibitor of apoptosis 2 (cIAP2) to K63 ubiquitinate IRF1, leading to increased function and blocking K48 ubiquitin-mediated IRF1 proteasomal degradation (18, 47, 59–63). This process, however, functions in concert with Src-family kinases following TLR4, TLR7/9, or IL-1 signaling (18, 47, 61–65). It is possible that this signaling occurred in our experimental condition with primary AEC infected with TLR4 ligand-producing S. pneumoniae, since we observed increases in IRF1 and HLA-A expression with or without MAIT cells. However, we also observed IRF1-dependent MR1 expression following 5-OP-RU-induced MAIT cell activation, in which circumstance TLR signaling was likely inactive. Exploring the role of innate sensors and non-interferon cytokines in modulating IRF1 activity may reveal additional factors that can induce or repress MR1 expression.
In co-culture settings, IFNγ-stimulated increases in MR1 expression resulted in greater MR1 antigen presentation and subsequent MAIT cell activation. MAIT cells activated by MR1 antigen presentation produced sufficient IFNγ to promote MR1 transcription and increased MR1 surface expression. This feed-forward signaling model would support the function of MAIT cells in immune surveillance and early infection response. Robust stimulation of MR1-dependent MAIT cell activation could be beneficial during infection onset, allowing minimal antigen stimulus to generate expansive and rapid proinflammatory activity. MAIT cell effector functions are well-established in priming myeloid cells and recruiting CD4+ and CD8+ T cells (66, 67). In addition to MAIT cells, a number of other cells could produce IFNγ and initiate this feed-forward loop. Local IFNγ production by professional antigen-presenting cells has been observed in infection contexts; for example, alveolar macrophages produce IFNγ during M. tuberculosis infection (68, 69). NK cells, ILC, airway-resident lymphocytes, and circulating lymphocytes are also known to make IFNγ in response to a variety of inflammatory stimuli as well (70, 71). Beyond cytokine signaling, TLRs and C-type lectin receptors can also stimulate expression of IRF1 and IRF1-inducible genes, suggesting that IRF1 inflammation could be mediated in response to non-interferon stimuli (72). Lepore et al. found that tumor cell self-antigens were presented by MR1 to non-MAIT MR1-restricted T (MR1T) cells (73, 74). In this context, MR1T cell activation could induce MR1 expression and stimulate immune responses despite the absence of TLR ligands or other foreign molecules. IFNγ and IRF1 signaling through any of these sources could stimulate MR1 expression and activate MAIT cells, leading to enhanced inflammatory responses.
However, dysregulation of this feed-forward loop could also lead to MAIT cell-caused pathology. Inappropriate MAIT cell activation is implicated in autoimmune diseases and chronic inflammation (75, 76). Overproduction of IFNγ contributes to inflammatory lung damage and can stimulate further IFNγ production by alveolar macrophages (68, 77–79). CD8+ T cell infiltration is associated with increased disease severity in chronic obstructive pulmonary disease (COPD), and IFNγ signaling is increased in the lungs of COPD patients (79–82). MR1 transcriptional expression was increased in AEC (22) and PBMC (24) from infected COPD donors. It is possible that the increased IFNγ present in the COPD airway environment could stimulate MR1 expression and lead to increased MAIT cell activity via the proposed feed-forward signaling loop. IFNγ signaling in response to inappropriate stimuli (e.g. antigens from commensal microbes) could also induce MR1 transcription and promote ligand-driven MAIT cell inflammatory pathology.
Given the potential for inflammatory damage due to this feed-forward loop, we hypothesize that a dampening mechanism exists to turn off this pathway. Constantin et al. revealed a potential role for ERK1/2 kinases in suppressing MR1 expression in melanoma, indicating repression mechanisms can modulate MR1 transcription (46). Specifically, they found the transcription factor ELF1 binds to the MR1 promoter to stimulate MR1 expression. ERK1/2, members of the MAPK/MEK signaling cascade, inhibited ELF1 function and subsequent MR1 transcription. The authors suggested ELF1 inhibition may occur through post-translational modification performed by a downstream intermediary protein (46). Signaling through MEK/ERK was recently demonstrated to inhibit IRF1 expression and activity in TLR-stimulated macrophages; however, ELF1 mediates antiviral activity in airway epithelial cells independent of interferon and IRF1 transcriptional activity (83, 84). Multiple distinct mechanisms of MR1 transcriptional activation could serve several functions: flexible induction of MR1 expression and function in the context of distinct stimuli, complementary activation to rapidly enhance MAIT cell responses, and/or as a checkpoint requiring a secondary signal to prevent overactivation. It is well-documented that pathogens target IFNγ signaling and MHC transcription mechanisms to evade immune recognition (34, 85, 86). Several MHC-Ia post-transcriptional repression mechanisms have been identified, including through IRF1 degradation or downregulation of NLRC5 expression (16, 87, 88). In human fibroblasts, MR1 transcripts were degraded by an RNase protein from herpes simplex virus types 1 and 2, although this mechanism was not specific to MR1 (42, 43). A greater understanding of how MR1 transcription is regulated could shed light on these host-pathogen dynamics.
Put together, this work demonstrates that IFNγ signaling stimulates MR1 transcription, surface expression, and antigen presentation. While we limited our study to airway epithelial cells infected with respiratory pathogens, our model of IFNγ-induced MR1 transcription may raises intriguing questions outside of this context. Given the variety in baseline MR1 expression across cell types and tissues (89, 90), exploration of this pathway in additional cells could shed light on MR1 function within these organs. Furthermore, MAIT cells and MR1T cells play key roles in cancer responses and tissue repair (5, 91). Understanding the mechanisms of MR1 transcriptional regulation may provide insights into broader immune signaling networks and better inform our knowledge of the roles MR1 and MAIT cells play in infection and inflammatory diseases.
Materials & methods
Human subjects
This study was conducted according to the principles expressed in the Declaration of Helsinki. Study participants, protocols and consent forms were approved by Oregon Health & Science University Institutional Review Board (IRB00000186). Written and informed consent was obtained from all donors. Human participants are not directly involved in the study. Healthy adults were recruited from among employees at Oregon Health & Science University as previously described to obtain human serum (92).
Cells and bacteria
Primary airway epithelial cells (AEC) were purchased from Lonza Biosciences or harvested from deceased human donor lung tissue through the Cascade Alliance (formerly Pacific Northwest Transplant Bank) as previously described (22, 93). The healthy donor AEC from (22) were likewise grown in Bronchial Epithelial Growth Media (“BEGM”, CC-3170) and harvested using ReagentPack Subculture reagents (CC-5034) per manufacturer’s protocols (Lonza).
The BEAS-2B bronchial epithelial cell line (CRL-9609, American Type Culture Collection) was grown in DMEM medium (Gibco) supplemented with L-glutamine (25030164, Life Technologies) and 10% heat-inactivated fetal bovine serum (“DMEM-FBS”). BEAS-2B cells overexpressing MR1-GFP under a tetracycline-inducible promoter (“BEAS-2B:doxMR1-GFP”) (11) were similarly cultured in DMEM-FBS. Expression of MR1-GFP was induced with doxycycline for 16 hours prior to harvest. BEAS-2B cells stably expressing Cas9 (94) were grown in DMEM-FBS and used to generate CRISPR knockouts.
The MR1-restricted T cell clone (D426G11) was generated and expanded in RPMI medium (Gibco) supplemented with L-glutamine and 10% heat-inactivated human serum (“RPMI-HuS”) as previously described (2, 92).
Streptococcus pneumoniae (95) and Mycobacterium smegmatis Mc (2)155 (ATCC) were grown as described in the supplement of (22) and used from frozen stocks. At late log phase, M. smegmatis were pelleted and the supernatant was passed through a syringe-driven 0.22 μm filter and frozen for use as antigen in ELISPOT assays.
Generation of stable CRISPR/Cas9 IRF1 or NLRC5 knockout BEAS-2B cells
We generated IRF1-/- and NLRC5-/- CRISPR knockout BEAS-2B cells as previously described (94). Early passage Cas9+ BEAS-2B cells were transduced with sgRNA constructs targeting IRF1 (CRISPR845545_LV, ThermoFisher) or NLRC5 (CRISPR1120312_LV, ThermoFisher) in the presence of 200 μg Polybrene (Sigma). Following puromycin selection, monoclonal populations were produced by limiting dilution and screened by Western blot or ELISPOT. We validated genomic editing by Sanger sequencing. DNA was isolated from control Cas9+, IRF1-/-, and NLRC5-/- BEAS-2B clones using the QIAamp DNA Micro Kit (Qiagen) and amplified by PCR. The OHSU Vollum Institute DNA Sequencing Core performed Sanger sequencing and the resulting sequences were analyzed by TIDE (96) and ICE (97).
Reagents and antibodies
6-formylpterin (6-FP, Schirck’s Laboratories) was suspended in 0.01 M NaOH and used at a final concentration of 100 μM. 5-(2-oxopropylideneamino)-6-d-ribitylaminouracil (5-OP-RU) was freshly prepared from equal volumes of 32 mM 5-amino-6-d-ribitylaminouracil (5-A-RU)*HCl (OHSU Medicinal Chemistry Core) (98) and 650 mM methylglyoxal (Sigma) exactly following the second method described in (94) and used at a final concentration of 500 pM. Phytohemagglutinin PHA-L (L4144 Sigma) was suspended in RPMI−HuS and used at 1 μg/well. Doxycycline (Sigma) was suspended in sterile water and used at 2 μg/ml.
Recombinant human cytokines were reconstituted in sterile water and supplemented with bovine serum albumin as per manufacturer recommendations. Final concentrations used were: 66 ng/ml IFNγ (R&D Systems 285-IF-100), 66 ng/ml IFNβ (R&D Systems 8199-IF-010), 132 ng/ml IFNλ (PeproTech 300-02K), 66 ng/ml TNFα (R&D Systems 10291-TA-050), and 66 ng/ml IL-17 (PeproTech 200-17). Cells were treated with cytokines for 12 hours unless otherwise noted.
Antibodies used for ELISPOT assays: α-IFNγ (1-D1K, Mabtech) and alkaline phosphatase-conjugated secondary antibody (7-B6-1-ALP, Mabtech). Antibodies used for Western blot: α-IRF1 (D5E4, Cell Signaling Technology), α-Vinculin (V284, Bio-Rad). Antibodies used for flow cytometry: α-MR1 (26.5, conjugated to APC, Biolegend), α-HLA-A,B,C (W6/32, conjugated to APC, Biolegend), IgG2a isotype (MOPC-173, conjugated to APC, Biolegend), α-phospho-STAT1 (KIKSI0803, conjugated to PE, eBioscience).
Co-culture experiments
Primary AEC were infected with S. pneumoniae (20 MOI) in antibiotic-free BEGM. After 1 hour, AEC were washed with PBS to remove non-adhered bacteria, then MAIT cells were added at a 1:1 ratio in BEGM complete with gentamycin-amphotericin (GA-1000, Lonza). BEAS-2B cells in antibiotic-free DMEM-FBS were infected with M. smegmatis or treated with 6-FP or 5-OP-RU for 1 hour, washed with PBS, then MAIT cells were added at a 1:1 ratio in DMEM-FBS with gentamycin. Following overnight co-culture, wells were extensively washed with PBS to remove MAIT cells before harvesting AEC or BEAS-2B cells.
Real-time quantitative PCR
Cell pellets washed with PBS were either used fresh or stored dry at -80 °C before thawing in 37 °C water bath. RNA was isolated using the RNEasy Plus kit (Qiagen) and cDNA was synthesized using the High Capacity cDNA Reverse Transcription Kit (Life Technologies) as per the manufacturers’ protocols. RT-qPCR was performed using TaqMan (Applied Biosystems) gene expression assays: HPRT1 (Hs02800695_m1), MR1 (Hs01042278_m1), HLA-A,H (Hs01058806_g1), IRF1 (Hs00971965_m1), NLRC5 (Hs01072123_m1), and β2m (Hs00187842_m1). Gene expression data were normalized to internal control HPRT1 and relative expression levels for each target gene were determined using the 2-ΔΔCt method (99). Some uninfected AEC HPRT1 and MR1 data were used as controls in (22).
Flow cytometry
To quantify surface expression of MR1 and MHC-I, AEC and BEAS-2B cells were treated as indicated and harvested. Samples were blocked in FACS buffer containing 2% heat-inactivated human serum, 2% heat-inactivated goat serum, and 0.5% heat-inactivated FBS for 30 minutes on ice, then stained with APC-conjugated IgG2a, α-MR1, or α-HLA-A,B,C antibody for 40 minutes. For pSTAT1 staining, cells were permeabilized with 0.2% saponin during the blocking step. Cells were washed with PBS and fixed with 1% paraformaldehyde, then analyzed with a Beckman Coulter CytoflexS. All analyses were performed using FlowJo10 (TreeStar).
Enzyme-linked immunospot assays
IFNγ ELISPOT assays were performed as previously described (100) with the following modifications: ELISPOT plates (MSHAS4510, MilliporeSigma) were coated overnight with α-IFNγ antibody, then washed and blocked for 1 hour in RPMI-HuS. BEAS-2B cells were seeded in duplicate (1x10⁵) cells/well) and infected with M. smegmatis, treated with a titration of M. smegmatis supernatant, or incubated with control PHA or RPMI-HuS medium for 1 hour at 37 C. D426G11 MAIT cell clones were added at a 1:1 ratio in RPMI-HuS with gentamycin for overnight incubation at 37 C. Following extensive washing with PBS−0.05% Tween 20, plates were incubated with ALP secondary antibody for 2 hours before additional washing and colorimetric development. IFNγ spot−forming units (SFU) were quantified by AID ELISPOT reader. For experiments with cytokine pre-treatment, BEAS-2B cells were seeded in 6-well plates and treated with cytokines for 12 hours, then washed 3 times with PBS to remove any excess cytokine before harvesting and seeding into ELISPOT plate.
siRNA gene silencing
Gene silencing in wildtype, Cas9+, or NLRC5-/- BEAS-2B cells was performed through nucleofection as in (101) and following the Amaxa Cell Line Nucleofector Kit T (Lonza) protocols. In brief, 2 μg total of Missense (4390843, ThermoFisher), IRF1 (s7501, ThermoFisher), and/or NLRC5 (s38591, ThermoFisher) siRNA were added to 1x10⁶ cells and transfected by the Amaxa Nucleofector 2b machine (Lonza) using program G-016. Cells were incubated for 48 hours before use in assays. Efficiency of gene silencing was validated by RT-qPCR.
Transcription factor binding sites
Putative transcription factor binding sites were acquired through the Eukaryotic Promoter Database browser using the Search Motif Tool to perform on-the-fly scanning for transcription factor motifs using the FindM tool from the Signal Search Analysis (SSA) Server toolkit (28, 102–104).
Data analysis
All data were analyzed using Prism (GraphPad) and plots were generated using R 4.4.0 and packages such as tidyverse, ggprism, and rstatix. Statistical significance was determined as indicated by two-tailed unpaired or pairwise t tests, using α=0.05.
Data availability statement
The raw data supporting the conclusions of this article will be made available by the authors, without undue reservation.
Ethics statement
Ethical approval was not required for the studies involving humans because materials used included 1) tissues from deceased human donors; 2) human serum from a biorepository (de-identified); 3) primary human T cell clone obtained as a gift (de-identified). The studies were conducted in accordance with the local legislation and institutional requirements. Written informed consent to participate in this study was not required from the participants or the participants’ legal guardians/next of kin in accordance with the national legislation and the institutional requirements.
Author contributions
MEH: Writing – review & editing, Validation, Visualization, Data curation, Methodology, Formal analysis, Investigation, Conceptualization, Writing – original draft, Resources. EL: Methodology, Investigation, Data curation, Writing – review & editing, Resources, Project administration. TL: Investigation, Writing – review & editing, Data curation, Resources. CH: Data curation, Investigation, Resources, Writing – review & editing. MJH: Resources, Data curation, Formal analysis, Validation, Project administration, Writing – review & editing, Methodology, Funding acquisition, Supervision, Conceptualization, Writing – original draft.
Funding
The author(s) declare financial support was received for the research and/or publication of this article. This work was supported in part by National Institutes of Health R01 AI129976 (MJH, research materials, equipment, and salary), 2T32HL083808 (MEH, research training and stipend), and the United States (U.S.) Department of Veterans Affairs, Clinical Sciences Research and Development Service I01 CX001562 (MJH, research materials, equipment, and salary).
Acknowledgments
We thank the staff at Cascade Alliance (formerly Pacific Northwest Transplant Bank) for procuring the human lung and airway tissue samples used in this study. The D426G11 MAIT cell clone was a kind gift from Dr. David Lewinsohn. We are grateful to Dr. Tim Nice and Dr. Austin Wright for their gift of recombinant human interferons and guidance in cytokine biology. We thank the OHSU Vollum Institute DNA Sequencing Core and the OHSU Flow Cytometry Core for their support. We also thank Dr. Laurisa Ankley and Dr. Andew Olive for their technical advice along with Savannah McBride and Dr. Fikadu Tafesse for their aid in generating Cas9+ BEAS 2B cells. We are grateful to Dr. Georgiana Purdy, Dr. Elly Karamooz, and Dr. Corinna Kulicke for their scientific guidance.
Conflict of interest
The authors declare that the research was conducted in the absence of any commercial or financial relationships that could be construed as a potential conflict of interest.
Generative AI statement
The author(s) declare that no Generative AI was used in the creation of this manuscript.
Any alternative text (alt text) provided alongside figures in this article has been generated by Frontiers with the support of artificial intelligence and reasonable efforts have been made to ensure accuracy, including review by the authors wherever possible. If you identify any issues, please contact us.
Publisher’s note
All claims expressed in this article are solely those of the authors and do not necessarily represent those of their affiliated organizations, or those of the publisher, the editors and the reviewers. Any product that may be evaluated in this article, or claim that may be made by its manufacturer, is not guaranteed or endorsed by the publisher.
Supplementary material
The Supplementary Material for this article can be found online at: https://www.frontiersin.org/articles/10.3389/fimmu.2025.1624767/full#supplementary-material
Supplementary Figure 1 | Associated with Figure 1 and 2. Panels A-E are alternate presentations of data shown in Figure 1A–E, respectively. (A) RT-qPCR of RNA isolated from primary human AECs (n=5) infected with S. pneumoniae (Sp) for one hour and incubated overnight with MAIT cell clone. MR1 expression was calculated relative to HPRT1 expression and uninfected no-MAIT (UI-) controls, paired by individual donor. MR1 (B) mRNA and (C) surface expression of BEAS-2B cells infected with M. smegmatis (Ms) for one hour and incubated overnight with MAIT cell clone. (B) RT-qPCR of MR1 expression was calculated relative to HPRT1 expression and UI- control, paired by experimental replicate. (C) Left, gMFI of surface MR1 stained with α-MR1 26.5 Ab, paired by experimental replicate. Right, representative α-MR1 stain histograms. MR1 (D) mRNA and (E) surface expression of BEAS-2B cells treated with 5-OP-RU (left, “5-OP”) or 6-FP (right) for one hour and incubated overnight with MAIT cell clone. (D) RT-qPCR of MR1 expression was calculated relative to HPRT1 expression and media no-MAIT (UT-) control, paired by experimental replicate. (E) gMFI of surface MR1 stained with α-26.5 Ab, paired by experimental replicate. (F) Representative α-MR1 stain histograms of BEAS-2B cells treated with media control (UT) or IFNγ. Data are representative of flow cytometry staining shown in Figure 2D. Pairwise statistical analyses are in Supplementary Table 1. Triangles represent data from primary AEC and circles represent data from BEAS-2B cells.
Supplementary Figure 2 | Associated with Figure 4. (A, B) RT-qPCR of BEAS-2B cells treated with IRF1, NLRC5, and/or missense siRNA as indicated for 36 hours, then incubated with IFNγ for 12 hours. (A) IRF1 and (B) NLRC5 expression were calculated relative to HPRT1 expression and missense UT control, paired by experimental replicate. (C, D) RT-qPCR of Cas9+ or NLRC5-/- BEAS-2B cells treated with IRF1 or missense siRNA for 36 hours, then incubated with IFNγ for 12 hours. Gene expression of (C) NLRC5-/- clone #1 or (D) NLRC5-/- clone #2 were calculated relative to HPRT1 expression and Cas9+ or NLRC5-/- clone missense UT controls, paired by experimental replicate. (E) Flow cytometry of cells from (C-D). gMFI of surface MR1 (α-26.5 Ab) are from IFNγ-treated Cas9+ (left), NLRC5-/- clone #1 (middle), and NLRC5-/- clone #2 (right). (F) RT-qPCR of Cas9+ or IRF1-/- clone #1 BEAS-2B cells treated with IFNγ for 12 hours. MR1 expression was calculated relative to HPRT1 expression and Cas9+ or IRF1-/- clone #1 UT controls, paired by experimental replicate. (G) Flow cytometry of Cas9+ or IRF1-/- clone #2 BEAS-2B cells treated with IFNγ for 12 hours. gMFI of surface MR1 (left, α-26.5 Ab) and MHC-Ia (left, α-W6/32 Ab) are paired by experimental replicate. Statistical analyses are in Supplementary Table 2. Yellow symbols indicate IFNγ treatment alone. For visual clarity, silencing of IRF1 (green), NLRC5 (teal), or both (dark blue) are also indicated. In (F, G), light green distinguishes media control IRF1-/- cells from IFNγ-treated IRF1-/- cells (dark green).
Supplementary Figure 3 | Associated with Figure 5 and Figure 6. Panels (A–D, G) are alternate presentations of data shown in Figure 5A, C, F,D, G, respectively. Panels (E, F, H, I) are alternate presentations of data shown in Figures 6A–D, respectively. (A) Left, flow cytometry of primary human AECs infected with S. pneumoniae (Sp) for one hour and incubated overnight with MAIT cell clone. gMFI of stained pSTAT1 expression is paired by individual donor (n=3). Right, histograms of α-pSTAT1 staining representative of data presented in Figures 5A, B. (B-D, G) RT-qPCR of primary human AECs infected with S. pneumoniae (Sp) for one hour and incubated overnight with MAIT cell clone. Expression of (B) β2m, (C) NLRC5 (D) HLA-A, and (G) IRF1 were calculated relative to HPRT1 expression and UI- control, paired by individual donor (n=4 (B) or n=5 (C, D, G) donors). (E, F, H, I) RT-qPCR of wildtype BEAS-2B cells treated as indicated below. Gene expression was calculated relative to HPRT1 expression and UI- or UT- controls, paired by experiment. (E) HLA-A and (H) IRF1 expression of BEAS-2B cells infected with M. smegmatis (Ms) for one hour and incubated overnight with MAIT cell clone. (F) HLA-A and (I) IRF1 expression of BEAS-2B cells treated with 5-OP-RU (left) or 6-FP (right) for one hour and incubated overnight with MAIT cell clone. Pairwise statistical analyses are in Supplementary Table 3. Triangles represent data from primary AEC and circles represent data from BEAS-2B cells.
Supplementary Figure 4 | Associated with Figure 7. (A-C) RT-qPCR of wildtype BEAS-2B cells treated with recombinant human cytokines for 12 hours. Gene expression was calculated relative to HPRT1 expression and UT controls. Statistical analyses are in Supplementary Table 5.
References
1. Treiner E, Duban L, Bahram S, Radosavljevic M, Wanner V, Tilloy F, et al. Selection of evolutionarily conserved mucosal-associated invariant T cells by MR1. Nature. (2003) 422:164–9. doi: 10.1038/nature01433
2. Gold MC, Cerri S, Smyk-Pearson S, Cansler ME, Vogt TM, Delepine J, et al. Human mucosal associated invariant T cells detect bacterially infected cells. PloS Biol. (2010) 8:e1000407. doi: 10.1371/journal.pbio.1000407
3. Le Bourhis L, Martin E, Peguillet I, Guihot A, Froux N, Core M, et al. Antimicrobial activity of mucosal-associated invariant T cells. Nat Immunol. (2010) 11:701–8. doi: 10.1038/ni.1890
4. Meermeier EW, Harriff MJ, Karamooz E, and Lewinsohn DM. MAIT cells and microbial immunity. Immunol Cell Biol. (2018) 96:607–17. doi: 10.1111/imcb.12022
5. Hinks TSC and Zhang X-W. MAIT cell activation and functions. Front Immunol. (2020) 0. doi: 10.3389/fimmu.2020.01014
6. Kjer-Nielsen L, Patel O, Corbett AJ, Le Nours J, Meehan B, Liu L, et al. MR1 presents microbial vitamin B metabolites to MAIT cells. Nature. (2012) 491:717–23. doi: 10.1038/nature11605
7. Riegert P, Wanner V, and Bahram S. Genomics, isoforms, expression, and phylogeny of the MHC class I-related MR1 gene. J Immunol. (1998) 161:4066–77. doi: 10.4049/jimmunol.161.8.4066
8. Harriff MJ, Karamooz E, Burr A, Grant WF, Canfield ET, Sorensen ML, et al. Endosomal MR1 trafficking plays a key role in presentation of mycobacterium tuberculosis ligands to MAIT cells. PloS Pathog. (2016) 12:e1005524. doi: 10.1371/journal.ppat.1005524
9. McWilliam HE, Eckle SB, Theodossis A, Liu L, Chen Z, Wubben JM, et al. The intracellular pathway for the presentation of vitamin B-related antigens by the antigen-presenting molecule MR1. Nat Immunol. (2016) 17:531–7. doi: 10.1038/ni.3416
10. Karamooz E, Harriff MJ, Narayanan GA, Worley AH, and Lewinsohn DM. MR1 recycling and blockade of endosomal trafficking reveal distinguishable antigen presentation pathways between Mycobacterium tuberculosis infection and exogenously delivered antigens. Sci Rep. (2019) 9:4797. doi: 10.1038/s41598-019-41402-y
11. Huber ME, Kurapova R, Heisler CM, Karamooz E, Tafesse FG, and Harriff MJ. Rab6 regulates recycling and retrograde trafficking of MR1 molecules. Sci Rep. (2020) 10:90–102. doi: 10.1038/s41598-020-77563-4
12. Kulicke C, Karamooz E, Lewinsohn D, and Harriff M. Covering all the bases: complementary MR1 antigen presentation pathways sample diverse antigens and intracellular compartments. Front Immunol. (2020) 11:2034. doi: 10.3389/fimmu.2020.02034
13. Lamichhane R and Ussher JE. Expression and trafficking of MR1. Immunology. (2017) 151:270–9. doi: 10.1111/imm.12744
14. McWilliam HEG and Villadangos JA. How MR1 presents a pathogen metabolic signature to mucosal-associated invariant T (MAIT) cells. Trends Immunol. (2017) 38:679–89. doi: 10.1016/j.it.2017.06.005
15. van dan Elsen PJ. Expression regulation of major histocompatibility complex class I and class II encoding genes. Front Immunol. (2011) 2. doi: 10.3389/fimmu.2011.00048
16. Jongsma MLM, Guarda G, and Spaapen RM. The regulatory network behind MHC class I expression. Mol Immunol. (2019) 113:16–21. doi: 10.1016/j.molimm.2017.12.005
17. Kalvakolanu DV, Nallar SC, and Kalakonda S. Interferons: Cellular and Molecular Biology of Their Actions. In: Boffetta P and Hainaut P, editors. Encyclopedia of Cancer, 3rd ed. Oxford: Academic Press (2019). 286–312. doi: 10.1016/B978-0-12-801238-3.96116-6
18. Wang L, Zhu Y, Zhang N, Xian Y, Tang Y, Ye J, et al. The multiple roles of interferon regulatory factor family in health and disease. Sig Transduct Target Ther. (2024) 9:1–48. doi: 10.1038/s41392-024-01980-4
19. Cho SX, Vijayan S, Yoo J-S, Watanabe T, Ouda R, An N, et al. MHC class I transactivator NLRC5 in host immunity, cancer and beyond. Immunology. (2021) 162:252–61. doi: 10.1111/imm.13235
20. Seshadri C, Thuong NT, Mai NT, Bang ND, Chau TT, Lewinsohn DM, et al. & Hawn, T. R. A polymorphism in human MR1 is associated with mRNA expression and susceptibility to tuberculosis. Genes Immun. (2017) 18:8–14. doi: 10.1038/gene.2016.41
21. Kubica P, Lara-Velazquez M, Bam M, Siraj S, Ong I, Liu P, et al. MR1 overexpression correlates with poor clinical prognosis in glioma patients. Neuro-Oncology Adv. (2021) 3:vdab034. doi: 10.1093/noajnl/vdab034
22. Huber ME, Larson E, Lust TN, Heisler CM, and Harriff MJ. Chronic obstructive pulmonary disease and cigarette smoke lead to dysregulated mucosal-associated invariant T-cell activation. Am J Respir Cell Mol Biol. (2023) 68:90–102. doi: 10.1165/rcmb.2022-0131OC
23. Sundar IK, Yin Q, Baier BS, Yan L, Mazur W, Li D, et al. DNA methylation profiling in peripheral lung tissues of smokers and patients with COPD. Clin Epigenet. (2017) 9:38. doi: 10.1186/s13148-017-0335-5
24. Szabo M, Sarosi V, Baliko Z, Bodo K, Farkas N, Berki T, et al. Deficiency of innate-like T lymphocytes in chronic obstructive pulmonary disease. Respir Res. (2017) 18:197. doi: 10.1186/s12931-017-0671-1
25. McWilliam HE, Birkinshaw RW, Villadangos JA, McCluskey J, and Rossjohn J. MR1 presentation of vitamin B-based metabolite ligands. Curr Opin Immunol. (2015) 34:28–34. doi: 10.1016/j.coi.2014.12.004
26. Dreos R, Ambrosini G, Périer RC, and Bucher P. The Eukaryotic Promoter Database: expansion of EPDnew and new promoter analysis tools. Nucleic Acids Res. (2015) 43:D92–6. doi: 10.1093/nar/gku1111
27. Meylan P, Dreos R, Ambrosini G, Groux R, and Bucher P. EPD in 2020: enhanced data visualization and extension to ncRNA promoters. Nucleic Acids Res. (2020) 48:D65–9. doi: 10.1093/nar/gkz1014
28. Rauluseviciute I, Riudavets-Puig R, Blanc-Mathieu R, Castro-Mondragon JA, Ferenc K, Kumar V, et al. JASPAR 2024: 20th anniversary of the open-access database of transcription factor binding profiles. Nucleic Acids Res. (2024) 52:D174–82. doi: 10.1093/nar/gkad1059
29. Sachini N and Papamatheakis J. NF-Y and the immune response: Dissecting the complex regulation of MHC genes. Biochim Biophys Acta (BBA) - Gene Regul Mech. (2017) 1860:537–42. doi: 10.1016/j.bbagrm.2016.10.013
30. Ning S, Pagano JS, and Barber GN. IRF7: activation, regulation, modification and function. Genes Immun. (2011) 12:399–414. doi: 10.1038/gene.2011.21
31. Sari G, DhatChinamoorthy K, Orellano-Ariza L, Ferreira LM, Brehm MA, and Rock K. IRF2 loss is associated with reduced MHC I pathway transcripts in subsets of most human cancers and causes resistance to checkpoint immunotherapy in human and mouse melanomas. J Exp Clin Cancer Research: CR. (2024) 43:276. doi: 10.1186/s13046-024-03187-5
32. Barrat FJ, Crow MK, and Ivashkiv LB. Interferon target-gene expression and epigenomic signatures in health and disease. Nat Immunol. (2019) 20:1574–83. doi: 10.1038/s41590-019-0466-2
33. McNab F, Mayer-Barber K, Sher A, Wack A, and O’Garra A. Type I interferons in infectious disease. Nat Rev Immunol. (2015) 15:87–103. doi: 10.1038/nri3787
34. Lee AJ and Ashkar AA. The dual nature of type I and type II interferons. Front Immunol. (2018) 9:2061. doi: 10.3389/fimmu.2018.02061
35. Han L-T, Hu J-Q, Ma B, Wen D, Zhang T-T, Lu Z-W, et al. IL-17A increases MHC class I expression and promotes T cell activation in papillary thyroid cancer patients with coexistent Hashimoto’s thyroiditis. Diagn Pathol. (2019) 14:52. doi: 10.1186/s13000-019-0832-2
36. Bonelli M, Dalwigk K, Platzer A, Olmos Calvo I, Hayer S, Niederreiter B, et al. IRF1 is critical for the TNF-driven interferon response in rheumatoid fibroblast-like synoviocytes. Exp Mol Med. (2019) 51:1–11. doi: 10.1038/s12276-019-0267-6
37. Liu Z. Molecular mechanism of TNF signaling and beyond. Cell Res. (2005) 15:24–7. doi: 10.1038/sj.cr.7290259
38. Looney M, Lorenc R, Halushka MK, and Karakousis PC. Key macrophage responses to infection with Mycobacterium tuberculosis are co-regulated by microRNAs and DNA methylation. Front Immunol. (2021) 12. doi: 10.3389/fimmu.2021.685237
39. Pacis A, Tailleux L, Morin AM, Lambourne J, MacIsaac JL, Yotova V, et al. Bacterial infection remodels the DNA methylation landscape of human dendritic cells. Genome Res. (2015) 25:1801–11. doi: 10.1101/gr.192005.115
40. Cizmeci D, Dempster EL, Champion OL, Wagley S, Akman OE, Prior JL, et al. Mapping epigenetic changes to the host cell genome induced by Burkholderia pseudomallei reveals pathogen-specific and pathogen-generic signatures of infection. Sci Rep. (2016) 6:30861. doi: 10.1038/srep30861
41. Liu Y, Zhu P, Wang W, Tan X, Liu C, Chen Y, et al. Mucosal-associated invariant T cell dysregulation correlates with conjugated bilirubin level in chronic HBV infection. Hepatology. (2021) 73:1671. doi: 10.1002/hep.31602
42. McSharry BP, Samer C, McWilliam HEG, Ashley CL, Yee MB, Steain M, et al. Virus-mediated suppression of the antigen presentation molecule MR1. Cell Rep. (2020) 30:2948. doi: 10.1016/j.celrep.2020.02.017
43. Samer C, McWilliam HEG, McSharry BP, Velusamy T, Burchfield JG, Stanton RJ, et al. Multi-targeted loss of the antigen presentation molecule MR1 during HSV-1 and HSV-2 infection. iScience. (2024) 27:108801. doi: 10.1016/j.isci.2024.108801
44. Tormanen K, Matundan HH, Wang S, Jaggi U, Mott KR, Ghiasi H, et al. (sncRNA1) within the Latency-Associated Transcript Modulates Herpes Simplex Virus 1 Virulence and the Host Immune Response during Acute but Not Latent Infection. J Virol. (2022) 96:e00054–22. doi: 10.1128/jvi.00054-22
45. Rebuli ME, Glista-Baker E, Hoffman JR, Duffney PF, Robinette C, Speen AM, et al. Electronic-cigarette use alters nasal mucosal immune response to live-attenuated influenza virus. A clinical trial. Am J Respir Cell Mol Biol. (2021) 64:126–37. doi: 10.1165/rcmb.2020-0164OC
46. Constantin D, Nosi V, Kehrer N, Vacchini A, Chancellor A, Contassot E, et al. MR1 gene and protein expression are enhanced by inhibition of the extracellular signal-regulated kinase ERK. Cancer Immunol Res OF1–OF16. (2024) 12(10):1452–1467. doi: 10.1158/2326-6066.CIR-24-0110
47. Narayan V, Pion E, Landré V, Müller P, and Ball KL. Docking-dependent ubiquitination of the interferon regulatory factor-1 tumor suppressor protein by the ubiquitin ligase CHIP. J Biol Chem. (2011) 286:607–19. doi: 10.1074/jbc.M110.153122
48. Rosain J, Neehus A-L, Manry J, Yang R, Le Pen J, Daher W, et al. Human IRF1 governs macrophagic IFN-γ immunity to mycobacteria. Cell. (2023) 186:621–645.e33. doi: 10.1016/j.cell.2022.12.038
49. Kim S-J and Karamooz E. MR1- and HLA-E-dependent antigen presentation of mycobacterium tuberculosis. Int J Mol Sci. (2022) 23:14412. doi: 10.3390/ijms232214412
50. Cross DL, Layton ED, Yu KKQ, Smith MT, Aguilar MS, Li S, et al. MR1-restricted T cell clonotypes are associated with “resistance” to Mycobacterium tuberculosis infection. JCI Insight. (2024) 9. doi: 10.1172/jci.insight.166505
51. Yang R, Mele F, Worley L, Langlais D, Rosain J, Benhsaien I, et al. Human T-bet governs innate and innate-like adaptive IFN-γ immunity against mycobacteria. Cell. (2020) 183:1826. doi: 10.1016/j.cell.2020.10.046
52. Ussher JE, van Wilgenburg B, Hannaway RF, Ruustal K, Phalora P, Kurioka A, et al. TLR signaling in human antigen-presenting cells regulates MR1-dependent activation of MAIT cells. Eur J Immunol. (2016) 46:1600–14. doi: 10.1002/eji.201545969
53. Lamichhane R, Galvin H, Hannaway RF, de la Harpe SM, Munro F, Tyndall JD, et al. Type I interferons are important co-stimulatory signals during T cell receptor mediated human MAIT cell activation. Eur J Immunol. (2020) 50:178–91. doi: 10.1002/eji.201948279
54. Pavlovic M, Gross C, Chili C, Secher T, and Treiner E. MAIT cells display a specific response to type 1 IFN underlying the adjuvant effect of TLR7/8 ligands. Front Immunol. (2020) 11:2097. doi: 10.3389/fimmu.2020.02097
55. López-Rodríguez JC, Hancock SJ, Li K, Crotta S, Barrington C, Suárez-Bonnet A, et al. Type I interferons drive MAIT cell functions against bacterial pneumonia. J Exp Med. (2023) 220:e20230037. doi: 10.1084/jem.20230037
56. Lazear HM, Schoggins JW, and Diamond MS. Shared and distinct functions of type I and type III interferons. Immunity. (2019) 50:907–23. doi: 10.1016/j.immuni.2019.03.025
57. Forero A, Ozarkar S, Li H, Lee CH, Hemann EA, Nadjsombati MS, et al. Differential activation of the transcription factor IRF1 underlies the distinct immune responses elicited by type I and type III interferons. Immunity. (2019) 51:451–464.e6. doi: 10.1016/j.immuni.2019.07.007
58. Goel RR, Kotenko SV, and Kaplan MJ. Interferon lambda in inflammation and autoimmune rheumatic diseases. Nat Rev Rheumatol. (2021) 17:349–62. doi: 10.1038/s41584-021-00606-1
59. Lavi E, Suzumura A, Murasko DM, Murray EM, Silberger DH, and Weiss SR. Tumor necrosis factor induces expression of MHC class I antigens on mouse astrocytes. J Neuroimmunology. (2002) 18:245. doi: 10.1016/0165-5728(88)90102-6
60. Venkatesh D, Ernandez T, Rosetti F, Batal I, Cullere X, Luscinskas FW, et al. Endothelial TNF receptor 2 induces IRF1 transcription factor-dependent interferon-β autocrine signaling to promote monocyte recruitment. Immunity. (2013) 38:1025–37. doi: 10.1016/j.immuni.2013.01.012
61. Tulli L, Cattaneo F, Vinot J, Baldari CT, and D’Oro U. Src family kinases regulate interferon regulatory factor 1 K63 ubiquitination following activation by TLR7/8 vaccine adjuvant in human monocytes and B cells. Front Immunol. (2018) 9. doi: 10.3389/fimmu.2018.00330
62. Liu A, Gong P, Hyun SW, Wang KZQ, Cates EA, Perkins D, et al. TRAF6 protein couples toll-like receptor 4 signaling to src family kinase activation and opening of paracellular pathway in human lung microvascular endothelia*. J Biol Chem. (2012) 287:16132–45. doi: 10.1074/jbc.M111.310102
63. Harikumar KB, Yester JW, Surace MJ, Oyeniran C, Price MM, Huang W-C, et al. K63-linked polyubiquitination of transcription factor IRF1 is essential for IL-1-induced production of chemokines CXCL10 and CCL5. Nat Immunol. (2014) 15:231–8. doi: 10.1038/ni.2810
64. Hoshino K, Sasaki I, Sugiyama T, Yano T, Yamazaki C, Yasui T, et al. Critical role of IkappaB Kinase alpha in TLR7/9-induced type I IFN production by conventional dendritic cells. J Immunol. (2010) 184:3341–5. doi: 10.4049/jimmunol.0901648
65. Sánchez-Tarjuelo R, Cortegano I, Manosalva J, Rodríguez M, Ruíz C, Alía M, et al. The TLR4-myD88 signaling axis regulates lung monocyte differentiation pathways in response to streptococcus pneumoniae. Front Immunol. (2020) 11:2120. doi: 10.3389/fimmu.2020.02120
66. Ioannidis M, Cerundolo V, and Salio M. The immune modulating properties of mucosal-associated invariant T cells. Front Immunol. (2020) 0. doi: 10.3389/fimmu.2020.01556
67. Davey MS, Morgan MP, Liuzzi AR, Tyler CJ, Khan MWA, Szakmany T, et al. Microbe-specific unconventional T cells induce human neutrophil differentiation into antigen cross-presenting cells. J Immunol. (2014) 193:3704–16. doi: 10.4049/jimmunol.1401018
68. Siebeler R, de Winther MPJ, and Hoeksema MA. The regulatory landscape of macrophage interferon signaling in inflammation. J Allergy Clin Immunol. (2023) 152:326–37. doi: 10.1016/j.jaci.2023.04.022
69. Frucht DM, Fukao T, Bogdan C, Schindler H, O’Shea JJ, and Koyasu S. IFN-γ production by antigen-presenting cells: mechanisms emerge. Trends Immunol. (2001) 22:556–60. doi: 10.1016/S1471-4906(01)02005-1
70. Fenimore J and Young HA. Regulation of IFN-γ Expression. In: Ma X, editor. Regulation of Cytokine Gene Expression in Immunity and Diseases. Dordrecht: Springer Netherlands (2016). p. 1–19. doi: 10.1007/978-94-024-0921-5_1
71. Gomez JC, Yamada M, Martin JR, Dang H, Brickey WJ, Bergmeier W, et al. Mechanisms of interferon-γ Production by neutrophils and its function during Streptococcus pneumoniae Pneumonia. Am J Respir Cell Mol Biol. (2015) 52:349–64. doi: 10.1165/rcmb.2013-0316OC
72. Briard B, Karki R, Malireddi RKS, Bhattacharya A, Place DE, Mavuluri J, et al. Fungal ligands released by innate immune effectors promote inflammasome activation during Aspergillus fumigatus infection. Nat Microbiol. (2019) 4:316–27. doi: 10.1038/s41564-018-0298-0
73. Lepore M, Kalinichenko A, Calogero S, Kumar P, Paleja B, Schmaler M, et al. Functionally diverse human T cells recognize non-microbial antigens presented by MR1. eLife. (2017) 6:e24476. doi: 10.7554/eLife.24476
74. Chancellor A, Vacchini A, and De Libero G. MR1, an immunological periscope of cellular metabolism. Int Immunol. (2022) 34:141–7. doi: 10.1093/intimm/dxab101
75. Hinks TS. Mucosal-associated invariant T cells in autoimmunity, immune-mediated diseases and airways disease. Immunology. (2016) 148:1–12. doi: 10.1111/imm.12582
76. Pincikova T, Parrot T, Hjelte L, Högman M, Lisspers K, Ställberg B, et al. MAIT cell counts are associated with the risk of hospitalization in COPD. Respir Res. (2022) 23:127. doi: 10.1186/s12931-022-02045-2
77. Mock JR, Tune MK, Dial CF, Torres-Castillo J, Hagan RS, and Doerschuk CM. Effects of IFN-γ on immune cell kinetics during the resolution of acute lung injury. Physiol Rep. (2020) 8:e14368. doi: 10.14814/phy2.14368
78. Ramana CV, DeBerge MP, Kumar A, Alia CS, Durbin JE, and Enelow RI. Inflammatory impact of IFN-γ in CD8+ T cell-mediated lung injury is mediated by both Stat1-dependent and -independent pathways. Am J Physiol Lung Cell Mol Physiol. (2015) 308:L650–7. doi: 10.1152/ajplung.00360.2014
79. Southworth T, Metryka A, Lea S, Farrow S, Plumb J, and Singh D. IFN-γ synergistically enhances LPS signalling in alveolar macrophages from COPD patients and controls by corticosteroid-resistant STAT1 activation. Br J Pharmacol. (2012) 166:2070–83. doi: 10.1111/j.1476-5381.2012.01907.x
80. Williams M, Todd I, and Fairclough LC. The role of CD8 + T lymphocytes in chronic obstructive pulmonary disease: a systematic review. Inflamm Res. (2021) 70:11–8. doi: 10.1007/s00011-020-01408-z
81. Zhu X, Gadgil AS, Givelber R, George MP, Stoner MW, Sciurba FC, et al. Peripheral T cell functions correlate with the severity of chronic obstructive pulmonary disease. J Immunol. (2009) 182:3270–7. doi: 10.4049/jimmunol.0802622
82. Briend E, Ferguson GJ, Mori M, Damera G, Stephenson K, Karp NA, et al. IL-18 associated with lung lymphoid aggregates drives IFNγ production in severe COPD. Respir Res. (2017) 18:159. doi: 10.1186/s12931-017-0641-7
83. Seifert LL, Si C, Saha D, Sadic M, de Vries M, Ballentine S, et al. The ETS transcription factor ELF1 regulates a broadly antiviral program distinct from the type I interferon response. PloS Pathog. (2019) 15:e1007634. doi: 10.1371/journal.ppat.1007634
84. Yang L and Ding JL. MEK1/2 inhibitors unlock the constrained interferon response in macrophages through IRF1 signaling. Front Immunol. (2019) 10:2020. doi: 10.3389/fimmu.2019.02020
85. Najjar I and Fagard R. STAT1 and pathogens, not a friendly relationship. Biochimie. (2010) 92:425–44. doi: 10.1016/j.biochi.2010.02.009
86. Miorin L and Sanchez-Aparicio MT. SLiMs go viral! One more weapon against interferon. Cell Host Microbe. (2022) 30:286–8. doi: 10.1016/j.chom.2022.02.012
87. Li J, Yu L, Shen Z, Li Y, Chen B, Wei W, et al. miR-34a and its novel target, NLRC5, are associated with HPV16 persistence. Infection Genet Evol. (2016) 44:293–9. doi: 10.1016/j.meegid.2016.07.013
88. Remoli AL, Marsili G, Perrotti E, Acchioni C, Sgarbanti M, Borsetti A, et al. HIV-1 tat recruits HDM2 E3 ligase to target IRF-1 for ubiquitination and proteasomal degradation. mBio. (2016) 7. doi: 10.1128/mbio.01528-16
89. Yamaguchi H, Tsukamoto K, and Hashimoto K. Cell surface expression of MR1B, a splice variant of the MHC class I-related molecule MR1, revealed with antibodies. Biochem Biophys Res Commun. (2014) 443:422–7. doi: 10.1016/j.bbrc.2013.11.096
90. Narayanan GA, Nellore A, Tran J, Worley AH, Meermeier EW, Karamooz E, et al. Alternative splicing of MR1 regulates antigen presentation to MAIT cells. Sci Rep. (2020) 10:15429. doi: 10.1038/s41598-020-72394-9
91. Yigit M, Basoglu OF, and Unutmaz D. Mucosal-associated invariant T cells in cancer: dual roles, complex interactions and therapeutic potential. Front Immunol. (2024) 15. doi: 10.3389/fimmu.2024.1369236
92. Lewinsohn DM, Briden AL, Reed SG, Grabstein KH, and Alderson MR. Mycobacterium tuberculosis-reactive CD8+ T lymphocytes: the relative contribution of classical versus nonclassical HLA restriction. J Immunol. (2000) 165:925–30. doi: 10.4049/jimmunol.165.2.925
93. Wong J, Korcheva V, Jacoby DB, and Magun BE. Proinflammatory responses of human airway cells to ricin involve stress-activated protein kinases and NF-κB. Am J Physiology-Lung Cell Mol Physiol. (2007) 293:L1385–94. doi: 10.1152/ajplung.00207.2007
94. Kulicke CA, Swarbrick GM, Ladd NA, Cansler M, Null M, Worley A, et al. Delivery of loaded MR1 monomer results in efficient ligand exchange to host MR1 and subsequent MR1T cell activation. Commun Biol. (2024) 7:1–13. doi: 10.1038/s42003-024-05912-4
95. Hartmann N, McMurtrey C, Sorensen ML, Huber ME, Kurapova R, Coleman FT, et al. Riboflavin Metabolism Variation among Clinical Isolates of Streptococcus pneumoniae Results in Differential Activation of Mucosal-associated Invariant T Cells. Am J Respir Cell Mol Biol. (2018) 58:767–76. doi: 10.1165/rcmb.2017-0290OC
96. Brinkman EK, Chen T, Amendola M, and van Steensel B. Easy quantitative assessment of genome editing by sequence trace decomposition. Nucleic Acids Res. (2014) 42:e168. doi: 10.1093/nar/gku936
97. Conant D, Hsiau T, Rossi N, Oki J, Maures T, Waite K, et al. Inference of CRISPR edits from sanger trace data. CRISPR J. (2022) 5:123–30. doi: 10.1089/crispr.2021.0113
98. Li K, Vorkas CK, Chaudhry A, Bell DL, Willis RA, Rudensky A, et al. Synthesis, stabilization, and characterization of the MR1 ligand precursor 5-amino-6-D-ribitylaminouracil (5-A-RU). PloS One. (2018) 13:e0191837. doi: 10.1371/journal.pone.0191837
99. Livak KJ and Schmittgen TD. Analysis of relative gene expression data using real-time quantitative PCR and the 2(-Delta Delta C(T)) Method. Methods. (2001) 25:402–8. doi: 10.1006/meth.2001.1262
100. Heinzel AS, Grotzke JE, Lines RA, Lewinsohn DA, McNabb AL, Streblow DN, et al. HLA-E-dependent presentation of Mtb-derived antigen to human CD8+ T cells. J Exp Med. (2002) 196:1473–81. doi: 10.1084/jem.20020609
101. Muller RY, Hammond MC, Rio DC, and Lee YJ. An efficient method for electroporation of small interfering RNAs into ENCODE project tier 1 GM12878 and K562 cell lines. J Biomol Tech. (2015) 26:142–9. doi: 10.7171/jbt.15-2604-003
102. Dreos R, Ambrosini G, Groux R, Cavin Périer R, and Bucher P. The eukaryotic promoter database in its 30th year: focus on non-vertebrate organisms. Nucleic Acids Res. (2017) 45:D51–5. doi: 10.1093/nar/gkw1069
103. Wasserman WW and Sandelin A. Applied bioinformatics for the identification of regulatory elements. Nat Rev Genet. (2004) 5:276–87. doi: 10.1038/nrg1315
Keywords: MAIT (mucosal-associated invariant T) cell, MR1, airway epithelial cell, interferon-gamma, IRF1
Citation: Huber ME, Larson EA, Lust TN, Heisler CM and Harriff MJ (2025) IFNγ regulates MR1 transcription and antigen presentation. Front. Immunol. 16:1624767. doi: 10.3389/fimmu.2025.1624767
Received: 07 May 2025; Accepted: 09 September 2025;
Published: 26 September 2025.
Edited by:
Florent Ginhoux, Singapore Immunology Network (ASTAR), SingaporeReviewed by:
Luc Van Kaer, Vanderbilt University Medical Center, United StatesMariolina Salio, Immunocore, United Kingdom
Copyright © 2025 Huber, Larson, Lust, Heisler and Harriff. This is an open-access article distributed under the terms of the Creative Commons Attribution License (CC BY). The use, distribution or reproduction in other forums is permitted, provided the original author(s) and the copyright owner(s) are credited and that the original publication in this journal is cited, in accordance with accepted academic practice. No use, distribution or reproduction is permitted which does not comply with these terms.
*Correspondence: Melanie J. Harriff, bWVsYW5pZS5oYXJyaWZmM0B2YS5nb3Y=