 Shuifang Hu
 Mingcong Xu
 Shuping Li1†
 Wei Chen
 Zhenwei Peng
- 1Department of Radiation Oncology, The First Affiliated Hospital of Sun Yat-sen University, Guangzhou, China
- 2Center of Hepato-Pancreato-Biliary Surgery, The First Affiliated Hospital of Sun Yat-sen University, Guangzhou, China
- 3Department of Pancreaticobiliary Surgery, The First Affiliated Hospital of Sun Yat-sen University, Guangzhou, China
- 4Institute of Precision Medicine, The First Affiliated Hospital of Sun Yat-sen University, Guangzhou, China
- 5Cancer Center, The First Affiliated Hospital of Sun Yat-sen University, Guangzhou, China
- 6Clinical Trials Unit, The First Affiliated Hospital of Sun Yat-sen University, Guangzhou, China
Background & Aims: Immune checkpoint inhibitors (ICIs) show heterogeneous efficacy in advanced hepatocellular carcinoma (HCC), but existing biomarkers are invasive and costly. We aimed to develop a noninvasive prognostic model using routine clinical parameters.
Materials and methods: This retrospective study included 537 advanced HCC patients treated with PD-1/PD-L1 inhibitors, randomly divided into training (n=322) and validation (n=215) cohorts. Continuous variables were dichotomized using R packages. Univariate Cox regression followed by LASSO regression with 10-fold cross-validation selected predictive features for nomogram construction. Model performance was assessed via time-dependent receiver operating characteristic (ROC) curves, calibration plots, and decision curve analysis (DCA). Cox proportional hazards models identified independent prognostic factors.
Results: Baseline characteristics were balanced between training and validation cohorts (P>0.05). The LASSO-derived nomogram incorporated 13 risk factors, which encompass multiple dimensions such as tumor characteristics, nutritional status, and inflammation. The model demonstrated robust discrimination, with the area under the curve (AUC) values exceeding 0.75 for 3-, 6-, 12-, and 24-month overall survival (OS). Calibration curves demonstrated a strong concordance between the predicted survival probabilities and the actual observations, and DCA revealed that the nomogram could increase net benefit. Additionally, the nomogram successfully stratified patients into low-risk and high-risk groups based on OS risk, with significant survival differences observed between the two groups in both the training and validation cohorts (all p < 0.001).
Conclusions: This validated nomogram integrating inflammatory, nutritional, and tumor characteristics provides a cost-effective tool for prognostic stratification in advanced HCC patients undergoing immunotherapy, potentially guiding personalized therapeutic strategies.
Introduction
According to the latest global cancer statistics, liver cancer is the third leading cause of cancer-related mortality, with approximately 757,000 deaths worldwide (1). Notably, China has a significantly higher incidence and mortality rate compared to the global average. Over 50% of patients present with advanced-stage disease at diagnosis due to nonspecific early symptoms, high Hepatitis B Virus (HBV) prevalence, and inadequate surveillance (2, 3).
However, durable responses to immune checkpoint blockade (ICB) in HCC remain restricted to a minority of patients, with existing biomarkers (e.g., PD-L1, TMB) demonstrating limited clinical utility for guiding precision therapy due to intratumoral heterogeneity, high detection costs, and inconsistent predictive performance (4–6). For instance, although PD-1/PD-L1 inhibitors have been approved by the FDA for TMB-high solid tumors, their response rates vary significantly across studies (15-30%), and their clinical application is constrained by inconsistent cutoff values (8–15 mutations/Mb) and lack of standardized detection methods (7). Therefore, there is an urgent need for non-invasive predictive tools based on routinely available clinical parameters to optimize treatment decisions.
Previous studies have shown that various biomarkers can affect the prognosis of immunotherapy in HCC patients, including markers related to tumor biology, nutritional status, and inflammatory metabolism. Among them, alpha-fetoprotein (AFP) is not only an important indicator for the diagnosis and prognosis of HCC, but its dynamic changes can also predict the efficacy of immunotherapy (8). The Prognostic Nutritional Index (PNI) has been confirmed as an independent predictor of OS in combination with immunotherapy (HR = 1.77, p < 0.001) (9, 10). Metabolic markers, such as lactate dehydrogenase (LDH), which reflects tumor glycolytic activity, are associated with poor prognosis when baseline levels are elevated (11). Fibrinogen (FIB) reduces the effectiveness of immunotherapy by promoting angiogenesis and creating an immunosuppressive microenvironment (12). Additionally, HCC is a malignancy closely related to chronic inflammation, and systemic inflammation affects the efficacy of ICIs by reshaping the tumor immune microenvironment (13). Inflammatory markers, such as the Systemic Immune-Inflammation Index (SII) and Neutrophil-Lymphocyte Ratio (NLR), are associated with poorer survival outcomes in HCC patients (14–18). However, there is no consensus on which biomarkers have the most predictive prognostic value, and the interactions between tumor characteristics, nutrition, and inflammatory metabolism still require systematic investigation.
To address fragmented biomarker studies and multicollinearity, we developed a multidimensional nomogram integrating pretreatment baseline data of nutritional, inflammatory, and tumor characteristics. Least Absolute Shrinkage and Selection Operator (LASSO) regression with cross-validation identified key predictors, enabling robust prognostic stratification. This model transcends single-biomarker limitations, offering a cost-effective, noninvasive tool to guide personalized immunotherapy in advanced HCC.
Materials and methods
Patient characteristics
This single-center retrospective cohort study enrolled 537 patients with Barcelona Clinic Liver Cancer (BCLC) C stage HCC who received PD-1/PD-L1 inhibitors (atezolizumab, camrelizumab, etc.) as monotherapy or combined with local therapies (TACE, HAIC, radiofrequency ablation), targeted agents (anti-angiogenics, TKIs), or radiotherapy at Sun Yat-sen University First Hospital (January 2019–May 2023). Inclusion criteria: (1) age ≥ 18 years; (2) histologically/radiologically confirmed unresectable or recurrent metastatic advanced HCC (BCLC C); (3) ≥ 2 cycles of PD-1/PD-L1 therapy; (4) ECOG performance score 0-1; (5) Child-Pugh A/B; (6) complete baseline clinical, imaging, and laboratory data. Exclusion criteria: (1) mixed/sarcomatoid HCC; (2) concurrent malignancies; (3) first immunotherapy administered outside our hospital; (4) missing key data or incomplete follow-up; (5) active autoimmune disease requiring systemic therapy. Patients were randomized 6:4 into training (n=322) and validation (n=215) cohorts (Figure 1).
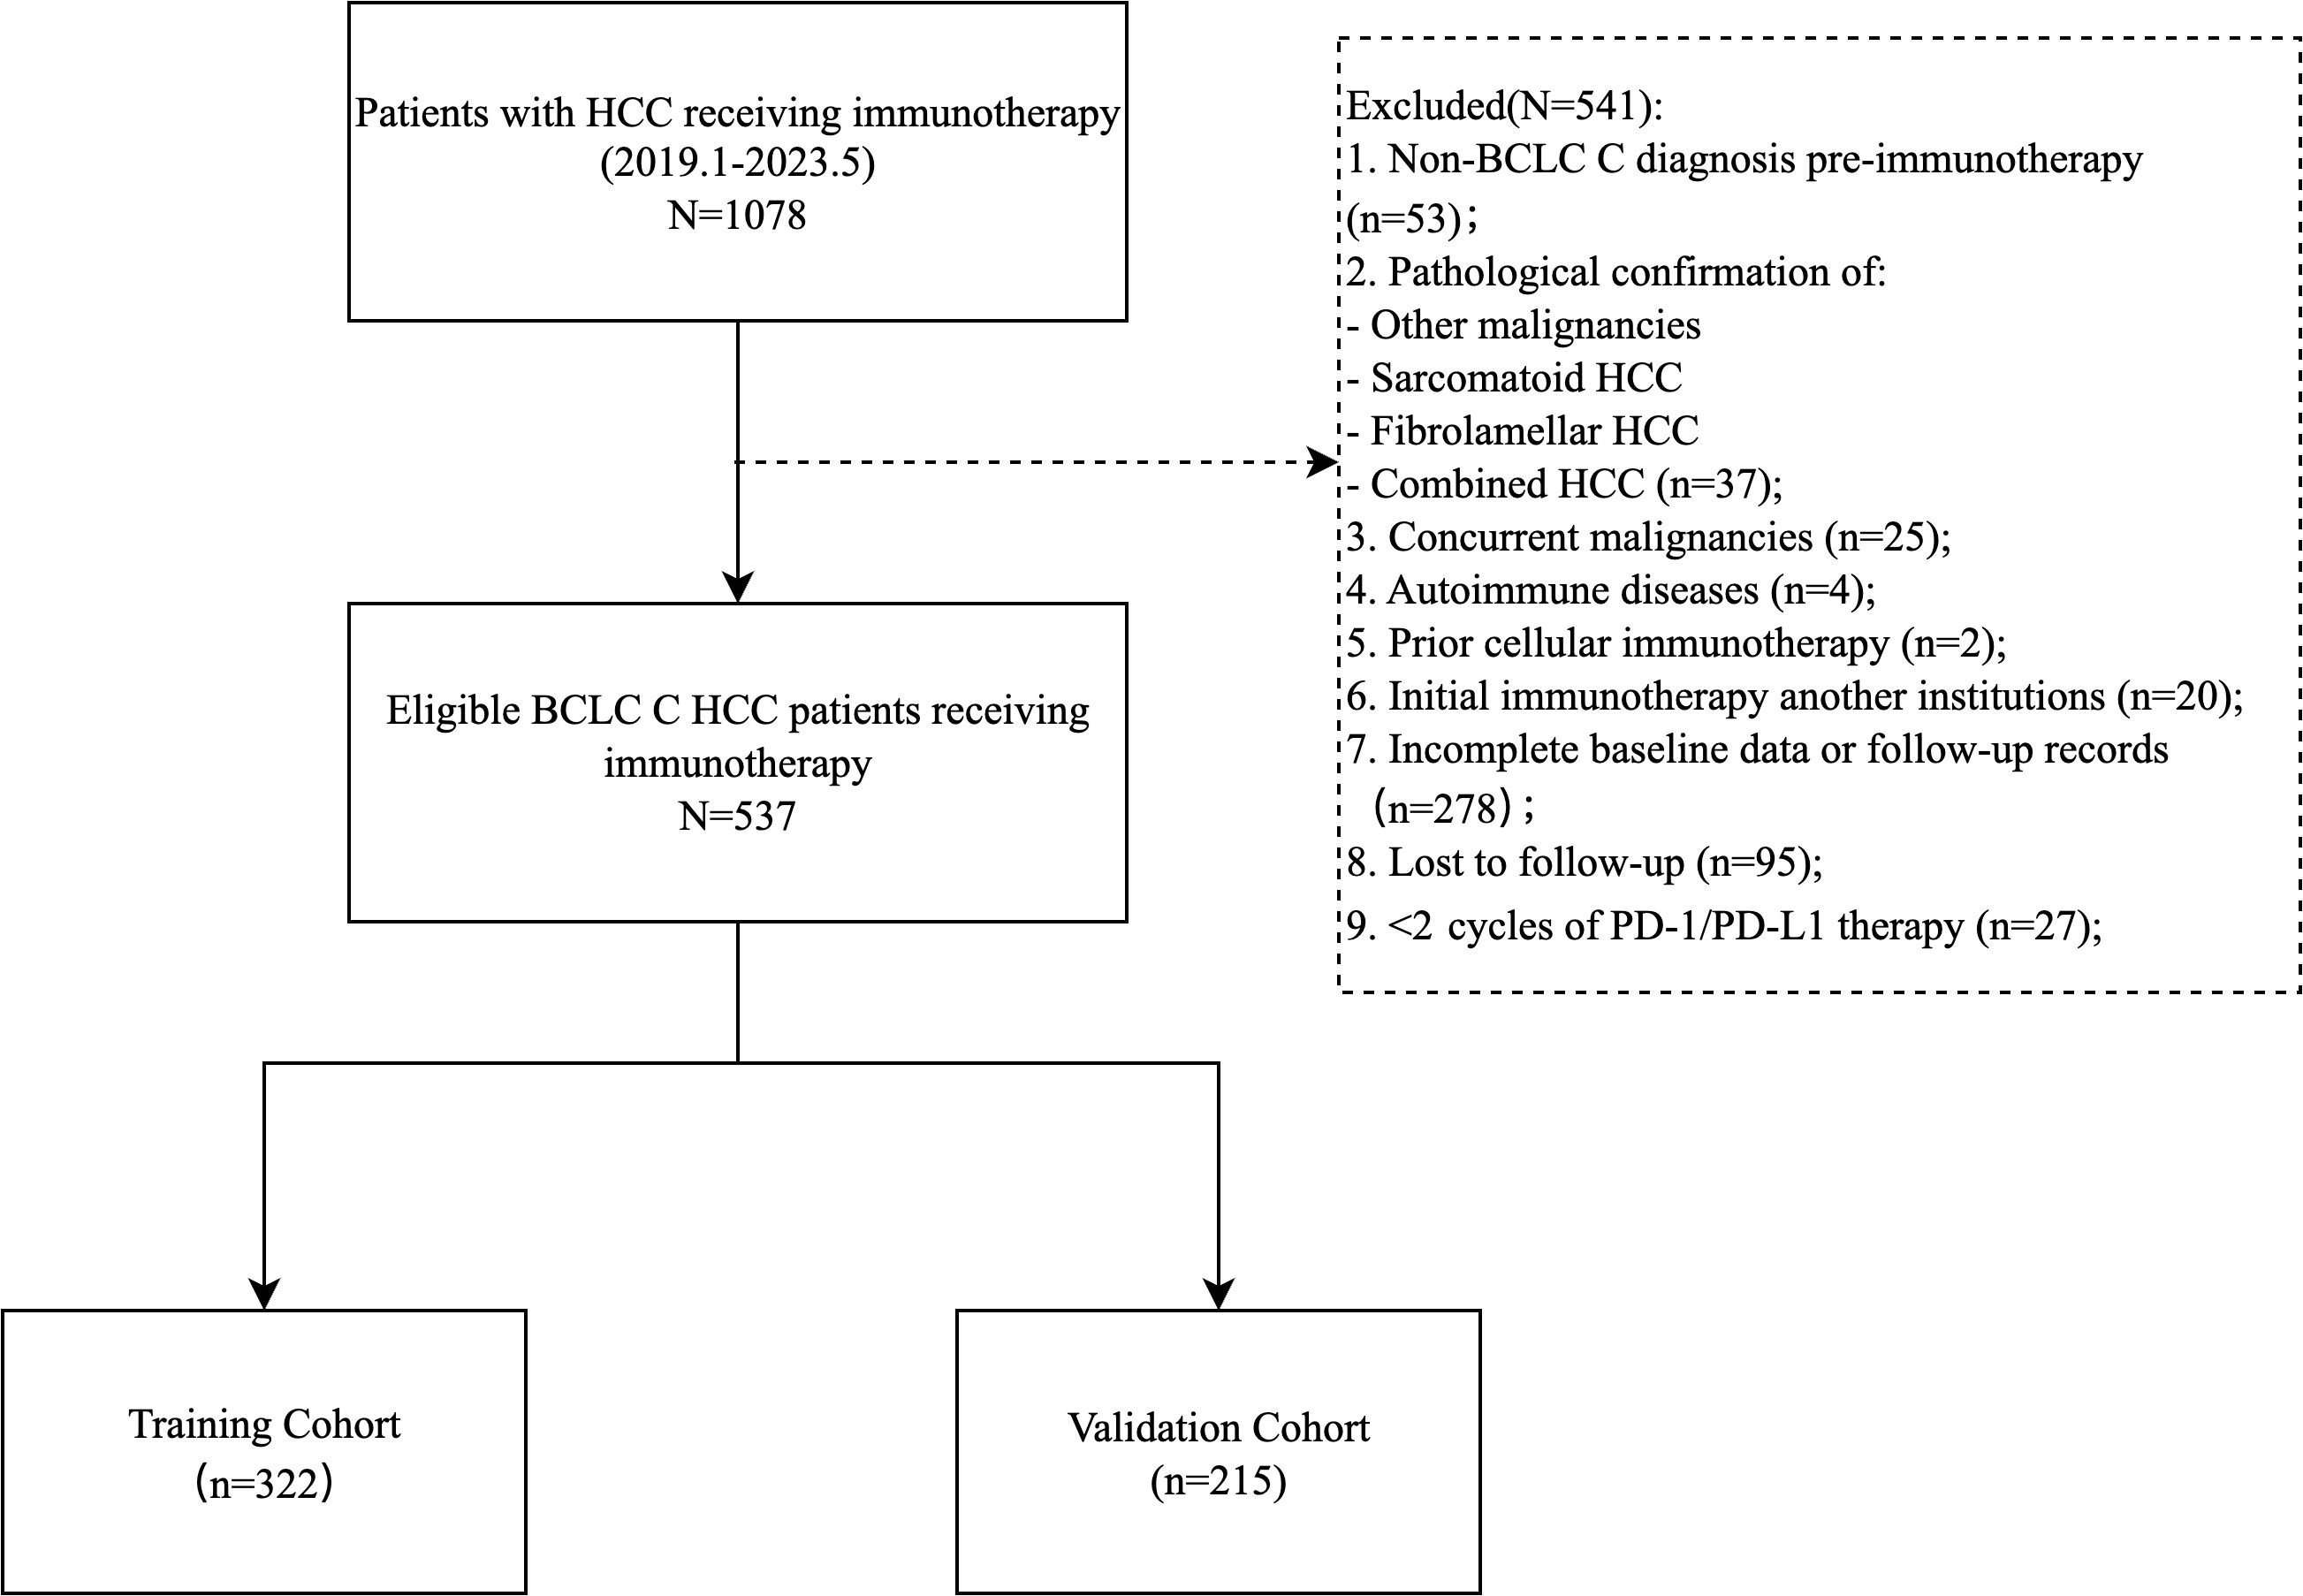
Figure 1. Flowchart of this study population.
This study was approved by the Institutional Research Ethics Committee of the First Affiliated Hospital of Sun Yat-sen University. Due to the retrospective nature, informed consent was waived. The study was conducted in accordance with the Helsinki Declaration.
Data collection
Demographic characteristics, treatment-related details, and clinical baseline characteristics from the week prior to the first immunotherapy were collected through the electronic medical record system. Demographic data included age, gender, weight, height; etiology included smoking history, alcohol consumption history, hepatitis B virus (HBV) and hepatitis C virus (HCV) infections; imaging features included liver cirrhosis, lymph node metastasis, extrahepatic metastasis, portal vein tumor thrombus (PVTT), hepatic vein tumor thrombus (HVTT), and ascites; laboratory indicators included liver function [total bilirubin (TBIL), aspartate aminotransferase (AST), alanine aminotransferase (ALT), albumin (ALB), globulin (GLO)], blood routine [hemoglobin (Hb), platelet distribution width (PDW), neutrophil count, lymphocyte count, platelet count, monocyte count], AFP, LDH, and FIB. Based on these indicators, composite scores were calculated, including body mass index (BMI), NLR, platelet-to-lymphocyte ratio (PLR), lymphocyte-to-monocyte ratio (LMR), albumin-to-globulin ratio (AGR), PNI, SII, aminotransferase-to-platelet ratio index (APRI), albumin-bilirubin index (ALBI), aminotransferase-to-neutrophil ratio index (ANRI), Hb, albumin, lymphocyte, and platelet (HALP) score, and the modified Gustave Roussy Immune (GRIm). Standardized Formulas for Composite Scores were as follows:
BMI= Weight (kg)/Height (m) 2;
NLR= Neutrophil count/Lymphocyte count;
PLR= Platelet count/Lymphocyte count;
LMR= Lymphocyte count/Monocyte count;
AGR= ALB (g/L)/GLO (g/L);
PNI=Serum albumin (g/L)+5× lymphocyte count (×109/L) (19);
SII= [Neutrophil count (×109/L)×Platelet count (×109/L)]/Lymphocyte count (×109/L) (20);
APRI=[AST (U/L)/upper limit of normal range] × 100/Platelet count (×109/L) (21);
ALRI=AST (U/L)/Lymphocyte count (×109/L) (22);
ALBI=log10TBIL (umol/L)×0.66−ALB (g/L)×0.085 (23);
ANRI= AST (U/L)/Neutrophil count (×109/L);
HALP= Hb (g/L)×ALB (g/L)×Lymphocyte count (×109/L)/Platelet count (×109/L) (24);
GRIm-score:NLR>6, ALB<35g/L, LDH>240U/L, 1 point for each, total score range: 0-3.
Follow-up
Patients were assessed every 2–3 months during the first year, and every 6 months thereafter. Follow-up evaluations included routine blood tests, liver function tests, AFP levels, and CT/MRI scans. Two radiologists independently analyzed the imaging results, and in case of any discrepancies, the final decision was made through discussion or by consulting a third-party expert. OS was defined as the time from the start of immunotherapy to death from any cause or the last follow-up, while progression-free survival (PFS) was defined as the time from the start of immunotherapy to radiological progression (RECIST 1.1), death, or the last follow-up. The follow-up period ended on May 30, 2023.
Statistical analysis
Normality of continuous variables was assessed using the Shapiro-Wilk test. Normally distributed variables were expressed as mean ± standard deviation and compared via Student’s t-test, while non-normally distributed variables were reported as median (interquartile range [IQR]) and analyzed using the Mann-Whitney U test. Categorical variables were presented as frequencies (percentages) and compared via Pearson’s χ² test or Fisher’s exact test, as appropriate. Optimal cutoff values for continuous biomarkers were determined using R packages based on OS. Univariate Cox proportional hazards regression was first performed to identify potential prognostic factors (P < 0.05 threshold for inclusion). Variables meeting this criterion were subsequently incorporated into multivariate Cox regression. To address multicollinearity and enhance model robustness, LASSO regression with 10-fold cross-validation was used to optimize variable selection. The optimal penalty parameter (λ) was determined using the λ.1se criterion, which selects the most parsimonious model whose performance is within one standard error of the minimum cross-validated error. This approach prioritizes model simplicity and generalizability over maximal fitting of the training data. Multicollinearity among the LASSO-selected variables was explicitly assessed by calculating variance inflation factors (VIFs). All VIF values remained below the conservative threshold of 5, confirming that significant multicollinearity was not present in the final model. A prognostic nomogram was then constructed using selected predictors. Discrimination was evaluated using time-dependent ROC curves. Calibration curves assessed agreement between predicted and observed survival probabilities. Clinical utility was quantified via DCA. Risk stratification was performed using the median value of calculated risk scores in the training cohort as the cutoff. This threshold was then applied to the validation cohort to categorize patients into high- and low-risk groups. Survival differences across risk strata were visualized using Kaplan-Meier curves and compared via log-rank tests. All analyses were conducted using SPSS 26.0 and R 4.3.1 (packages: survival, ggplot2, time-ROC.etc). A p-value < 0.05 was considered statistically significant.
Results
Patient characteristics
The study ultimately included 537 patients, with 322 in the training group and 215 in the validation group (Figure 1). The median PFS was 7.7 months (95% CI: 6.5-9.7), and the median OS was 27.3 months (95% CI: 21.9-35.0) (Supplementary Figure S1).
Baseline demographic and clinical characteristics are summarized in Table 1. The cohort comprised predominantly males (91.1%), with a median age of 53.31 ± 11.17 years and median BMI of 22.87 ± 3.31 kg/m². The majority (85.1%) had HBV infection, while HCV infection was rare (3.4%). Imaging studies demonstrated cirrhosis in 40.6% of cases, PVTT in 50.1%, and extrahepatic metastases in 54.0%. Hepatic function assessments classified 77.7% as Child-Pugh grade A and 76.2% as ALBI grade 2. Elevated AFP levels exceeding 400 ug/L were observed in 50.8% of patients. The most commonly used immunotherapy agents are camrelizumab (36.1%) and tislelizumab (29.4%). The training and validation cohorts demonstrated balanced baseline characteristics across all key variables, with no statistically significant intergroup differences (all p > 0.05).

Table 1. Baseline characteristics of enrolled HCC patients in training set and validation set.
Determination of optimal cut-off
The optimal cutoff values for baseline prognostic biomarkers associated with OS were determined based on the highest log-rank statistic (Supplementary Figure S2), including the following: age (38 years), BMI (19.78 kg/m²), AGR (0.94), LDH (191.00 U/L), FIB (3.13 g/L), Hb (128.00 g/L), PDW (10.50 fl), NLR (3.34), SII (1356.42), PLR (228.96), LMR (3.77), PNI (43), ANRI (27.01), ALRI (42.36), APRI (1.26), and HALP (17.52). Patients were classified into high-risk and low-risk groups based on these cutoff values for OS (Supplementary Figure S3).
Univariate and multivariate Cox regression analysis
Through univariate Cox regression analysis in the training cohort, we identified 21 clinical factors significantly associated with OS (P < 0.05) (Table 2).
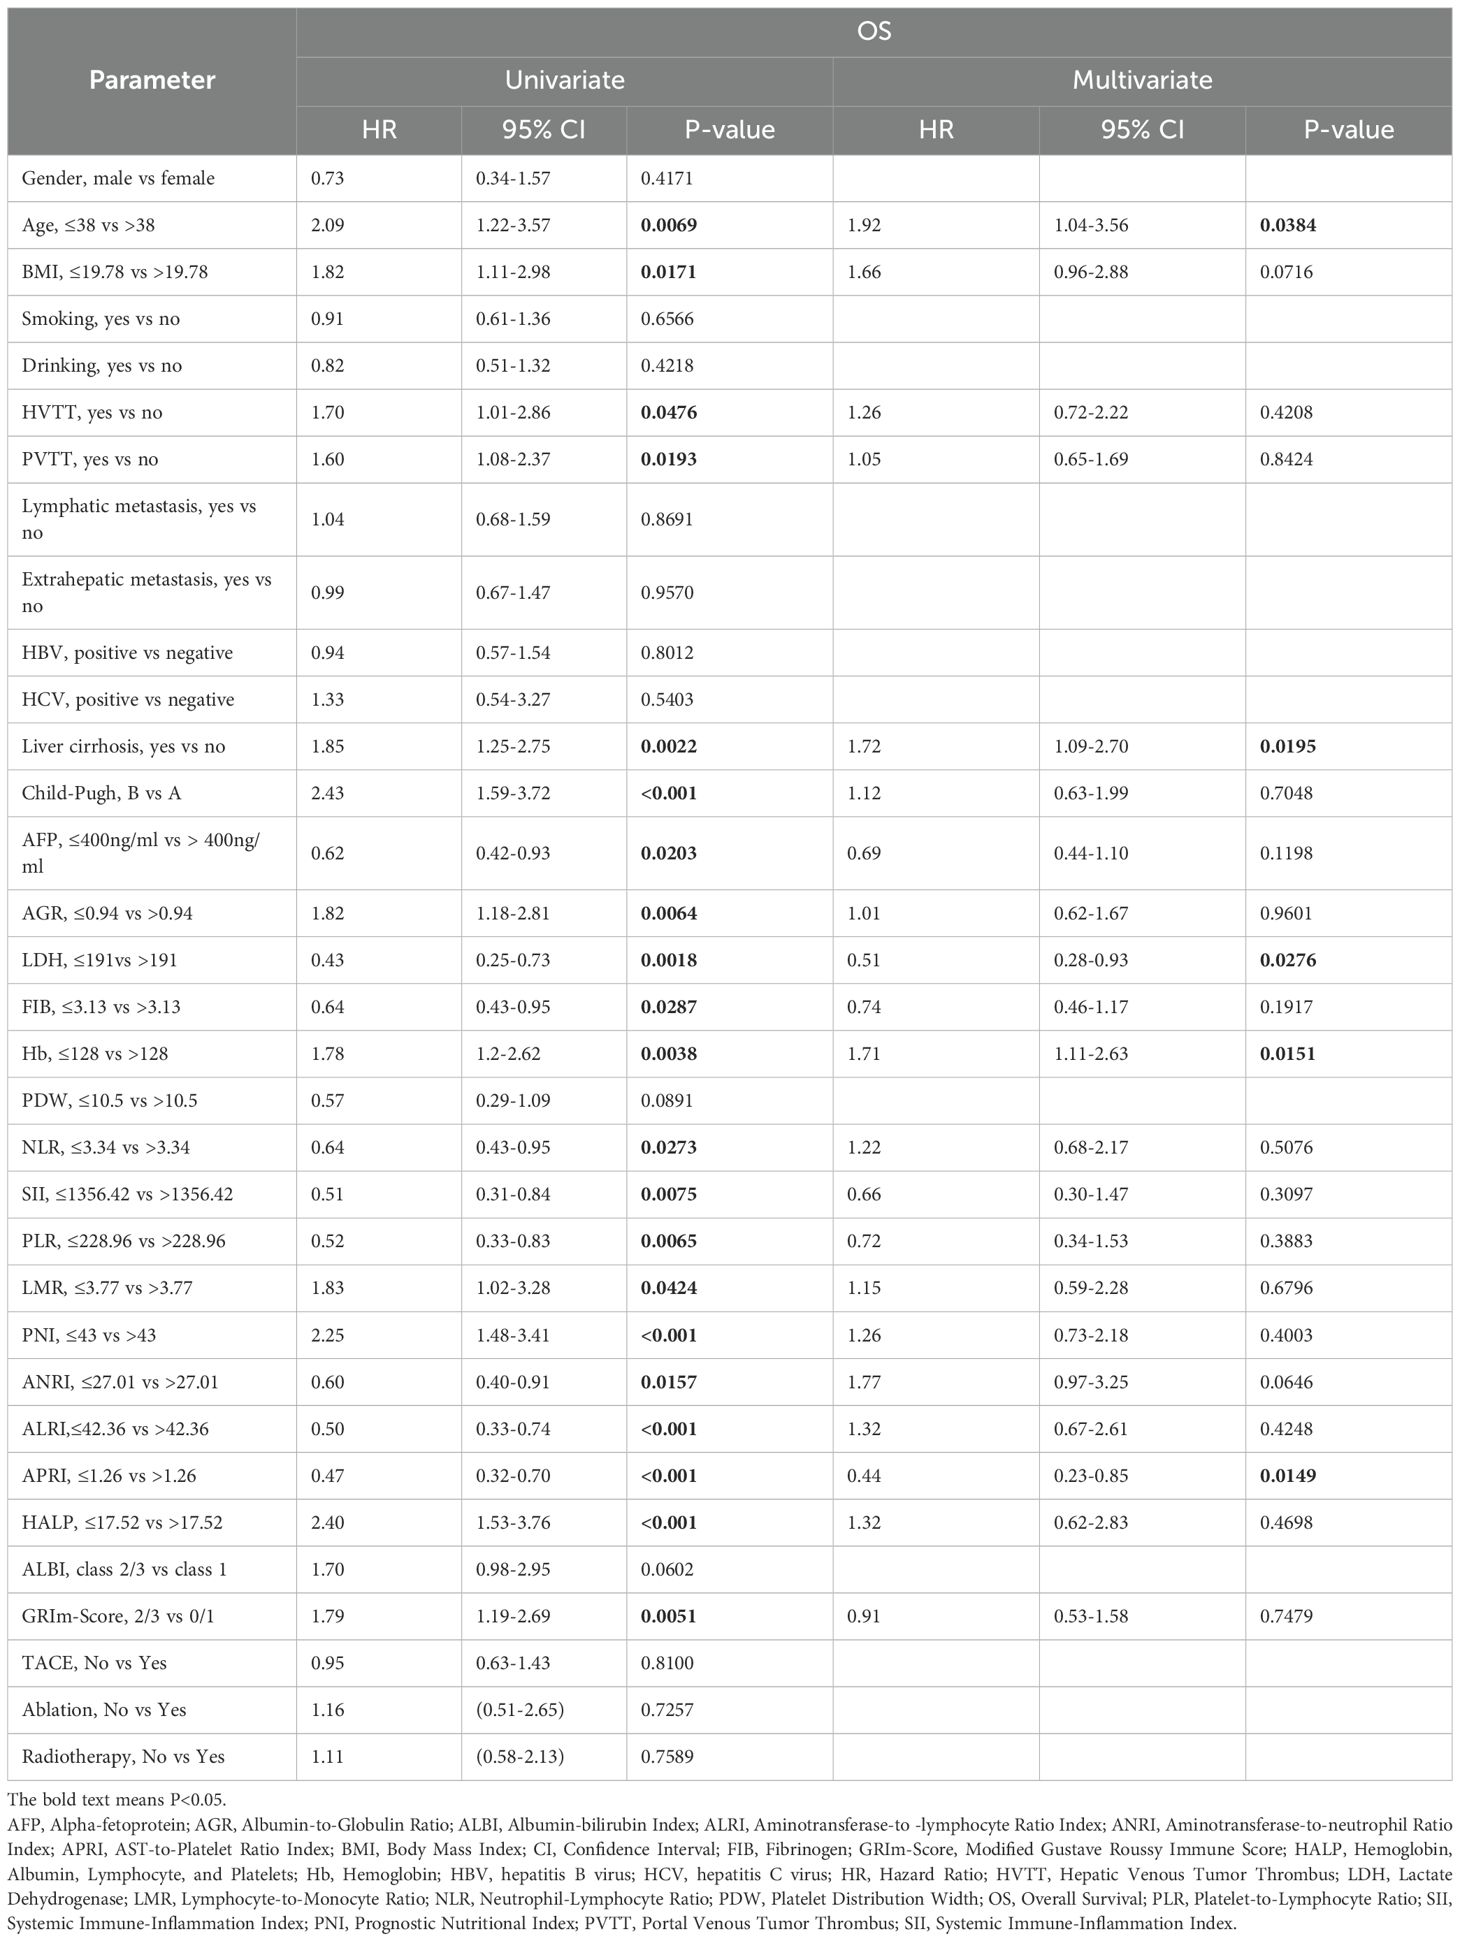
Table 2. Univariate and multivariate cox hazards analysis for overall survival in the training cohort.
In the multivariate Cox regression model, LDH ≤ 191 U/L (HR = 0.51, 95% CI: 0.28-0.93, P = 0.028) and APRI ≤1.26 (HR = 0.44, 95% CI: 0.23-0.85, P = 0.015) demonstrated significant survival-protective effects, while Liver cirrhosis (HR = 1.72, 95% CI: 1.09-2.70, P = 0.020), Age ≤38 years (HR = 1.92, 95% CI: 1.04-3.56, P = 0.038) and Hb ≤ 128 g/L (HR = 1.71, 95% CI: 1.11-2.63, P = 0.015) was independently associated with a shortened OS (Table 2). Kaplan-Meier survival analysis for OS further validated the prognostic value of these biomarkers (Supplementary Figure S4).
Prognostic factor selection and nomogram construction
Univariate Cox regression analysis (with a screening threshold of P < 0.2) was first performed to identify prognostic factors associated with OS. Subsequently, LASSO regression with 10-fold cross-validation and the λ.1SE criterion was used to optimize the variable selection. Thirteen independent prognostic factors with non-zero coefficients were identified: age, BMI, Child-Pugh grade, liver cirrhosis, AFP, FIB, Hb, LDH, PDW, PNI, SII, HALP and APRI (Figure 2; Supplementary Figure S5, Supplementary Table S1). The nomogram constructed based on these variables allows for the intuitive quantification of the contribution of each clinical factor to predicting the 3/6/12/24-month survival probability of advanced HCC patients after immunotherapy (Figure 3A).
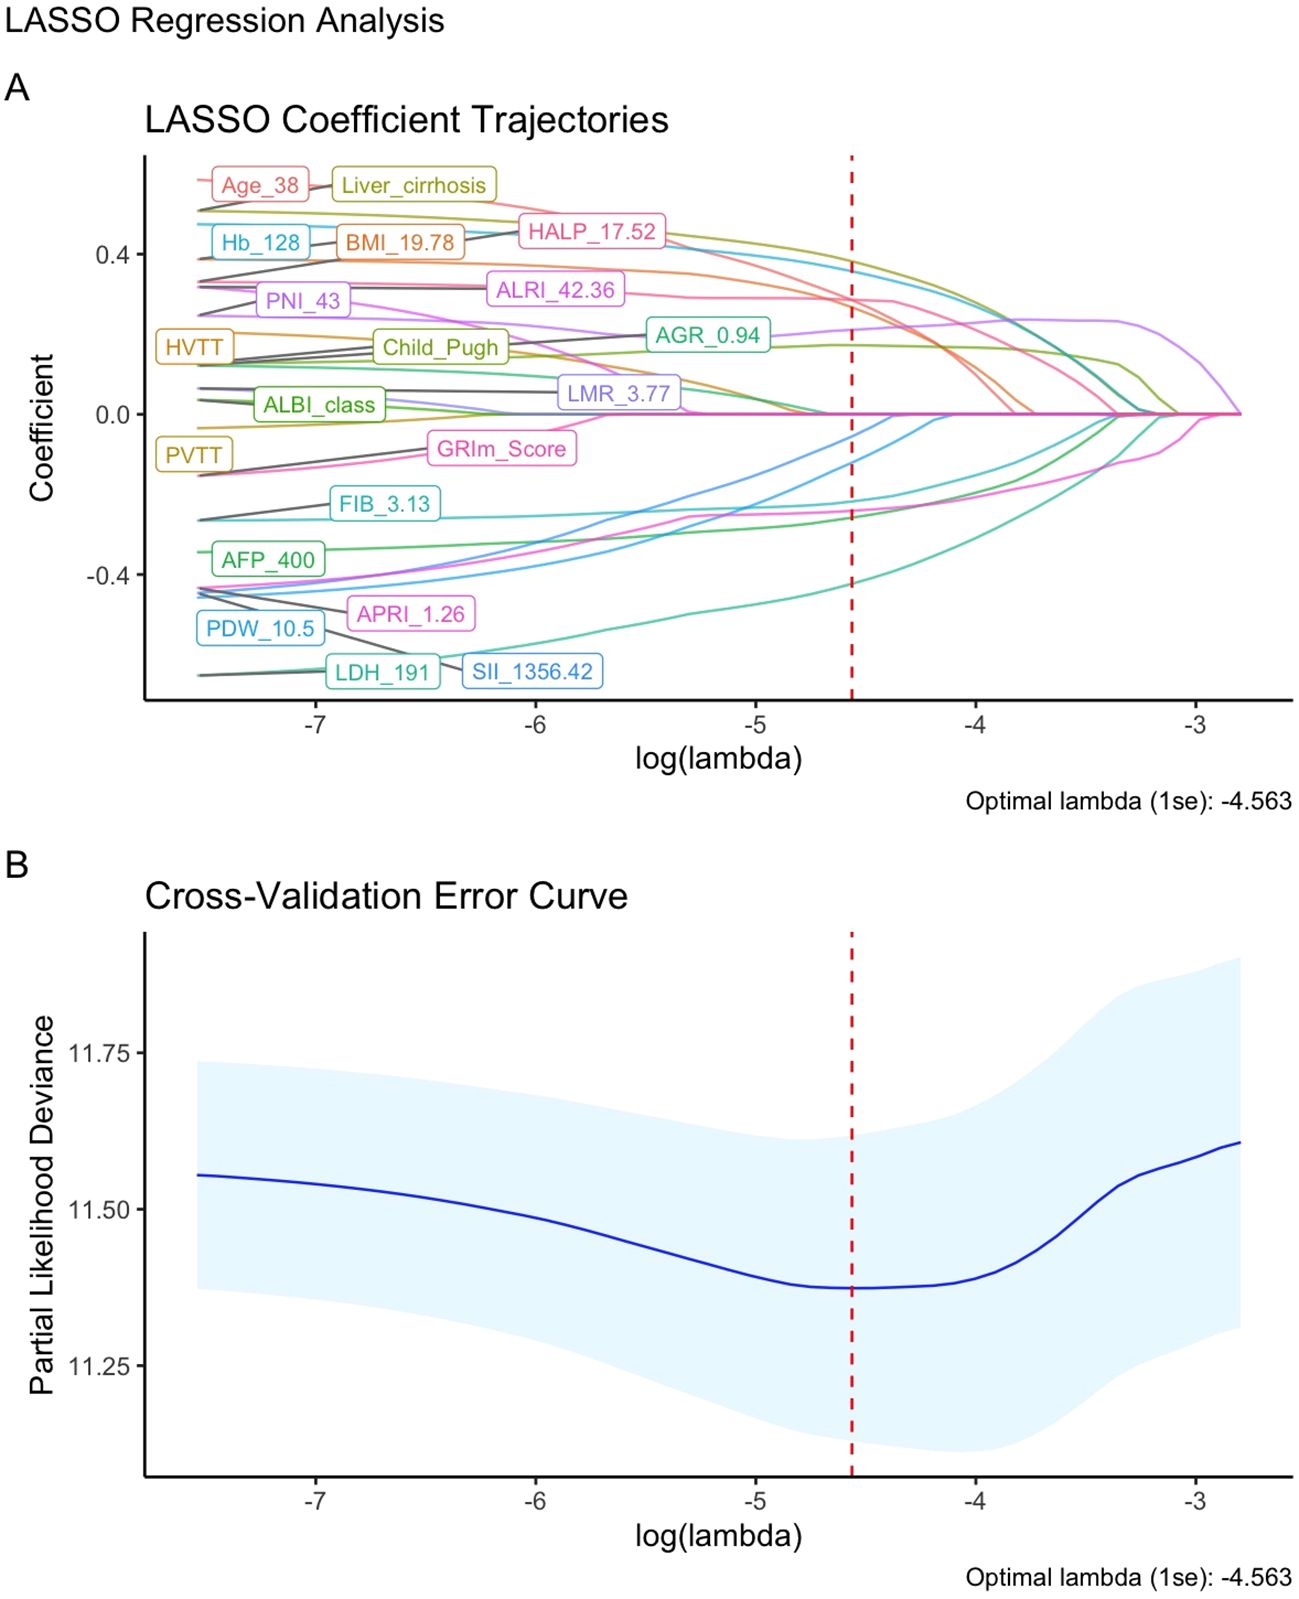
Figure 2. Feature Selection using LASSO regression. (A) LASSO coefficient path for OS-related potential prognostic factors; (B) LASSO regression cross-validation curve.
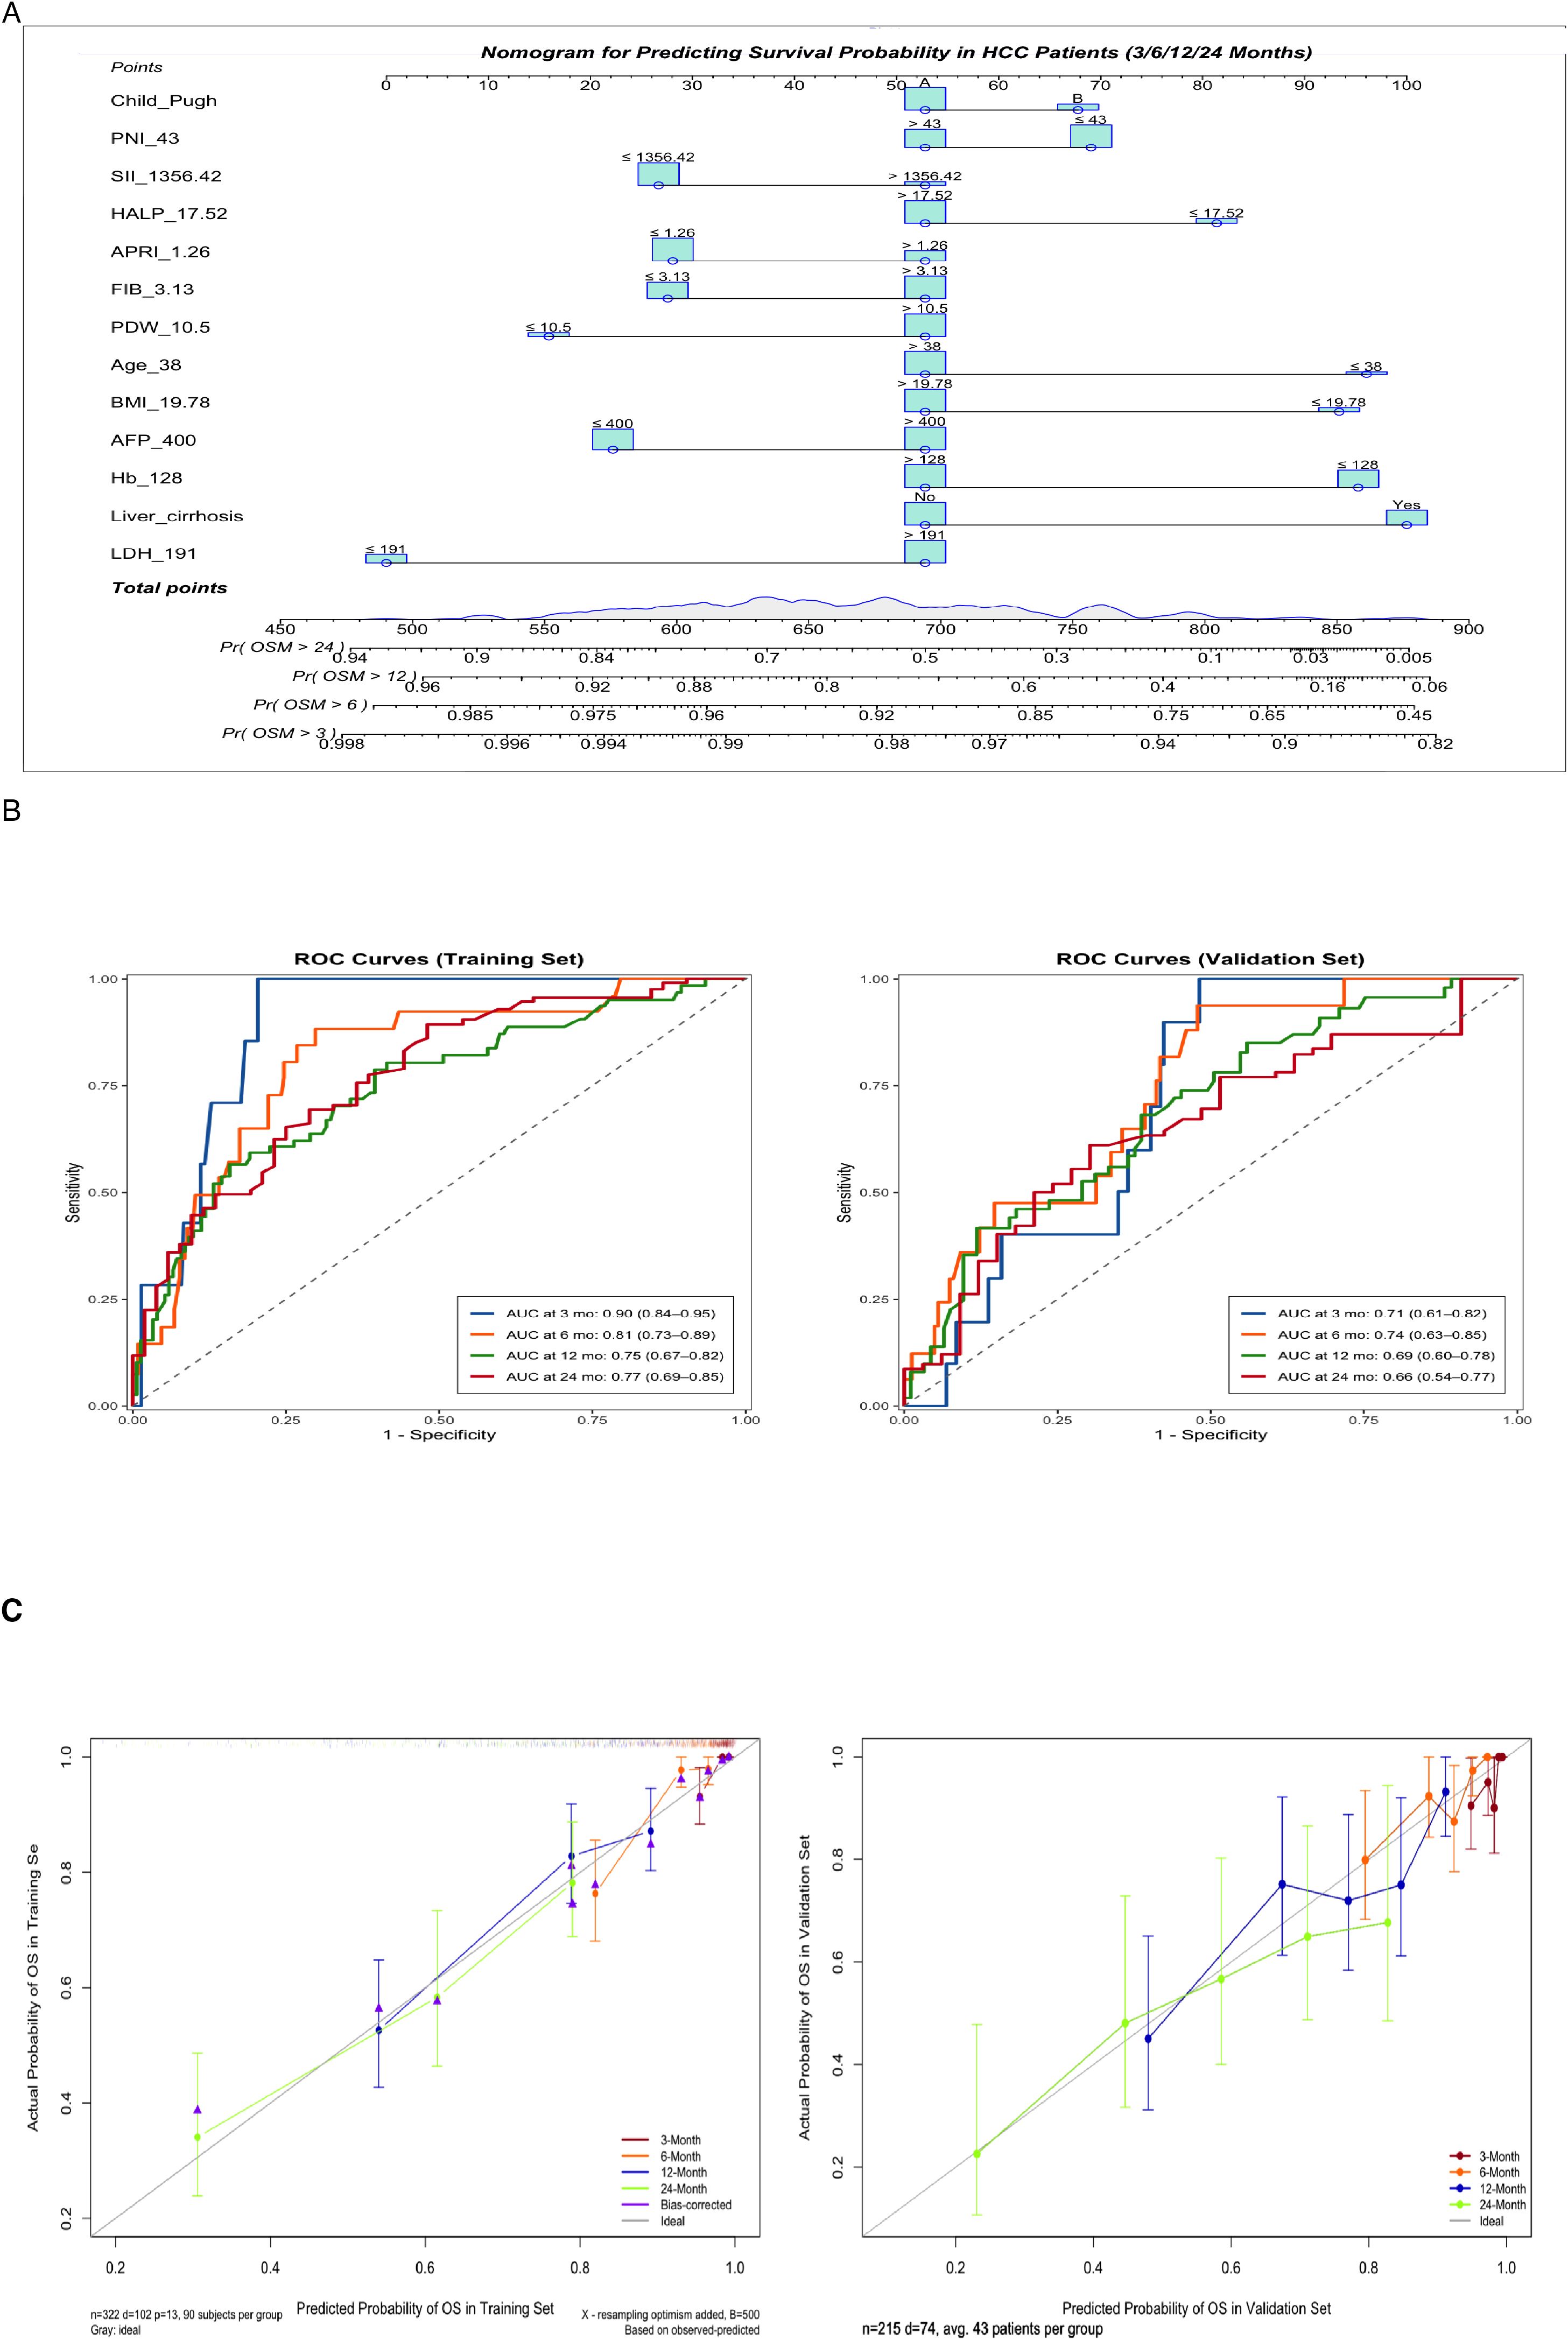
Figure 3. (A) Nomogram for predicting 3-, 6-, 12-, and 24-month overall survival. Instructions: Locate the patient’s value for each variable, draw a line upward to determine the points, sum all points, and locate the total points on the ‘Total Points’ axis. A line drawn downward to the survival axes indicates the predicted probability of survival at each timepoint. (B) Time-dependent receiver operating characteristic (ROC) curves at 3, 6, 12, and 24 months for predicting overall survival probabilities in the training and validation cohorts. (C) Calibration curves for predicting 3-, 6-, 12-, and 24-month survival probabilities in the training and validation sets.
Model performance validation
The nomogram demonstrated good discriminatory ability in the training cohort, with a C-index of 0.72 (95% CI: 0.67–0.78). Time-dependent ROC curve analysis showed that the model predicted the 3/6/12/24-month OS with AUC values of 0.90 (95% CI: 0.84–0.95), 0.81 (95% CI: 0.73–0.89), 0.75 (95% CI: 0.67–0.82), and 0.77 (95% CI: 0.69–0.85) in the training cohort, respectively. The corresponding AUC values in the validation cohort remained stable (0.71 [95% CI:0.61–0.82], 0.74 [95% CI:0.63–0.85], 0.69 [95% CI:0.60–0.78], 0.66 [95% CI:0.54–0.77]) (Figure 3B). Calibration curves demonstrated a high concordance between the predicted survival probabilities and the Kaplan-Meier observed values in both the training and validation cohorts (Figure 3C). DCA further confirmed its clinical utility: when the threshold probability ranged from 20% to 60%, the nomogram showed a significantly higher net clinical benefit compared to traditional single biomarker models in both the training and validation cohorts (Figure 4).

Figure 4. Decision curve analysis (DCA) of overall survival in the training and validation cohorts. The DCA compares the net clinical benefit of the nomogram, “Treat All,” “Treat None,” and traditional biomarkers.
Survival analysis based on risk stratification from the nomogram
Using the nomogram developed in this study, patients were categorized into low-risk and high-risk groups based on calculated risk factors. In the training cohort, the high-risk group had an OS hazard ratio (HR) of 3.22 (95% CI: 2.11–4.91; P < 0.0001) (Figure 5). In the validation cohort, the HR for OS in the high-risk group was 2.47 (95% CI: 1.48–4.13; P < 0.001). While the nomogram was developed for OS, it also predicts PFS with clinical relevance. In the training cohort, the HR for PFS in the high-risk group was 1.69 (95% CI: 1.27–2.26; P < 0.001) (Figure 5), and in the validation cohort, the HR for PFS was 1.59 (95% CI: 1.11–2.28; P = 0.01).

Figure 5. Kaplan-Meier plots of OS for the low-risk group and high-risk group in the training and validation cohort.
Subgroup validation demonstrating model robustness
The model exhibited consistent discriminative ability across different treatment strategies. For the ICI + anti-angiogenic therapy group (n=75), the AUCs at 3, 6, 12, and 24 months were 0.78 (95% CI: 0.67–0.88), 0.95 (0.86–1.00), 0.65 (0.45–0.86), and 0.66 (0.40–0.93), respectively. In the ICI + TKIs group (n=342), the corresponding AUCs were 0.85 (0.77–0.92), 0.78 (0.70–0.86), 0.73 (0.65–0.80), and 0.76 (0.67–0.85) (Supplementary Figure S6). There were no significant differences in OS (P = 0.91) or PFS (P = 0.76) between the treatment groups, confirming that the model’s risk stratification remained consistent regardless of the therapeutic regimen (Supplementary Figure S7).
In the HBV-positive cohort (n=457, 85.1%), the model maintained stable performance, with AUCs of 0.78 (0.70–0.86), 0.79 (0.72–0.86), 0.75 (0.69–0.81), and 0.74 (0.66–0.81) at 3, 6, 12, and 24 months. Calibration curves showed excellent alignment with observed outcomes, and decision curve analysis demonstrated significant net benefit within clinical decision thresholds, further validating the model’s clinical utility in HBV-endemic populations (Supplementary Figure S8).
Discussion
Breakthrough advances in immunotherapy have significantly improved survival in advanced HCC patients, but the heterogeneity of treatment responses remains a challenge in clinical practice (25). There is a need for prognostic tools that integrate multiple biological factors to overcome the limitations of single biomarkers in predicting therapeutic efficacy. This study developed the first prognostic nomogram, constructed using 13 key indicators identified by LASSO regression, which integrates demographic, tumor, inflammatory, and nutritional metabolism features, providing a novel strategy for stratified management of advanced HCC in immunotherapy.
The 13 factors were categorized into four groups: (1) Demographic characteristics: Age, BMI; (2) Tumor characteristics and liver function: liver cirrhosis, AFP, Child Pugh; (3) Systemic inflammatory and fibrotic response: LDH, FIB, SII, HALP, APRI, PDW. These markers indicate tumor-associated inflammation and liver fibrosis progression (26–29); (4) Nutritional metabolism: Hb, PNI. The model demonstrated good discrimination and calibration in both the training and validation cohorts, with notable advantages in early prediction. Notably, the model demonstrated consistent predictive performance in both HBV-positive patients and across subgroups receiving different combination therapies, further validating its clinical applicability.
Among all factors, pretreatment elevated LDH conferred the highest weight in our model, underscoring its pivotal role. Our findings align with a large propensity score-matched study where high LDH levels (>241 U/L) were independently associated with shorter OS (median OS: 10.7 vs. 38.6 months, HR = 1.37, 95% CI: 1.20–1.55, P < 0.001) (11). Another retrospective study on patients undergoing HCC liver resection further confirmed that LDH is an independent risk factor for OS (HR = 1.807, 95% CI: 1.262–2.587, P < 0.001) (30). The prognostic value of LDH is closely related to its role in lactate metabolism. As a key rate-limiting enzyme in glycolysis, LDH catalyzes the conversion of pyruvate to lactate, driving tumor microenvironment acidification. This induces M2 macrophage polarization, inhibits CTL/NK cell function, and while also enhances Treg immunosuppressive activity, collectively shaping an immunosuppressive “cold tumor” microenvironment (31). Therefore, targeting the LDH-lactate axis may be a promising strategy to improve HCC immunotherapy response by reversing microenvironment acidification and restoring immune cell function.
As the end-stage manifestation of liver fibrosis (32), cirrhosis demonstrated significant prognostic value in our study. LASSO regression analysis revealed a significantly increased risk score in cirrhotic patients (coefficient +0.382, second only to LDH), indicating cirrhosis as an independent risk factor affecting immunotherapy efficacy. This finding, along with other predictive factors in our model, such as Child-Pugh (which incorporates cirrhosis assessment), FIB, and APRI, collectively forms a liver disease-based predictive framework for immunotherapy response. The poor outcomes may result from cirrhosis-induced immunosuppression (33), including dysfunctional macrophage/monocyte accumulation, impaired NK cell activity (34), and TGF-β-mediated expansion of MDSCs and Tregs (35). These findings underscore the importance of considering liver fibrosis status when selecting patients for immunotherapy.
As a classic biomarker for HCC, AFP is also an important independent predictor in the prognostic model of this study. This finding aligns with a study investigating the efficacy of immunotherapy in unresectable HCC, which identified a ≥20% reduction in AFP within 8 weeks as an independent predictor of improved PFS (HR = 0.41, P < 0.05) (36). In addition to being a tumor burden marker, AFP reshapes the immunosuppressive microenvironment through mechanisms such as inducing immune tolerance, inhibiting dendritic cell antigen presentation, promoting Treg cell expansion, and upregulating PD-L1 expression, thereby weakening the response to immunotherapy (37). Notably, preclinical studies have shown that AFP vaccination can activate antigen-specific T cell responses and enhance anti-tumor immunity (38), providing a rationale for exploring combination strategies with immune checkpoint inhibitors in AFP-positive HCC patients. Regarding nutritional metabolism indicator, Hb <128 g/L were significantly associated with poorer outcomes (HR = 1.71, P = 0.015), consistent with findings by Jia et al. (18). This may be because anemia may activate VEGF and PDGF through hypoxia-inducible factors (HIF), thereby promoting tumor angiogenesis (39). Although the prognostic nutritional index (PNI) did not reach statistical significance in multivariate analysis, its inclusion in the model suggests a potential role of nutritional status in modulating immunotherapy response, supporting the hypothesis that nutritional interventions may improve treatment efficacy (40). Younger patients (<38 years) exhibited worse prognosis, possibly due to early hepatitis B virus infection leading to cirrhosis or more aggressive tumor biology in this population (41). Furthermore, the incorporation of systemic inflammatory markers (SII and HALP) reinforces the impact of chronic inflammation in shaping an immunosuppressive tumor microenvironment (42). While BMI and PDW did not show significant predictive value in multivariate analysis, their trends in univariate analyses warrant further validation in larger cohorts.
The current study has several limitations. (1) As a retrospective study, it is inevitably subject to selection bias. (2) The follow-up data were obtained from a single center, lacking external validation. (3) This study did not perform longitudinal comparisons of biomarkers before and after immunotherapy. Future research should incorporate serial measurements during treatment to explore the predictive value of dynamic biomarker models. (4) It is important to note that the primary objective of this study was to develop a clinically applicable prognostic model using routine parameters. While we discuss potential biological mechanisms, the complex and systematic interplay between these variables warrants further validation through prospective studies and dedicated basic science research. Therefore, there is an urgent need for randomized, multicenter, large-sample, and long-term follow-up studies to evaluate and improve the practical applicability and utility of this model.
Conclusion
This study successfully developed and validated a prognostic model that integrates inflammation, nutrition, and tumor burden dimensions, providing a supportive tool for immunotherapy decision-making in patients with advanced HCC. However, further optimization of the model through multicenter large-sample studies is required to promote the clinical application of precision treatment strategies.
Data availability statement
The raw data supporting the conclusions of this article will be made available by the authors, without undue reservation.
Ethics statement
The studies involving humans were approved by the Institutional Research Ethics Committee of the First Affiliated Hospital of Sun Yat-sen University. The studies were conducted in accordance with the local legislation and institutional requirements. The ethics committee/institutional review board waived the requirement of written informed consent for participation from the participants or the participants’ legal guardians/next of kin because this study was a retrospective study, and the institutional ethics committee waived the patient’s informed consent.
Author contributions
SH: Data curation, Software, Visualization, Writing – original draft, Writing – review & editing. MX: Data curation, Software, Visualization, Writing – review & editing. SL: Data curation, Validation, Visualization, Writing – review & editing. WC: Conceptualization, Project administration, Resources, Supervision, Writing – review & editing. ZP: Conceptualization, Funding acquisition, Project administration, Resources, Supervision, Writing – review & editing.
Funding
The author(s) declare financial support was received for the research and/or publication of this article. The study was funded by the National Natural Science Foundation of China (Number 82072029).
Conflict of interest
The authors declare that the research was conducted in the absence of any commercial or financial relationships that could be construed as a potential conflict of interest.
Generative AI statement
The author(s) declare that no Generative AI was used in the creation of this manuscript.
Any alternative text (alt text) provided alongside figures in this article has been generated by Frontiers with the support of artificial intelligence and reasonable efforts have been made to ensure accuracy, including review by the authors wherever possible. If you identify any issues, please contact us.
Publisher’s note
All claims expressed in this article are solely those of the authors and do not necessarily represent those of their affiliated organizations, or those of the publisher, the editors and the reviewers. Any product that may be evaluated in this article, or claim that may be made by its manufacturer, is not guaranteed or endorsed by the publisher.
Supplementary material
The Supplementary Material for this article can be found online at: https://www.frontiersin.org/articles/10.3389/fimmu.2025.1626940/full#supplementary-material
Glossary
AFP: Alpha-Fetoprotein
AGR: Albumin-to-Globulin Ratio
ALB: Albumin
ALBI: Albumin-Bilirubin Index
ALT: Alanine Aminotransferase
ANRI: Aminotransferase-to-Neutrophil Ratio Index
APRI: Aminotransferase-to-Platelet Ratio Index
AST: Aspartate Aminotransferase
AUC: The Area Under the Curve
BCLC: Barcelona Clinic Liver Cancer
BMI: Body Mass Index
CI: Confidence Interval
CT: Computed Tomography
DCA: Decision Curve Analysis
ECOG: Eastern Cooperative Oncology Group
FIB: Fibrinogen
GRIm: Modified Gustave Roussy Immune Score
GLO: Globulin
HAIC: Hepatic Arterial Infusion Chemotherapy
HALP: Hemoglobin, Albumin, Lymphocyte, and Platelet
Hb: Hemoglobin
HBsAg: Hepatitis B surface antigen
HBV: Hepatitis B Virus
HCC: Hepatocellular Carcinoma
HCV: Hepatitis C Virus
HIF: Hypoxia-Inducible Factors
HR: Hazard Ratio
HVTT: Hepatic Vein Tumor Thrombus
ICB: Immune Checkpoint Blockade
ICIs: Immune Checkpoint Inhibitors
IQR: Interquartile Range
LASSO: Least Absolute Shrinkage and Selection Operator
LDH: Lactate Dehydrogenase
LMR: Lymphocyte-to-Monocyte Ratio
MRI: Magnetic Resonance Imaging
NLR: Neutrophil-Lymphocyte Ratio
OS: Overall Survival
PDGF: Platelet-Derived Growth Factor
PDW: Platelet Distribution Width
PFS: Progression-Free Survival
PDW: Platelet Distribution Width
PLR: Platelet-to-Lymphocyte Ratio
PNI: Prognostic Nutritional Index
PVTT: Portal Vein Tumor Thrombus
ROC: Receiver Operating Characteristic
SII: Systemic Immune-Inflammation Index
TACE: Transarterial Chemoembolization
TBIL: Total Bilirubin
TKI: Tyrosine Kinase Inhibitor
TMB: Tumor Mutational Burden
VEGF: Vascular Endothelial Growth Factor
References
1. Bray F, Laversanne M, Sung H, et al. Global cancer statistics 2022: GLOBOCAN estimates of incidence and mortality worldwide for 36 cancers in 185 countries. CA Cancer J Clin. (2024) 74:229–63. doi: 10.3322/caac.21834
2. Vogel A, Meyer T, Sapisochin G, Salem R, and Saborowski A Hepatocellular carcinoma. Lancet. (2022) 400:1345–62. doi: 10.1016/S0140-6736(22)01200-4
3. Shan S and Jia J. The clinical management of hepatocellular carcinoma in China: Progress and challenges. Clin Mol Hepatol. (2023) 29:339–41. doi: 10.3350/cmh.2023.0077
4. Greten TF, Villanueva A, Korangy F, et al. Biomarkers for immunotherapy of hepatocellular carcinoma. Nat Rev Clin Oncol. (2023) 20:780–98. doi: 10.1038/s41571-023-00816-4
5. Zhang N, Yang X, Piao M, et al. Biomarkers and prognostic factors of PD-1/PD-L1 inhibitor-based therapy in patients with advanced hepatocellular carcinoma. biomark Res. (2024) 12:26. doi: 10.1186/s40364-023-00535-z
6. Yau T, Kang YK, Kim TY, et al. Efficacy and safety of nivolumab plus ipilimumab in patients with advanced hepatocellular carcinoma previously treated with sorafenib: the checkMate 040 randomized clinical trial. JAMA Oncol. (2020) 6:e204564. doi: 10.1001/jamaoncol.2020.4564
7. Marabelle A, Fakih M, Lopez J, et al. Association of tumour mutational burden with outcomes in patients with advanced solid tumours treated with pembrolizumab: prospective biomarker analysis of the multicohort, open-label, phase 2 KEYNOTE-158 study. Lancet Oncol. (2020) 21:1353–65. doi: 10.1016/S1470-2045(20)30445-9
8. Yang Z, Fu Y, Wang Q, et al. Dynamic changes of serum α-fetoprotein predict the prognosis of bevacizumab plus immunotherapy in hepatocellular carcinoma. Int J Surg. (2025) 111:751–60. doi: 10.1097/JS9.0000000000001860
9. Persano M, Rimini M, Tada T, et al. Role of the prognostic nutritional index in predicting survival in advanced hepatocellular carcinoma treated with atezolizumab plus bevacizumab. Oncology. (2023) 101:283–91. doi: 10.1159/000528818
10. Mei J, Sun XQ, Lin WP, et al. Comparison of the prognostic value of inflammation-based scores in patients with hepatocellular carcinoma after anti-PD-1 therapy. J Inflammation Res. (2021) 14:3879–90. doi: 10.2147/JIR.S325600
11. Su K, Huang W, Li X, et al. Evaluation of lactate dehydrogenase and alkaline phosphatase as predictive biomarkers in the prognosis of hepatocellular carcinoma and development of a new nomogram. J Hepatocell Carcinoma. (2023) 10:69–79. doi: 10.2147/JHC.S398632
12. Kong W, Xu H, Cheng J, et al. The prognostic role of a combined fibrinogen and neutrophil-to-lymphocyte ratio score in patients with resectable hepatocellular carcinoma: A retrospective study. Med Sci Monit. (2020) 26:e918824. doi: 10.12659/MSM.918824
13. Ringelhan M, Pfister D, O'Connor T, Pikarsky E, and Heikenwalder M The immunology of hepatocellular carcinoma. Nat Immunol. (2018) 19:222–32. doi: 10.1038/s41590-018-0044-z
14. Arvanitakis K, Mitroulis I, and Germanidis G. Tumor-associated neutrophils in hepatocellular carcinoma pathogenesis, prognosis, and therapy. Cancers (Basel). (2021) 13:2899. doi: 10.3390/cancers13122899
15. Lo CH, Lee HL, Hsiang CW, et al. Pretreatment neutrophil-to-lymphocyte ratio predicts survival and liver toxicity in patients with hepatocellular carcinoma treated with stereotactic ablative radiation therapy. Int J Radiat Oncol Biol Phys. (2021) 109:474–84. doi: 10.1016/j.ijrobp.2020.09.001
16. Minici R, Siciliano MA, Ammendola M, et al. Prognostic role of neutrophil-to-lymphocyte ratio (NLR), lymphocyte-to-monocyte ratio (LMR), platelet-to-lymphocyte ratio (PLR) and lymphocyte-to-C reactive protein ratio (LCR) in patients with hepatocellular carcinoma (HCC) undergoing chemoembolizations (TACE) of the liver: the unexplored corner linking tumor microenvironment, biomarkers and interventional radiology. Cancers (Basel). (2022) 15:257. doi: 10.3390/cancers15010257
17. Wang C, He W, Yuan Y, et al. Comparison of the prognostic value of inflammation-based scores in early recurrent hepatocellular carcinoma after hepatectomy. Liver Int. (2020) 40:229–39. doi: 10.1111/liv.14281
18. Jia G, Qiu L, Zheng H, et al. Nomogram for predicting survival in patients with advanced hepatocellular carcinoma treated with PD-1 inhibitors: incorporating pre-treatment and post-treatment clinical parameters. BMC Cancer. (2023) 23:556. doi: 10.1186/s12885-023-11064-1
19. Tsukagoshi M, Araki K, Igarashi T, et al. Lower geriatric nutritional risk index and prognostic nutritional index predict postoperative prognosis in patients with hepatocellular carcinoma. Nutrients. (2024) 16:940. doi: 10.3390/nu16070940
20. Hu B, Yang XR, Xu Y, et al. Systemic immune-inflammation index predicts prognosis of patients after curative resection for hepatocellular carcinoma. Clin Cancer Res. (2014) 20:6212–22. doi: 10.1158/1078-0432.CCR-14-0442
21. Zheng J, Seier K, Gonen M, et al. Utility of serum inflammatory markers for predicting microvascular invasion and survival for patients with hepatocellular carcinoma. Ann Surg Oncol. (2017) 24:3706–14. doi: 10.1245/s10434-017-6060-7
22. Liao M, Sun J, Zhang Q, et al. A novel post-operative ALRI model accurately predicts clinical outcomes of resected hepatocellular carcinoma patients. Front Oncol. (2021) 11:665497. doi: 10.3389/fonc.2021.665497
23. Zhang ZQ, Xiong L, Zhou JJ, et al. Ability of the ALBI grade to predict posthepatectomy liver failure and long-term survival after liver resection for different BCLC stages of HCC. World J Surg Oncol. (2018) 16:208. doi: 10.1186/s12957-018-1500-9
24. Liu X, Qiu Z, Ndhlovu E, et al. Establishing and externally validating a hemoglobin, albumin, lymphocyte, and platelet (HALP) score-based nomogram for predicting early recurrence in BCLC stage 0/A hepatocellular carcinoma patients after radical liver resection: A multi-center study. J Hepatocell Carcinoma. (2024) 11:1127–41. doi: 10.2147/JHC.S465670
25. EASLClinical Practice Guidelines on the management of hepatocellular carcinoma. J Hepatol. (2025) 82:315–74. doi: 10.1016/j.jhep.2024.08.028
26. Drent M, Cobben NA, Henderson RF, Wouters EF, and van Dieijen-Visser M Usefulness of lactate dehydrogenase and its isoenzymes as indicators of lung damage or inflammation. Eur Respir J. (1996) 9:1736–42. doi: 10.1183/09031936.96.09081736
27. Vilar-Gomez E and Chalasani N. Non-invasive assessment of non-alcoholic fatty liver disease: Clinical prediction rules and blood-based biomarkers. J Hepatol. (2018) 68:305–15. doi: 10.1016/j.jhep.2017.11.013
28. Nielsen MJ, Leeming DJ, Goodman Z, et al. Comparison of ADAPT, FIB-4 and APRI as non-invasive predictors of liver fibrosis and NASH within the CENTAUR screening population. J Hepatol. (2021) 75:1292–300. doi: 10.1016/j.jhep.2021.08.016
29. Duran-Bertran J, Rusu EC, Barrientos-Riosalido A, et al. Platelet-associated biomarkers in nonalcoholic steatohepatitis: Insights from a female cohort with obesity. Eur J Clin Invest. (2024) 54:e14123. doi: 10.1111/eci.14123
30. Wu SJ, Lin YX, Ye H, Xiong XZ, Li FY, and Cheng NS Prognostic value of alkaline phosphatase, gamma-glutamyl transpeptidase and lactate dehydrogenase in hepatocellular carcinoma patients treated with liver resection. Int J Surg. (2016) 36:143–51. doi: 10.1016/j.ijsu.2016.10.033
31. Peng X, He Z, Yuan D, Liu Z, and Rong P Lactic acid: The culprit behind the immunosuppressive microenvironment in hepatocellular carcinoma. Biochim Biophys Acta Rev Cancer. (2024) 1879:189164. doi: 10.1016/j.bbcan.2024.189164
32. Ginès P, Krag A, Abraldes JG, Solà E, Fabrellas N, and Kamath PS Liver cirrhosis. Lancet. (2021) 398:1359–76. doi: 10.1016/S0140-6736(21)01374-X
33. De Martin E, Fulgenzi CAM, Celsa C, et al. Immune checkpoint inhibitors and the liver: balancing therapeutic benefit and adverse events. Gut. (2025) 74:1165–77. doi: 10.1136/gutjnl-2024-332125
34. Bai Q, Hong X, Lin H, et al. Single-cell landscape of immune cells in human livers affected by HBV-related cirrhosis. JHEP Rep. (2023) 5:100883. doi: 10.1016/j.jhepr.2023.100883
35. Peng D, Fu M, Wang M, Wei Y, and Wei X Targeting TGF-β signal transduction for fibrosis and cancer therapy. Mol Cancer. (2022) 21:104. doi: 10.1186/s12943-022-01569-x
36. Zhang Y, Shen H, Zheng R, et al. Development and assessment of nomogram based on AFP response for patients with unresectable hepatocellular carcinoma treated with immune checkpoint inhibitors. Cancers (Basel). (2023) 15:5131. doi: 10.3390/cancers15215131
37. Lu X, Deng S, Xu J, et al. Combination of AFP vaccine and immune checkpoint inhibitors slows hepatocellular carcinoma progression in preclinical models. J Clin Invest. (2023) 133:e163291. doi: 10.1172/JCI163291
38. Butterfield LH, Ribas A, Potter DM, and Economou JS Spontaneous and vaccine induced AFP-specific T cell phenotypes in subjects with AFP-positive hepatocellular cancer. Cancer Immunol Immunother. (2007) 56:1931–43. doi: 10.1007/s00262-007-0337-9
39. Unwith S, Zhao H, Hennah L, and Ma D The potential role of HIF on tumour progression and dissemination. Int J Cancer. (2015) 136:2491–503. doi: 10.1002/ijc.28889
40. Stephensen CB. Examining the effect of a nutrition intervention on immune function in healthy humans: what do we mean by immune function and who is really healthy anyway? Am J Clin Nutr. (2001) 74:565–6. doi: 10.1093/ajcn/74.5.565
41. Dong D, Zhu X, Wang H, et al. Prognostic significance of albumin-bilirubin score in patients with unresectable hepatocellular carcinoma undergoing combined immunotherapy and radiotherapy. J Med Imaging Radiat Oncol. (2022) 66:662–70. doi: 10.1111/1754-9485.13398
Keywords: hepatocellular carcinoma, immunotherapy, nomogram, LASSO regression, prognostic biomarkers
Citation: Hu S, Xu M, Li S, Chen W and Peng Z (2025) LASSO-empowered nomogram integrating nutritional-inflammatory-tumor characteristics predicts immunotherapy outcomes in advanced HCC: Large retrospective cohort. Front. Immunol. 16:1626940. doi: 10.3389/fimmu.2025.1626940
Received: 23 May 2025; Accepted: 11 November 2025; Revised: 10 November 2025;
Published: 01 December 2025.
Edited by:
Hu Caixia, Capital Medical University, ChinaReviewed by:
Rongqiang Liu, Renmin Hospital of Wuhan University, ChinaTianliang Liu, Gannan Medical University, China
Copyright © 2025 Hu, Xu, Li, Chen and Peng. This is an open-access article distributed under the terms of the Creative Commons Attribution License (CC BY). The use, distribution or reproduction in other forums is permitted, provided the original author(s) and the copyright owner(s) are credited and that the original publication in this journal is cited, in accordance with accepted academic practice. No use, distribution or reproduction is permitted which does not comply with these terms.
*Correspondence: Wei Chen, Y2hlbnc1N0BtYWlsLnN5c3UuZWR1LmNu; Zhenwei Peng, cHpoZW53QG1haWwuc3lzdS5lZHUuY24=
†These authors have contributed equally to this work