 Yanan Zhao1†
 Yuanmei Wang
 Xianyao Li
- 1Shandong Provincial Key Laboratory for Livestock Germplasm Innovation & Utilization, College of Animal Science and Technology, Shandong Agricultural University, Tai’an, Shandong, China
- 2College of Life Sciences, Shandong Agricultural University, Tai’an, Shandong, China
- 3Key Laboratory of Efficient Utilization of Non-grain Feed Resources (Co-construction by Ministry and Province), Ministry of Agriculture and Rural Affairs, Tai’an, Shandong, China
Introduction: Campylobacter jejuni (C. jejuni), a commensal food-borne pathogen, poses severe threat to human health and poultry industry. N6-methyladenosine (m6A) mRNA modification is associated with innate immunity. However, the mechanism of m6A modification in C. jejuni chicken cecum inoculation remains unclear.
Methods: Here, we characterized the cecal m6A modification landscape of chicken in the C. jejuni-resistant (R) and susceptible (S) groups using methylated RNA immunoprecipitation sequencing and RNA sequencing (RNA-seq), and further conducted the in vitro C. jejuni inflammatory model based on chicken macrophage-like cell line (HD11) to elucidate the specific mechanism.
Results: In the S group, the level of proinflammatory cytokines (IL-8, IL-1β, IL-18, TNF-α, IL-17A) and global RNA methylation were significantly decreased (P < 0.05). A total of 30,427 and 30,367 m6A peaks were identified in R and S groups, which were primarily located in 3'UTR and CDS regions. Among these, 514 differential m6A peaks (270 hypermethylated peaks and 244 hypomethylated peaks) were identified, which mainly correlated with the regulation of canonical NF-kappaB signal transduction, apoptotic signaling pathway, and MyD88-dependent toll-like receptor signaling pathway. Moreover, we identified 365 differentially expressed genes (DEGs), which were mainly associated with regulation of autophagy, and toll-like receptor 9 signaling pathway, intraciliary transport involved in cilium assembly, positive regulation of mTOR signaling, defense response to bacteria. The correlation analysis revealed that m6A methylation level correlated positively with gene expression. Further analysis identified 58 differentially methylated genes (DMGs), and mainly involved in apoptosis, autophagy, Notch signaling pathway and defense response to bacteria, which mainly enriched by DMGs including IFT74, SUSD5, WDR41, STAB2, EPG5 and FOS. Furthermore, we found that YTHDC2 could involve in regulating the apoptosis and autophagy process of HD11 cells through altering the expression of DMGs including IFT74, SUSD5, STAB2, EPG5 and FOS, which was confirmed by experiments in vitro.
Conclusion: This result suggested the regulatory role of m6A methylation in chicken responds to C. jejuni inoculation. Collectively, the current study characterized the m6A modification landscape of chicken cecum and identified YTHDC2 acting key regulator responsible for C. jejuni inoculation.
1 Introduction
Campylobacter jejuni (C. jejuni), a foodborne bacterial pathogen, is considered a major causative agent of bacterial gastroenteritis (1). It causes severe diarrheal symptoms, accompanied by fever, nausea and abdominal cramping (2), and poses a sever threat to the poultry industry and human health (3). In 2010, C. jejuni caused an estimated 96 million cases of diarrheal illness, contributing to approximately 37,600 deaths worldwide (4). Human bacterial gastroenteritis is primarily attributed to Campylobacter species, among which C. jejuni is responsible for approximately 90% of reported cases (5). Human infection typically results from the ingestion of contaminated animal food products, particularly poultry, where C. jejuni colonizes as part of the natural intestinal microbiota (6). C. jejuni primarily colonizes the chicken cecum and subsequently disseminates to systemic tissues, resulting in contamination of poultry meat and eggs (7–9). C. jejuni can cause intestinal damage, disrupt gut barrier function, and facilitate the translocation of luminal bacteria to internal organs (10, 11). Despite extensive efforts in vaccination and antibiotic applications, C. jejuni remains persistent in commercial poultry production. Notably, emerging evidence demonstrates that genetic selection strategies effectively enhance host resistance to C. jejuni challenge in chickens, offering a sustainable alternative for disease control (12–14).
The host immune response plays a critical role in responding to C. jejuni inoculation. The activation of both innate and adaptive immune responses is critical for controlling Campylobacter inoculation (15, 16). Multiple studies have documented immune or metabolic genes closely correlated with resistance in chickens to C. jejuni inoculation, including factors such as the major histocompatibility complex (MHC), cadherins, and other genetic elements (17). Briefly, the MHC has been identified as a critical genetic determinant in resistance to Campylobacter in commercial broiler chickens (18). The resistance to C. jejuni inoculation in the chicken intestine has been linked to a locus spanning CDH13 (19). Chickens with an inherently high phenotype of pro-inflammatory mediators, including IL-6, CXCLi2, and CCLi2, are more resistant to Campylobacter inoculation (20). Disruption of flhF abolishes sustained C. jejuni invasion capacity in the avian intestinal tract (21). The expression of the host defense peptides (HDPs) including AvBD1-2, CATH1-3, AvBD7, AvBD4, and AvBD6 were suppressed in chicken HD11 cell following C. jejuni inoculation (22). Additionally, miR-155, as a vital regulator, could involve in regulating the C. jejuni inoculation in chicken (23). The miR-30 and miR-148/miR-152 families exhibit time-dependent regulation in response to Campylobacter inoculation in chickens (24). Recent studies revealed that post-transcriptional modifications play crucial roles in regulating the immune system following C. jejuni inoculation (25). The recognition of m6A methylation within the coding sequence (CDS) by YTHDC2 promotes the overall translation efficiency, whereas knockdown YTHDC2 substantially reduces protein synthesis (26).
N6-methyladenosine (m6A), the most prevalent post-transcriptional modification, regulate various biological processes including reproduction (27), growth and development (28, 29), immunity (30, 31), and metabolism (32, 33) through altering mRNA splicing, export, translation, and degradation (34, 35). Recent study revealed that resveratrol augments antioxidant and anti-apoptotic functions in chicken primordial germ cells via m6A methylation (36). m6A modification is catalyzed by three classes of key regulators, writers (e.g., METTL3, METTL14), erasers (e.g., ALKBH5, FTO) and readers (e.g., YTHDC2, YTHDF2) (37). METTL3 is involved in M1 macrophage polarization and pyroptosis during liver fibrosis (38). It is reported that LPS inoculation alters the m6A methylation on the transcripts of GR and impairs its mRNA stability in a YTHDF2-dependent manner, which leads to the decrease of its protein (Zhao et al., 2025). YTHDC2 suppresses antiviral immunity through ISG20-dependent degradation of IFN-β mRNA in macrophages during late-stage viral infection (39). Lactylation of ALKBH5 enhances innate immune responses to DNA viruses including herpesviruses and mpox virus (40). However, the mechanism underlying m6A modification in chicken in response to C. jejuni inoculation remains poorly understood.
To elucidate the regulatory role of m6A modification in the chicken immune response to C. jejuni inoculation, the cecal m6A modification landscape in susceptible and resistant groups were characterized using MeRIP-seq and RNA-seq. Numerous differential m6A methylation peaks and corresponding differentially expressed genes potentially were involved in host defense mechanisms against C. jejuni. Notably, YTHDC2 regulates resistance to C. jejuni inoculation by modulating immune-related gene expression, as confirmed through in vitro experiments. These findings provide new insights into epigenetic regulation of avian host-pathogen interactions.
2 Materials and methods
2.1 C. jejuni inoculation and sample collection
A total of 70 day-3 C. jejuni-free specific pathogen-free (SPF) White Leghorn chickens (Jinan SAIS Poultry Co., Ltd, China) were used in the current study. The C. jejuni (ATCC 33291) strain was obtained from the China Center of Industrial Culture Collection (CICC). Chickens were raised in sterilized isolators with free access to feed and water. Each chicken was orally inoculated with 0.5 mL of C. jejuni solution (1.68 × 10⁸ CFU/mL). All procedures were performed under strict sterilization conditions. At 8 hours post-inoculation with C. jejuni, the venous blood, liver, cecal content, and cecum were collected from each individual, and immediately frozen in liquid nitrogen.
To quantify the C. jejuni levels, 0.1 g cecal content from each chicken was collected and serially diluted with sterile PBS. Subsequently, the cecum content was cultured on Columbia Blood Agar Base plates (Sigma, USA) under microaerophilic conditions (42°C, 85% N2, 10% CO2, and 5% O2) for 48 hours. Chicken with over 1.86×10¹³ CFU/mL C. jejuni in cecal content was classified as the susceptible group (S group), and chicken with below 4.36×10¹⁰ CFU/mL was assigned to the resistant group (R group). All experimental protocols were approved by the Ethics Committee on the Care and Use of Laboratory Animals at Shandong Agricultural University (Approval Number: SDAUA-2019-060).
2.2 Mitochondrial electron microscopy observation
Approximately 1–2 mm3 liver tissue from each chicken was fixed in a 2.5% glutaraldehyde and washed with 0.1 M phosphate buffer for three times. After post-fixation with 1% osmium tetroxide in 0.1 M phosphate buffer, tissues were dehydrated through a graded ethanol series (30%, 50%, 70%, 90%, and 100%) for 10 minutes per concentration. The tissue was embedded in epoxy resin (Epon 812, Epon, USA), and polymerized at 60°C for 48 hours. Ultrathin sections (60–90 nm) were prepared and examined using a transmission electron microscope (TEM) (Hitachi, Japan) at a magnifications of 80,000x. ImageJ 1.8.0 was used to quantify the mitochondrial length, width, area, and the number of mitochondrial cristae.
2.3 The concentration of immune factors in chicken serum
To collect the serum, the venous blood was collected from each chicken in the R and S groups, and centrifuged at 3000 × g for 10 minutes at 4°C. IgA (ml002792), IL-6 (ml059839), IL-18 (ml042769), IL-1β (ml002787), IL-17A (ml023404), and TNF-α (ml002790) ELISA kits (MLBIO, Shanghai, China) were used to determine the serum cytokines’ levels according to the manufacturer’s instructions, respectively.
2.4 m6A immunoprecipitation, library construction and sequencing
Total RNA was isolated from cecum sample using the Total RNA Kit I (Omega, Hunt Valley, USA) according to the manufacturer’s instructions. The integrity and concentration of RNA were measured using Agilent 2100 Bioanalyzer (Agilent, California, USA) and Nanodrop 2000 (Nanodrop, Wilmington, DE), respectively. Total RNA was purified using the Dynabeads Oligo (dT) (Thermo Fisher Scientific, Massachusetts, USA), and fragmented into approximately 100 nucleotides. The fragmented RNA of each individual was clustered into two libraries: an immunoprecipitation (IP) library and an input library. For the IP library, the fragmented RNA was incubated with an m6A-specific antibody in IP buffer (50 mM Tris-HCl, 750 mM NaCl, and 0.5% Igepal CA-630) for 2 hours at 4°C. The IP and input RNA was then reverse-transcribed into cDNA using SuperScript II Reverse Transcriptase (Invitrogen, Waltham, USA), and second-strand synthesis was conducted with NEBNext® Ultra™ II Directional RNA Library Prep Kit (New England Biolabs, USA). Finally, a total of six libraries in each group (3 replicates × (IP + input)) were constructed, and subjected to paired-end 150 bp sequencing using the Illumina NovaSeq 6000 platform (LC-Bio Technology Co., Ltd., Hangzhou, China).
2.5 Bioinformatics analysis
The adapter sequences, duplicate reads, and low quality reads were filtered out from raw data with the default parameters using fastp (41). The clean reads were mapped to the Gallus gallus reference genome (GRCg7b) using HISAT2 (42). Peak calling analysis was performed with the R package ExomePeak (43). The candidate peak region within the genome was tested by the Poisson distribution model to assess the statistical significance of read enrichment, and the region with P value < 0.05 was considered a peak. The differentially methylated m6A peaks (DMPs) between resistant and susceptible groups were identified using Fisher’s test. The distribution of m6A peaks across functional elements (5′UTR, start codon, CDS, stop codon, and 3′UTR) was annotated using ANNOVAR (44). Subsequently, the identification and visualization of m6A motifs enriched within peak regions were performed using HOMER (45) and the BioSeqUtils package in R (46). The gene expression was quantified using StringTie (47) with default parameters. The differentially expressed genes (DEGs) between R group and S group was identified with DESeq2 package (48). The genes with |log2Fold change| ≥ 1 and P value < 0.05 were considered DEGs. The DEG harboring at least one DMPs was defined as the differentially methylated gene (DMG). Gene ontology (GO) and Kyoto Encyclopedia of Genes and Genomes (KEGG) enrichment analysis for DMPs, DEGs and DMGs was performed using the LC-Bio OmicStudio platform (https://www.omicstudio.cn/home).
2.6 RNA m6A dot blot assay
The total RNA from each cecum was denatured at 95°C for 3 minutes and cross-linked to an Immobilon-Ny+ Nylon Membrane Roll (Merck Millipore, Germany). The unbound RNA was washed with Tris-buffered saline containing 0.1% Tween 20 for 5 minutes. After blocking with 5% skimmed milk (BI, Germany) for 1 hour, the membrane was incubated with an anti-m6A antibody (1:250 dilution; ab286164, abcam) at 4°C overnight with gentle shaking. Subsequently, the membrane was incubated with an anti-mouse IgG secondary antibody (1:5,000 dilution; ab190475, Abcam) for 1 hour at room temperature. The m6A levels were visualized using a chemiluminescent substrate in a chemiluminescence imaging system (Fusion Fx Vilber Lourmat, France) and then quantified using ImageJ 1.8.0.
2.7 MeRIP-PCR
Following RNA extraction, poly(A)+ RNA was selectively purified using oligo(dT) magnetic beads (Thermo Fisher Scientific, Massachusetts, USA), and fragmented into approximately 100 nts using the Magnesium RNA Fragmentation Kit (New England Biolabs, USA) following the manufacturer’s instructions. The fragmented RNA was then subjected to immunoprecipitation with an m6A-specific antibody (Synaptic Systems, Göttingen, Germany) conjugated to Protein A/G magnetic beads (Invitrogen, USA). Both the immunoprecipitated RNA and input RNA were reverse transcribed into cDNA using the PrimeScript RT Reagent Kit (Takara, Dalian, China). qRT-PCR was performed using SYBR Premix Dimer Eraser (Takara, Dalian, China) and specific primers (Sangon, Shanghai, China) on Roche LightCycler® 96 System (Supplementary Table S1).
2.8 Cell culture, siRNA and LPS challenge
The chicken macrophage-like cell line (HD11) was provided by ShanghaiNulen Biotech. (Shanghai, China). HD11 were cultured in Dulbecco’s modified Eagle’s medium (DMEM) (Gibco, Invitrogen, Carlsbad, CA), supplemented with 10% fetal bovine serum (Gibico, Thermo Fisher Scientific, Australia) and 1% penicillin and streptomycin (Servicebio, Beijing, China) at 37 °C in a humidified atmosphere of 5 % CO2 for amplification. Cells were subcultured when they reached 80% to 90% confluence.
The small interfering RNA (si-YTHDC2) for YTHDC2 (Sense: 5’-CAGCUUUAAUUGUGAGAAATT-3’; Anti-sense: 3’-UUUCUCACAAUUAAAGCUGTT-5’) and negative control si-NC were obtained from Sangon Biotech (Shanghai, China). C. jejuni lipopolysacharide (LPS) was obtained from FUJIFILM Wako (Cat. No. 128-05671, Japan). The HD11 cells were seeded in 6-well plates at a density of 1 × 10⁶ cells per well and cultured for 24 h. The si-YTHDC2 or si-NC was transfected using Lipofectamine™ 3000 (Thermo Scientific, Invitrogen, US) in serum-free Opti-MEM®I Medium (Gibco, Invitrogen, Carlsbad, CA), and incubated at 37 °C in a humidified atmosphere of 5 % CO2 for 8 h. Following 24 hours transfection, the cells were incubated with LPS challenge (5 μg/mL) for 8 h, and the expression of YTHDC2 was detected using RT-qPCR (Supplementary Figure S1).
2.9 Flow cytometric analysis
Apoptosis assay was performed using the Annexin V-FITC/propidium iodide Cell Apoptosis Detection Kit (Servicebio, Wuhan, China) followed by flow cytometry analysis. Briefly, the cells were rinsed and resuspended with 1× binding buffer to a concentration of 5 × 10⁶ cells/mL. A 100 μL cell suspension was incubated with Annexin-FITC (5 μL) and propidium iodide (5 μL) for 10 min at room temperature in the dark. Data were analyzed using Flowjo software (Version: 10.9.1).
2.10 Quantitative real-time polymerase chain reaction
Total RNA from cecum or HD11 was extracted using TRIzol Reagent (Thermo Scientific, Invitrogen, US) following the manufactures’ instructions. One μg total RNA from each sample used for RNA sequencing was reverse-transcribed into cDNA with PrimeScript™ RT Reagent Kit (Takara, Japan). Quantitative real-time PCR (qRT-PCR) was performed using SYBR Premix Dimer Eraser (Takara, Japan) and gene-specific primers (Sangon, Shanghai, China) (Supplementary Table S1). The relative gene expression level was calculated using the 2 -ΔΔCt method.
2.11 Statistical analysis
In the current study, the statistical analysis was performed with SPSS 26.0 software. T-tests and One-way analysis of variance (ANOVA) followed by Tukey’s post hoc test were employed to ascertain differences among groups. Among these, T-tests were used for two groups and One-way ANOVA with Tukey’s multiple comparisons were used for multiple groups (n = 4). The data were presented as mean ± SEM. Results with P value < 0.05 were considered statistically significant.
3 Results
3.1 The characterization of immune related traits of chicken in the susceptible and resistant groups
The C. jejuni colonization level in chicken cecum of the R group was significantly lower than that of the S group (P < 0.01) (Figure 1A). The level of proinflammatory cytokine (IL-8, IL-1β, IL-18, TNF-α, and IL-17A) in the S group was significantly higher compared to the R group. Whereas, the level IL-6 was significantly decreased in the S group (P < 0.05) (Figure 1B). The mitochondria in the R group were closely arranged, clearly visible, and evenly distributed, whereas those in the S group appeared damaged and swollen (Figure 1C). Additionally, the average cross-sectional area and the inter-membrane space distance of mitochondria in the R group were significantly smaller than those in the S group (P < 0.05). Whereas, the number of mitochondria per μm2 and the cristae density per mitochondria in the R group were significantly higher than those in the S group (Figure 1D).
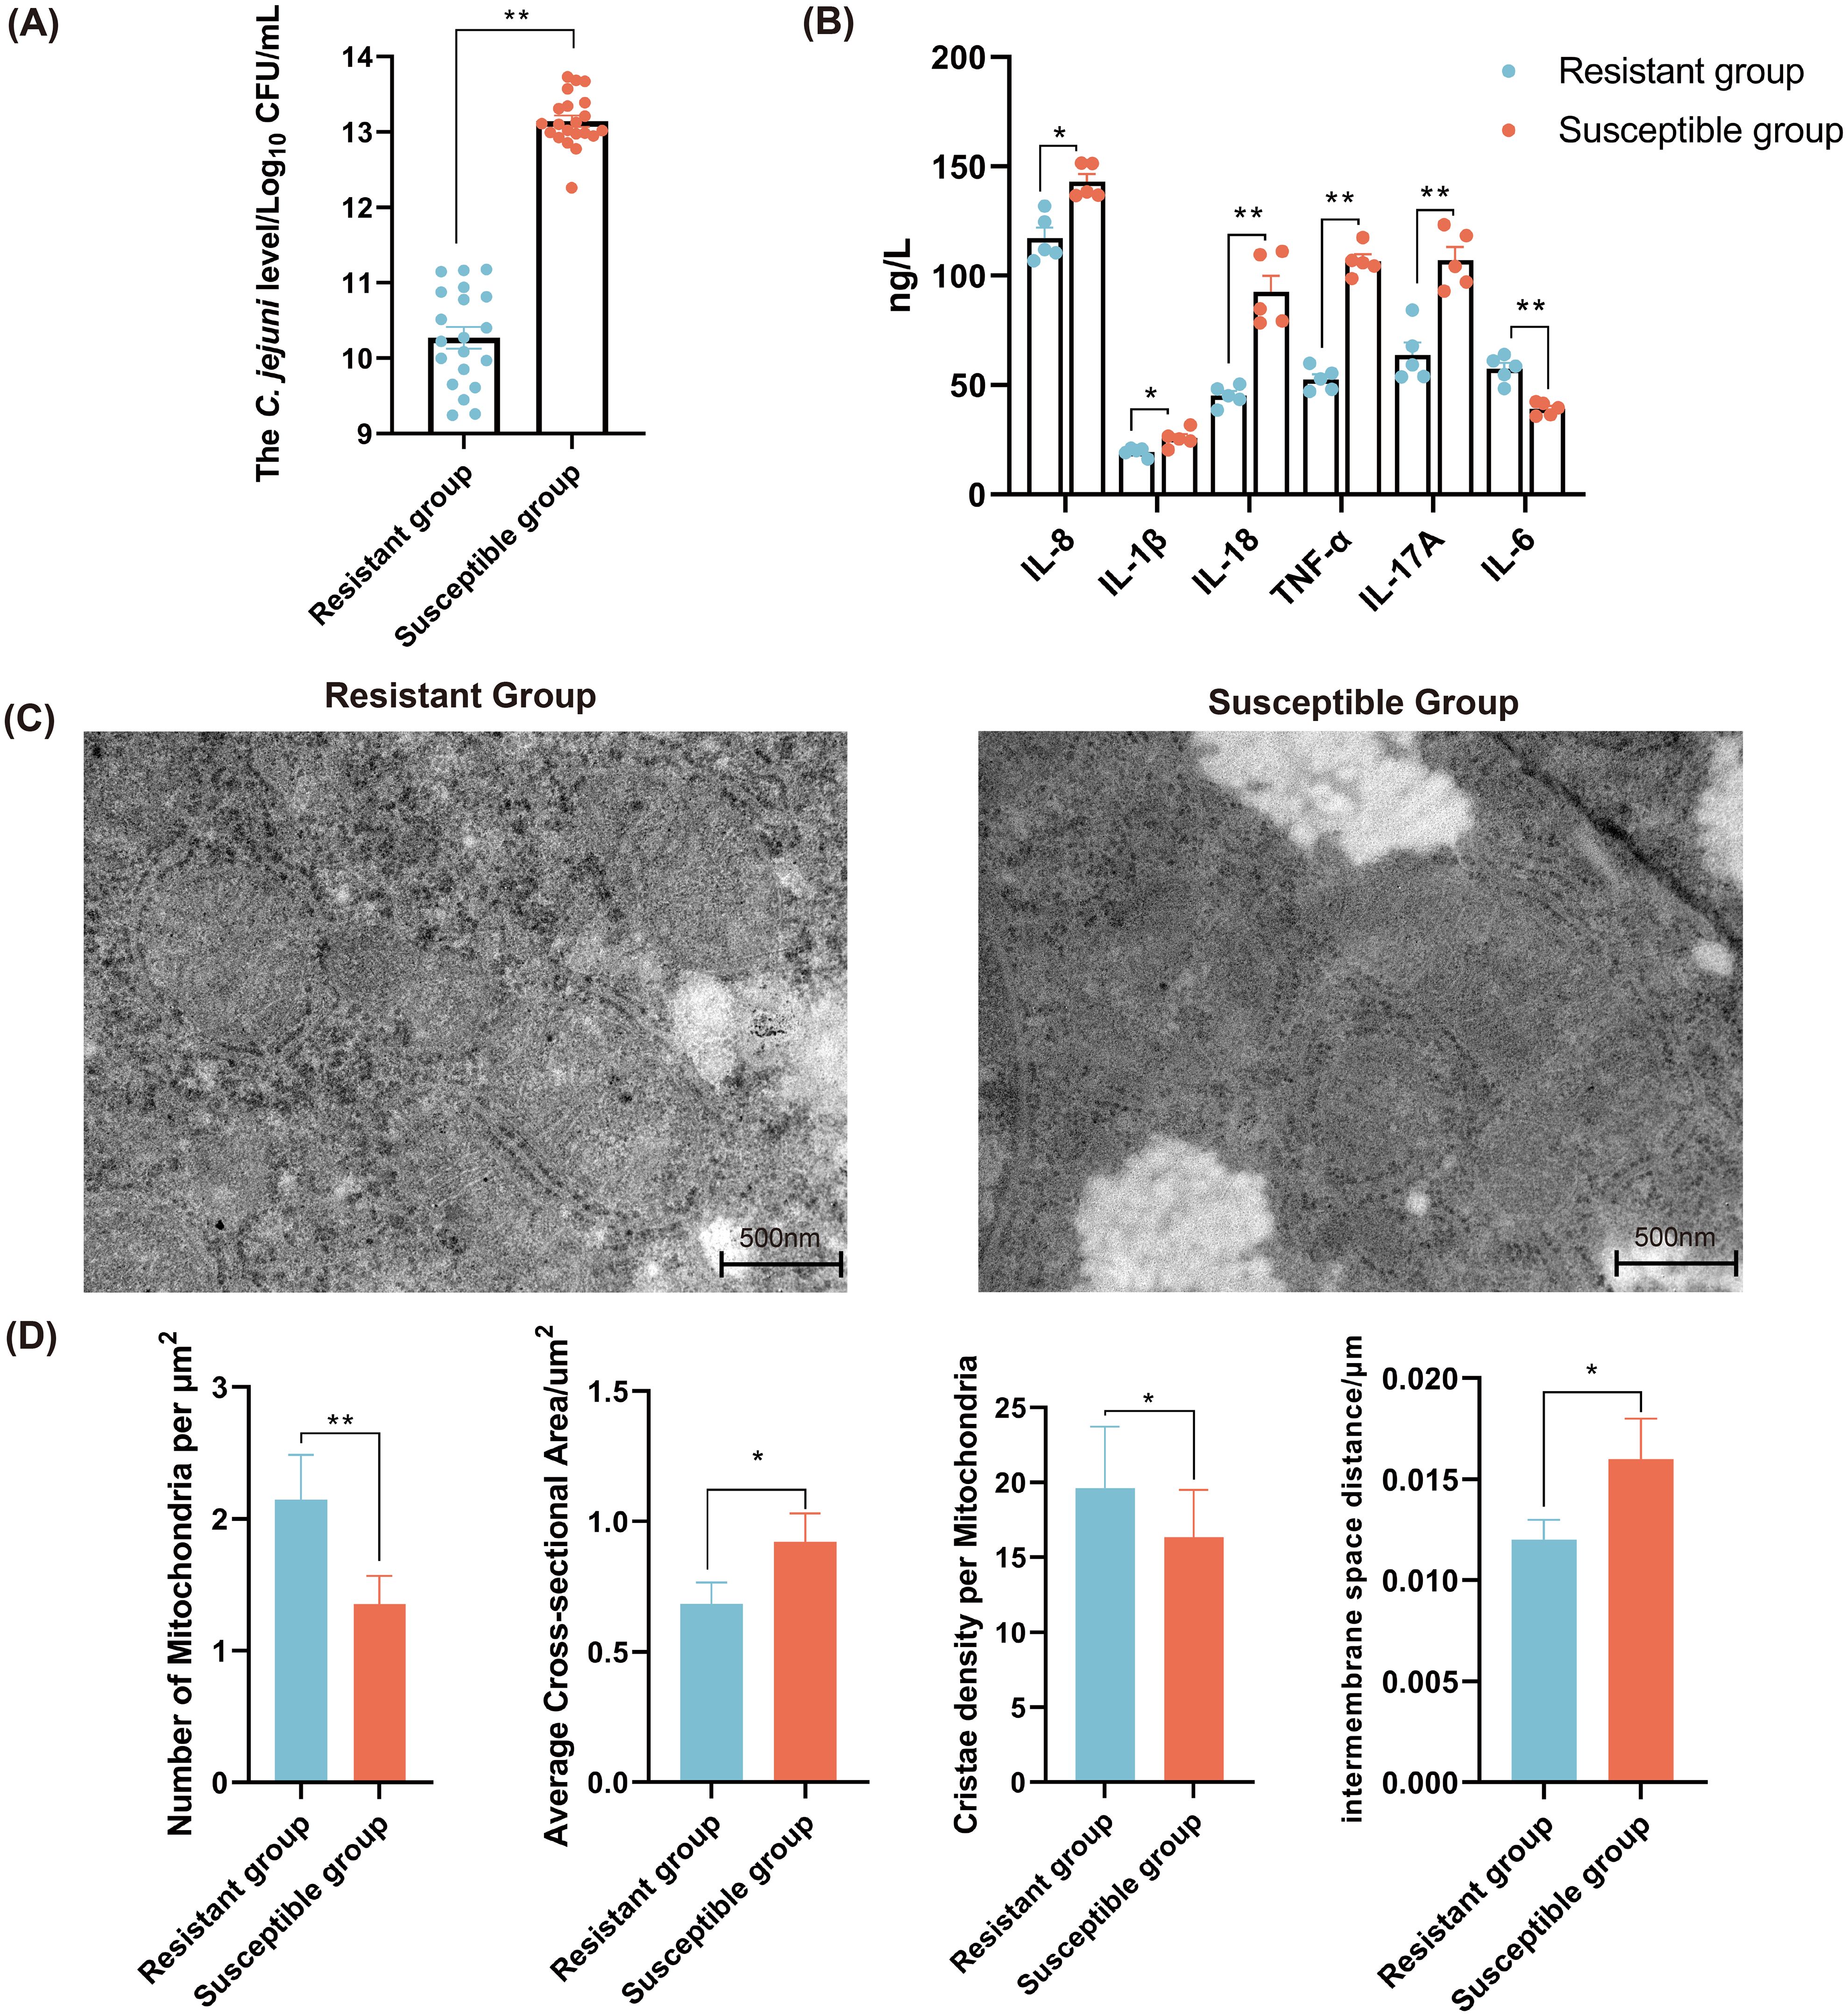
Figure 1. The characterization of immune related traits of chicken in the C. jejuni-susceptible (S) and resistant (R) groups. (A) The C. jejuni colonization levels in chicken cecum of resistant and susceptible groups. (B) The levels of cytokines in chicken serum in the C. jejuni-susceptible and resistant groups. Scale bar, 500 nm. (C) The mitochondrial morphology and ultrastructure of chicken liver in the C. jejuni-susceptible and resistant groups. (D) The indexes of mitochondria of liver in the C. jejuni-susceptible and resistant groups. The data are pooled from 2 independent experiments with 5 replicates per group (n = 5) and presented as the mean ± SEM; *, ** representing P < 0.05, and P < 0.01, respectively.
3.2 Characterization of m6A methylation
To elucidate the mechanism underlying chicken responding to C. jejuni inoculation, we evaluated the global level of m6A in chicken cecum in the R and S groups using dot blot method. As shown in Figure 2A, the global level of m6A modification decreased substantially in S group (P < 0.01). Further analysis of MeRIP-seq and RNA-seq indicated that 40–50 million raw reads were obtained from each sample. After removing the low quality reads, more than 39 million clean reads with Q20 values above 98% were generated from each sample (Supplementary Table S2), and more than 86.86% clean reads could be uniquely aligned to the chicken genome. Moreover, more than 91.82% clean reads could be mapped to the exon region (Supplementary Figure S2). A total of 30,427 and 30,367 m6A peaks, corresponding to 13,969 and 13,875 genes, were identified in the R and S groups, respectively (Figure 2B). Most genes contained just 1–2 peaks (Figure 2C). The m6A peaks in the R and S groups were predominantly enriched in the 3′UTR, CDS region, and stop codon, followed by the start codon and 5′UTR (Figure 2D). Moreover, m6A modifications were widely distributed throughout the chicken genome, with the highest number of peaks located on chromosome 1, accounting for 14.1% in each group (Figure 2E). Additionally, enriched motifs in both groups matched the canonical m6A motifs ‘RRACH’ and ‘DRACH’ (R = A or G; D = A, G or U; H = A, C or U), while multiple motifs corresponding to non-canonical m6A sites including ‘CUACG’ and ‘CGACG’ were also identified (Supplementary Figure S3).
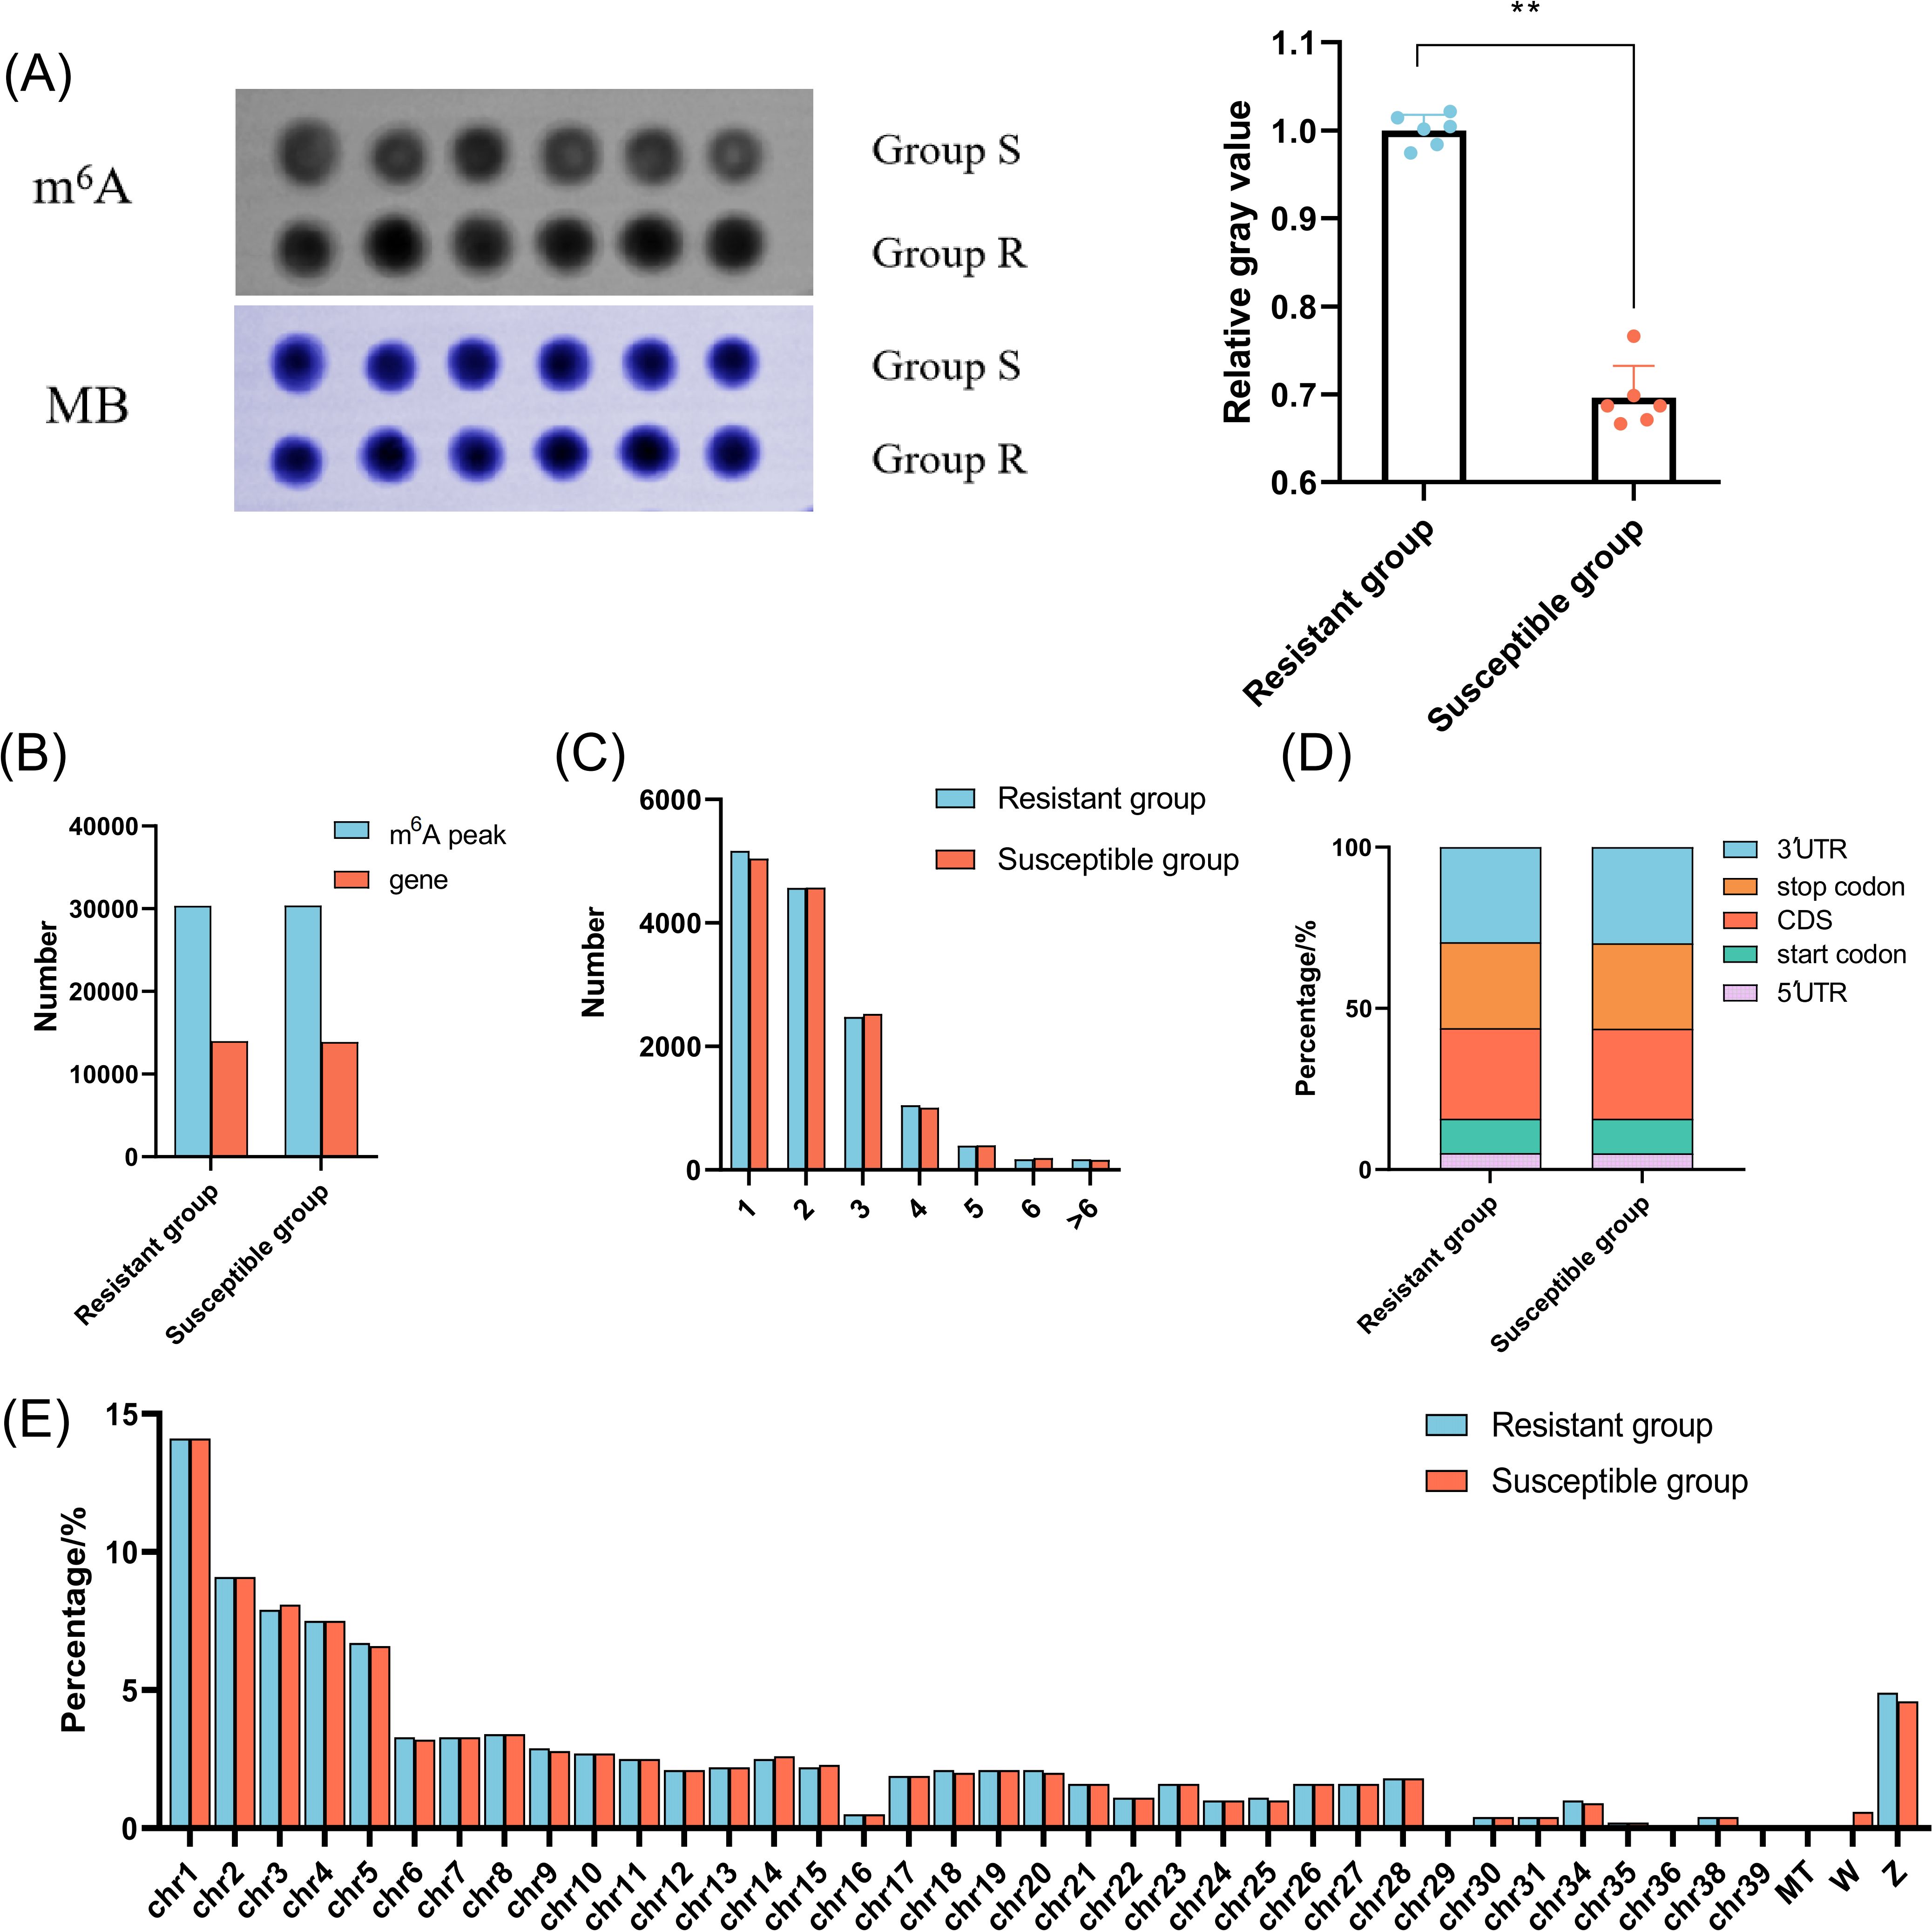
Figure 2. The characterization of the m6A methylation of chicken cecum in the C. jejuni-susceptible (S) and resistant (R) groups. (A) The global m6A levels of chicken cecum in the C. jejuni-susceptible and resistant groups. The data are pooled from 2 independent experiments with 6 replicates per group (n = 6) and presented as the mean ± SEM; ** representing P < 0.01. (B) The number of identified m6A peaks and genes in the C. jejuni-susceptible and resistant groups. (C). The number of peaks in the corresponding genes in the C. jejuni-susceptible and resistant groups. (D) The distribution of m6A peaks in different genomic features in the C. jejuni-susceptible and resistant groups. (E) The density of m6A peaks on chromosomes in the C. jejuni-susceptible and resistant groups.
3.3 Identification and functional analysis of DMPs
There were 514 DMPs identified between the R group and the S group including 270 hyper-methylated and 244 hypo-methylated peaks (P < 0.05, |log2 Fold change| ≥ 1) (Figure 3A, Supplementary Table S3), which mainly located in the stop codon (34.7%) (Figure 3B). Among which, the 270 hyper-methylated peaks were widely distributed on 36 chromosomes, while the 244 hypo-methylated peaks were widely distributed on 32 chromosomes (Figure 3C). Moreover, there were 38 hyper-methylated and 46 hypo-methylated peaks mainly located on chromosome 1. These DMPs were annotated to 514 genes, approximately 98% genes contained one m6A peak (Figure 3D). GO enrichment analysis indicated that the DMPs were significantly enriched in 324 terms (212 biological process (BP), 76 molecular function (MF), 36 cellular component (CC)) (P < 0.05) (Supplementary Table S4). In terms of BP, the major immune-related pathways including regulation of mitochondrion organization, regulation of canonical NF-kappaB signal transduction, apoptotic signaling pathway, MyD88-dependent toll-like receptor signaling pathway, and lipopolysaccharide-mediated signaling pathway were significantly enriched (Figure 3E). Notably, PIDD1, ZFAND6, and CAPN3 were significantly enriched in the regulation of canonical NF-kappaB signal transduction, and apoptotic signaling pathway. PTAFR and CD180 were significantly enriched in the lipopolysaccharide-mediated signaling pathway. KEGG pathway enrichment results revealed that the DMPs were significantly enriched in Wnt signaling pathway, mTOR signaling pathway, Toll-like receptor signaling pathway, calcium signaling pathway, VEGF signaling pathway, autophagy, and tight junction (P < 0.05) (Figure 3F). Notably, WNT6, PRKCB, WNT4, and SLC38A9 were demonstrated significantly associated with the mTOR signaling pathway.
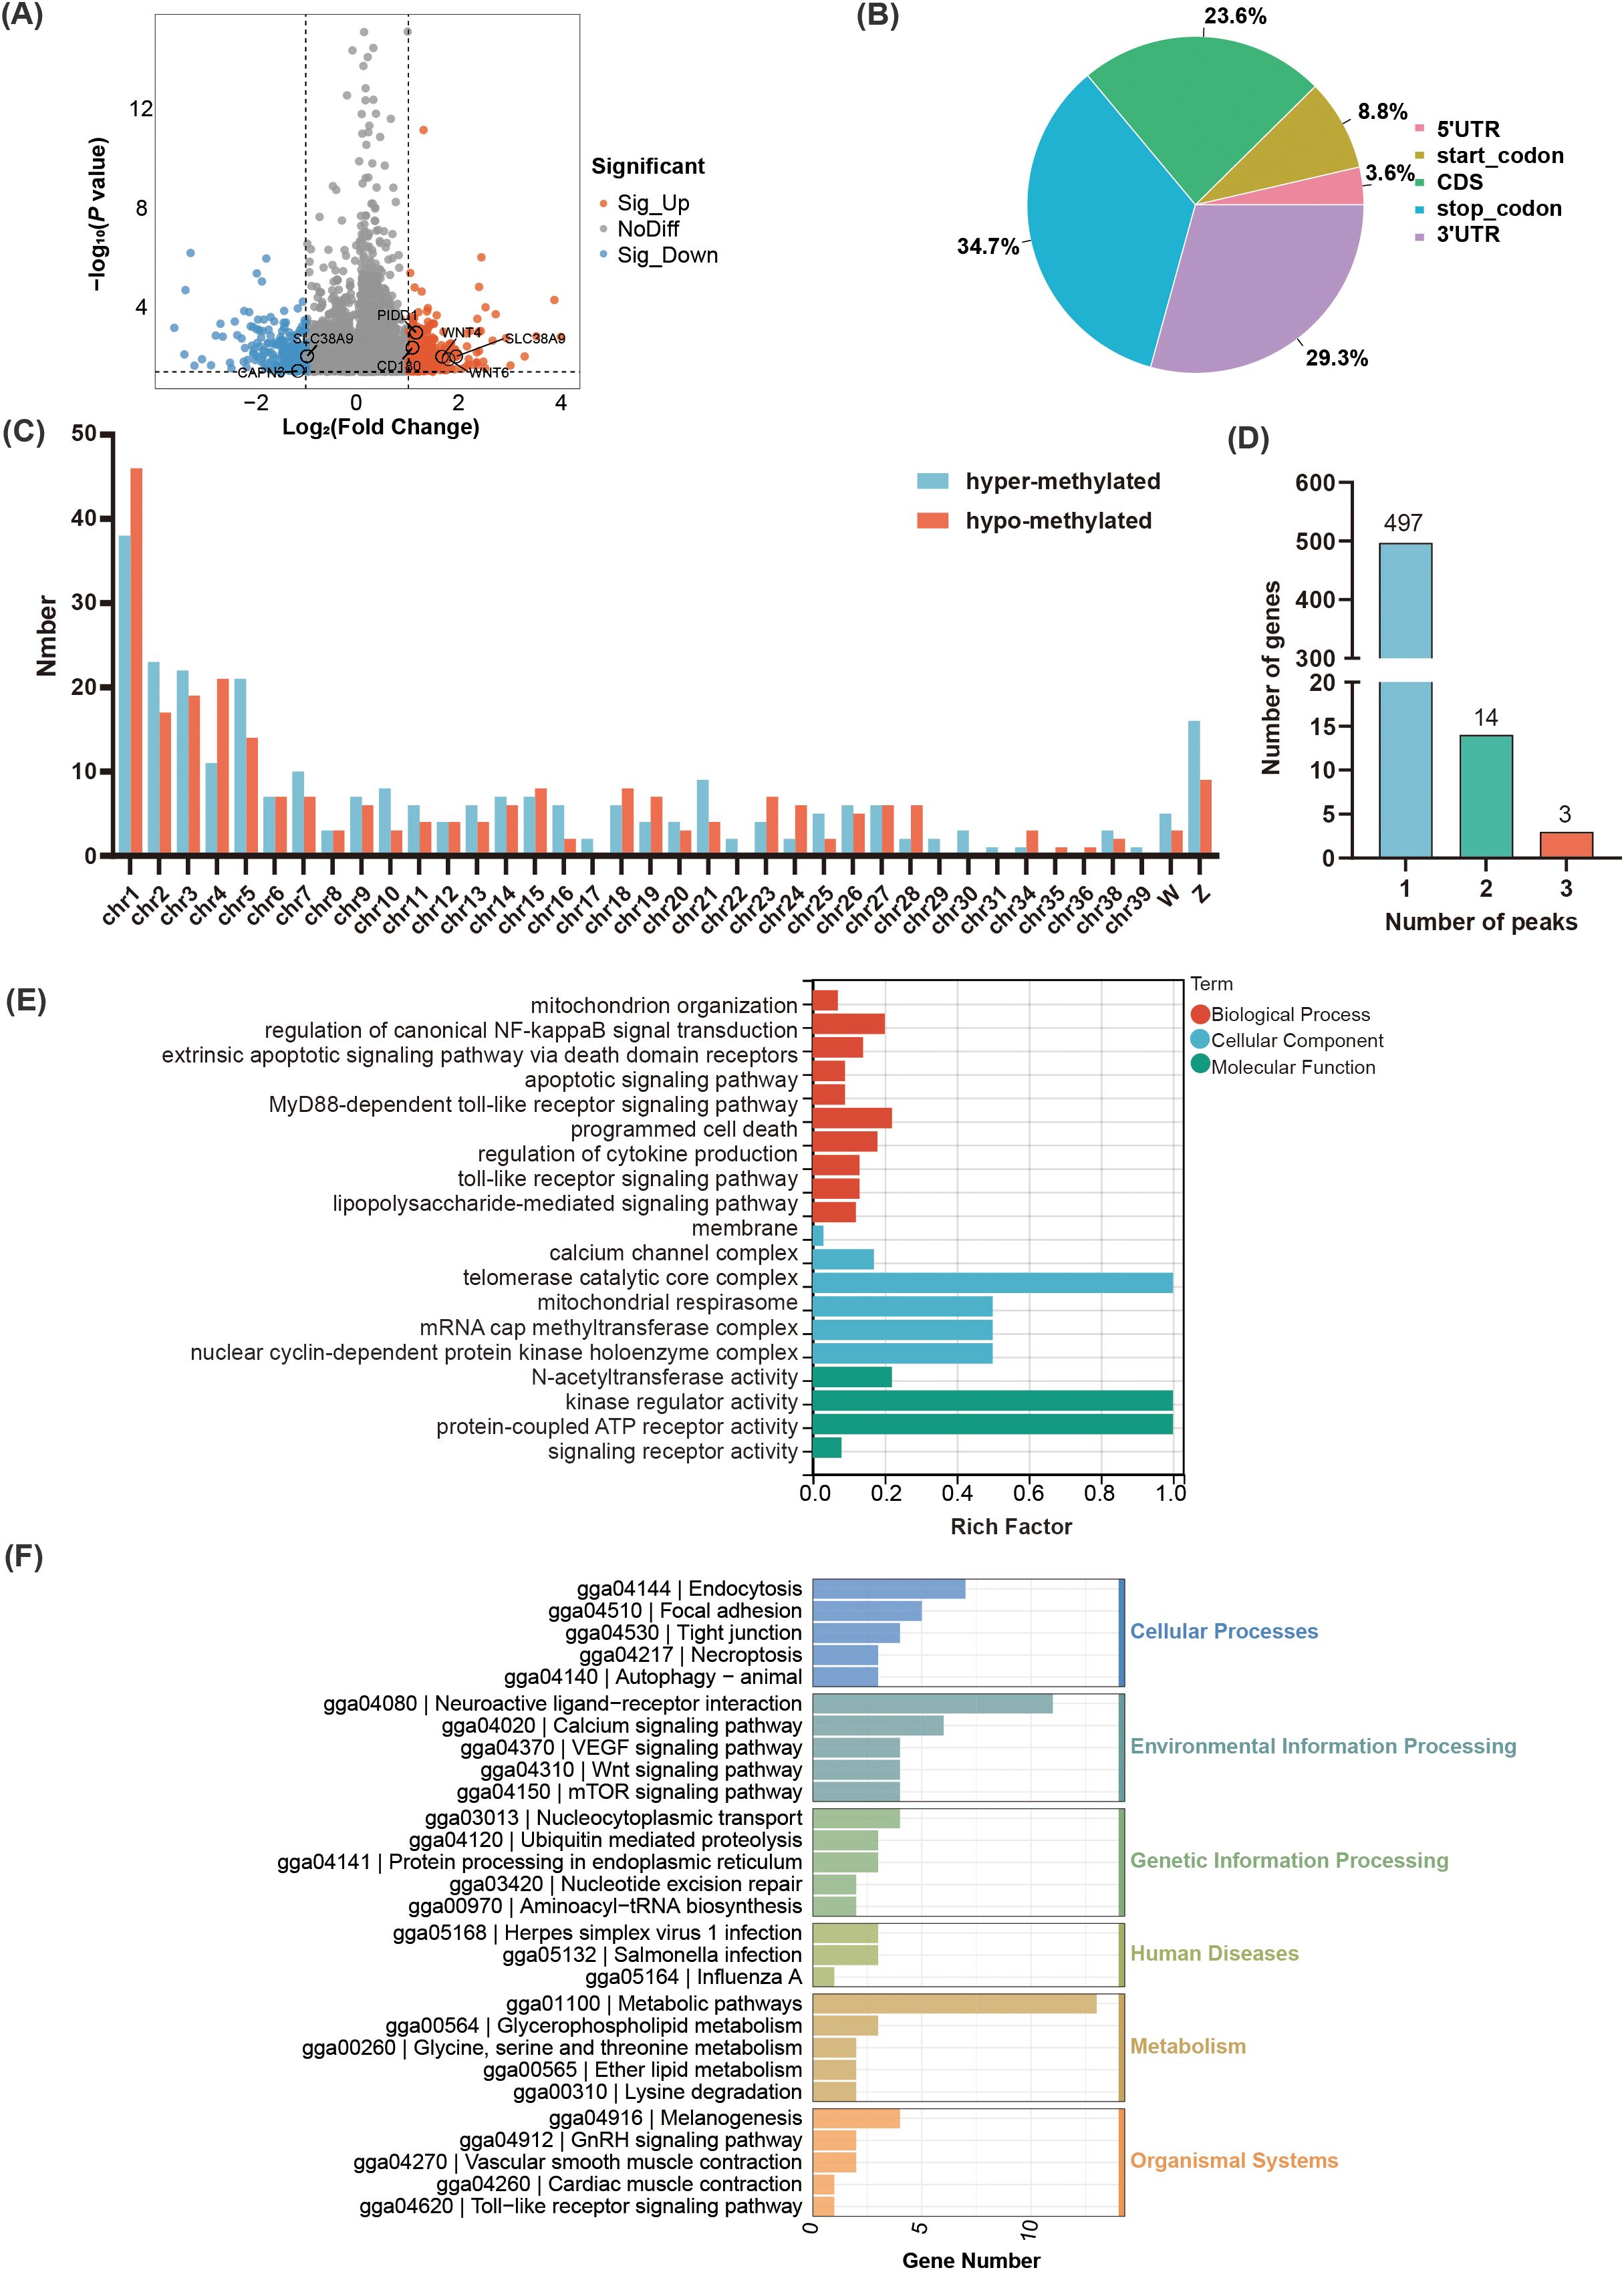
Figure 3. Identification and functional analysis of the identified m6A peaks in the C. jejuni-susceptible (S) and resistant (R) groups. (A) The identified m6A peaks in C. jejuni-susceptible and resistant groups. (B). The distribution of differential m6A peaks in different genomic features in the resistant and susceptible groups. (C). The density of m6A peaks on chromosomes. (D) The number of differential m6A peaks in the corresponding genes. (E) The enriched GO terms for the differential m6A peaks. (F) The enriched KEGG pathway of differential m6A peaks.
3.4 Correlated analysis of m6A modification and gene expression
To elucidate the functional consequences of the gene expression modified by m6A methylation, the global transcriptomic landscape of chicken cecum in the R and S groups were performed using RNA-seq. Totally, 365 DEGs were identified including 166 upregulated genes and 199 downregulated genes (P < 0.05, |log2Fold change| ≥ 1) (Figure 4A, Supplementary Table S5). Notably, the expression of m6A modification related gene YTHDC2 were upregulated in the R group, but no significance was observed in other m6A modification related genes such as METTL14, FTO, ALKBH5 (Supplementary Figure S4). Further GO and KEGG analysis for DEGs identified 193 significantly enriched terms (128 BP, 49 MF, 16 CC) (P < 0.05) (Supplementary Table S6). In terms of BP, the major immune-related terms including defense response to bacterium, regulation of polarized epithelial cell differentiation, negative regulation of T-helper 1 type immune response, positive regulation of B cell apoptotic process, and negative regulation of cytokine activity were significantly enriched (Figure 4B). Among these, IL-10, DEFB4A, and AvBD1 were significantly enriched in defense response to bacterium. KEGG enrichment results showed that the DEGs were significantly enriched in eight pathways including PPAR signaling pathway, apoptosis, p53 signaling pathway, tyrosine metabolism (P < 0.05) (Figure 4C).
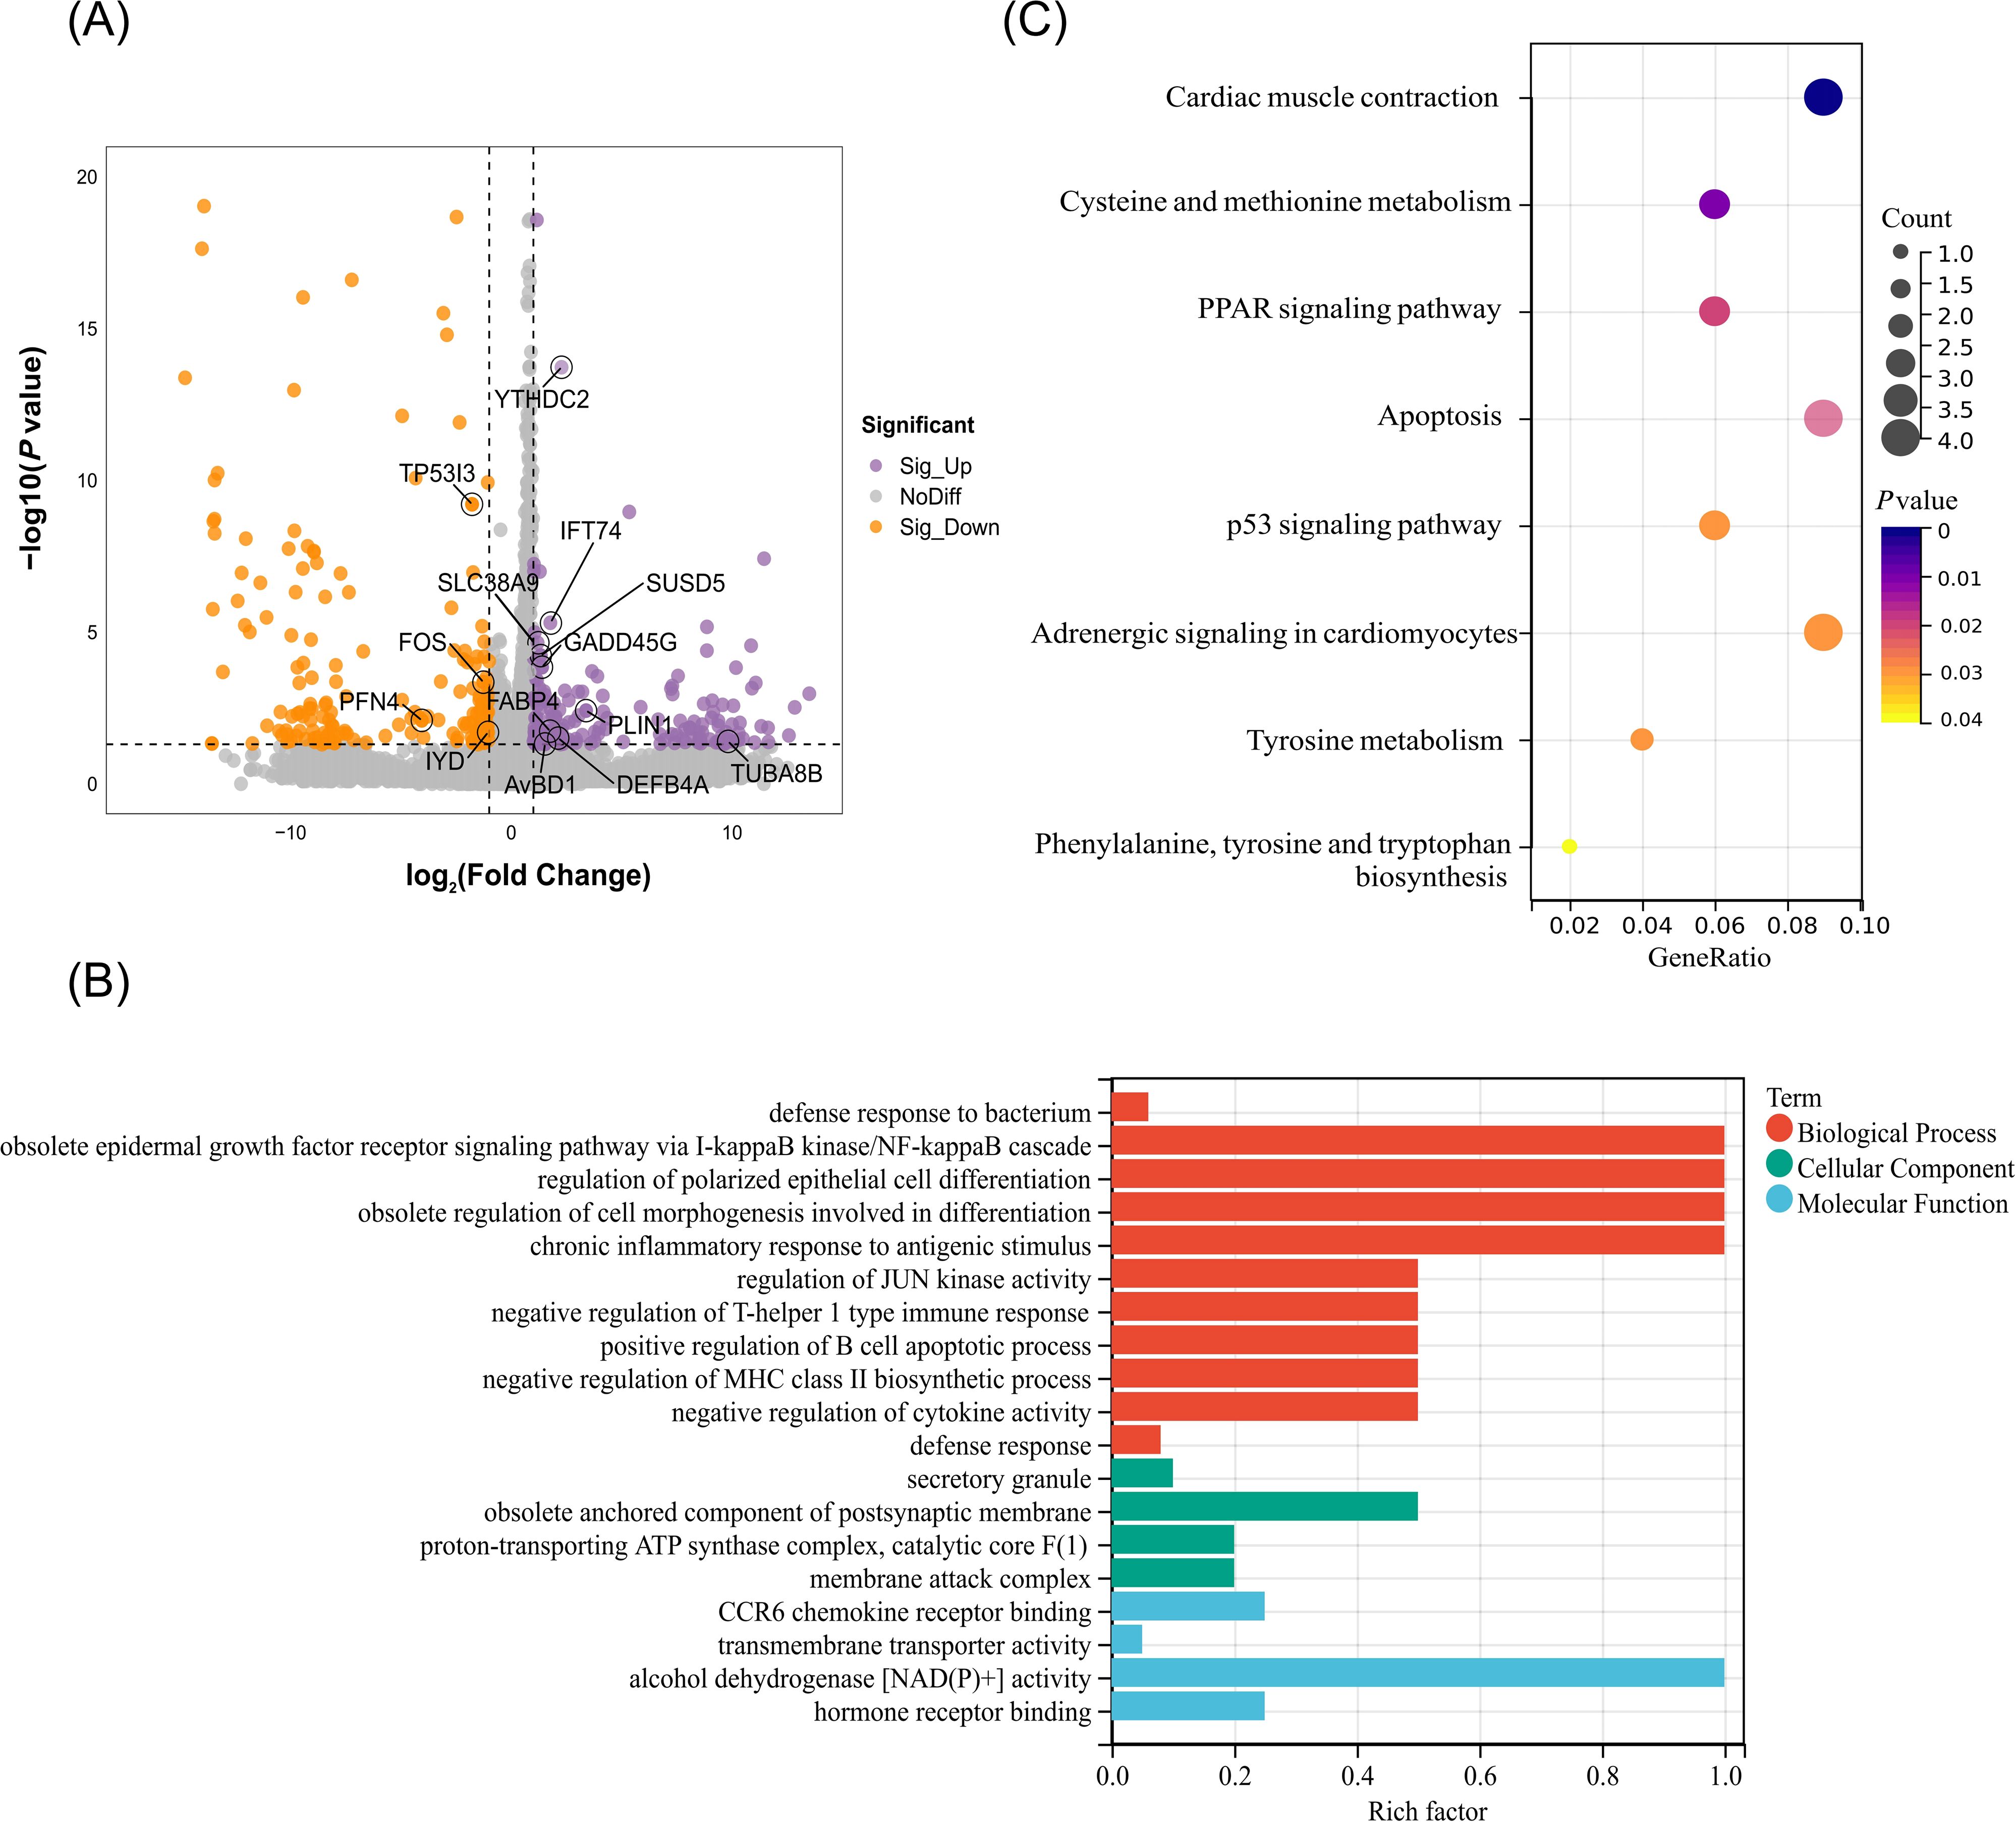
Figure 4. Identification and functional analysis of differentially expressed genes in the C. jejuni-susceptible (S) and resistant (R) groups. (A) The identified genes in the C. jejuni-susceptible and resistant groups. (B) The enriched GO terms of differentially expressed genes. (C) The enriched KEGG pathway of differentially expressed genes.
To elucidate the regulatory role of m6A modification, the correlation between m6A modification and gene expression was performed. In general, we found that the expression of gene containing m6A peak was significantly higher than that of genes without m6A modifications in both the R and S groups (P < 0.05) (Figure 5A). Further analysis revealed that 58 DMGs were identified in R group including 26 hyper-methylated DMGs (16 mRNAs upregulated and 10 mRNAs downregulated), and 32 hypo-methylated DMGs (23 mRNAs upregulated and 9 mRNAs downregulated) (Figure 5B, Supplementary Table S7). The m6A peaks of the DMGs predominantly located in CDS region (n=27) and 3’UTR (n=18) (Figure 5C). The GO enrichment results showed that these DMGs were mainly enriched in 11 terms including autophagy, toll-like receptor 9 signaling pathway, Notch signaling pathway, intraciliary transport involved in cilium assembly (P < 0.05) (Figure 5D). KEGG enrichment results showed that these DMGs were significantly enriched in 7 pathways including C-type lectin receptor signaling pathway, Calcium signaling pathway, toll-like receptor signaling pathway, apoptosis, MAPK signaling pathway, and mTOR signaling pathway (P < 0.05) (Figure 5E). Interestingly, the hypo-methylated DMGs including SUSD5 and IFT74 were significantly enriched in Notch signaling pathway, but the expression at mRNA level was increased. The regulation of autophagy pathway was enriched by two hyper-methylated DMGs WDR41 and EPG5, which have higher mRNA expression. Moreover, the DMG FOS with hypo-methylated level and lower expression at mRNA level was significantly enriched in apoptosis pathway. The hypo-methylated DMG STAB2 was mainly associated with defense response to bacteria (Figures 5F, G).
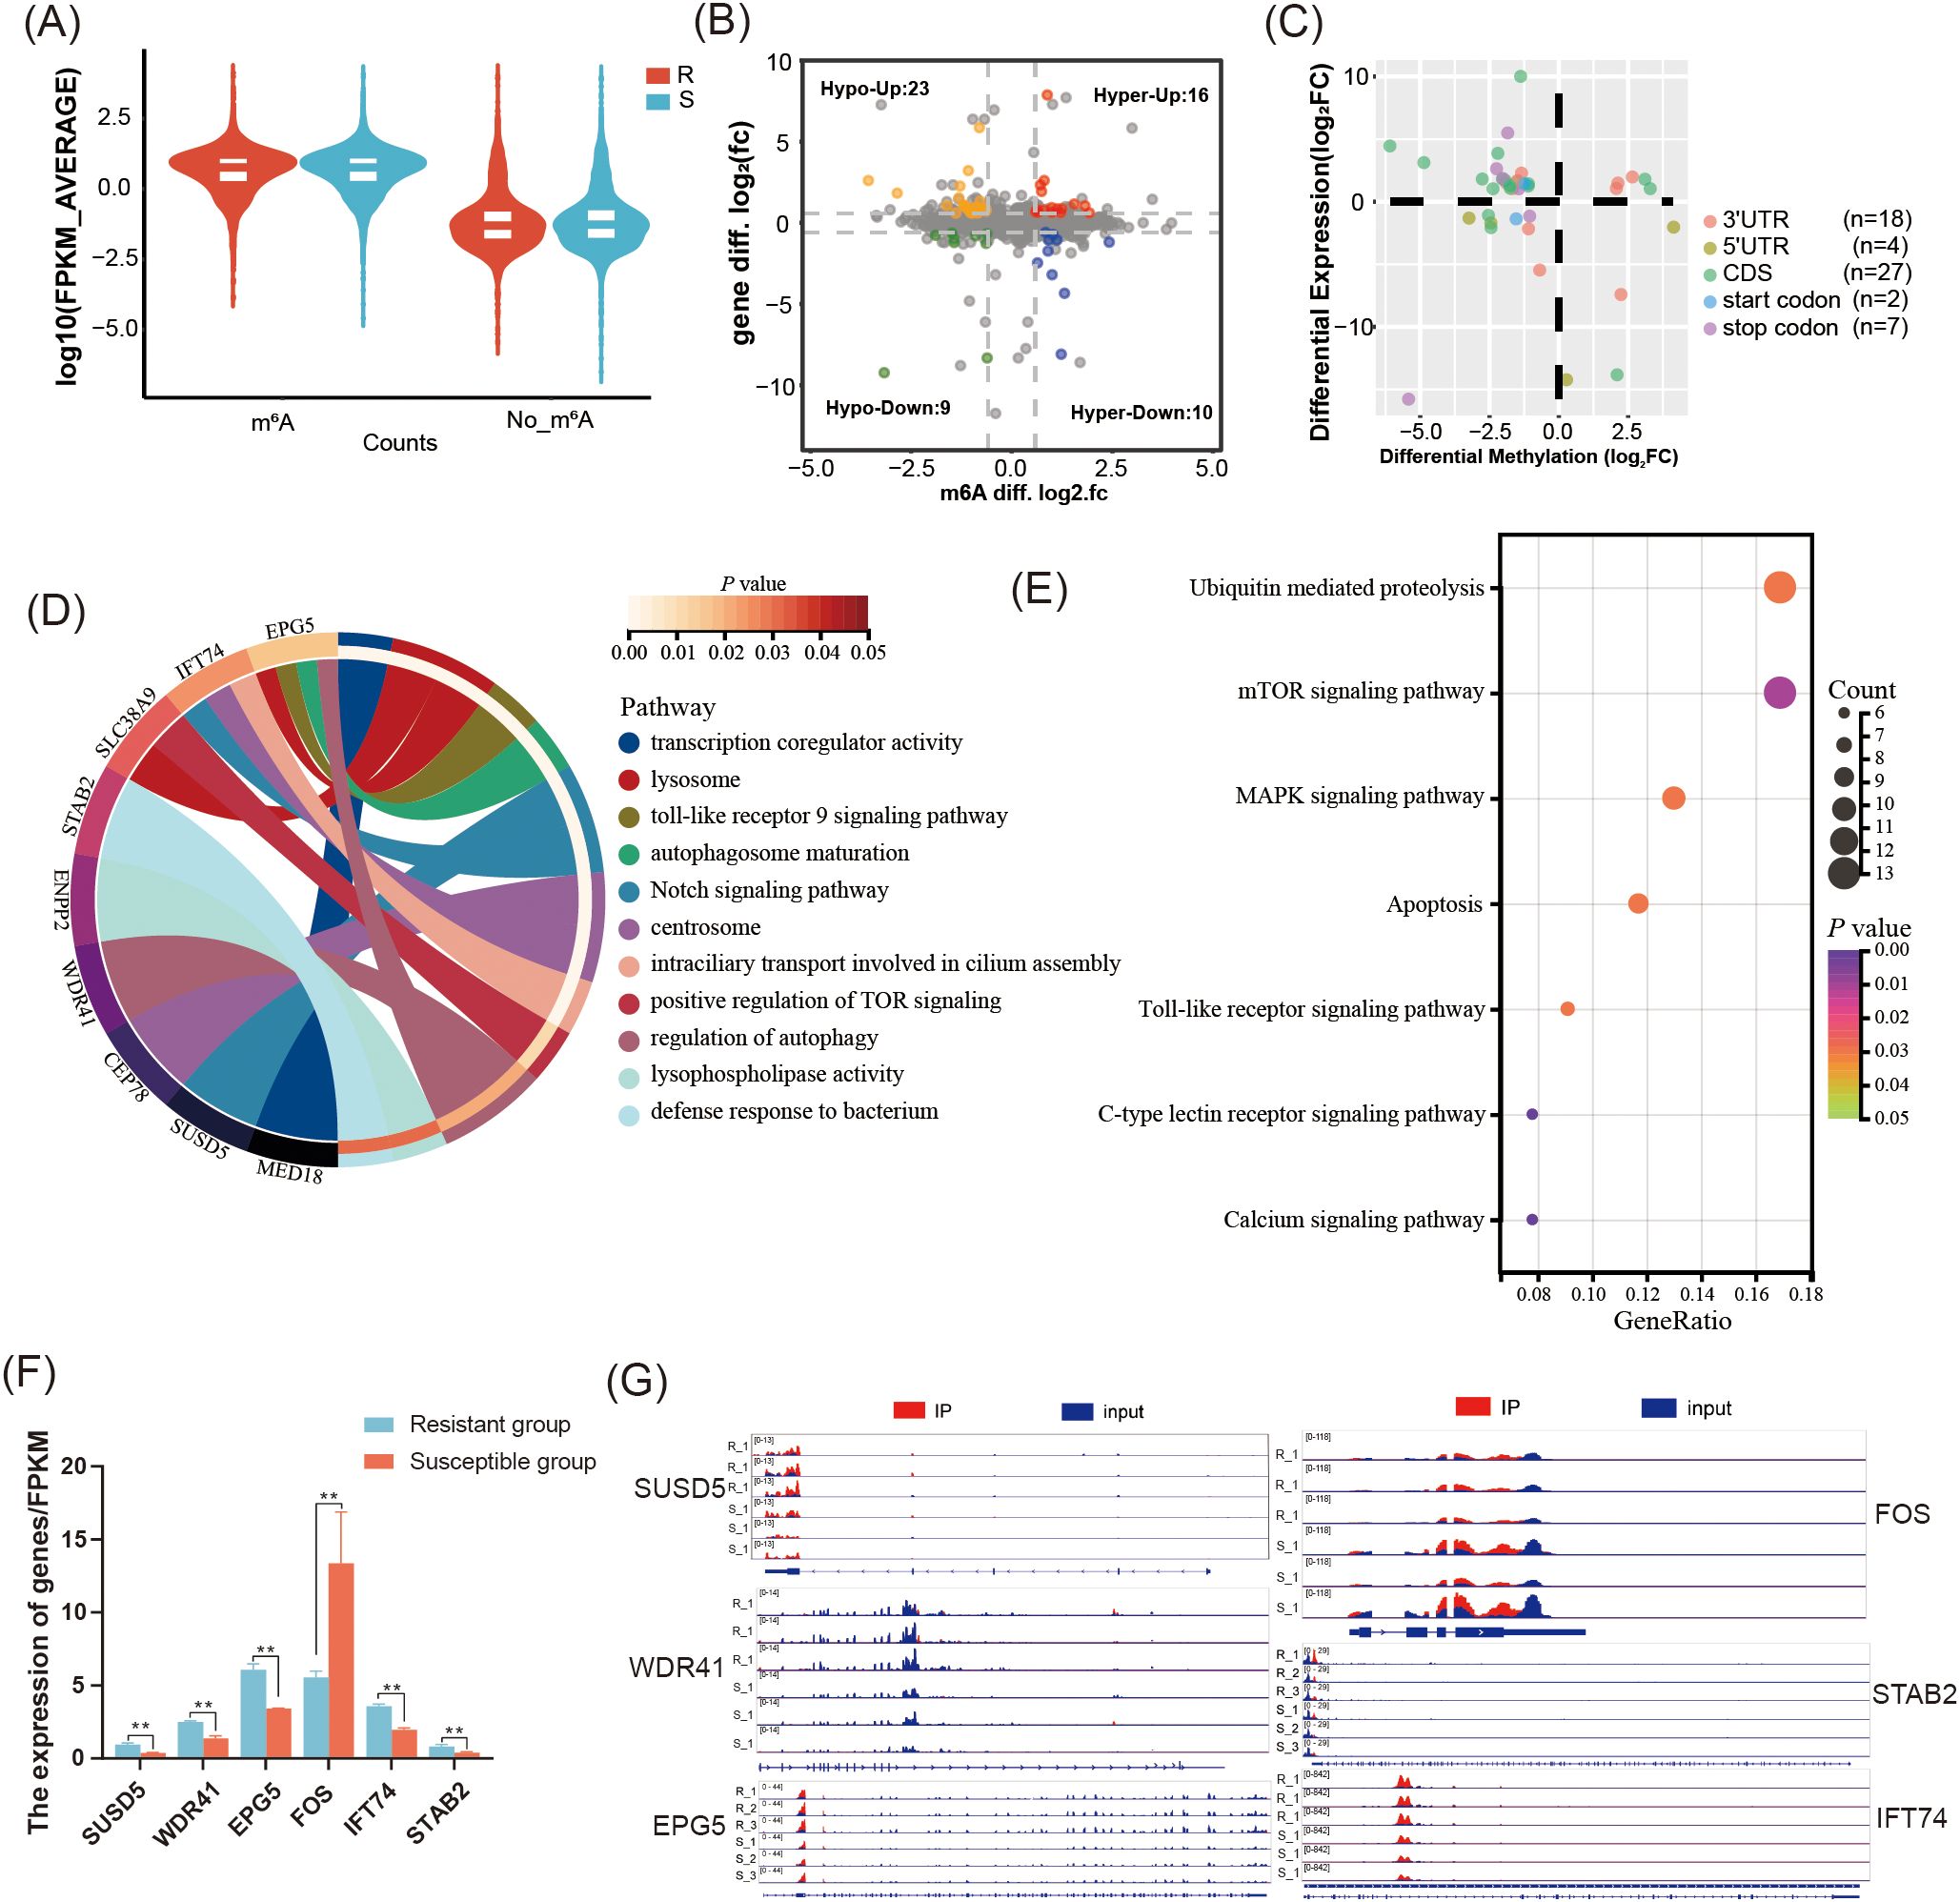
Figure 5. Integrated analysis of MeRIP-seq and RNA-seq in the C. jejuni-susceptible (S) and resistant (R) groups. (A) The gene expression of genes with or without m6A modifications in the resistant and susceptible groups. (B) Distribution of genes with significant changes in both gene expression levels as well as m6A levels (Hyper-up: m6A levels upregulated and mRNA expression upregulated; Hyper-down: m6A levels upregulated as well as mRNA expression downregulated; Hypo-up: m6A levels downregulated as well as mRNA expression upregulated; Hypo-down: m6A levels downregulated as well as mRNA expression downregulated. (C) The distribution of differentially expressed genes containing differential m6A peaks in different genomic features. (D) The enriched GO terms of differentially expressed genes containing differential m6A peaks (E) The enriched KEGG pathway of DMGs with differential peaks. (F) The expression of differentially expressed genes containing differential m6A peaks SUSD5, WDR41, EPG5, FOS, STAB2, and IFT74 in the resistant and susceptible groups. The data are pooled from 2 independent experiments with 6 replicates per group (n = 6) and presented as the mean ± SEM; ** representing P < 0.01. (G) The distribution m6A peaks located in SUSD5, WDR41, EPG5, FOS, STAB2, and IFT74.
3.5 The regulatory role of YTHDC2 in HD11 cells responding to C. jejuni colonization
In general, the qRT-PCR results for seven randomly selected genes were highly correlated with the sequencing results (R2 = 0.933, P < 0.0001) (Figure 6A). Additionally, the m6A modification related genes, just the expression level of YTHDC2 in the S group was significantly lower than that in the R group, which is consistent with the RNA-seq results (P < 0.05) (Figure 6B). The expression level of immune related DMGs EPG5, IFT74, SUSD5, STAB2 and WDR41 in the S group were significantly lower than those in the R group, whereas the expression level of FOS in the S group was significantly higher than that in the R group (P < 0.05) (Figure 6C). Using MeRIP-qPCR, we found that the m6A modification level of EPG5, STAB2 and WDR41 in R group was increased, but the m6A modification levels of SUSD5, IFT74 and FOS in R group were decreased compared to S group (P < 0.05) (Figure 6D).
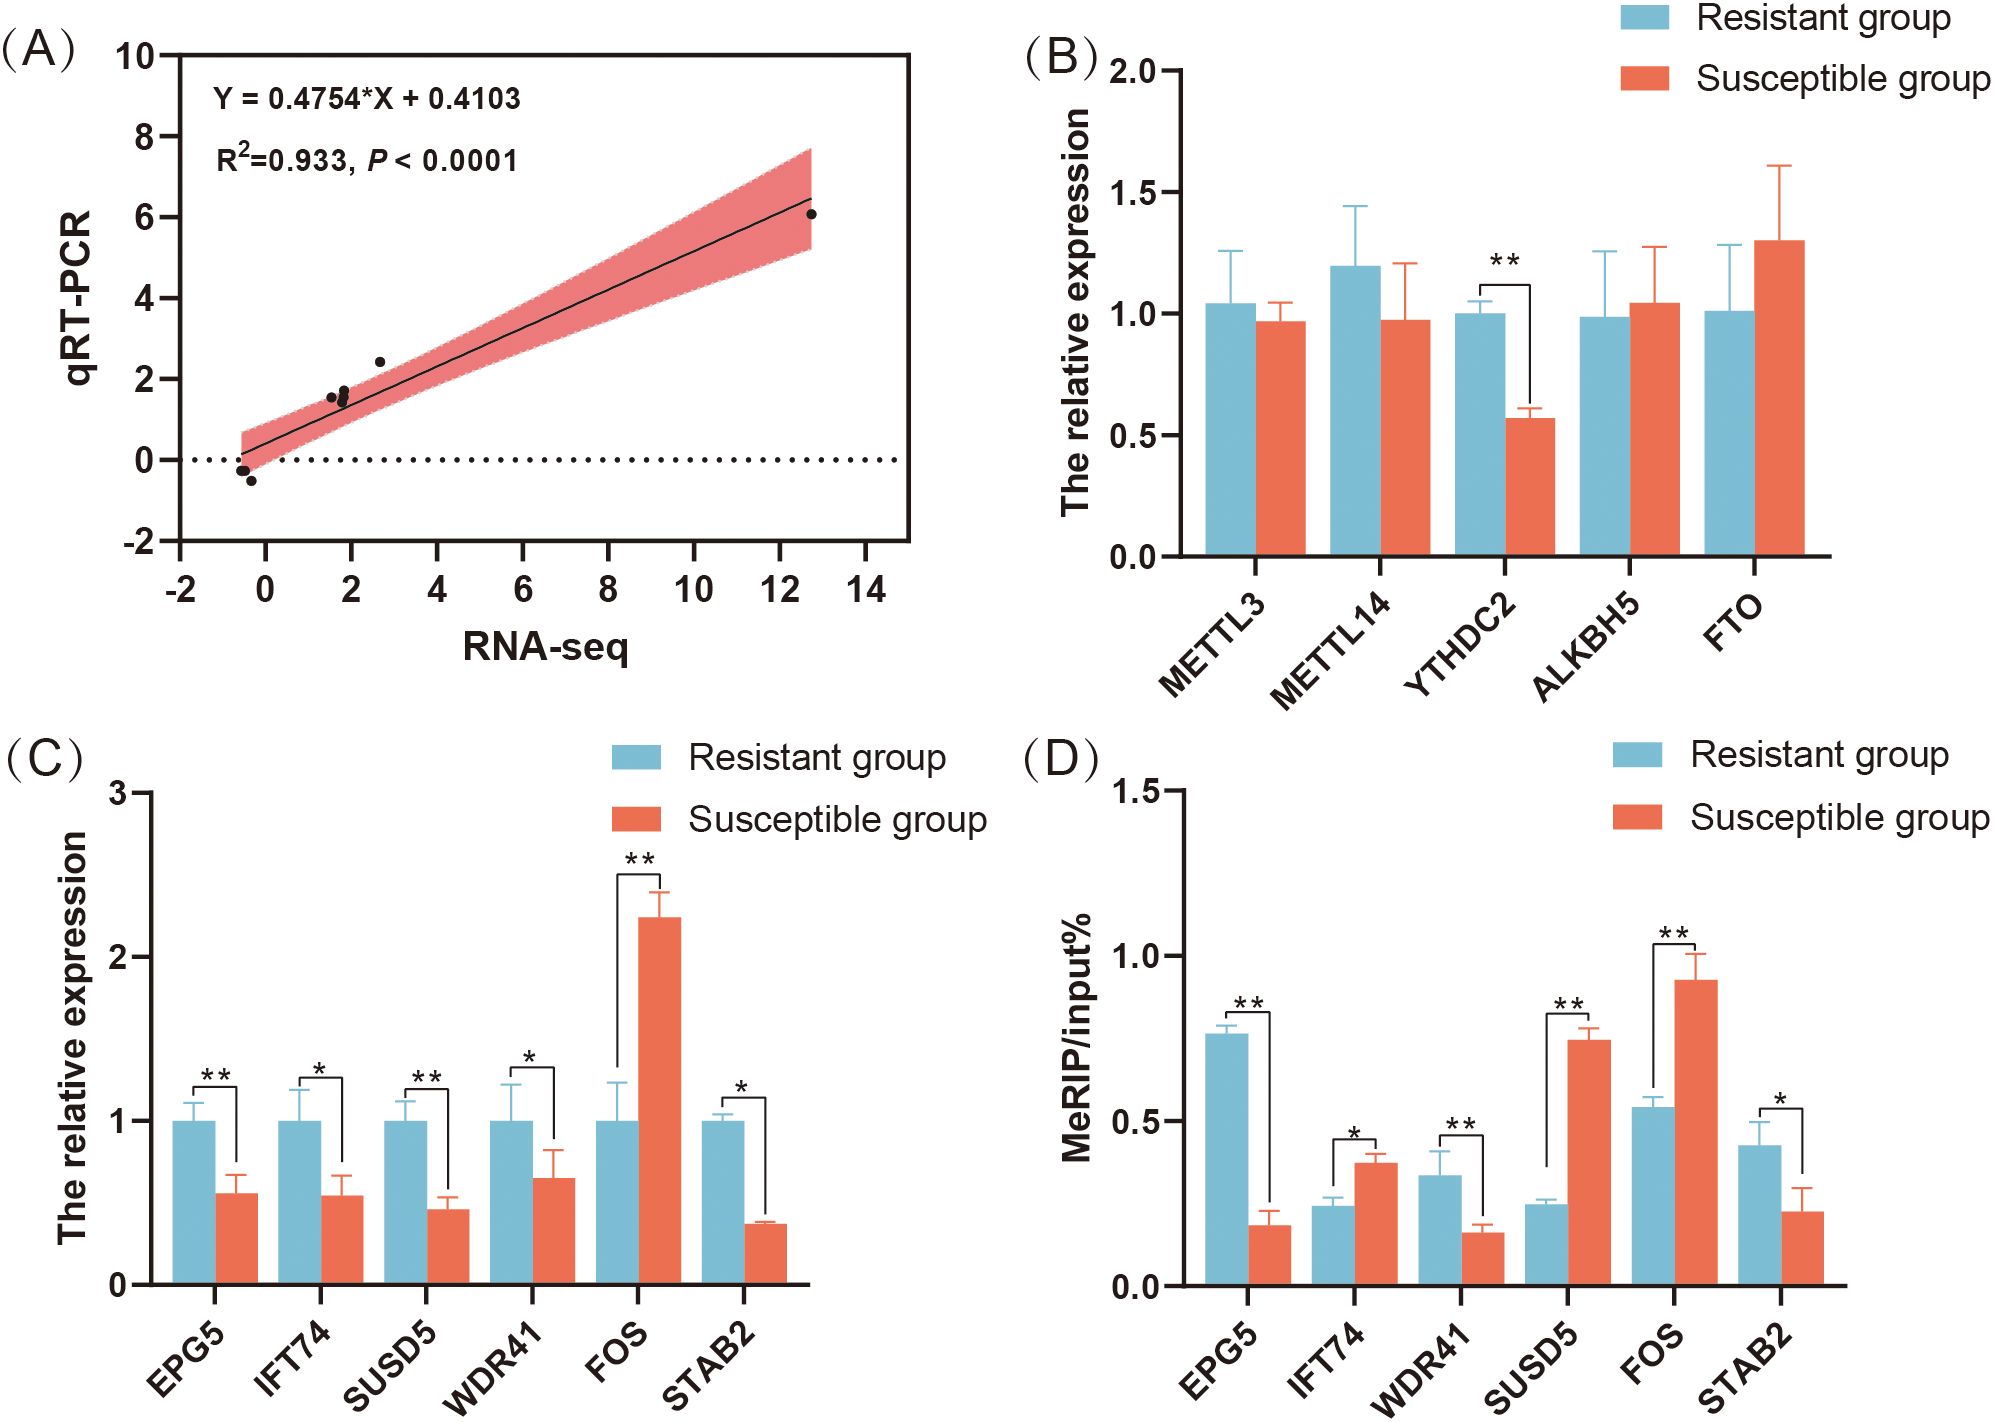
Figure 6. Validation of m6A peaks and mRNA levels of differentially expressed genes containing differential m6A peaks in the C. jejuni-susceptible (S) and resistant (R) groups. (A) qRT-PCR validation of gene expression in the resistant and susceptible groups. (B) The expression levels of m6A modification related genes METTL3, METTL14, YTHDC2, ALKBH5, and FTO in the resistant and susceptible groups of chicken cecum. (C) qRT-PCR results of SUSD5, WDR41, EPG5, FOS, STAB2, and IFT74 in the resistant and susceptible groups of chicken cecum. (D) meRIP-qPCR results of SUSD5, WDR41, EPG5, FOS, STAB2, and IFT74 in the resistant and susceptible groups of chicken cecum. The data are pooled from 2 independent experiments with 6 replicates per group (n = 6) and presented as the mean ± SEM; * and ** represent P < 0.05, P < 0.01, respectively.
To further evaluate the function of YTHDC2, the YHTDC2 knockdown model in chicken HD11 cell line was constructed. The apoptosis rate of HD11 in LPS group was higher than that in NC group, whereas the apoptosis rate of HD11 in si-YTHDC2 group was lower than that in NC group (P < 0.05) (Figure 7A). The qRT-PCR results of apoptosis related gene CASP3 and anti-apoptosis related gene BCL2L1 further supported the above results (P < 0.05) (Figure 7B). Additionally, YTHDC2 knockdown could increase the expression of the autophagy related genes ATG5 and ULK1, whereas LPS stimulation could decrease the expression of the ATG5 and ULK1 (P < 0.05) (Figure 7B). Moreover, YTHDC2 knockdown significantly increased the expression of DMGs: EPG5, WDR41, SUSD5, STAB2, FOS, and IFT74 (P < 0.05). Compared to NC group, the expression of EPG5 and IFT74 was increased, whereas the expression of STAB2 was decreased in the LPS group (P < 0.05) (Figure 7B). These results indicated that YTHDC2 could be involved in regulating the apoptosis and autophagy process of HD11 cells through altering the expression of DMGs including IFT74, SUSD5, STAB2, EPG5 and FOS.
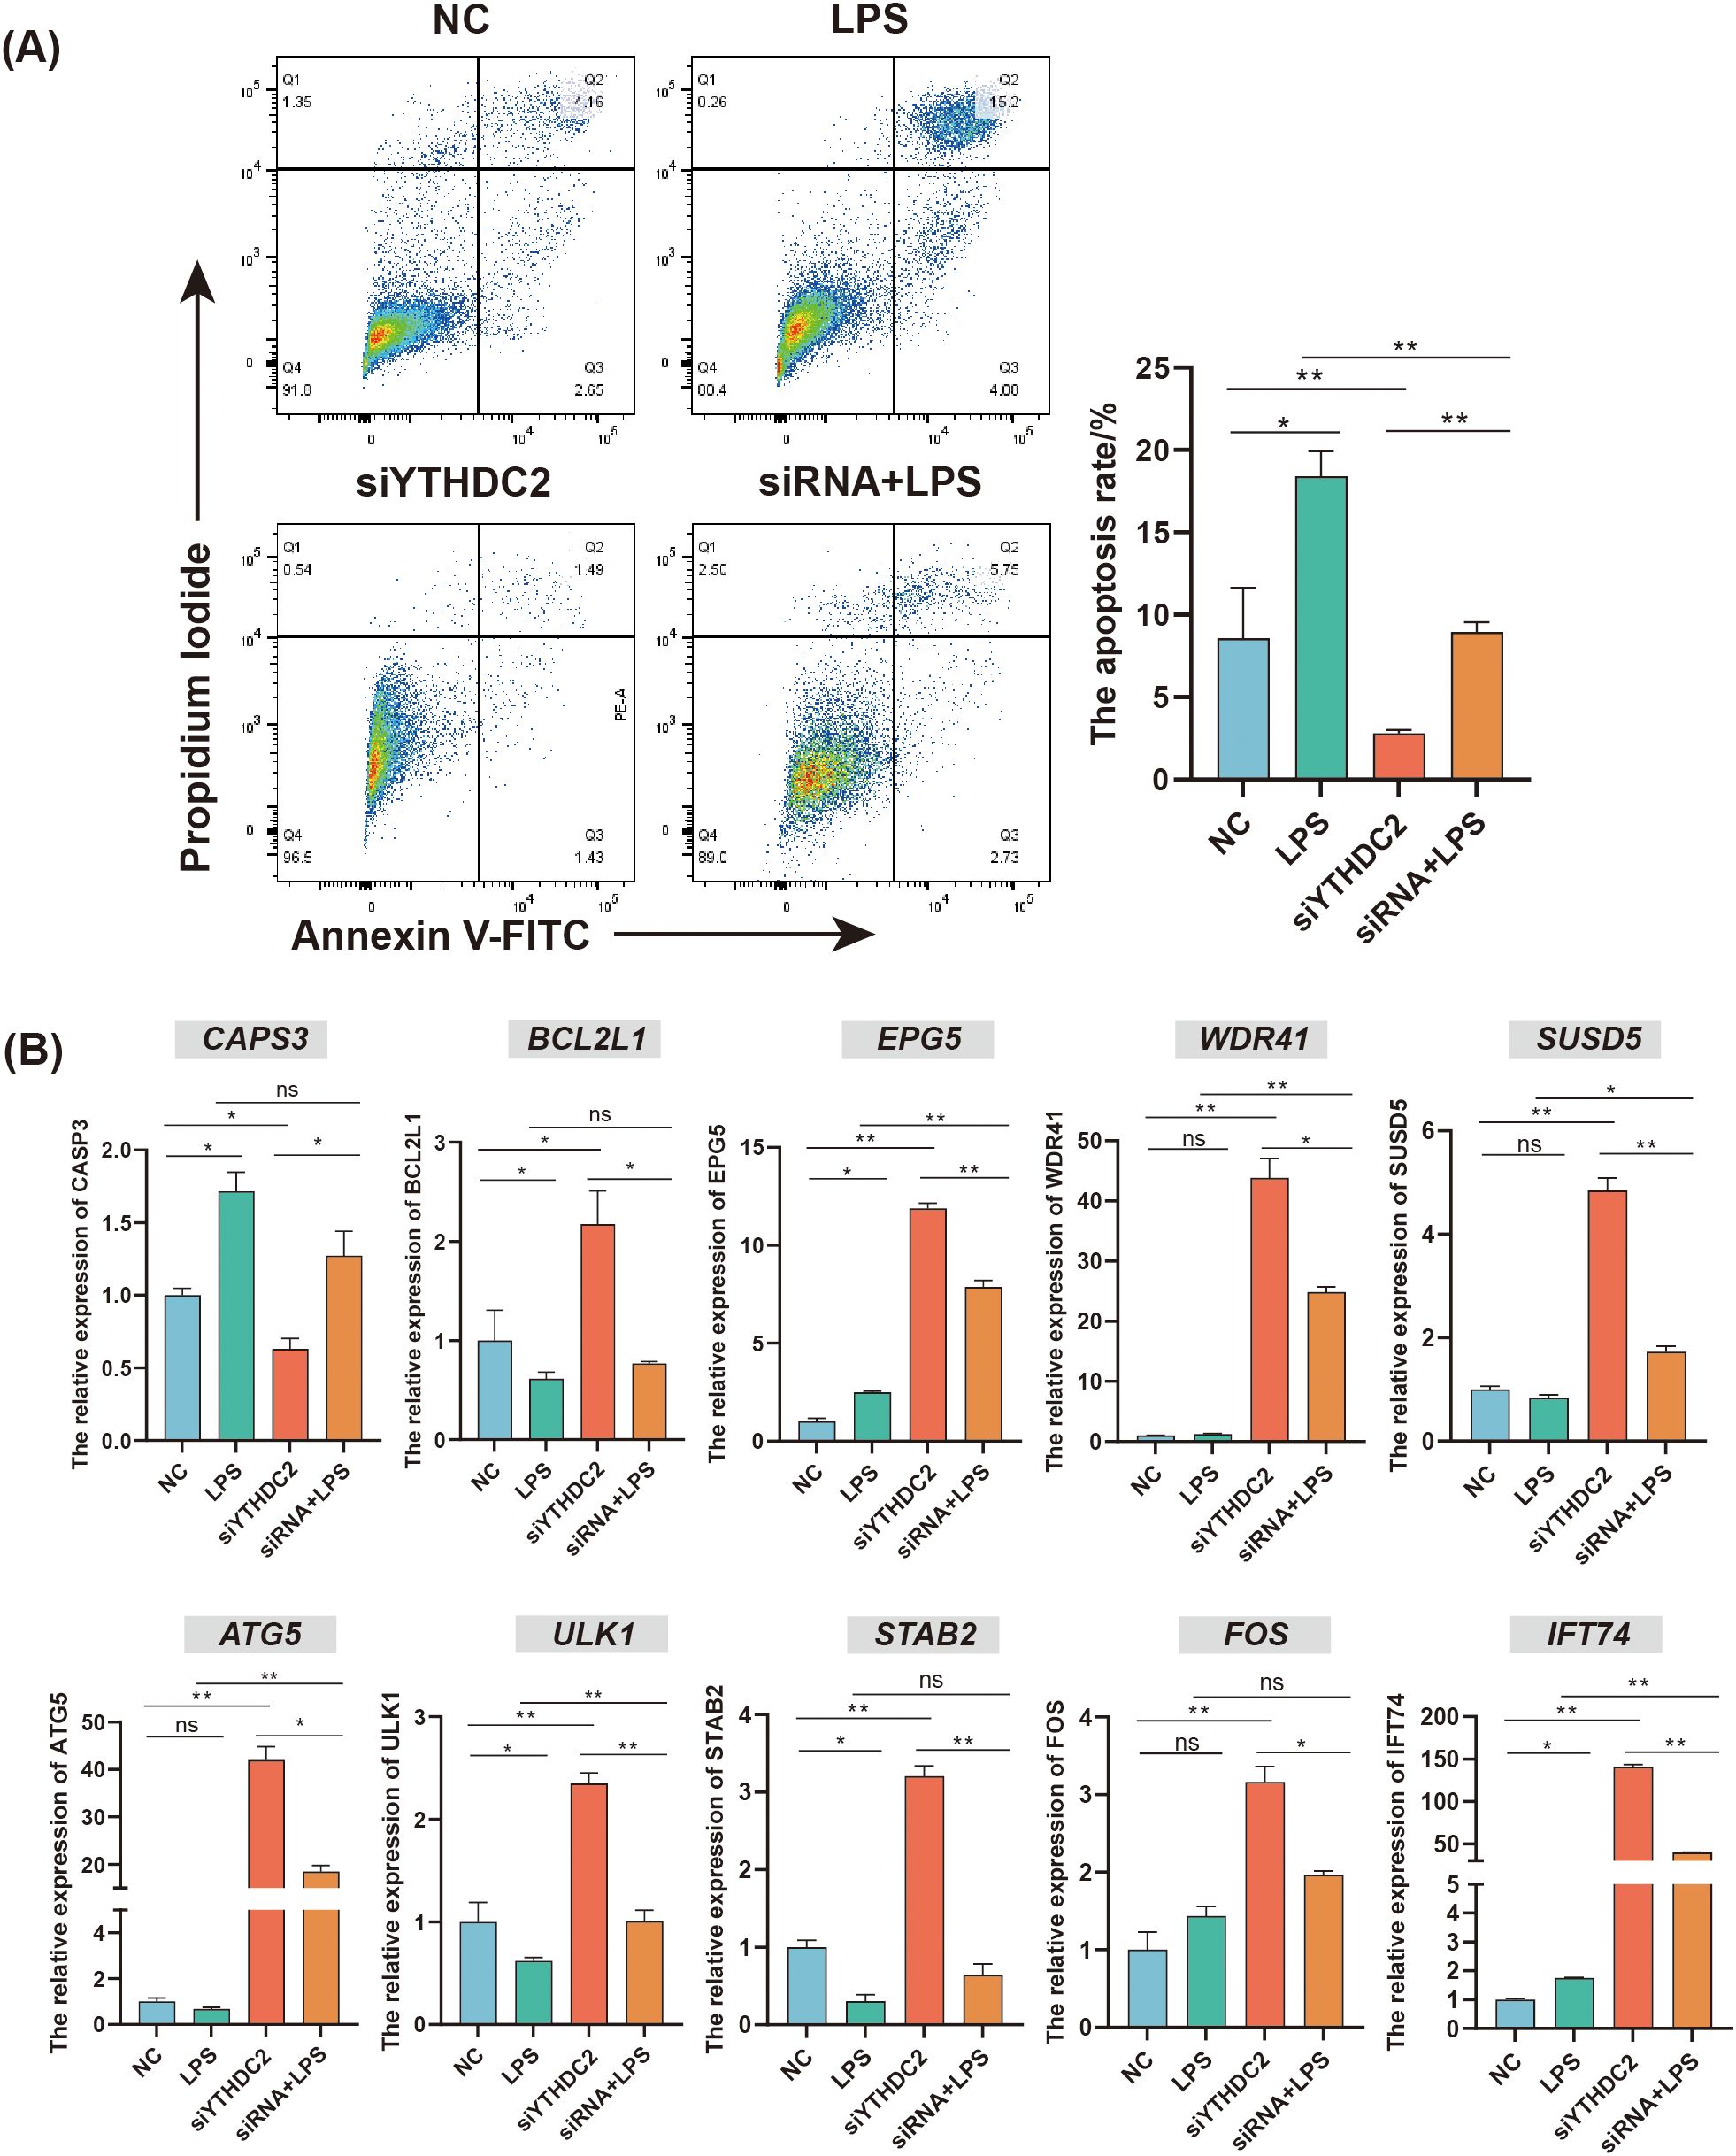
Figure 7. The regulatory role of YTHDC2 for chicken HD11 cell line responding to C. jejuni LPS stimulation. (A) Flow cytometric analysis of apoptosis in HD11 cells after YTHDC2 knock down followed by C. jejuni LPS stimulation. (B) Effects of interference YTHDC2 on the mRNA expression of apoptosis and autophagy related genes involved in responding to C. jejuni LPS stimulation. The data are pooled from 4 independent experiments with 4 replicates per group (n = 4) and presented as the mean ± SEM; * and ** represent P < 0.05, P < 0.01, respectively.
4 Discussion
C. jejuni, as a commensal bacterium in commercial broiler chickens, seriously hampers bird welfare (49). C. jejuni colonizes the avian intestines in high numbers and rapidly spreads within flocks (50). Studies on pathogen-resistant and -susceptible chicken inbred lines have revealed that differences in innate immunity are associated with variations in intestinal β-defensin secretion (51). The mechanism in response to C. jejuni inoculation in chickens is regulated by multiple molecular levels with manifestation in transcriptional level, post-transcriptional level, and the protein level (52–54). While, the regulatory role of m6A modification underlying chicken responding to C. jejuni inoculation still remains unclear. Therefore, the chicken model inoculated with C. jejuni inoculation was constructed, and the landscape of m6A modification of chicken cecum was characterized.
m6A modification, the most prevalent and abundant internal post-transcriptional modification of messenger RNA in eukaryotic organisms, plays essential regulatory roles in immune responsiveness (55–58). In this study, we identified numerous m6A modification sites in both susceptible and resistant chickens of cecum, which were mainly located in the 3′UTR, CDS, and stop codon regions, which aligns with previously findings (59–61). m6A modification has been mechanistically implicated in attenuating mRNA stability and facilitating mRNA decay across diverse biological processes (62, 63). Conversely, emerging evidence suggests that m6A methylation density is positively correlated with transcript abundance (64–66). In our study, the expression of genes containing m6A peak was significantly higher than that of genes without modification, indicating the m6A modification could regulate chicken responding to C. jejuni colonization though modulating gene expression.
Recent researches have uncovered that m6A methylation machinery emerged as important regulators of host immunity through dynamics regulation of RNA metabolism and innate immune signaling pathways (67, 68). In the current study, we identified numerous differential m6A peaks associated with immune related pathways, such as regulation of canonical NF-kappaB signal transduction, apoptotic signaling pathway, MyD88-dependent toll-like receptor signaling pathway, mTOR signaling pathway. As the prototypical adapter of the Toll-like receptor signaling cascade, MyD88 coordinates essential innate immune defenses against microbial pathogens (69). Furthermore, SPOP-mediated ubiquitination limits canonical NF-κB signaling activity, thereby attenuating IL-1β biosynthesis in chicken macrophages following lipopolysaccharide challenge (70). B cell-specific mTOR deficiency can limit humoral immune responses through AID signaling (71). In the current study, the above immune related pathways were significantly enriched by DMPs PIDD1, ZFAND6, CAPN3, WNT6, PRKCB, WNT4, and SLC38A9. Of which, PIDD1, ZFAND6, WNT6, PRKCB, and WNT4 were hyper-regulated in the C. jejuni-resistant chickens, whereas CAPN3, and SLC38A9 were hypo-methylated in the C. jejuni-resistant chickens. These genes are involved in the immune response by inducing M1 macrophages polarization, the over-activation of innate immunity, immune infiltration, and inhibiting the proliferation of various bacteria (72–74). Dysregulation of m6A modification in intestinal epithelial cells could disrupt intestinal immune cell homeostasis (75). Therefore, C. jejuni inoculation may trigger the immune related signaling pathways by altering the methylation levels of candidate genes.
m6A modifications are widely acknowledged as being specifically recognized and bound by m6A reader proteins (76). YTHDC2 as the member of the YT521-B homology (YTH) family of proteins, contains the highly conserved YTH domain and multiple helicase domains that selectively recognizes m6A (77). Numerous studies have demonstrated that YTHDC2 as a crucial regulator was involved in sex differentiation (55), ferroptosis (78), Yersinia ruckeri infection (79), virus invasion (80). In the current study, we found the expression of YTHDC2 was increased in the C. jejuni-susceptible chickens. Further analysis identified several DMGs SUSD5, IFT74, WDR41, EPG5, FOS, and STAB2 enriched in immune related terms including Notch signaling pathway, the regulation of autophagy pathway, defense response to bacteria, and apoptosis pathway. These pathways have been validated as critical modulators of immune responses, coordinating both innate regulator functions and adaptive immune priming through transcriptional and post-translational regulation of cytokine biosynthesis and immune cell determination (81–84). Notch signaling pathway could regulate the LPS induced cellular immune and inflammatory response in chicken macrophages (85). These findings elucidate a complex regulatory mechanism of immune responses in chickens during C. jejuni inoculation. The autophagy-related gene EPG5 mediates intestinal antiviral immunity through microbiota independent mechanisms (86). IFT74 was mainly associated with intraciliary transport involved in cilium assembly (87). STAB2 as a scavenger receptor was mainly associated with defense response to Gram-negative bacterium through inducing the production of anti-inflammatory mediators (88). FOS, a member of the AP-1 transcription factor family, plays a critical role in cell proliferation, differentiation, gene regulation, and tumorigenesis (89). Therefore, we inferred that EPG5, IFT74, STAB2 and SLC38A9 could involve in regulating chicken responding to C. jejuni colonization. YTHDC2 can reduce the translation efficiency of target genes and the mRNA abundance in the meiosis of germline cells (77). Here, we found the knockdown of YTHDC2 could decrease the apoptosis rate of chicken HD11, and increase the expression of IFT74, SUSD5, STAB2, EPG5 and FOS. Taken together, YTHDC2 could regulate the apoptosis and autophagy process of HD11 cells through altering the level of m6A methylated modification and expression of DMGs including IFT74, SUSD5, STAB2, EPG5 and FOS in the response to C. jejuni colonization.
5 Conclusion
In the current study, we found m6A methylation modification could involve in the process of chicken responding to C. jejuni inoculation through regulating gene expression. YTHDC2 could involve in regulating the apoptosis and autophagy process of HD11 cells through altering the expression of DMGs including IFT74, SUSD5, STAB2, EPG5 and FOS, which was confirmed by experiments in vitro. This regulatory role of m6A methylation modification underlying chicken cecum responding to C. jejuni inoculation was firstly characterized. Our results would provide novel insights into understanding the molecular mechanisms underlying chicken in response to C. jejuni inoculation, and offer new insights for improving chicken disease resistance.
Data availability statement
The datasets presented in this study can be found in online repositories. The names of the repository/repositories and accession number(s) can be found in the article/Supplementary Material.
Ethics statement
The animal study was approved by The Ethics Committee on the Care and Use of Laboratory Animals at Shandong Agricultural University (Approval Number: SDAUA-2019-060). The study was conducted in accordance with the local legislation and institutional requirements.
Author contributions
YZ: Formal analysis, Investigation, Methodology, Validation, Writing – original draft, Conceptualization, Visualization. YW: Conceptualization, Formal analysis, Writing – review & editing. LYL: Validation, Supervision, Resources, Writing – review & editing. YR: Formal analysis, Writing – review & editing, Data curation. LL: Methodology, Writing – review & editing, Investigation. JW: Writing – review & editing, Data curation. XL: Conceptualization, Resources, Writing – review & editing, Funding acquisition.
Funding
The author(s) declare that financial support was received for the research and/or publication of this article. This work was supported by Key R&D Program of Shandong Province, China (2022LZGC013, 2023LZGC018, 2024TZXD023), National Key Research and Development Program of China (2022YFD1300102), Shandong Modern Agricultural Industry and Technology System (SDAIT-11-02).
Conflict of interest
The authors declare that the research was conducted in the absence of any commercial or financial relationships that could be construed as a potential conflict of interest.
Generative AI statement
The author(s) declare that no Generative AI was used in the creation of this manuscript.
Publisher’s note
All claims expressed in this article are solely those of the authors and do not necessarily represent those of their affiliated organizations, or those of the publisher, the editors and the reviewers. Any product that may be evaluated in this article, or claim that may be made by its manufacturer, is not guaranteed or endorsed by the publisher.
Supplementary material
The Supplementary Material for this article can be found online at: https://www.frontiersin.org/articles/10.3389/fimmu.2025.1630008/full#supplementary-material
References
1. Tegtmeyer N, Sharafutdinov I, Harrer A, Soltan Esmaeili D, Linz B, and Backert S. Campylobacter virulence factors and molecular host-pathogen interactions. Curr Top Microbiol Immunol. (2021) 431:169–202. doi: 10.1007/978-3-030-65481-8_7
2. Awad WA, Hess C, and Hess M. Re-thinking the chicken-Campylobacter jejuni interaction: a review. Avian Pathol. (2018) 47:352–63. doi: 10.1080/03079457.2018.1475724
3. Lopes GV, Ramires T, Kleinubing NR, Scheik LK, Fiorentini  M, and Padilha da Silva W. Virulence factors of foodborne pathogen Campylobacterjejuni. Microb Pathog. (2021) 161:105265. doi: 10.1016/j.micpath.2021.105265
4. Kaakoush NO, Castaño-Rodríguez N, Mitchell HM, and Man SM. Global epidemiology of campylobacter infection. Clin Microbiol Rev. (2015) 28:687–720. doi: 10.1128/cmr.00006-15
5. Sheppard SK and Maiden MC. The evolution of Campylobacter jejuni and Campylobacter coli. Cold Spring Harb Perspect Biol. (2015) 7:a018119. doi: 10.1101/cshperspect.a018119
6. Dessouky YE, Elsayed SW, Abdelsalam NA, Saif NA, Álvarez-Ordóñez A, and Elhadidy M. Genomic insights into zoonotic transmission and antimicrobial resistance in Campylobacter jejuni from farm to fork: a one health perspective. Gut Pathog. (2022) 14:44. doi: 10.1186/s13099-022-00517-w
7. Al Hakeem WG, Fathima S, Shanmugasundaram R, and Selvaraj RK. Campylobacter jejuni in poultry: pathogenesis and control strategies. Microorganisms. (2022) 10:2134. doi: 10.3390/microorganisms10112134
8. Knudsen KN, Bang DD, Andresen LO, and Madsen M. Campylobacter jejuni strains of human and chicken origin are invasive in chickens after oral challenge. Avian Dis. (2006) 50:10–4. doi: 10.1637/7376-051005r.1
9. Sanyal SC, Islam KM, Neogy PK, Islam M, Speelman P, and Huq MI. Campylobacter jejuni diarrhea model in infant chickens. Infect Immun. (1984) 43:931–6. doi: 10.1128/iai.43.3.931-936.1984
10. Awad WA, Dublecz F, Hess C, Dublecz K, Khayal B, Aschenbach JR, et al. Campylobacter jejuni colonization promotes the translocation of Escherichia coli to extra-intestinal organs and disturbs the short-chain fatty acids profiles in the chicken gut. Poult Sci. (2016) 95:2259–65. doi: 10.3382/ps/pew151
11. Omarova S, Awad K, Moos V, Püning C, Gölz G, Schulzke JD, et al. Intestinal barrier in post-campylobacter jejuni irritable bowel syndrome. Biomolecules. (2023) 13:449. doi: 10.3390/biom13030449
12. Schoeni JL and Doyle MP. Reduction of Campylobacter jejuni colonization of chicks by cecum-colonizing bacteria producing anti-C. jejuni metabolites. Appl Environ Microbiol. (1992) 58:664–70. doi: 10.1128/aem.58.2.664-670.1992
13. Shayya NW, Bandick R, Busmann LV, Mousavi S, Bereswill S, and Heimesaat MM. Metabolomic signatures of intestinal colonization resistance against Campylobacter jejuni in mice. Front Microbiol. (2023) 14:1331114. doi: 10.3389/fmicb.2023.1331114
14. Wagle BR, Donoghue AM, Shrestha S, Upadhyaya I, Arsi K, Gupta A, et al. Carvacrol attenuates Campylobacter jejuni colonization factors and proteome critical for persistence in the chicken gut. Poult Sci. (2020) 99:4566–77. doi: 10.1016/j.psj.2020.06.020
15. Pielsticker C, Glünder G, and Rautenschlein S. Colonization properties of Campylobacter jejuni in chickens. Eur J Microbiol Immunol (Bp). (2012) 2:61–5. doi: 10.1556/EuJMI.2.2012.1.9
16. Shaughnessy RG, Meade KG, Cahalane S, Allan B, Reiman C, Callanan JJ, et al. Innate immune gene expression differentiates the early avian intestinal response between Salmonella and Campylobacter. Vet Immunol Immunopathol. (2009) 132:191–8. doi: 10.1016/j.vetimm.2009.06.007
17. Psifidi A, Fife M, Howell J, Matika O, van Diemen PM, Kuo R, et al. The genomic architecture of resistance to Campylobacter jejuni intestinal colonisation in chickens. BMC Genomics. (2016) 17:293. doi: 10.1186/s12864-016-2612-7
18. Zhang J, Goto RM, Psifidi A, Stevens MP, Taylor RL, and Miller MM. Research Note: MHCY haplotype impacts Campylobacter jejuni colonization in a backcross [(Line 61 x Line N) x Line N] population. Poult Sci. (2022) 101:101654. doi: 10.1016/j.psj.2021.101654
19. Connell S, Meade KG, Allan B, Lloyd AT, Downing T, O’Farrelly C, et al. Genome-wide association analysis of avian resistance to Campylobacter jejuni colonization identifies risk locus spanning the CDH13 gene. G3 (Bethesda). (2013) 3:881–90. doi: 10.1534/g3.113.006031
20. Swaggerty CL, Pevzner IY, He H, Genovese KJ, and Kogut MH. Selection for pro-inflammatory mediators produces chickens more resistant to Campylobacter jejuni. Poult Sci. (2017) 96:1623–7. doi: 10.3382/ps/pew465
21. Ren F, Li X, Tang H, Jiang Q, Yun X, Fang L, et al. Insights into the impact of flhF inactivation on Campylobacter jejuni colonization of chick and mice gut. BMC Microbiol. (2018) 18:149. doi: 10.1186/s12866-018-1318-1
22. Li P, Cui Y, Guo F, Guo J, Cao X, Lin J, et al. Campylobacter jejuni infection induces dynamic expression of avian host defense peptides in vitro and in vivo. Vet Microbiol. (2023) 277:109631. doi: 10.1016/j.vetmic.2022.109631
23. Liu X, Liu L, Zhang M, Wang H, Yang N, and Li X. Chicken cecal microRNAs in the response to Campylobacter jejuni inoculation by Solexa sequencing. Poult Sci. (2016) 95:2819–23. doi: 10.3382/ps/pew190
24. Wang H, Liu L, Liu X, Zhang M, and Li X. Correlation between miRNAs and target genes in response to Campylobacter jejuni inoculation in chicken. Poult Sci. (2018) 97:485–93. doi: 10.3382/ps/pex343
25. Zhao Y, Wang Y, Ren Y, Liu L, Wang T, Liu L, et al. Direct RNA sequencing reveals chicken post-transcriptional modifications in response to Campylobacter jejuni inoculation. BMC Genomics. (2025) 26:374. doi: 10.1186/s12864-025-11564-3
26. Mao Y, Dong L, Liu XM, Guo J, Ma H, Shen B, et al. m6A in mRNA coding regions promotes translation via the RNA helicase-containing YTHDC2. Nat Commun. (2019) 10:5332. doi: 10.1038/s41467-019-13317-9
27. Fan Y, Zhang C, and Zhu G. Profiling of RNA N6-methyladenosine methylation during follicle selection in chicken ovary. Poult Sci. (2019) 98:6117–24. doi: 10.3382/ps/pez277
28. Chen B, Liu S, Zhang W, Xiong T, Zhou M, Hu X, et al. Profiling Analysis of N6-Methyladenosine mRNA Methylation Reveals Differential m6A Patterns during the Embryonic Skeletal Muscle Development of Ducks. Anim (Basel). (2022) 12:2953. doi: 10.3390/ani12192593
29. Xu T, Xu Z, Lu L, Zeng T, Gu L, Huang Y, et al. Transcriptome-wide study revealed m6A regulation of embryonic muscle development in Dingan goose (Anser cygnoides orientalis). BMC Genomics. (2021) 22:270. doi: 10.1186/s12864-021-07556-8
30. Wu L, Quan W, Zhang Y, Wang M, Ou X, Mao S, et al. Attenuated Duck Hepatitis A Virus Infection Is Associated With High mRNA Maintenance in Duckling Liver via m6A Modification. Front Immunol. (2022) 13:839677. doi: 10.3389/fimmu.2022.839677
31. Zhao Q, Yao Z, Chen L, He Y, Xie Z, Zhang H, et al. Transcriptome-wide dynamics of m(6)A methylation in tumor livers induced by ALV-J infection in chickens. Front Immunol. (2022) 13:868892. doi: 10.3389/fimmu.2022.868892
32. Hu Y, Feng Y, Zhang L, Jia Y, Cai D, Qian SB, et al. GR-mediated FTO transactivation induces lipid accumulation in hepatocytes via demethylation of m(6)A on lipogenic mRNAs. RNA Biol. (2020) 17:930–42. doi: 10.1080/15476286.2020.1736868
33. Zhou Z, Zhang A, Liu X, Yang Y, Zhao R, and Jia Y. m(6)A-mediated PPARA translational suppression contributes to corticosterone-induced visceral fat deposition in chickens. Int J Mol Sci. (2022) 23:15761. doi: 10.3390/ijms232415761
34. Wu J, Frazier K, Zhang J, Gan Z, Wang T, and Zhong X. Emerging role of m(6) A RNA methylation in nutritional physiology and metabolism. Obes Rev. (2020) 21:e12942. doi: 10.1111/obr.12942
35. Yang C, Hu Y, Zhou B, Bao Y, Li Z, Gong C, et al. The role of m(6)A modification in physiology and disease. Cell Death Dis. (2020) 11:960. doi: 10.1038/s41419-020-03143-z
36. Qiao Y, Xiao G, Zhu X, Wen J, Bu Y, Zhang X, et al. Resveratrol Enhances Antioxidant and Anti-Apoptotic Capacities in Chicken Primordial Germ Cells through m6A Methylation: A Preliminary Investigation. Anim (Basel). (2024) 14:2214. doi: 10.3390/ani14152214
37. Shi H, Wei J, and He C. Where, when, and how: context-dependent functions of RNA methylation writers, readers, and erasers. Mol Cell. (2019) 74:640–50. doi: 10.1016/j.molcel.2019.04.025
38. Shu B, Zhou YX, Li H, Zhang RZ, He C, and Yang X. The METTL3/MALAT1/PTBP1/USP8/TAK1 axis promotes pyroptosis and M1 polarization of macrophages and contributes to liver fibrosis. Cell Death Discov. (2021) 7:368. doi: 10.1038/s41420-021-00756-x
39. Zhu J, Liu S, Fang J, Cui Z, Wang B, Wang Y, et al. Enzymolysis-based RNA pull-down identifies YTHDC2 as an inhibitor of antiviral innate response. Cell Rep. (2023) 42:113192. doi: 10.1016/j.celrep.2023.113192
40. Li W, Zhou J, Gu Y, Chen Y, Huang Y, Yang J, et al. Lactylation of RNA m6A demethylase ALKBH5 promotes innate immune response to DNA herpesviruses and mpox virus. Proc Natl Acad Sci U S A. (2024) 121:e2409132121. doi: 10.1073/pnas.2409132121
41. Chen S, Zhou Y, Chen Y, and Gu J. fastp: an ultra-fast all-in-one FASTQ preprocessor. Bioinformatics. (2018) 34:i884–90. doi: 10.1093/bioinformatics/bty560
42. Kim D, Paggi JM, Park C, Bennett C, and Salzberg SL. Graph-based genome alignment and genotyping with HISAT2 and HISAT-genotype. Nat Biotechnol. (2019) 37:907–15. doi: 10.1038/s41587-019-0201-4
43. Meng J, Lu Z, Liu H, Zhang L, Zhang S, Chen Y, et al. A protocol for RNA methylation differential analysis with MeRIP-Seq data and exomePeak R/Bioconductor package. Methods. (2014) 69:274–81. doi: 10.1016/j.ymeth.2014.06.008
44. Wang K, Li M, and Hakonarson H. ANNOVAR: functional annotation of genetic variants from high-throughput sequencing data. Nucleic Acids Res. (2010) 38:e164. doi: 10.1093/nar/gkq603
45. Heinz S, Benner C, Spann N, Bertolino E, Lin YC, Laslo P, et al. Simple combinations of lineage-determining transcription factors prime cis-regulatory elements required for macrophage and B cell identities. Mol Cell. (2010) 38:576–89. doi: 10.1016/j.molcel.2010.05.004
46. Lee TH, Kim YK, and Nahm BH. GBParsy: a GenBank flatfile parser library with high speed. BMC Bioinf. (2008) 9:321. doi: 10.1186/1471-2105-9-321
47. Pertea M, Pertea GM, Antonescu CM, Chang TC, Mendell JT, and Salzberg SL. StringTie enables improved reconstruction of a transcriptome from RNA-seq reads. Nat Biotechnol. (2015) 33:290–5. doi: 10.1038/nbt.3122
48. Love MI, Huber W, and Anders S. Moderated estimation of fold change and dispersion for RNA-seq data with DESeq2. Genome Biol. (2014) 15:550. doi: 10.1186/s13059-014-0550-8
49. Pokhrel D, Thames HT, Zhang L, Dinh T, Schilling MW, White S, et al. Aerotolerance and multi-locus sequence typing of campylobacter jejuni isolated from commercial broiler processing plants. Foods. (2023) 12:3305. doi: 10.3390/foods12173305
50. Szczepańska B, Kamiński P, Andrzejewska M, Śpica D, Kartanas E, Ulrich W, et al. Prevalence, virulence, and antimicrobial resistance of Campylobacter jejuni and Campylobacter coli in white stork Ciconia ciconia in Poland. Foodborne Pathog Dis. (2015) 12:24–31. doi: 10.1089/fpd.2014.1793
51. Li X, Swaggerty CL, Kogut MH, Chiang HI, Wang Y, Genovese KJ, et al. Systemic response to Campylobacter jejuni infection by profiling gene transcription in the spleens of two genetic lines of chickens. Immunogenetics. (2012) 64:59–69. doi: 10.1007/s00251-011-0557-1
52. Ruddell B, Hassall A, Sahin O, Plummer PJ, Zhang Q, and Kreuder AJ. Small RNA CjNC110 regulates the activated methyl cycle to enable optimal chicken colonization by Campylobacter jejuni. mSphere. (2025) 10:e0083224. doi: 10.1128/msphere.00832-24
53. Russell KM, Smith J, Bremner A, Chintoan-Uta C, Vervelde L, Psifidi A, et al. Transcriptomic analysis of caecal tissue in inbred chicken lines that exhibit heritable differences in resistance to Campylobacter jejuni. BMC Genomics. (2021) 22:411. doi: 10.1186/s12864-021-07748-2
54. Shank JM, Kelley BR, Jackson JW, Tweedie JL, Franklin D, Damo SM, et al. The Host Antimicrobial Protein Calgranulin C Participates in the Control of Campylobacter jejuni Growth via Zinc Sequestration. Infect Immun. (2018) 86:e00234-18. doi: 10.1128/iai.00234-18
55. Li J, Zhang X, Wang X, Sun C, Zheng J, Li J, et al. The m6A methylation regulates gonadal sex differentiation in chicken embryo. J Anim Sci Biotechnol. (2022) 13:52. doi: 10.1186/s40104-022-00710-6
56. Wang Z, Ju X, Li K, Cai D, Zhou Z, and Nie Q. MeRIP sequencing reveals the regulation of N6-methyladenosine in muscle development between hypertrophic and leaner broilers. Poult Sci. (2024) 103:103708. doi: 10.1016/j.psj.2024.103708
57. Yu B, Liu J, Cai Z, Wang H, Feng X, Zhang T, et al. RNA N(6)-methyladenosine profiling reveals differentially methylated genes associated with intramuscular fat metabolism during breast muscle development in chicken. Poult Sci. (2023) 102:102793. doi: 10.1016/j.psj.2023.102793
58. Zhao Y, Jiang Y, Feng Y, and Zhao R. RNA m(6)A-mediated post-transcriptional repression of glucocorticoid receptor in LPS-activated Kupffer cells on broilers. Poult Sci. (2025) 104:104393. doi: 10.1016/j.psj.2024.104393
59. Luo G, Wang S, Ai Y, Li J, and Ren Z. N6-methyladenosine methylome profiling of muscle and adipose tissues reveals methylase-mRNA metabolic regulatory networks in fat deposition of rex rabbits. Biol (Basel). (2022) 11:944. doi: 10.3390/biology11070944
60. Ma X, La Y, Bao P, Chu M, Guo X, Wu X, et al. Regulatory role of N6-methyladenosine in longissimus dorsi development in yak. Front Vet Sci. (2022) 9:757115. doi: 10.3389/fvets.2022.757115
61. Meyer KD, Saletore Y, Zumbo P, Elemento O, Mason CE, and Jaffrey SR. Comprehensive analysis of mRNA methylation reveals enrichment in 3’ UTRs and near stop codons. Cell. (2012) 149:1635–46. doi: 10.1016/j.cell.2012.05.003
62. Wang X, Lu Z, Gomez A, Hon GC, Yue Y, Han D, et al. N6-methyladenosine-dependent regulation of messenger RNA stability. Nature. (2014) 505:117–20. doi: 10.1038/nature12730
63. Zhao BS, Roundtree IA, and He C. Post-transcriptional gene regulation by mRNA modifications. Nat Rev Mol Cell Biol. (2017) 18:31–42. doi: 10.1038/nrm.2016.132
64. Liu L, Wang J, Sun G, Wu Q, Ma J, Zhang X, et al. m(6)A mRNA methylation regulates CTNNB1 to promote the proliferation of hepatoblastoma. Mol Cancer. (2019) 18:188. doi: 10.1186/s12943-019-1119-7
65. Wang YN and Jin HZ. Transcriptome-wide m(6)A methylation in skin lesions from patients with psoriasis vulgaris. Front Cell Dev Biol. (2020) 8:591629. doi: 10.3389/fcell.2020.591629
66. Yue B, Song C, Yang L, Cui R, Cheng X, Zhang Z, et al. METTL3-mediated N6-methyladenosine modification is critical for epithelial-mesenchymal transition and metastasis of gastric cancer. Mol Cancer. (2019) 18:142. doi: 10.1186/s12943-019-1065-4
67. Lin C, Zeng M, Song J, Li H, Feng Z, Li K, et al. PRRSV alters m(6)A methylation and alternative splicing to regulate immune, extracellular matrix-associated function. Int J Biol Macromol. (2023) 253:126741. doi: 10.1016/j.ijbiomac.2023.126741
68. Luo S, Liao C, Zhang L, Ling C, Zhang X, Xie P, et al. METTL3-mediated m6A mRNA methylation regulates neutrophil activation through targeting TLR4 signaling. Cell Rep. (2023) 42:112259. doi: 10.1016/j.celrep.2023.112259
69. Gurung P, Fan G, Lukens JR, Vogel P, Tonks NK, and Kanneganti TD. Tyrosine kinase SYK licenses myD88 adaptor protein to instigate IL-1α-mediated inflammatory disease. Immunity. (2017) 46:635–48. doi: 10.1016/j.immuni.2017.03.014
70. Li Q, Wang F, Wang Q, Zhang N, Zheng J, Zheng M, et al. SPOP promotes ubiquitination and degradation of MyD88 to suppress the innate immune response. PloS Pathog. (2020) 16:e1008188. doi: 10.1371/journal.ppat.1008188
71. Zhang S, Pruitt M, Tran D, Du Bois W, Zhang K, Patel R, et al. B cell-specific deficiencies in mTOR limit humoral immune responses. J Immunol. (2013) 191:1692–703. doi: 10.4049/jimmunol.1201767
72. Chen Y, Huang D, Xie A, Shan Y, Zhao S, Gao C, et al. Capn3b-deficient zebrafish model reveals a key role of autoimmune response in LGMDR1. J Genet Genomics. (2024) 51:1375–88. doi: 10.1016/j.jgg.2024.09.011
73. Garcia-Carpio I, Braun VZ, Weiler ES, Leone M, Niñerola S, Barco A, et al. Extra centrosomes induce PIDD1-mediated inflammation and immunosurveillance. EMBO J. (2023) 42:e113510. doi: 10.15252/embj.2023113510
74. Wang J, Shi M, Zhang H, Zhou H, Huang Z, Zhou Y, et al. PRKCB is relevant to prognosis of lung adenocarcinoma through methylation and immune infiltration. Thorac Cancer. (2022) 13:1837–49. doi: 10.1111/1759-7714.14466
75. Ma Y, Zhang X, Xuan B, Li D, Yin N, Ning L, et al. Disruption of CerS6-mediated sphingolipid metabolism by FTO deficiency aggravates ulcerative colitis. Gut. (2024) 73:268–81. doi: 10.1136/gutjnl-2023-330009
76. Xiao W, Adhikari S, Dahal U, Chen YS, Hao YJ, Sun BF, et al. Nuclear m(6)A Reader YTHDC1 Regulates mRNA Splicing. Mol Cell. (2016) 61:507–19. doi: 10.1016/j.molcel.2016.01.012
77. Hsu PJ, Zhu Y, Ma H, Guo Y, Shi X, Liu Y, et al. Ythdc2 is an N(6)-methyladenosine binding protein that regulates mammalian spermatogenesis. Cell Res. (2017) 27:1115–27. doi: 10.1038/cr.2017.99
78. Li Y, Guo M, Qiu Y, Li M, Wu Y, Shen M, et al. Autophagy activation is required for N6-methyladenosine modification to regulate ferroptosis in hepatocellular carcinoma. Redox Biol. (2024) 69:102971. doi: 10.1016/j.redox.2023.102971
79. Yu H, Gao Q, Wang W, Liu D, He J, and Tian Y. Comprehensive Analysis of YTH Domain-Containing Genes, Encoding m(6)A Reader and Their Response to Temperature Stresses and Yersinia ruckeri Infection in Rainbow Trout (Oncorhynchus mykiss). Int J Mol Sci. (2023) 24:9348. doi: 10.3390/ijms24119348
80. Macveigh-Fierro D, Cicerchia A, Cadorette A, Sharma V, and Muller M. The m(6)A reader YTHDC2 is essential for escape from KSHV SOX-induced RNA decay. Proc Natl Acad Sci U S A. (2022) 119:e2116662119. doi: 10.1073/pnas.2116662119
81. Qin C, Lu Y, Bai L, and Wang K. The molecular regulation of autophagy in antimicrobial immunity. J Mol Cell Biol. (2022) 14:mjac015. doi: 10.1093/jmcb/mjac015
82. Sun H, Bi R, Liu P, Nolan LK, and Lamont SJ. Combined analysis of primary lymphoid tissues’ transcriptomic response to extra-intestinal Escherichia coli (ExPEC) infection. Dev Comp Immunol. (2016) 57:99–106. doi: 10.1016/j.dci.2015.12.013
83. Sun H, Yang Y, Cao Y, Li H, Qu L, and Lamont SJ. Gene expression profiling of RIP2-knockdown in HD11 macrophages - elucidation of potential pathways (gene network) when challenged with avian pathogenic E.coli (APEC). BMC Genomics. (2022) 23:341. doi: 10.1186/s12864-022-08595-5
84. Zhang B, Hong L, Ke J, Zhong Y, Cao N, Li W, et al. Polysaccharide of Atractylodes macrocephala Koidz alleviate lipopolysaccharide-induced liver injury in goslings via the p53 and FOXO pathways. Poult Sci. (2023) 102:102480. doi: 10.1016/j.psj.2023.102480
85. Tan J, Lu Y, Li H, Sun H, Han W, and Zhang J. Functional analysis of circSTX8 in chicken macrophages under lipopolysaccharide stimulation. Res Vet Sci. (2023) 165:105053. doi: 10.1016/j.rvsc.2023.105053
86. Lee S, Kalugotla G, Ingle H, Rodgers R, Wu C, Wang Y, et al. Intestinal antiviral signaling is controlled by autophagy gene Epg5 independent of the microbiota. Autophagy. (2022) 18:1062–77. doi: 10.1080/15548627.2021.1968607
87. Bakey Z, Cabrera OA, Hoefele J, Antony D, Wu K, Stuck MW, et al. IFT74 variants cause skeletal ciliopathy and motile cilia defects in mice and humans. PloS Genet. (2023) 19:e1010796. doi: 10.1371/journal.pgen.1010796
88. Penberthy KK and Ravichandran KS. Apoptotic cell recognition receptors and scavenger receptors. Immunol Rev. (2016) 269:44–59. doi: 10.1111/imr.12376
Keywords: Campylobacter jejuni, chicken, m6A, MeRIP-seq, RNA-seq
Citation: Zhao Y, Wang Y, Liu L, Ren Y, Liu L, Wang J and Li X (2025) Transcriptome-wide N6-methyladenosinem modifications analysis of chicken cecum in responding to Campylobacter jejuni inoculation. Front. Immunol. 16:1630008. doi: 10.3389/fimmu.2025.1630008
Received: 19 May 2025; Accepted: 14 July 2025;
Published: 30 July 2025.
Edited by:
Li-Shang Dai, Wenzhou Medical University, ChinaReviewed by:
Hailiang Yu, Yangzhou University, ChinaDefu Tang, Gansu Agricultural University, China
Jinjun Xu, Yangzhou University, China
Copyright © 2025 Zhao, Wang, Liu, Ren, Liu, Wang and Li. This is an open-access article distributed under the terms of the Creative Commons Attribution License (CC BY). The use, distribution or reproduction in other forums is permitted, provided the original author(s) and the copyright owner(s) are credited and that the original publication in this journal is cited, in accordance with accepted academic practice. No use, distribution or reproduction is permitted which does not comply with these terms.
*Correspondence: Xianyao Li, eHlsaUBzZGF1LmVkdS5jbg==
†These authors have contributed equally to this work and share first authorship