 Yunxin Xu
 Yue Xing†
 Zhongze Du
 Hongjiang Song
- Department of Gastrointestinal Surgery, Harbin Medical University Cancer Hospital, Harbin Medical University, Harbin, Heilongjiang, China
Background: The purpose of this study is to investigate the combination of skeletal muscle index (SMI) and immunoglobulin M (IgM) to form the SMI-IgM score to predict the prognosis of patients who underwent surgery for gastric cancer.
Patients and methods: In this study, 190 patients operated for gastric cancer from July 2016 to December 2017 were collected. According to the optimal critical values of skeletal muscle index and immunoglobulin M, all patients were divided into three groups. We used Kaplan-Meier survival curves and log-rank test to assess the differences in progression-free survival time (PFS) and overall survival time (OS) between the 3 groups of patients. Independent predictors were identified using Cox regression, and nomogram plots were produced to predict confounded 1-, 3-, and 5-year survival rates based on independent predictors.
Results: There were 68 patients (35.8%) in the SMI-IgM 1 group, 85 patients (44.7%) in the SMI-IgM 2 group, and 37 patients (19.5%) in the SMI-IgM 3 group. Patients in the SMI-IgM 1 group had worse PFS (HR = 0.345, 95% CI: 0.226-0.525, p < 0.001) and OS (HR = 0.345, 95% CI: 0.227-0.525, p < 0.001). The multifactorial analysis showed that SMI-IgM score was an independent predictor of PFS and OS in patients. The calibration curves show better predictive efficacy of the column charts in years 3 and 5.
Conclusion: The SMI-IgM score could well respond to the nutritional and immune status of the body, and could be used as a new predictor for patients undergoing surgery for gastric cancer.
Introduction
According to the statistical data of World Health Organisation, gastric cancer is the fifth most common cancer in the world and the fourth leading cause of cancer deaths (1). Radical gastrectomy is still the mainstay of treatment for gastric cancer at present (2). However, many gastric cancer patients still have recurrence and distant metastases after undergoing surgery (3, 4). Therefore, a new biomarker is urgently needed to accurately predict the prognosis of gastric cancer patients.
Cachexia is an internationally recognized independent prognostic factor affecting patients with cancer. Some studies have shown that 50%-80% of cancer patients suffer from cachexia and it contributes to the deaths of 20%-40% of cancer patients (5–7). Some researchers have defined cancer cachexia as a loss of more than 2% of body weight in patients with malignant tumors and associated sarcopenia (8). In 2016, sarcopenia was recognized as a separate disease (9). Sarcopenia is a skeletal muscle disease characterized by progressive loss of muscle mass and function, manifested by low muscle strength and reduced muscle quantity or quality (10, 11). It also has a high prevalence among cancer patients (12). Numerous studies have shown that sarcopenia is one of the predictors of poor prognosis for surgical complications and overall survival in patients with various solid tumors (13–15). Skeletal muscle index (SMI) is an important parameter for measuring body composition, and it is obtained by quantifying skeletal muscle on computed tomography (CT) scans based on patient height (16, 17). Low SMI is an important manifestation of sarcopenia (18). In addition, the inflammatory state of the body can affect the prognosis of tumor patients. Some studies have shown that lymphocytes (L) and C-reactive protein (CRP) are associated with lower survival rates in gastric cancer (19). Immunoglobulin M (IgM) acts primarily as an early immune response following antigenic stimulation and it is associated with recurrence and metastasis of many tumors, including gastric cancer (20–22). Overall, patients with sarcopenia and those in an inflammatory state have a poor prognosis.
Numerous studies have shown that skeletal muscle index can predict poor prognosis in gastric cancer (23–25). However, no article has reported that the SMI-IgM score, a combined indicator of SMI and IgM, predicts effectiveness in patients underwent surgery for gastric cancer. In this study, we aimed to evaluate the predictive efficacy of the SMI-IgM score in gastric cancer patients who underwent surgery.
Materials and methods
Patients
We continuously collected 190 gastric cancer patients who underwent surgical treatment at Harbin Medical University Cancer Hospital from July 2016 to December 2017. Due to the retrospective nature of this study, the Ethics Committee of Harbin Medical University Cancer Hospital waived the requirement for informed consent (Ethics Number: 2019-57-IIT). We conducted statistical analysis on clinical information, laboratory tests, and pathological data of 190 patients based on the Helsinki Declaration and its amendments. The inclusion criteria are: (1) All patients are gastric cancer patients who have undergone surgical treatment; (2) All patients underwent specific protein testing; (3) All patients underwent abdominal computed tomography (CT) scans at the Cancer Hospital of Harbin Medical University. The exclusion criteria are: (1) Patients with chronic diseases; (2) The patient’s body is in an acute inflammatory state; (3) Patients with gastric cancer combined with other primary malignant tumors; (4) The patient has no complete clinical data.
Data collection
Patients were followed up through telephone or outpatient services, with a follow-up every 3–6 months for the first two years, every 6–12 months for the third to fifth years, and annually thereafter. Progression free survival (PFS) is defined as the time period from the first day of surgery to the date of disease progression, withdrawal from follow-up, or last follow-up. The evidence of progress is mainly obtained through chest and abdominal X-rays or CT scans. The overall survival (OS) is defined as the time interval from the date of surgery to the date of death, the date of withdrawal from follow-up, or the last follow-up. We use the hospital electronic medical record system to obtain clinical and pathological information of patients.
The assessment of SMI and patients group
All abdominal CT images were analyzed using 3D Slicer (version 4.10.2, www.slicer.org) by radiologists from Harbin Medical University Cancer Hospital. All physicians have worked in the radiology department for more than 10 years. We measure the skeletal muscle area (cm2) at the level of the third lumbar vertebra (L3), subcutaneous fat area (SAT), and visceral fat area (VAT). The Hounsfield unit threshold for skeletal muscle is set to -29 to 150, and the Hounsfield unit threshold for fat is set to -190 to -30. The definition of SMI for L3 is: skeletal muscle area (cm2)/Height square (m2). The level of peripheral specific proteins were measured and analyzed using a specific protein analyzer (IMMAGE800). Specific proteins include immunoglobulin A (IgA), immunoglobulin G (IgG), IgM, light chain immunoglobulin (KAP), heavy chain immunoglobulin (LAM), and KAP/LAM.
The optimal cutoff values for SMI and IgM are obtained using the maximum Youden index calculated from the receiver operating characteristic (ROC) curve. The optimal cut-off values of SMI and IgM with the highest Youden index were obtained. The optimal cut-off value of IgM was 0.93 g/L (Figure 1B). The optimal cut-off value for SMI is 39.26 cm²/m² (Figure 1E) for males and 31.41 cm²/m² (Figure 1F) for females. According to the optimal cut-off values of SMI and IgM, all patients were divided into three groups: SMI-IgM score 3 (n = 68): high IgM (≥ 0.93 g/L) and high SMI (men ≥ 39.26 cm²/m², women ≥ 31.41 cm²/m²); SMI-IgM score 2 (n = 85): high IgM (≥ 0.93 g/L) and low SMI (men < 39.26 cm²/m², women < 31.41 cm²/m²), or low IgM (< 0.93 g/L) and high SMI (men ≥ 39.26 cm²/m², women ≥ 31.41 cm²/m²); SMI-IgM score 1(n = 37): low IgM (< 0.93 g/L) and low SMI (men < 39.26 cm²/m², women < 31.41 cm²/m²).
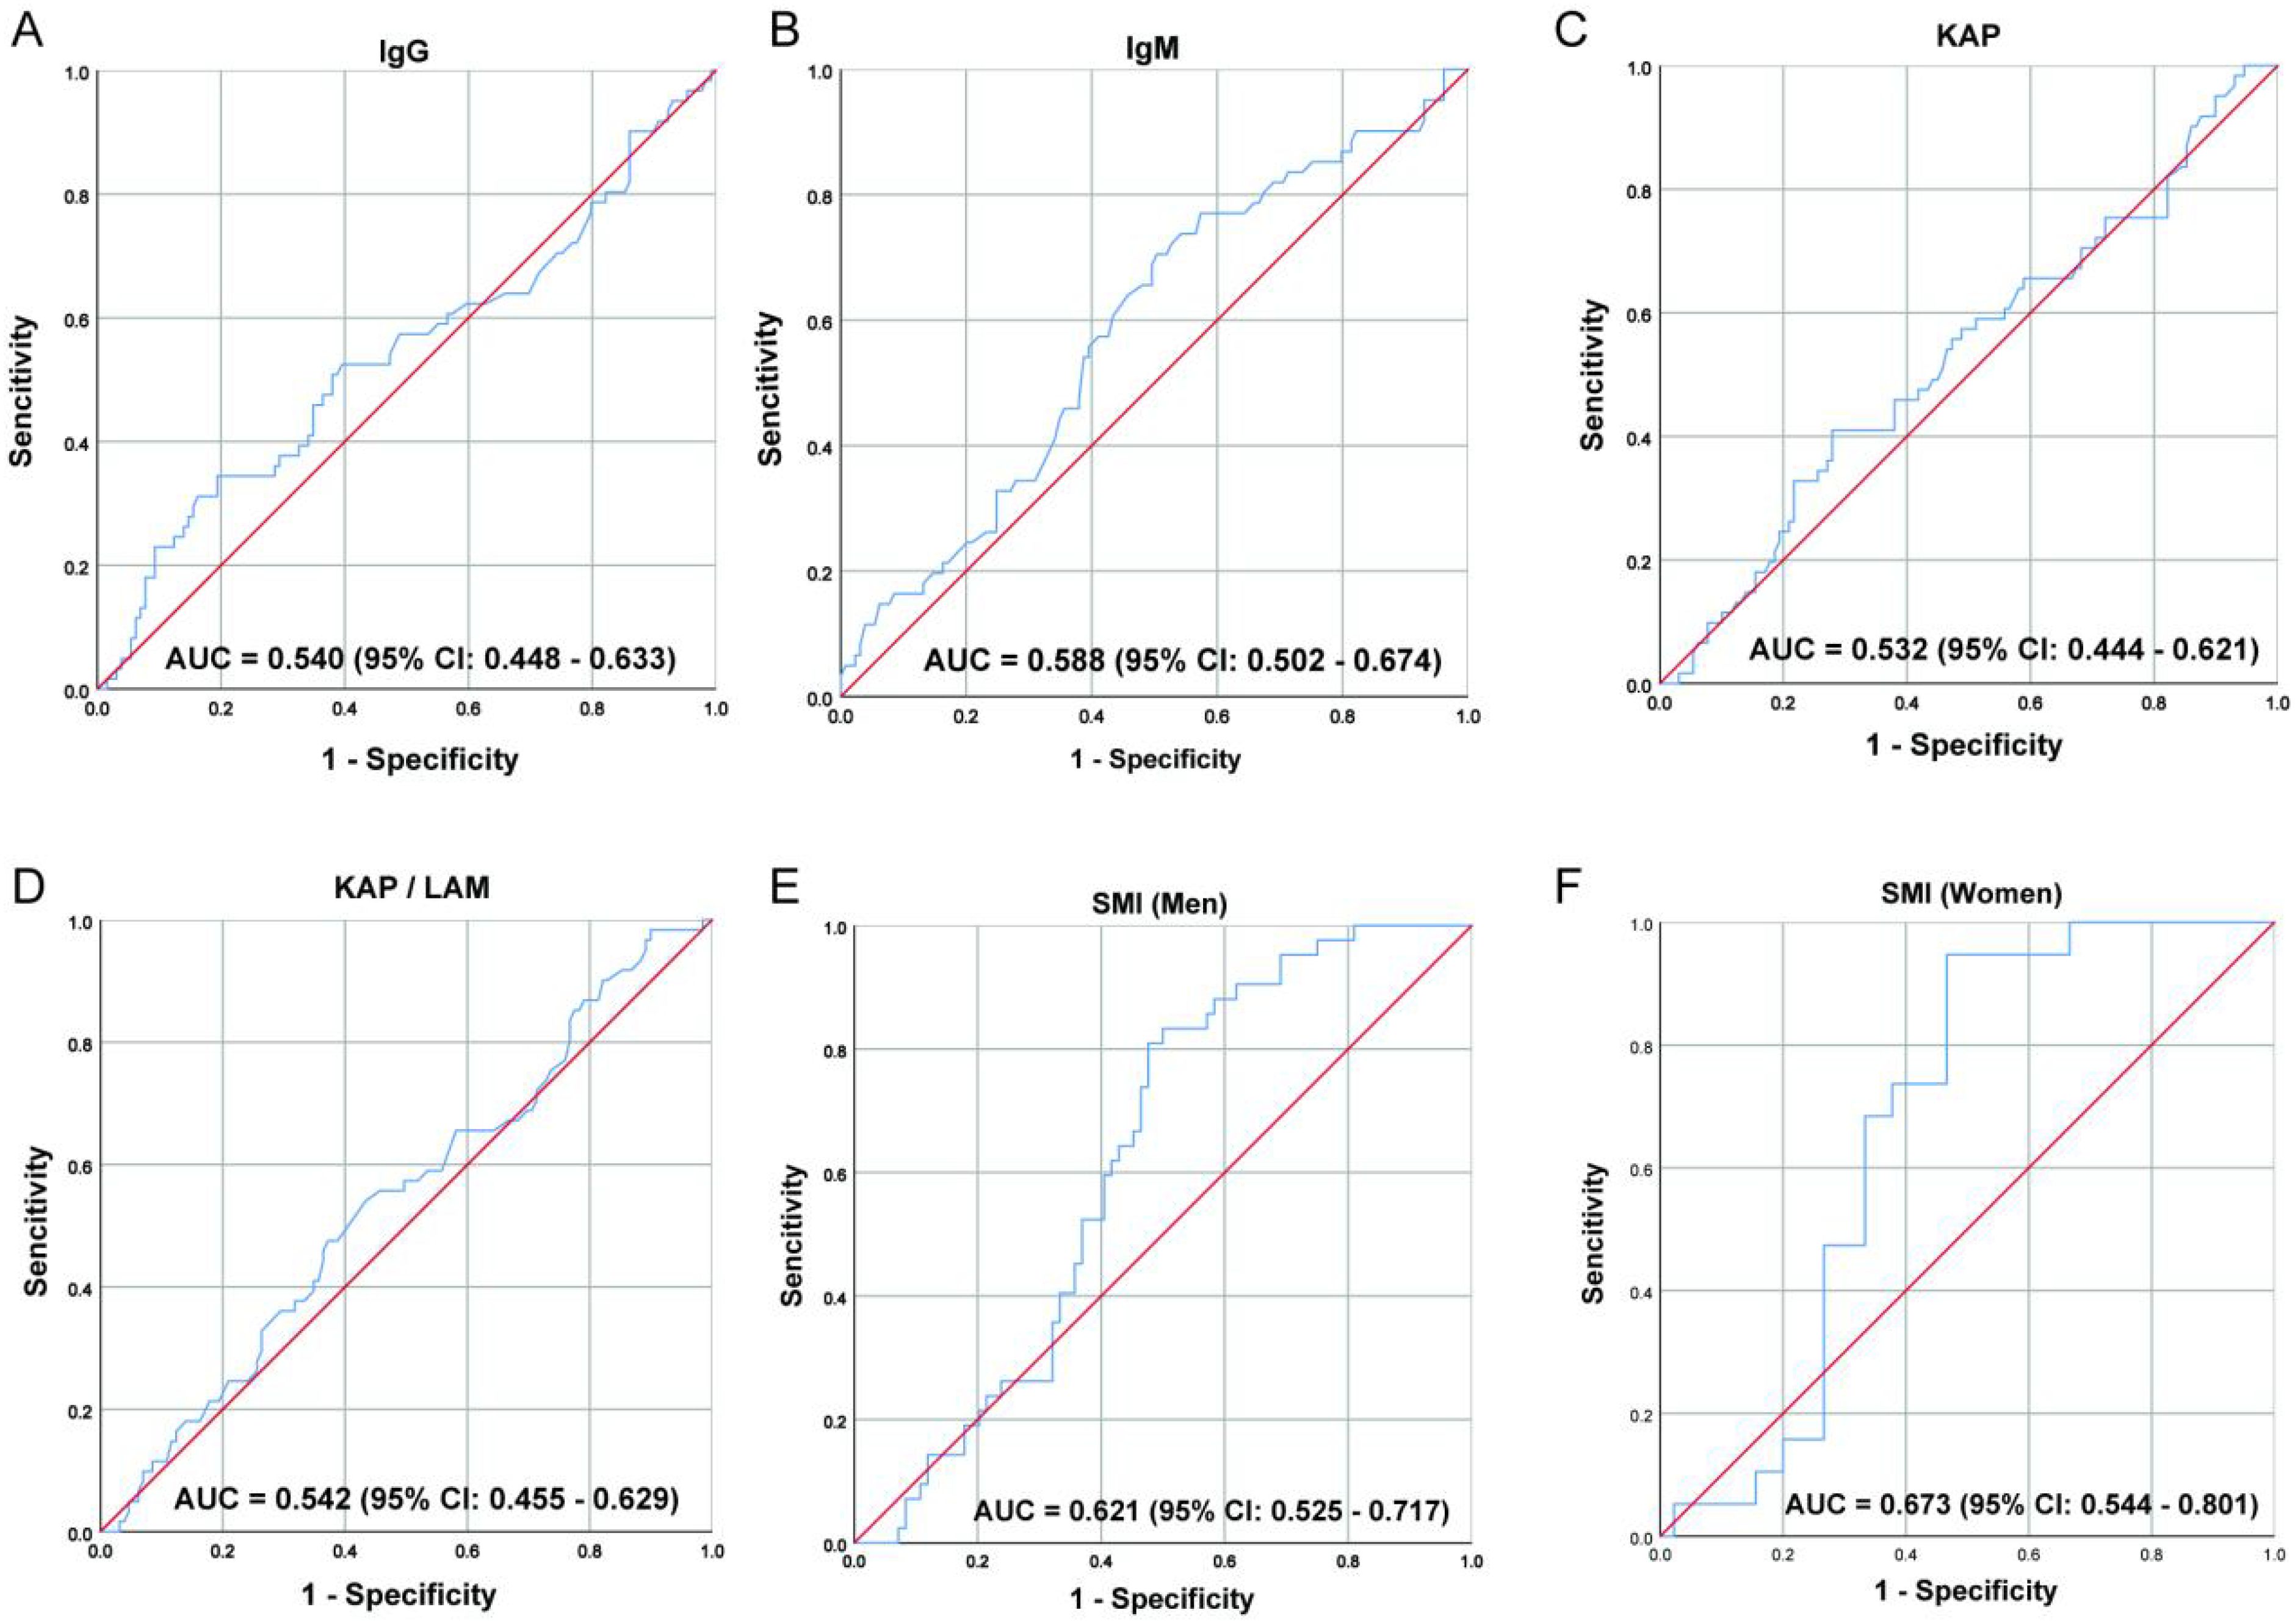
Figure 1. The ROC curve of (A) IgG, (B) IgM, (C) KAP, (D) KAP/LAM, (E) SMI (Men), and (F) SMI (Women).
Statistical analysis
We use mean with standard deviation (SD) or median with interquartile range (IQR) to represent continuous variables. Use percentages to represent categorical variables. We compared the differences between continuous variables using one-way ANOVA and Kruskal-Wallis rank-sum test. The differences between categorical variables are compared using chi square test or Fisher’s exact test. We used Kaplan-Meier survival curve and log-rank test to calculate the difference in survival rate and survival time. Univariate and multivariate analyses were conducted using the Cox proportional risk model. Variables with p < 0.05 in univariate analysis were input into multivariate Cox regression analysis. We further evaluated potential multicollinearity by calculating variance inflation factors (VIFs). We evaluate relative risk through hazard ratio (HR) and 95% confidence interval (CI). We constructed a nomogram to predict the 1-year, 3-year, and 5-year survival probabilities of PFS and OS. Calibration curve analysis is used to evaluate the prognostic predictive ability of nomograms. Finally, there is a statistically significant difference in p values < 0.05 between the two sides.
Results
Patient characteristics
This study continuously enrolled 190 patients, with a median age of 60 years old, consisting of 126 males (66.3%) and 64 females (33.7%). We found through chi square test or Fisher’s exact test that the SMI-IgM score was associated with Melena (p = 0.042), weight loss (p = 0.026), tumor size (p = 0.001), and pTNM staging (p = 0.003). The one-way ANOVA and Kruskal-Wails rank sum test showed that SMI-IgM score was related to age, body mass index (BMI), and SAT (all p < 0.05). Table 1 shows the clinical characteristics of patients grouped by SMI-IgM score.
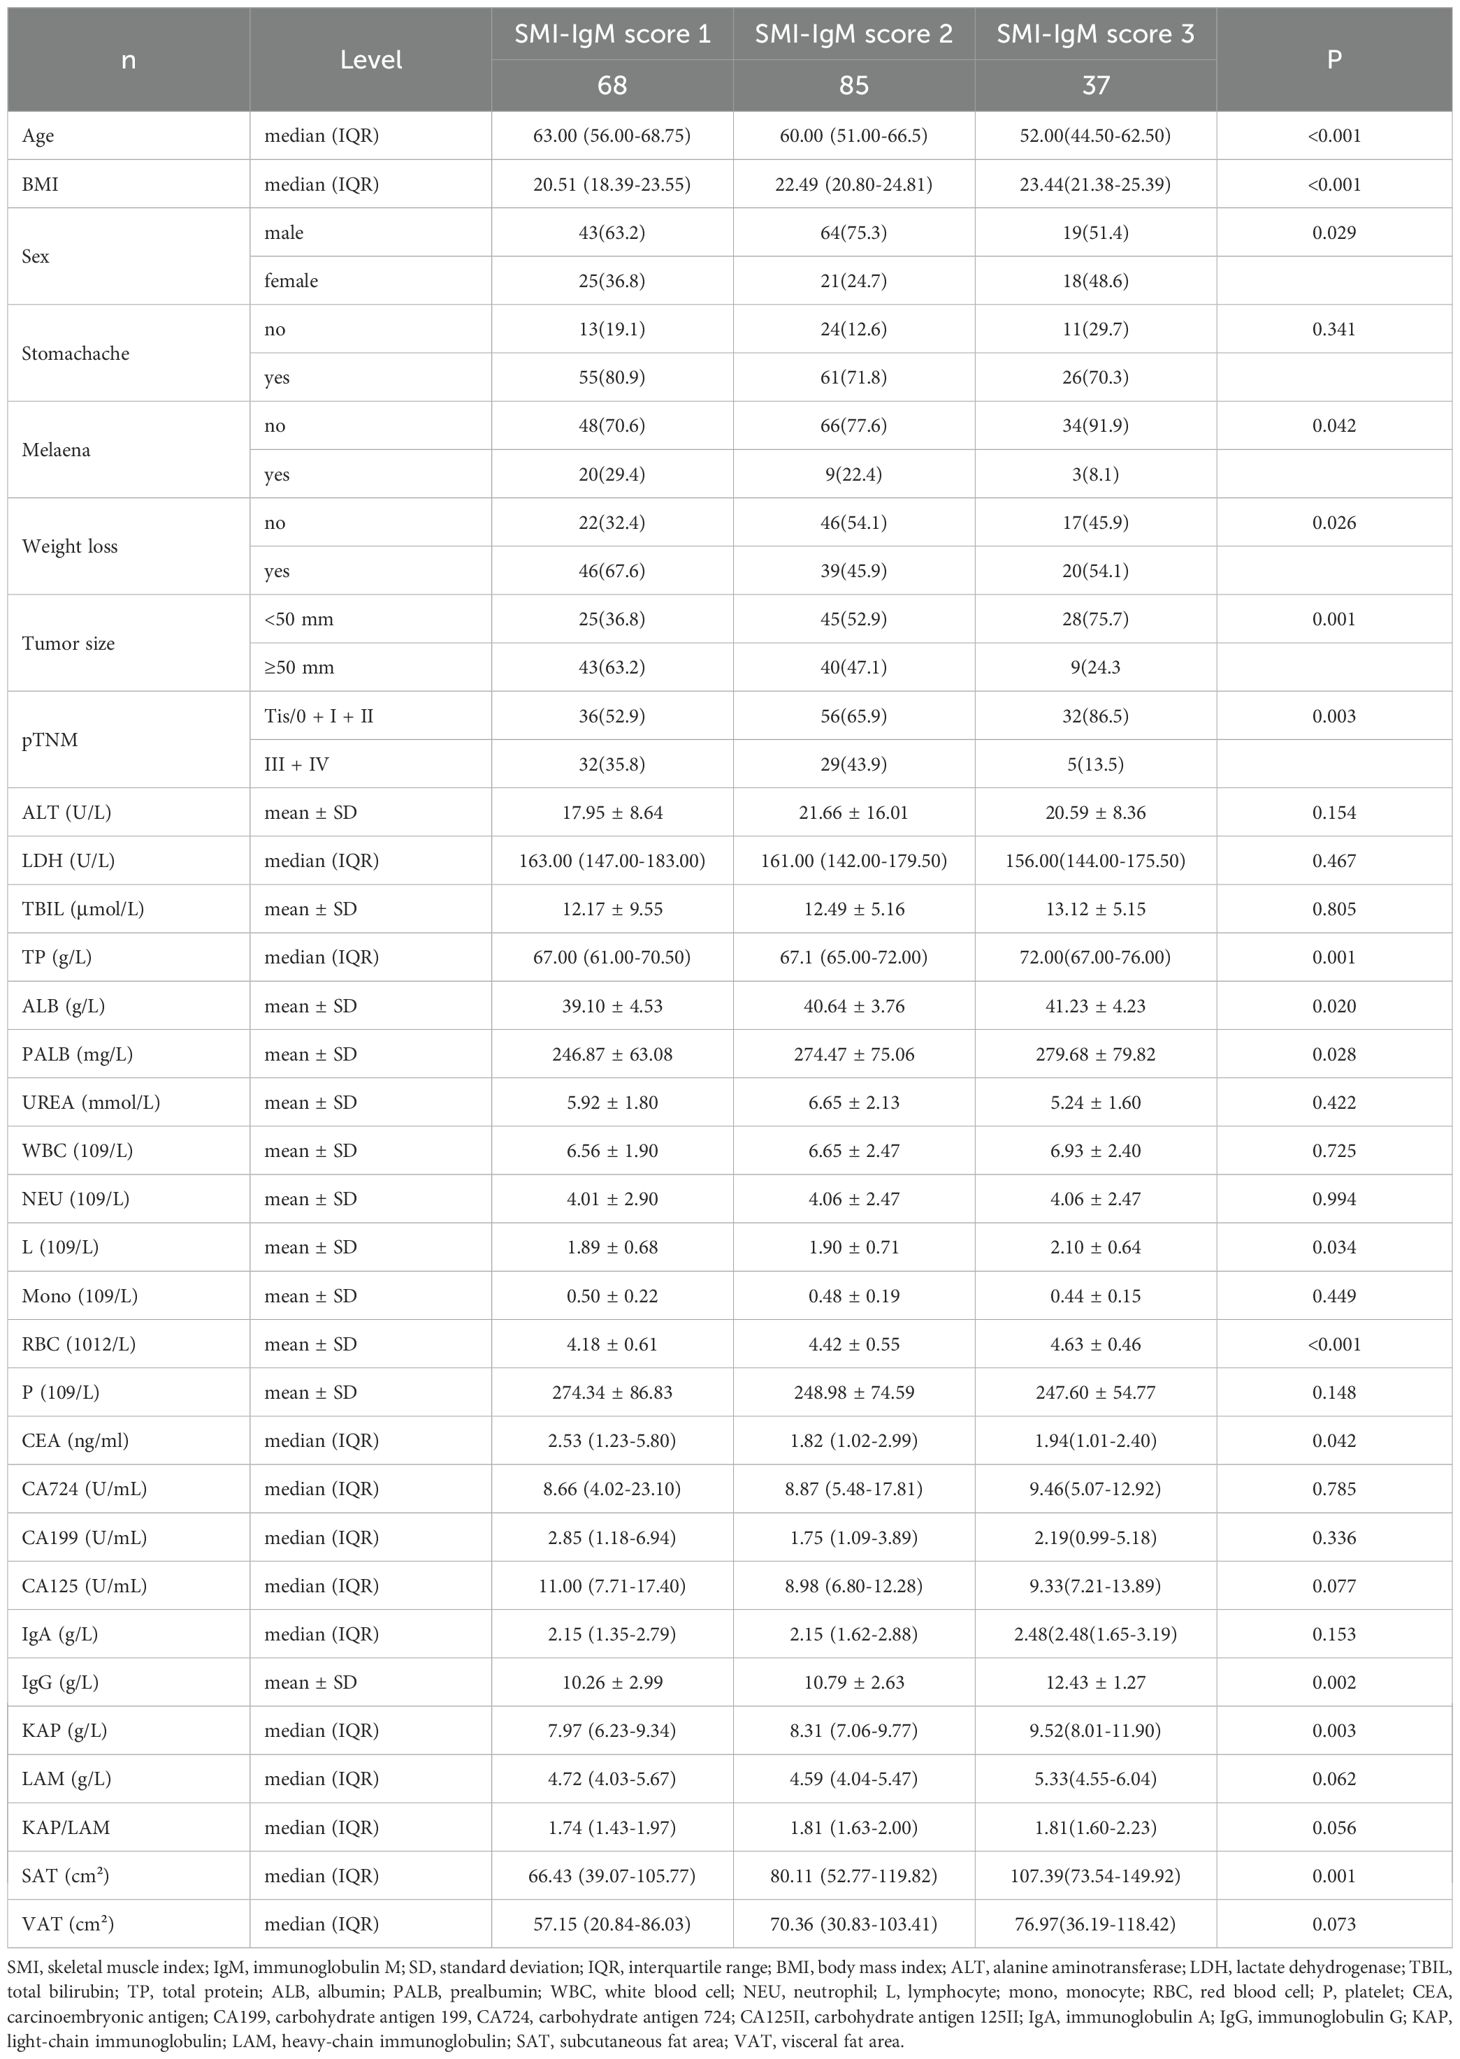
Table 1. Clinical, pathological and laboratory information of all patients.
When analyzing blood parameters, The one-way ANOVA and Kruskal-Wails rank-sum test found that SMI-IgM score was related to TP (total protein), ALB (albumin), PALB (prealbumin), L (lymphocyte), RBC (red blood cell), CEA (carcinoembryonic antigen), IgG, KAP (all p < 0.05). The detailed blood indicators of all 190 cases grouped by SMI-IgM score are displayed in Table 1. Table 1 shows the detailed blood indicators of patients grouped by SMI-IgM score.
Univariate and multivariate Cox’s regression analysis for PFS and OS
The univariate analysis found the patients’ age (p = 0.005), tumor size (p < 0.001), pTNM stage (p < 0.001), L (p = 0.021), CA724 (p = 0.002), IgG (p = 0.033), SAT (p = 0.020), VAT (p = 0.004), SMI-IgM score (p < 0.001) were related to PFS. Our research indicates that the prognostic factors for patients with OS were age (p = 0.003), L (p = 0.017), tumor size (p < 0.001), pTNM stage (p < 0.001), CA724 (p = 0.002), IgG (p = 0.038), SAT (p = 0.020), VAT (p = 0.004), SMI-IgM score (p < 0.001). The multivariate analysis indicated that CA724 (p = 0.015), pTNM stage (p < 0.001), and SMI-IgM score (p < 0.05) were independent prognostic factors for PFS. Our research findings suggest that the prognostic factors for patient OS were CA724 (p = 0.013), pTNM stage (p < 0.001), and SMI-IgM score (p < 0.05) (Table 2). We additionally performed supplementary analyses in which SMI and IgM were treated as continuous variables. In the univariate Cox regression analysis, SMI was significantly associated with both PFS (HR = 0.958, p = 0.014) and OS (HR = 0.960, p = 0.017), whereas IgM showed no significant association with PFS (HR = 0.580, p = 0.098) or OS (HR = 0.579, p = 0.098). We further assessed multicollinearity among the included predictors by calculating variance inflation factors (VIFs) (all <5), indicating no significant collinearity.
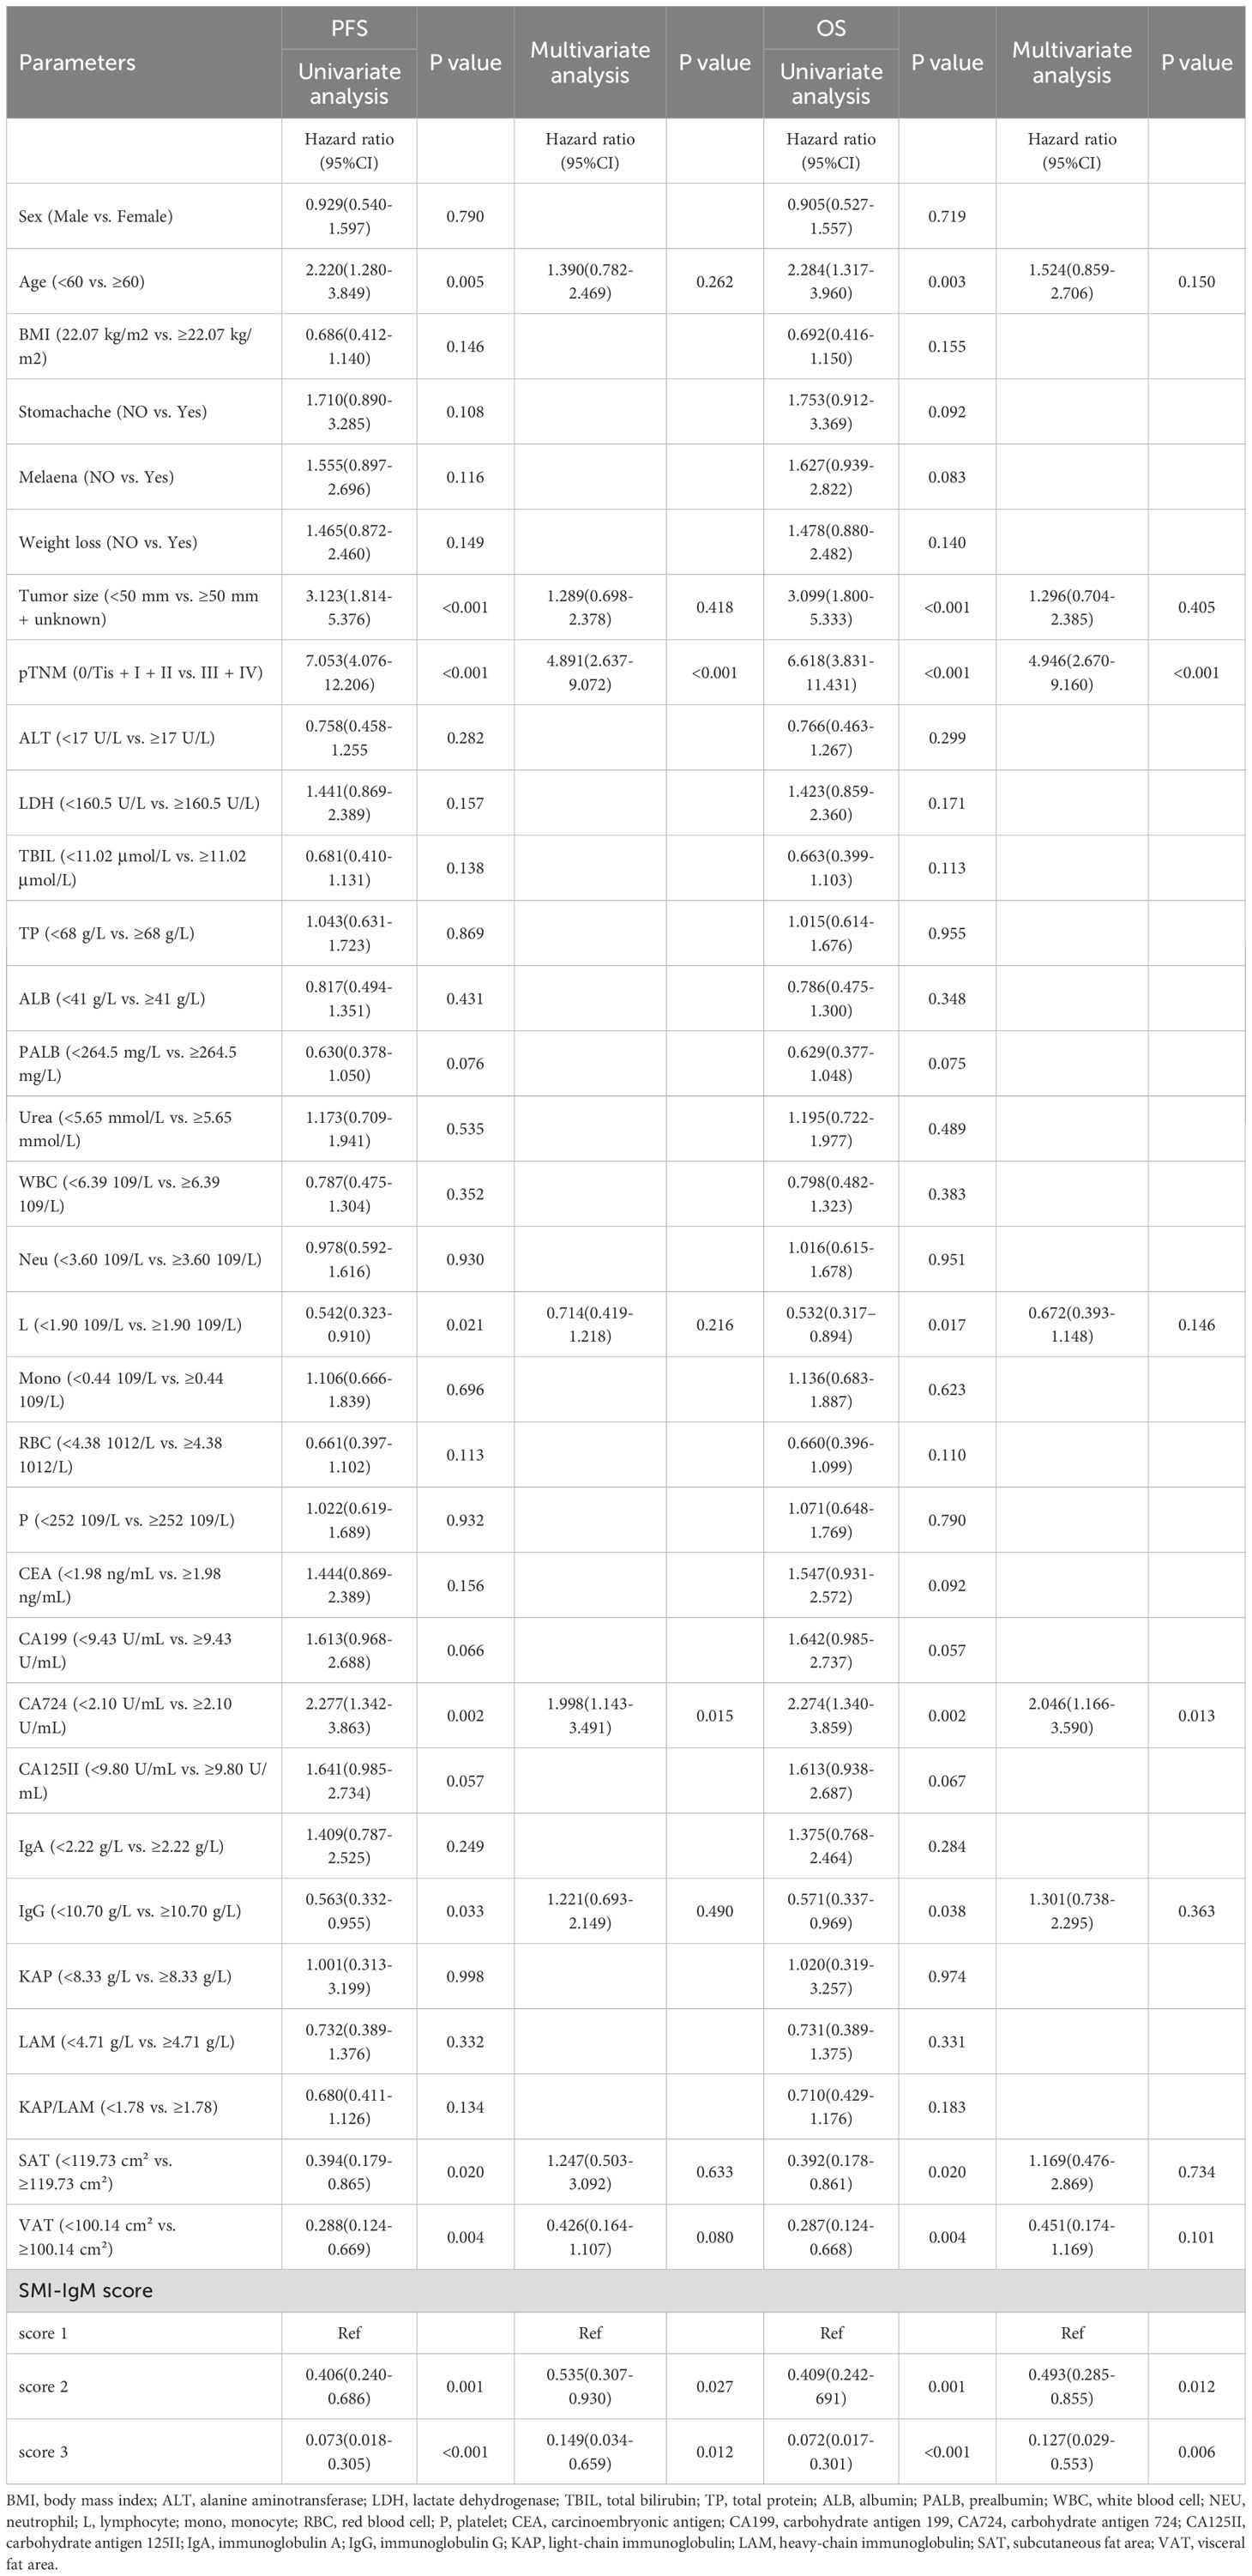
Table 2. Univariate and multivariate analysis for PFS and OS.
Survival analysis for IgM and SMI
In this study, we performed survival analyses for IgM and SMI separately. Among the 108 patients with IgM < 0.93 g/L, the 1-, 3-, and 5-year survival rates were 86.9% (95% CI: 80.7%-93.5%), 65.2% (95% CI:56.6%-75.1%), and 60.8% (95% CI: 51.9%-71.1%) for PFS, and 88.7% (95% CI: 82.9%-95.0%), 69.4% (95% CI: 61.1%-78.9%), and 63.3% (95% CI: 54.7%-73.4%) for OS. In contrast, among the 82 patients with IgM ≥ 0.93 g/L, the corresponding survival rates were 95.1% (95% CI: 90.6%-99.9%), 79.7% (95% CI: 71.3%-89.1%), and 76.9% (95% CI: 68.1%-86.9%) for PFS, and 96.3% (95% CI: 92.4%-100.0%), 82.4% (95% CI: 74.5%-91.2%), and 77.3% (95% CI: 68.5%-87.1%) for OS. Patients with higher IgM levels exhibited prolonged PFS (HR = 0.498, p = 0.013) and OS (HR = 0.493, p = 0.012) (Figures 2A, B).
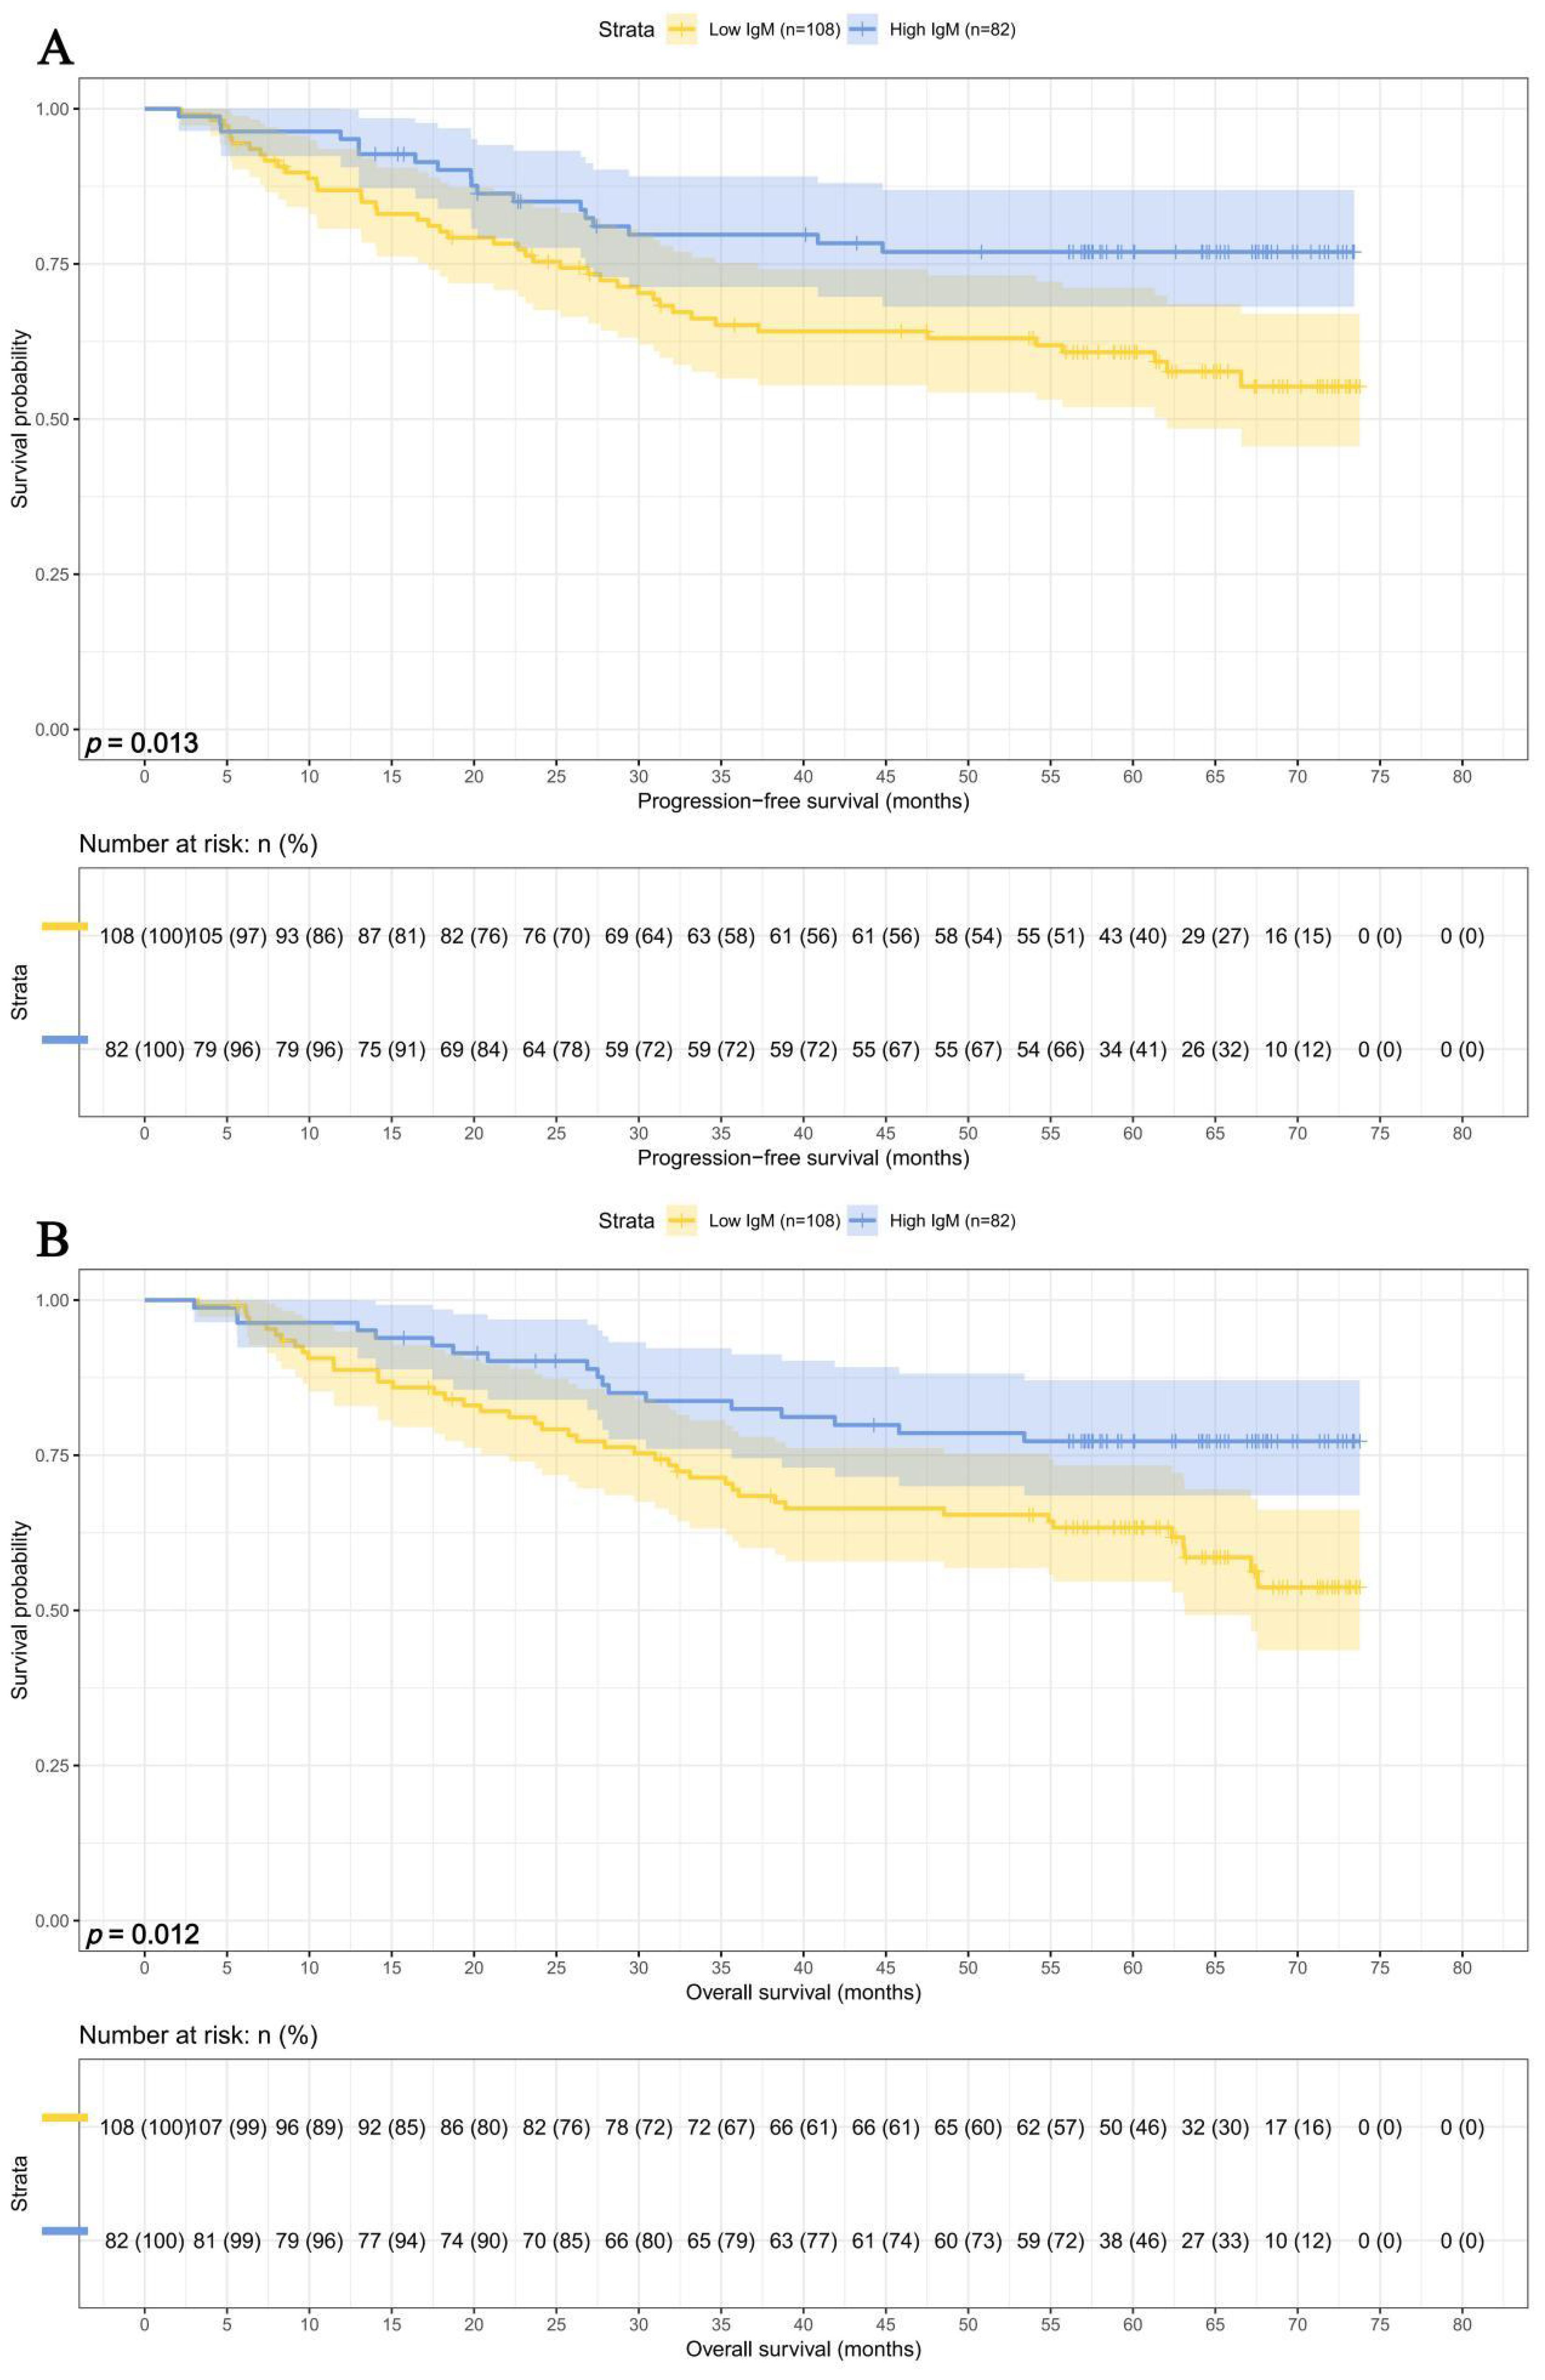
Figure 2. IgM related survival curve of (A) PFS and (B) OS in all patients.
There were 113 patients with lower SMI, and their 1-, 3-, and 5-year survival rates for PFS and OS were 85.7% (95% CI: 79.5%-92.5%), 58.2% (95% CI: 49.5%-68.4%), and 53.1% (95% CI: 44.3%-63.6%) and 88.4% (95% CI: 82.6%-94.5%), 61.8% (95% CI: 53.3%-71.6%),and 51.6% (95% CI: 47.5%-66.3%), respectively. While there were 73 patients with higher SMI, and their 1-, 3-, and 5-year survival rates for PFS and OS were 97.4% (95% CI: 93.9%-100.0%), 90.6% (95% CI: 84.2%-97.5%), and 89.0% (95% CI: 82.1%-96.5%) and 97.4% (95% CI: 93.9%-100.0%), 94.7% (95% CI: 89.7%-99.9%), and 89.0% (95% CI: 82.1%-96.5%), respectively. Patients with high SMI levels had longer PFS (HR = 0.196, p < 0.001) and OS (HR = 0.195, p < 0.001) (Figures 3A, B).
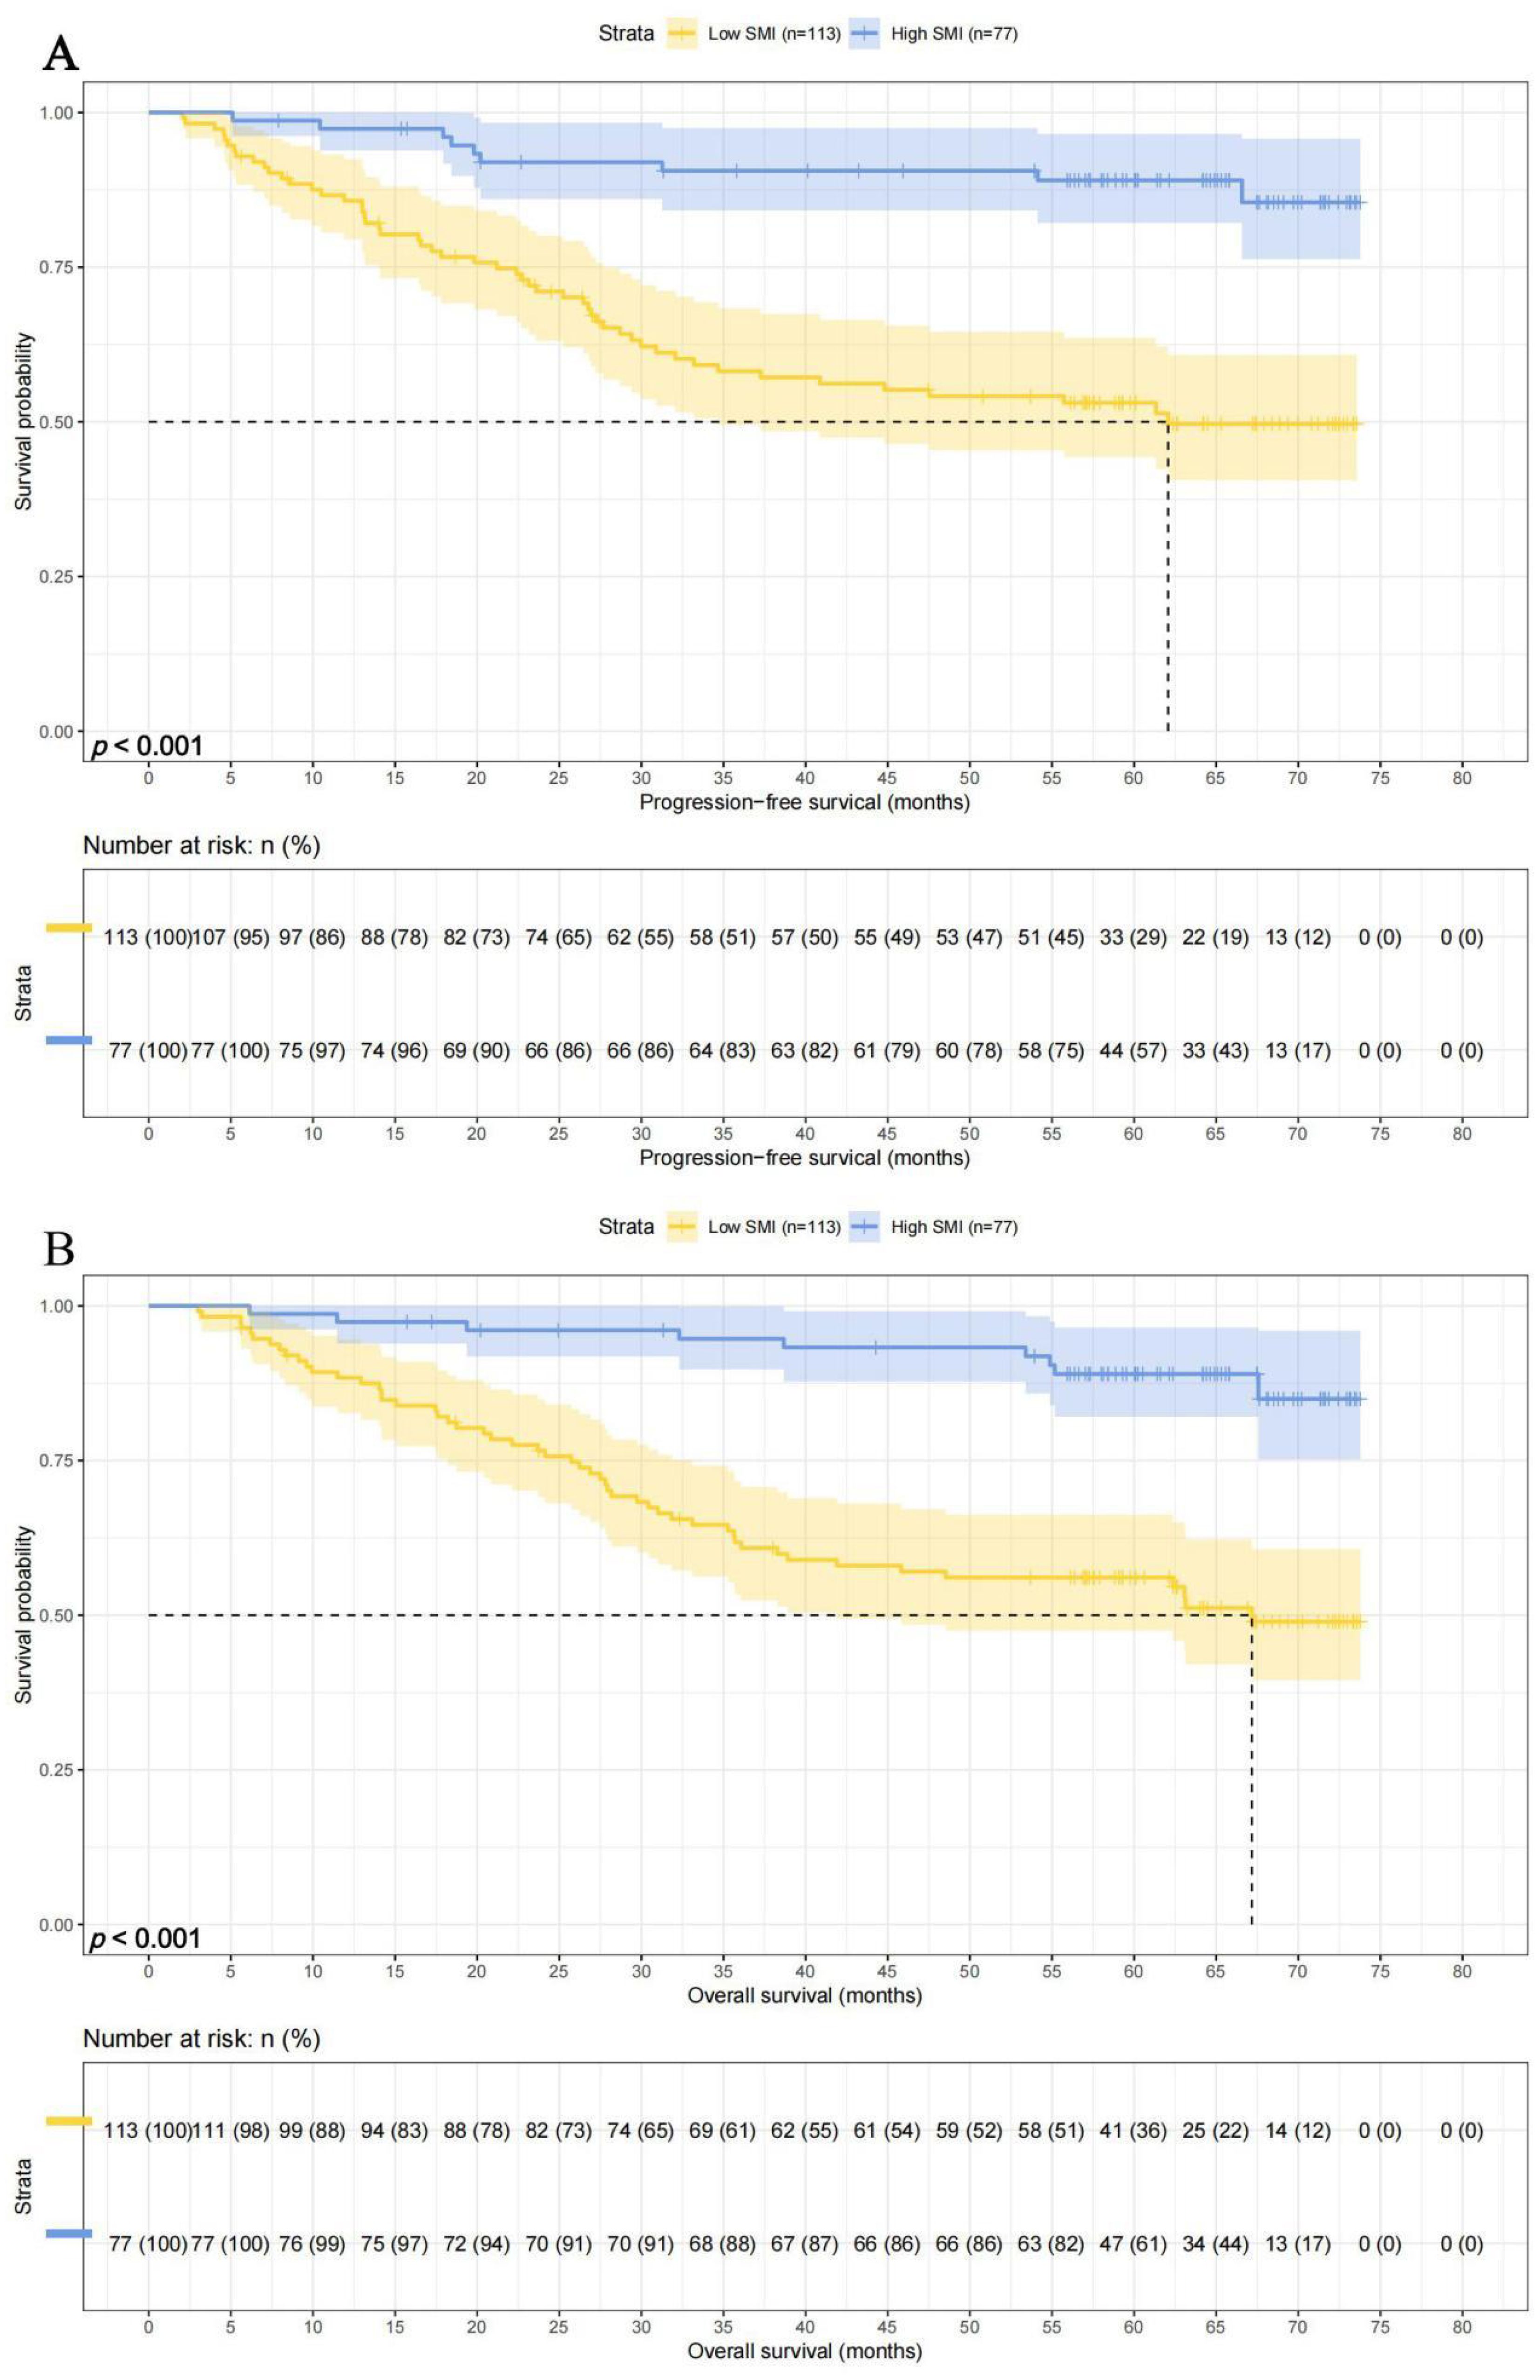
Figure 3. SMI related survival curve of (A) PFS and (B) OS in all patients.
SMI-IgM score and prognosis
The median survival times for PFS and OS in SMI-IgM score 1 group were 37.27 months and 62.37 months. The 1-, 3-, and 5- year survival rates for PFS in SMI-IgM score 1 group were 82.1% (95% CI: 73.4%-91.8%), 51.4% (95% CI: 40.4%-65.5%), 46.1% (95% CI: 35.1%-60.5%). The 1-, 3-, and 5- year survival rates for OS in SMI-IgM score 1 were 85.0% (95% CI: 76.8%-94.0%), 57.2% (95% CI: 46.3%-70.6%), 50.7% (95% CI: 39.8%-64.5%). The median survival time of PFS in SMI-IgM score groups 2 and 3 were both not achieved. The 1-, 3-, and 5-year survival rates for PFS in SMI-IgM score groups 2 and 3 were 92.9% (95% CI: 87.6%-98.5%), 77.1% (95% CI: 68.6%-86.7%), and 73.2% (95% CI: 64.2%-83.5%); 100.0% (95% CI: 100.0%-100.0%), 94.3% (95% CI: 86.9%-100.0%), and 94.3% (95% CI: 86.9%-100.0%), respectively. The median survival time of OS in SMI-IgM score groups 2 and 3 were not achieved. The 1-, 3-, and 5-year survival rates for OS in SMI-IgM score groups 2 and 3 were 94.1% (95% CI: 89.2%-99.3%), 78.5% (95% CI: 70.2%-87.8%), and 73.6% (95% CI: 64.6%-83.7%); 100.0% (95% CI: 100.0%-100.0%), 100.0% (95% CI: 100.0%-100.0%), and 94.0% (95% CI: 86.3%-100.0%), respectively. Patients with SMI-IgM score 1 had worse PFS (HR = 0.345, 95% CI: 0.226-0.525, p < 0.001) and OS (HR = 0.345, 95% CI: 0.227-0.525, p < 0.001) (Figures 4A, B).
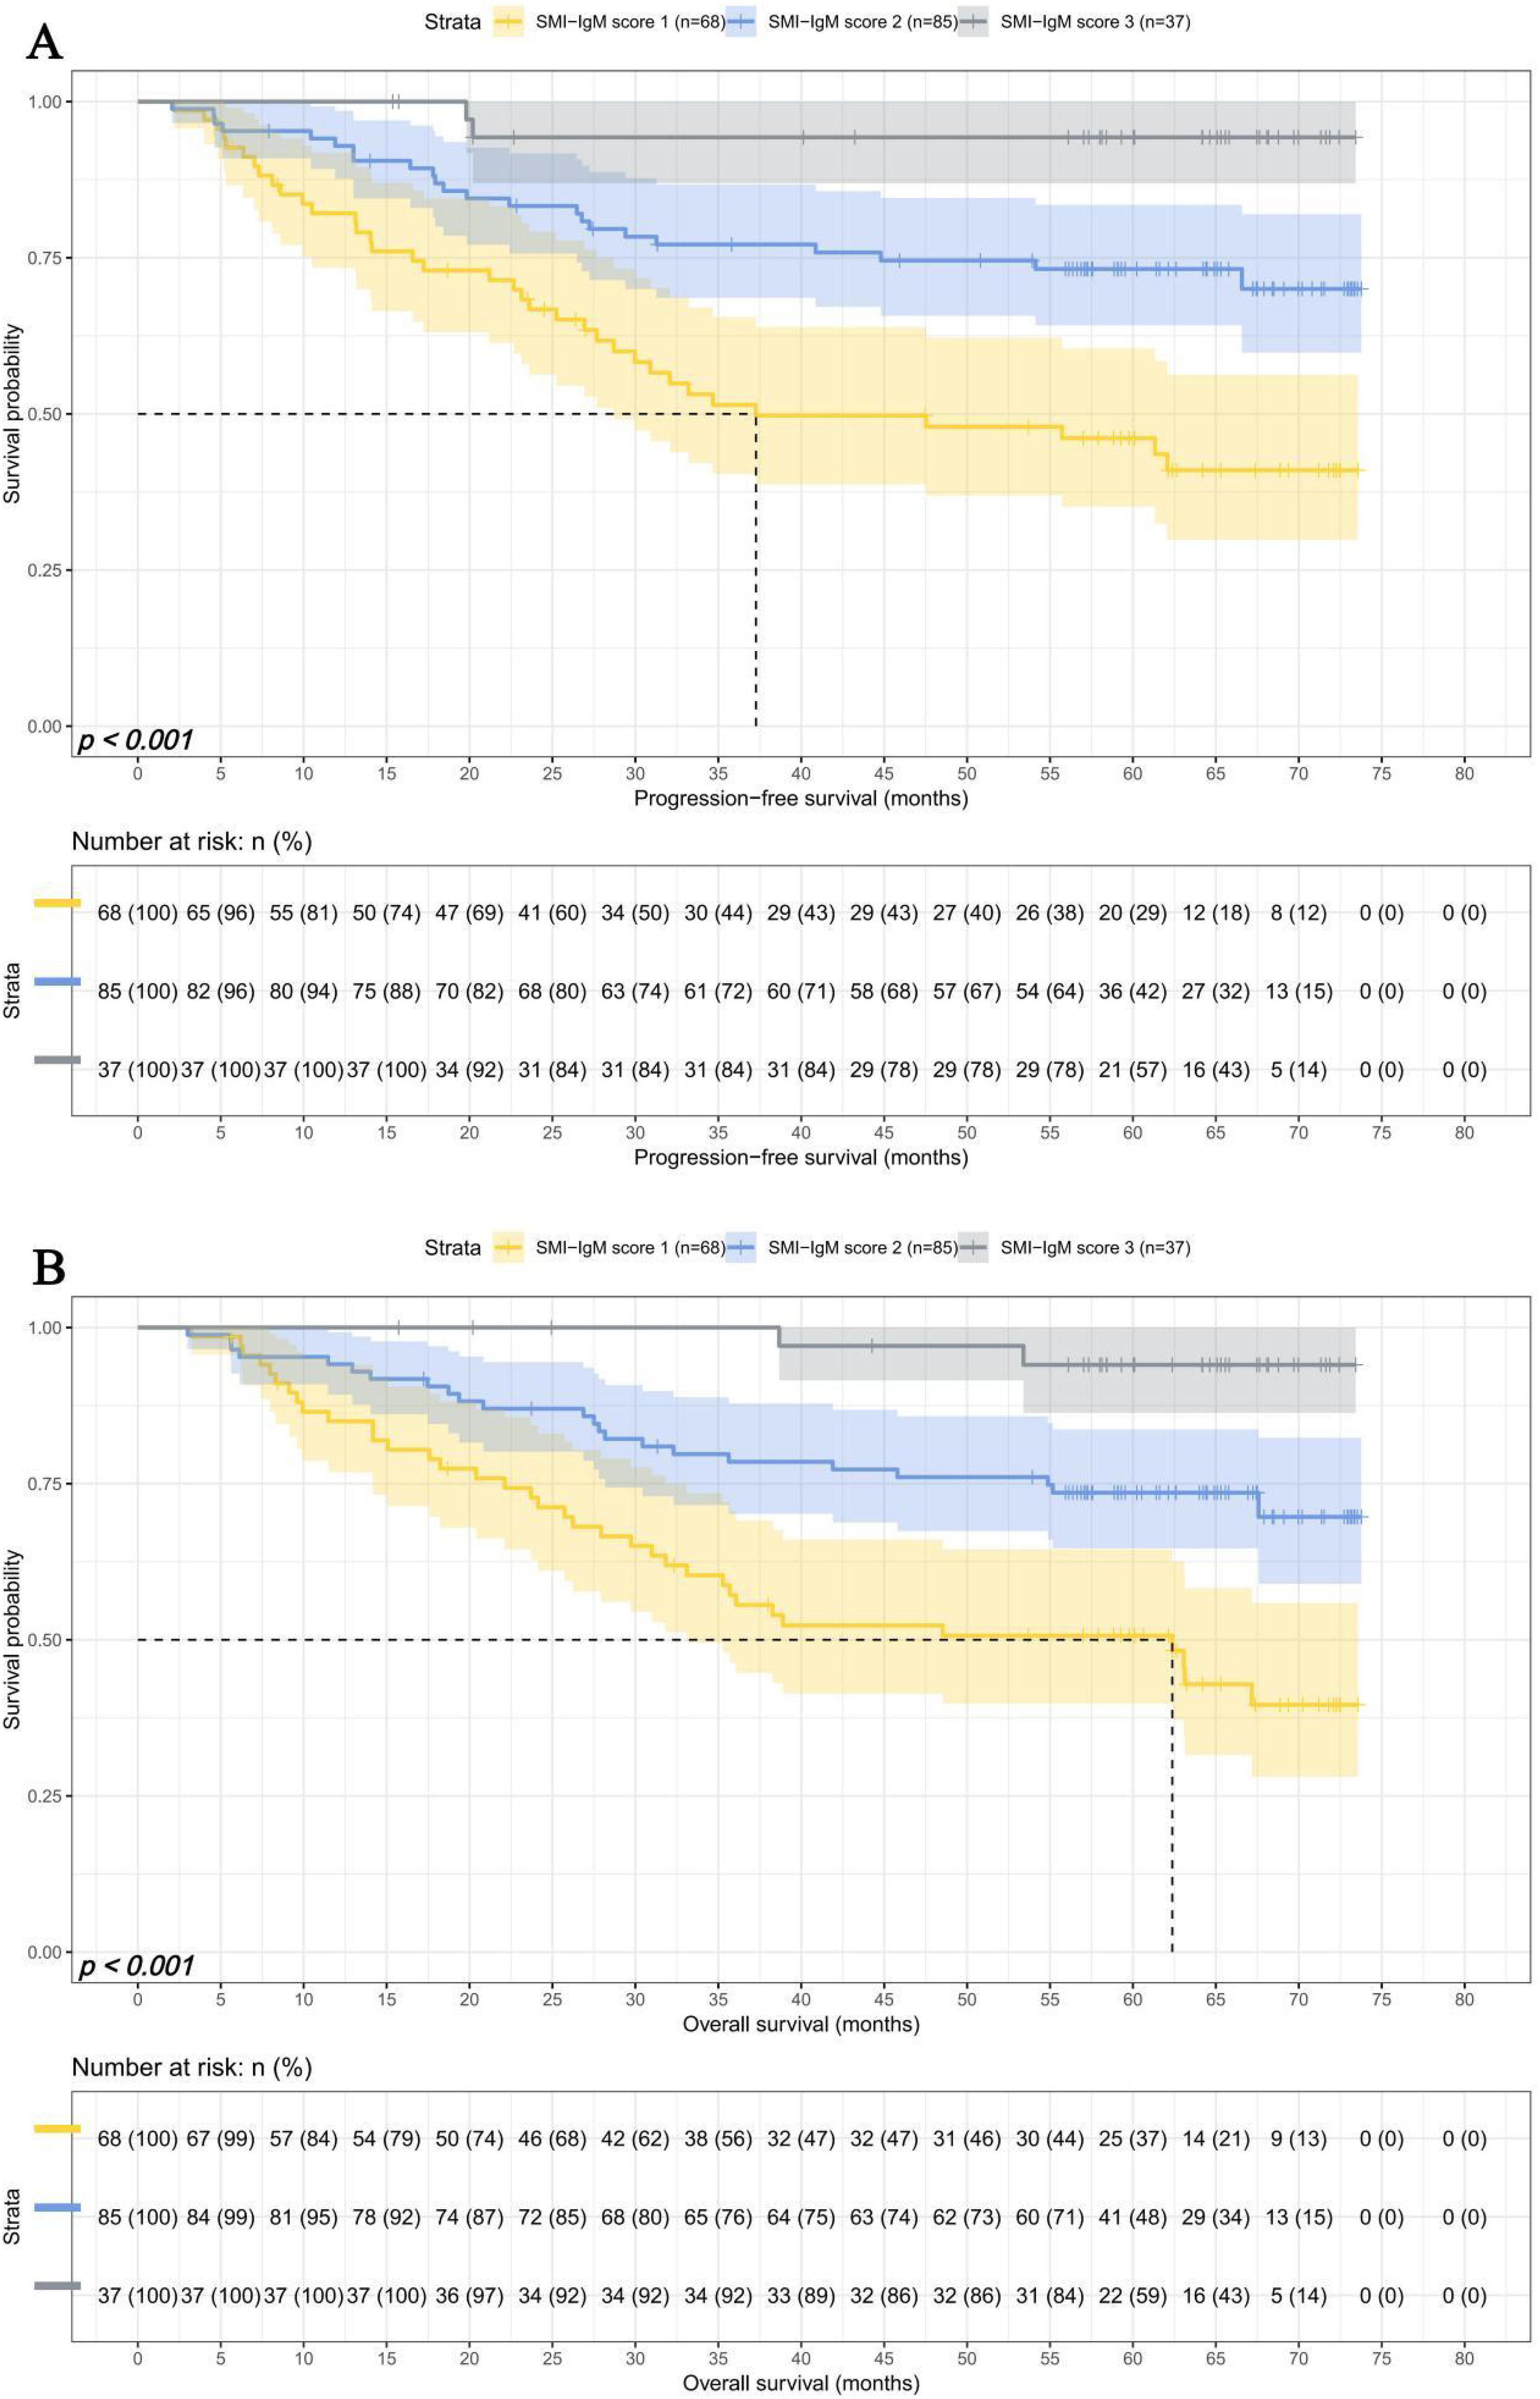
Figure 4. SMI-IgM score related survival curve of (A) PFS and (B) OS in all patients.
Survival for pTNM stage
Due to differences in TNM staging among patients, we investigated the predictive ability of SMI-IgM score and the prognostic significance of pTNM staging. We divided 190 patients into an early pTNM stage (0/Tis + I + II) group (124 patients) and an advanced pTNM stage (III + IV) group (66 patients). The median survival time for PFS and OS in early pTNM stage and advanced pTNM stage were both not reached. The 1-, 3-, and 5-year survival rates for PFS in early pTNM are 97.6% (95% CI: 94.9%-100.0%), 89.2% (95% CI: 83.8%-94.9%), and 85.6% (95% CI: 79.5%-92.2%). The 1-, 3-, and 5-year survival rates for OS in early pTNM are 97.6% (95% CI: 94.9%-100.0%), 89.2% (95% CI: 83.9%-94.9%), and 86.7% (95% CI: 80.8%-93.0%). The median survival time for PFS and OS in advanced pTNM stage and advanced pTNM stage were 26.93 months and 35.63 months. The 1-, 3-, and 5-year survival rates for PFS and OS in early pTNM were 76.8% (95% CI: 67.2%-87.8%), 36.1% (95% CI: 25.7%-50.7%), and 32.3% (95% CI: 22.2%-46.9%); 81.5% (95% CI: 72.6%-91.5%), 47.7% (95% CI: 36.7%-61.8%), 36.1% (95% CI: 25.9%-50.4%), respectively. Patients in the advanced pTNM stage had lower PFS (HR = 6.983, 95% CI: 4.027-12.108, p < 0.001) and OS (HR = 6.618, 95% CI: 3.831-11.431, p < 0.001) than those early pTNM stage patients (Figures 5A, B).
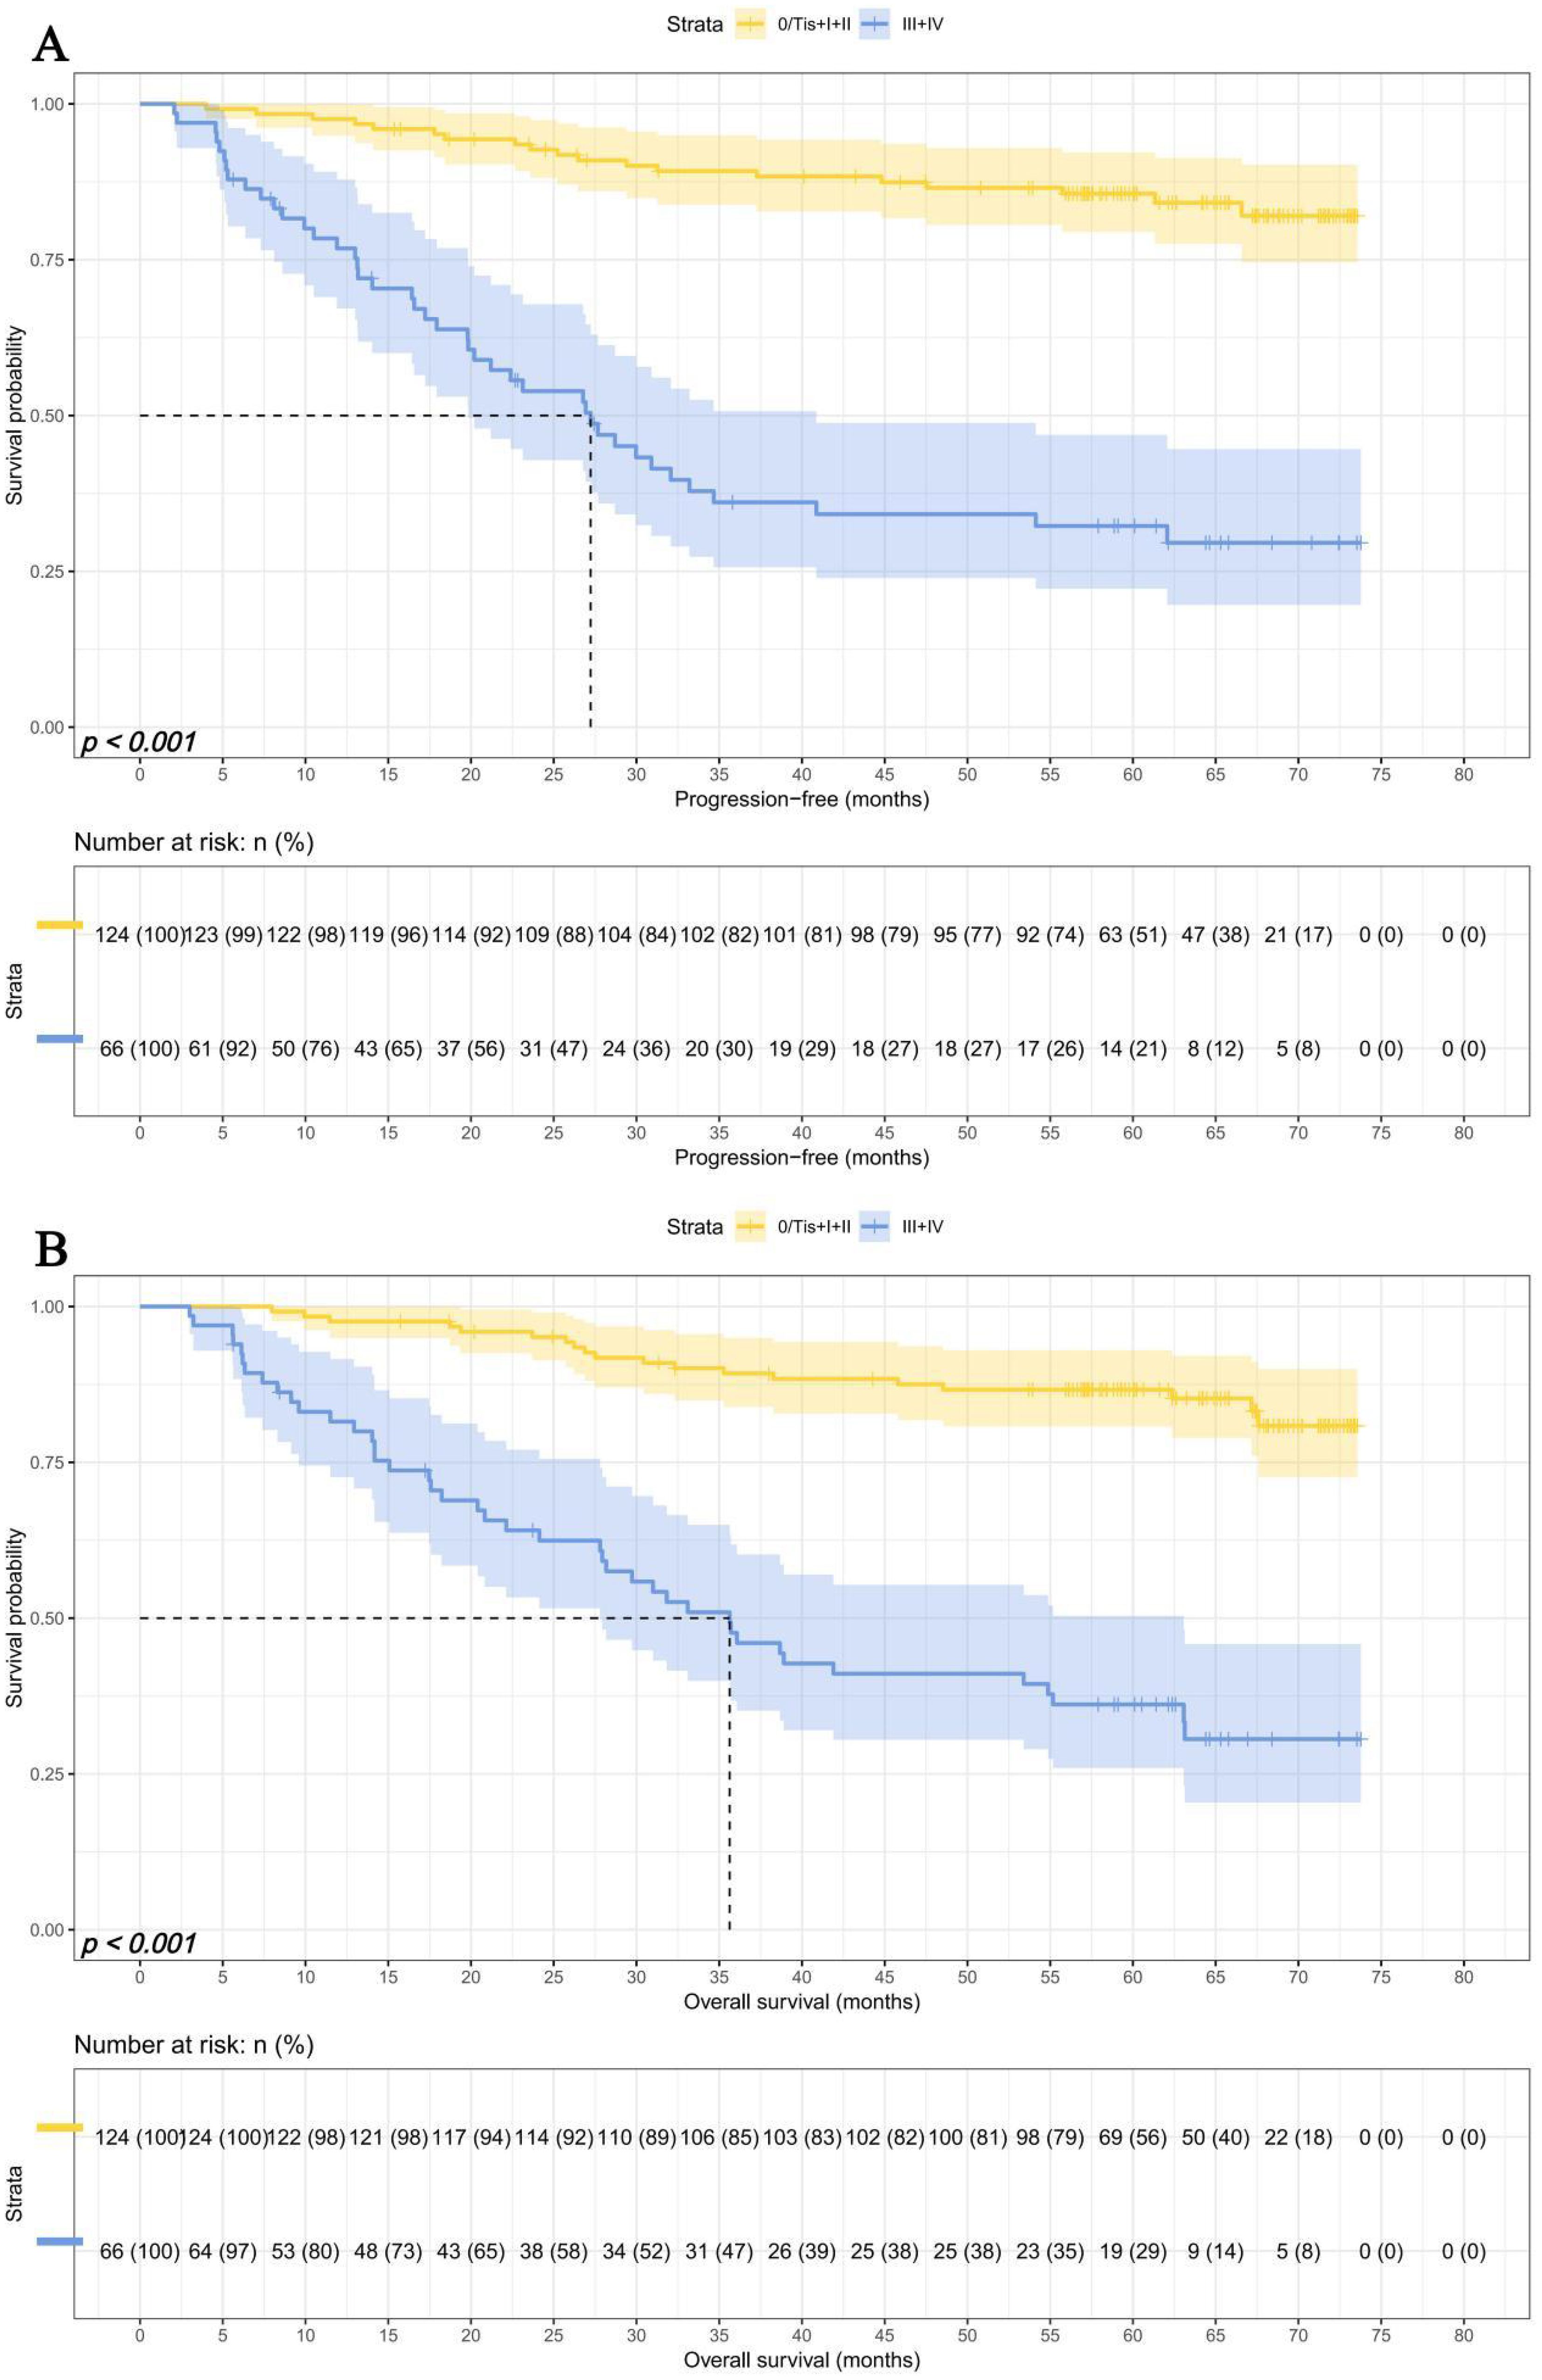
Figure 5. The pTNM related survival curve of (A) PFS and (B) OS in all patients.
In early pTNM stage, There were 36 patients in SMI-IgM score 1 group, 56 patients in SMI-IgM score 2 group, and 32 patients in SMI-IgM score 3 group. The 1-, 3-, and 5-year survival rates for PFS and OS in SMI-IgM score 1 were 94.4% (95% CI: 87.3%-100.0%) vs. 94.4% (95% CI: 87.3%-100.0%), 82.8% (95% CI: 71.1%-96.4%) vs. 82.9% (95% CI: 71.3%-96.4%), and 72.4% (95% CI: 58.4%-89.8%) vs. 76.8% (95% CI: 63.8%-92.3%). The 1-, 3-, and 5-year survival rates for PFS and OS in SMI-IgM score 2 were 98.2% (95% CI: 94.8%-100.0%), 87.5% (95% CI: 79.3%-96.6%), and 85.7% (95% CI: 77.0%-95.4%); 98.2% (95% CI: 94.8%-100.0%), 87.5% (95% CI: 79.2%-96.6%), and 85.6% (95% CI: 76.9%-95.4%), respectively. The 1-, 3-, and 5-year survival rates for PFS and OS in SMI-IgM score 3 were 100.0% (95% CI: 100.0%-100.0%) vs. 100.0% (95% CI: 100.0%-100.0%), 100.0% (95% CI: 100.0%-100.0%) vs. 100.0% (95% CI: 100.0%-100.0%), and 100.0% (95% CI: 100.0%-100.0%) vs.100.0% (95% CI: 100.0%-100.0%). Patients with SMI-IgM score 1 had shorter PFS (HR = 0.325, 95% CI: 0.156-0.675, p = 0.003) and OS (HR = 0.342, 95% CI: 0.166-0.708, p = 0.004) (Figures 6A, B).
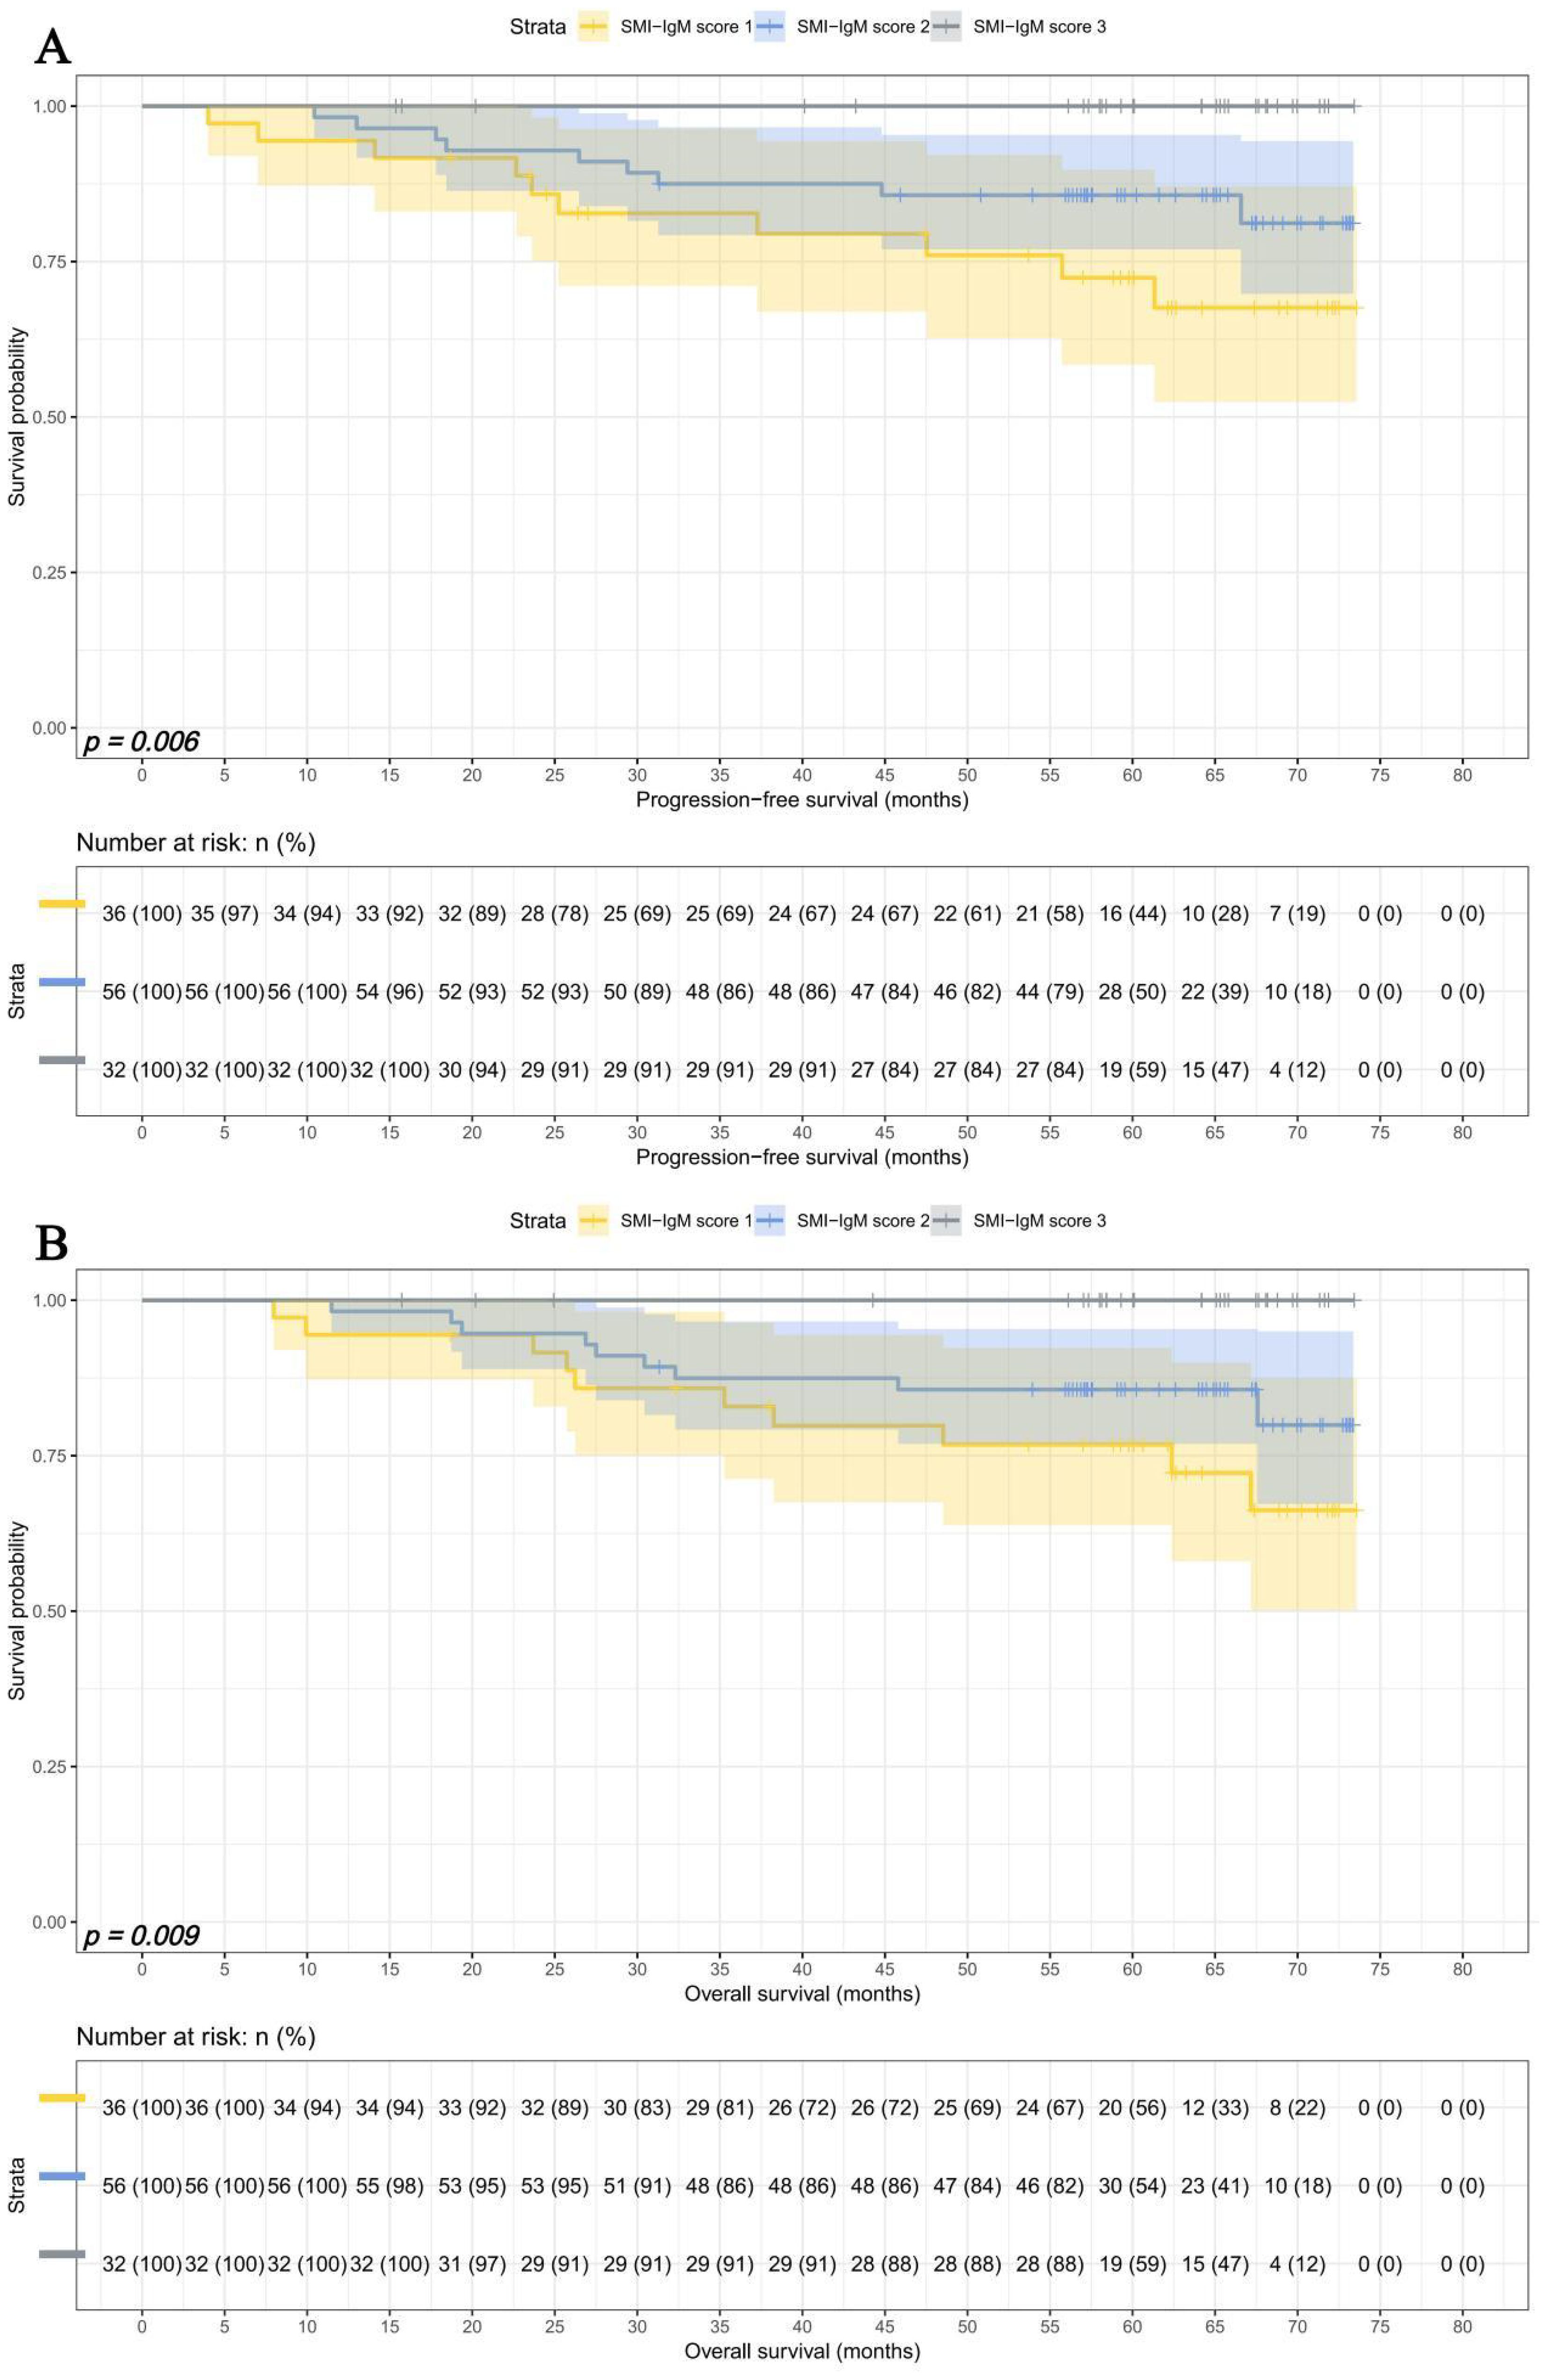
Figure 6. SMI-IgM score related survival curves in early pTNM stage for (A) PFS and (B) OS.
In advanced pTNM stage, There were 32 patients in SMI-IgM score 1 group, 29 patients in SMI-IgM score 2 group, and 5 patients in SMI-IgM score 3 group. The 1-, 3-, and 5-year survival rates for PFS and OS in SMI-IgM score 1 were 67.6% (95% CI: 52.9%-86.4%) vs. 73.9% (95% CI: 59.8%-91.2%), 16.9% (95% CI: 7.6%-37.5%) vs.26.9% (95% CI: 14.9%-48.5%), and 16.9% (95% CI: 7.6%-37.5%) vs. 20.2% (95% CI: 9.9%-41.2%). The 1-, 3-, and 5-year survival rates for PFS and OS in SMI-IgM score 2 were 82.6% (95% CI: 69.9%-97.7%), 56.0% (95% CI: 40.0%-78.3%), and 46.6% (95% CI: 30.6%-71.1%); 86.2% (95% CI: 74.5%-99.7%), 60.7% (95% CI: 45.0%-81.9%), and 49.3% (95% CI: 33.7%-72.2%), respectively. The 1-, 3-, and 5-year survival rates for PFS and OS in SMI-IgM score 3 were 100.0% (95% CI: 100.0%-100.0%) vs. 100.0% (95% CI: 100.0%-100.0%), 60.0% (95% CI: 29.3%-100.0%) vs. 100.0% (95% CI: 100.0%-100.0%), and 60.0% (95% CI: 29.3%-100.0%) vs. 60.0% (95% CI: 29.3%-100.0%). Patients with SMI-IgM score 1 had worse PFS (HR = 0.491, 95% CI: 0.284-0.850, p = 0.011) and OS (HR = 0.434, 95% CI: 0.252-0.746, p = 0.003) (Figures 7A, B).
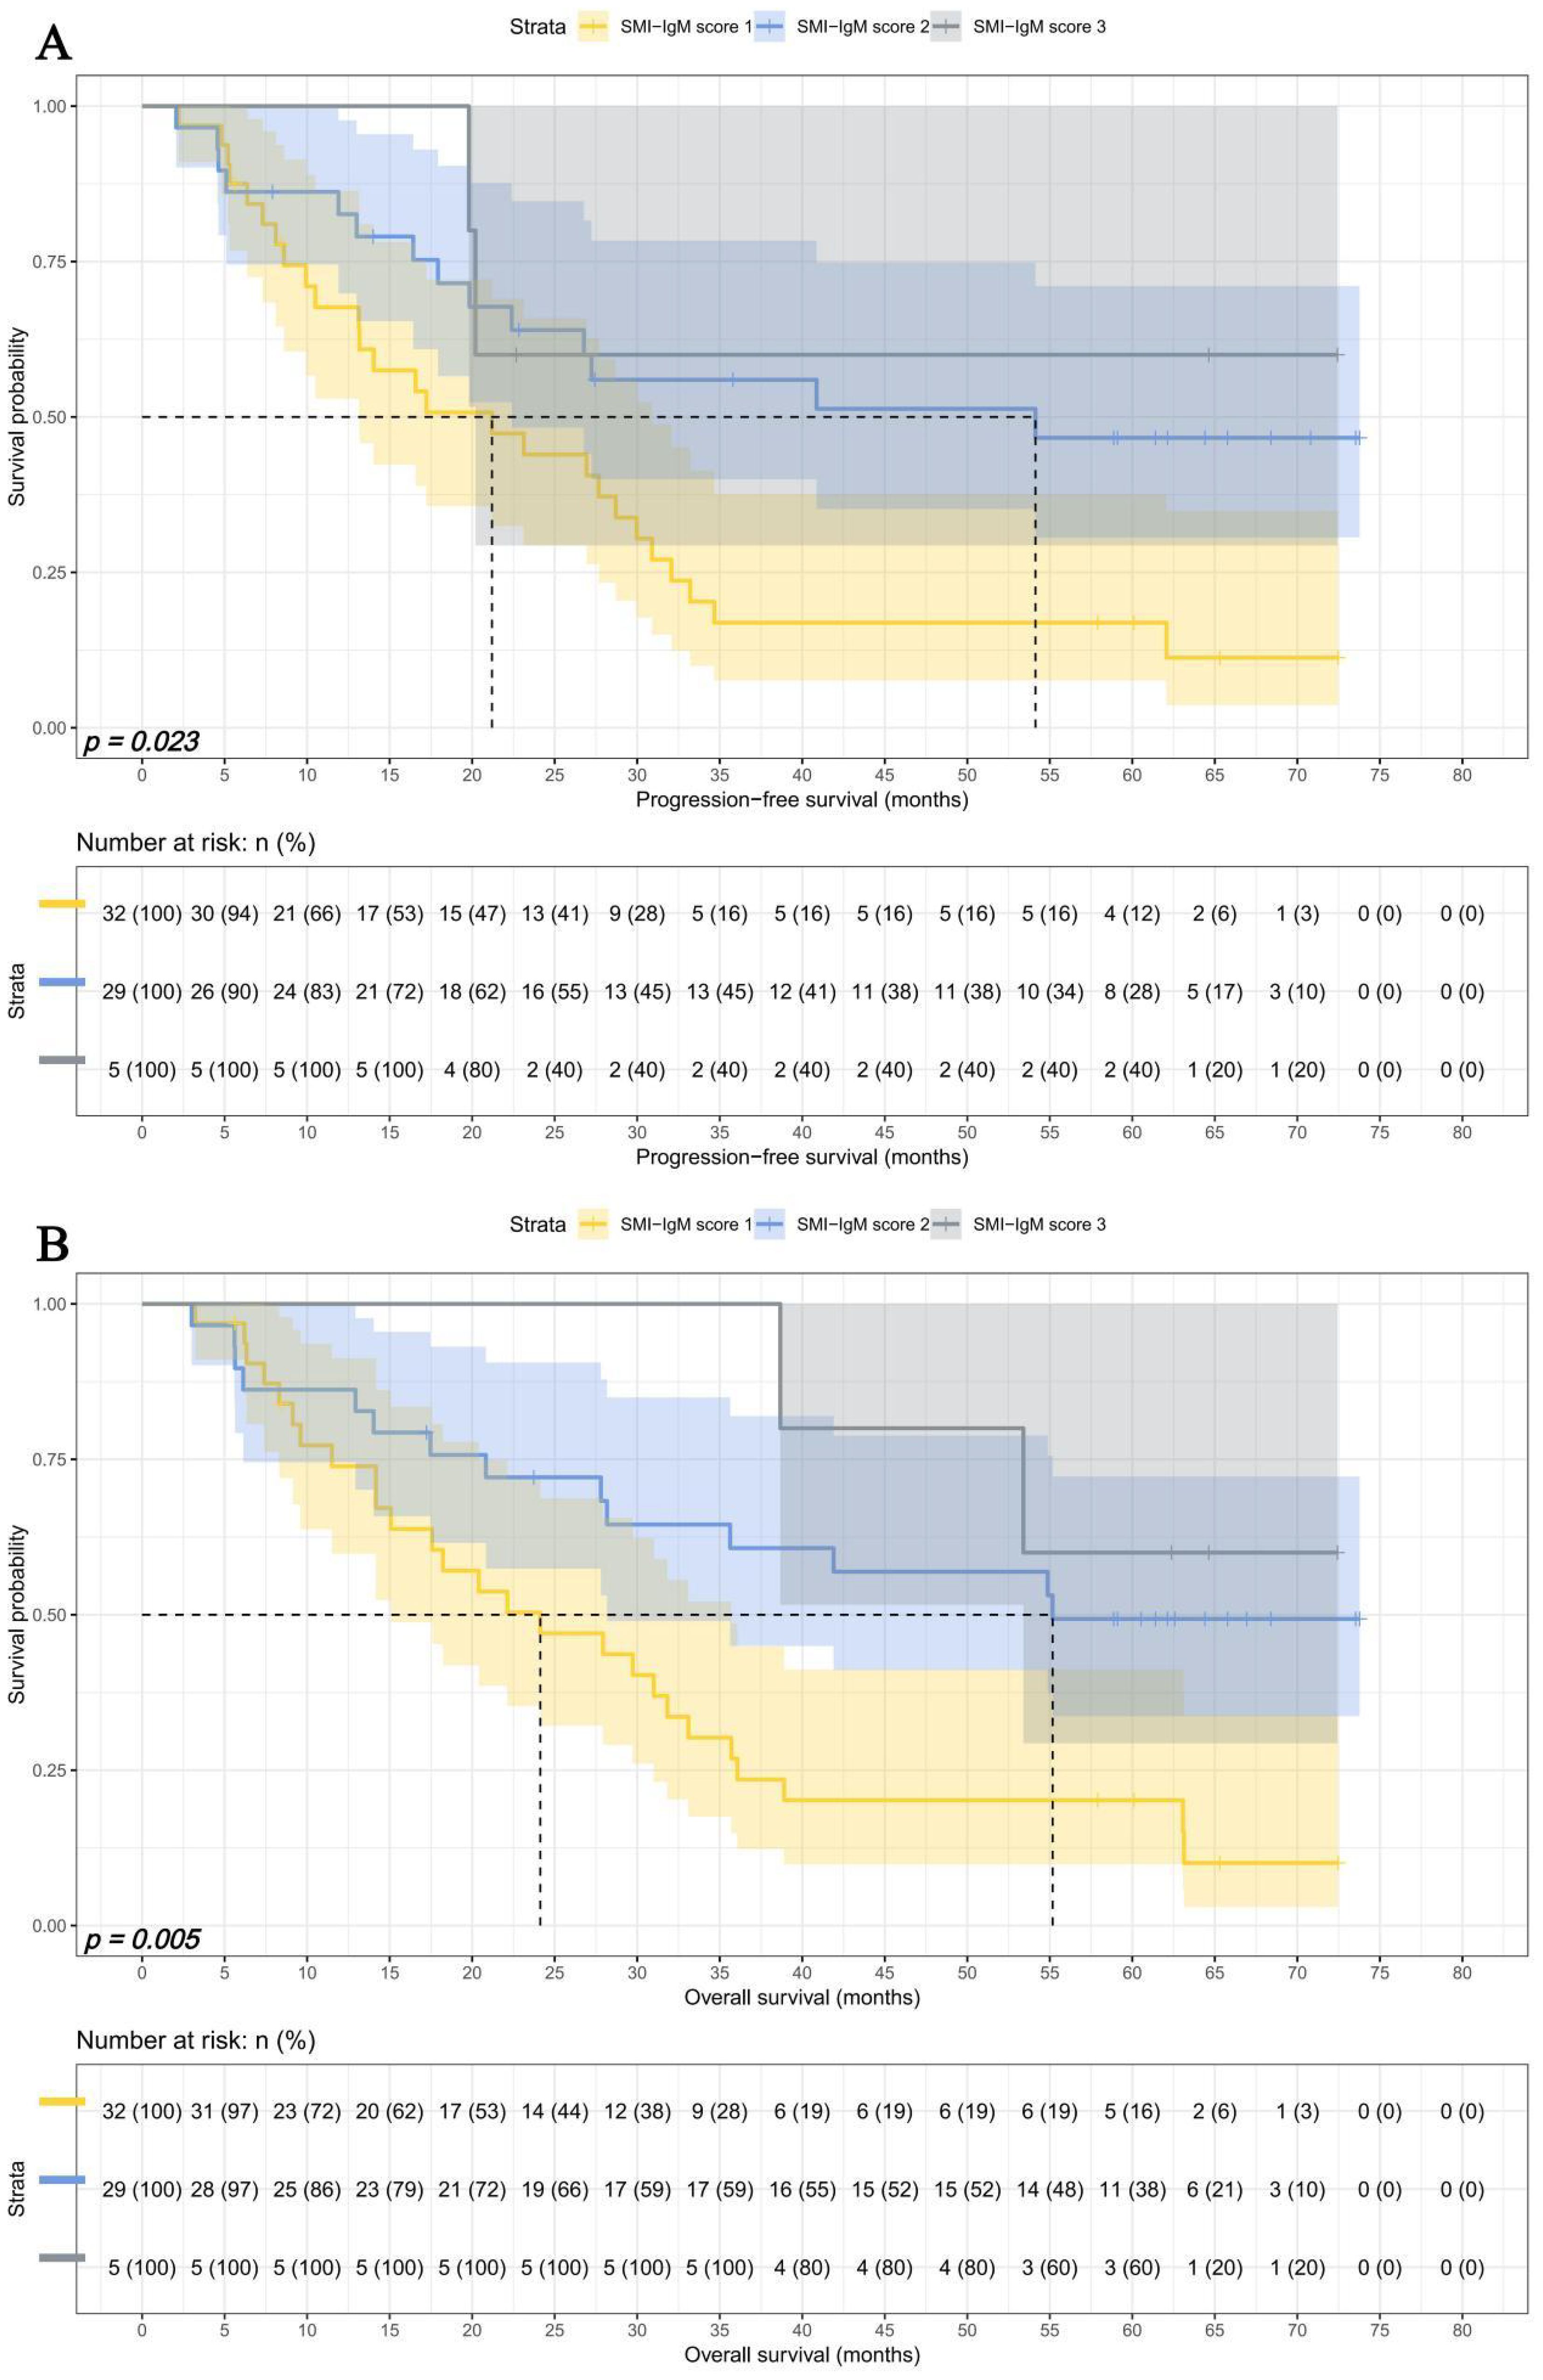
Figure 7. SMI-IgM score related survival curves in advanced pTNM stage for (A) PFS and (B) OS.
Subgroup analysis
Subgroup analyses were conducted to assess the prognostic value of the SMI-IgM across different clinical strata, including sex, TNM stage, CA724 level, and age. The SMI-IgM remained a significant predictor of overall survival in most subgroups, with no significant interactions observed for sex, TNM stage, or CA724 level. Notably, a significant interaction was detected for age, indicating that the prognostic impact of the SMI-IgM index was more pronounced in younger patients (Figure 8).
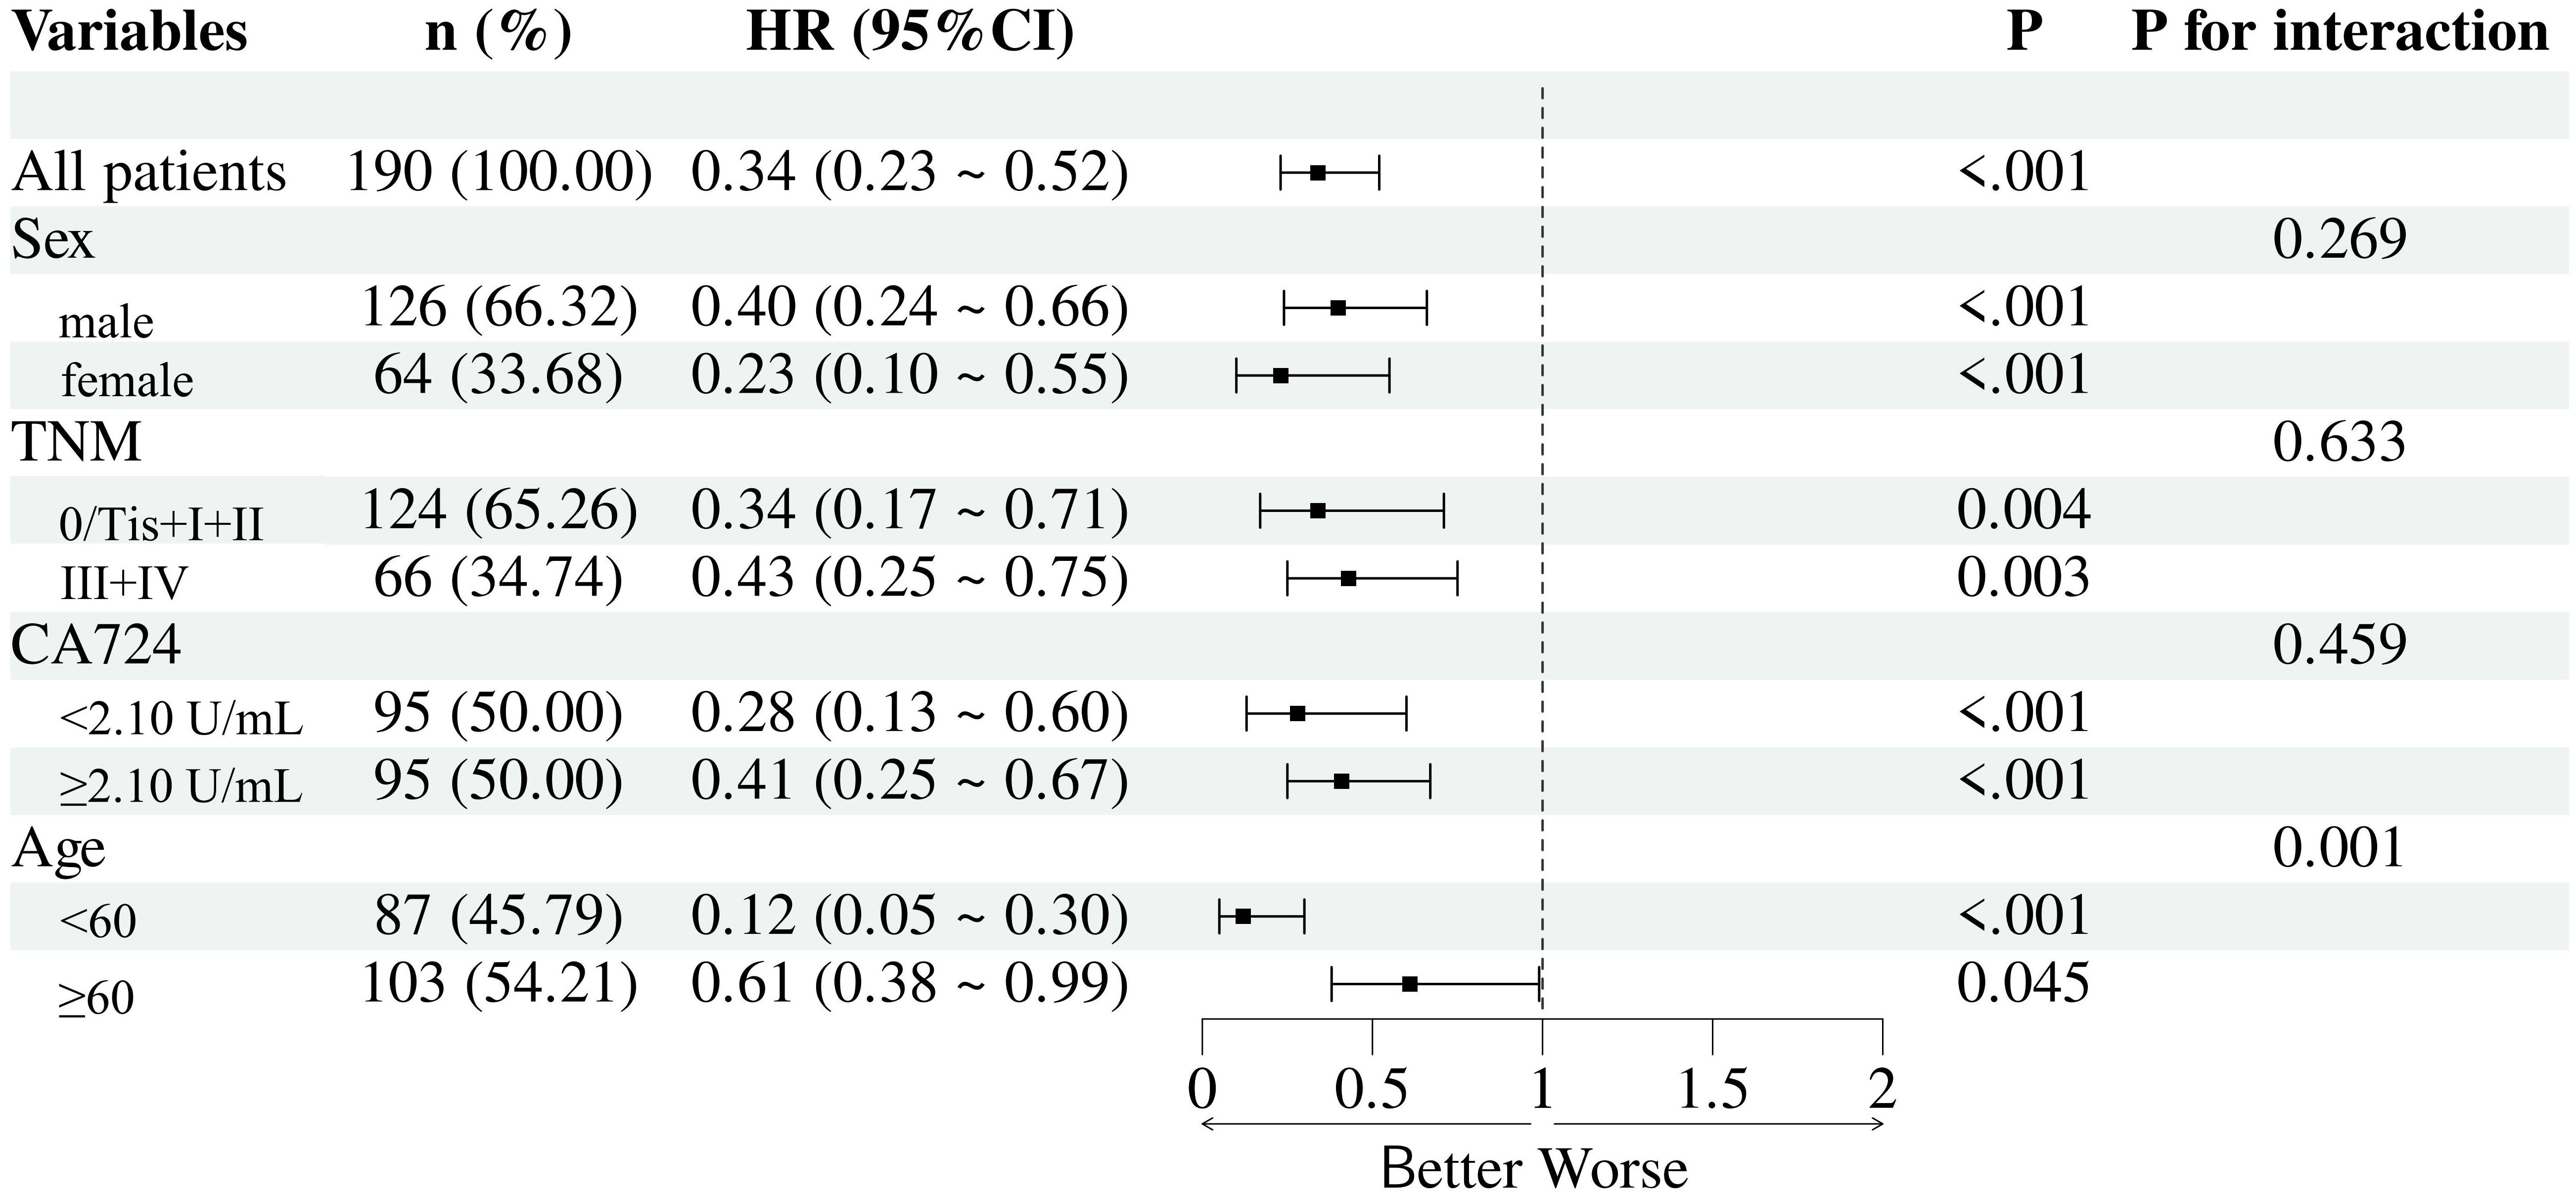
Figure 8. The stratification analysis of SMI-IgM score for OS.
Construction of nomograms to predict PFS and OS
In order to further test the prognostic effectiveness of SMI-IgM score, we constructed nomograms based on CA724, pTNM stage, SMI-IgM score to predict the 1-, 3-, and 5- year survival probability for PFS and OS. The C-index and 95% CI for predicting the survival probability of PFS and OS were 0.808 (0.761-0.855) and 0.806 (0.758-0.854), respectively (Figures 9A, B). The calibration found that the nomograms could accurately predict the 3- and 5-year survival rates of PFS and OS in patients (Figures 10A, B). To evaluate the internal robustness and discrimination performance of the prognostic models, bootstrap resampling with 1000 iterations was conducted. The optimism-corrected concordance index was 0.802 for PFS and 0.801 for OS, suggesting that both models demonstrated strong predictive discrimination with minimal overfitting.
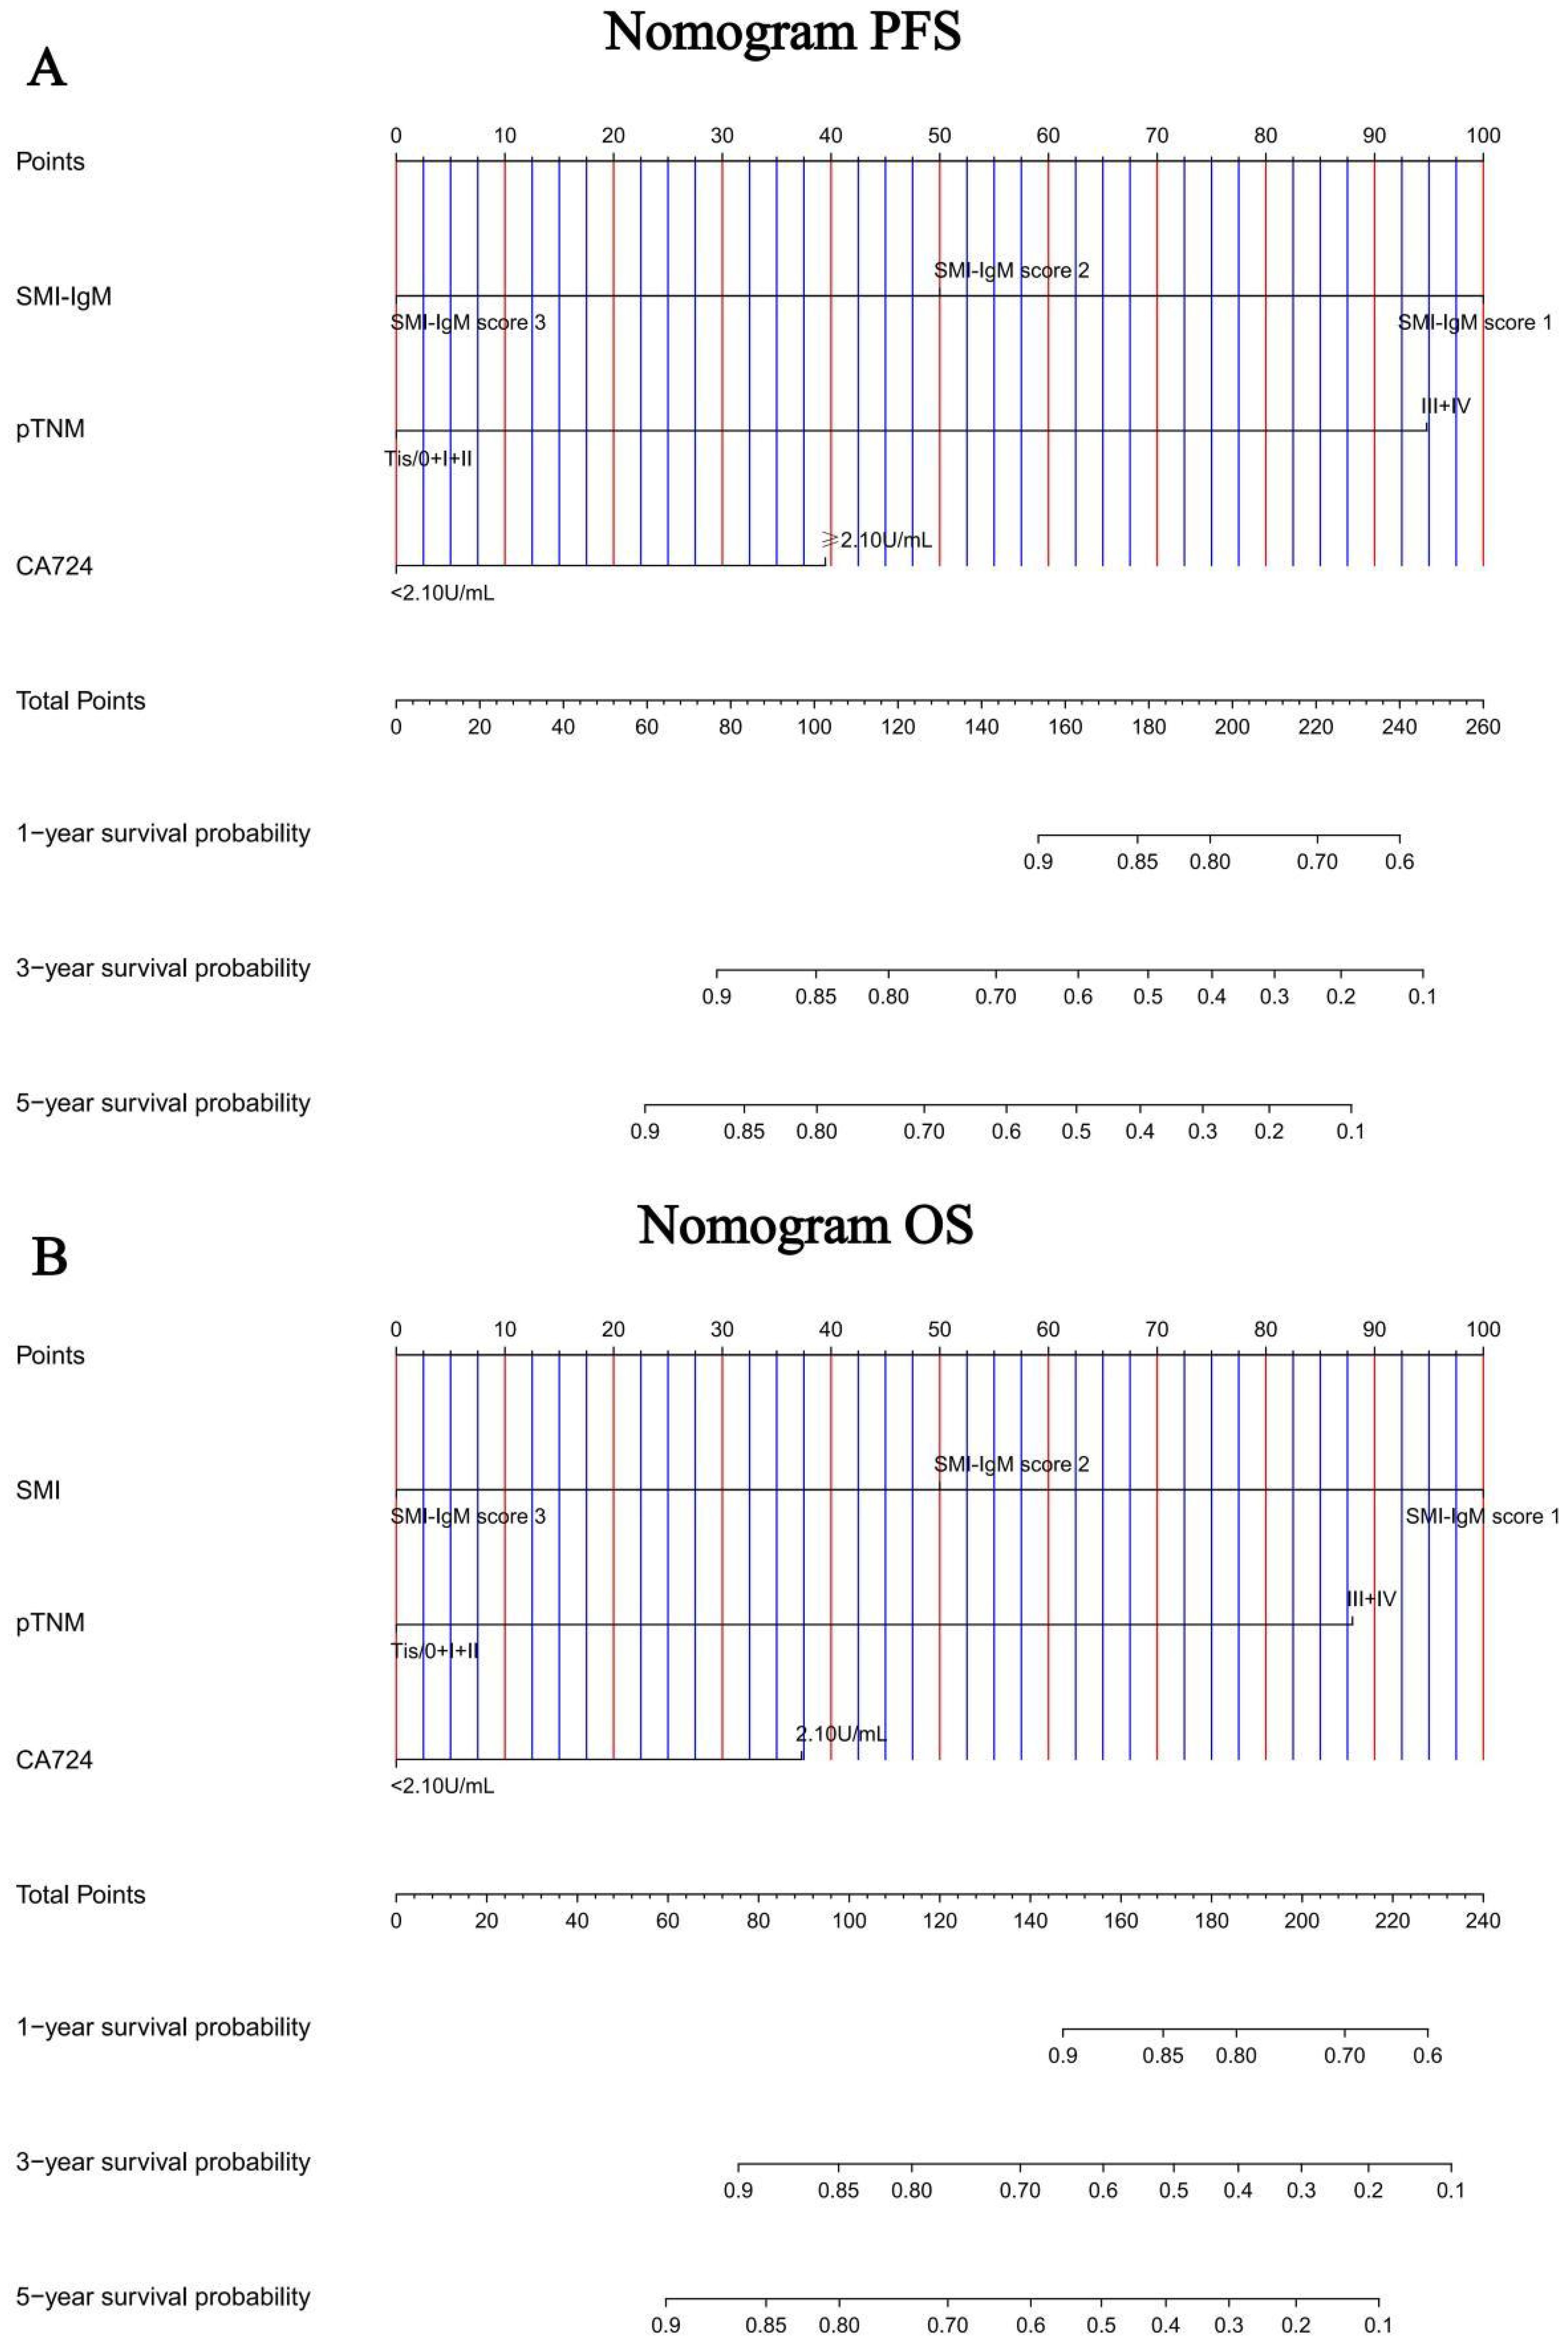
Figure 9. Nomogram for predicting 1-, 3-, 5-year survival probability of (A) PFS and (B) OS.
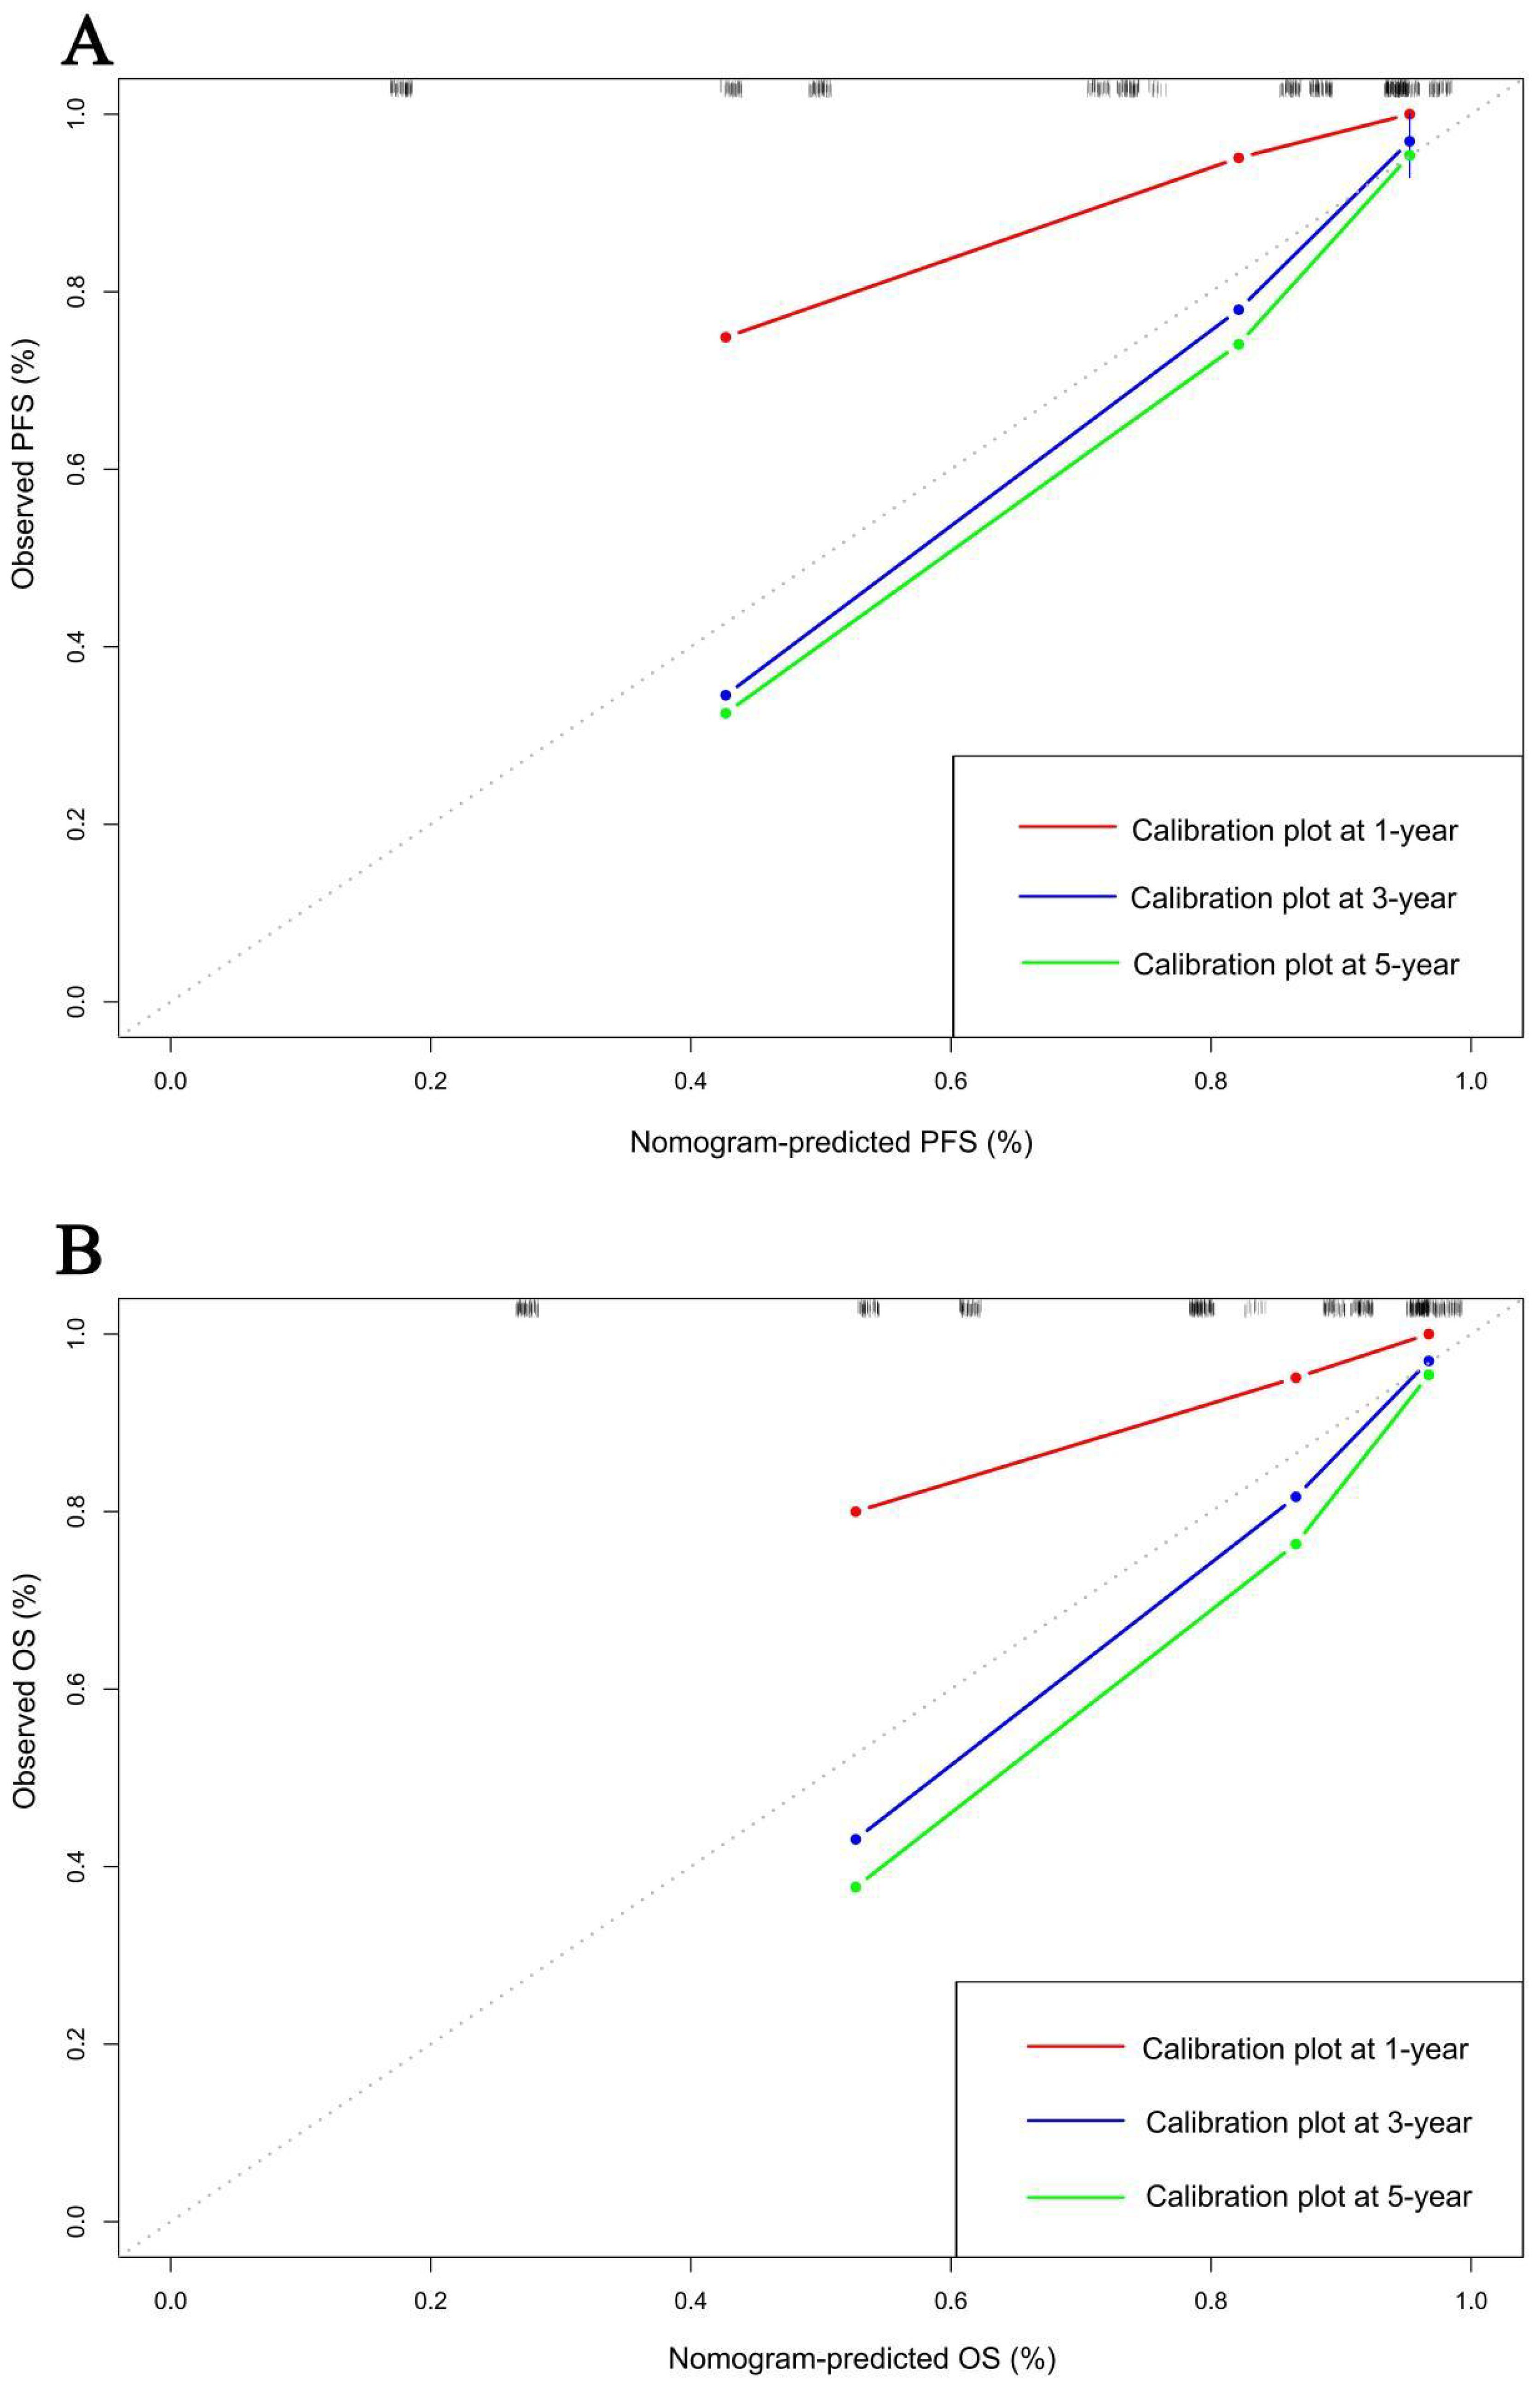
Figure 10. Calibration curves for predicting (A) PFS and (B) OS at 1-,3-, and 5-years.
Discussion
Our study is the first to assess the relationship between SMI-IgM score and the prognosis of patients who underwent surgery for gastric cancer. Our results showed that SMI-IgM score was an independent prognostic factor for PFS and OS in patients underwent radical gastric cancer surgery. In addition we found that pTNM stage and CA724 were an independent prognostic factor for PFS and OS. This study suggests that low SMI and low IgM are associated with a poorer prognosis for patients.
Gastric cancer is one of the most common malignant tumors in China, with the third highest incidence and mortality rates in China (26). Nowadays, there are various therapeutic methods for gastric cancer, including surgery, chemotherapy, immunotherapy, and so on (2, 27, 28). The survival rate of gastric cancer patients has been greatly improved, but there are still many patients with poor prognosis (29). Previous studies have shown that the prognosis of gastric cancer patients is related to the nutritional status and immune function of the organism (30–32).
Although a series of studies have shown that SMI and IgM can predict recurrent metastasis in gastric cancer (33, 34) and other malignancies (35–37). However, there are no articles that combine SMI and IgM to form the SMI-IgM score to predict progression in patients underwent surgery for gastric cancer. In our study, low SMI and low IgM were associated with poorer prognosis in patients with gastric cancer. The SMI-IgM score could predict the prognosis of patients with gastric cancer, which may be explained by the following mechanisms. SMI is an accurate indicator for assessing the nutritional status of the body in relation to sarcopenia. Elderly people and patients with malignant tumors are prone to reduced SMI, which is an important cause of frailty (functional limitations and physical disabilities), the extent of which affects the body’s immune function (38). Several studies have shown that muscle loss may lead to immune senescence. Skeletal muscle cells secrete large amounts of interleukin 15 (IL-15), which is important for natural killer (NK) cell development. NK cells have an important role in tumor killing (39, 40). Skeletal muscle loss may alter immune cell populations such as myeloid-derived suppressor cells via myocytokines (41, 42). Skeletal muscle loss can be affected by inflammation in the body (43). Cancer is a chronic inflammatory disease, and inflammatory cells such as neutrophils produced by the cancer stimulus can progress the tumor by invading adipose tissue and causing the body to become depleted of nutrients (44). IgM mainly reflects the state of the body’s recent immune response (45). Tumor-reactive IgM could clear tumor cells through complement fixation, induction of apoptosis and induction of secondary immune responses against neoantigens (46–48). Serum WT1–271 IgM antibodies exhibit high sensitivity for early-stage gastric cancer and can serve as a diagnostic marker for gastric cancer when combined with autoantibody screening, especially in the early stages (49). IgM SC-1 recognizes a tumor-specific carbohydrate epitope on decay-accelerating factor B (DAF; also known as CD55), which is selectively expressed on the membrane of gastric carcinoma cells, and induces apoptosis through receptor crosslinking both in vitro and in experimental in vivo models. IgM PAM-1 targets CFr-1 (cysteine-rich fibroblast growth factor receptor), and its binding inhibits growth factor receptor pathways such as EGFR and FGFR, which are frequently overexpressed in malignant cells, ultimately leading to cellular starvation and death (50, 51).
A study involving 1,516 patients showed that body mass index was negatively associated with IgM concentrations after adjusting for covariates (52). Moreover, gastric cancer patients who received immune-enhanced enteral nutrition showed significant increases in IgM, NK cell, and albumin levels (53, 54), indicating that IgM levels not only reflect recent immune responses but are also influenced by the patient’s current nutritional status and degree of obesity. However, IgM levels are also affected by non-cancer-related nutritional and immune conditions, such as infections caused by recent pathogens and autoimmune diseases. Therefore, its application in cancer research and clinical practice is limited (55). SMI reflects the long-term nutritional, immune, and inflammatory status of gastric cancer patients, whereas IgM is more closely associated with recent immune and nutritional conditions. Combining these two indicators allows for a multidimensional assessment of the patient’s physiological status during cancer progression, thereby providing a basis for prognosis evaluation and nutritional support therapy in gastric cancer patients. The coexistence of low SMI and low IgM (SMI-IgM score 1) may synergistically impair both nutritional and immune defense systems, leading to worse outcomes, while discordant cases (score 2) may reflect partial compensation. In our study, while pTNM stage and CA724 remained the strongest predictors, the SMI-IgM score provided complementary information reflecting the nutritional and immune status, which were not captured by tumor-based factors alone.
This study, while providing valuable insights, is not without its limitations. Firstly, it is imperative to acknowledge that this was a single-region, single-center retrospective investigation characterized by a relatively modest sample size, which may introduce inherent biases. Furthermore, the study exclusively focused on gastric cancer patients who had undergone surgical intervention, potentially limiting the generalizability of the findings. We acknowledge that results may differ in non-surgical or advanced-stage patients and emphasize that further studies are required to validate generalizability. Additionally, the determination of SMI and IgM cut-off values was reliant on ROC curves, and it is worth noting that these optimal cut-off values exhibited regional variations. Normalization or consensus-based cut-offs may improve reproducibility across populations. Because of the retrospective design of our study, detailed data regarding postoperative chemotherapy regimens, perioperative complications, and comorbidities were incomplete and therefore could not be reliably included in the multivariate analyses. Consequently, there is a compelling need for prospective clinical trials encompassing more extensive sample sizes and multiple geographical regions, involving diverse medical centers, to robustly validate these findings.
Conclusion
In our study, we found that SMI-IgM score was an independent predictor of PFS and OS. This novel index demonstrates efficacy in prognosticating the recurrence and metastasis risk in gastric cancer patients who subjected to surgical interventions. As elucidated, a lower SMI-IgM score aligns with a deteriorating prognosis, substantiating its utility as a novel predictive tool in the selection and management of gastric cancer patients underwent surgical interventions.
Data availability statement
The raw data supporting the conclusions of this article will be made available by the authors, without undue reservation.
Ethics statement
The studies involving humans were approved by ethics committee of Harbin Medical University Cancer Hospital. The studies were conducted in accordance with the local legislation and institutional requirements. The participants provided their written informed consent to participate in this study.
Author contributions
YXX: Writing – original draft, Writing – review & editing. YX: Writing – review & editing, Writing – original draft. ZD: Methodology, Writing – review & editing, Supervision. RZ: Writing – review & editing, Methodology, Supervision. GD: Writing – review & editing, Data curation, Investigation. HBS: Writing – review & editing, Investigation, Data curation. YWX: Writing – review & editing, Project administration, Funding acquisition. HJS: Writing – review & editing.
Funding
The author(s) declare financial support was received for the research and/or publication of this article. Clinical Research Foundation of Wu Jieping Medical Foundation (No: 320.6750.2022-07-13).
Conflict of interest
The authors declare that the research was conducted in the absence of any commercial or financial relationships that could be construed as a potential conflict of interest.
Generative AI statement
The author(s) declare that no Generative AI was used in the creation of this manuscript.
Any alternative text (alt text) provided alongside figures in this article has been generated by Frontiers with the support of artificial intelligence and reasonable efforts have been made to ensure accuracy, including review by the authors wherever possible. If you identify any issues, please contact us.
Publisher’s note
All claims expressed in this article are solely those of the authors and do not necessarily represent those of their affiliated organizations, or those of the publisher, the editors and the reviewers. Any product that may be evaluated in this article, or claim that may be made by its manufacturer, is not guaranteed or endorsed by the publisher.
References
1. Sung H, Ferlay J, Siegel RL, Laversanne M, Soerjomataram I, Jemal A, et al. Global cancer statistics 2020: GLOBOCAN estimates of incidence and mortality worldwide for 36 cancers in 185 countries. CA Cancer J Clin. (2021) 71:209–49. doi: 10.3322/caac.21660
2. Bang YJ, Kim YW, Yang HK, Chung HC, Park YK, Lee KH, et al. Adjuvant capecitabine and oxaliplatin for gastric cancer after D2 gastrectomy (CLASSIC): a phase 3 open-label, randomised controlled trial. Lancet. (2012) 379:315–21. doi: 10.1016/S0140-6736(11)61873-4
3. Pape M, Kuijper SC, Vissers PAJ, Ruurda JP, Neelis KJ, van Laarhoven HWM, et al. Conditional relative survival in nonmetastatic esophagogastric cancer between 2006 and 2020: A population-based study. Int J Cancer. (2023) 152:2503–11. doi: 10.1002/ijc.34480
4. Park SH, Hyung WJ, Yang HK, Park YK, Lee HJ, An JY, et al. Standard follow-up after curative surgery for advanced gastric cancer: secondary analysis of a multicentre randomized clinical trial (KLASS-02). Br J Surg. (2023) 110:449–55. doi: 10.1093/bjs/znad002
5. Hauser CA, Stockler MR, and Tattersall MHN. Prognostic factors in patients with recently diagnosed incurable cancer: a systematic review. Support Care Cancer. (2006) 14:999–1011. doi: 10.1007/s00520-006-0079-9
6. Fearon KCH. Cancer cachexia: developing multimodal therapy for a multidimensional problem. Eur J Cancer. (2008) 44:1124–32. doi: 10.1016/j.ejca.2008.02.033
8. Fearon K, Strasser F, Anker SD, Bosaeus I, Bruera E, Fainsinger RL, et al. Definition and classification of cancer cachexia: an international consensus. Lancet Oncol. (2011) 12:489–95. doi: 10.1016/S1470-2045(10)70218-7
9. Anker SD, Morley JE, and von Haehling S. Welcome to the ICD-10 code for sarcopenia. J Cachexia Sarcopenia Muscle. (2016) 7:512–4. doi: 10.1002/jcsm.12147
10. Cruz-Jentoft AJ and Sayer AA. Sarcopenia. Lancet. (2019) 393:2636–46. doi: 10.1016/S0140-6736(19)31138-9
11. Cruz-Jentoft AJ, Bahat G, Bauer J, Boirie Y, Bruyère O, Cederholm T, et al. Sarcopenia: revised European consensus on definition and diagnosis. Age Ageing. (2019) 48:16–31. doi: 10.1093/ageing/afy169
12. Pamoukdjian F, Bouillet T, Lévy V, Soussan M, Zelek L, and Paillaud E. Prevalence and predictive value of pre-therapeutic sarcopenia in cancer patients: A systematic review. Clin Nutr. (2018) 37:1101–13. doi: 10.1016/j.clnu.2017.07.010
13. Schneider M, Hübner M, Becce F, Koerfer J, Collinot JA, Demartines N, et al. Sarcopenia and major complications in patients undergoing oncologic colon surgery. J Cachexia Sarcopenia Muscle. (2021) 12:1757–63. doi: 10.1002/jcsm.12771
14. Rutten IJG, Ubachs J, Kruitwagen RFPM, van Dijk DPJ, Beets-Tan RGH, Massuger LF, et al. The influence of sarcopenia on survival and surgical complications in ovarian cancer patients undergoing primary debulking surgery. Eur J Surg Oncol. (2017) 43:717–24. doi: 10.1016/j.ejso.2016.12.016
15. Lu J, Zheng ZF, Li P, Xie JW, Wang JB, Lin JX, et al. A novel preoperative skeletal muscle measure as a predictor of postoperative complications, long-term survival and tumor recurrence for patients with gastric cancer after radical gastrectomy. Ann Surg Oncol. (2018) 25:439–48. doi: 10.1245/s10434-017-6269-5
16. Liu X, Ji W, Zheng K, Lu J, Li L, Cui J, et al. The correlation between skeletal muscle index of the L3 vertebral body and malnutrition in patients with advanced lung cancer. BMC Cancer. (2021) 21:1148. doi: 10.1186/s12885-021-08876-4
17. Derstine BA, Holcombe SA, Ross BE, Wang NC, Su GL, and Wang SC. Skeletal muscle cutoff values for sarcopenia diagnosis using T10 to L5 measurements in a healthy US population. Sci Rep. (2018) 8:11369. doi: 10.1038/s41598-018-29825-5
18. Fielding RA, Vellas B, Evans WJ, Bhasin S, Morley JE, Newman AB, et al. Sarcopenia: an undiagnosed condition in older adults. Current consensus definition: prevalence, etiology, and consequences. International working group on sarcopenia. J Am Med Dir Assoc. (2011) 12:249–56. doi: 10.1016/j.jamda.2011.01.003
19. Lu J, Xu BB, Zheng ZF, Xie JW, Wang JB, Lin JX, et al. CRP/prealbumin, a novel inflammatory index for predicting recurrence after radical resection in gastric cancer patients: post hoc analysis of a randomized phase III trial. Gastric Cancer. (2019) 22:536–45. doi: 10.1007/s10120-018-0892-0
20. Roney MSI, Lanagan C, Sheng YH, Lawler K, Schmidt C, Nguyen NT, et al. IgM and IgA augmented autoantibody signatures improve early-stage detection of colorectal cancer prior to nodal and distant spread. Clin Transl Immunol. (2021) 10:e1330. doi: 10.1002/cti2.1330
21. Fitzgerald S, O’Reilly JA, Wilson E, Joyce A, Farrell R, Kenny D, et al. Measurement of the igM and igG autoantibody immune responses in human serum has high predictive value for the presence of colorectal cancer. Clin Colorectal Cancer. (2019) 18:e53–60. doi: 10.1016/j.clcc.2018.09.009
22. Du Z, Sun H, Zhao R, Deng G, Pan H, Zuo Y, et al. Combined with prognostic nutritional index and IgM for predicting the clinical outcomes of gastric cancer patients who received surgery. Front Oncol. (2023) 13:1113428. doi: 10.3389/fonc.2023.1113428
23. Tan S, Zhuang Q, Zhang Z, Li S, Xu J, Wang J, et al. Postoperative loss of skeletal muscle mass predicts poor survival after gastric cancer surgery. Front Nutr. (2022) 9:794576. doi: 10.3389/fnut.2022.794576
24. Ding P, Yang P, Yang L, Sun C, Chen S, Li M, et al. Impact of skeletal muscle loss during conversion therapy on clinical outcomes in lavage cytology positive patients with gastric cancer. Front Oncol. (2022) 12:949511. doi: 10.3389/fonc.2022.949511
25. Kang Z, Cheng L, Li K, Shuai Y, Xue K, Zhong Y, et al. Correlation between L3 skeletal muscle index and prognosis of patients with stage IV gastric cancer. J Gastrointest Oncol. (2021) 12:2073–81. doi: 10.21037/jgo-21-556
26. Xia C, Dong X, Li H, Cao M, Sun D, He S, et al. Cancer statistics in China and United States, 2022: profiles, trends, and determinants. Chin Med J (Engl). (2022) 135:584–90. doi: 10.1097/CM9.0000000000002108
27. Bang YJ, Kim YW, Yang HK, Chung HC, Park YK, Lee KH, et al. Survival results of a randomised two-by-two factorial phase II trial comparing neoadjuvant chemotherapy with two and four courses of S-1 plus cisplatin (SC) and paclitaxel plus cisplatin (PC) followed by D2 gastrectomy for resectable advanced gastric cancer. Eur J Cancer. (2016) 62:103–11. doi: 10.1016/j.ejca.2016.04.012
28. Mahoney KM, Rennert PD, and Freeman GJ. Combination cancer immunotherapy and new immunomodulatory targets. Nat Rev Drug Discov. (2015) 14:561–84. doi: 10.1038/nrd4591
29. Mahoney KM, Rennert PD, and Freeman GJ. International variation in oesophageal and gastric cancer survival 2012-2014: differences by histological subtype and stage at diagnosis (an ICBP SURVMARK-2 population-based study). Gut. (2022) 71:1532–43. doi: 10.1136/gutjnl-2021-325266
30. Vidra N, Kontogianni MD, SChina E, and Gioulbasanis I. Detailed dietary assessment in patients with inoperable tumors: potential deficits for nutrition care plans. Nutr Cancer. (2016) 68:1131–9. doi: 10.1080/01635581.2016.1213867
31. Diakos CI, Charles KA, McMillan DC, and Clarke SJ. Cancer-related inflammation and treatment effectiveness. Lancet Oncol. (2014) 15:e493–503. doi: 10.1016/S1470-2045(14)70263-3
32. Garla P, Waitzberg DL, and Tesser A. Nutritional therapy in gastrointestinal cancers. Gastroenterol Clin North Am. (2018) 47:231–42. doi: 10.1016/j.gtc.2017.09.009
33. Garla P, Waitzberg DL, and Tesser A. Sarcopenia adversely impacts postoperative clinical outcomes following gastrectomy in patients with gastric cancer: A prospective study. Ann Surg Oncol. (2016) 47:231–42. doi: 10.1245/s10434-015-4887-3
34. Takagi A, et al. Serum carnitine as a biomarker of sarcopenia and nutritional status in preoperative gastrointestinal cancer patients. J Cachexia Sarcopenia Muscle. (2022) 13:287–95. doi: 10.1002/jcsm.12906
35. Dolan RD, Almasaudi AS, Dieu LB, Horgan PG, McSorley ST, and McMillan DC. The relationship between computed tomography-derived body composition, systemic inflammatory response, and survival in patients undergoing surgery for colorectal cancer. J Cachexia Sarcopenia Muscle. (2019) 10:111–22. doi: 10.1002/jcsm.12357
36. Dolan RD, Almasaudi AS, Dieu LB, Horgan PG, McSorley ST, McMillan DC, et al. The IMPACT study: early loss of skeletal muscle mass in advanced pancreatic cancer patients. J Cachexia Sarcopenia Muscle. (2019) 10:368–77. doi: 10.1002/jcsm.12368
37. Basile D, Parnofiello A, Vitale MG, Cortiula F, Gerratana L, Fanotto V, et al. Muscle loss during primary debulking surgery and chemotherapy predicts poor survival in advanced-stage ovarian cancer. J Cachexia Sarcopenia Muscle. (2020) 11:534–46. doi: 10.1002/jcsm.12524
38. Huang CY, Yang YC, Chen TC, Chen JR, Chen YJ, Wu MH, et al. Antibodies as biomarkers for cancer risk: a systematic review. Clin Exp Immunol. (2022) 209:46–63. doi: 10.1093/cei/uxac030
39. Elias R, Hartshorn K, Rahma O, Lin N, and Snyder-Cappione JE. Aging, immune senescence, and immunotherapy: A comprehensive review. Semin Oncol. (2018) 45:187–200. doi: 10.1053/j.seminoncol.2018.08.006
40. Pawelec G. Immunosenescence and cancer. Biogerontology. (2017) 18:717–21. doi: 10.1007/s10522-017-9682-z
42. Nagaraj S and Gabrilovich DI. Myeloid-derived suppressor cells in human cancer. Cancer J. (2010) 16:348–53. doi: 10.1097/PPO.0b013e3181eb3358
43. Nagaraj S and Gabrilovich DI. Blood CD33(+)HLA-DR(-) myeloid-derived suppressor cells are increased with age and a history of cancer. J Leukoc Biol. (2013) 93:633–7. doi: 10.1189/jlb.0912461
44. Verschoor CP, Johnstone J, Millar J, Dorrington MG, Habibagahi M, Lelic A, et al. Biomarkers in sarcopenia: A multifactorial approach. Exp Gerontol. (2016) 85:1–8. doi: 10.1016/j.exger.2016.09.007
45. Suzuki K. Chronic inflammation as an immunological abnormality and effectiveness of exercise. Biomolecules. (2019) 9:223. doi: 10.3390/biom9060223
46. Díaz-Zaragoza M, Hernández-Ávila R, Viedma-Rodríguez R, Arenas-Aranda D, and Ostoa-Saloma P. Natural and adaptive IgM antibodies in the recognition of tumor-associated antigens of breast cancer (Review). Oncol Rep. (2015) 34:1106–14. doi: 10.3892/or.2015.4095
47. Kaveri SV, Silverman GJ, and Bayry J. Natural IgM in immune equilibrium and harnessing their therapeutic potential. J Immunol. (2012) 188:939–45. doi: 10.4049/jimmunol.1102107
48. Kaveri SV, Silverman GJ, and Bayry J. Immune surveillance by natural igM is required for early neoantigen recognition and initiation of adaptive immunity. Am J Respir Cell Mol Biol. (2018) 59:580–91. doi: 10.1165/rcmb.2018-0159OC
49. Atif SM, Gibbings SL, Redente EF, Camp FA, Torres RM, Kedl RM, et al. Serum WT1–271 IgM antibody as a novel diagnostic marker for Gastric Cancer. Mol Clin Oncol. (2022) 16:74. doi: 10.3892/mco.2022.2507
50. Vollmers HP and Brändlein S. Natural IgM antibodies: from parias to parvenus. Histol Histopathol. (2006) 21:1355–66. doi: 10.14670/HH-21.1355
51. Pohle T, Brändlein S, Ruoff N, Müller-Hermelink HK, and Vollmers HP. Lipoptosis: tumor-specific cell death by antibody-induced intracellular lipid accumulation. Cancer Res. (2004) 64:3900–6. doi: 10.1158/0008-5472.CAN-03-3149
52. Pohle T, Brändlein S, Ruoff N, Müller-Hermelink HK, and Vollmers HP. Factors associated with serum IgM concentrations: a general adult population study. Scand J Clin Lab Invest. (2021) 81:454–60. doi: 10.1080/00365513.2021.1946843
53. Liu H, Ling W, Shen ZY, Jin X, and Cao H. Clinical application of immune-enhanced enteral nutrition in patients with advanced gastric cancer after total gastrectomy. J Dig Dis. (2012) 13:401–6. doi: 10.1111/j.1751-2980.2012.00596.x
54. Li K, Xu Y, Hu Y, Liu Y, Chen X, and Zhou Y. Effect of enteral immunonutrition on immune, inflammatory markers and nutritional status in gastric cancer patients undergoing gastrectomy: A randomized double-blinded controlled trial. J Invest Surg. (2020) 33:950–9. doi: 10.1080/08941939.2019.1569736
Keywords: skeletal muscle index, IgM, gastric cancer, surgery, prognosis
Citation: Xu Y, Xing Y, Du Z, Zhao R, Deng G, Song H, Xue Y and Song H (2025) Skeletal muscle index combined with IgM predicts prognosis in gastric cancer patients who underwent surgery. Front. Immunol. 16:1633926. doi: 10.3389/fimmu.2025.1633926
Received: 11 June 2025; Accepted: 10 November 2025; Revised: 19 October 2025;
Published: 21 November 2025.
Edited by:
Khyati Maulik Kariya, Massachusetts General Hospital and Harvard Medical School, United StatesReviewed by:
Pratima Saini, Northwestern Medicine, United StatesSubir Kapuria, Children’s Hospital Los Angeles, United States
Copyright © 2025 Xu, Xing, Du, Zhao, Deng, Song, Xue and Song. This is an open-access article distributed under the terms of the Creative Commons Attribution License (CC BY). The use, distribution or reproduction in other forums is permitted, provided the original author(s) and the copyright owner(s) are credited and that the original publication in this journal is cited, in accordance with accepted academic practice. No use, distribution or reproduction is permitted which does not comply with these terms.
*Correspondence: Hongjiang Song, NjAwOTExQGhyYm11LmVkdS5jbg==
†These authors have contributed equally to this work
‡ORCID: Yunxin Xu, orcid.org/0009-0008-7829-4949