 Mari Kaarbø1*
 Mingyi Yang1
 Malin Holm Meyer-Myklestad1,2
 Arvind Y. M. Sundaram3
 Mirta Mittelstedt Leal de Sousa4Animesh Sharma4,5
 Asle W. Medhus6,7
 Anne Margarita Dyrhol-Riise2,7
 Dag Kvale2,7
 Johannes R. Hov7,8,9
 Pål Aukrust7,9,10Magnar Bjørås1,4,11*†
 Dag Henrik Reikvam2,7†
- 1Department of Microbiology, Oslo University Hospital, Oslo, Norway
- 2Department of Infectious Diseases, Oslo University Hospital, Oslo, Norway
- 3Department of Medical Genetics, Oslo University Hospital and University of Oslo, Oslo, Norway
- 4Department of Clinical and Molecular Medicine, Norwegian University of Science and Technology, Trondheim, Norway
- 5Proteomics and Modomics Experimental Core Facility at Norwegian University of Science and Technology, and the Central Norway Regional Health Authority, Trondheim, Norway
- 6Department of Gastroenterology, Oslo University Hospital, Oslo, Norway
- 7Institute for Clinical Medicine, University of Oslo, Oslo, Norway
- 8Norwegian PSC Research Centre and Section of Gastroenterology, Department of Transplantation Medicine, Oslo University Hospital, Oslo, Norway
- 9Research Institute of Internal Medicine, Division of Surgery, Inflammatory Diseases and Transplantation, Oslo University Hospital, Oslo, Norway
- 10Section of Clinical Immunology and Infectious Diseases, Oslo University Hospital, Oslo, Norway
- 11Centre for Embryology and Healthy Development, University of Oslo and Oslo University Hospital, Oslo, Norway
Background: People living with HIV are called immunological non-responders (INR) when their CD4+ T cell count is not restored to immunocompetent levels, despite successful viral suppression. INR have increased risk of progression to AIDS, non-AIDS related morbidity, and death. Impaired mucosal barrier function is a prevailing hypothesis for why INR among people with HIV (PWH) have persistently low CD4+ T cell counts.
Objective: To understand the molecular mechanisms behind incomplete immune recovery in INR, we analyzed gene regulation and protein expression in gut tissues from INR, immunological responders (IR) and healthy controls (HC).
Methods: The transcriptome was assessed by RNA-sequencing (RNA-seq) and the proteome was examined using shotgun proteomic mass spectrometry in mucosal biopsies from the sigmoid colon and terminal ileum.
Results: In INR compared to IR, we identified 3326 differentially expressed genes (DEGs) in the colon while no DEGs were observed in the ileum. Gene ontology (GO) analyses revealed that the DEGs in colon of INR, compared to IR, predominantly involved pathways related to immune response, metabolism, and cellular processes. Notably, GO analysis highlighted downregulation of genes associated with B cell-mediated immunity and adaptive responses in INR. Deconvolution analysis indicated that these transcriptomic changes were not solely due to shifts in immune cell composition. Proteomic analysis supported these findings, showing more differential protein composition between INR and IR in colon than ileum. These proteins are associated with the regulation of adaptive immune signaling and essential cellular processes, including cell signaling, tissue repair, and growth, all of which are characteristic features of inflammatory bowel disease (IBD).
Conclusion: Our findings suggest that incomplete immune recovery during anti-retroviral therapy in PWH is associated with specific dysregulations in the molecular environment of the sigmoid colon, which may share mechanisms with IBD. The identified macromolecules may serve as potential targets for adjuvant treatment to improve the prognosis for INR.
1 Introduction
Human immunodeficiency virus (HIV) infection affects more than 40 million people worldwide (1). During the last decades, the introduction of antiretroviral treatment (ART) has dramatically improved the prognosis for people with HIV (PWH). ART suppresses viral replication efficiently and allows the immune system to recover over time for the majority of PWH. However, in 10 to 15% of PWH, efficient treatment with persistent viral suppression fails to restore the level of CD4+ T cells (2, 3). This group is termed immunological non-responders (INR), and their impaired immunological response is associated with an increased risk of progression to AIDS and non-AIDS related morbidity and mortality (4–7). INR also show signs of increased and persistent inflammation and immune activation compared to immune responders (IR) who have normal CD4+ T cell counts. The molecular causes underlying the INR phenotype remain elusive (8–12).
The gastrointestinal (GI) tract is the largest lymphoid organ of the human body and plays an important role in HIV persistence and viral replication (13, 14). During acute HIV infection, the gut suffers a dramatic destruction of mucosal CD4+ T cells, including the T helper (Th)17 and Th22 subsets, which both are essential to support the gut epithelium (13). As a result, untreated HIV infection leads to disruption of the gut mucosal barrier allowing translocation of luminal microbial products that subsequently promote immune activation and inflammation not only in the GI tract but also systemically (13). Thus, gut mucosal barrier dysfunction may contribute to inadequate immunological response to ART and the INR phenotype (15).
We have shown that INR have signs of increased enterocyte damage and mucosal immune dysfunction in gut biopsies as compared to IR (16, 17). Importantly, in gut mucosal biopsies, INR had a lower fraction of CD4+ T cells and a higher fraction of Th22 cells compared to IR, which were restricted to the sigmoid colon (colon) compared with terminal ileum (ileum) (16). Additionally, levels of the enterocyte damage marker intestinal fatty acid binding protein were elevated in INR compared to IR. Furthermore, regenerating islet-derived protein 3 alpha (REG3α), a novel marker of enterocyte damage, also showed a tendency to be higher in INR than in IR (16). To gain a deeper insight into mucosal dysregulation in INR and to identify potential molecular targets for adjuvant treatment, we performed untargeted transcriptome and proteome analyses in the sigmoid colon and terminal ileum of INR, IR, and healthy control (HC) groups in this study.
2 Materials and methods
2.1 Participant and study design
The participants and study design have previously been presented (16). PWH were recruited from the outpatient clinic of the Department of Infectious Diseases, Oslo University Hospital. INR were defined as < 400 CD4+ T cells/µL and IR as having > 600 CD4+ T cells/ µL for longer than 3.5 years. All INR (n=4 for RNA-seq and n=5 for proteomics) and IR (n=5, RNA-seq and proteomics) included were male, on continuous efficient ART for > 4 years, < 50 HIV RNA copies/ml plasma > 3.5 years, and the groups were matched on nadir CD4 count (before initiating ART) and age. Men without HIV referred to colonoscopy for control after polyp removal and age-matched with INR and IR, were enrolled as healthy controls (HC, n=5 for RNA-seq and proteomics). The characteristics of the study group are presented in Table 1.

Table 1. Characteristics of study participants used for transcriptomic (RNA-sequencing) (A) and proteomic (mass spec) (B) studies.
2.2 Sample collection
Single pinch biopsies were obtained from the terminal ileum and the sigmoid colon by colonoscopy as previously described (16). The biopsies were either preserved in RNAlater (Thermo Fisher Scientific, Waltham, MA, USA) at -20°C for transcriptome analyses (RNA-sequencing) or snap frozen in 1.5 mL tubes in liquid nitrogen and stored at -80°C for proteome analyses by liquid chromatography–mass spectrometry (LS-MS/MS).
2.3 RNA-sequencing (RNA-seq)
2.3.1 Sample preparation for RNA-seq
Total RNA was isolated from biopsies stored in RNA later using Allprep DNA/RNA Mini kit (Qiagen, Hilden, Germany) according to the manufacturer’s instructions with a few modifications as described in (18). The samples were lysed in RLT buffer with β-mercaptoethanol and homogenized using 0.1 mm zirconia steel beads (BioSpec Products, Bartlesville, OK, USA) and 5 mm stainless steel beads (Qiagen, Hilden, Germany) in a MiniBeadBeater (BioSpec Products, Bartlesville, OK). The RNA was treated with DNAse on the column for 15 minutes and eluted in molecular grade H20 and stored at - 80°C. The quantity and quality were measured using Nanodrop (Thermo Fisher Scientific, Waltham, MA) and Tapestation (Agilent Technologies, Santa Clara, CA), respectively.
2.3.2 RNA-seq
Total RNA samples (RIN > 6.3) were used for directional library preparation (Illumina mRNA stranded prep kit, San Diego, CA) using polyA selection and were sequenced on five lanes in Illumina HiSeq, 150 bp paired end (Illumina, San Diego, CA). Additional details can be found in the supplementary methods section. A table of differentially expressed genes (DEGs) is available in Supplementary Table S1.
2.3.3 Deconvolution analyses for estimating immune cell proportions from RNA-seq data
To estimate the proportions of immune cell subsets from RNA-seq data, we conducted deconvolution analysis using the R package “granulator” (19). Within this package, we employed the quadratic programming with non-negative least-squares constraints linear model (qprogwc), as described in (19, 20). We utilized the “sigMatrix_ABIS_S0” reference dataset, which contains transcription levels of 1,200 genes across 17 immune cell types derived from single-cell RNA-seq data, to accurately represent the various immune cell populations. The normalized mRNA counts (TPM, transcripts per million) from our RNA-seq dataset served as input for predicting the proportions of different cell subsets.
2.3.4 Gene set enrichment analysis on gene ontology (GSEA on GO) terms
GSEA was performed to explore the enrichment in gene ontology (GO) terms (biological process, molecular function and cellular component) by comparing transcription profile between conditions, using the complete list DEGs as input, ranking them based on expression level and calculation of enrichment score with GSEA tool implemented in R package clusterProfile (21, 22).
2.4 Liquid chromatography–tandem mass spectrometry (LC-MS/MS)
2.4.1 Sample preparation
The total proteomes of biopsies (n=5 per group) from sigmoid colon and terminal ileum were analyzed. Total protein was isolated from snap-frozen biopsies using Allprep DNA, RNA and protein kit (Qiagen, Hilden, Germany) according to the manufacturer’s instructions with a few modifications: the samples were lysed in RLT buffer with β-mercaptoethanol and homogenized using a QIAshredder (Qiagen, Hilden, Germany). The protein fraction was precipitated, washed in 70% ethanol, dried and stored at -80°C. The peptide concentration was measured in a NanoDrop One C (Thermo Fisher Scientific, Waltham, MA) at 205 nm, Scopes’ method (23). For detailed preparation method for LC-MS/MS, please refer to the Supplementary Material and Methods.
2.4.2 Shotgun proteomic analysis
Protein analyses were performed on a LC-MS/MS platform consisting of an EASY-nLC 1200 UHPLC system coupled to a Q Exactive HF mass spectrometer operating in FullMS-ddMS2 mode (Thermo Fisher Scientific, Waltham, MA). Protein concentrations were quantified by processing MS data using MaxQuant (MQ) v.1.6.6.0 (24). The protein data were further analyzed using an R DEP package (Differential Enrichment analysis of Proteomics data, Version 1.12.0) by which the DEPs were identified using the protein-wise linear model (limma package inside DEP) combined with empirical Bayes statistics. DEPs were defined by adj p-value < 0.05, according to the Benjamini-Hochberg Method (25). GO and Kyoto Encyclopedia of Genes and Genomes (KEGG) pathway enrichment analyses were performed using R package clusterProfile (3.18.1). The data were visualized using R packages including ggplot2 and VennDetail. The detailed method is included in Supplementary Material and Material. The mass spectrometry proteomics data have been deposited to the ProteomeXchange Consortium via the PRIDE (26) partner repository with the dataset identifier PXD041255. A table of differentially expressed proteins (DEPs) is available in Supplementary Table S2.
ImmuneSigDB (Immune Signatures Database) was used in conjunction with the GSEA (Gene Set Enrichment Analysis) software to map the differentially expressed proteins in sigmoid colon.
2.5 Integrative transcriptomic and proteomic analysis
To integrate the transcriptomic and proteomic datasets from colonic biopsies, we performed a multi-step correlation analysis to identify and characterize concordant molecular features between immunological non-responders (INR) and immunological responders (IR). We compared the DEGs and DEPs lists to identify genes that were significantly dysregulated in both the transcript and protein levels. We then constructed a gene–protein correlation network using the overlapping genes. In this network, node sizes reflected the product of the absolute log2 fold changes from RNA and protein data, while edge weights indicated the strength of correlation between RNA and protein expression levels. To quantify these relationships, we performed correlation analysis using scatterplots of log2 fold change values for each overlapping gene and calculated Pearson correlation coefficients (by R built-in function “cor”) to assess the degree of concordance. To create a network plot, the correlation matrix was filtered by coefficient R > 0.5, then further converted into graph matrix by R package igraph using function “graph_from_adjacency_matrix” (parameter weighted = True, mode = “undirected”), further converted as network object by R package Intergraph. The network plot was created from network object using ggplot2 package. Functional annotation of the overlapping genes was carried out using public gene annotation databases, including UniProt, Gene Ontology (GO), and GeneCards, with an emphasis on immune signaling, translational regulation, and mucosal barrier function (by R package clusterProfile and AnnotationDbi). Finally, we performed unsupervised hierarchical clustering based on the integrated RNA and protein expression levels of the overlapping genes (R package p heatmap). Clustering was done using Euclidean distance and complete linkage to assess whether these features could stratify INR and IR samples.
2.6 Statistical analyses
A modified t-test (Wald test) was used in statistical p value analysis for the RNA-seq data. DEGs were defined as adjusted p-value < 0.05. Analyses of DEPs for the proteomics data were performed using Empirical Bayes statistics test. For both RNA-seq and proteomics analyses, the adjusted p-value was used to decrease the false discovery rate (25). The Chi-square test was used to compare regulation in sigmoid colon and terminal ileum (27). For comparisons between paired groups (e.g., INR versus IR within subjects), paired two-tailed t-test was used, while one-way ANOVA was applied to assess differences across more than two paired groups for the deconvolution assay. Gene Ontology (GO) term enrichment was carried out with clusterProfiler, using FDR (adjusted p-value). The correlation between RNA and protein expression levels was assessed by Pearson correlation coefficient. A p-value < 0.05 or adjusted p-value < 0.05 was considered statistically significant throughout.
3 Results
3.1 INR exhibit distinct RNA regulation compared to IR exclusively in the sigmoid colon
RNA-seq was performed on endoscopic pinch biopsies of gut mucosa from INR, IR and HC to examine transcriptome regulation in the sigmoid colon and terminal ileum. The participant characteristics are outlined in Table 1. Differential gene expression analysis, performed using negative binomial GLM fitting and Wald tests, revealed significantly higher expression differences in the sigmoid colon compared to the terminal ileum (p < 0.0001) (Figures 1A, B). In the colon, we identified 3326 DEGs when comparing INR to IR, and 202 DEGs when comparing INR to HC (Figure 1A). Strikingly, although both INR and IR showed several differences compared with HC (364 and 991 DEGs, respectively) in the TI, there was no difference in the transcriptome between INR and IR in this compartment (Figure 1B).

Figure 1. Transcriptional regulation in immunological non-responders, immunological responders and healthy controls in (A) sigmoid colon and (B) terminal ileum. Venn diagrams illustrating numbers of uniquely and commonly differentially expressed transcripts (p adj < 0.05) in INR (n=4), IR (n=5) and HC (n=5). Total RNA was isolated from gut mucosal endoscopic pinch biopsies and transcriptomic analyses were performed by RNA-sequencing. Modified t-test (Wald test) was used to identify differential expression (p adj < 0.05). The Chi-square test was used to calculate the difference in expression between the two tissues (p < 0.0001). INR, immunological non-responders; IR, immunological responders; HC, healthy controls.
3.1.1 Dysregulation of transcripts related to metabolism, immune response, and stimulus reactivity in the sigmoid colon of INR
In sigmoid colon, 2579 mRNAs were downregulated in INR compared to IR while 747 were upregulated. Among these 3326 DEGs, 1471 DEGs had two-fold change or more (p adj < 0.05) (Figure 2A). GO analyses of DEGs with two-fold change or more in INR versus IR showed that these transcripts were implicated in critical processes such as protein metabolism, regulation of stimulus and immune responses signal transduction, defense responses, and cell adhesion (Figure 2B), GO analyses of the 747 mRNAs that were significantly upregulated in INR compared to IR (p adj < 0.05, Figure 2C) indicated involvement in cellular processes such as regulation of RNA (ncRNA, RNA metabolism and localization) and protein regulation (localization to organelle and telomere and protein folding).
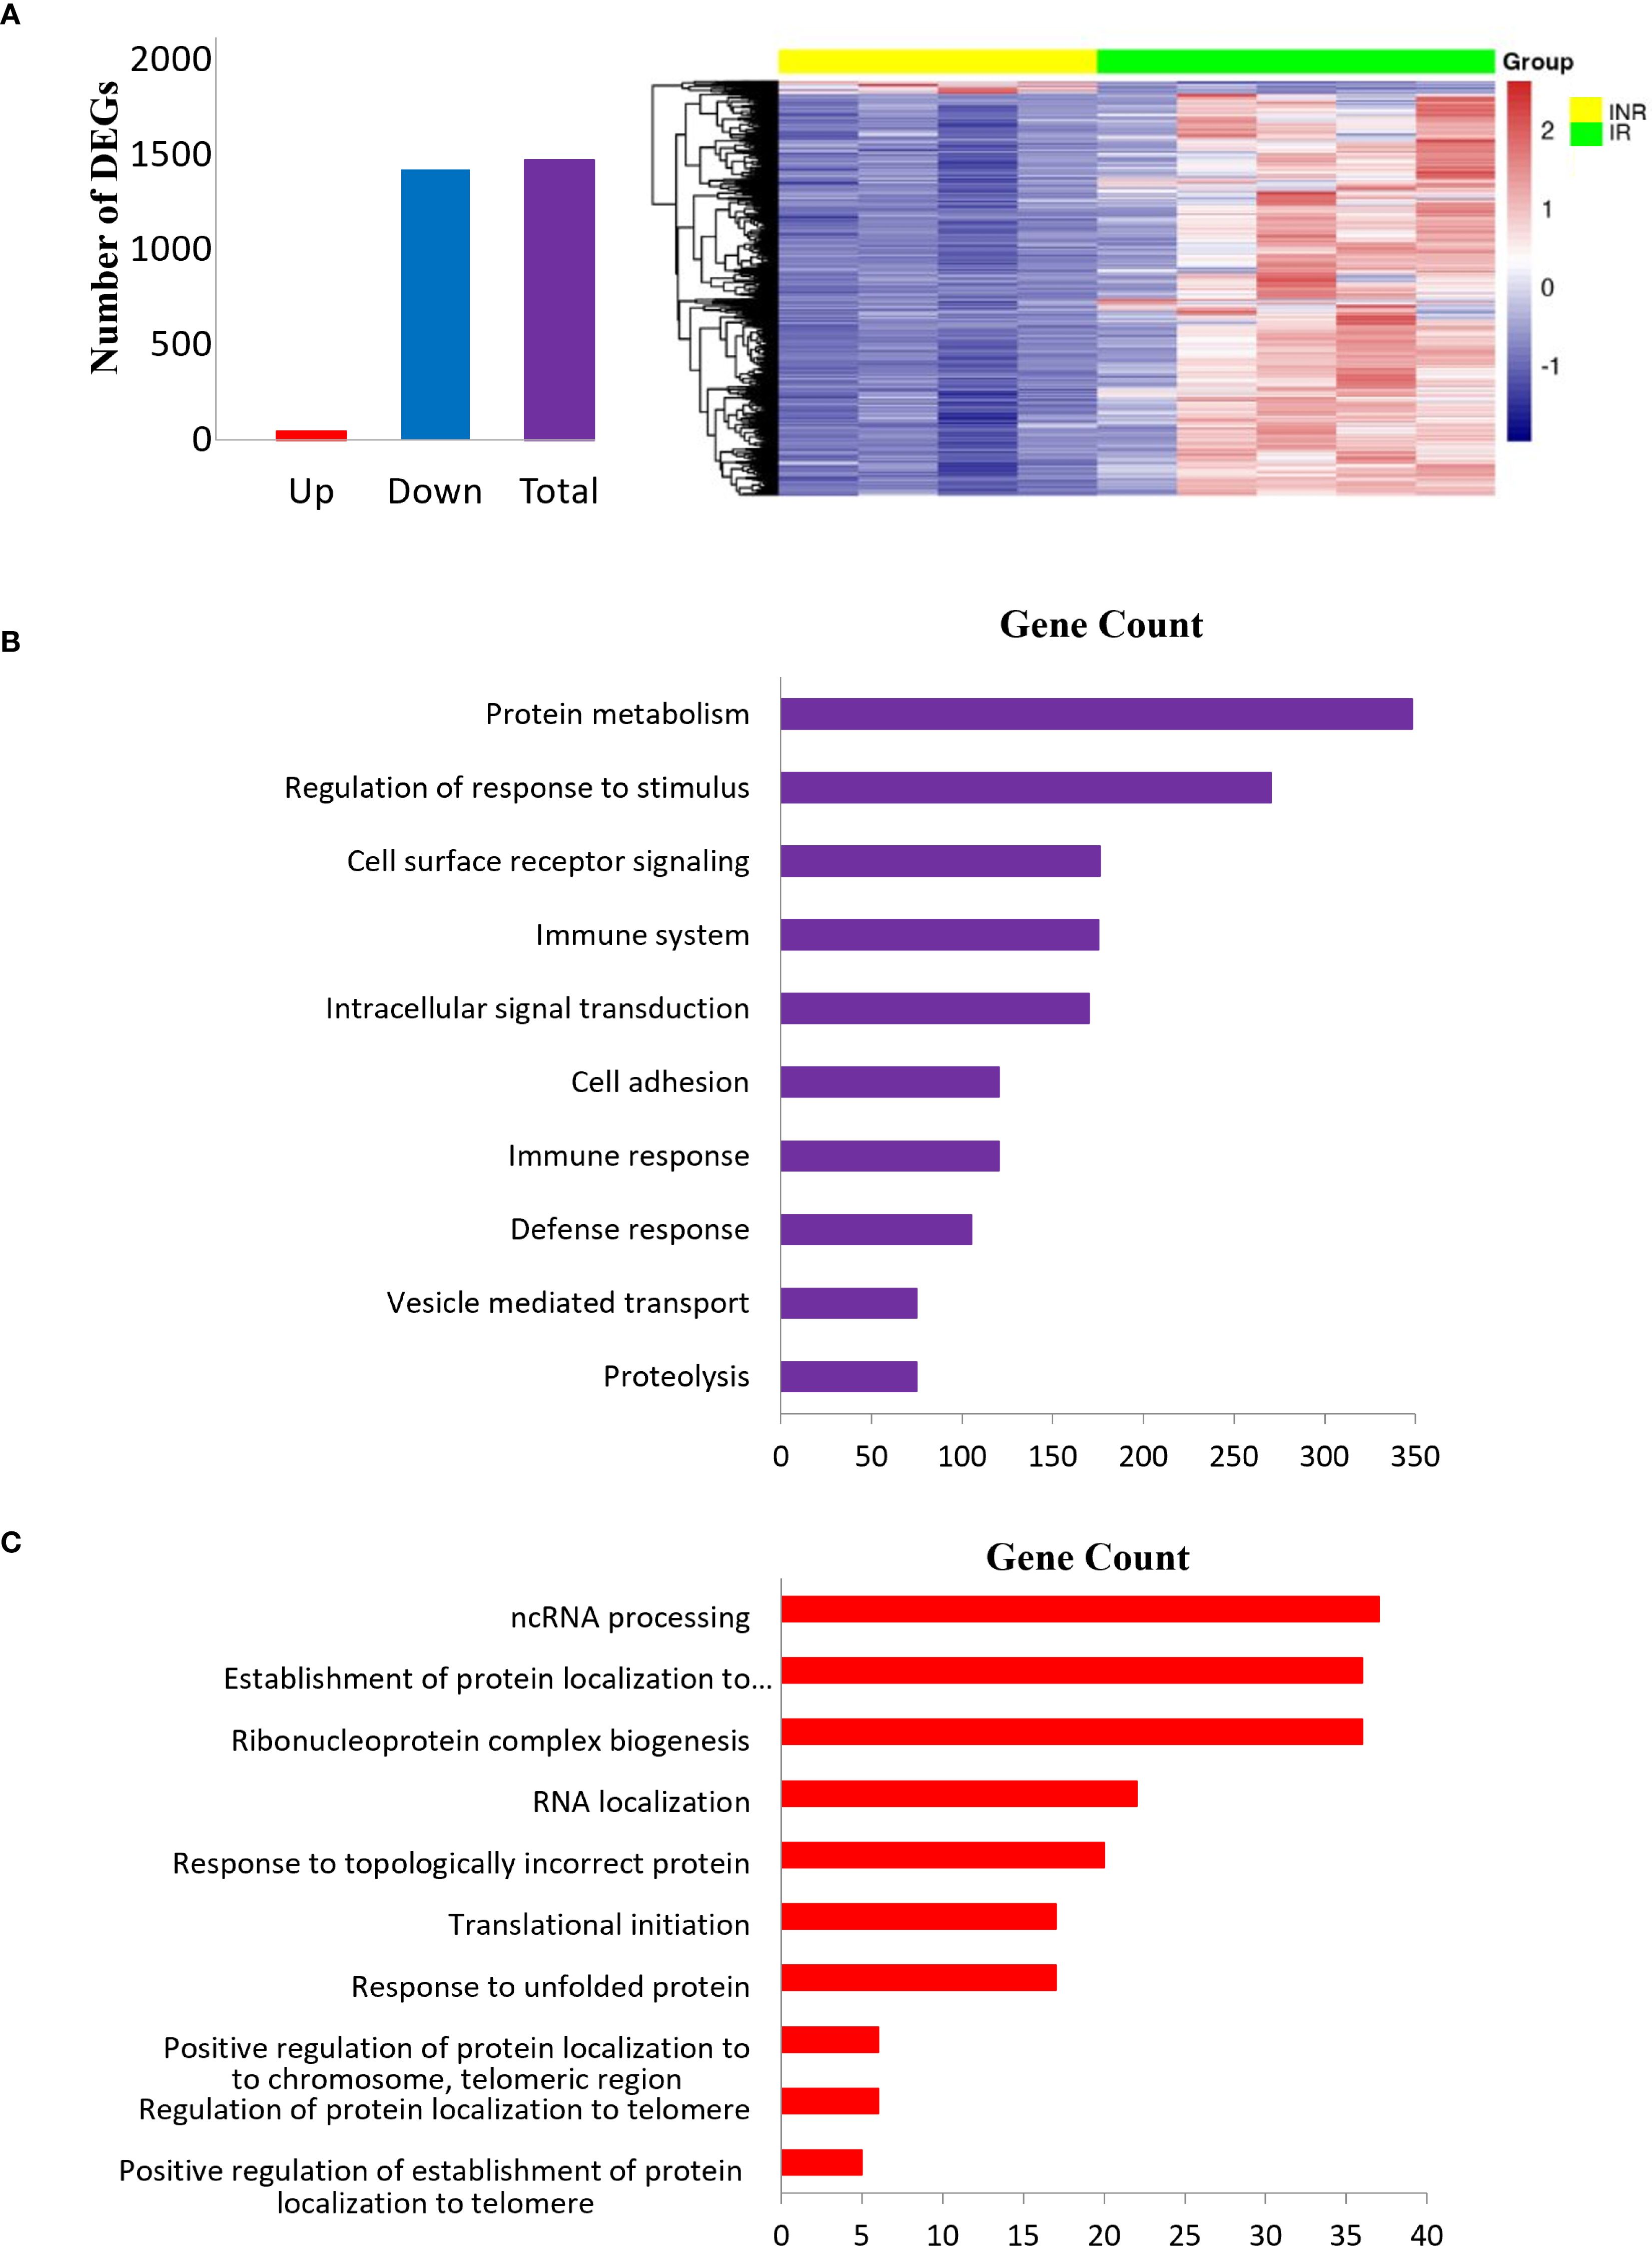
Figure 2. Differentially expressed transcripts in INR compared to IR in sigmoid colon. (A) Bar plot (left) and heatmap (right) showing top DEGs with fold change >2 and adjusted p < 0.05 in INR versus IR in the colon. The heatmap displays Z-scores, where positive values indicate expression above the mean across all samples, and negative values indicate expression below the mean. (B) Gene ontology enrichment analyses of DEGs with two-fold or greater regulation in INR versus IR in the colon. The pathways (y-axis) are ranked by enrichment (x-axis); (C) Gene ontology analysis of upregulated DEGs in INR versus IR in the colon. The canonical pathways (y-axis) are ranked by enrichment (x-axis). Modified t-test (Wald test) was used to identify differential expression (p adj < 0.05). INR, immunological non-responders; IR, immunological responders; HC, healthy controls; DEGs, Differentially expressed genes.
Several of the mRNAs significantly dysregulated in the colonic tissue of INR (adjusted p < 0.05) have been previously implicated in HIV pathogenesis and are linked to diverse biological pathways. HIV entry was associated with cluster of differentiation 4 (CD4, log2fold -0.678), the primary receptor for viral attachment and internalization (2, 3, 28, 29). Immune response modulation was linked to multiple molecules, including Chemokine (C-X-C motif) ligand 1 (CXCL1, also known as GRO-α, log2fold 1.225), which has been shown to enhance HIV replication (30–32); Interleukin-21 Receptor (IL21R, log2fold -1.899), important for T cell and B cell function (33); Transforming Growth Factor Beta 1 (TGFB1, log2fold -1.028), known to regulate immune activation (34); and Human Leukocyte Antigen E (HLA-E, log2fold -0.594), involved in immune evasion and NK cell regulation (35, 36). T cell activation and function were associated with Tyrosine Phosphatase Non-Receptor Type 22 (PTPN22, log2fold 0.697), which modulates T cell receptor (TCR) signaling (37), and Granzyme A (GZMA, log2fold 0.764), a key effector in cytotoxic lymphocytes (38). Immune signaling pathways included Mitogen-Activated Protein Kinase Kinase Kinase 5 (MAP3K5, log2fold 0.521), also known as ASK1, which regulates stress-induced apoptosis and interacts with multiple HIV proteins (39–41). Lastly, MHC class II regulation was linked to the Class II Major Histocompatibility Complex Transactivator (CIITA, log2fold -1.138), a master regulator of antigen presentation, which also plays a complex role in HIV pathogenesis (42–44).
When comparing INR to both IR and HC, the majority of the common transcripts were downregulated in INR (Supplementary Figure S1A) and typically involved in protein transport, metabolism and cellular localization (Supplementary Figure S1B).
3.1.2 Downregulation of transcripts associated with B cell-mediated immunity in the sigmoid colon of INR
To further investigate the immune pathways underlying the dysregulation observed in colon of INR, we performed Gene Set Enrichment Analysis (GSEA) using the Gene Ontology (GO) database, ranking all genes based on transcript levels derived from RNA-seq data (Figure 3). When comparing the colon of INR with IR, there was significant downregulation in several key immune processes related to the adaptive immune response (Figures 3A, D). Specifically, we observed reduced expression in pathways involved in B-cell mediated immunity, antigen binding, and the immunoglobulin mediated immune response. These findings are visually summarized in Figure 3D, highlighting the downregulated factors in INR compared to IR including several transcripts related Ig components (e.g. Immunoglobulin Kappa Variable Cluster, IKGVs) and B cell stimulating cytokines (e.g. interleukin (IL)-4 and IL-10). In contrast, pathways involved in the adaptive immune response were upregulated in IR compared to HC (Figure 3C). Interestingly, genes within the immunoglobulin complex showed a positive enrichment score (upregulated) in IR compared to HC but were downregulated in INR compared to IR (Figure 3A). When analyzing the comparison between INR and HC, no significant changes in this gene ontology (GO) term were found (Figure 3B), suggesting that immunoglobulin complex genes are specifically upregulated in IR but not in INR relative to healthy controls.
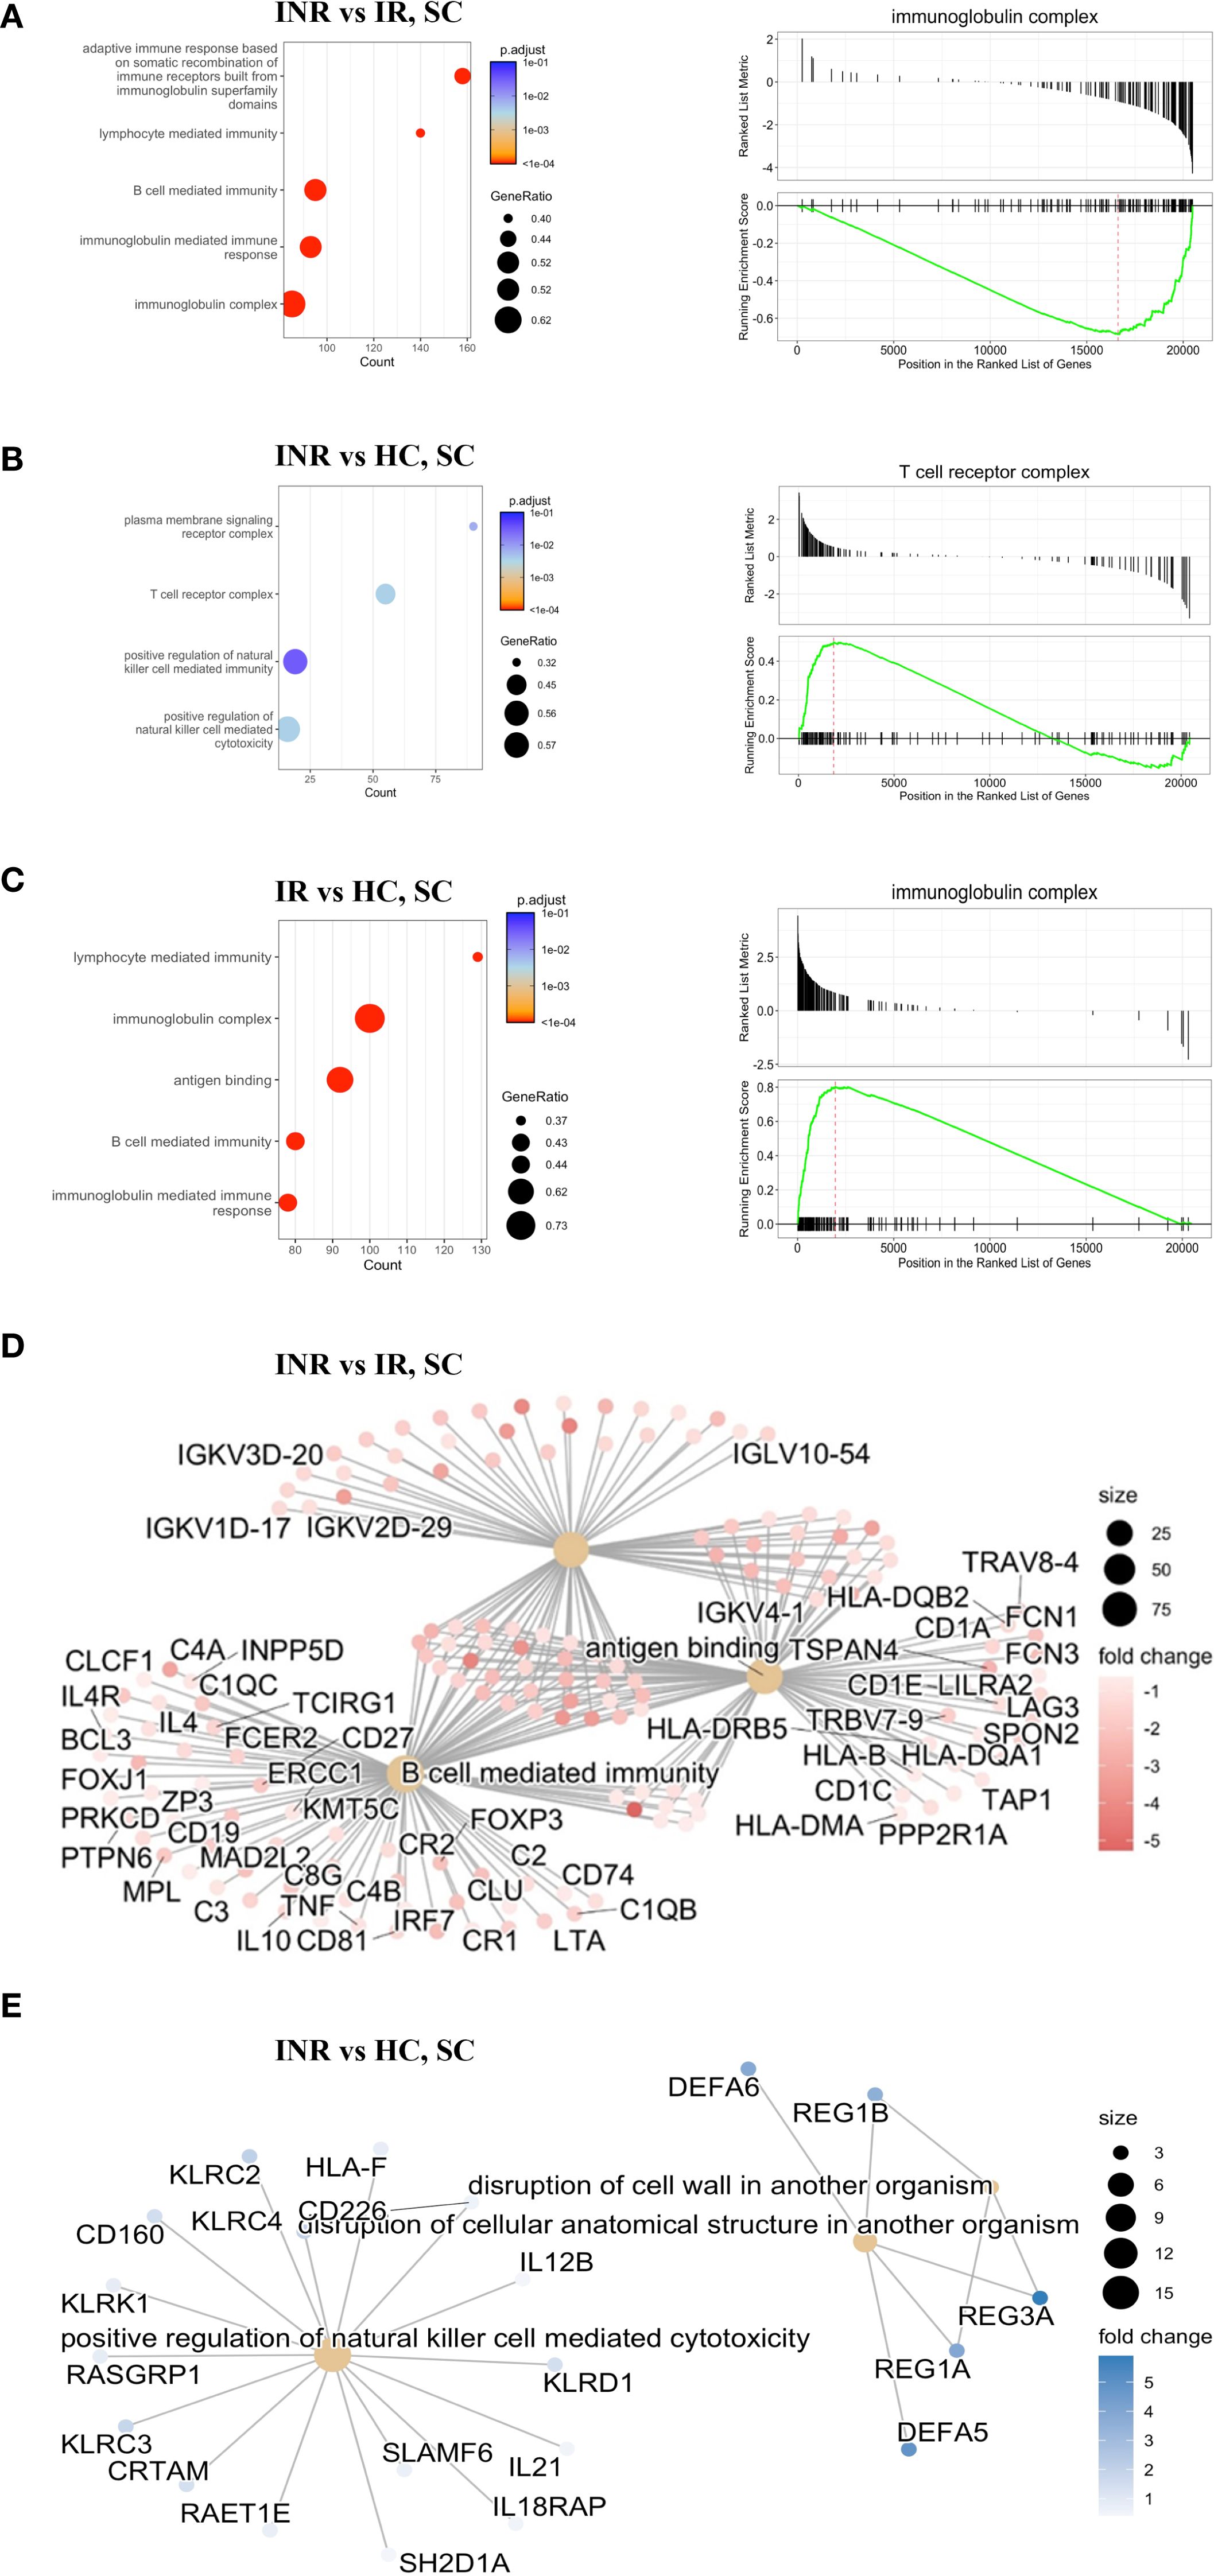
Figure 3. Gene Set Enrichment Analysis (GSEA) by Gene Ontology from RNA-seq data (A) Top five enriched GO terms (bar plot, left) comparing colon samples from INR versus IR. A representative enrichment plot (right) shows the running enrichment score and position of genes in the preranked list. (B) Top five enriched GO terms (bar plot, left) comparing INR versus HC in the colon, with a representative enrichment plot shown on the right. (C) Top five enriched GO terms (bar plot, left) comparing IR versus HC in the colon, with a representative enrichment plot shown on the right. (D) Gene network illustrating the top three enriched GO terms in colon samples from immune non-responders (INR) versus immune responders (IR). (E) Gene network showing the top three enriched GO terms in colon samples from INR versus healthy controls. INR, immunological non-responders; IR, immunological responders; HC, healthy controls; GSEA, Gene Set Enrichment Analysis; GO, Gene Ontology; RNA-seq, RNA sequencing; SC, sigmoid colon.
3.1.3 Upregulation of transcripts associated with NK cell-mediated cytotoxicity in the sigmoid colon of INR compared to healthy controls
When comparing colon of INR to colon of HC, transcripts associated with positive regulation of natural killer (NK) cell mediated toxicity and disruption of cellular anatomical structures were upregulated in INR (Figure 3B). In addition, there were alterations in the plasma membrane signaling receptor complex and the T-cell receptor complex. The specific factors involved in some of the upregulated processes are represented in Figure 3E. Notably, the disruption of the cell wall involving REG3α, among others, which we previously have shown to have a tendency to be higher in INR than in IR (16), was upregulated in INR compared to healthy controls. When comparing INR to both IR and HC, the majority of the common transcripts were downregulated in INR (Supplementary Figure S1A), and typically involved in protein transport, metabolism and cellular localization (Supplementary Figure S1B).
3.1.4 Deconvolution analysis highlights variations in immune cell distribution among PLW groups and healthy controls
To investigate whether the differences observed in transcriptome analyses reflect variations in immune cell distribution among biopsy specimens from the different PLW groups and healthy controls (HC), we conducted a deconvolution analysis of the RNA-seq data (Figure 4). The analysis revealed a significant decrease in monocytes in INR compared to HC (Paired t-test, p= 0.049) (Figure 4A). Conversely, there was a significant increase in the proportion of memory B cells in INR compared to HC (Paired t-test, p=0.029) (Figure 4C). Additionally, our deconvolution analysis indicated a five-fold significant increase in plasmablasts in IR compared to HC (Paired t-test, p =0.030) (Figure 4C). However, although the level of plasmablasts was significantly lower in INR compared to those of IR (Paired t-test, p=0.028) and differed significantly between all groups (one tailed ANOVA, p = 0.008) (Figure 4C), there were no significant differences in the proportion of naïve and memory B cells between INR and IR (Figure 4B). This suggests that the differences in transcriptome analyses indicating reduced B cell mediated immunity in INR as compared with IR (Figure 3D) do not merely reflect variations in the distribution of these cells in the biopsy specimens.
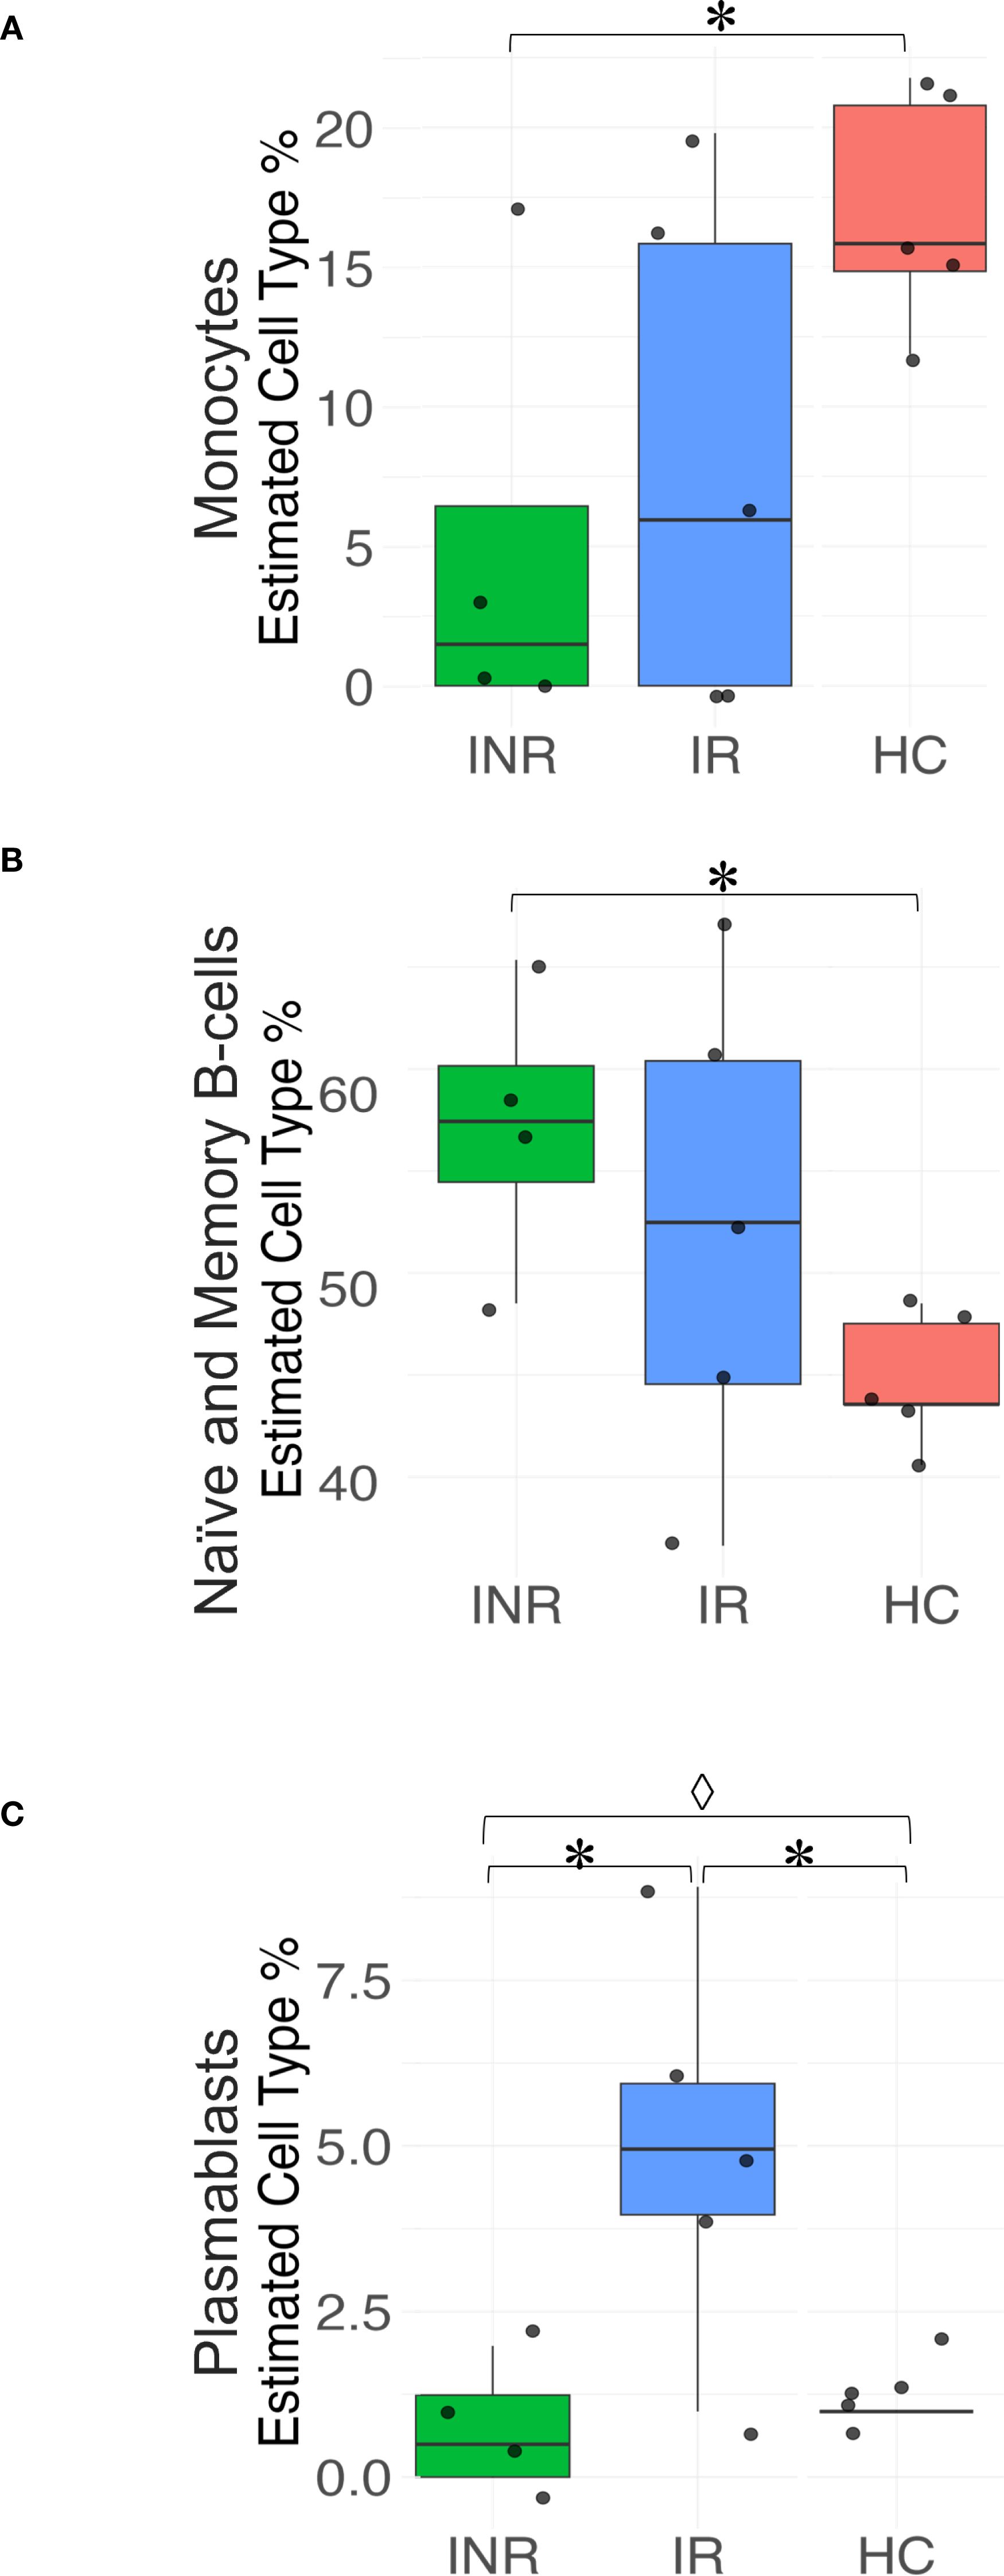
Figure 4. Deconvolution analyses of immune cell subsets in the sigmoid colon. Box plots illustrating the relative abundance of (A) Monocytes; (B) Naïve and memory B cells; and (C) Plasmablasts in sigmoid colon from INR, IR, and HC. Statistical significance is indicated as P<0.05 (*Paired t-test; ◊ one-way ANOVA). Box plots display the median, interquartile range, and minimum/maximum values. INR, immunological non-responders; IR, immunological responders; HC, healthy controls.
3.2 Greater protein dysregulation observed in the sigmoid colon of INR compared to IR, in contrast to the terminal ileum
We next examined protein regulation in biopsies from sigmoid colon and terminal ileum by global proteomic analyses, focusing on INR and IR that was the main predefined comparison of the study. We detected a total of 4027 common proteins for all three groups in both tissues after data cleaning and filtering out proteins that were not identified in all replicates for at least one group (INR, IR and/or HC). The data were further evaluated for differential expression by empirical Bayes statistics test. Consistent with our findings at the transcriptional level, more proteins were differentially regulated in sigmoid colon compared to terminal ileum (p < 0.0001; Figures 5A, B). In the paired comparisons from the three groups (IR, INR and HC), we identified a total of 74 differentially regulated proteins in sigmoid colon (Figure 5A) and six in terminal ileum (Figure 5B). Twelve proteins were differentially regulated between INR and IR in sigmoid colon but only four in terminal ileum (Figures 5A, B, respectively).
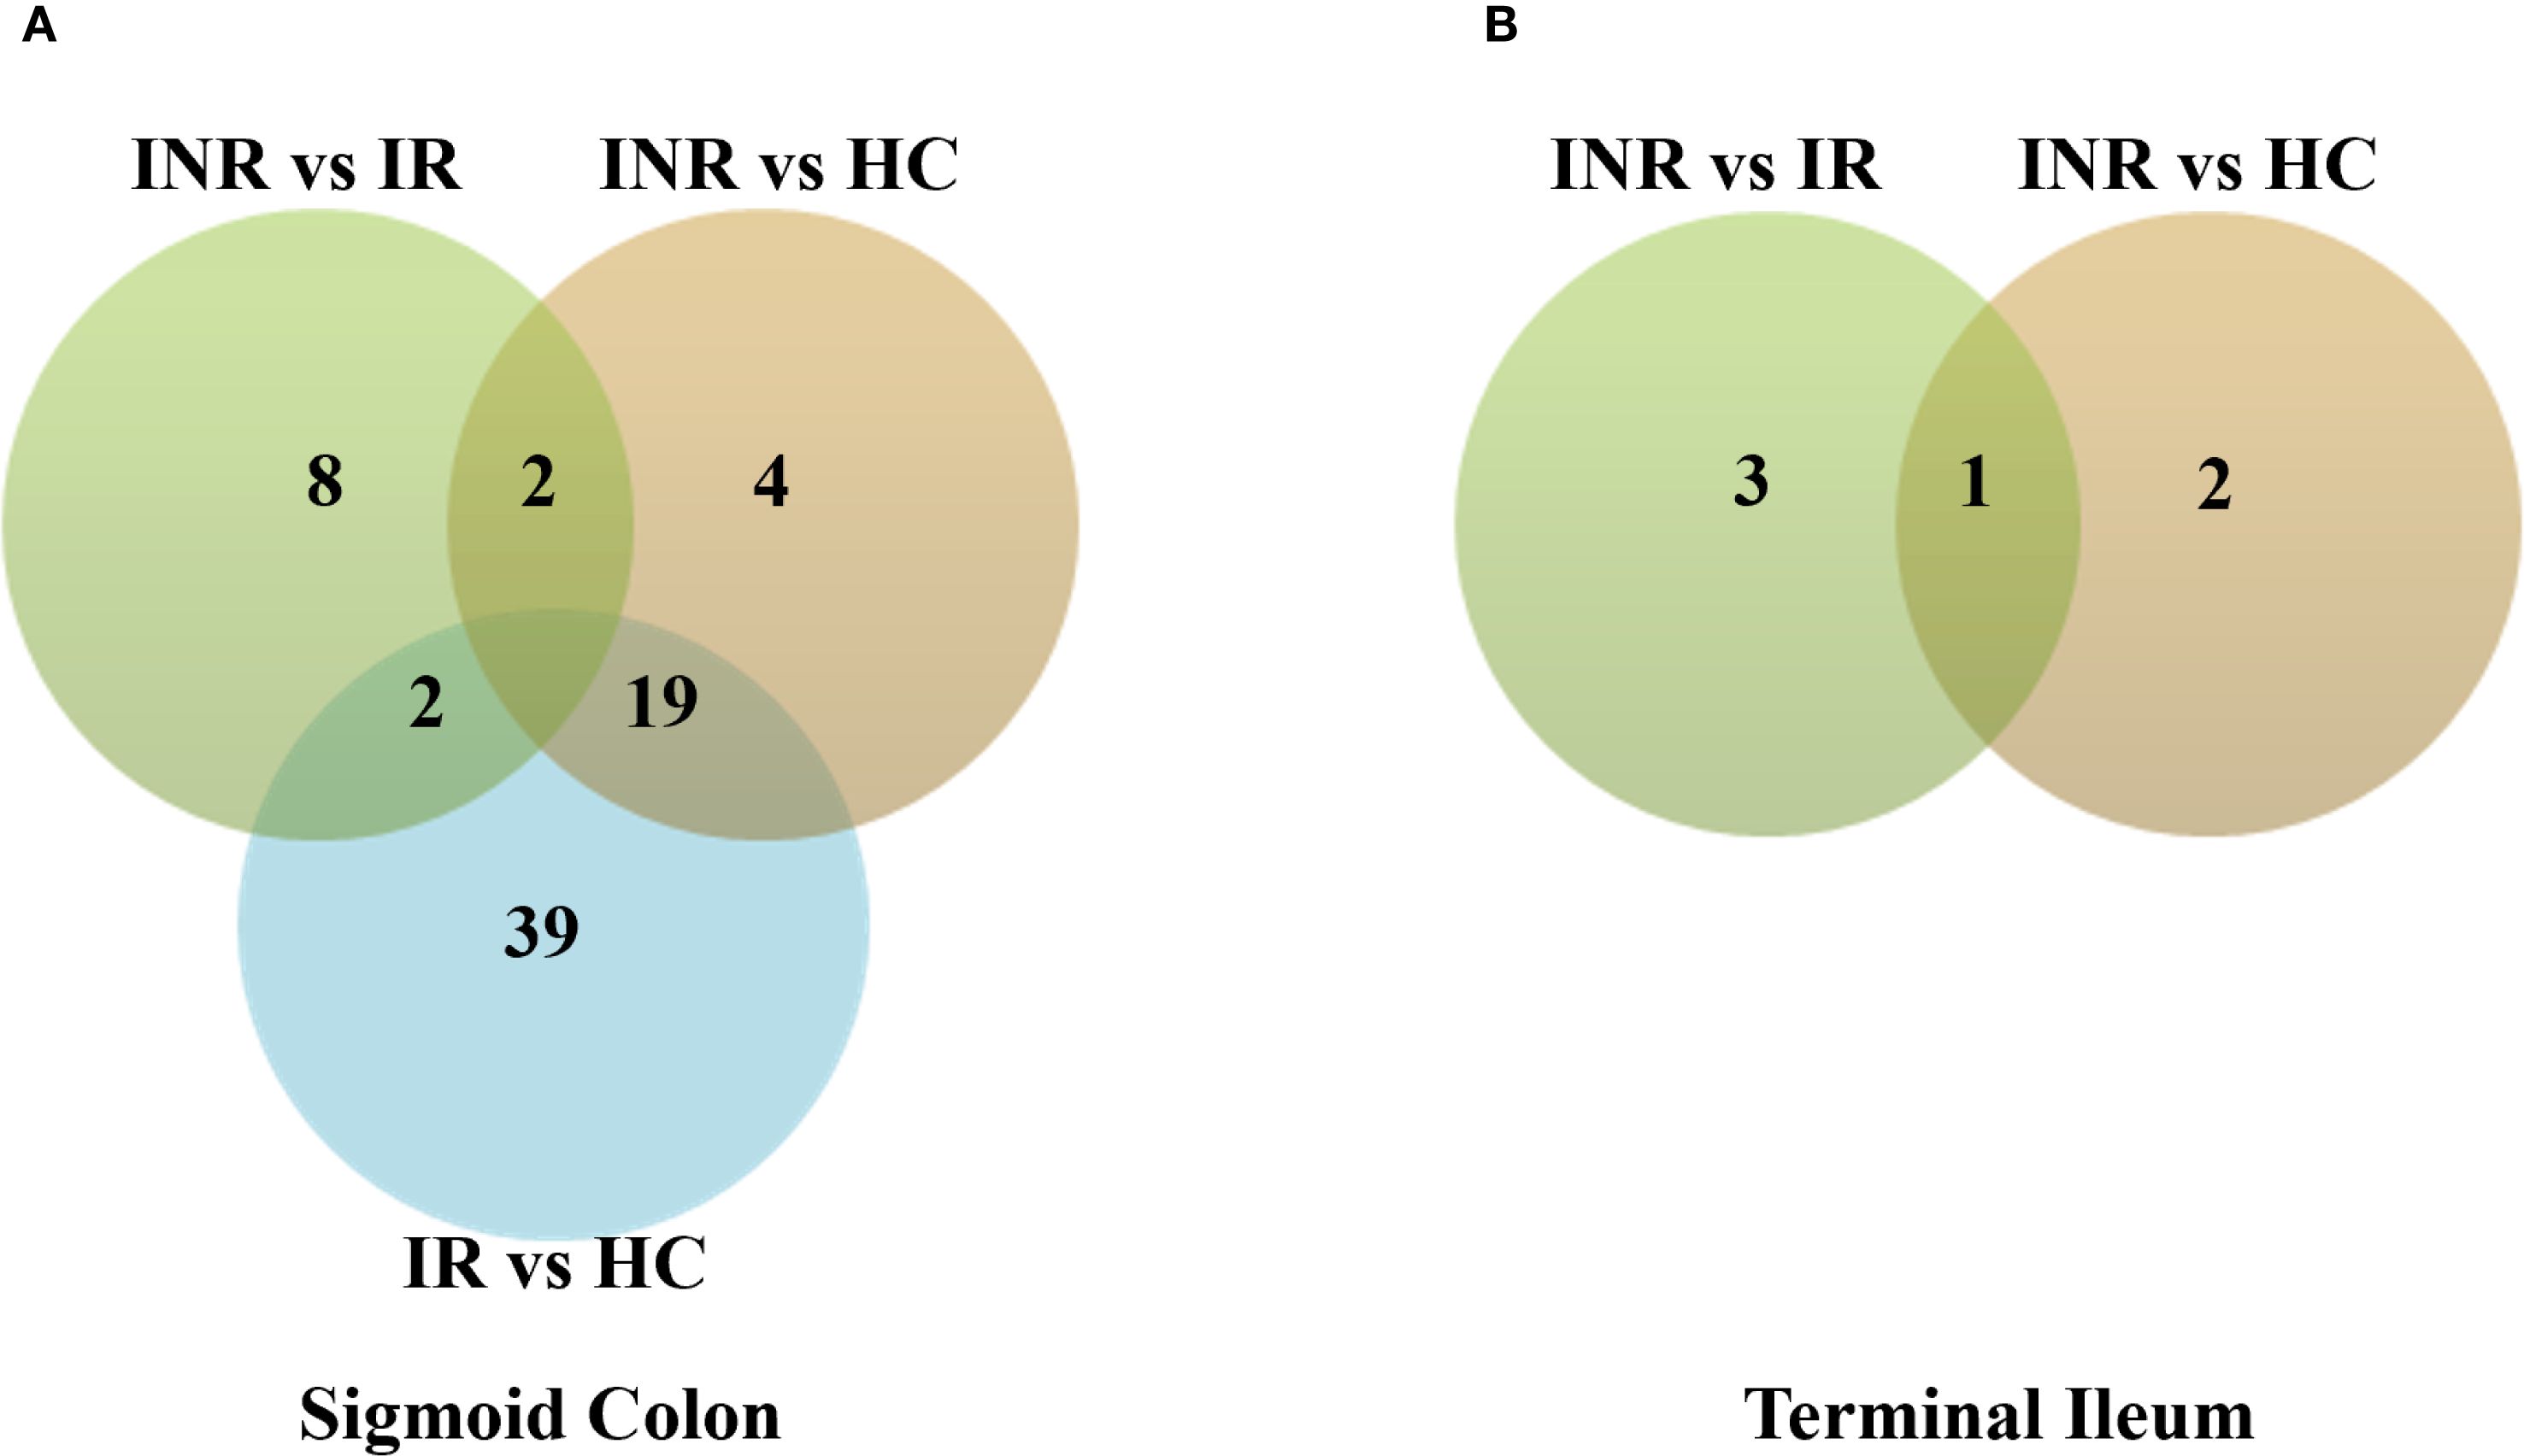
Figure 5. Protein regulation in INR, IR and HC in (A) sigmoid colon compared to (B) terminal ileum. Venn diagram showing numbers of uniquely and commonly regulated proteins, DEPs (p adj < 0.05). Total protein was isolated from gut mucosal endoscopic pinch biopsies protein levels and analysed by mass spectrometry. Empirical Bayes statistics test was used to identify differential regulation (p adj < 0.05). Chi-square test was used to calculate difference in regulation between the two tissues (p adj < 0.0001). INR, immunological non-responders; IR, immunological responders; HC, healthy controls; DEPs, Differential Enrichment analysis of Proteomics data.
3.2.1 Differential pathway and protein expression analysis in the sigmoid colon of INR versus IR: implications for immune response regulation
Proteomic analysis of the sigmoid colon revealed distinct differences in protein expression between INR and IR, with significant implications for mucosal immune activity. Among the proteins most upregulated in INR samples were Eukaryotic translation initiation factor 1 (EIF1), Transcriptional regulator transducin β-like X-linked receptor 1 (TBLXR1), and Transcription factor RWD domain-containing protein 1 (RWDD1) (Figures 6A, B), proteins associated with immune function and carcinogenesis (45–47). In contrast, Periostin (POSTN1), Musashi RNA-binding protein 2 (MSI2), and Immunoglobulin kappa variable A18 (IGKV18) were significantly downregulated in INR (Figure 6C). POSTN1 contributes to extracellular matrix remodeling and tissue repair (48, 49). MSI2 regulates RNA metabolism and autophagy, and IGKV18 is associated with B cell–mediated immune responses (50, 51). Additional differentially expressed proteins included Angiotensin-converting enzyme 2 (ACE2), which was upregulated in INRs and is known for its role in mucosal receptor signaling and as a co-receptor exploited by several viruses. Caspase-3 (CASP3), a central mediator of apoptosis, was also elevated in INR samples. In relation to antigen presentation, Major histocompatibility complex, class II, DR beta 1 (HLA-DRB1) was upregulated, consistent with reports linking specific HLA-DRB1 alleles to variations in HIV-1 susceptibility, disease progression, and viral control (52, 53). Regarding intracellular signaling, Phosphatidylinositol 4-kinase alpha (PI4KA) was upregulated, while MSI2 was downregulated, suggesting alterations in both phosphoinositide signaling and RNA regulation. Structural and mitochondrial components were also affected: Spectrin beta chain, non-erythrocytic 1 (SPTBN1), which supports cytoskeletal architecture (54), and Translocase of inner mitochondrial membrane 8A (TIMM8A), which facilitates mitochondrial protein import (55), were both upregulated in INR samples. Collectively, these expression profiles indicate widespread differences in immune regulation, apoptosis, antigen processing, cellular signaling, and homeostasis between INR and IR at the mucosal level (32, 56). Supporting these findings, ImmuneSigDB analyses of the differentially expressed proteins in the sigmoid colon of INR and IR revealed significant differences in pathways regulating memory B cells, CD4 T-helper cells, and dendritic cells (DCs) between the two groups. GO analyses further revealed significant differences in cytokine production pathways between INR and IR.
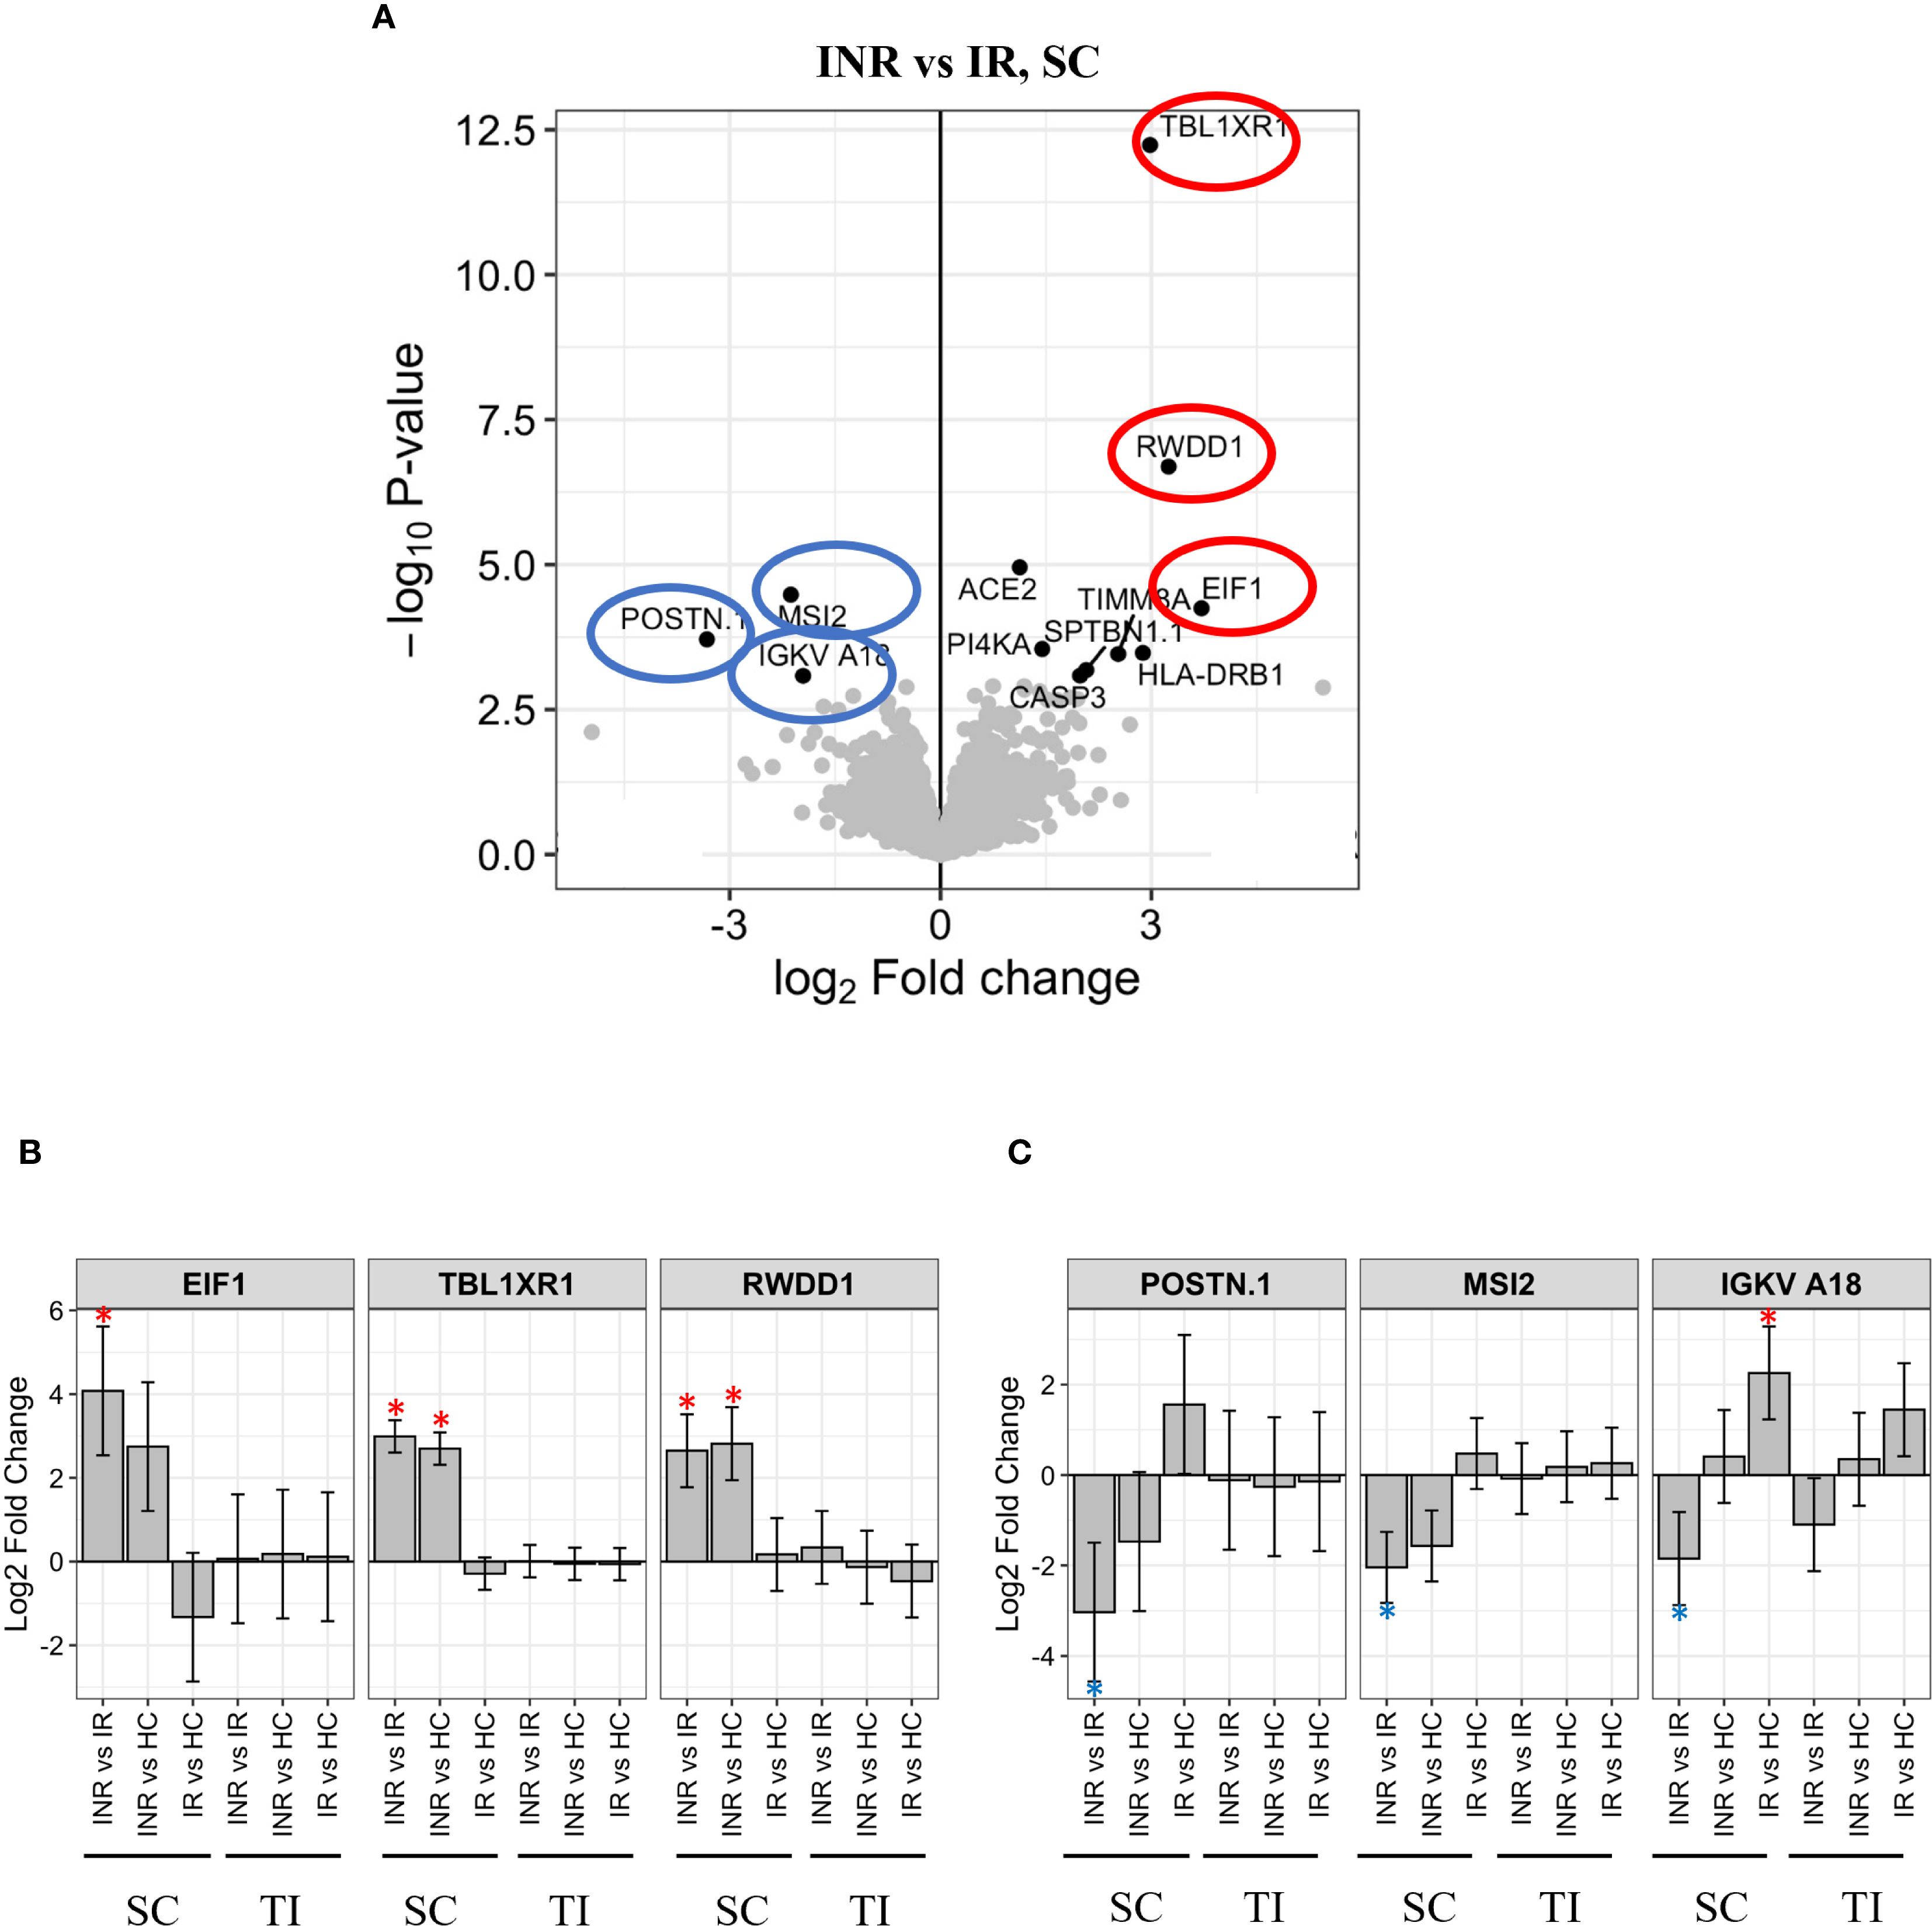
Figure 6. Protein regulation in INR versus IR in sigmoid colon (A) Volcano plot illustrating proteins significantly regulated in INR compared to IR in sigmoid colon. Y-axis shows -log10 adjusted p-value, X-axis log2 fold change. Significant DEPs are in black dots with the corresponding name. Grey dots illustrate non-significant DEPs. The most significantly upregulated proteins in INR versus IR (-log10 adjusted p-value > 2.5) are highlighted in red circles, significantly downregulated proteins are highlighted in blue circles. (B) Levels of the most upregulated proteins in INR versus IR are shown for all groups in both tissues. The protein intensity (log2) (Y-axis) is shown for each group with significant differences (p < 0.05) marked *. (C) Levels of the most downregulated proteins in INR vs IR shown for all groups in both tissues. The protein intensity (log2) (Y-axis) is shown for each group, significant differences (p < 0.05) are marked *. Error bars represent 95% confidence intervals. INR, immunological non-responders; IR, immunological responders; HC, healthy controls; DEP, Differential Enrichment analysis of Proteomics data; E1F1, Eukaryotic translation initiation factor; IGKV18, Antibody immunoglobulin kappa variable A18; MSI2, Musashi RNA binding protein 2; POSTN1, Periostin; RWDD1, transcription factor RWD domain containing 1; SC, sigmoid colon; TBLXR1, Transducin β-like 1 X-linked receptor 1; TI, terminal ileum.
3.2.2 Significant downregulation of mitochondrial and cell cycle-related proteins in the terminal ileum of INR compared to IR
In terminal ileum, the Mitochondrially encoded ATP synthase membrane subunit 8 (MT-ATP8), High mobility group AT-Hook 1 (HMGA1), and the growth hormone release-inhibiting factor Somatostatin (SST) were all significantly downregulated factors in INR compared to IR (Figures 7A, B). MT-ATP8 (57, 58) and HMGA1 (59) have been implicated in mitochondrial function. In addition, the mitotic check point signaling factor ZW10 interacting kinetochore protein (ZWINT) was downregulated in INR compared to IR in ileum.
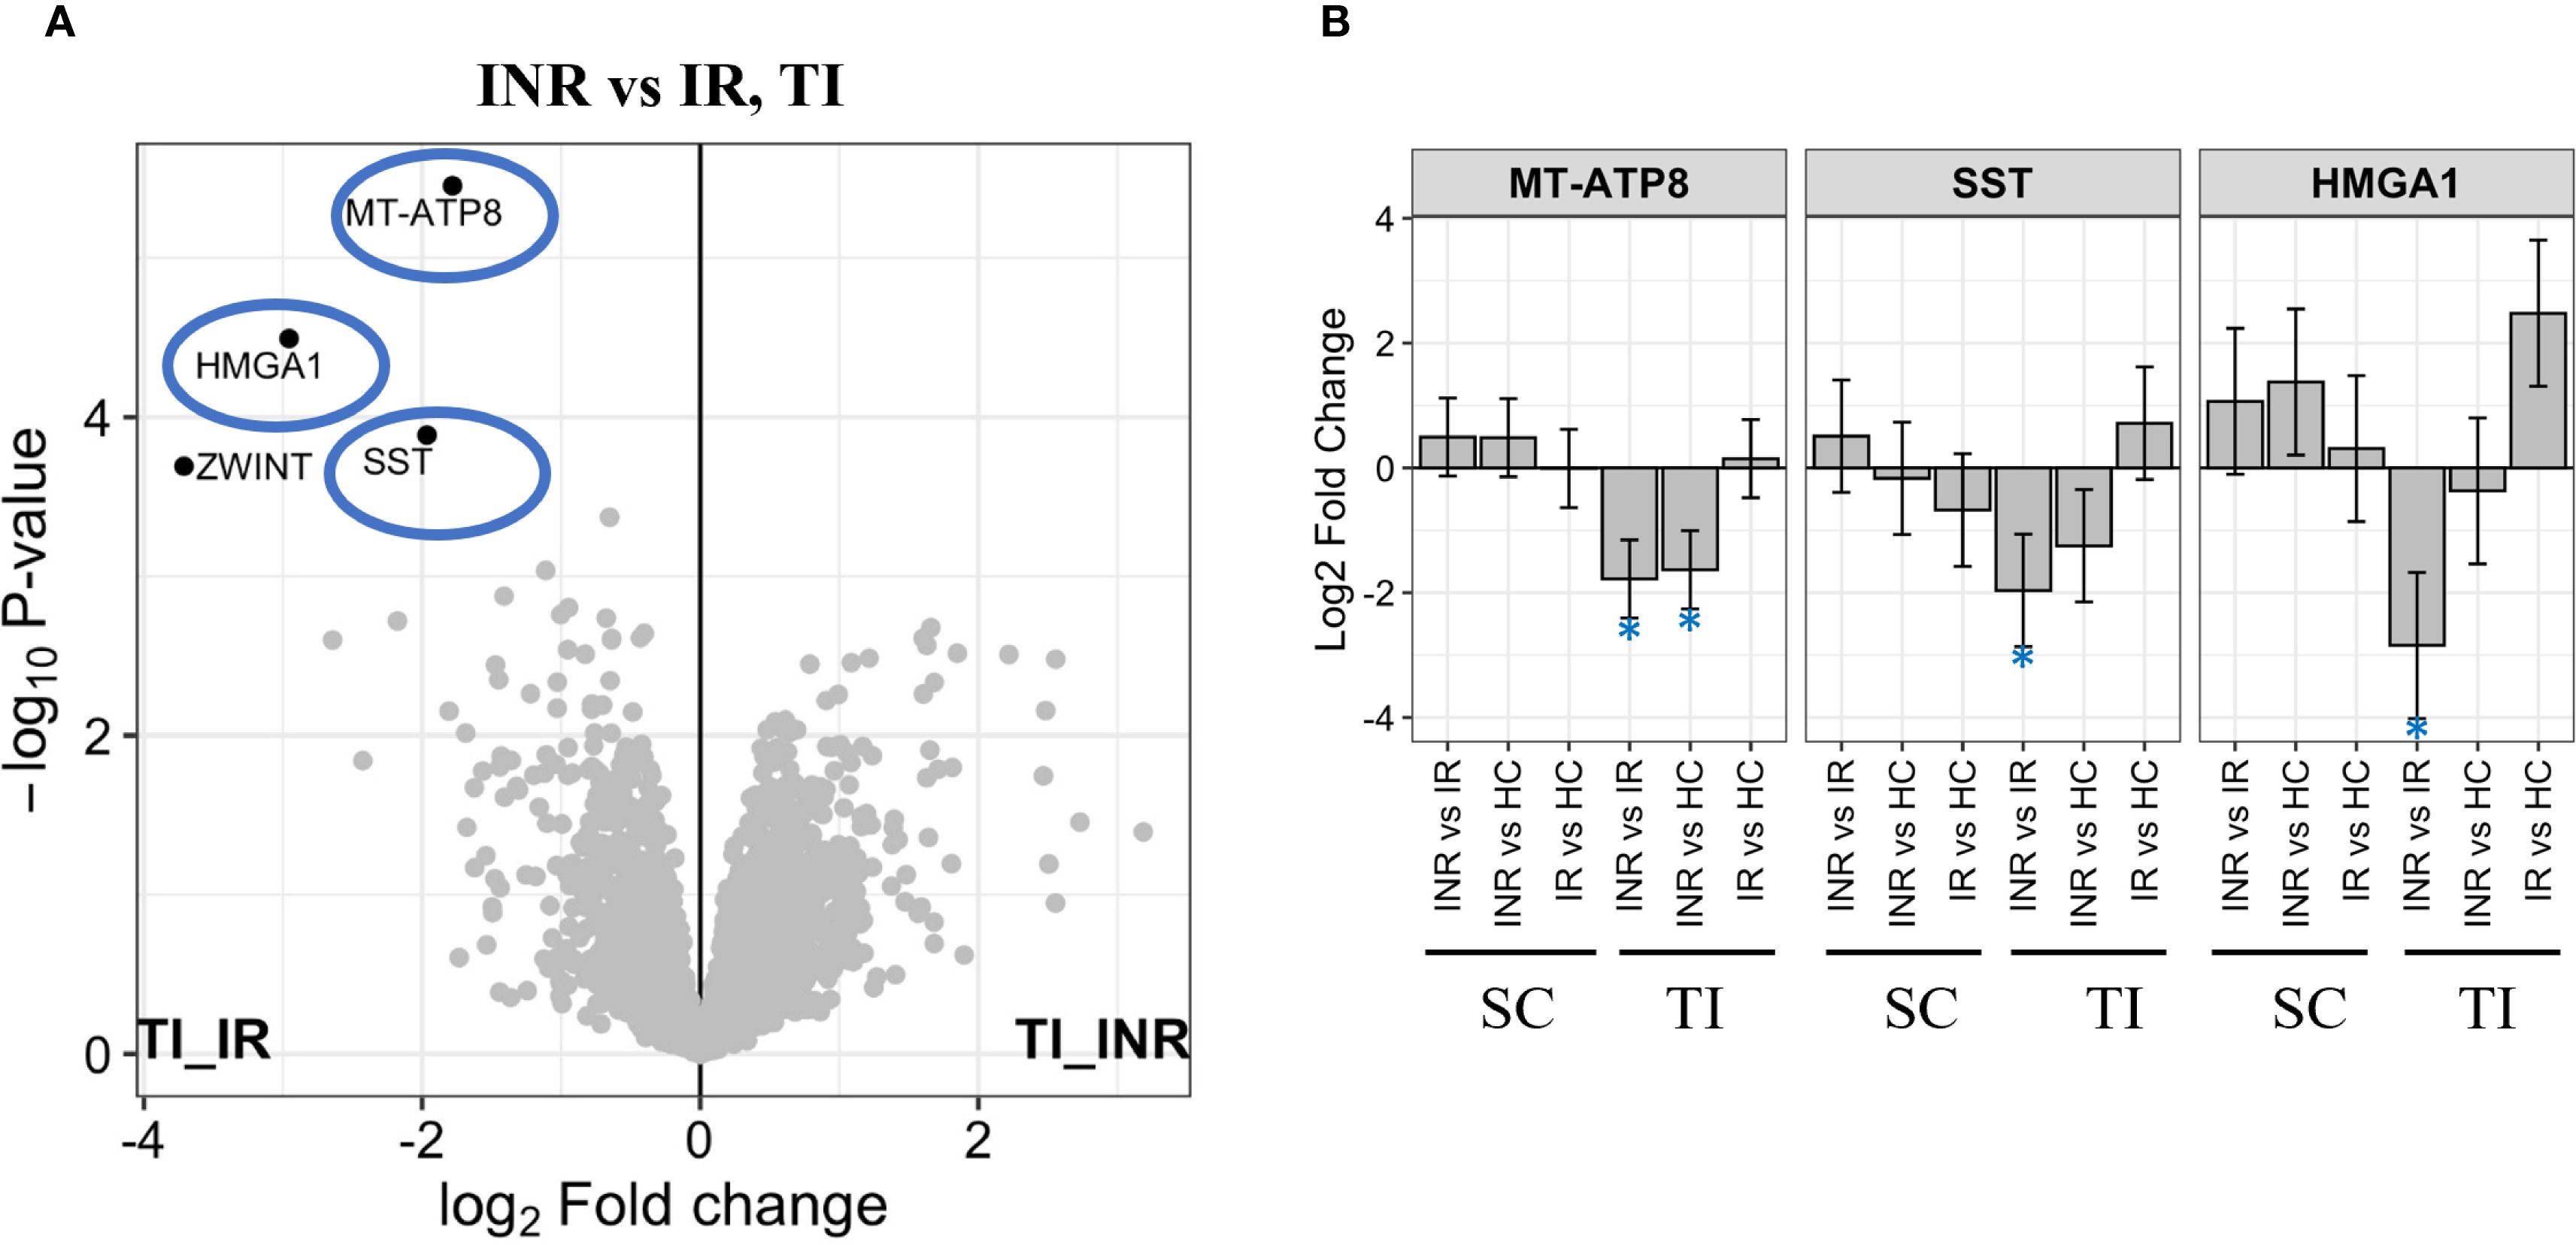
Figure 7. Protein regulation in terminal ileum (A) Volcano plot illustrating proteins most significantly downregulated in INR versus IR in terminal ileum. Y-axis shows -log10 adjusted p-value, X-axis log2 fold change. Significant DEPs showed in black dots with the corresponding name. Grey dots show non-significant DEPs. The most significantly downregulated proteins in INR vs IR (-log10 adjusted p-value > 2) highlighted in blue circles; (B) Level of most significantly downregulated factors in INR versus IR, in all groups and tissues. Y-axis shows log2 fold change. Error bars represent 95% confidence intervals. INR, immunological non-responders; IR, immunological responders; HC, healthy controls; DEPs, Differential Enrichment analysis of Proteomics data; HMGA1, High mobility group AT-hook 1; MT-ATP8, Mitochondrially encoded ATP synthase membrane subunit 8; SC, sigmoid colon; SST, Somastatin; TI, terminal ileum.
3.2.3 Integrated transcriptomic and proteomic profiling reveals candidate biomarkers and therapeutic targets in INR
To investigate the molecular mechanisms underlying discordant immunological response and to identify potential biomarkers, we conducted an integrated analysis of RNA-seq and proteomics data from gut mucosal biopsies of INR and IR. Among the 3,326 DEGs and 12 DEPs identified in INR versus IR in the colon, four genes showed concordant dysregulation at both transcript and protein levels (Figure 8A). These genes were PI4KA, EIF1, RWDD1, and POSTN. A weighted gene–protein correlation network revealed strong RNA–protein associations for these overlapping genes (Figure 8B). Specifically, PI4KA, EIF1, and RWDD1 were upregulated at the protein level, while POSTN was slightly downregulated. Discrepancies between mRNA and protein expression were observed for P14KA and POSTN. POSTN exhibited increased mRNA expression but was downregulated at the protein level in INR, suggesting the presence of post-transcriptional inhibitory mechanisms (60). In contrast, PI4KA was significantly downregulated at the mRNA level but upregulated at the protein level in INR compared to IR, indicating potential post-transcriptional upregulation or increased protein stability (60, 61) However, scatterplot analysis confirmed a strong positive correlation between RNA and protein expression for EIF1, RWDD1, and PI4KA, with a correlation coefficient of R = 0.96 (Figure 8C), indicating high concordance despite the limited sample size. Finally, unsupervised clustering of the integrated transcriptomic and proteomic data clearly distinguished INR from IR (Figure 8D), suggesting these four genes form a distinct molecular signature associated with impaired immunological response upon ART.
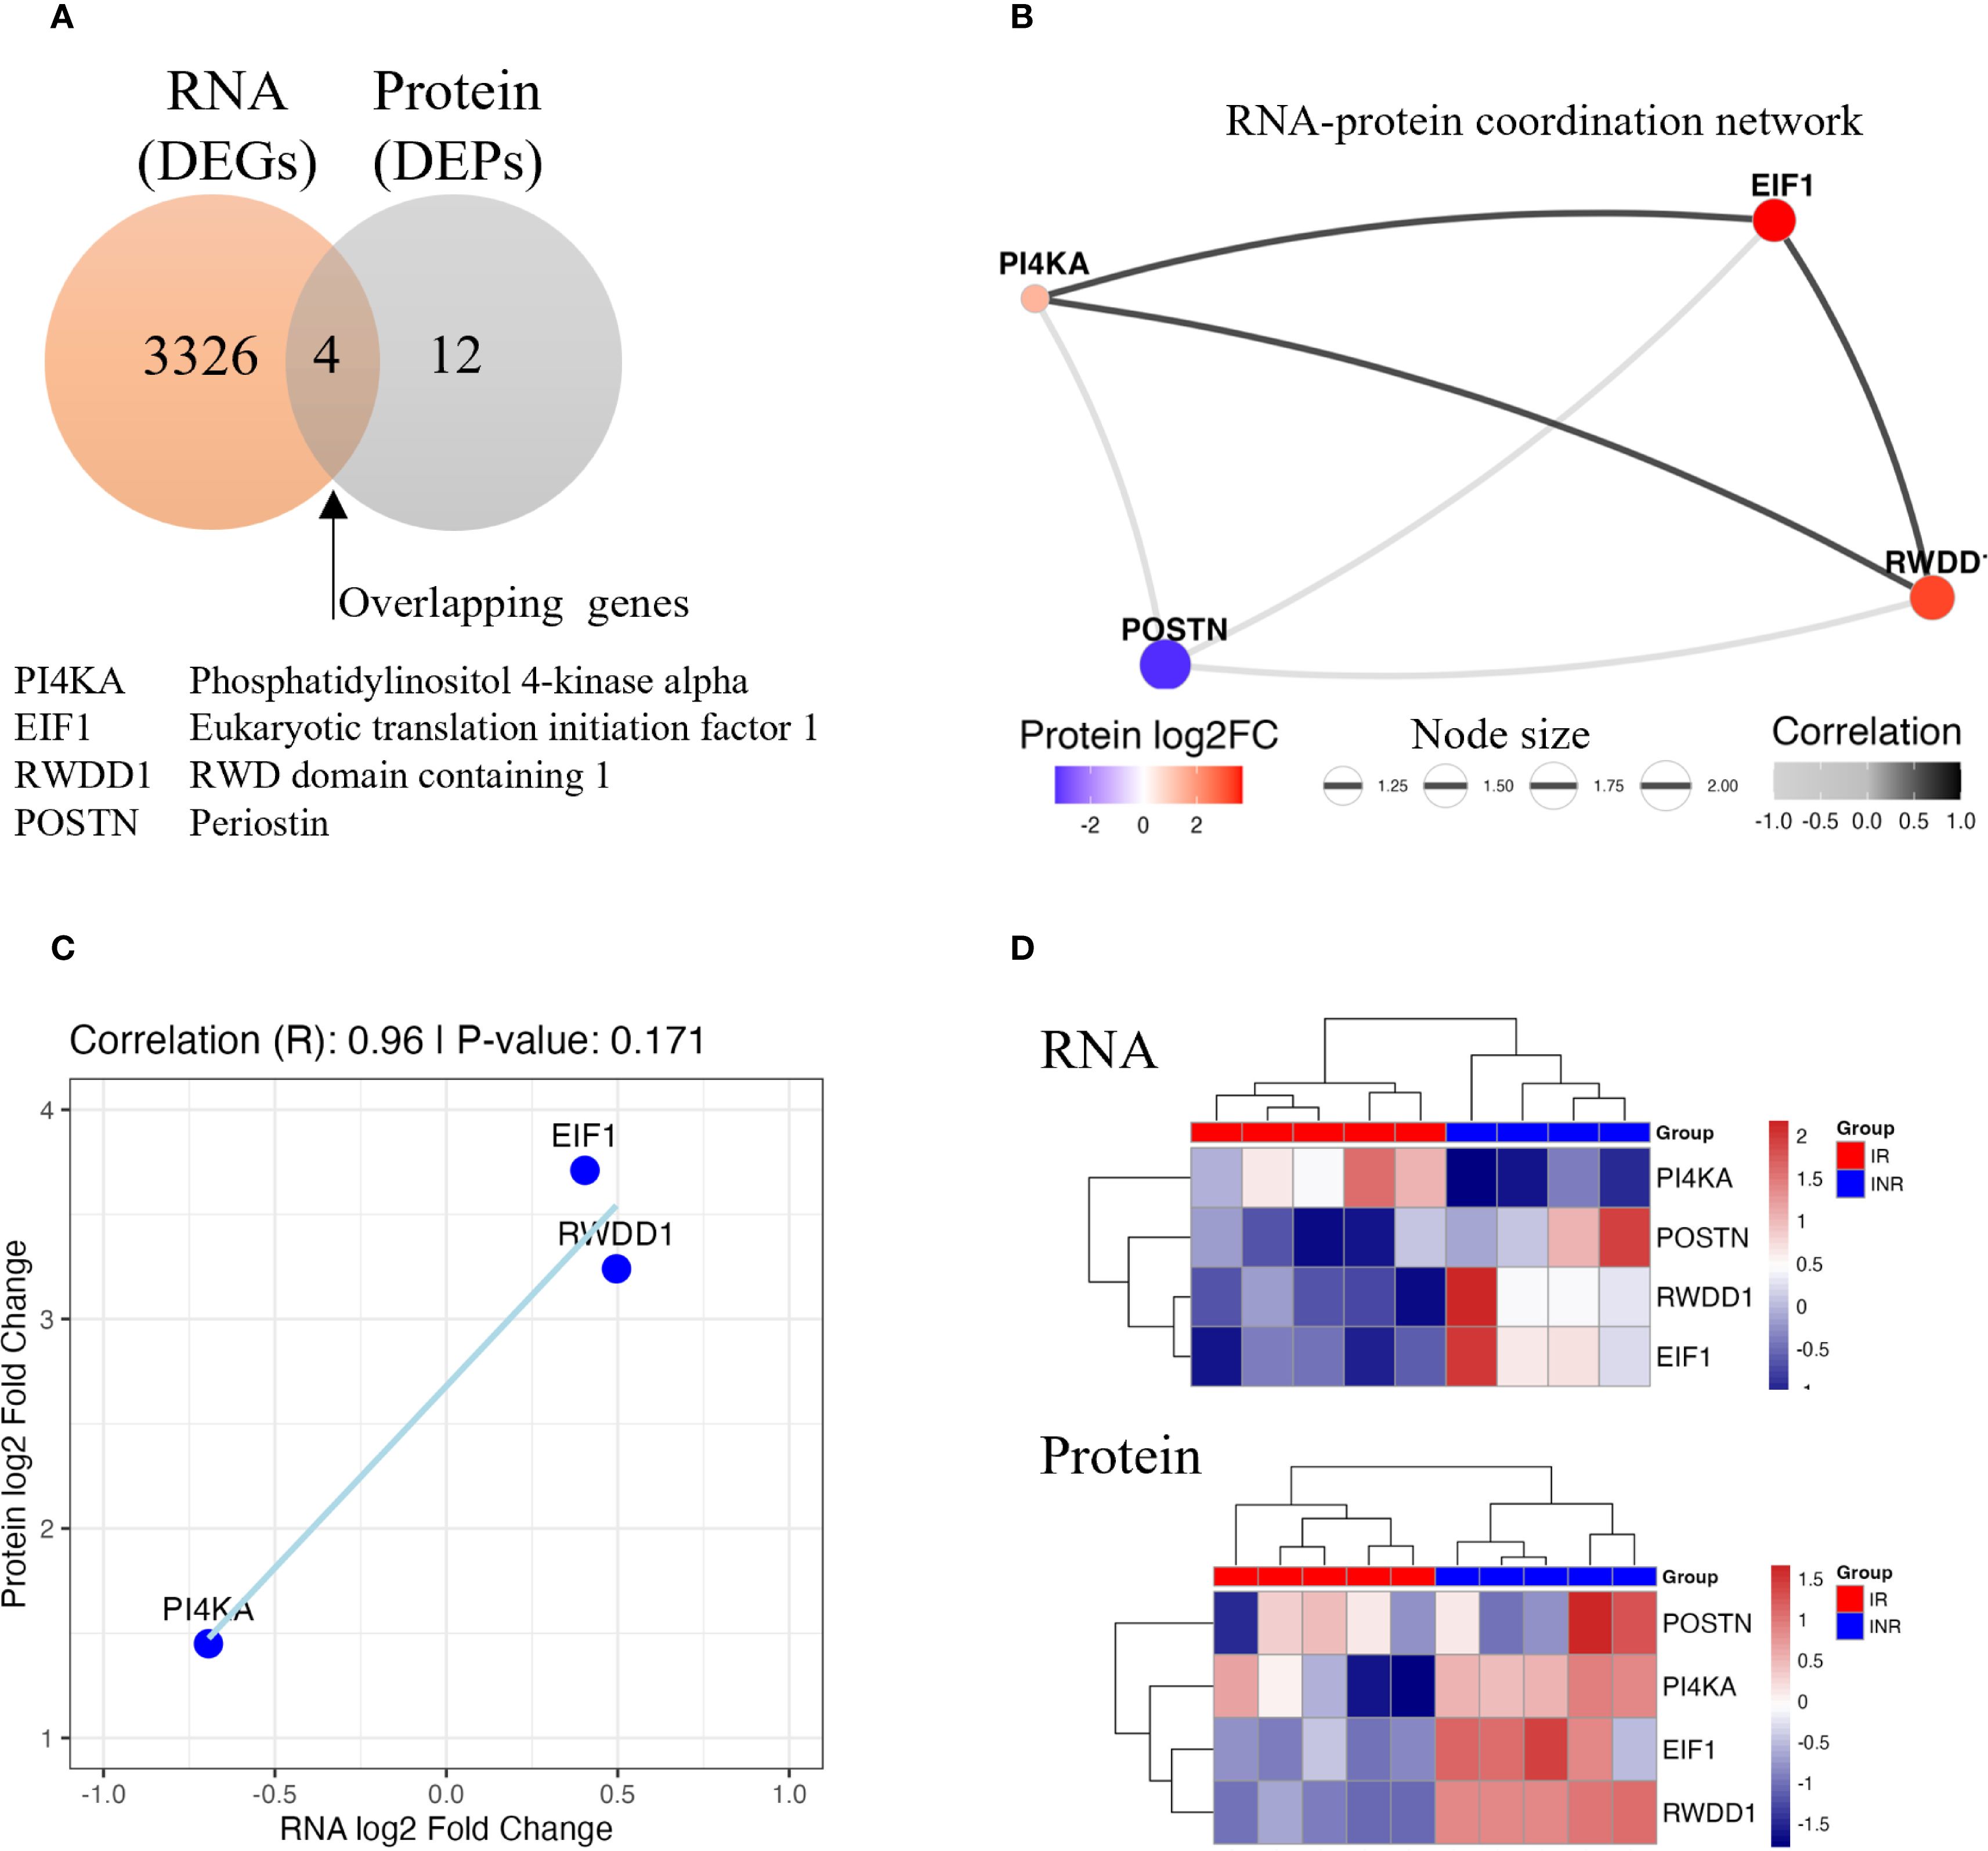
Figure 8. Integrated analysis of RNA-seq and proteomic data in colon samples from INR compared to IR. (A) Venn diagram showing the overlap between DEGs and DEPs. B) RNA–protein coordination network of overlapping genes. Node size reflects the product of absolute RNA and protein log2 fold changes; edge thickness represents correlation strength. (C) Scatterplot showing the positive correlation trend in three overlapping genes (EIF1, RWDD1, and PI4KA). (D) Heatmap of RNA and protein expression levels for overlapping genes. Samples clustered distinctly by group, separating INR from IR. INR, immunological non-responders; IR, immunological responders; DEG, differentially expressed gene; DEP, differentially expressed protein; log2FC, log2 fold change; RNA-seq, RNA sequencing.
4 Discussion
This study provides the first integrated transcriptomic and proteomic analysis of mucosal tissues from people with HIV (PWH) who fail to achieve immune reconstitution (INR) despite effective ART, compared with immune responders (IR) and healthy controls (HC). We demonstrate that the sigmoid colon is a key site of molecular dysregulation in INR. INR exhibited broad transcriptional and proteomic alterations, including downregulation of immune and metabolic pathways, particularly those involving B cell responses, mitochondrial function, and RNA metabolism. These changes were not observed in the ileum and suggest a region-specific impairment in mucosal immune homeostasis in INR.
4.1 Regional differences emphasize the sigmoid colon as a key site of dysregulation
The most striking differences in gene and protein expression between INR and comparator groups (IR and HC) were found in the sigmoid colon. Transcriptomic analysis identified 3,326 differentially expressed genes (DEGs) between INR and IR in the colon, compared to no significant DEGs in the ileum. Similarly, proteomic analysis revealed 12 differentially expressed proteins (DEPs) in the colon and only four in the ileum. These findings underscore a compartmentalized pattern of immune dysfunction and highlight the distal colon as a uniquely affected site in INR.
The basis for this regional specificity is not fully understood. However, prior studies have reported that the colon may harbor higher levels of residual HIV replication and microbial translocation than the small intestine, which could drive ongoing mucosal immune activation and injury despite ART (3, 62). Our findings support this concept, revealing persistent molecular disturbances in colonic tissue from INR that are absent in the ileum.
4.2 Downregulation of immune, metabolic, and stress-response genes in colon of INR
The sigmoid colon of INR exhibited extensive transcriptional suppression, particularly affecting key immunological, metabolic, and stress-response pathways. Gene ontology and pathway enrichment analyses revealed significant downregulation of genes involved in protein transport, cytokine signaling, and adaptive immune responses, suggesting a compromised mucosal immune environment. Notably, CD4 mRNA expression was reduced by 37% in INR compared to IR.
We have previously reported that INR have approximately 10% fewer CD4+ T cells in the mucosa of the colon with increased activation and exhaustion of CD4+ T cells, correlating with signs of epithelial damage and mucosal dysfunction (16, 17). The magnitude of CD4 mRNA reduction observed here, suggests that, in addition to the reduced number of CD4+ T cells, INR also have transcriptional downregulation of the CD4 gene itself. This implies that impaired CD4 transcription, in combination with chronic immune activation (2, 3), may contribute to the failure of CD4+ T-cell recovery in INR, extending the mucosal dysfunction initially triggered by CD4+ T-cell loss in PWH (16, 17). The HIV Vpu protein and CD4 gene polymorphisms may further suppress CD4 expression (61, 62). Thus, reduced gut mucosal CD4 mRNA is not merely a consequence but also a contributing factor to poor immune reconstitution in INR (3, 28, 29).
Several key immune-regulatory genes were also downregulated in INR, including TGFB1 and IL21R, which play crucial roles in immune modulation, tissue repair, and T/B cell function (33, 34). Similarly, downregulation of HLA-E, a molecule involved in NK cell regulation and epithelial immune tolerance, supports the hypothesis of impaired mucosal immune regulation (35, 36).
In contrast, a limited subset of genes associated with inflammation was upregulated. These include CXCL1, a chemokine known to enhance HIV replication (30, 32), PTPN22, which modulates TCR signaling and T cell activation (37), and GZMA, a granzyme involved in cytotoxic lymphocyte function mediating potential harmful effects on the host (38).
Additional dysregulated genes with recognized roles in HIV pathogenesis included MAP3K5, implicated in stress-induced apoptosis and interactions with HIV proteins (39), and CIITA (–1.138), a master regulator of MHC class II expression and antigen presentation (42). Dysregulation of CIITA further underscores impaired adaptive immune responses in INR, with direct implications for HIV infection.
Proteomic analysis confirmed transcriptomic findings and revealed increased expression of pro-apoptotic and stress-response proteins such as CASP3 and ACE2, the known receptor for SARS-CoV-2 entry, both previously implicated in HIV-mediated epithelial damage and mucosal dysfunction (32, 56, 63). CASP3, a central mediator of apoptosis, was also elevated in INR. This aligns with previous evidence that HIV-1 envelope proteins can trigger CASP3 dependent apoptosis in CD4+ T cells through CD4 receptor engagement (32, 56). Additional upregulated proteins included EIF1, RWDD1, and PI4KA, associated with translational control and intracellular signaling (45, 47, 64). Conversely, MSI2, a key regulator of RNA metabolism and autophagy (65), and POSTN, essential for extracellular matrix remodeling and tissue repair (48), were significantly downregulated, suggesting impaired tissue homeostasis and repair capacity.
The differential expression of structural and mitochondrial proteins, such as SPTBN1 and TIMM8A, further supports the presence of cellular stress and compensatory remodeling in INR mucosa (54, 55). Together, these findings reflect widespread disruption of mucosal immune regulation, apoptosis control, antigen processing, and cellular maintenance in INR, despite ART-mediated viral suppression.
4.3 Reduced B cell function in the colonic mucosa of INR
B cell–related signaling emerged as one of the most consistently downregulated pathways in colon of INR compared to IR. Genes involved in antigen binding, the immunoglobulin production, and B cell activation were significantly suppressed. This included multiple immunoglobulin variable genes and key cytokine receptors.
Interestingly, immunoglobulin gene expression in INR was not significantly different from healthy controls, suggesting that the defect is not due to baseline normalization but rather to a failure of ART-mediated upregulation. This aligns with prior reports of deficient B cell responses in INR (33, 34) and indicates underlying dysfunction in mucosal B cell differentiation.
RNA deconvolution analysis revealed a reduction in plasmablast frequencies in INR, while memory B cell levels remained comparable. This suggests a specific impairment in B cell activation processes, particularly in proliferation and differentiation into plasmablasts during the immune response to HIV at the mucosal level.
4.4 Upregulation of inflammatory immune signatures in INR
Despite suppression of adaptive immune pathways, the colonic mucosa of INR exhibited increased expression of genes linked to inflammation, including NK cell–associated markers and epithelial stress mediators. REG3α, a known marker of epithelial inflammation, was significantly upregulated in the INR colon compared to HC in our dataset. We have previously reported elevated levels of REG3α in INR (16), and its persistent increase here likely serum reflects ongoing epithelial stress and persistent inflammation as a potential important phenotype in INR in the absence of effective adaptive immunity.
4.5 Proteomic evidence supports immune and metabolic imbalance
Proteomic profiling supported our transcriptomic findings, revealing dysregulation of proteins involved in translation, apoptosis, and mitochondrial function. The upregulated proteins EIF1, RWDD1, and PI4KA play roles in translation initiation and phosphoinositide signaling (45, 47, 64), and may represent stress-adaptive mechanisms.
In contrast, POSTN, involved in extracellular matrix remodeling and hematopoietic regulation, was downregulated, suggesting impaired tissue repair in INR (50, 66). Decreased expression of the immunoglobulin variable gene IGKV18 suggests impaired local antibody production. Increased levels of CASP3 and ACE2 further point to increased epithelial susceptibility and apoptotic signaling (32, 56). Indeed, in addition to being the receptor for SARS-CoV-2 entry, ACE2 plays a crucial role in modulating gut inflammation and gut microbiome and has also been implicated in the pathogenesis of simian immunodeficiency virus infection (63). Additional upregulation of mitochondrial and structural proteins (SPTBN1, TIMM8A) may reflect epithelial adaptation to sustained cellular stress (54, 55).
4.6 Limited transcriptomic and proteomic changes in the ileum point to localized dysfunction
In contrast to the colon, the terminal ileum exhibited minimal molecular disturbance, with no significant differentially expressed genes. At the proteomic level, lower levels of MT-ATP8, HMGA1, SST, and ZWINT, proteins involved in mitochondrial function and cellular proliferation, were observed. These findings support a localized rather than systemic mucosal dysfunction in INR, focused on the colon.
4.7 Concordant transcriptomic and proteomic markers of INR mucosal dysfunction
Integration of transcriptomic and proteomic datasets highlighted a small group of altered markers, EIF1, RWDD1, PI4KA, and POSTN, that distinguished INR from IR and HC. The observed discordance between mRNA and protein levels for PI4KA and POSTN highlights the complexity of gene regulation and suggests that post-transcriptional mechanisms are involved. PI4KA upregulation at the protein level despite transcript downregulation suggests enhanced translation efficiency or reduced degradation, which may influence phosphoinositide signaling, vesicle trafficking, or viral persistence (61). Although POSTN mRNA levels were elevated in INR colon tissue, its protein levels were suppressed, suggesting a role for post-transcriptional regulation (60). N6-Methyladenosine (m6A) methylation of POSTN mRNA, particularly in the 3′ UTR, could mediate enhanced mRNA decay or impaired translation (60). These molecules may serve as candidate biomarkers for persistent mucosal immune dysregulation and provide mechanistic insights into failed immune reconstitution.
4.8 Parallels and distinctions with IBD
Interestingly, these findings exhibit several features that might relate to Inflammatory Bowel Disease (IBD), particularly through shared mechanisms of immune dysregulation and impaired gut barrier function. Both B cell dysfunction and altered immune responses are hallmark features of IBD, characterized by dysregulated innate and adaptive immune responses [reviewed in (67)]. Moreover, the hypothesis that impaired mucosal barrier function contributes to incomplete immune recovery in INR aligns with the pathogenic mechanisms observed in IBD, where increased intestinal permeability can lead to translocation of luminal antigens and microorganisms, contributing to intestinal inflammation [reviewed in (68)].
Notably, a recent study has shown that REG3α expression is absent in normal colonic tissue but is significantly induced in inflamed colonic biopsies, suggesting its potential role as a marker of inflammation in colonic conditions (69). Immunohistochemistry analyses indicated that REG3α was absent in colon from healthy controls but markedly upregulated in inflamed colonic tissue, suggesting its potential as a biomarker for colonic inflammation (69). We observed increased inflammation and immune activation in INR (16), which are common features in IBD, marked by chronic intestinal inflammation that triggers immune responses through similar pathways (70). Additionally, dysregulation in the adaptive immune response, cytokine signaling, and cellular processes related to tissue repair and growth are observed in IBD, where immune signalling and metabolic pathways are frequently altered, resulting in tissue damage and impaired repair mechanisms (67).
Furthermore, dysregulation of the adaptive immune response, cytokine signaling, and cellular mechanisms associated with tissue repair and growth has been noted in IBD (67). Within this framework, immune signaling and metabolic pathways frequently undergo alterations, resulting in tissue damage and hindered repair processes (66, 69).
While similarities can be identified between INR and IBD concerning disrupted immune and repair pathways, it is essential to acknowledge that persistent immune activation is also evident in IR, representing a shared characteristic among people living with HIV (70, 71). Consequently, instead of implying a direct disease overlap, upcoming research should investigate whether specific pathways or markers identified in IBD may have relevance for HIV-associated immune dysregulation, including INR (68, 70).
It is also important to emphasize that gut mucosal dysfunction should not be considered the sole driver of inflammation in PWH. Other contributing factors—including coinfections, immune senescence, and residual HIV viral replication—play significant roles in sustaining chronic immune activation (13, 15, 16).
Given these shared features, future research may benefit from exploring potential overlaps in pathways and biomarkers between IBD and INR, which could reveal therapeutic targets applicable to both. Specifically, dysregulation in B cell-mediated immunity, NK-cell interactions, and immune signaling pathways involved in tissue repair present viable avenues for targeted therapies. However, while such overlaps offer promising leads, these strategies must be carefully tailored to the distinct immunological context of INR (29, 70). A deeper understanding of the molecular mechanisms driving immune dysregulation in INR is essential before translating IBD-derived treatments, with careful consideration of safety, efficacy, and potential interactions with HIV-specific management strategies.
4.9 Strengths, limitations, and future directions
The strength of our study is the well characterized study groups matched on ethnicity, age, and sex for all groups and nadir CD4 T+ count for INR and IR. The biopsies were collected in the same hospital by the same gastroenterologist, from the same parts of the gut, using a well-defined protocol avoiding anatomical bias. Another important aspect of this study is that we investigated both the transcriptomic and proteomic regulation, which provide new insight to the pathogenesis of INR and a resource for developing novel adjuvant therapy. This study also has limitations such as low number of individuals and limited sample material per individual. Only one biopsy per individual was analyzed for RNA or protein regulation. As biopsies only sample a limited area of the mucosa, this can result in sampling bias. Finally, whereas we found markedly different regulation of several transcripts and proteins between INR and IR, the molecular mechanisms for these findings are not clear and the observed associations may not reflect direct causal relationships. Thus, functional validation and mechanistic investigation of these findings, such as through in vitro HIV infection models, B cell co-culture systems, or organoid-based approaches, are necessary to establish direct mechanistic roles, and should be prioritized in future studies.
5 Conclusions
We have shown that INR display a highly altered mucosal transcriptome and proteome compared to IR in the sigmoid colon, but not in the terminal ileum. This underscores previous findings implicating sigmoid colon, as opposed to terminal ileum, as an anatomic site linked to incomplete immune recovery in PWH. Our findings suggest that the impaired immunological response in INR is associated with extensive transcriptional and protein dysregulation in the sigmoid colon.
The differentially regulated factors should be candidates for further research targeting adjuvant therapy to improve the prognosis and quality of life for PWH and incomplete immune recovery. Integration of transcriptomic and proteomic datasets highlighted a small group of dysregulated markers, PI4KA, EIF1, RWDD1, and POSTN, that distinguished INR from IR and HC. These molecules may serve as candidate biomarkers for persistent mucosal immune dysregulation and provide mechanistic insights into failed immune reconstitution. The shared mechanisms of immune dysregulation and impaired gut barrier function observed in both INR and IBD suggest a promising avenue for exploring common therapeutic targets between these conditions. However, given the distinct immunological challenges posed by INR, further research is essential to fully understand the molecular underpinnings of these dysregulations and to adapt IBD treatment strategies accordingly.
Data availability statement
The datasets presented in this study can be found in online repositories. The names of the repository/repositories and accession number(s) can be found in the article/Supplementary Material.
Ethics statement
The studies involving humans were approved by The Regional Committee for Medical and Health Research Ethics in Norway, approval id 2015/2125. The studies were conducted in accordance with the local legislation and institutional requirements. The participants provided their written informed consent to participate in this study.
Author contributions
MK: Project administration, Formal Analysis, Resources, Writing – original draft, Conceptualization, Writing – review & editing, Methodology, Investigation. MY: Methodology, Data curation, Formal Analysis, Investigation, Writing – review & editing. MHM-M: Methodology, Writing – review & editing, Formal Analysis, Data curation, Investigation, Conceptualization. AYMS: Investigation, Writing – review & editing, Formal Analysis, Methodology. MMLdS: Methodology, Writing – review & editing, Data curation, Investigation, Formal Analysis. AS: Methodology, Data curation, Formal Analysis, Writing – review & editing, Investigation. AM: Resources, Supervision, Writing – review & editing, Methodology. AMD-R: Supervision, Funding acquisition, Writing – review & editing, Resources, Project administration. DK: Writing – review & editing, Resources, Supervision, Funding acquisition. JRH: Resources, Methodology, Supervision, Writing – review & editing. PA: Supervision, Investigation, Conceptualization, Writing – review & editing. MB: Resources, Writing – review & editing, Investigation, Supervision, Conceptualization. DHR: Writing – review & editing, Funding acquisition, Investigation, Supervision, Project administration, Resources, Conceptualization, Formal Analysis, Methodology, Data curation.
Funding
The author(s) declare financial support was received for the research and/or publication of this article. Funding for this research was provided by the South-Eastern Norway Regional Health Authority (Grant #2016018) and the Stiftelsen Kristian Gerhard Jebsen (K.G. Jebsen Inflammation Research Centre).
Acknowledgments
We thank all of the study participants and Hanne Guldsten (OUH) and PROMEC (NTNU) for technical assistance. Thanks to Dr Ingrid Lovise Augestad for assistance with statistics and Dr Wayne Murrell for proofreading the manuscript. Proteomics data storage and handling are supported under the Norwegian research data archival system (NIRD)/Notur project.
Conflict of interest
The authors declare that the research was conducted in the absence of any commercial or financial relationships that could be construed as a potential conflict of interest.
Generative AI statement
The author(s) declare that Generative AI was used in the creation of this manuscript. The GPT UiO service, developed by the IT department at the University of Oslo (UiO) using the GPT-4 model, was utilized for language refinement. The initial version of the manuscript was submitted in its entirety, and the model was instructed to “rewrite this text to improve its grammatical accuracy.” The final output was then fact-checked and revised by the authors.
Any alternative text (alt text) provided alongside figures in this article has been generated by Frontiers with the support of artificial intelligence and reasonable efforts have been made to ensure accuracy, including review by the authors wherever possible. If you identify any issues, please contact us.
Publisher’s note
All claims expressed in this article are solely those of the authors and do not necessarily represent those of their affiliated organizations, or those of the publisher, the editors and the reviewers. Any product that may be evaluated in this article, or claim that may be made by its manufacturer, is not guaranteed or endorsed by the publisher.
Supplementary material
The Supplementary Material for this article can be found online at: https://www.frontiersin.org/articles/10.3389/fimmu.2025.1635523/full#supplementary-material
References
1. UNAIDS. Fact Sheet 2025 (2025). Available online at: https://www.unaids.org/sites/default/files/media_asset/UNAIDS_FactSheet_en.pdf (Accessed July 01, 2025).
2. Engsig FN, Zangerle R, Katsarou O, Dabis F, Reiss P, Gill J, et al. Long-term mortality in HIV-positive individuals virally suppressed for >3 years with incomplete CD4 recovery. Clin Infect Dis: Off Publ Infect Dis Soc America. (2014) 58:1312–21. doi: 10.1093/cid/ciu038
3. Casotti JA, Passos LN, Oliveira FJ, and Cerutti C Jr. Factors associated with paradoxical immune response to antiretroviral therapy in HIV infected patients: a case control study. BMC Infect Dis. (2011) 11:306. doi: 10.1186/1471-2334-11-306
4. Kaufmann GR, Furrer H, Ledergerber B, Perrin L, Opravil M, Vernazza P, et al. Characteristics, determinants, and clinical relevance of CD4 T cell recovery to <500 cells/microL in HIV type 1-infected individuals receiving potent antiretroviral therapy. Clin Infect Dis: Off Publ Infect Dis Soc America. (2005) 41:361–72. doi: 10.1086/431484
5. Zoufaly A, an der Heiden M, Kollan C, Bogner JR, Fätkenheuer G, Wasmuth JC, et al. Clinical outcome of HIV-infected patients with discordant virological and immunological response to antiretroviral therapy. J Infect Dis. (2011) 203:364–71. doi: 10.1093/jinfdis/jiq055
6. Helleberg M, Kronborg G, Larsen CS, Pedersen G, Pedersen C, Obel N, et al. Poor CD4 response despite viral suppression is associated with increased non-AIDS-related mortality among HIV patients and their parents. AIDS (London England). (2013) 27:1021–6. doi: 10.1097/QAD.0b013e32835cba4c
7. Helleberg M, Kronborg G, Larsen CS, Pedersen G, Pedersen C, Obel N, et al. CD4 decline is associated with increased risk of cardiovascular disease, cancer, and death in virally suppressed patients with HIV. Clin Infect Dis: Off Publ Infect Dis Soc America. (2013) 57:314–21. doi: 10.1093/cid/cit232
8. Jiang W, Lederman MM, Hunt P, Sieg SF, Haley K, Rodriguez B, et al. Plasma levels of bacterial DNA correlate with immune activation and the magnitude of immune restoration in persons with antiretroviral-treated HIV infection. J Infect Dis. (2009) 199:1177–85. doi: 10.1086/597476
9. Marchetti G, Bellistrì GM, Borghi E, Tincati C, Ferramosca S, La Francesca M, et al. Microbial translocation is associated with sustained failure in CD4+ T-cell reconstitution in HIV-infected patients on long-term highly active antiretroviral therapy. AIDS (London England). (2008) 22:2035–8. doi: 10.1097/QAD.0b013e3283112d29
10. Merlini E, Bai F, Bellistrì GM, Tincati C, d’Arminio Monforte A, and Marchetti G. Evidence for polymicrobic flora translocating in peripheral blood of HIV-infected patients with poor immune response to antiretroviral therapy. PloS One. (2011) 6:e18580. doi: 10.1371/journal.pone.0018580
11. Trøseid M, Nowak P, Nyström J, Lindkvist A, Abdurahman S, and Sönnerborg A. Elevated plasma levels of lipopolysaccharide and high mobility group box-1 protein are associated with high viral load in HIV-1 infection: reduction by 2-year antiretroviral therapy. AIDS (London England). (2010) 24:1733–7. doi: 10.1097/QAD.0b013e32833b254d
12. Piconi S, Trabattoni D, Gori A, Parisotto S, Magni C, Meraviglia P, et al. Immune activation, apoptosis, and Treg activity are associated with persistently reduced CD4+ T-cell counts during antiretroviral therapy. AIDS (London England). (2010) 24:1991–2000. doi: 10.1097/QAD.0b013e32833c93ce
13. Khan S, Telwatte S, Trapecar M, Yukl S, and Sanjabi S. Differentiating immune cell targets in gut-associated lymphoid tissue for HIV cure. AIDS Res Hum Retroviruses. (2017) 33:S40–s58. doi: 10.1089/aid.2017.0153
14. Chun TW, Nickle DC, Justement JS, Meyers JH, Roby G, Hallahan CW, et al. Persistence of HIV in gut-associated lymphoid tissue despite long-term antiretroviral therapy. J Infect Dis. (2008) 197:714–20. doi: 10.1086/527324
15. Massanella M, Negredo E, Clotet B, and Blanco J. Immunodiscordant responses to HAART–mechanisms and consequences. Expert Rev Clin Immunol. (2013) 9:1135–49. doi: 10.1586/1744666X.2013.842897
16. Meyer-Myklestad MH, Medhus AW, Lorvik KB, Seljeflot I, Hansen SH, Holm K, et al. Human immunodeficiency virus-infected immunological nonresponders have colon-restricted gut mucosal immune dysfunction. J Infect Dis. (2022) 225:661–74. doi: 10.1093/infdis/jiaa714
17. Lorvik KB, Meyer-Myklestad MH, Kushekar K, Handeland C, Medhus AW, Lund-Iversen M, et al. Enhanced gut-homing dynamics and pronounced exhaustion of mucosal and blood CD4(+) T cells in HIV-infected immunological non-responders. Front Immunol. (2021) 12:744155. doi: 10.3389/fimmu.2021.744155
18. Moen AE, Tannæs TM, Vatn S, Ricanek P, Vatn MH, and Jahnsen J. Simultaneous purification of DNA and RNA from microbiota in a single colonic mucosal biopsy. BMC Res Notes. (2016) 9:328. doi: 10.1186/s13104-016-2110-7
19. Pfister S KV. Ferrero E granulator: Rapid benchmarking of methods for *in silico* deconvolution of bulk RNA-seq data. (2024). doi: 10.18129/B9.bioc.granulator
20. Gong T and Szustakowski JD. DeconRNASeq: a statistical framework for deconvolution of heterogeneous tissue samples based on mRNA-Seq data. Bioinformatics. (2013) 29:1083–5. doi: 10.1093/bioinformatics/btt090
21. Mootha VK, Lindgren CM, Eriksson KF, Subramanian A, Sihag S, Lehar J, et al. PGC-1alpha-responsive genes involved in oxidative phosphorylation are coordinately downregulated in human diabetes. Nat Genet. (2003) 34:267–73. doi: 10.1038/ng1180
22. Subramanian A, Tamayo P, Mootha VK, Mukherjee S, Ebert BL, Gillette MA, et al. Gene set enrichment analysis: a knowledge-based approach for interpreting genome-wide expression profiles. Proc Natl Acad Sci U S A. (2005) 102:15545–50. doi: 10.1073/pnas.0506580102
23. Scopes RK. Measurement of protein by spectrophotometry at 205 nm. Analytical Biochem. (1974) 59:277–82. doi: 10.1016/0003-2697(74)90034-7
24. Tyanova S, Temu T, and Cox J. The MaxQuant computational platform for mass spectrometry-based shotgun proteomics. Nat Protoc. (2016) 11:2301–19. doi: 10.1038/nprot.2016.136
25. Haynes W. Benjamini–hochberg method. In: Dubitzky W, Wolkenhauer O, Cho K-H, and Yokota H, editors. Encyclopedia of Systems Biology. Springer New York, New York, NY (2013). p. 78.
26. Vizcaíno JA, Csordas A, del-Toro N, Dianes JA, Griss J, Lavidas I, et al. update of the PRIDE database and its related tools. Nucleic Acids Res. (2016) 44:D447–56. doi: 10.1093/nar/gkv1145
27. McHugh ML. The chi-square test of independence. Biochem Med. (2013) 23:143–9. doi: 10.11613/BM.2013.018
28. Engsig FN, Gerstoft J, Kronborg G, Larsen CS, Pedersen G, Røge B, et al. Long-term mortality in HIV patients virally suppressed for more than three years with incomplete CD4 recovery: a cohort study. BMC Infect Dis. (2010) 10:318. doi: 10.1186/1471-2334-10-318
29. Liu X, Lin L, Lu L, Li X, Han Y, Qiu Z, et al. Comparative transcriptional analysis identified characteristic genes and patterns in HIV-infected immunological non-responders. Front Immunol. (2022) 13:807890. doi: 10.3389/fimmu.2022.807890
30. Lane BR, Strieter RM, Coffey MJ, and Markovitz DM. Human immunodeficiency virus type 1 (HIV-1)-induced GRO-alpha production stimulates HIV-1 replication in macrophages and T lymphocytes. J Virol. (2001) 75:5812–22. doi: 10.1128/JVI.75.13.5812-5822.2001
31. Lane BR, Lore K, Bock PJ, Andersson J, Coffey MJ, Strieter RM, et al. Interleukin-8 stimulates human immunodeficiency virus type 1 replication and is a potential new target for antiretroviral therapy. J Virol. (2001) 75:8195–202. doi: 10.1128/JVI.75.17.8195-8202.2001
32. Cicala C, Arthos J, Selig SM, Dennis G Jr., Hosack DA, Van Ryk D, et al. HIV envelope induces a cascade of cell signals in non-proliferating target cells that favor virus replication. Proc Natl Acad Sci U S A. (2002) 99:9380–5. doi: 10.1073/pnas.142287999
33. Pallikkuth S, Parmigiani A, and Pahwa S. The role of interleukin-21 in HIV infection. Cytokine Growth Factor Rev. (2012) 23:173–80. doi: 10.1016/j.cytogfr.2012.05.004
34. Shive CL, Freeman ML, Younes SA, Kowal CM, Canaday DH, Rodriguez B, et al. Markers of T cell exhaustion and senescence and their relationship to plasma TGF-β Levels in treated HIV+ Immune non-responders. Front Immunol. (2021) 12:638010. doi: 10.3389/fimmu.2021.638010
35. Wallace Z, Heunis T, Paterson RL, Suckling RJ, Grant T, Dembek M, et al. Instability of the HLA-E peptidome of HIV presents a major barrier to therapeutic targeting. Mol Ther. (2024) 32:678–88. doi: 10.1016/j.ymthe.2024.01.010
36. Jost S, Lucar O, Lee E, Yoder T, Kroll K, Sugawara S, et al. Antigen-specific memory NK cell responses against HIV and influenza use the NKG2/HLA-E axis. Sci Immunol. (2023) 8:eadi3974. doi: 10.1126/sciimmunol.adi3974
37. Naamati A, Williamson JC, Greenwood EJ, Marelli S, Lehner PJ, and Matheson NJ. Functional proteomic atlas of HIV infection in primary human CD4+ T cells. Elife. (2019) 8. doi: 10.7554/eLife.41431
38. Kiniry BE, Hunt PW, Hecht FM, Somsouk M, Deeks SG, and Shacklett BL. Differential expression of CD8(+) T cell cytotoxic effector molecules in blood and gastrointestinal mucosa in HIV-1 infection. J Immunol (Baltimore Md: 1950). (2018) 200:1876–88. doi: 10.4049/jimmunol.1701532
39. Geleziunas R, Xu W, Takeda K, Ichijo H, and Greene WC. HIV-1 Nef inhibits ASK1-dependent death signalling providing a potential mechanism for protecting the infected host cell. Nature. (2001) 410:834–8. doi: 10.1038/35071111
40. Miyakawa K, Matsunaga S, Kanou K, Matsuzawa A, Morishita R, Kudoh A, et al. ASK1 restores the antiviral activity of APOBEC3G by disrupting HIV-1 Vif-mediated counteraction. Nat Commun. (2015) 6:6945. doi: 10.1038/ncomms7945
41. Chen Y, Hwang SL, Chan VS, Chung NP, Wang SR, Li Z, et al. Binding of HIV-1 gp120 to DC-SIGN promotes ASK-1-dependent activation-induced apoptosis of human dendritic cells. PloS Pathog. (2013) 9:e1003100. doi: 10.1371/journal.ppat.1003100
42. Stumptner-Cuvelette P, Morchoisne S, Dugast M, Le Gall S, Raposo G, Schwartz O, et al. HIV-1 Nef impairs MHC class II antigen presentation and surface expression. Proc Natl Acad Sci U S A. (2001) 98:12144–9. doi: 10.1073/pnas.221256498
43. Forlani G, Turrini F, Ghezzi S, Tedeschi A, Poli G, Accolla RS, et al. The MHC-II transactivator CIITA inhibits Tat function and HIV-1 replication in human myeloid cells. J Trans Med. (2016) 14:94. doi: 10.1186/s12967-016-0853-5
44. Porter KA, Kelley LN, Nekorchuk MD, Jones JH, Hahn AB, de Noronha CM, et al. CIITA enhances HIV-1 attachment to CD4+ T cells leading to enhanced infection and cell depletion. J Immunol (Baltimore Md: 1950). (2010) 185:6480–8. doi: 10.4049/jimmunol.1000830
45. Hinnebusch AG. Structural insights into the mechanism of scanning and start codon recognition in eukaryotic translation initiation. Trends Biochem Sci. (2017) 42:589–611. doi: 10.1016/j.tibs.2017.03.004
46. Perissi V, Aggarwal A, Glass CK, Rose DW, and Rosenfeld MG. A corepressor/coactivator exchange complex required for transcriptional activation by nuclear receptors and other regulated transcription factors. Cell. (2004) 116:511–26. doi: 10.1016/S0092-8674(04)00133-3
47. Li X, Liu X, Qin Z, Wei M, Hou X, Zhang T, et al. A novel transcription factor Rwdd1 and its SUMOylation inhibit the expression of sqr, a key gene of mitochondrial sulfide metabolism in Urechis unicinctus. Aquat Toxicol (Amsterdam Netherlands). (2018) 204:180–9. doi: 10.1016/j.aquatox.2018.09.012
48. Wang Z, An J, Zhu D, Chen H, Lin A, Kang J, et al. Periostin: an emerging activator of multiple signaling pathways. J Cell Commun Signaling. (2022) 16(4):515–30. doi: 10.1007/s12079-022-00674-2
49. Yu KW, Yao CC, Jeng JH, Shieh HY, and Chen YJ. Periostin inhibits mechanical stretch-induced apoptosis in osteoblast-like MG-63 cells. J Formosan Med Assoc. (2018) 117:292–300. doi: 10.1016/j.jfma.2017.12.008
50. Bennett CG, Riemondy K, Chapnick DA, Bunker E, Liu X, Kuersten S, et al. Genome-wide analysis of Musashi-2 targets reveals novel functions in governing epithelial cell migration. Nucleic Acids Res. (2016) 44:3788–800. doi: 10.1093/nar/gkw207
51. Atkinson MJ, Cowan MJ, and Feeney AJ. New alleles of IGKV genes A2 and A18 suggest significant human IGKV locus polymorphism. Immunogenetics. (1996) 44:115–20. doi: 10.1007/s002510050098
52. Ranasinghe S, Cutler S, Davis I, Lu R, Soghoian DZ, Qi Y, et al. Association of HLA-DRB1-restricted CD4+ T cell responses with HIV immune control. Nat Med. (2013) 19:930–3. doi: 10.1038/nm.3229
53. Ferre AL, Hunt PW, McConnell DH, Morris MM, Garcia JC, Pollard RB, et al. HIV controllers with HLA-DRB1*13 and HLA-DQB1*06 alleles have strong, polyfunctional mucosal CD4+ T-cell responses. J Virol. (2010) 84:11020–9. doi: 10.1128/JVI.00980-10
54. Yang P, Yang Y, Sun P, Tian Y, Gao F, Wang C, et al. βII spectrin (SPTBN1): biological function and clinical potential in cancer and other diseases. Int J Biol Sci. (2021) 17:32–49. doi: 10.7150/ijbs.52375
55. Chacinska A, Koehler CM, Milenkovic D, Lithgow T, and Pfanner N. Importing mitochondrial proteins: machineries and mechanisms. Cell. (2009) 138:628–44. doi: 10.1016/j.cell.2009.08.005
56. Cai R, Liu L, Luo B, Wang J, Shen J, Shen Y, et al. Caspase-1 activity in CD4 T cells is downregulated following antiretroviral therapy for HIV-1 infection. AIDS Res Hum Retroviruses. (2017) 33:164–71. doi: 10.1089/aid.2016.0234
57. Niedzwiecka K, Baranowska E, Panja C, and Kucharczyk R. ATP synthase subunit a supports permeability transition in yeast lacking dimerization subunits and modulates yPTP conductance. Cell Physiol Biochem. (2020) 54:211–29. doi: 10.33594/000000215
58. Cogliati S, Cabrera-Alarcón JL, and Enriquez JA. Regulation and functional role of the electron transport chain supercomplexes. Biochem Soc Trans. (2021) 49:2655–68. doi: 10.1042/BST20210460
59. Esposito F, Tornincasa M, Federico A, Chiappetta G, Pierantoni GM, and Fusco A. High-mobility group A1 protein inhibits p53-mediated intrinsic apoptosis by interacting with Bcl-2 at mitochondria. Cell Death Dis. (2012) 3:e383. doi: 10.1038/cddis.2012.126
60. Jiang X, Liu B, Nie Z, Duan L, Xiong Q, Jin Z, et al. The role of m6A modification in the biological functions and diseases. Signal Transduct Targeted Ther. (2021) 6:74. doi: 10.1038/s41392-020-00450-x
61. McPhail JA and Burke JE. Molecular mechanisms of PI4K regulation and their involvement in viral replication. Traffic. (2023) 24:131–45. doi: 10.1111/tra.12841
62. Estes JD, Kityo C, Ssali F, Swainson L, Makamdop KN, Del Prete GQ, et al. Defining total-body AIDS-virus burden with implications for curative strategies. Nat Med. (2017) 23:1271–6. doi: 10.1038/nm.4411
63. Hu S, Buser E, Arredondo J, Relyea D, Santos Rocha C, and Dandekar S. Altered expression of ACE2 and co-receptors of SARS-coV-2 in the gut mucosa of the SIV model of HIV/AIDS. Front Microbiol. (2022) 13:879152. doi: 10.3389/fmicb.2022.879152
64. Zhang K, Kang L, Zhang H, Bai L, Pang H, Liu Q, et al. A synonymous mutation in PI4KA impacts the transcription and translation process of gene expression. Front Immunol. (2022) 13:987666. doi: 10.3389/fimmu.2022.987666
65. Wang R, Kato F, Watson RY, Beedle AM, Call JA, Tsunoda Y, et al. The RNA-binding protein Msi2 regulates autophagy during myogenic differentiation. Life Sci Alliance. (2024) 7. doi: 10.26508/lsa.202302016
66. Koh SJ, Choi Y, Kim BG, Lee KL, Kim DW, Kim JH, et al. Matricellular protein periostin mediates intestinal inflammation through the activation of nuclear factor κB signaling. PloS One. (2016) 11:e0149652. doi: 10.1371/journal.pone.0149652
67. Saez A, Herrero-Fernandez B, Gomez-Bris R, Sánchez-Martinez H, and Gonzalez-Granado JM. Pathophysiology of inflammatory bowel disease: innate immune system. Int J Mol Sci. (2023) 24. doi: 10.3390/ijms24021526
68. Michielan A and D’Incà R. Intestinal permeability in inflammatory bowel disease: pathogenesis, clinical evaluation, and therapy of leaky gut. Mediators Inflamm. (2015) 2015:628157. doi: 10.1155/2015/628157
69. Perez K, Ngollo M, Rabinowitz K, Hammoudi N, Seksik P, Xavier RJ, et al. Meta-analysis of IBD gut samples gene expression identifies specific markers of ileal and colonic diseases. Inflammation Bowel Dis. (2022) 28:775–82. doi: 10.1093/ibd/izab311
70. Alzahrani J, Hussain T, Simar D, Palchaudhuri R, Abdel-Mohsen M, Crowe SM, et al. Inflammatory and immunometabolic consequences of gut dysfunction in HIV: Parallels with IBD and implications for reservoir persistence and non-AIDS comorbidities. EBioMedicine. (2019) 46:522–31. doi: 10.1016/j.ebiom.2019.07.027
Keywords: immunological non-responders, mucosal immunology, inflammatory bowel disease, metabolic, gut mucosa, lamina propria, RNA-seq, shotgun mass spectrometry
Citation: Kaarbø M, Yang M, Meyer-Myklestad MH, Sundaram AYM, de Sousa MML, Sharma A, Medhus AW, Dyrhol-Riise AM, Kvale D, Hov JR, Aukrust P, Bjørås M and Reikvam DH (2025) Transcriptomic and proteomic profiling reveal immune and metabolic dysregulation in the colonic mucosa of people living with HIV with incomplete immune recovery. Front. Immunol. 16:1635523. doi: 10.3389/fimmu.2025.1635523
Received: 26 May 2025; Accepted: 27 August 2025;
Published: 17 September 2025.
Edited by:
Claudia Matteucci, University of Rome Tor Vergata, ItalyReviewed by:
Christina K. Psomas, Hôpital Européen Marseille, FranceXiaojun Chen, Nanjing Medical University, China
Copyright © 2025 Kaarbø, Yang, Meyer-Myklestad, Sundaram, de Sousa, Sharma, Medhus, Dyrhol-Riise, Kvale, Hov, Aukrust, Bjørås and Reikvam. This is an open-access article distributed under the terms of the Creative Commons Attribution License (CC BY). The use, distribution or reproduction in other forums is permitted, provided the original author(s) and the copyright owner(s) are credited and that the original publication in this journal is cited, in accordance with accepted academic practice. No use, distribution or reproduction is permitted which does not comply with these terms.
*Correspondence: Mari Kaarbø, bWFyaS5rYWFyYm9AbWVkaXNpbi51aW8ubm8=; Magnar Bjørås, bWFnbmFyLmJqb3Jhc0BudG51Lm5v
†These authors share last authorship