 Yanfei Jiang1,2
 Kaida Mu2
 Zhaowei Huang2Xinwei Zhang2Yalin Wang2
 Wenyu Xu2
 Ronghua Song2*
 Jinan Zhang1,2*
- 1Graduate School, Shanghai University of Traditional Chinese Medicine, Shanghai, China
- 2Department of Endocrinology & Rheumatology, Shanghai University of Medicine & Health Sciences Affiliated Zhoupu Hospital, Shanghai, China
Introduction: Graves’ disease (GD) is an organ-specific autoimmune disorder characterized by the presence of thyroid-stimulating hormone receptor autoantibodies (TRAb), leading to hyperthyroidism. While genetic and environmental factors contribute to GD pathogenesis, the role of epigenetic mechanisms, particularly in regulating Th17-associated cytokines, remains poorly understood.
Methods: This study aimed to characterize the promoter methylation profiles of IL17, IL21, and IL22 in GD patients, evaluate their diagnostic potential, and explore correlations with clinical parameters. Targeted bisulfite sequencing was performed on peripheral blood mononuclear cells from 60 GD patients, including newly diagnosed and refractory individuals, and 60 matched healthy controls.
Results: Significant hypomethylation at IL17, IL21, and IL22 promoter regions was observed in GD patients compared with controls (P = 2.5 × 10⁻⁷), with partial methylation restoration in refractory cases. Four specific CpG sites were identified as potential biomarkers, demonstrating good diagnostic performance with area under the curve (AUC) values exceeding 0.7, including chr4_123542549_R (AUC = 0.754) and chr12_68647247_R (AUC = 0.752). These sites were associated with elevated TRAb (OR = 4.00, P = 0.02) and FT4 levels (OR = 0.29, P = 0.02), respectively.
Discussion: Our findings highlight Th17-related epigenetic dysregulation as a key feature of GD and support the potential of methylation markers for diagnostic and therapeutic monitoring applications.
1 Introduction
Graves’ disease (GD) is a prototypical organ-specific autoimmune thyroid disorder characterized by hyperthyroidism mediated by thyroid-stimulating hormone receptor autoantibodies (TRAb), along with thyroid follicular epithelial hyperplasia and lymphocytic infiltration of the gland (1, 2). Its pathogenesis involves a complex interplay between genetic predisposition and environmental triggers. Genetic variants in immune-regulatory genes such as HLA, CTLA4, and PTPN22 are strongly associated with increased susceptibility to GD (3, 4), while environmental exposures are recognized as critical contributors to disease initiation and progression (5, 6).
Emerging evidence has shown elevated frequencies of peripheral Th17 cells in GD patients, correlating positively with TRAb titers (7). Th17-related cytokines—interleukin (IL)-17, IL-21, and IL-22—play distinct and complementary roles in the pathogenesis of autoimmune diseases. IL-17 promotes the recruitment of inflammatory cells and tissue remodeling; IL-21 facilitates B cell differentiation and autoantibody production; and IL-22 modulates epithelial barrier integrity and influences the local thyroid immune microenvironment (8–10). While their immunological functions in GD have been well established, the epigenetic regulation of these cytokines—particularly DNA methylation of their promoter regions—remains poorly defined (11, 12).
DNA methylation, a key epigenetic mechanism involving the addition of methyl groups to CpG dinucleotides, is essential for the regulation of gene expression and has been implicated in the pathogenesis of multiple autoimmune diseases (13–15). Hypomethylation of immune-related genes can result in aberrant T and B lymphocyte activation, aggravating inflammatory responses and promoting disease progression (16, 17). Previous studies suggest that methylation changes in cytokine genes may modulate their transcription and contribute to immune dysregulation in GD (18). Furthermore, environmental factors such as endocrine-disrupting chemicals may exacerbate GD by disrupting thyroid hormone signaling and interfering with epigenetic regulation (19). A comprehensive understanding of the interplay among genetic susceptibility, environmental factors, and epigenetic modifications is therefore essential for elucidating the molecular mechanisms underlying GD and identifying novel therapeutic targets (20).
In this study, we employed targeted bisulfite sequencing to assess the DNA methylation status of the promoter regions of IL17, IL21, and IL22 in peripheral blood mononuclear cells (PBMCs) from GD patients (21). Using machine learning algorithms, we developed a CpG-based diagnostic model and, for the first time, compared methylation profiles between newly diagnosed GD (NGD) and refractory GD (RGD) cases (22). By correlating methylation patterns with clinical parameters such as TRAb and FT4, we aimed to elucidate the role of Th17-associated epigenetic dysregulation in GD progression and identify potential biomarkers for disease diagnosis and therapeutic monitoring.
2 Materials & methods
2.1 Study population
This study was conducted at Zhoupu Hospital, Shanghai, China, between August 2023 and January 2025. A total of 120 Han Chinese individuals were enrolled, including 60 patients diagnosed with GD and 60 age- and sex-matched healthy controls. Participants were recruited from the Department of Endocrinology and the Physical Examination Center. Baseline demographic and clinical characteristics are summarized in Table 1.
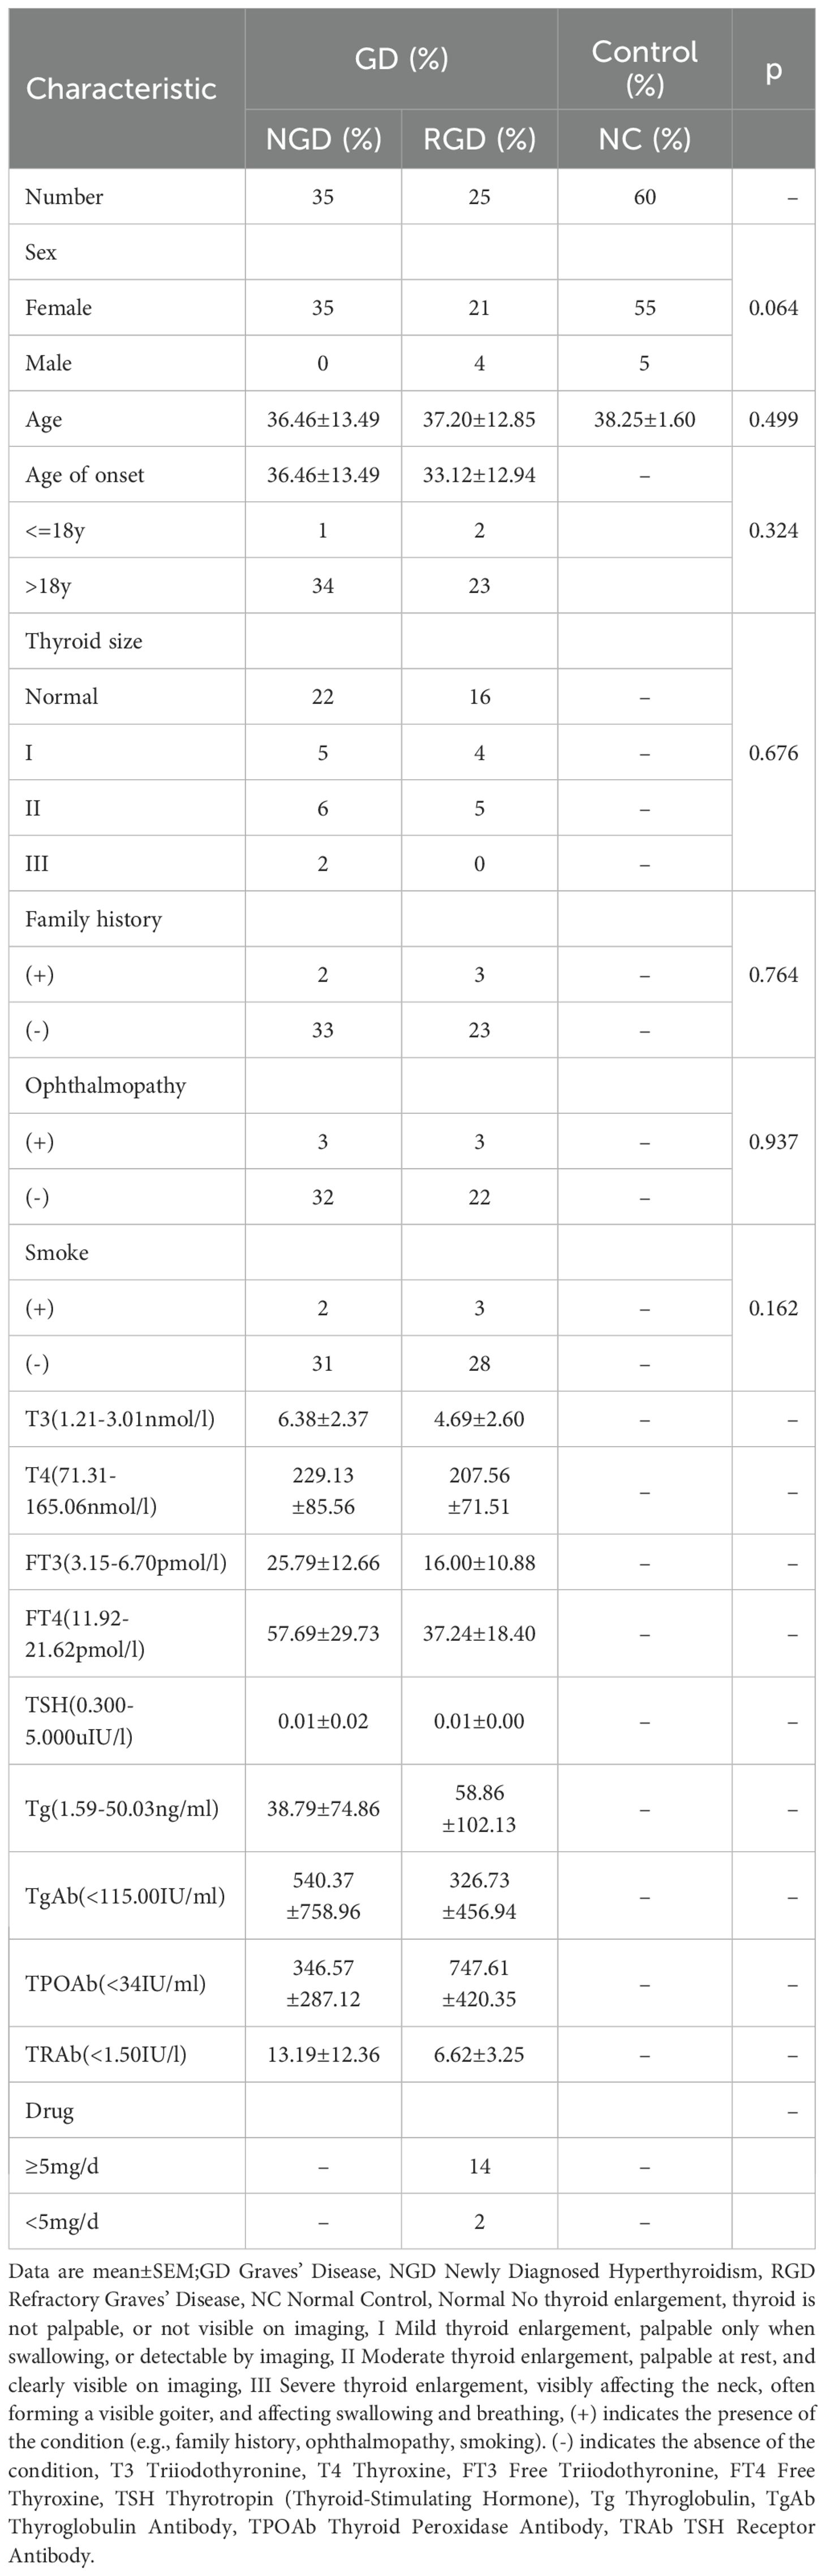
Table 1. Characteristics of patients with GD and controls.
To investigate disease phenotypes, GD patients were further stratified into two subgroups: (1) NGD, defined as patients with first-time diagnosis of hyperthyroidism and no prior treatment; and (2) RGD, defined as patients with a disease duration >2 years, persistent or recurrent hyperthyroid symptoms, and positive TRAb levels (≥1.5 IU/L) despite standard treatment. Clinical data collected included age at onset, thyroid size, presence of ophthalmopathy, smoking status, and family history of hyperthyroidism (defined as having at least one first-degree relative affected). Drug history was recorded for methimazole (MMI), and patients were categorized according to their daily dosage (≥5 mg/day or <5 mg/day).The study was approved by the Ethics Committee of Shanghai Health Medical College (Approval No. 2023-C-123-E01), and written informed consent was obtained from all participants.
2.2 Thyroid function assessment and inclusion/exclusion criteria
GD diagnosis was based on clinical symptoms, laboratory findings, and thyroid ultrasonography. Fasting venous blood samples (10 mL, non-anticoagulated) were collected after ≥8 hours of fasting. Thyroid function was assessed using electrochemiluminescence (ECL) assays. Inclusion criteria for GD comprised: clinical manifestations of hyperthyroidism, suppressed serum TSH levels, positive TRAb, and ultrasonographic evidence of diffuse goiter.
Healthy controls were selected from individuals with normal physical and biochemical examination results and no history of chronic diseases. Control participants also provided fasting venous blood samples, and their thyroid peroxidase antibody (TPOAb) levels were assessed using ECL. Inclusion criteria for controls included TPOAb negativity and absence of a family history of autoimmune thyroid diseases (AITDs). Exclusion criteria for both groups included the presence of diffuse goiter or thyroid nodules >5 mm detected by ultrasonography, as well as a history or diagnosis of other autoimmune diseases.
2.3 DNA extraction
PBMCs were isolated from 5.0 mL of venous blood collected in EDTA-K2 tubes after overnight fasting. Genomic DNA was extracted using the Relaxgene DNA Isolation Kit (Tiangen Biotech, China) following the manufacturer’s instructions. DNA concentration and purity were assessed using a NanoDrop 2000 spectrophotometer (Thermo Scientific, USA). Only samples meeting the following quality criteria were included: concentration ≥20 ng/μL, OD260/280 ratio between 1.7–1.9, and OD260/230 ≥2.0.
2.4 DNA methylation analysis of IL17, IL21, and IL22
DNA methylation levels at the promoter regions of IL17, IL21, and IL22 genes were analyzed using the MethylTarget™ assay (Genesky Corporation, Shanghai, China). CpG-rich promoter regions (GC content >20%, length >200 bp) were selected, and two rounds of PCR were conducted per target gene. Methylation at each CpG site was quantified as the ratio of methylated to total cytosines. CpG site annotation was based on genomic coordinates. Primer sequences and PCR conditions are provided in Table 2 and Supplementary Table S1.
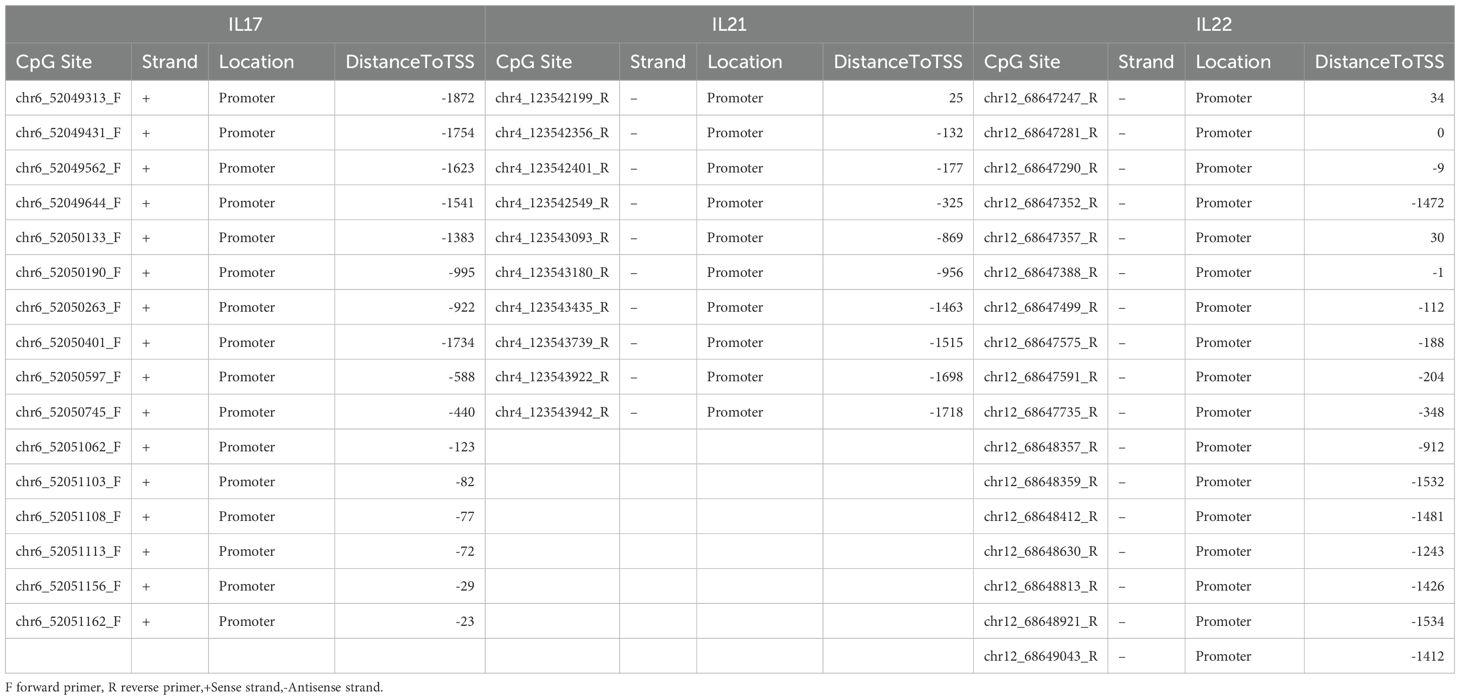
Table 2. IL17, IL21, IL22 CpG site annotation.
2.5 Diagnostic model construction using machine learning
To identify potential diagnostic biomarkers, four supervised machine learning algorithms were applied: Random Forest (RF), Support Vector Machine (SVM), Generalized Linear Model (GLM), and eXtreme Gradient Boosting (XGBoost). All models were implemented in R using the caret package (v7.0-1) with standardized preprocessing including mean-centering and near-zero variance filtering (23). Model performance was evaluated using repeated stratified 5-fold cross-validation (3 repetitions), with performance metrics averaged across all folds.
Model interpretability was assessed using Shapley additive explanations (SHAP), implemented via the DALEX R package (v2.4.3), to evaluate the relative importance of each CpG site based on cooperative game theory (24). Diagnostic performance was quantified using receiver operating characteristic (ROC) curves generated by the pROC package (v1.18.5), and the area under the curve (AUC) was interpreted as follows: <0.6, non-informative; 0.6–0.7, suboptimal; 0.7–0.9, moderate to strong; >0.9, excellent discrimination (25).
2.6 Correlation between methylation and clinical parameters
To explore the relationship between methylation profiles and clinical features of GD, patients were stratified by age, age at onset, sex, disease subtype, family history, presence of ophthalmopathy, smoking status, and thyroid function indices. FT3 and FT4 levels were dichotomized at their median values. TSH was categorized as ≤0.001 vs. >0.001 mIU/L, and TRAb as ≤1.5 vs. >1.5 IU/L. Variables with >50% missing data (e.g., T3, T4, Tg) were excluded.
Expression data were log2-transformed using the formula log2(X+1). Univariate binary logistic regression was performed using the glm function in R to identify significant predictors. Variables with p < 0.1 were included in multivariate logistic regression to identify independent associations, with significance set at p < 0.05. Statistical modeling was conducted using the rms (v6.4.0) and ResourceSelection (v0.3.5) R packages.
2.7 Statistical analysis
Methylation data are presented as mean±standard error of the mean (SEM). Normally distributed continuous variables are shown as mean±standard deviation (SD), while non-normally distributed data are expressed as median with interquartile range (IQR). Group comparisons were conducted using independent samples t-tests or Mann–Whitney U tests, as appropriate. Correlations between methylation levels and clinical variables were evaluated using Spearman’s rank correlation coefficient. Categorical variables were analyzed using Chi-square or Fisher’s exact tests.
Univariate binary logistic regression was performed to evaluate associations between clinical features and methylation subgroups, and odds ratios (ORs) with 95% confidence intervals (CIs) were calculated. Variables with p < 0.1 in univariate analysis were included in multivariate logistic regression to identify independent predictors (p < 0.05). All statistical analyses, including data preprocessing, descriptive statistics, and regression modeling, were conducted using SPSS version 26.0 (IBM Corp., Armonk, NY, USA) and R version 4.3.3 (R Core Team, Vienna, Austria).
3 Results
3.1 Reduced methylation levels of IL17, IL21, and IL22 promoter regions in GD patients
To investigate DNA methylation alterations across different stages of Graves’ disease (GD), we enrolled 35 NGD patients, 25 RGD patients, and 60 NCs. PBMCs were isolated and subjected to DNA extraction. Following stringent quality control, promoter regions of the Th17-related cytokines IL17, IL21, and IL22 with GC content >20% were selected for methylation analysis.
Compared to NCs, the majority of CpG sites in GD patients exhibited significantly reduced methylation levels, with high intra-group consistency (Supplementary Figures S1A-F). Principal component analysis (PCA) of methylation profiles clearly distinguished GD patients from controls (Figures 1A–C), and revealed a significant overall decrease in methylation levels in GD patients (P=2.5 × 10⁻⁷, Figure 1D). Both NGD (P=1.4 × 10⁻⁷) and RGD (P=6.6 × 10⁻⁷) groups showed significantly lower methylation compared to NCs, with NGD exhibiting the most pronounced hypomethylation, suggesting stage-specific methylation dynamics (Figures 1E–F).
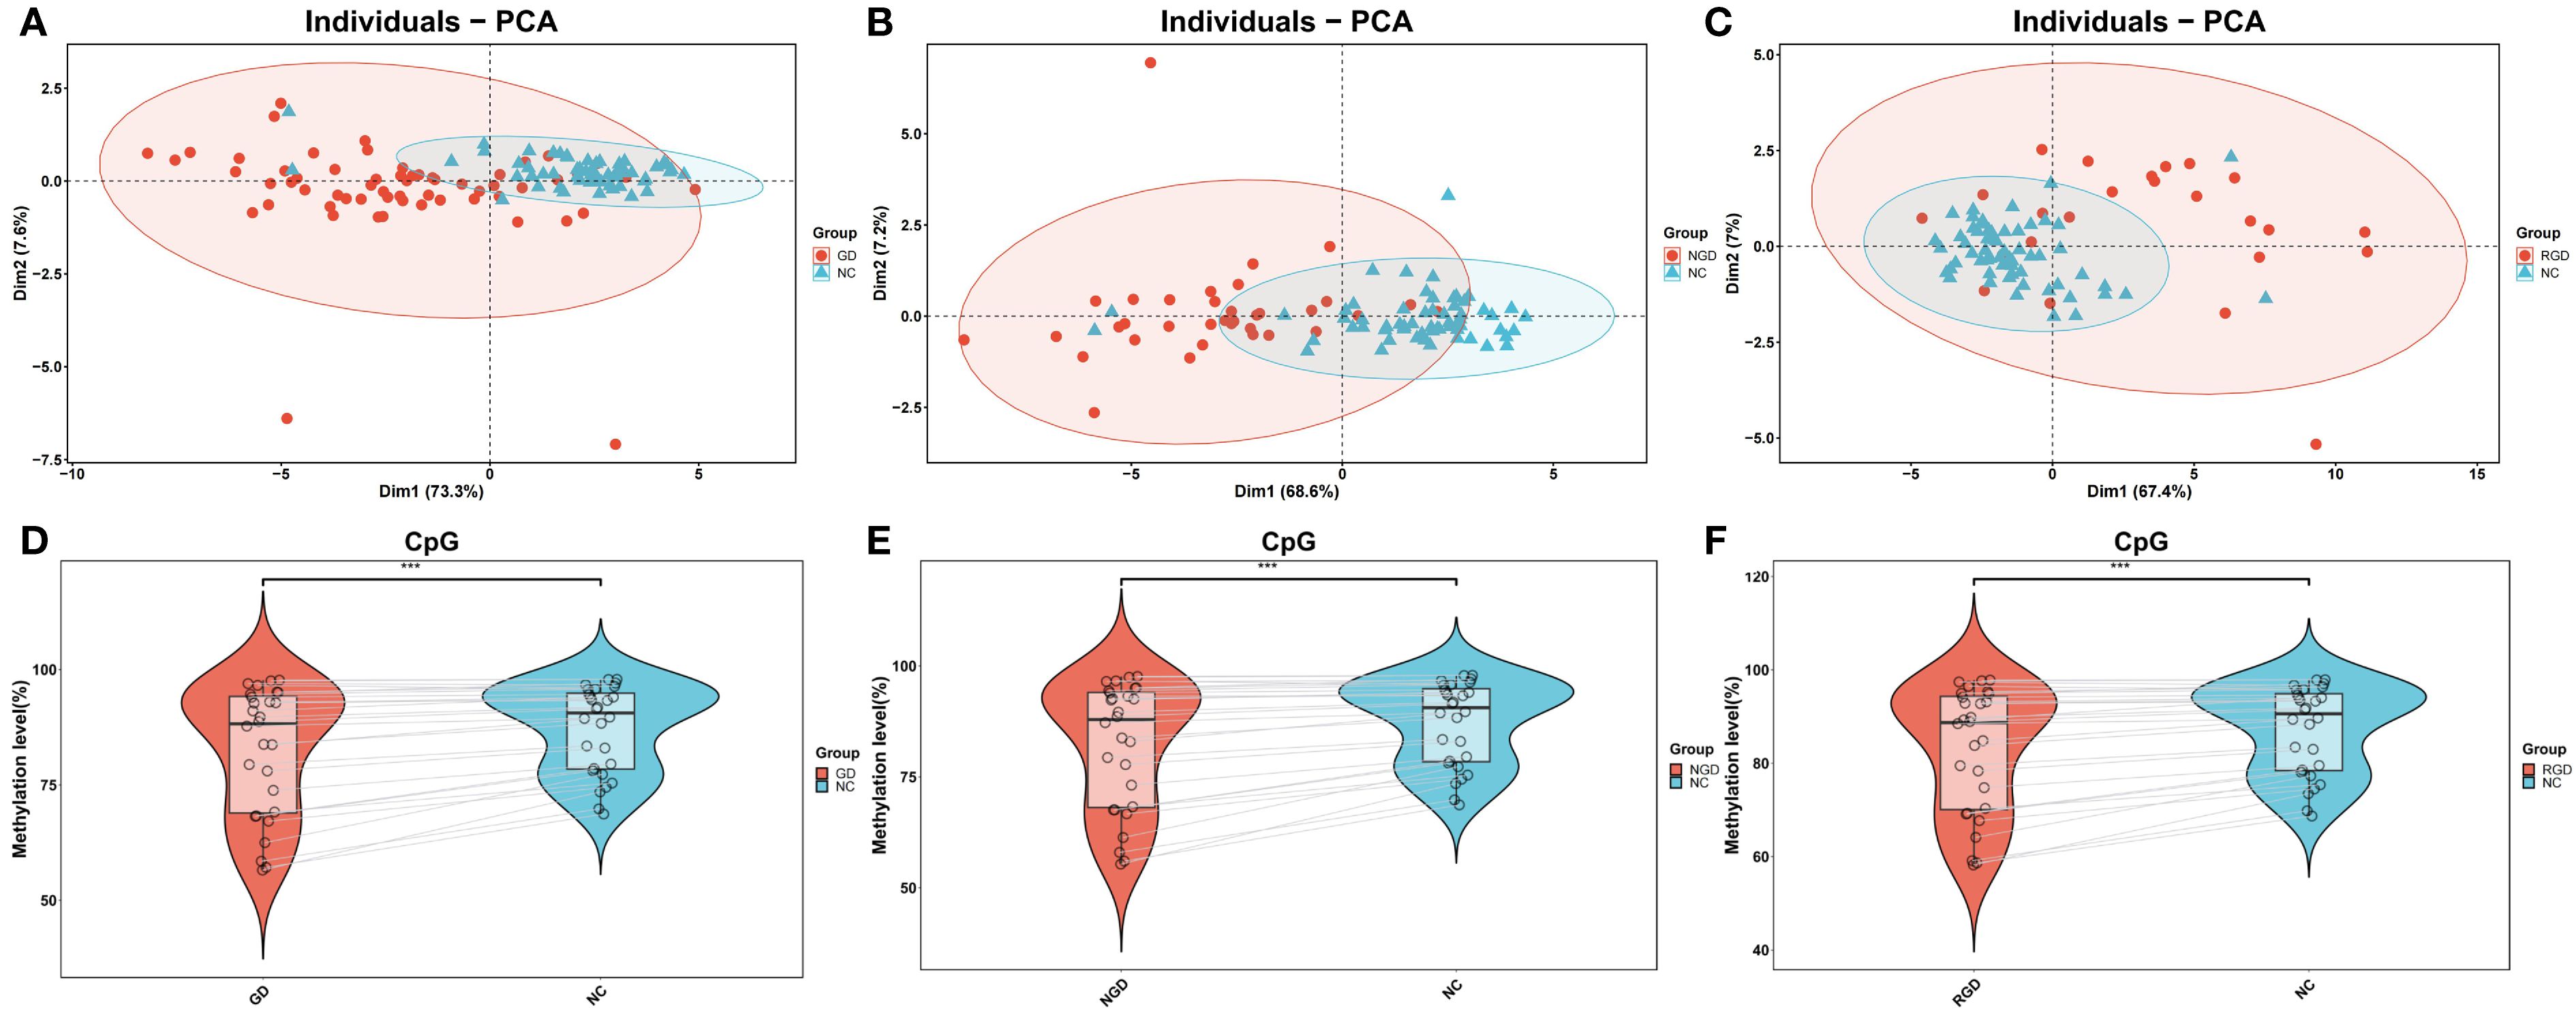
Figure 1. DNA methylation percentages in IL17, IL21, and IL22 gene promoters across study groups. (A) Principal component analysis (PCA) of DNA methylation levels in the IL17, IL21, and IL22 gene promoters between Graves’ disease (GD) patients and normal controls (NC). (B) PCA of methylation levels comparing newly diagnosed GD (NGD) patients and NC. (C) PCA of methylation levels comparing refractory GD (RGD) patients and NC. (D) Violin plots showing DNA methylation percentages in the IL17, IL21, and IL22 promoters between GD and NC groups. (E) Violin plots comparing methylation levels between NGD and NC groups. (F) Violin plots comparing methylation levels between RGD and NC groups. Abbreviations: GD, Graves’ disease; NGD, newly diagnosed Graves’ disease; RGD, refractory Graves’ disease; NC, normal control; PCA, principal component analysis. *p < 0.05, **p < 0.01, ***p < 0.001, ns, not significant (p > 0.05).
We further assessed gene-specific methylation of the IL17, IL21, and IL22 promoter regions. All three genes exhibited significantly lower promoter methylation levels in GD patients relative to NCs (p < 0.05, Figure 2A). Similar reductions were observed in both NGD and RGD subgroups (p < 0.05, Figures 2B, C).
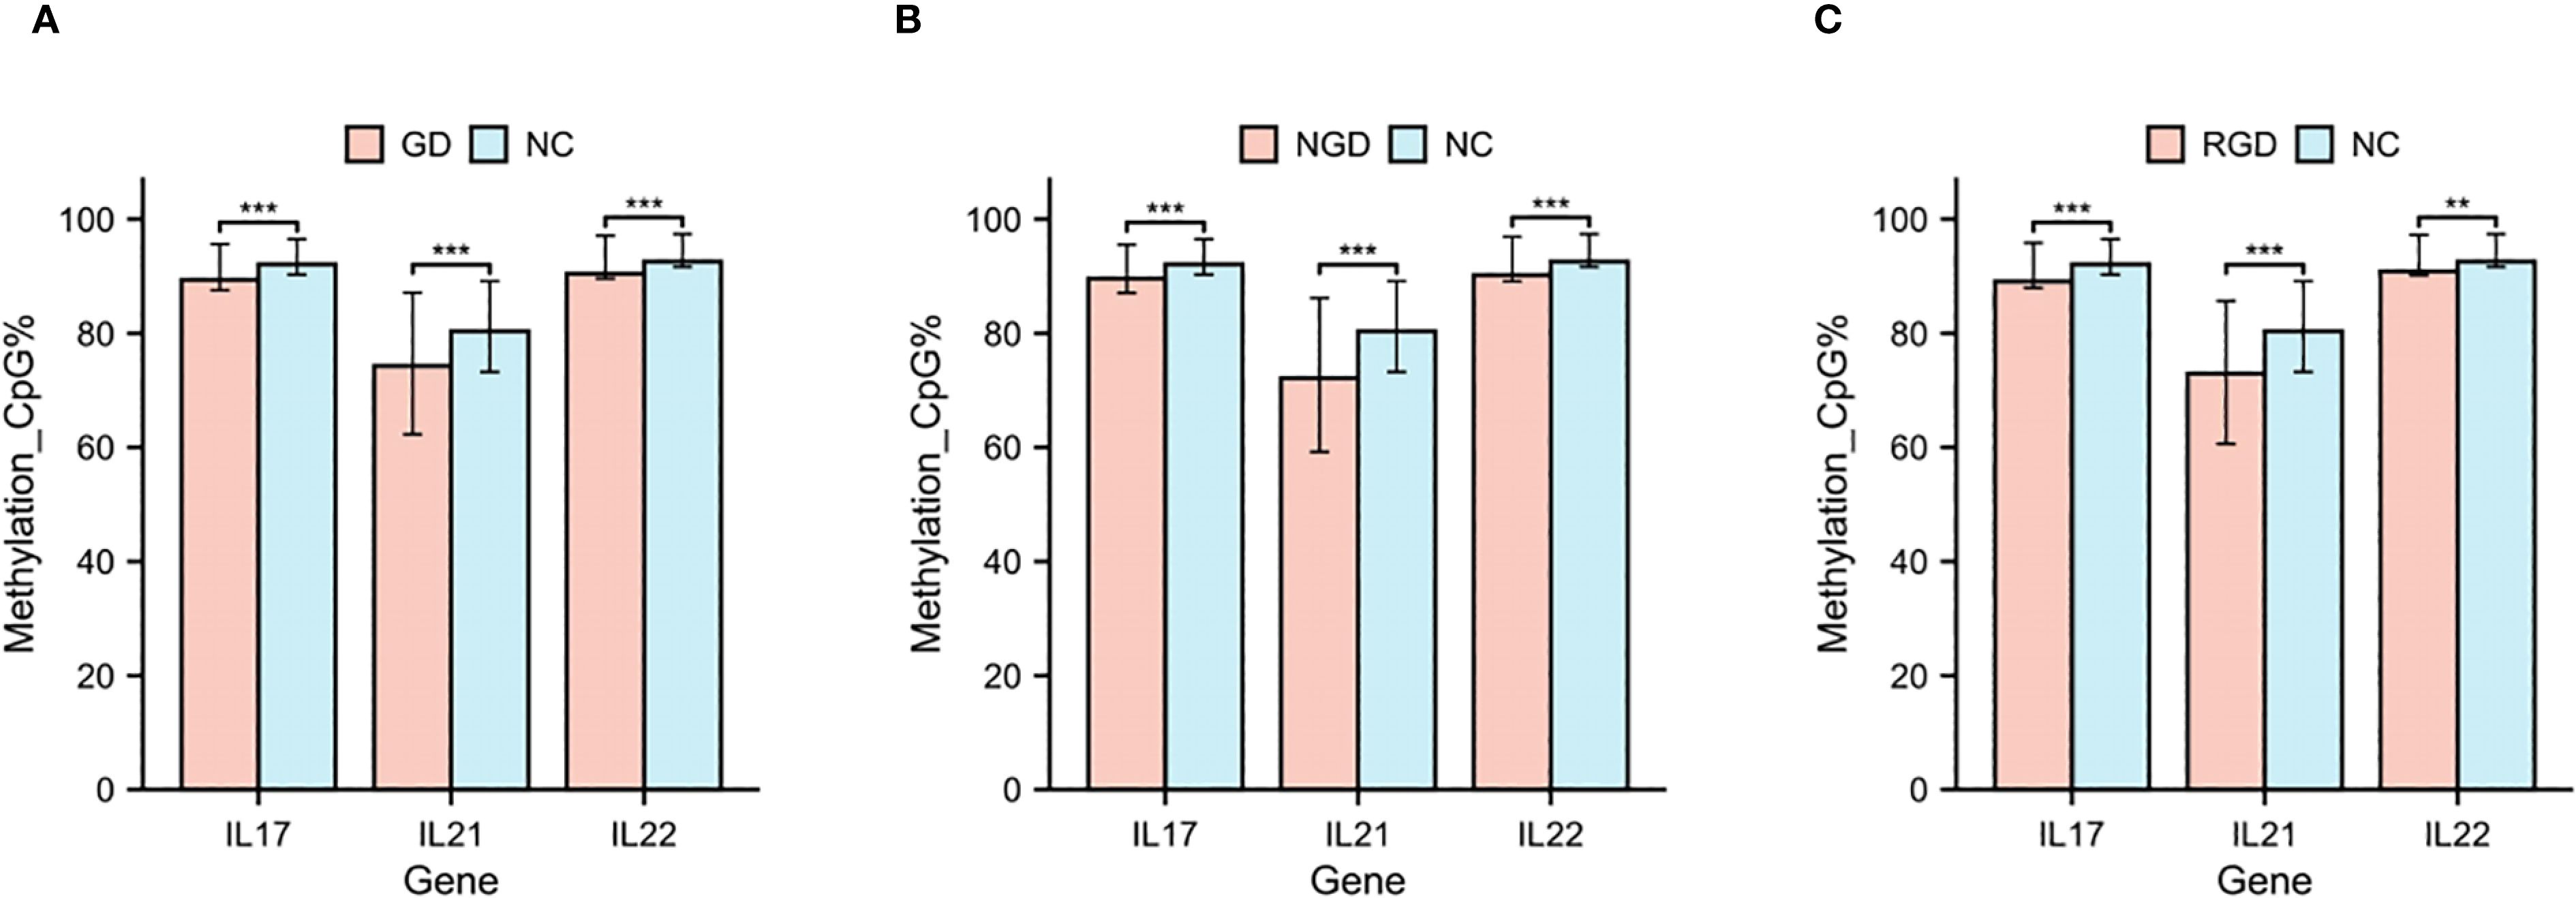
Figure 2. DNA methylation percentages in IL17, IL21, and IL22 gene promoters in each study group. (A) DNA methylation percentages in IL17, IL21, and IL22 gene promoters in GD patients and NC. (B) DNA methylation percentages in IL17, IL21, and IL22 gene promoters in NGD and NC. (C) DNA methylation percentages in IL17, IL21, and IL22 gene promoters in RGD and NC. GD, Graves’ Disease; NGD, Newly Diagnosed Graves’ Disease; RGD, Refractory Graves’ Disease; NC, Normal Control. *p < 0.05, **p < 0.01, ***p < 0.001, ns, p > 0.05.
To delineate CpG site-specific methylation patterns, we analyzed promoter regions >200 bp in length, containing 16 CpG sites for IL17, 10 for IL21, and 17 for IL22 (Supplementary Table S2). The methylation levels of CpG sites for each gene are shown in Figures 3A–C. Site-level methylation analyses demonstrated significant hypomethylation in GD patients at 12 CpG sites in IL17 (p < 0.05, Figure 4A), 9 sites in IL21 (Figure 4B), and 13 sites in IL22 (Figure 4C).
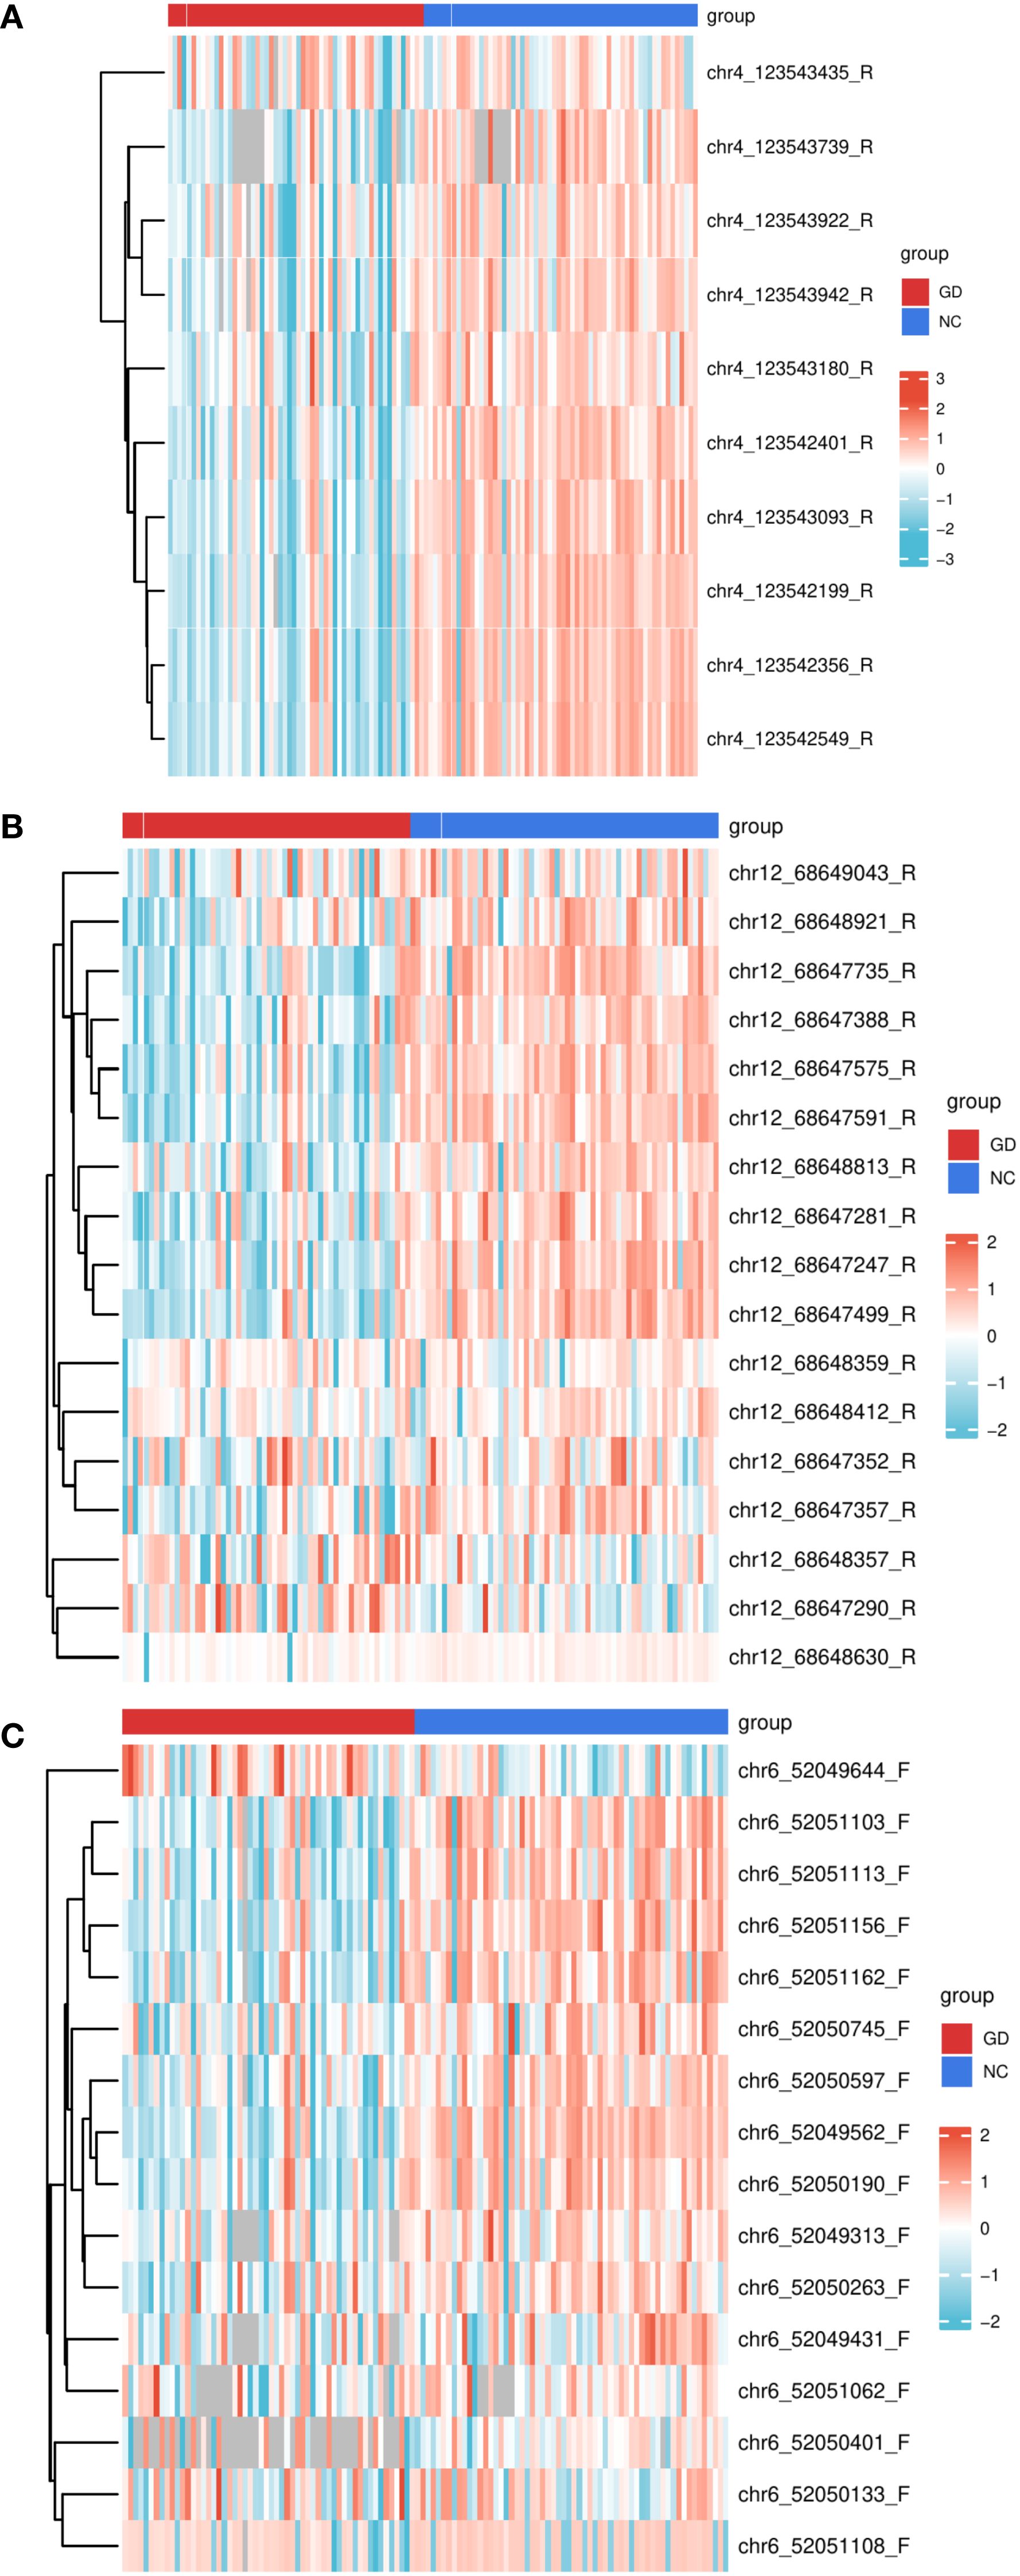
Figure 3. Heatmaps of DNA methylation levels in the promoter regions of IL17, IL21, and IL22 genes across study groups. (A) Heatmap depicting DNA methylation percentages at individual CpG sites within the IL17 gene promoter in patients with Graves’ disease (GD) compared to normal controls (NC). (B) Heatmap depicting DNA methylation percentages at individual CpG sites within the IL21 gene promoter in GD patients versus NC. (C) Heatmap depicting DNA methylation percentages at individual CpG sites within the IL22 gene promoter in GD patients versus NC. Each color gradient represents the relative methylation level at each CpG site, allowing for visualization of methylation patterns across groups. GD, Graves’ Disease; NC, Normal Control.
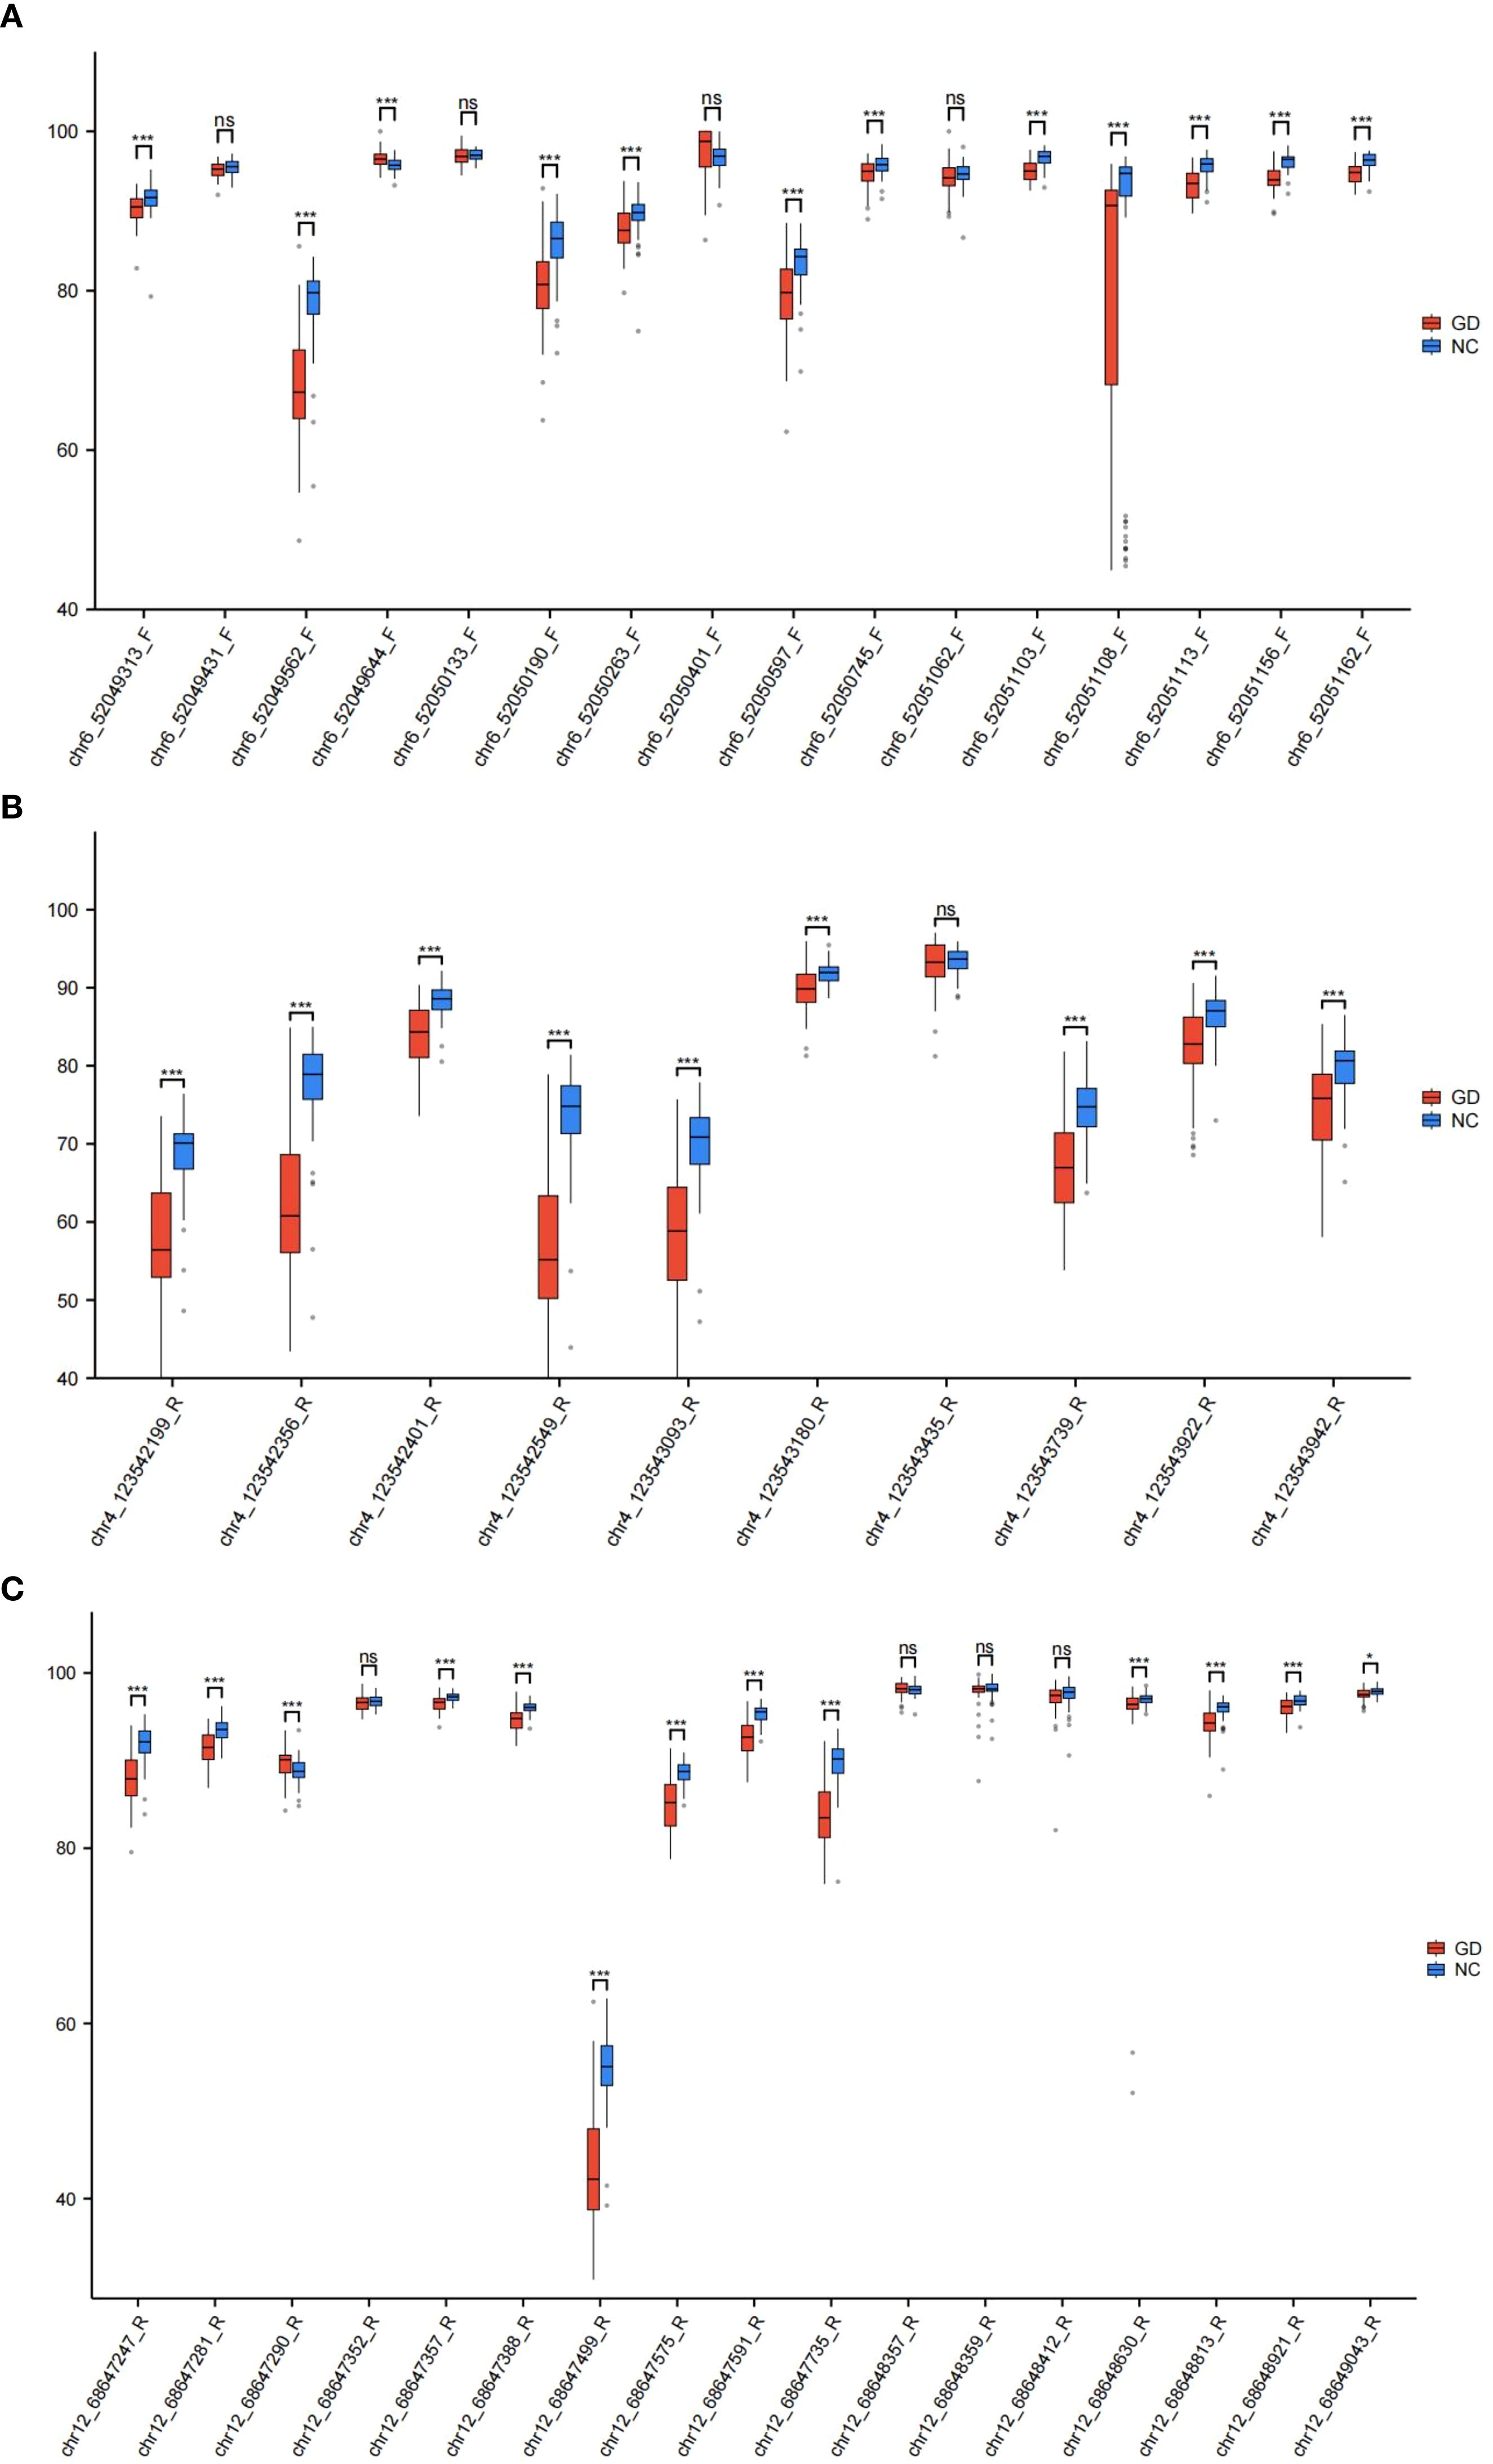
Figure 4. Box plots of DNA methylation levels in the promoter regions of IL17, IL21, and IL22 genes between study groups. (A) Box plot illustrating the distribution of DNA methylation percentages at CpG sites within the IL17 gene promoter in GD patients compared to NC. (B) Box plot illustrating the distribution of DNA methylation percentages at CpG sites within the IL21 gene promoter in GD patients versus NC. (C) Box plot illustrating the distribution of DNA methylation percentages at CpG sites within the IL22 gene promoter in GD patients versus NC. Data are presented as median with interquartile range; statistical comparisons highlight group-specific differences in methylation levels. GD, Graves’ Disease; NC, Normal Control. *p < 0.05, **p < 0.01, ***p < 0.001, ns, p > 0.05.
3.2 Identification of diagnostic CpG Sites in IL17, IL21, and IL22 promoter regions using machine learning
After excluding CpG sites without statistically significant methylation differences, the remaining CpG sites in the promoter regions of IL17, IL21, and IL22 were used to develop predictive models. Four machine learning algorithms were applied: RF, SVM, GLM, and XGB. Among them, the RF, SVM, and XGB models demonstrated superior performance in terms of lower residual distributions and higher classification accuracy based on ROC curve analysis (Figures 5A–C). Thus, these three models were selected for downstream analyses.
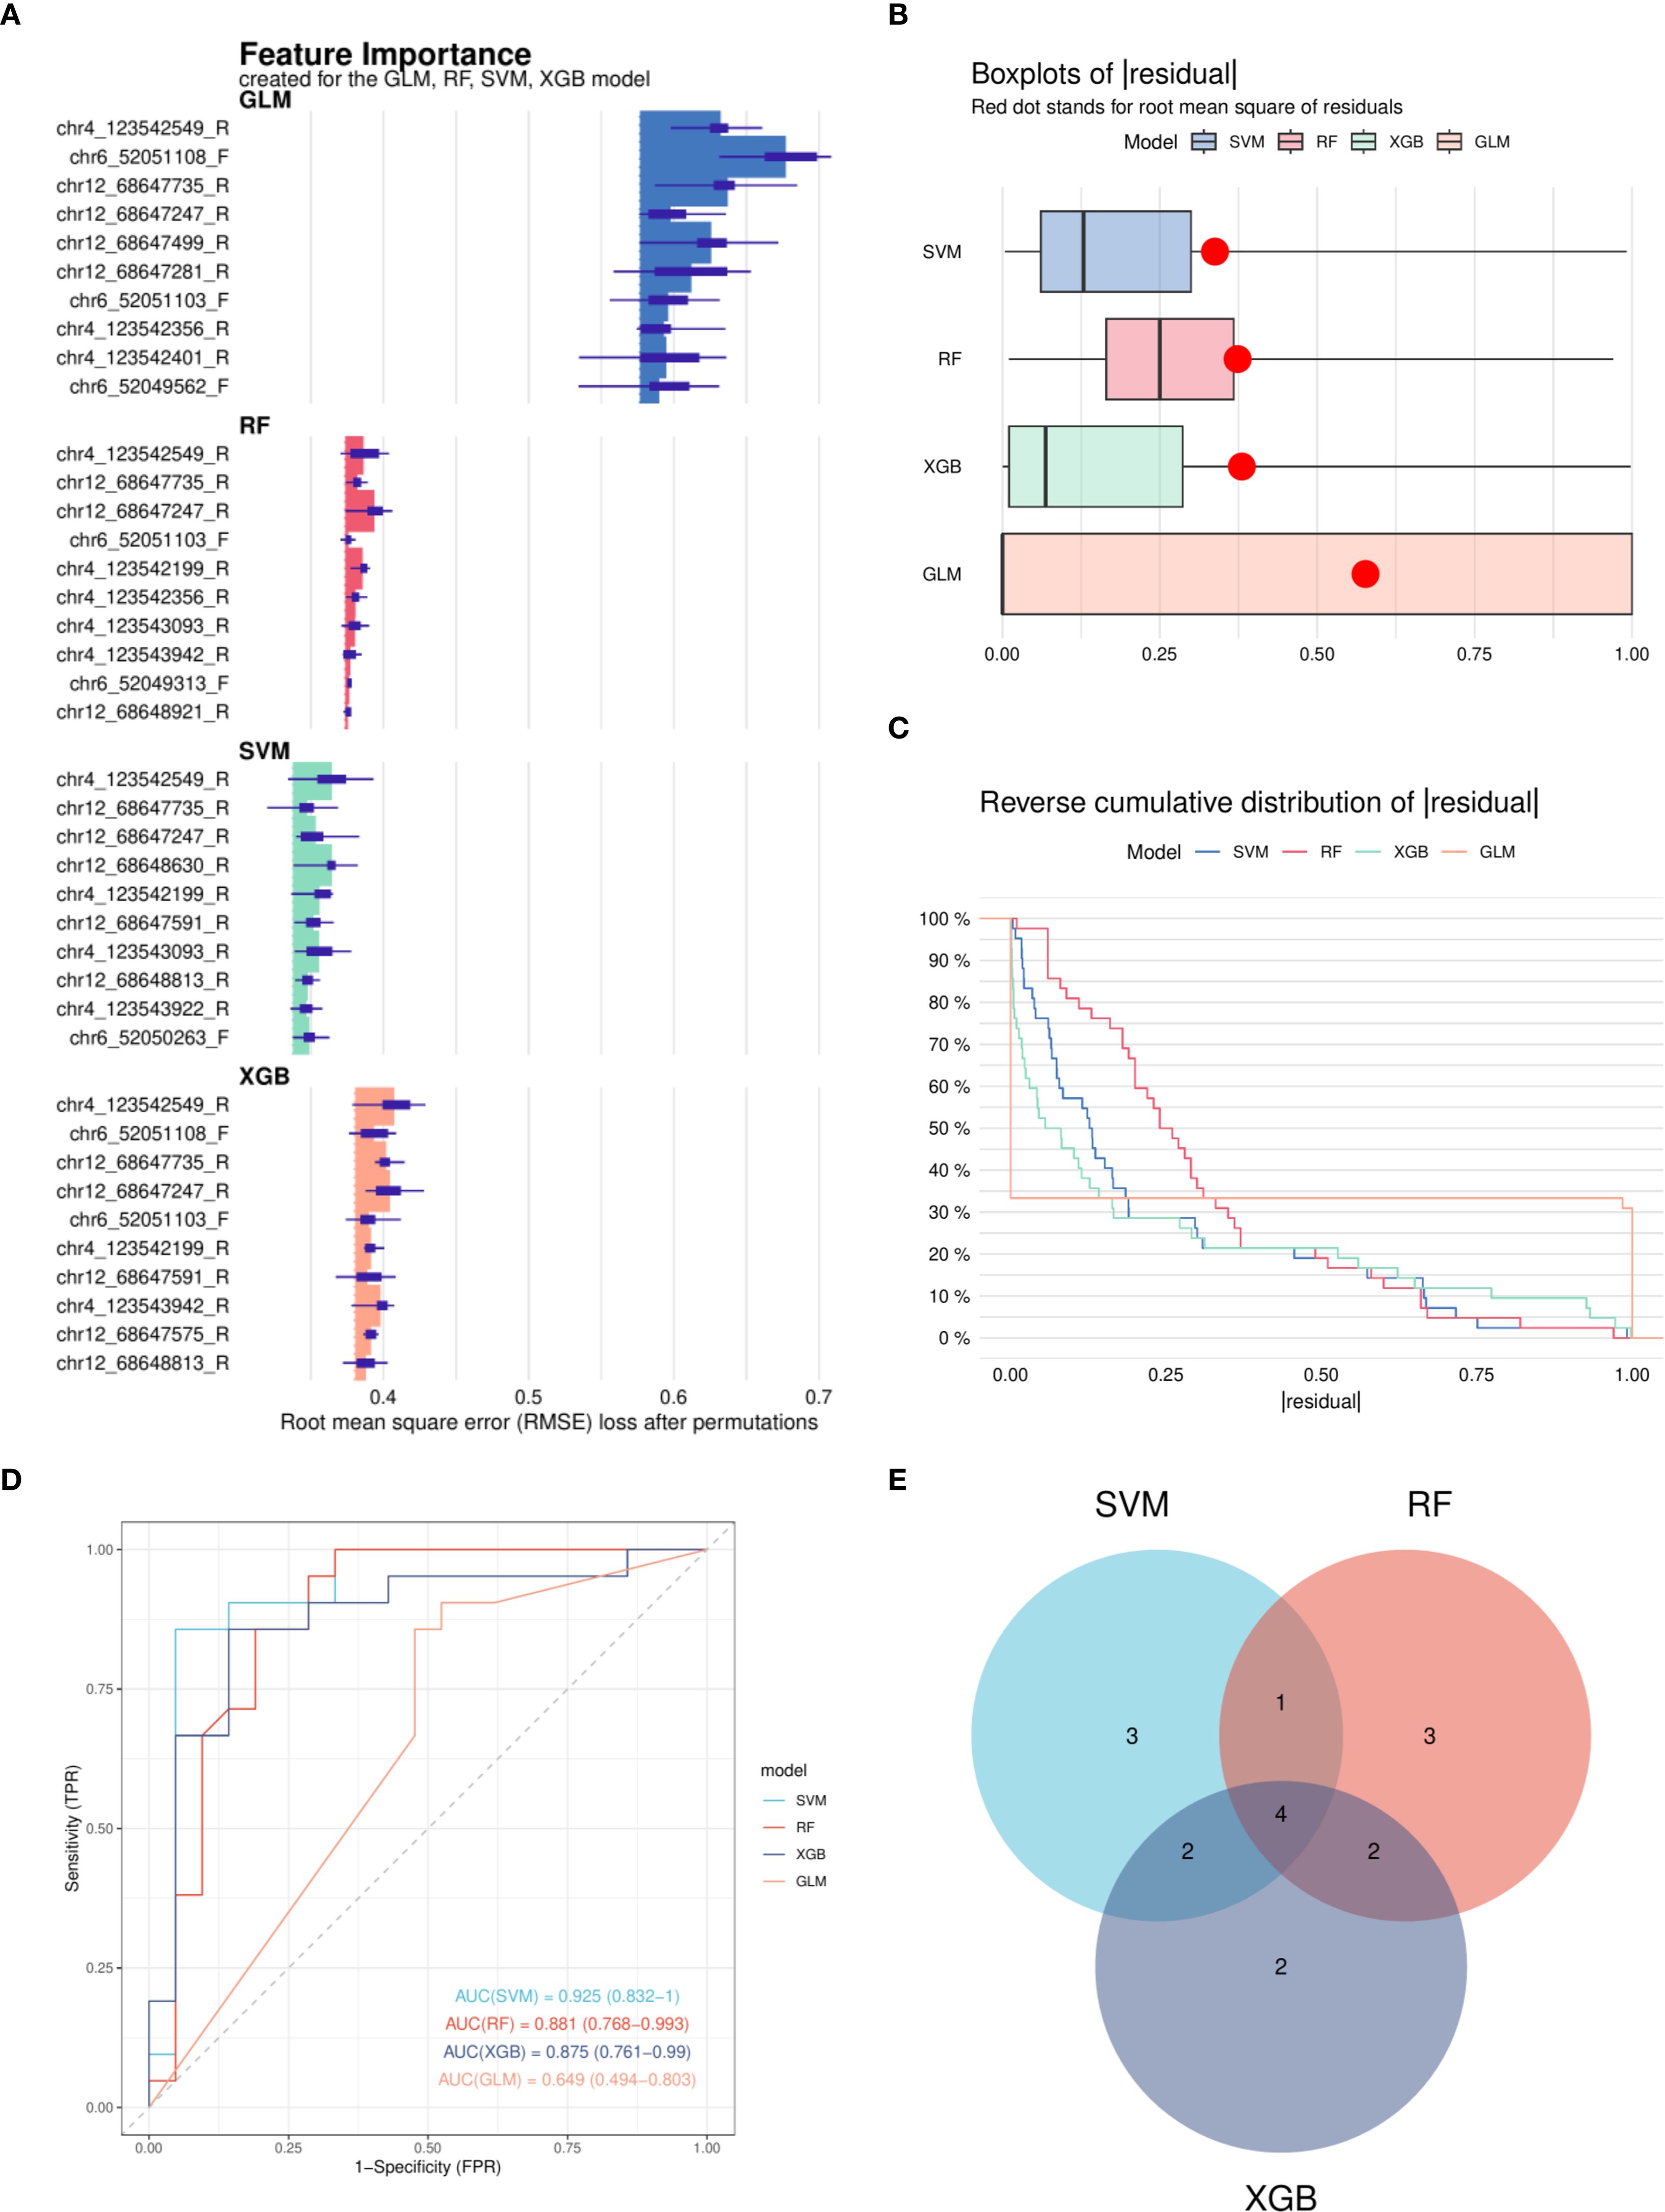
Figure 5. Construction and performance evaluation of machine learning models for DNA methylation-based classification. (A) Feature importance rankings derived from four machine learning models: Random Forest (RF), Support Vector Machine (SVM), Generalized Linear Model (GLM), and eXtreme Gradient Boosting (XGB). (B) Cumulative residual distribution curves for each model, indicating overall model fit. (C) Box plots of residuals for the four models; red dots represent the Root Mean Square Error (RMSE) for each model. (D) Receiver Operating Characteristic (ROC) curves generated from the test set for all four models; SVM, RF, and XGB models achieved area under the curve (AUC) values exceeding 0.7. (E) Venn diagram illustrating the overlap of important features identified by the SVM, RF, and XGB models. RF, Random Forest; SVM, Support Vector Machine; GLM, Generalized Linear Model; XGB, eXtreme Gradient Boosting; RMSE, Root Mean Square Error; ROC, Receiver Operating Characteristic; AUC, Area Under the Curve.
Four CpG sites—chr4_123542199_R, chr4_123542549_R, chr12_68647247_R, and chr12_68647735_R—were consistently identified by the three models and prioritized for further evaluation (Figures 5D, E).
3.3 Diagnostic evaluation of hypomethylated CpG sites
The four CpG sites identified through model-based feature importance were subjected to ROC curve analysis to assess their diagnostic utility (Figure 6). All four CpG sites demonstrated AUC values >0.7, indicating moderate diagnostic performance. Specifically, the AUC values for chr4_123542199_R, chr4_123542549_R, chr12_68647247_R, and chr12_68647735_R were 0.764, 0.754, 0.752, and 0.738, respectively (Figures 6A–D). These results suggest that hypomethylation at these sites may serve as potential biomarkers for GD diagnosis.
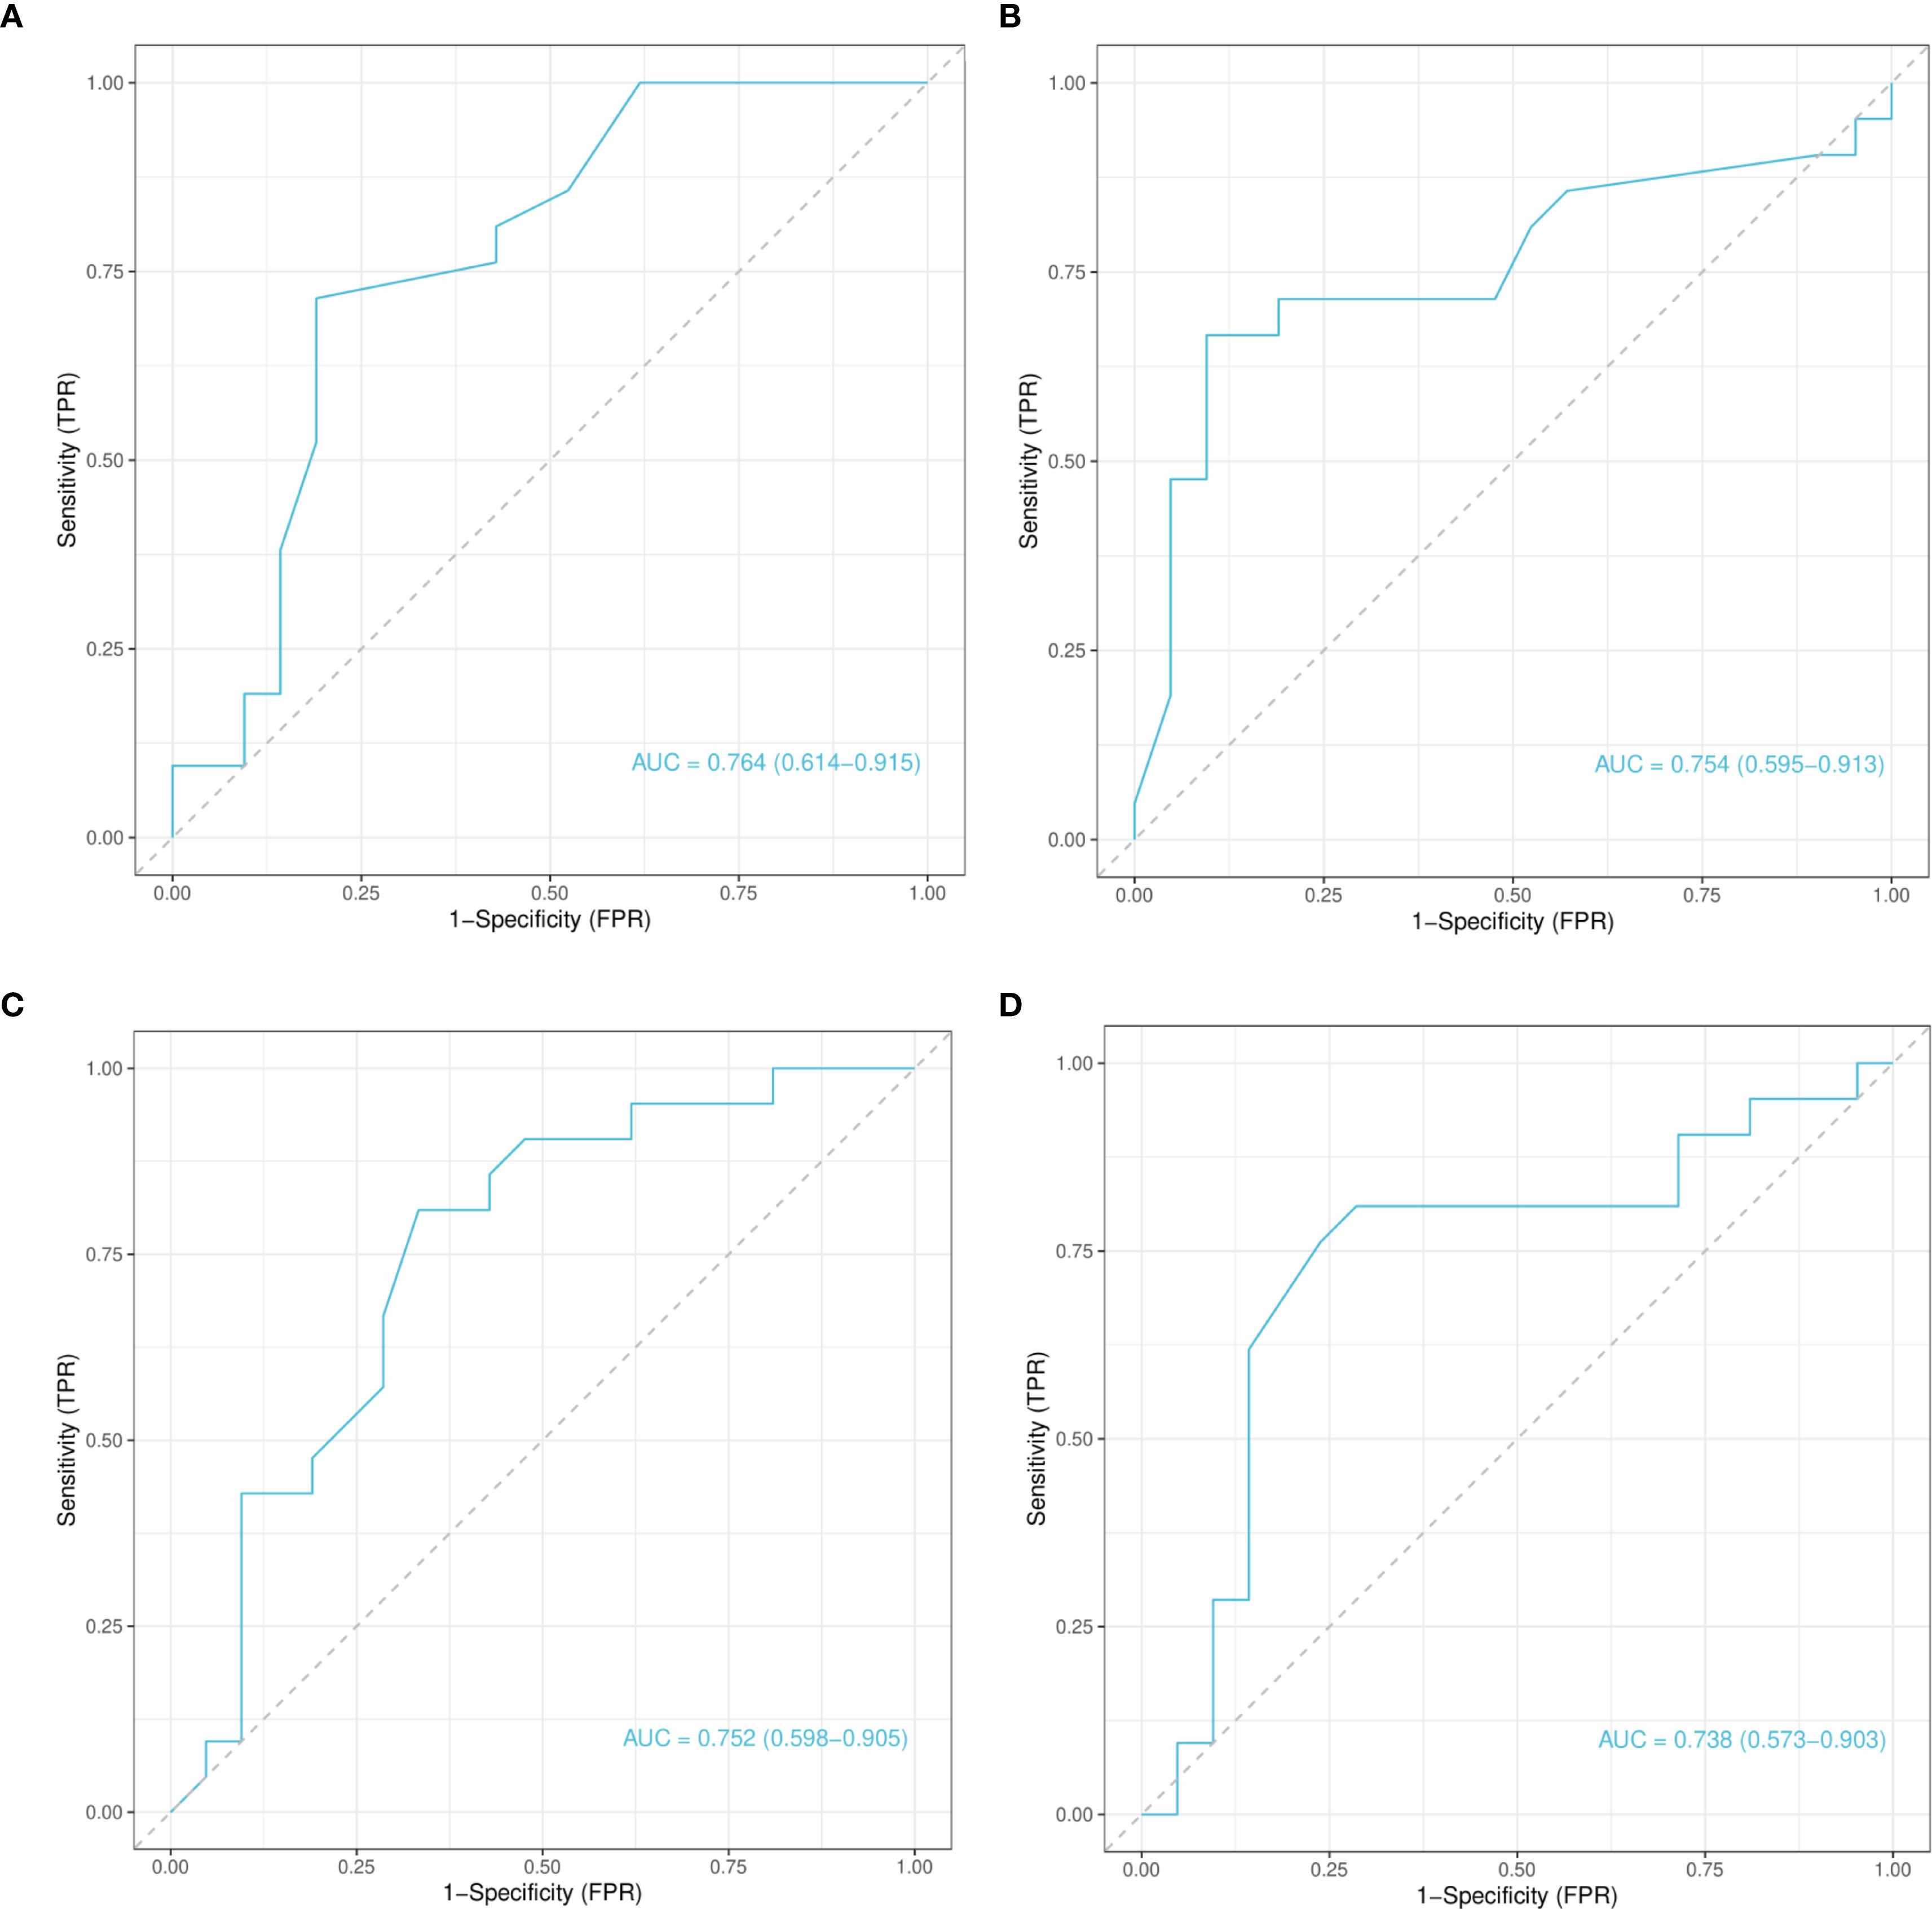
Figure 6. Receiver operating characteristic curve analysis of selected CpG Loci based on test set predictions. (A) Receiver Operating Characteristic (ROC) curve for the chr4_123542199_R locus. (B) ROC curve for the chr4_123542549_R locus. (C) ROC curve for the chr12_68647247_R locus. (D) ROC curve for the chr12_68647735_R locus. Each panel shows the classification performance of the corresponding CpG locus, with AUC values indicating diagnostic potential. ROC, Receiver Operating Characteristic; AUC, Area Under the Curve.
3.4 Clinical relevance of methylation alterations
Clinical variable distributions are presented in Supplementary Table S4. To investigate the clinical relevance of the four identified CpG sites, univariate logistic regression analyses were performed (Supplementary Figure S2). Hypomethylation at chr4_123542549_R was significantly associated with elevated TRAb levels (OR=4.00, 95% CI: 1.30–12.33, p=0.02), and this association remained significant in multivariate analysis (Figure 7; Supplementary Table S3). These findings suggest that demethylation at this site may influence TRAb production or activity, potentially contributing to disease pathogenesis and reflecting disease severity.
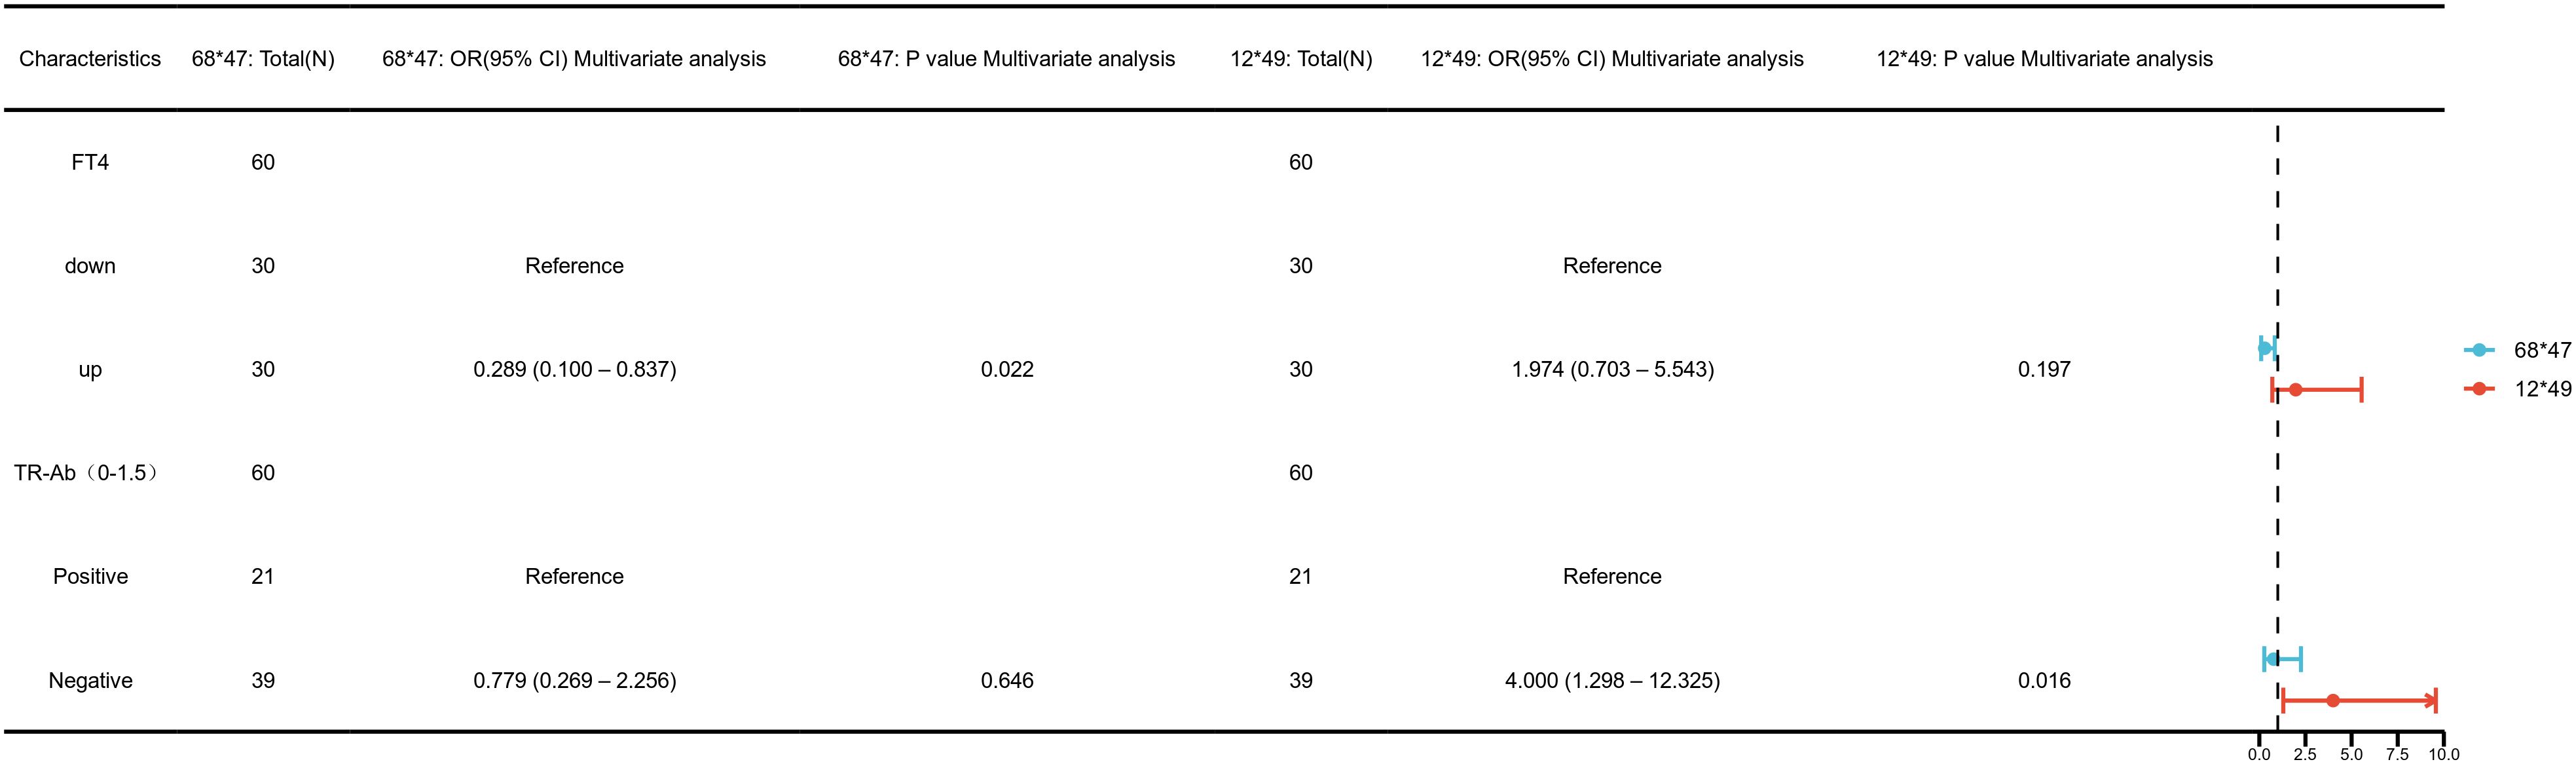
Figure 7. Multivariate logistic regression analysis of clinical associations at key DNA methylation sites— chr4_123542549_R (12*49), chr12_68647247_R (68*47).
Furthermore, both univariate and multivariate analyses revealed a significant association between hypomethylation at chr12_68647247_R and increased FT4 levels (OR=0.29, 95% CI: 0.10–0.84, p=0.02, Figure 7; Supplementary Table S3). This indicates a possible regulatory role for this site in thyroid hormone synthesis or metabolism, suggesting its utility as a marker of thyroid functional status in GD.
No significant associations were observed between methylation levels at chr4_123542199_R or chr12_68647735_R and clinical parameters (p > 0.05, Supplementary Figure S2).
4 Discussion
In recent years, DNA methylation has been widely recognized as a key epigenetic mechanism involved in maintaining physiological homeostasis and regulating gene expression under pathological conditions, including autoimmune diseases (26, 27). GD, a prototypical autoimmune thyroid disorder, has been associated with aberrant methylation patterns of immune-related genes, such as IL10 (28). In this study, we focused on the DNA methylation status of the promoter regions of IL-17, IL-21, and IL-22 in PBMCs from patients with GD. By integrating machine learning models, we identified hypomethylated CpG sites significantly associated with GD, and found strong correlations between these epigenetic alterations and clinical indicators such as TRAb and FT4. These findings are consistent with previous reports emphasizing the role of Th17 cells in GD-related immune dysregulation and provide new insights into the epigenetic regulation of Th17 cell function (29, 30).
We found that the promoter regions of Th17-related cytokines exhibited significantly lower methylation levels in patients with GD compared to healthy controls. This suggests that epigenetic mechanisms may contribute to GD pathogenesis and highlights a previously underexplored dimension of Th17 cell regulation in this context. Notably, aberrant methylation patterns of IL-17, IL-21, and IL-22 are not exclusive to GD; similar patterns have been reported in other Th17-mediated autoimmune diseases, including rheumatoid arthritis, psoriasis, and Sjögren’s syndrome (31–34). Hypomethylation in these loci may enhance transcription factor binding, such as RORγt, or modulate IL-23/IL-23R signaling, or destabilize repressive chromatin complexes, thereby facilitating the expression of these pro-inflammatory cytokines (35–38). These observations support the existence of a shared epigenetic dysregulation of Th17-associated genes across various autoimmune conditions.
Previous studies, including our own, have demonstrated increased proportions of Th17 cells in patients with GD, with elevated expression levels of IL-17, IL-21, and IL-22 correlating positively with disease activity (39–42). These cytokines are markedly upregulated in GD and are implicated in amplifying the pro-inflammatory response and contributing to thyroid tissue damage (43–45). While earlier research has primarily focused on phenotypic aspects of Th17 cell activation, our study underscores the pivotal role of epigenetic regulation in modulating Th17-related gene expression. By systematically correlating promoter methylation with transcriptional activity, we offer new insights into the epigenetic mechanisms underlying Th17 dysregulation in GD (46, 47).
GD is characterized by thyroid-specific organ involvement, in which aberrant expression of the thyroid-stimulating hormone receptor (TSHR) on follicular epithelial cells and its interaction with thyroid-stimulating hormone receptor antibodies (TRAb) may drive immune imbalance (48). However, our machine learning analysis revealed that hypomethylation at chr4:123542549_R (AUC > 0.7) exhibited higher sensitivity and specificity for GD identification compared to conventional antibody-based diagnostics such as TRAb, which has a false-negative rate of 10–15% (49). Additionally, the methylation level at chr12:68647247_R was significantly correlated with elevated FT4 levels. These findings suggest that aberrant methylation at specific loci may play a direct regulatory role in the immune imbalance and thyroid dysfunction associated with GD. By employing advanced machine learning techniques, this study uniquely identified GD-associated CpG sites with potential predictive value for disease risk, warranting further validation in larger cohorts (50).
Interestingly, in patients with RGD, partial modulation of methylation levels was observed after treatment; however, these levels remained lower than in healthy controls. This suggests the presence of an epigenetic “memory” that may sustain autoimmune activity and contribute to disease relapse, even during periods of clinical remission. Persistent hypomethylation of Th17 cytokine genes may maintain Th17 activation and predispose patients to recurrence. This finding offers new perspectives on the mechanisms underlying GD chronicity and relapse. Clinically, methylation status may reflect treatment response and serve as a biomarker for relapse risk. The incomplete restoration observed suggests that conventional antithyroid therapy (e.g., methimazole) may insufficiently reset epigenetic patterns, highlighting the need for interventions targeting immune regulation or epigenetic remodeling. Longitudinal monitoring of methylation profiles could aid early diagnosis, track disease trajectory, and identify patients at high risk of persistent or recurrent hyperthyroidism. Future research should employ single-cell methylome sequencing and functional assays to dissect cell type–specific methylation patterns and clarify their roles in modulating Th17 activity. Furthermore, dynamic monitoring of methylation changes in Th17 cytokine genes may inform treatment adjustments and support the development of early-stage immuno-epigenetic combination therapies (51).
In conclusion, this study identified decreased DNA methylation levels in the promoter regions of IL-17, IL-21, and IL-22 in patients with GD and preliminarily explored their associations with Th17 cell activation and clinical parameters. These findings contribute to a deeper understanding of the epigenetic mechanisms involved in GD and lay a foundation for future research.
5 Conclusion
From an epigenetic perspective, this study investigated the aberrant methylation patterns of IL-17, IL-21, and IL-22 genes in GD patients, contributing to a deeper understanding of the role of Th17 cells in GD-related immune dysregulation. These findings may aid in advancing the understanding of GD’s immunopathological mechanisms and provide a scientific basis for potential epigenetic intervention strategies.
Data availability statement
The original contributions presented in the study are included in the article/Supplementary Material. Further inquiries can be directed to the corresponding authors.
Ethics statement
The studies involving humans were approved by the Declaration of Helsinki and approved by the Ethics Committee of Shanghai Health Medical College. The studies were conducted in accordance with the local legislation and institutional requirements. The participants provided their written informed consent to participate in this study.
Author contributions
YJ: Formal Analysis, Methodology, Writing – original draft, Funding acquisition. KM: Project administration, Writing – review & editing, Investigation. ZH: Resources, Writing – review & editing. XZ: Data curation, Writing – review & editing. YW: Writing – review & editing, Software. WX: Writing – review & editing, Software. RS: Visualization, Supervision, Writing – review & editing. JZ: Conceptualization, Writing – review & editing, Funding acquisition, Visualization.
Funding
The author(s) declare financial support was received for the research and/or publication of this article. The research was funded by the following grants:1. National Natural Science Foundation of China (82370791);2. Pudong New Area Outstanding Young Medical Talent Training Program (PWRq2022-34);3. Shanghai University of Medicine & Health Sciences Hundreds of Talented Teachers Project (A3-0200-23-311001).
Acknowledgments
The authors would like to thank all participants in the study.
Conflict of interest
The authors declare that the research was conducted in the absence of any commercial or financial relationships that could be construed as a potential conflict of interest.
Generative AI statement
The author(s) declare that no Generative AI was used in the creation of this manuscript.
Any alternative text (alt text) provided alongside figures in this article has been generated by Frontiers with the support of artificial intelligence and reasonable efforts have been made to ensure accuracy, including review by the authors wherever possible. If you identify any issues, please contact us.
Publisher’s note
All claims expressed in this article are solely those of the authors and do not necessarily represent those of their affiliated organizations, or those of the publisher, the editors and the reviewers. Any product that may be evaluated in this article, or claim that may be made by its manufacturer, is not guaranteed or endorsed by the publisher.
Supplementary material
The Supplementary Material for this article can be found online at: https://www.frontiersin.org/articles/10.3389/fimmu.2025.1635883/full#supplementary-material
Supplementary Figure 1 | DNA methylation patterns of IL17, IL21, and IL22 gene promoters in GD, NGD, and RGD groups compared to normal controls. (A) Box plots showing DNA methylation percentages in the IL17, IL21, and IL22 gene promoters in GD patients and NCs. Vertical bars indicate 95% confidence intervals of the mean. (B) Heatmap showing methylation levels in the IL17, IL21, and IL22 promoters in GD and NC groups. (C) Box plots showing methylation percentages in NGD patients and NCs. (D) Heatmap of IL17, IL21, and IL22 promoter methylation levels in NGD and NC groups. (E) Box plots showing methylation percentages in RGD patients and NCs. (F) Heatmap of IL17, IL21, and IL22 promoter methylation levels in RGD and NC groups. Abbreviations: GD: Graves’ Disease, NGD: Newly Diagnosed Graves’ Disease, RGD: Refractory Graves’ Disease, NC: Normal Control.
Supplementary Figure 2 | Univariate logistic regression analysis of DNA methylation sites associated with clinical features. (A) Univariate logistic regression analysis of the association between clinical parameters and methylation at two CpG sites located on chromosome 4: chr4_123542199_R (12*99) and chr4_123542549_R (12*49). (B) Univariate logistic regression analysis of the association between clinical parameters and methylation at two CpG sites located on chromosome 12: chr12_68647247_R (68*47) and chr12_68647735_R (68*45).
References
1. Duan J, Xu P, Luan X, Ji Y, He X, Song N, et al. Hormone- and antibody-mediated activation of the thyrotropin receptor. Nature. (2022) 609:854–9. doi: 10.1038/s41586-022-05173-3
2. Lane LC, Wood CL, and Cheetham T. Graves' disease: moving forwards. Arch Dis Child. (2023) 108:276–81. doi: 10.1136/archdischild-2022-323905
3. Zhou F, Wang X, Wang L, Sun X, Tan G, Wei W, et al. Genetics, epigenetics, cellular immunology, and gut microbiota: emerging links with graves' Disease. Front Cell Dev Biol. (2021) 9:794912. doi: 10.3389/fcell.2021.794912
4. Grixti L, Lane LC, and Pearce SH. The genetics of Graves' disease. Rev Endocr Metab Disord. (2024) 25:203–14. doi: 10.1007/s11154-023-09848-8
5. Antonelli A, Ferrari SM, Ragusa F, Elia G, Paparo SR, Ruffilli I, et al. Graves' disease: Epidemiology, genetic and environmental risk factors and viruses. Best Pract Res Clin Endocrinol Metab. (2020) 34:101387. doi: 10.1016/j.beem.2020.101387
6. Lee SY and Pearce EN. Hyperthyroidism: A review. Jama. (2023) 330:1472–83. doi: 10.1001/jama.2023.19052
7. Wang Y, Fang S, and Zhou H. Pathogenic role of Th17 cells in autoimmune thyroid disease and their underlying mechanisms. Best Pract Res Clin Endocrinol Metab. (2023) 37:101743. doi: 10.1016/j.beem.2023.101743
8. Huang F, Zhang L, Zhou Y, Zhao S, and Wang J. NrCAM activates the NF-κB signalling pathway by competitively binding to SUMO - 1 and promotes Th17 cell differentiation in Graves' disease. Scandinavian J Immunol. (2024) 100:e13401. doi: 10.1111/sji.13401
9. Cai Y, Ji H, Zhou X, Zhao K, Zhang X, Pan L, et al. Interleukin-21 modulates balance between regulatory T cells and T-helper 17 cells in chronic hepatitis B virus infection. BMC Infect Dis. (2023) 23:719. doi: 10.1186/s12879-023-08723-w
10. Mills KHG. IL - 17 and IL - 17-producing cells in protection versus pathology. Nat Rev Immunol. (2023) 23:38–54. doi: 10.1038/s41577-022-00746-9
11. Cai TT, Muhali FS, Song RH, Qin Q, Wang X, Shi LF, et al. Genome-wide DNA methylation analysis in Graves' disease. Genomics. (2015) 105:204–10. doi: 10.1016/j.ygeno.2015.01.001
12. Cai TT, Zhang J, Wang X, Song RH, Qin Q, Muhali FS, et al. Gene-gene and gene-sex epistatic interactions of DNMT1, DNMT3A and DNMT3B in autoimmune thyroid disease. Endocrine J. (2016) 63:643–53. doi: 10.1507/endocrj.EJ15-0596
13. Mattei AL, Bailly N, and Meissner A. DNA methylation: a historical perspective. Trends Genet. (2022) 38:676–707. doi: 10.1016/j.tig.2022.03.010
14. Kurata I, Mikami N, Ohyama A, Osada A, Kondo Y, Tsuboi H, et al. Impaired function of PD - 1(+) follicular regulatory T cells in systemic lupus erythematosus. Clin Exp Immunol. (2021) 206:28–35. doi: 10.1111/cei.13643
15. Danieli MG, Casciaro M, Paladini A, Bartolucci M, Sordoni M, Shoenfeld Y, et al. Exposome: Epigenetics and autoimmune diseases. Autoimmun Rev. (2024) 23:103584. doi: 10.1016/j.autrev.2024.103584
16. Guo Q, Wu D, Yu H, Bao J, Peng S, Shan Z, et al. Alterations of global DNA methylation and DNA methyltransferase expression in T and B lymphocytes from patients with newly diagnosed autoimmune thyroid diseases after treatment: A follow-up study. Thyroid. (2018) 28:377–85. doi: 10.1089/thy.2017.0301
17. Unoki M. Exploring the intersection of epigenetics, DNA repair, and immunology from studies of ICF syndrome, an inborn error of immunity. Front Immunol. (2024) 15:1405022. doi: 10.3389/fimmu.2024.1405022
18. Lafontaine N, Wilson SG, and Walsh JP. DNA methylation in autoimmune thyroid disease. J Clin Endocrinol Metab. (2023) 108:604–13. doi: 10.1210/clinem/dgac664
19. Singh A, Sathe N, Rani K, Das S, Patel JD, and Jyothi RR. Impact of mother's hypothyroidism on fetal development and outcomes: a systematic review. Georgian Med News. (2023) 345):32–6.
20. Mu S, Wang W, Liu Q, Ke N, Li H, Sun F, et al. Autoimmune disease: a view of epigenetics and therapeutic targeting. Front Immunol. (2024) 15:1482728. doi: 10.3389/fimmu.2024.1482728
21. Yortanli BC, Can U, Yortanli M, Kollu K, Celikdelen SO, Catak GT, et al. EXPRESS: spexin as a potential biomarker for autoimmune inflammation in graves' Disease. J Investig Med. (2025), 10815589251335050. doi: 10.1177/10815589251335050
22. Esen İ, Arslan H, Aktürk Esen S, Gülşen M, Kültekin N, and Özdemir O. Early prediction of gallstone disease with a machine learning-based method from bioimpedance and laboratory data. Med (Baltimore). (2024) 103:e37258. doi: 10.1097/MD.0000000000037258
23. Kulikowski CA. Introducing Kuhn et al.'s paper "Informatics and medicine: from molecules to populations" and invited papers on this special topic. Methods Inf Med. (2008) 47:279–82.
24. Mitchell R, Frank E, and Holmes G. GPUTreeShap: massively parallel exact calculation of SHAP scores for tree ensembles. PeerJ Comput Sci. (2022) 8:e880. doi: 10.7717/peerj-cs.880
25. Robin X, Turck N, Hainard A, Tiberti N, Lisacek F, Sanchez JC, et al. pROC: an open-source package for R and S+ to analyze and compare ROC curves. BMC Bioinf. (2011) 12:77. doi: 10.1186/1471-2105-12-77
26. Mei X, Zhang B, Zhao M, and Lu Q. An update on epigenetic regulation in autoimmune diseases. J Transl Autoimmun. (2022) 5:100176. doi: 10.1016/j.jtauto.2022.100176
27. Kober P, Rymuza J, Baluszek S, Maksymowicz M, Nyc A, Mossakowska BJ, et al. DNA methylation pattern in somatotroph pituitary neuroendocrine tumors. Neuroendocrinology. (2024) 114:51–63. doi: 10.1159/000533692
28. Kinoshita R, Inoue N, Iwatani Y, Noguchi Y, Hidaka Y, and Watanabe M. Methylation levels of the IL10 gene in peripheral blood are related to the intractability of Graves' disease. Clin Immunol. (2024) 263:110196. doi: 10.1016/j.clim.2024.110196
29. Zake T, Skuja S, Kalere I, Konrade I, and Groma V. Upregulated tissue expression of T helper (Th) 17 pathogenic interleukin (IL)-23 and IL - 1β in Hashimoto's thyroiditis but not in Graves' disease. Endocrine J. (2019) 66:423–30. doi: 10.1507/endocrj.EJ18-0396
30. Tan Y, Chen W, Liu C, Zheng X, Guo A, and Long J. Effect of IL - 21 on the balance of th17 cells/treg cells in the pathogenesis of graves' Disease. Endocrine Res. (2019) 44:138–47. doi: 10.1080/07435800.2019.1600535
31. Payet M, Dargai F, Gasque P, and Guillot X. Epigenetic regulation (Including micro-RNAs, DNA methylation and histone modifications) of rheumatoid arthritis: A systematic review. Int J Mol Sci. (2021) 22. doi: 10.3390/ijms222212170
32. Charras A, Garau J, Hofmann SR, Carlsson E, Cereda C, Russ S, et al. DNA methylation patterns in CD8(+) T cells discern psoriasis from psoriatic arthritis and correlate with cutaneous disease activity. Front Cell Dev Biol. (2021) 9:746145. doi: 10.3389/fcell.2021.746145
33. Natoli V, Charras A, Hofmann SR, Northey S, Russ S, Schulze F, et al. DNA methylation patterns in CD4(+) T-cells separate psoriasis patients from healthy controls, and skin psoriasis from psoriatic arthritis. Front Immunol. (2023) 14:1245876. doi: 10.3389/fimmu.2023.1245876
34. Li P, Han M, Zhao X, Ren G, Mei S, and Zhong C. Abnormal epigenetic regulations in the immunocytes of sjögren's syndrome patients and therapeutic potentials. Cells. (2022) 11. doi: 10.3390/cells11111767
35. Ren P, Tong X, Li J, Jiang H, Liu S, Li X, et al. CRL4(DCAF13) E3 ubiquitin ligase targets MeCP2 for degradation to prevent DNA hypermethylation and ensure normal transcription in growing oocytes. Cell Mol Life Sci. (2024) 81:165. doi: 10.1007/s00018-024-05185-4
36. Sahu RK, Dhakshnamoorthy J, Jain S, Folco HD, Wheeler D, and Grewal SIS. Nucleosome remodeler exclusion by histone deacetylation enforces heterochromatic silencing and epigenetic inheritance. Mol Cell. (2024) 84:3175–3191.e3178. doi: 10.1016/j.molcel.2024.07.006
37. Detilleux D, Spill YG, Balaramane D, Weber M, and Bardet AF. Pan-cancer predictions of transcription factors mediating aberrant DNA methylation. Epigenet Chromatin. (2022) 15:10. doi: 10.1186/s13072-022-00443-w
38. Klibi J, Joseph C, Delord M, Teissandier A, Lucas B, Chomienne C, et al. PLZF acetylation levels regulate NKT cell differentiation. J Immunol. (2021) 207:809–23. doi: 10.4049/jimmunol.2001444
39. Song RH, Yu ZY, Qin Q, Wang X, Muhali FS, Shi LF, et al. Different levels of circulating Th22 cell and its related molecules in Graves' disease and Hashimoto's thyroiditis. Int J Clin Exp pathol. (2014) 7:4024–31.
40. Li C, Yuan J, Zhu YF, Yang XJ, Wang Q, Xu J, et al. Imbalance of th17/treg in different subtypes of autoimmune thyroid diseases. Cell Physiol biochem: Int J Exp Cell physiol biochem Pharmacol. (2016) 40:245–52. doi: 10.1159/000452541
41. Zhao J, Liu X, Xu J, Fang Y, Du P, Gao C, et al. Elevated expression and activation of GPR15 in immune cells in graves' Disease. Biomolecules. (2022) 12. doi: 10.3390/biom12121899
42. Guan LJ, Wang X, Meng S, Shi LF, Jiang WJ, Xiao L, et al. Increased IL - 21/IL-21R expression and its proinflammatory effects in autoimmune thyroid disease. Cytokine. (2015) 72:160–5. doi: 10.1016/j.cyto.2014.11.005
43. Qin J, Zhou J, Fan C, Zhao N, Liu Y, Wang S, et al. Increased circulating th17 but decreased CD4(+)Foxp3(+) treg and CD19(+)CD1d(hi)CD5(+) breg subsets in new-onset graves' Disease. BioMed Res Int. (2017) 2017:8431838. doi: 10.1155/2017/8431838
44. Liu HY, Shi ZY, Fan D, Zhang SX, Wu LX, Lu KY, et al. Absolute reduction in peripheral regulatory T cells in patients with Graves' disease and post-treatment recovery. Mol Immunol. (2022) 144:49–57. doi: 10.1016/j.molimm.2022.02.004
45. Peng D, Xu B, Wang Y, Guo H, and Jiang Y. A high frequency of circulating th22 and th17 cells in patients with new onset graves' disease. PloS One. (2013) 8:e68446. doi: 10.1371/journal.pone.0068446
46. Loureiro-Amigo J, Franco-Jarava C, Perurena-Prieto J, Palacio C, Martínez-Valle F, and Soláns-Laqué R. Serum CXCL13, BAFF, IL - 21 and IL - 22 levels are related to disease activity and lymphocyte profile in primary Sjögren's syndrome. Clin Exp Rheumatol. (2021) 39 Suppl 133:131–9. doi: 10.55563/clinexprheumatol/fp741f
47. Qiu X, Liang Y, Wei Y, Lu M, Mei Y, Liu B, et al. Progression predictors of clinically isolated syndrome to multiple sclerosis: A prospective study in China. Clin Neurol neurosurgery. (2024) 245:108514. doi: 10.1016/j.clineuro.2024.108514
48. Antonelli A, Fallahi P, Elia G, Ragusa F, Paparo SR, Ruffilli I, et al. Graves' disease: Clinical manifestations, immune pathogenesis (cytokines and chemokines) and therapy. Best Pract Res Clin Endocrinol Metab. (2020) 34:101388. doi: 10.1016/j.beem.2020.101388
49. Davies TF, Andersen S, Latif R, Nagayama Y, Barbesino G, Brito M, et al. Graves' disease. Nat Rev Dis primers. (2020) 6:52. doi: 10.1038/s41572-020-0184-y
50. Tenenbaum A, Revel-Vilk S, Gazit S, Roimi M, Gill A, Gilboa D, et al. A machine learning model for early diagnosis of type 1 Gaucher disease using real-life data. J Clin Epidemiol. (2024) 175:111517. doi: 10.1016/j.jclinepi.2024.111517
51. Alfardan AS, Nadeem A, Ahmad SF, Al-Harbi NO, Alqinyah M, Attia SM, et al. DNMT inhibitor, 5-aza-2'-deoxycytidine mitigates di(2-ethylhexyl) phthalate-induced aggravation of psoriasiform inflammation in mice via reduction in global DNA methylation in dermal and peripheral compartments. Int Immunopharmacol. (2024) 137:112503. doi: 10.1016/j.intimp.2024.112503
Keywords: Graves’ disease, DNA methylation, IL17, IL21, IL22, epigenetic biomarkers
Citation: Jiang Y, Mu K, Huang Z, Zhang X, Wang Y, Xu W, Song R and Zhang J (2025) Th17-associated cytokine gene hypomethylation reflects epigenetic dysregulation in graves’ disease. Front. Immunol. 16:1635883. doi: 10.3389/fimmu.2025.1635883
Received: 27 May 2025; Accepted: 27 August 2025;
Published: 16 September 2025.
Edited by:
Karina Pino-Lagos, University of the Andes, ChileReviewed by:
Caio Santos Bonilha, University of Glasgow, United KingdomDelnavaz Jan, Tehran University of Medical Sciences, Iran
Copyright © 2025 Jiang, Mu, Huang, Zhang, Wang, Xu, Song and Zhang. This is an open-access article distributed under the terms of the Creative Commons Attribution License (CC BY). The use, distribution or reproduction in other forums is permitted, provided the original author(s) and the copyright owner(s) are credited and that the original publication in this journal is cited, in accordance with accepted academic practice. No use, distribution or reproduction is permitted which does not comply with these terms.
*Correspondence: Ronghua Song, c29tZW9uZXNyaDY2QDE2My5jb20=; Jinan Zhang, emhhbmdqaW5hbkBob3RtYWlsLmNvbQ==