 Tarmo Äijö
 Marianthi Gioulbasani1,2†
 Jair Ernesto Valenzuela
 Ageliki Tsagaratou
- 1Lineberger Comprehensive Cancer Center, University of North Carolina at Chapel Hill, Chapel Hill, NC, United States
- 2School of Biology, Aristotle University of Thessaloniki, Thessaloniki, Greece
- 3Lampe Joint Department of Biomedical Engineering, University of North Carolina at Chapel Hill, Chapel Hill and North Carolina State University, Raleigh, NC, United States
- 4Department of Genetics, University of North Carolina at Chapel Hill, Chapel Hill, NC, United States
- 5Department of Microbiology and Immunology, University of North Carolina at Chapel Hill, Chapel Hill, NC, United States
Ten Eleven Translocation (TET) proteins can oxidize 5-methylcytosine to generate in sequential steps oxidized forms of cytosine: 5-hydroxymethylcytosine, 5-formylcytosine and 5-carboxylcytosine. Through their catalytic activity TET proteins promote active DNA demethylation. There are three TET proteins: TET1, TET2 and TET3. In T cells, TET2 and TET3 are more highly expressed. In the past years we have extensively analyzed the impact of TET proteins and 5-hydroxymethylcytosine in T cell development. In this report, we focus on the impact of TET proteins in the TCR alpha (α) and beta (β) repertoires in thymic CD4 single positive cells and upon migration in the periphery. Our data reveal that both wild type and Tet2/3 DKO CD4 cells in the thymus and the spleen are polyclonal. Then, we focus on Tet2/3 DKO CD4 cells that are serially transplanted in recipient mice. Our TCR sequencing data reveals that expanded Tet2/3 DKO CD4 cells are less diverse and oligoclonal. Overall, this report serves as a resource of TCRα and TCRβ repertoire in both wild type and Tet2/3 DKO murine conventional CD4 T cells and provides insights on how expanded Tet2/3 DKO CD4 cells opt for specific TCRα and β repertoires.
Introduction
TET proteins are iron(II)/α-ketoglutarate (Fe(II)/α-KG)-dependent dioxygenases that catalyze the oxidation of 5-methylcytosine (5mC) to 5-hydroxymethylcytosine (5hmC) (1). There are three TET proteins; TET1, TET2 and TET3. TET1 was identified as a fusion partner of MLL in a case of pediatric acute myeloid leukemia (AML) bearing the t(10;11)(q22;q23) translocation (2, 3). All three TET proteins share a common, evolutionary conserved carboxyl-terminal catalytic domain that consists of a double-stranded β-helix domain and a cysteine-rich domain (4). Via their catalytic domain TET proteins oxidize 5-methylcytosine (5mC) to 5-hydroxymethylcytosine (5hmC) (1) and other oxidized cytosines (oxi-mCs), namely 5-formylcytosine (5fC) and 5-carboxylcytosine (5caC) (5). Loss of 5hmC correlates with myelodysplastic syndromes (6). Tet2 is one of the most frequently mutated genes in hematological cancers (7–9), such as angioimmunoblastic T cell lymphoma (AITL) (10–12) and peripheral T cell lymphoma, non-otherwise specified (PTCL-NOS) (13). TET2 mutations occur early in hematopoietic stem cells (HSCs) and Tet2 mutant HSCs proliferate faster compared to wild type HSCs, however Tet2 mutant HSCs are not fully transformed (7, 9, 13). Instead, secondary mutations are required to result in cancer emergence (9, 14). Further research using mice, demonstrated that murine Tet2 deficient HSCs proliferate faster compared to wild type HSCs in vivo and in vitro in serial plating assays (15, 16). This enhanced proliferative capacity of Tet2 HSCs was dependent on the enzymatic activity of TET2 (17, 18). Interestingly, targeting specifically TET2 in murine models is not sufficient to result in T cell expansion, presumably due to redundant functions with other TET proteins (19, 20).
Our work the past years has demonstrated a critical role for TET proteins and 5hmC in T cell development and differentiation (21, 22). Specifically, we (21) and others (23) have demonstrated that 5hmC marks active enhancers and decorates the gene body of highly expressed genes during thymic development in conventional (21, 24) and unconventional T cells (22, 24), such as invariant natural killer T (iNKT) cells, as well as in peripheral naïve and helper T cells (21, 23), and in regulatory T cells (Tregs) (25, 26). Importantly, it has been demonstrated that 5hmC is critical for recruiting DNA repair proteins at loci of DNA damage and in particular at double strand breaks (DSBs) (27). It has also been shown that oxi-mCs are stable epigenetic marks (28, 29) that are preferentially recognized by DNA repair proteins (30–32). Along these lines, immune cells that lack TET proteins such as hematopoietic stem cells, B cells, myeloid cells, iNKT cells and conventional T cells demonstrate genomic instability, defects in DNA repair and increase in DSBs (20, 22, 32–35).
We have previously systematically studied the thymic development of TET-deficient conventional and unconventional T cells (9, 36–39). Tet2/3 DKO iNKT cells in the thymus are significantly increased and they are characterized by skewing towards the NKT17 lineage (22, 39). This phenotype is regulated by TET2 catalytic activity (24). We have demonstrated that Tet2/3 DKO CD4 SP cells that develop in the thymus exhibit reduced levels of ThPOK, due to increased methylation of the proximal enhancer and the intragenic site A (24). Site A is bound by GATA3 in wild type CD4 SP cells when site A is unmethylated and can potentially function as a regulatory element to impact ThPOK expression (40). TET proteins are implicated in Treg stability (25, 41–44) and Treg function (26, 45, 46). In addition, we have demonstrated that Tet2/3 DKO CD4 cells in the periphery even at mice immediately post weaning, at 25 days old, are more activated compared to control CD4 cells (20). Notably, mice that lack TET2 and TET3 specifically in T cells or that have a germ line deletion of Tet2 and lack specifically Tet3 in T cells get sick by 5 weeks old and die by 7 weeks old due to a lymphoproliferative disease (22, 25). Thus, to assess the long-term expansion potential of Tet2/3 DKO peripheral CD4 T cells we performed serial transplantations in recipient mice (20). We discovered that Tet2/3 DKO CD4 cells can expand in immune-competent mice and we demonstrated that expanded Tet2/3 DKO CD4 cells exhibit increased stemness and increased genomic instability as demonstrated by increased aneuploidies (20). These expanded cells progressively downregulate CD4 expression and show decreased protein levels of the β chain of the T cell receptor (20). We have previously demonstrated that Tet2/3 DKO iNKT cells exhibit reduced diversity of their TCRβ repertoire upon expansion (34). However, despite our systematic studies on the impact of TET proteins in conventional T cell differentiation our understanding regarding their impact on TCR expression remains elusive.
Conventional T cells express a T cell receptor (TCR) that consists of a TCRαβ heterodimer and enables them to recognize a variety of peptide antigens, spanning from self-antigens to foreign antigens-that are presented via major histocompatibility complexes (47). This broad antigen recognition is achieved through a remarkable diversity of the available TCR heterodimers (48). Each TCR chain consists of a constant region and a variable region (48). The TCRα variable region is encoded by variable (V) and joining (J) genes, whereas the TCRβ variable region is encoded by V, J and diversity (D) genes (49–51). V(D)J recombination occurs during thymic development. During this process, double strand DNA breaks occur by the recombinase complex which consists of RAG1 and RAG2 (52). RAG1 and RAG2 recognize and cleave recombination signal sequences near the V, D and J segments (53). These physiological, regulated breaks are repaired through the process of non-homologous DNA end joining (NHEJ) (51, 54, 55). First, the gene Tcrb that encodes the TCRβ chain is assembled through recombination events at the double negative stage (DN) 3 of thymic development (56). At this stage, the TCRβ chain associates with the pre-TCRα chain to form the pre-TCR complex (57). The DN3 stage cells that successfully assemble the Tcrb gene undergo β-selection, and through a proliferative burst will eventually give rise to double positive (DP) cells. This process ensures that only cells capable to form a functional TCRα β heterodimer will develop (58, 59). During β-selection Tcrb gene rearrangement is subject to allelic exclusion, preventing further rearrangements events of the Tcrb gene (60, 61). DP cells stop expressing pre-TCRα chain and start the V-J recombination at the TCR locus. The process of TCR rearrangement results in the tremendous diversity of the TCRα/β heterodimer in the surface of the T cells. The total number of TCRs that are expressed by the T cells of an individual consist their TCR repertoire. Upon antigen encounter, T cells that express TCR specific to the antigen become activated and clonally expand resulting in increased representation of T cell clones that express the same TCR. Thus, while under physiological conditions we expect a diverse TCR repertoire, in pathological conditions (infections, autoimmunity, inflammation or cancer) the TCR repertoire becomes less diverse, as specific clones become dominant (62, 63).
In this report, we compare TCRα and TCRβ repertoires at the gene expression level in control and Tet2/3 DKO CD4 single positive (SP) cells in the thymus as well as CD4 cells isolated from the spleen of control and Tet2/3 DKO mice at 25 days old. We focus on CD4 cells because Tet2/3 DKO CD8 SP cells in the thymus are atypical and exhibit innate like characteristics (64). The activated phenotype of the Tet2/3 DKO thymic CD8 SP cells is not cell-intrinsic, instead it is due to the increase of the Tet2/3 DKO iNKT cells (22). In addition, the peripheral Tet2/3 DKO CD8 cells are significantly reduced (22). Finally, we assess the TCR repertoire in expanded Tet2/3 DKO T cells that acquire a stemness phenotype (20). Thus, we provide a resource that catalogues TCRα and TCRβ repertoires in CD4 SP and peripheral CD4 cells in mice. In addition, our data provides information on how concomitant loss of Tet2 and Tet3 impacts TCRα and TCRβ gene expression. Collectively, our data demonstrates that in our system the loss of TET2 and TET3 does not affect the diversity of TCRα and TCRβ chains during thymic development. However, upon expansion of Tet2/3 DKO T cells in serial transplantations we observe significantly reduced diversity of both TCRα and TCRβ chains.
Results and discussion
To investigate the impact of TET proteins on the TCR repertoire in thymic murine CD4 SP cells, we depleted immature CD24 expressing thymocytes and we subsequently sorted CD4 SP cells from control and Tet2/3 DKO mice (Supplementary Figure 1A) (24, 65). We note that we excluded unconventional iNKT cells, identified as TCRβ+ aGalCer-tetramer+ cells, as we have previously described (24, 65). Then we isolated total RNA from FACS sorted CD4 SP (24) (Supplementary Figure 1A). For all the sorted samples the purity was above 95 percent as we have previously described (24) (Supplementary Figures 2, 3). To profile the TCR repertoire using next generation sequencing, we amplified the full-length variable VJ sequences of Tcra transcripts and VDJ variable sequences of Tcrb transcripts by using TCR Switching mechanism at 5’ end of RNA template (SMART)-seq (66) and then sequenced the libraries. This approach uses as starting material total RNA and employs a 5’-Rapid amplification of cDNA ends (RACE)-based approach (66). Analysis of our datasets revealed that wild type and Tet2/3 DKO CD4 SP cells were polyclonal and expressed diverse Tcra and Tcrb genes (Figure 1A, Supplementary Tables 1, 2). In addition, to gain understanding on the TCR diversity across samples from another angle, we generated cumulative proportion curves (Figure 1B). The gradually rising curves indicate a large number of unique clones that contribute to the total TCR repertoire. Thus, our data reveals that TCR α/β libraries from wild type and Tet2/3 DKO CD4 SP cells are highly diverse (Figure 1B). We next asked if there was a preference for specific clones that would be more highly expressed among samples. We identified the 10 most abundant clones in each sample for TCR α and β chain and we examined the frequency of these clones in each sample. Our analysis reveals variability both in terms of most frequent clones expressed among samples and in terms of how dominant these clones are in each sample (Figure 1C, Supplementary Tables 3, 4). We also analyzed TCRβ repertoire at the protein level by Flow cytometry in wild type and Tet2/3 DKO CD4 SP T cells (Figure 1D, Supplementary Figures 4, 5). We used commercially available antibodies specific for different TCRβ chains (summarized in Supplementary Table 5). Our data further confirms that Tet2/3 DKO CD4 SP cells express diverse TCRβ chains, similarly to control mice (Figure 1D). We note that the percentage of Tet2/3 DKO CD4 SP cells expressing TCRVβ 8.1-8.2 chains is less compared to the control CD4 SP cells, whereas we observed an increase of TCRVβ 5.1-5.2 chains in Tet2/3 DKO CD4 SP cells (Figure 1C).
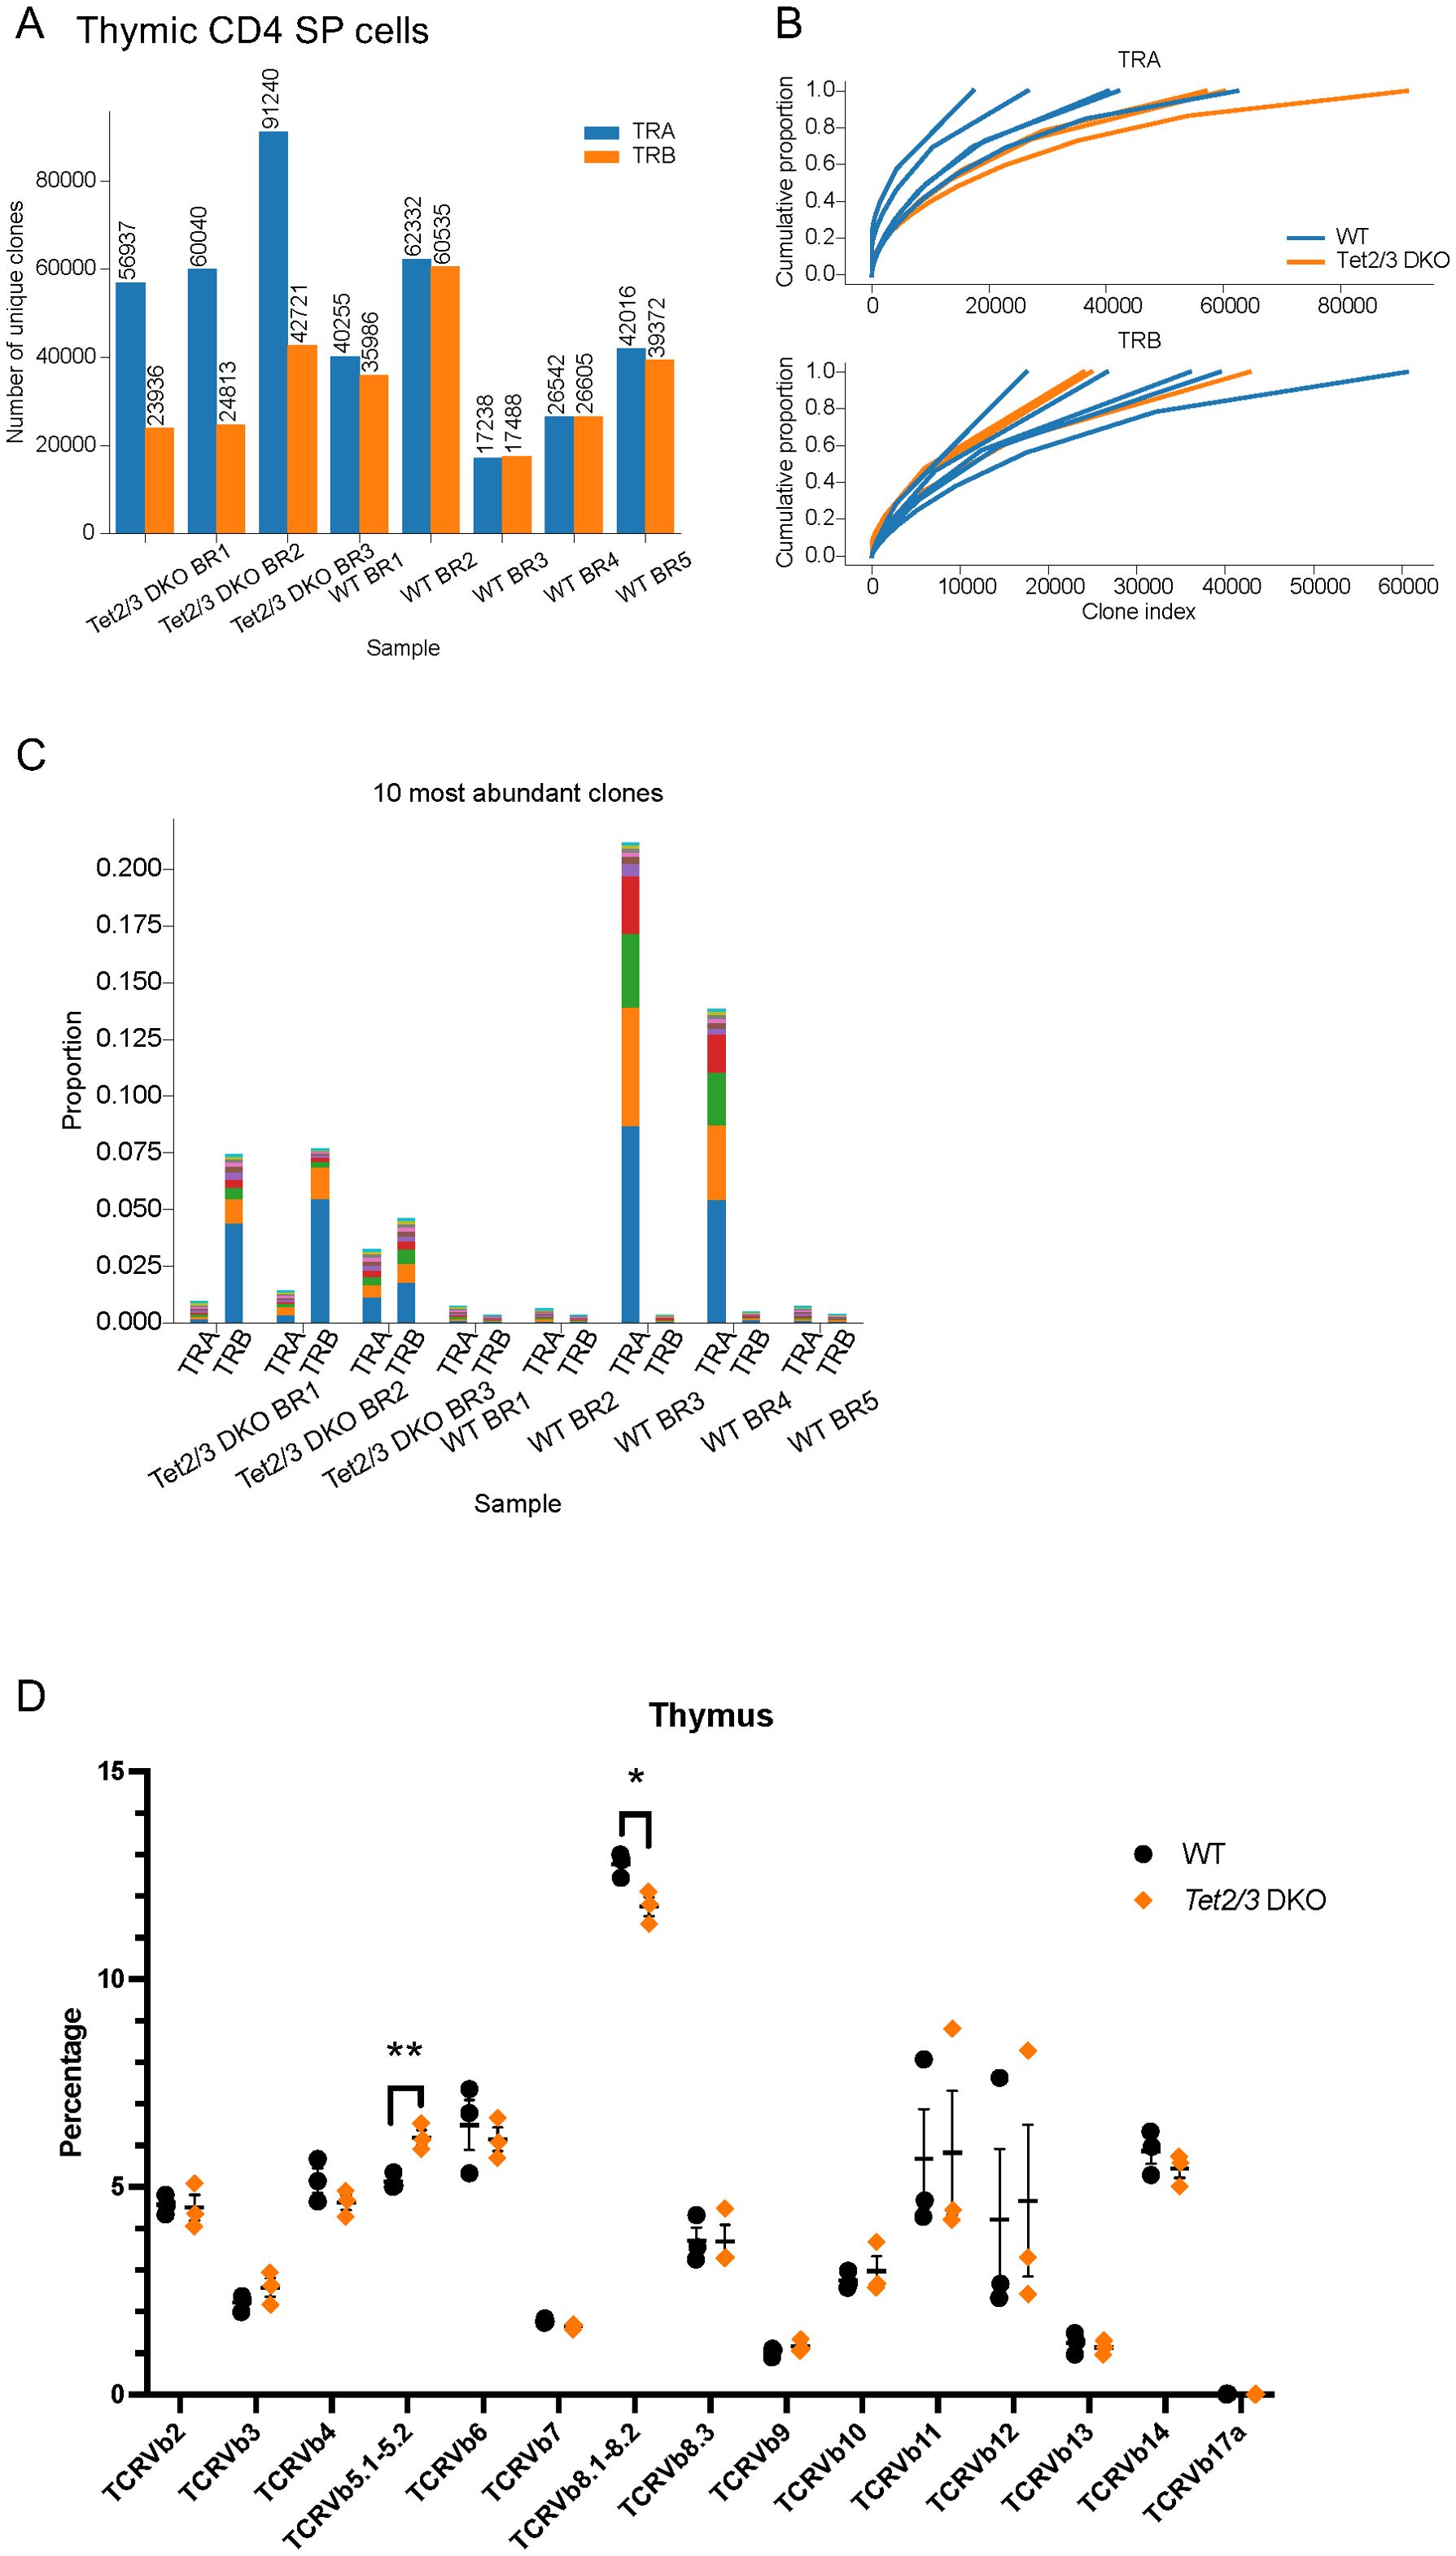
Figure 1. Tet2/3 DKO thymic CD4 SP cells express similar TCRα and TCRβ chains compared to wild type CD4 SP cells. (A) Total RNA was isolated from wild type (WT) (n=5), and Tet2/3 DKO (n=3) thymic CD4 SP cells (excluding aGalCer+TCRβ+ cells). TCRα (TRA, shown in blue) and TCRβ (TRB, shown in orange) repertoire was assessed by TCR SMART-seq. The numbers of identified clones per biological replicate (BR) and genotype are depicted in a bar plot. Each bar indicates the number of unique clones. (B) Cumulative frequency curves for TCRVα and TCRVβ chains. Each plot depicts the cumulative proportion (y axis) of the unique clones (x axis, clone index) identified by TCR SMART-seq for WT (n=5, shown in blue) and Tet2/3 DKO (n=3, shown in orange) thymic CD4 SP cells. The slope indicates a broad distribution of clone sizes where multiple different clones contribute to the repertoire. (C) Bar plot indicating the proportion of the 10 most abundant clones of the TCRα and TCRβ chains as identified by TCR SMART-seq for WT (n=5) and Tet2/3 DKO (n=3) thymic CD4 SP cells. Each clone is indicated with a different color within one sample. (D) Assessing TCRβ repertoire by flow cytometry. Each symbol represents a mouse. N=3 WT mice (indicated in black dots) and n=3 Tet2/3 DKO mice (shown in orange rhombus). 3 independent experiments were performed. Unpaired student’s t-test was performed to assess statistical significance. p<0.05 (*), p<0.01 (**). Specifically, p value for TCR Vb 5.1-5.2 was 0.0076 and p value for TCR Vb 8.1-8.2 was 0.0224. Male and female mice (average age 25 days old) were evaluated.
We then proceeded to analyze TCR repertoire of peripheral CD4 T cells from young mice approximately 25 days old as we have previously described (20) (Supplementary Figure 1B). We depleted CD19+ B cells and we sorted total (activated and naïve) CD4 T cells, but we excluded iNKT cells and CD25 expressing cells (20) (Supplementary Figures 6, 7). Sorted samples had a purity above 95% (Supplementary Figures 6, 7) as previously described (20). We isolated RNA (20) and we performed TCR SMART-seq sequencing to assess TCRα and TCRβ repertoire (Supplementary Figure 1B). Our data indicates that wild type and Tet2/3 DKO peripheral CD4 T cells exhibit diverse TCRα and TCRβ repertoire (Figure 2A, Supplementary Tables 1, 2). Cumulative proportion curves further support our assessment that Tet2/3 DKO CD4 T cells isolated from the spleen of young mice are diverse to a comparable level to wild type CD4 T cells (Figure 2B). We next investigated the top 10 most abundant clones for TCRα and TCRβ (Figure 2C, Supplementary Tables 3, 4). This was confirmed for the TCRβ at the protein level by flow cytometry (Supplementary Figure 8). We note that while Tet2/3 DKO CD4 cells are polyclonal they demonstrate some differences in terms of TCRβ repertoire expression (Supplementary Figure 9). Specifically, in the samples that we assessed, the percentage of Tet2/3 DKO CD4 cells that express TCRVβ2 is significantly reduced whereas the percentage of TCRVβ5.1-5.2 and TCRVβ12 is significantly increased. Further research is required to address if there are functional implications for the observed differences. Another possibility is that these differences reflect stochastic variabilities in the TCR repertoire across biological replicates. Collectively, the TCRα and β repertoire is highly diverse in thymic murine CD4 SP and peripheral CD4 T cells. Regarding the Tet2/3 DKO CD4 samples isolated either from the thymus (24) or the spleen (20) of young mice we emphasize that the sample size is relatively small. We analyzed three samples from the thymus and two from the spleen. Our data indicate that concomitant deletion of TET proteins does not compromise the TCR rearrangement and the diversity of the TCRα/β heterodimer.
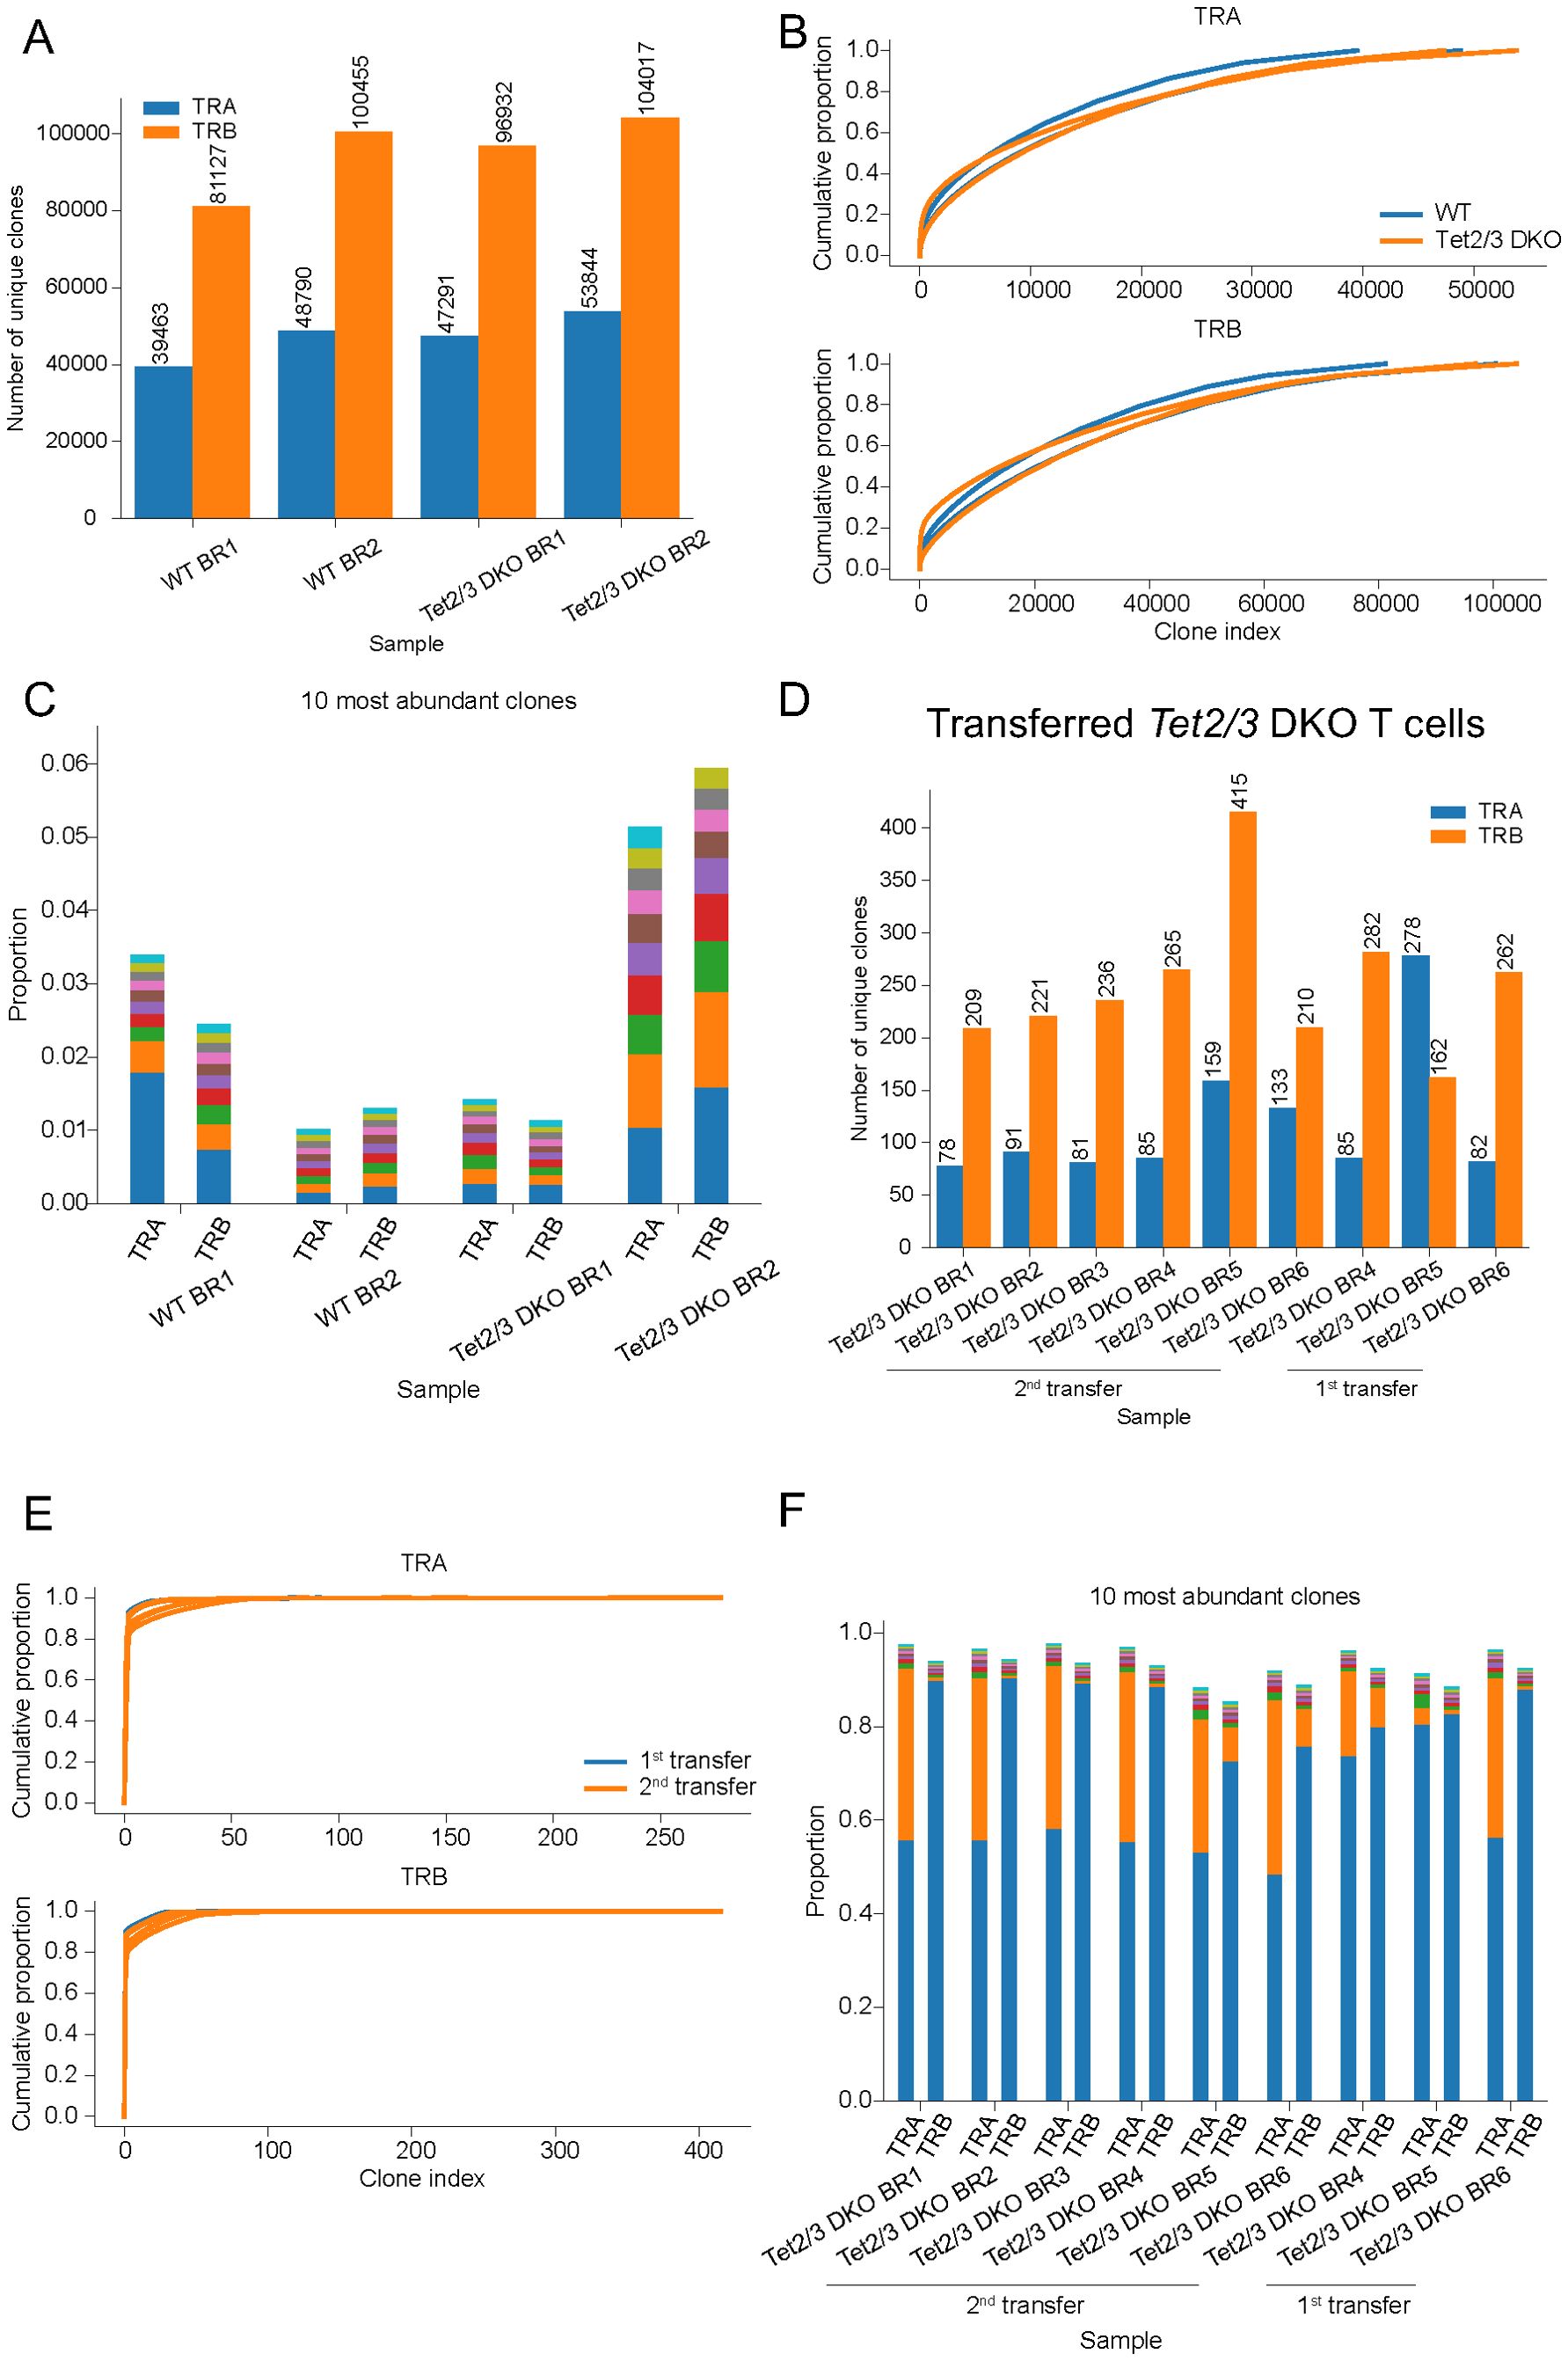
Figure 2. Tet2/3 DKO CD4 T cells that have been serially transplanted in immunocompetent recipients express a limited amount of TCRα and TCRβ chains and are oligoclonal. (A) Total RNA was isolated from wild type (WT) total CD4 (n=2), and Tet2/3 DKO total CD4 (n=2) cells (excluding aGalCer+TCRβ+ cells and CD25+ cells) isolated from the spleen of mice with average age 25 days old. TCRα and TCRβ repertoire was assessed by TCR SMART-seq. The numbers of identified clones per biological replicate (BR) and genotype are depicted in a bar plot. Each bar indicates the number of unique clones for TCRα (in blue) and TCRβ (in orange). (B) Cumulative proportion curves for TCRVα and TCRVβ chains. Each plot depicts the cumulative proportion (y axis) of the unique clones (x axis, clone index) identified by TCR SMART-seq for WT total CD4 (n=2), and Tet2/3 DKO total CD4 (n=2) cells (excluding aGalCer+TCRβ+ cells and CD25+ cells) isolated from the spleen. (C) Bar plot indicating the proportion of the 10 most abundant clones of the TCRα and TCRβ chains as identified by TCR SMART-seq for WT (n=2) and Tet2/3 DKO (n=2) CD4 cells isolated from the spleen. Different colors represent different clones within one sample. (D) RNA was isolated from transferred and expanded Tet2/3 DKO CD4 cells from the spleen either after 1 transplantation (n=3) or 2 serial transplantations (n=6) in congenic recipient mice. TCRα and TCRβ repertoire was assessed by TCR SMART-seq. The numbers of identified clones per biological replicate (BR) and condition (1st transfer or 2nd transfer) are depicted in a bar plot. Each bar indicates the number of unique clones for TCRα (in blue) and TCRβ (in orange). (E) Cumulative proportion curves for TCRVα and TCRVβ chains. Each plot depicts the cumulative proportion (y axis) of the unique clones (x axis, clone index) identified by TCR SMART-seq Tet2/3 DKO CD4 cells from the spleen either after 1 transfer (in blue, n=3) or 2 serial transfers (in orange, n=6) in congenic recipient mice. (F) Bar plot indicating the proportion of the 10 most abundant clones of the TCRα and TCRβ chains as identified by TCR SMART-seq for transferred and expanded Tet2/3 DKO CD4 cells from the spleen either after 1 transfer (n=3) or 2 serial transfers (n=6) in congenic recipient mice. For all the experiments, male and female mice were evaluated.
We recently published that serially transplanted Tet2/3 DKO CD4 cells exhibit upregulation of stemness genes, genomic instability and expand in the recipient mice (20). Our analysis revealed that the expanded Tet2/3 DKO T cells demonstrated a significant and reproducible decrease at the protein level of the TCRβ expression (20). A typical characteristic of expanded, activated T cells in disease states, such as autoimmunity, inflammation and cancer, is the expansion of T cells that express a specific TCRα/β heterodimer resulting in a significant reduction of the diversity of the available TCR clones (63). To assess the TCR repertoire of the serially transplanted and expanded Tet2/3 DKO T cells we isolated RNA from Tet2/3 DKO T cells that have been transplanted once or twice in immunocompetent recipients as we have previously described (20) (Supplementary Figure 1C). The purity of the sorted cells was at least 95% (20)(Supplementary Figure 10). We performed TCR SMART-seq (Supplementary Figure 1C). The analysis revealed that the serially transplanted and expanded Tet2/3 DKO CD4 cells expressed a very limited number of TCRα and TCRβ chains, compared to wild type CD4 cells (Figure 2D, Supplementary Tables 1, 2). Interestingly, we did not detect a significant difference in the diversity of TCR repertoire between first and second transplantation (Figure 2D, Supplementary Tables 1, 2). Cumulative proportion curves were very steep for the Tet2/3 DKO samples after transfer (Figure 2E), indicating low diversity as a diminished number of dominant clones accounts for the TCR repertoire of these samples. These findings further support the reduced TCRα/β diversity of the Tet2/3 DKO T cells after first and second transfer. This is in sharp contrast to the cumulative curves for the CD4 SP TCR SMART-seq data (Figure 1B) and the CD4 cells from the spleen of young mice TCR SMART-seq data (Figure 2B) where the curves were flatter, reflecting higher diversity of clones. Next, we investigated the top 10 most highly expressed clones in these samples (Figure 2F). In these barplots the dominant expression of one clone becomes apparent. Strikingly, in some samples the dominant clones represent more than 80% of the repertoire (Figure 2F, Supplementary Tables 3, 4). Collectively, our analysis indicates that the oligoclonal expansion occurs during the first transplantation and that all the expanded Tet2/3 DKO T cells can equally expand in the second transplantation in recipients with intact immune system.
We further analyzed our data to gain insight in the diversity of the TCR repertoire across samples. To this end we used the Shannon-Wiener index which is a function of the relative number of clonotypes present and the relative abundance of each clonotype (67). Analysis of our data revealed that Tet2/3 DKO T cells after transfer had reduced diversity compared to WT and Tet2/3 DKO CD4 T cells in the thymus or the spleen (Figure 3A, Supplementary Figure 11). We note that the number of distinct biological replicates varied across all the conditions from a minimum of two distinct biological replicates to a maximum of six distinct biological replicates. To perform statistical analysis of our samples we utilized the Kruskal-Wallis test, a non-parametric statistical test. Our analysis reveals that Tet2/3 DKO CD4 T cells after first or second transfer are significantly less diverse compared to either thymic wild type or Tet2/3 DKO CD4 SP cells (Figure 3A). In addition, Tet2/3 DKO CD4 T cells after first or second transfer are significantly less diverse compared to CD4 T cells isolated from the spleen of young mice (regardless of the genotype) that have not been exposed to transfer (Supplementary Figure 11). Thus, the reduction of TCR diversity for both α and β chains is significant in Tet2/3 DKO T cells after transfer. Additional comparison of the relative TCR diversity across our samples confirms that in wild type and Tet2/3 DKO CD4 SP T cells isolated from the thymus and in wild type and Tet2/3 DKO CD4 cells isolated from the spleen of young mice we do not observe a dominant clone, indicating high relative diversity. This observation is consistent for TCRα (Figure 3B) and TCRβ (Figure 3C) chains. On the other hand, focusing on Tet2/3 DKO cells post transfer (first and second) it becomes apparent the presence of clones that dominate the samples and thus indicate reduced diversity (Figures 3B, C).
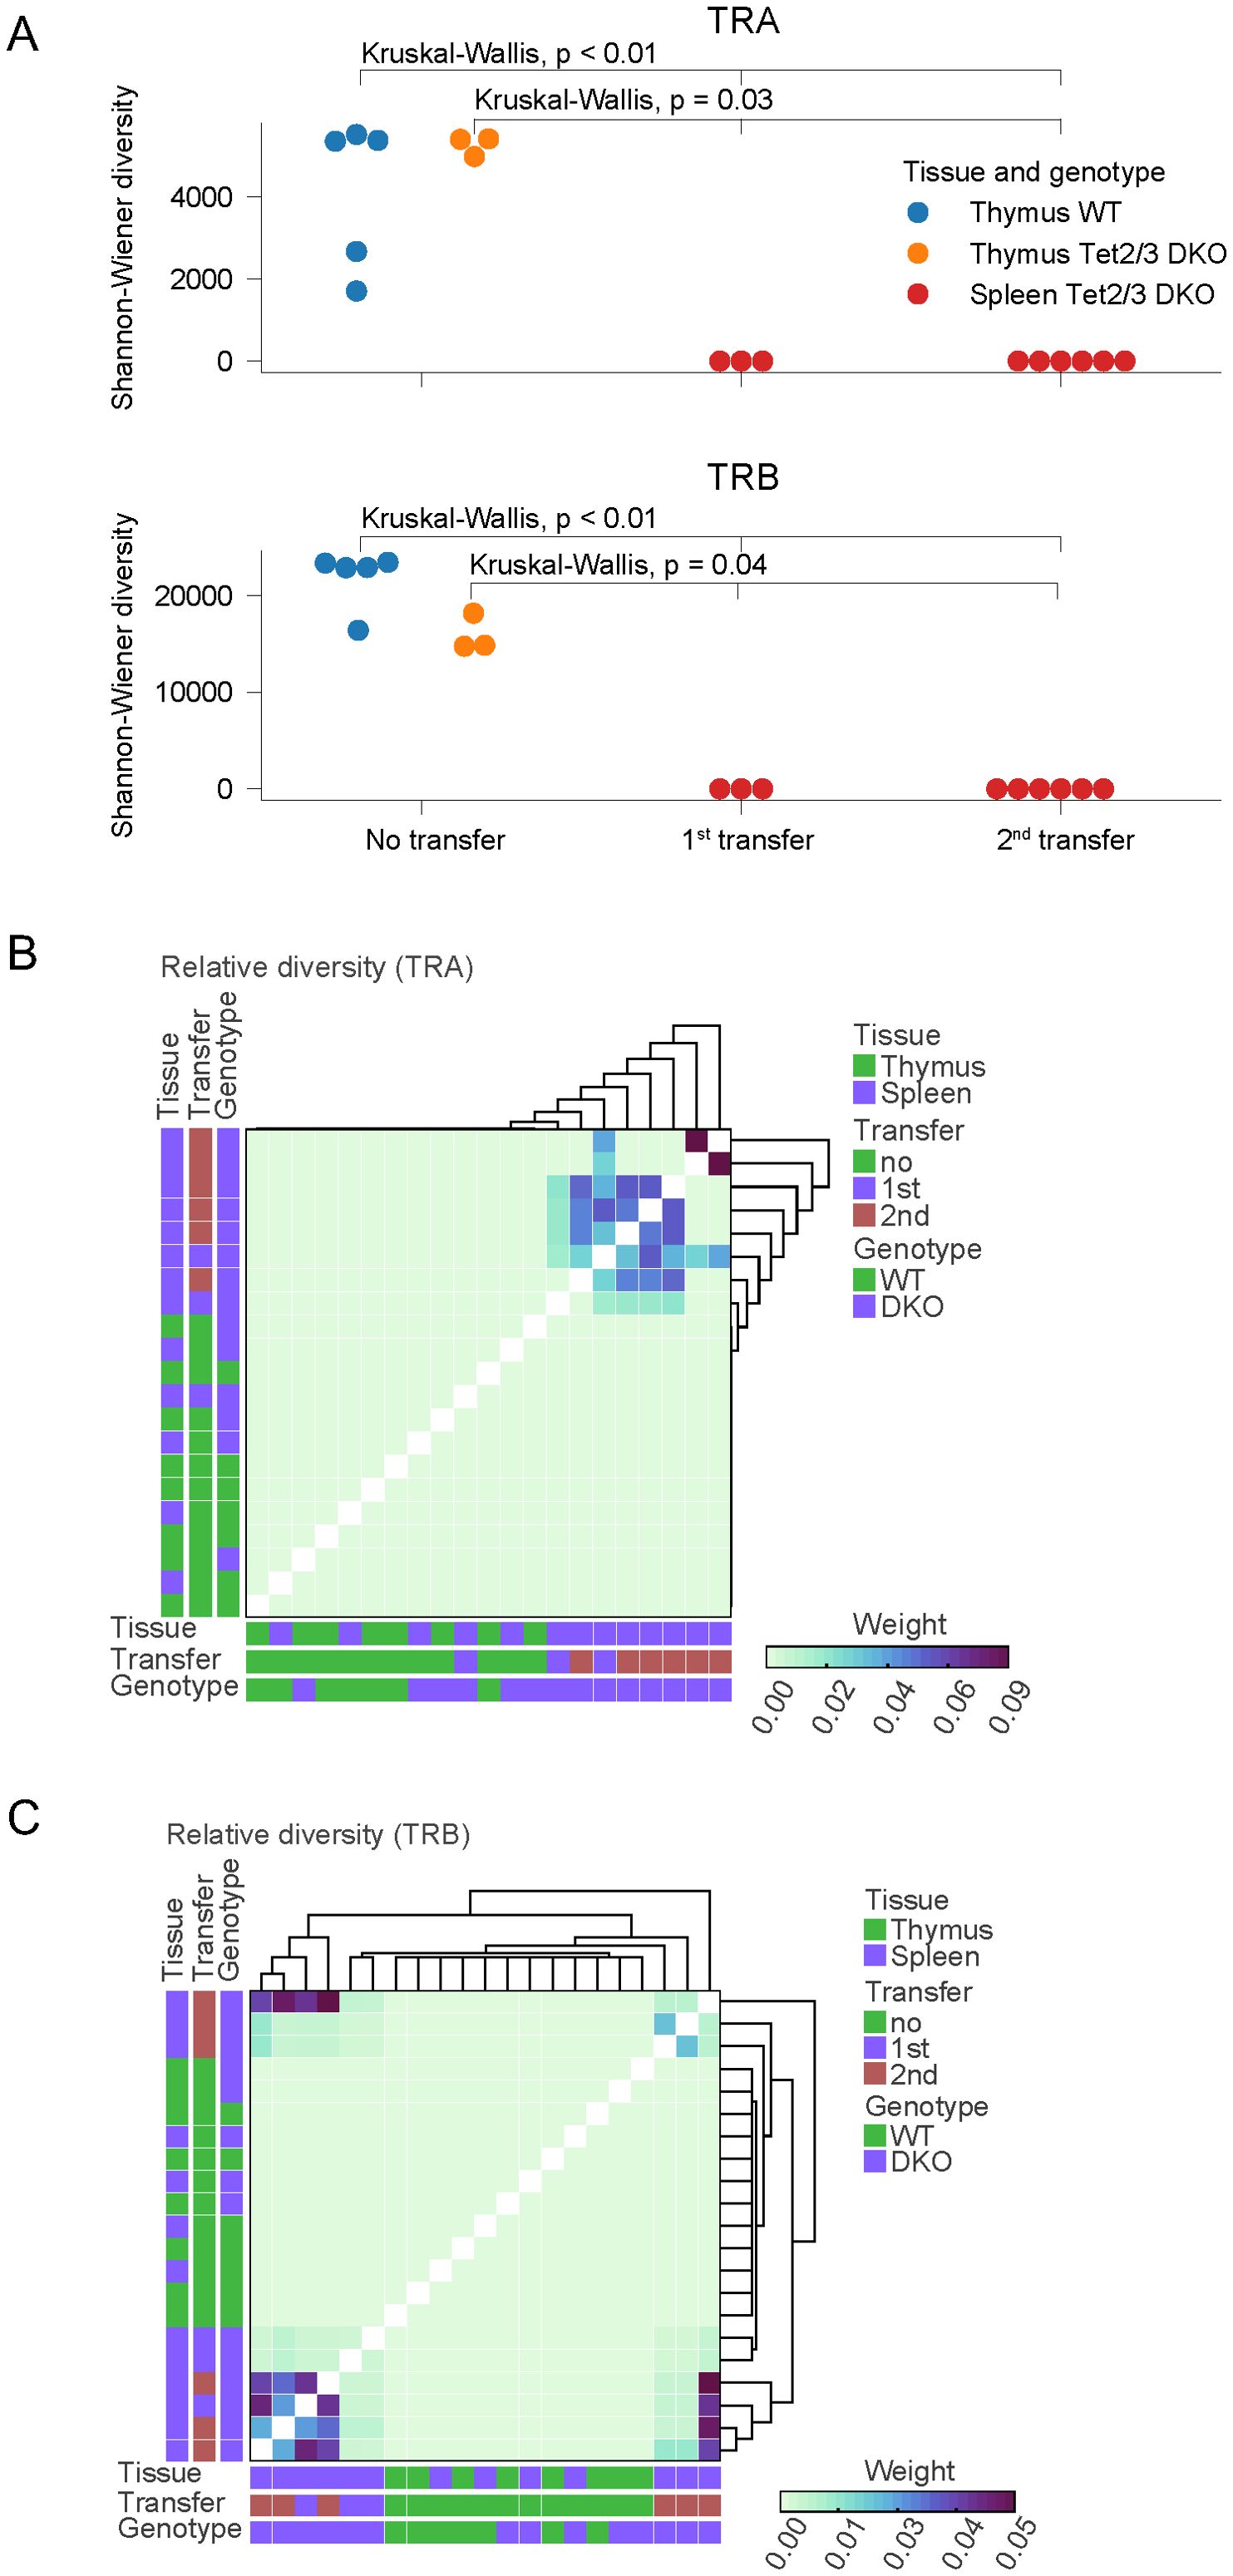
Figure 3. Comparing TCR diversity in control and Tet2/3 DKO CD4 T cells during development and after transfer in congenic recipients. (A) Shannon-Wiener diversity comparison for TCRα and TCRβ chains determined by TCR SMART-seq for wild type (WT) (n=5) and Tet2/3 DKO (n=3) CD4 SP samples in thymus, as well as from Tet2/3 DKO CD4 cells that have been transferred in congenic recipients and expanded after one (n=3) or two transfers (n=6). Our analysis reveals the high diversity of the CD4 samples isolated from thymus regardless of the genotype. TCR SMART-seq for Tet2/3 DKO CD4 cells isolated after 1st or 2nd transfer in congenic recipients reveals reduced diversity. Statistical analysis using the Kruskal-Wallis test reveals that Tet2/3 DKO T cells after transfer (1st, 2nd) exhibit significantly reduced diversity compared to thymic WT CD4 SP cells (p<0.01) and compared to Tet2/3 DKO CD4 SP cells (p=0.03). (B) Relative diversity was calculated between samples for the TCRα for WT CD4, Tet2/3 DKO CD4 SP, WT CD4 isolated from spleen, Tet2/3 DKO CD4 isolated from spleen, Tet2/3 DKO CD4 after 1st or 2nd transfer in congenic recipients and plotted into heatmap. A hierarchical clustering was performed on the relative diversity weight. Parameters such as tissue (thymus/spleen), transfer (no, 1st, 2nd) and genotype (WT, DKO) are indicated. Higher weight indicates greater contribution (as measured by read counts) in the overall repertoire of the sample. The Tet2/3 DKO samples for 1st and 2nd transfer have clones with high contribution in the repertoire and thus reduced diversity. (C) As in B, focusing on data for TCRβ.
Our next goal was to study the diversity regarding the usage of gene segments during the V(D)J rearrangement process in our samples. Our analysis demonstrated that usage of J gene segment for TCRα (Figure 4A) and for TCRβ (Figure 4B) was diverse in CD4 cells isolated from the thymus or the spleen of wild type and Tet2/3 DKO mice, whereas only a small subset of J segments contributed in rearrangements for TCRα (Figure 4A) and for TCRβ (Figure 4B) in Tet2/3 DKO T cells after first or second transfer. Similar analysis for the V gene segment for TCRα (Supplementary Figure 12) and for TCRβ (Figure 4C) resulted in comparable conclusions, confirming the dominance of a small number of V gene segments that are used in Tet2/3 DKO T cells after first or second transfer, supporting the lack of diversity in these samples.
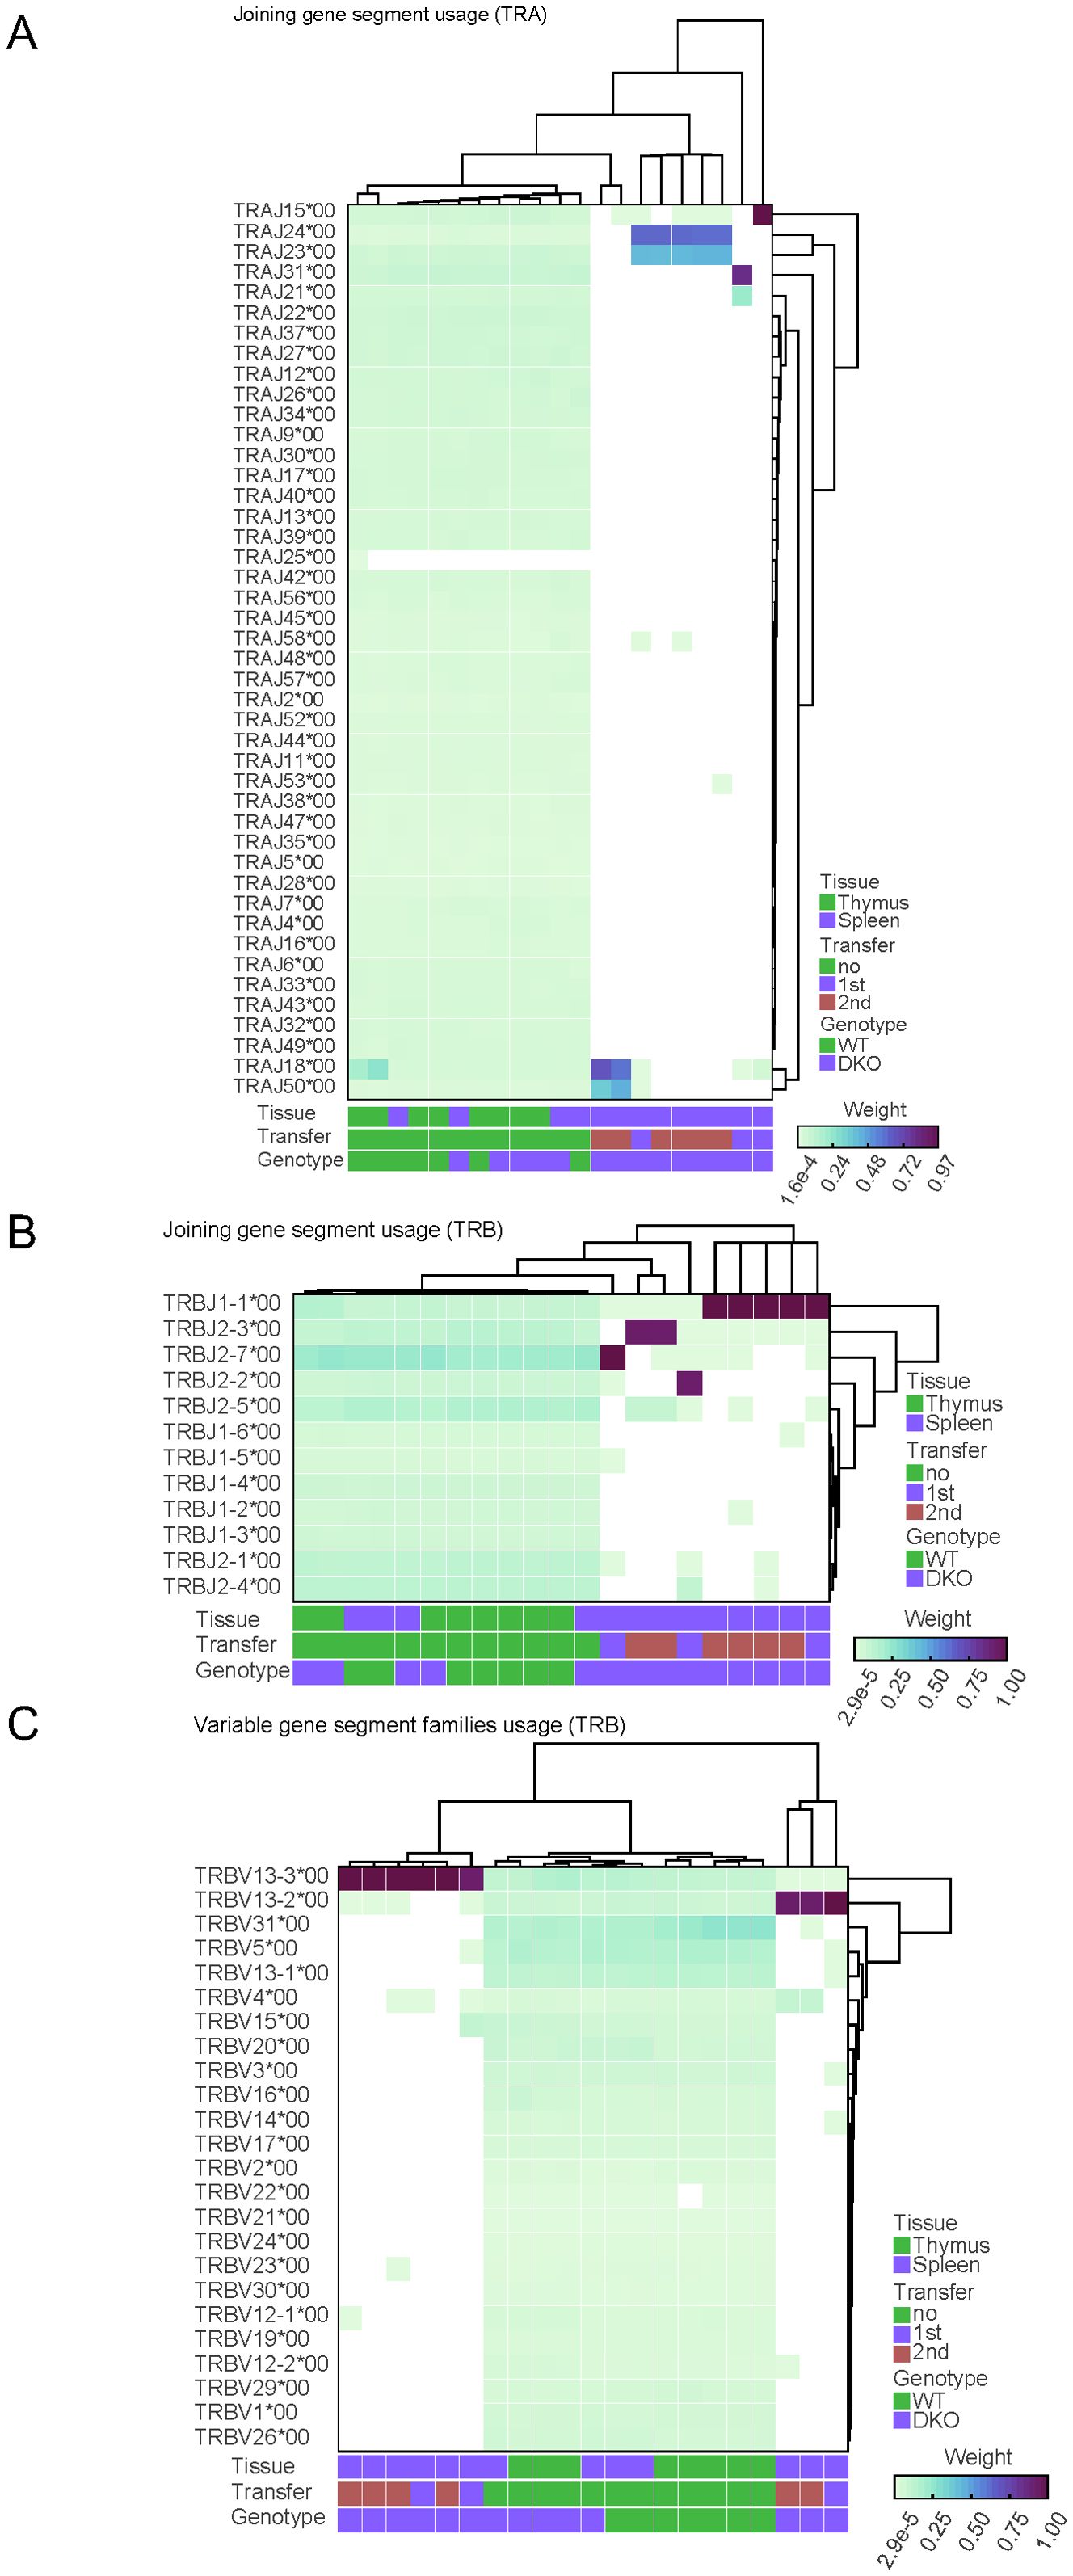
Figure 4. Comparison of diversity within segment usage across samples reveals reduced diversity in Tet2/3 DKO T cells after transfer in congenic recipients. (A) Relative diversity was calculated between samples for the joining (J) segment gene usage for TCRα for WT CD4, Tet2/3 DKO CD4 SP, WT CD4 isolated from spleen, Tet2/3 DKO CD4 isolated from spleen, Tet2/3 DKO CD4 after 1st or 2nd transfer in congenic recipients and plotted into heatmap. A hierarchical clustering was performed on the relative diversity weight. Parameters such as tissue (thymus/spleen), transfer (no, 1st, 2nd) and genotype (WT, DKO) are indicated. Higher weight indicates greater contribution (as measured by read counts) in the overall J gene segment usage for the TCRα repertoire of the sample. The Tet2/3 DKO samples for 1st and 2nd transfer have J gene segments with high contribution in the repertoire and thus reduced diversity. (B) As in A, focusing on data for TCRβ. (C) Relative diversity was calculated between samples for the variable (V) segment gene usage for TCRβ for WT CD4, Tet2/3 DKO CD4 SP, WT CD4 isolated from spleen, Tet2/3 DKO CD4 isolated from spleen, Tet2/3 DKO CD4 after 1st or 2nd transfer in congenic recipients and plotted into heatmap. A hierarchical clustering was performed on the relative diversity weight. Parameters such as tissue (thymus/spleen), transfer (no, 1st, 2nd) and genotype (WT, DKO) are indicated. Higher weight indicates greater contribution (as measured by read counts) in the overall V gene segment usage for the TCRβ repertoire of the sample. The Tet2/3 DKO samples for 1st and 2nd transfer have J gene segments with high contribution in the repertoire and thus reduced diversity.
Specifically, our analysis indicates predominant representation of TcrVβ 13. Interestingly, it has been reported that a patient with granular T cell leukemia had 95% dominance of TCRVβ 13.3 (68).
Our data indicates that in mice that have a germline deletion of TET2 and a deletion of TET3 at the DP cell stage using CD4-cre conditional mice (69) the TCR repertoire of conventional thymic CD4 SP is diverse. Similarly, we observe that the peripheral conventional Tet2/3 DKO CD4 T cells are polyclonal. We must note that 5hmC and the other oxi-mCs are stable modifications, thus there are still sufficient amounts present at the DN3 stage when the VDJ recombination starts at the pre-TCRβ since at that stage only TET2 is deleted. At the DP stage when the VJ recombination occurs for the pre-TCRα, TET3 is deleted but while 5hmC levels are substantially reduced compared to wild type cells, we can still detect 5hmC (22). However, 5hmC levels are very much reduced at the thymic Tet2/3 DKO CD4 SP cells (22). Overall, we report that in our mouse model concomitant loss of TET2 and TET3 does not appear to compromise the diversity of the TCR of CD4 cells in the thymus or in the periphery.
However, expanded Tet2/3 DKO CD4 T cells isolated from the spleen of congenic immunocompetent recipients demonstrate reduced expression of the TCRβ compared to control CD4 cells (20). The observed oligoclonal expansion is a feature that has been previously reported in mouse models of T cell malignancy (70), including models with defects in TET2 (71). We have previously discovered that Tet2/3 DKO CD4 T cells after transfers in congenic recipients demonstrate a stemness gene expression signature (20). Our data demonstrated that these transferred and expanded in congenic, immune-competent recipients Tet2/3 DKO T cells could escape immune surveillance (20). We hypothesize that the dominant TCR clones potentially characterize those Tet2/3 DKO T cells that had an increased stemness potential compared to the other clones. As a result, these clones have a proliferative advantage and preferentially expand during the transfers. We cannot exclude additional possibilities that contribute in this striking oligoclonal expansion of Tet2/3 DKO T cells during transfers. For instance, the selected clones may exhibit increased survival compared to the other T cells that become eliminated. To formally address the above possibilities, it would be informative to perform single cell analysis to simultaneously assess TCR expression and gene expression programs in Tet2/3 DKO CD4 T cells before transfer and at distinct time points after transfer. This approach could reveal if the clones that ultimately prevail after transfers are characterized by an enhanced stemness signature compared to the non-selected Tet2/3 DKO CD4 T cells.
As TET proteins are tumor suppressor genes and in particular TET2 is frequently mutated in PTCL-NOS (9, 13, 72), it is important to highlight connections between our findings in murine Tet2/3 DKO T cells (20) and human PTCL. Our samples exhibit genomic instability as reflected by increased chromosomal copy numbers (20). Indeed, aneuploidies have been reported in cases of PTCL-NOS (73). In addition, comparison of human PTCL samples reveals reduced diversity of TCR clones across the samples and clonal expansion of dominant clones, however there is no prominent TCR clone shared among all the samples potentially due to the stochastic selection of the dominant clone and the heterogeneity of the lymphomas that are grouped together in the PTCL classification (74). At the same time, we wish to emphasize that there are also differences in our model compared to human T cells that give rise to T cell lymphomas due to TET2 mutations. Specifically, in human AITL TET2 loss of function mutations co-occur with gain of function mutations of the RHOA GTPase and result in cancerous T cells that exhibit a phenotype with characteristics of follicular helper T cells (Tfh) (10, 12, 72). Detailed analysis using mouse models revealed that the gain of function mutation of RHOA was driving the Tfh skewing, whereas TET2 loss of function mutations were critical for the proliferation (75). However, our molecular and phenotypic analysis of the Tet2/3 DKO murine T cells after transfer indicated a lack of Tfh phenotype (20). We attribute this to the fact that in the mice we use for our studies we delete simultaneously TET2 and TET3, which are the two most highly expressed TET proteins in T cells (6, 22, 24, 76). We chose this approach because our goal in our studies is to investigate the impact of profound loss of 5hmC in T cell differentiation, function and overall biology. However, we clarify that in human blood cancers, including PTCL, simultaneous mutations in TET proteins are extremely rare (73). These critical discrepancies in our study design must be carefully assessed and taken into account when we attempt to make correlations of our findings with observations relevant to human disease.
Conclusions
In this report, we provide a resource of TCRα and TCRβ repertoire of wild type murine CD4 cells in the thymus and in spleen. In addition, we demonstrate that conventional CD4 SP cells in the thymus and peripheral CD4 cells in the spleen that lack the DNA demethylases TET2 and TET3 express a diverse TCR repertoire, with a breadth of distinct TCRα and TCRβ clones that is comparable to wild type populations. However, when we assess Tet2/3 DKO T cells that have been serially transplanted and expanded in immunocompetent recipients we notice a striking reduction in the diversity of the TCR repertoire for both chains.
Methods
Mice
Mice were maintained under specific pathogen-free conditions at the Genetic Medicine building, in a facility managed by the Division of Comparative Medicine at University of North Carolina (UNC) Chapel Hill. All the experiments using mice were performed as described in our approved protocol (protocol number: 20-013, continuation protocol number: 22-252) by the UNC Institutional Animal Care and Use Committee. C57BL/6 (B6) (stock number: 000664, RRID: IMSR_JAX:000664) were obtained from Jackson Laboratories and were bred and maintained in our facility. B6. SJL-Pyprca Pepcb/BoyJ (common name B6 CD45.1) (stock number 002014, RRID: IMSR_JAX:002014) were purchased from Jackson Laboratories and were either used for transfers after an acclimation period or were bred and maintained in our facility. Tet2-/-Tet3flx/flx CD4Cre (22) mice have been described in previous publications. Tet2-/-Tet3flx/flx CD4Cre mice were used between 22–25 days old. For the experiments, we used sex and age-matched mice as we described (20, 24). When feasible, both male and female mice were used as indicated in the figure legends. To determine the genotype of the mutant mice we performed PCR genotyping as previously described (20, 24, 77). Mice were ear tagged and murine tissue was isolated as described in our approved mouse protocol. Genomic DNA was extracted using Phire Animal Tissue Direct PCR kit (Thermo scientific, cat no F-140WH), as described in the protocol provided by the manufacturer. To amplify DNA fragments, we performed PCR amplification using the Phire DNA polymerase (Thermo scientific) and specific primers using Biorad T100 or Biorad C1000 Touch thermocyclers. Subsequently, PCR products were run in a 3% agarose gel and were visualized using SYBR safe (Invitrogen, Thermo Scientific) staining in an Axygen Gel documentation system.
Flow cytometry
Mice were euthanized by CO2 asphyxiation. Thymus and spleen were harvested. To prepare single-cell suspensions the organs were dissociated using a 70um cell strainer (Falcon) as previously described (65, 78). Specifically for the spleen suspension, erythrocytes were depleted using ACK lysing buffer (LifeTechnologies). Splenocytes were incubated for 10 minutes with TruStain Fc PLUS (anti-mouse CD16/32, clone: S17011E, Biolegend, Research Resource Identifier RRID: AB_2783138) at room temperature. Cells were stained in FACS buffer (PBS containing 2% FBS). Dead cells were excluded by using fixable viability dye (fixable viability dye efluor780, cat. no: 65-0865-18, eBioscience). Antibodies were used conjugated with fluorophores: CD4 APC (dilution 1:200, Biolegend, clone: RM4-5, RRID: AB_312718) or CD4 BV711 (dilution 1:200, Biolegend, clone: RM4-5, RRID: AB_11219396), CD8 PerCP-Cy5.5 (dilution 1:200, Biolegend, clone: 53-6.7, RRID: AB_2075239) or CD8 BV650 (dilution 1:200, Biolegend, clone: 53-6.7, RRID: AB_11124344), Tetramer (α-GalCer) PE (dilution 1:400, from NIH tetramer core), B220 PE-Cy7 (dilution 1:400, Biolegend, clone: RA3-6B2, RRID: AB_313004). To assess TCRβ repertoire, cells were also stained using the β TCR Screening Panel FITC (BD Pharmingen). For each clone, 20 µL of the corresponding antibody were added per reaction, according to manufacturer instructions (Supplementary Table 5). aGalactosyl-ceramide loaded tetramer conjugated with PE was obtained from NIH tetramer Core and was used in a dilution 1:400 per staining reaction.
Samples were analyzed by Flow Cytometry in a Novocyte 3005 (ACEA, Agilent). For data acquisition the NovoExpress software (Agilent) was used. Data analysis and FACS plots generation was performed using FlowJo (Treestar).
Cell enrichment & flow cytometry activated sorting
The detailed procedures for enriching, sorting and obtaining thymic WT and Tet2/3 DKO CD4 SP cells, WT and Tet2/3 DKO CD4 cells from the spleens and Tet2/3 DKO expanded cells have been previously described (20, 24). Briefly, thymocytes were dissociated as previously described (65, 78) and were enriched for mature T cell subsets by depleting CD24+ cells, using biotinylated anti-mouse CD24 (clone:M1/69, RRID: AB_312837, Biolegend) (24). Splenocytes were treated with ACK buffer (Life Technologies) to remove erythrocytes and were depleted for B cells using biotinylated anti-mouse CD19 (clone: 6D5, RRID: AB_313639), any remaining blood cells using biotinylated anti-mouse TER119/Erythroid cells (clone: TER119, RRID: AB_313705). Cells were stained with CD4 AF488 (clone: RM4-5, RRID: AB_389303), TCRβ PERCPCy5.5 (clone: H57-597, RRID: AB_1575173), CD25 APC (clone: PC61, RRID: AB_312861), aGalactocyl-Ceramide (aGal-Cer) loaded Tetramer PE. Live CD4+, CD25-, TCRβ+, tetramer- cells were sorted and used in downstream applications. Expanded cells in congenic recipients were sorted after staining with CD45.1 BV421 (clone: A20, RRID: AB_2562563) and CD45.2 PE (clone: 104, RRID: AB_313445) from Biolegend. We have previously described the sorting strategy and we have evaluated the purity of the sorted samples that were used to isolate RNA (20, 24). Our sorted samples have a minimum purity of 95% (20, 24) (Supplementary Figures 2, 3, 6, 7, 10). Part of this RNA was used for the TCR repertoire analysis using TCR sequencing for this study.
In all cases, dead cells were excluded using a fixable viability dye eFluor780 (eBioscience).
The cells were sorted using an Aria Sorter (Becton Dickinson).
Adoptive transfer of Tet2/3 DKO CD4 cells in congenic recipient mice
The serial transplantation and expansion experiments of Tet2/3 DKO CD4 T cells in CD45.1 non-irradiated, immune-competent mice were described (20). Tet2/3 DKO T cells for the first and the second transplantation were isolated and characterized in the context of our previous study (20).
RNA isolation
RNA used in this study has been isolated from murine samples that were analyzed and described in our previous studies (20, 24). To isolate RNA from sorted subsets we used the RNA plus mini kit (Qiagen, catalogue number: 74134) or RNA plus micro kit (Qiagen, catalogue number: 74034) depending on the starting material as we have previously described (20, 24, 65, 77). Typically for expanded Tet2/3 DKO T cells we had a starting material of 5 million cells and we used the RNA plus mini kit, whereas for wild type and Tet2/3 DKO thymic or peripheral CD4 T cells we used a maximum of 600.000 cells and we isolated cells with RNA plus micro kit. In all cases we followed the instructions provided in the accompanying protocols by Qiagen. RNA quantity was determined using High Sensitivity RNA kit in a Qubit 4 Fluorometer (Thermo Fischer). RNA integrity was evaluated using Tapestation or Bioanalyzer (Agilent). All the samples had an RNA integrity number (RIN) value above 9.
TCR-sequencing
In order to analyze TCR repertoire, we used the SMARTer mouse TCR α/β profiling kit (Takara, catalogue number 634403) following the manufacturer’s instructions. We used 20 ng of total RNA (isolated as described above) in order to synthesize cDNA for each library. The kit employs a 5’-RACE-based approach to capture complete V(D)J variable regions of TCR transcripts. The libraries were sequenced using a Miseq sequencer (Illumina) at the UNC High Throughput Sequencing Facility (HTSF) (data shown in Figures 1B, 3B) or the Duke University School of Medicine for the use of Sequencing and Genomic Technologies Shared Resource (data shown in Figure 2B). In this study we analyzed a total of 21 libraries (Supplementary Table 6).
Statistics and reproducibility
Data were analyzed using Prism software (Graphpad). Unpaired student’s t test was applied as indicated. In each figure legend, the indicated P-values are described. Data are mean ± s.e.m. In the graphs, each dot represents a mouse. For statistical analysis of the Shannon-Wienner diversity across different samples we used the Kruskal-Wallis test. Unless otherwise indicated the P value was not statistically significant (P > 0.05). Differences were considered significant when p < 0.05 (∗); < 0.01 (∗∗); < 0.001 (∗∗∗).
For the phenotyping experiments, age-matched mice from different litters and of different sex were evaluated, with reproducible results. In addition, we ensured that a minimum of 2 independent experiments was performed in each case.
TCR-seq data analysis
Adapter trimming and quality filtering of the sequencing libraries was done using fastp (0.21.0) (79) with the default parameters. The TCR repertoire extraction (–receptor-type tcr) was done using MiXCR (v4.7.0) (80) was used was used to assess TCR repertoire from TCR-seq data using the takara-mouse-rna-tcr-smarter preset (mixcr analyze takara-mouse-rna-tcr-smarter). MiXCR was used to assess the quality of the samples (mixcr exportQc align *.vdjca alignQC.pdf). MiXCR was used to run postanalysis routines (mixcr postanalysis individual –metadata metadata.tsv –default-downsampling count-read-auto –default-weight-function read *.clns result.json.gz and mixcr postanalysis overlap –metadata metadata.tsv –default-downsampling count-read-auto –default-weight-function read *.clns overlap.json.gz). MiXCR was used to assess V and J gene usage (mixcr exportPlots vUsage result.json.gz vusage.pdf and mixcr exportPlots jUsage result.json.gz vusage.pdf). MiXCR was used to visualize Shannon-Wiener diversity (mixcr exportPlots diversity –metric shannonWiener) and relative diversity (mixcr exportPlots overlap –metric RelativeDiversity). All the libraries were complex with a range of duplication rate ranging between 0.0005 to 0.0010 (Supplementary Figure 13A, B). Comparison of the mappable reads across the samples revealed variability. Specifically, reads for all the TCR SMART-seq libraries generated from WT and Tet2/3 DKO CD4 SP thymic cells or peripheral CD4 T cells were approximately 55% successfully aligned (Supplementary Figure 13C). However, reads obtained for the TCR SMART-seq libraries for Tet2/3 DKO T cells varied from 30% to 80% successful alignment to the reference genome (Supplementary Figure 13). Such variability has been previously reported for TCR-seq libraries prepared using 5-RACE approach (81, 82). From a technical standpoint, the lower alignment efficiency can be attributed to relatively increased number of shorter fragments (82). However, it becomes evident that from all our samples the lower alignment is observed specifically to some libraries using RNA from transferred Tet2/3 DKO T cells that have proliferated to dominate the spleen of the recipient mice (20). While the RNA integrity of the isolated RNA was at least 9 (20) we believe that the downregulation of the TCR observed in these activated samples and the overall compromised health status of the recipient mice may have contributed in the reduced efficiency of alignment consistent with previous reports for samples with malignant traits (81).
Data availability statement
TCR-seq datasets have been deposited in the Gene Expression Omnibus (GEO) public repository under the accession code GSE190231 (https://www.ncbi.nlm.nih.gov/geo/query/acc.cgi?acc=GSE190231).
Ethics statement
The animal study was approved by UNC Institutional Animal Care and Use Committee. The study was conducted in accordance with the local legislation and institutional requirements.
Author contributions
TÄ: Validation, Writing – original draft, Methodology, Conceptualization, Visualization, Investigation, Software, Writing – review & editing, Formal Analysis. MG: Methodology, Formal analysis, Investigation, Visualization, Writing – review & editing, Writing – original draft. JV: Validation, Methodology, Visualization, Formal analysis, Writing – original draft, Writing – review & editing, Investigation. AT: Formal analysis, Methodology, Conceptualization, Writing – original draft, Supervision, Investigation, Visualization, Resources, Funding acquisition, Validation, Writing – review & editing.
Funding
The author(s) declare that financial support was received for the research and/or publication of this article. This work was supported by NIH grant (R35-GM138289), Supplement 3R35-GM138289-02S1 from National Institute of General Medicinal Sciences (NIGMS), and UNC Lineberger Comprehensive Cancer Center Startup funds (to AT). The funders had no role in the design, data collection, data analysis, and reporting of this study. JV was the recipient of a North Carolina State University (NCSU) College of Engineering Dean’s Doctoral Fellowship and is partially supported by a National Consortium for Graduate Degrees for Minorities in Engineering and Science (GEM) Fellowship.
Acknowledgments
We thank Ms. Kayla Harrison and Ms. Theresa Hegarty (UNC DCM Colony Management Core) for excellent mouse colony management. We acknowledge Ms. Janet Dow and Ms. Ayrianna Woody of the UNC Flow Cytometry Core (RRID: SCR_019170) for FACS sorting. Research reported in this publication and related to FACS sorting was supported in part by the North Carolina Biotech Center Institutional Support Grant 2012-IDG-1006. We wish to thank the UNC High Throughput Sequencing core (HTSF) for sequencing. The above cores affiliated to UNC Lineberger Comprehensive Cancer Center are supported in part by P30 CA016086 Cancer Center Core Support Grant to the UNC Lineberger Comprehensive Cancer Center. We thank the Duke University School of Medicine for the use of Sequencing and Genomic Technologies Shared Resource, which provided sequencing services. We thank the NIH tetramer core for generously providing aGalactosyl-Ceramide loaded mouse CD1d tetramers. Supplementary Figure 1 was designed using Biorender.
Conflict of interest
TÄ is Vice President of Data Science at Covera Health. No funding from Covera Health was provided for this work.
The remaining authors declare that the research was conducted in the absence of any commercial or financial relationships that could be construed as a potential conflict of interest.
Generative AI statement
The author(s) declare that no Generative AI was used in the creation of this manuscript.
Publisher’s note
All claims expressed in this article are solely those of the authors and do not necessarily represent those of their affiliated organizations, or those of the publisher, the editors and the reviewers. Any product that may be evaluated in this article, or claim that may be made by its manufacturer, is not guaranteed or endorsed by the publisher.
Supplementary material
The Supplementary Material for this article can be found online at: https://www.frontiersin.org/articles/10.3389/fimmu.2025.1638500/full#supplementary-material
Supplementary Table 1 | Summary of Tcra sequences identified by TCR-seq. The source table is deposited in Figshare. https://doi.org/10.6084/m9.figshare.29293649.v1.
Supplementary Table 2 | Summary of Tcrb sequences identified by TCR-seq. The source table is deposited in Figshare. https://doi.org/10.6084/m9.figshare.29640680.v1.
Supplementary Table 3 | Summary of top 10 TCRα clones observed in the examined samples in this study.
Supplementary Table 4 | Summary of top 10 TCRβ clones observed in the examined samples in this study.
Supplementary Table 5 | Summary of the antibodies used to assess TCRβ clones by flow cytometry. This table is provided in a combined pdf as supplementary material.
Supplementary Table 6 | Sequencing metrics. Table summarizing the number of reads for each of the sequenced libraries. This table is provided in a combined pdf as supplementary material.
Supplementary Figures 1–13 and their accompanying legends are provided in a combined pdf file as supplementary material.
References
1. Tahiliani M, Koh KP, Shen Y, Pastor WA, Bandukwala H, Brudno Y, et al. Conversion of 5-methylcytosine to 5-hydroxymethylcytosine in mammalian DNA by MLL partner TET1. Science. (2009) 324:930–5. doi: 10.1126/science.1170116
2. Lorsbach RB, Moore J, Mathew S, Raimondi SC, Mukatira ST, and Downing JR. TET1, a member of a novel protein family, is fused to MLL in acute myeloid leukemia containing the t(10;11)(q22;q23). Leukemia. (2003) 17:637–41. doi: 10.1038/sj.leu.2402834
3. Ono R, Taki T, Taketani T, Taniwaki M, Kobayashi H, and Hayashi Y. LCX, leukemia-associated protein with a CXXC domain, is fused to MLL in acute myeloid leukemia with trilineage dysplasia having t(10;11)(q22;q23). Cancer Res. (2002) 62:4075–80.
4. Pastor WA, Aravind L, and Rao A. TETonic shift: biological roles of TET proteins in DNA demethylation and transcription. Nat Rev Mol Cell Biol. (2013) 14:341–56. doi: 10.1038/nrm3589
5. Ito S, Shen L, Dai Q, Wu SC, Collins LB, Swenberg JA, et al. Tet proteins can convert 5-methylcytosine to 5-formylcytosine and 5-carboxylcytosine. Science. (2011) 333:1300–3. doi: 10.1126/science.1210597
6. Ko M, Huang Y, Jankowska AM, Pape UJ, Tahiliani M, Bandukwala HS, et al. Impaired hydroxylation of 5-methylcytosine in myeloid cancers with mutant TET2. Nature. (2010) 468:839–43. doi: 10.1038/nature09586
7. Delhommeau F, Dupont S, Della Valle V, James C, Trannoy S, Masse A, et al. Mutation in TET2 in myeloid cancers. N Engl J Med. (2009) 360:2289–301. doi: 10.1056/NEJMoa0810069
8. Langemeijer SM, Kuiper RP, Berends M, Knops R, Aslanyan MG, Massop M, et al. Acquired mutations in TET2 are common in myelodysplastic syndromes. Nat Genet. (2009) 41:838–42. doi: 10.1038/ng.391
9. Tsiouplis NJ, Bailey DW, Chiou LF, Wissink FJ, and Tsagaratou A. TET-mediated epigenetic regulation in immune cell development and disease. Front Cell Dev Biol. (2020) 8:623948. doi: 10.3389/fcell.2020.623948
10. Sakata-Yanagimoto M, Enami T, Yoshida K, Shiraishi Y, Ishii R, Miyake Y, et al. Somatic RHOA mutation in angioimmunoblastic T cell lymphoma. Nat Genet. (2014) 46:171–5. doi: 10.1038/ng.2872
11. Quivoron C, Couronne L, Della Valle V, Lopez CK, Plo I, Wagner-Ballon O, et al. TET2 inactivation results in pleiotropic hematopoietic abnormalities in mouse and is a recurrent event during human lymphomagenesis. Cancer Cell. (2011) 20:25–38. doi: 10.1016/j.ccr.2011.06.003
12. Palomero T, Couronne L, Khiabanian H, Kim MY, Ambesi-Impiombato A, Perez-Garcia A, et al. Recurrent mutations in epigenetic regulators, RHOA and FYN kinase in peripheral T cell lymphomas. Nat Genet. (2014) 46:166–70. doi: 10.1038/ng.2873
13. Cortes JR and Palomero T. Biology and molecular pathogenesis of mature T-cell lymphomas. Cold Spring Harb Perspect Med. (2020) 11(5):a035402. doi: 10.1101/cshperspect.a035402
14. Rasmussen KD and Helin K. Role of TET enzymes in DNA methylation, development, and cancer. Genes Dev. (2016) 30:733–50. doi: 10.1101/gad.276568.115
15. Ko M, Bandukwala HS, An J, Lamperti ED, Thompson EC, Hastie R, et al. Ten-Eleven-Translocation 2 (TET2) negatively regulates homeostasis and differentiation of hematopoietic stem cells in mice. Proc Natl Acad Sci U S A. (2011) 108:14566–71. doi: 10.1073/pnas.1112317108
16. Moran-Crusio K, Reavie L, Shih A, Abdel-Wahab O, Ndiaye-Lobry D, Lobry C, et al. Tet2 loss leads to increased hematopoietic stem cell self-renewal and myeloid transformation. Cancer Cell. (2011) 20:11–24. doi: 10.1016/j.ccr.2011.06.001
17. Ito K, Lee J, Chrysanthou S, Zhao Y, Josephs K, Sato H, et al. Non-catalytic roles of Tet2 are essential to regulate hematopoietic stem and progenitor cell homeostasis. Cell Rep. (2019) 28:2480–90.e4. doi: 10.1016/j.celrep.2019.07.094
18. Yeaton A, Cayanan G, Loghavi S, Dolgalev I, Leddin EM, Loo CE, et al. The impact of inflammation-induced tumor plasticity during myeloid transformation. Cancer Discov. (2022) 12(10):2392–413. doi: 10.1158/2159-8290.22541791
19. Zhao Z, Chen L, Dawlaty MM, Pan F, Weeks O, Zhou Y, et al. Combined loss of Tet1 and Tet2 promotes B cell, but not myeloid Malignancies, in mice. Cell Rep. (2015) 13:1692–704. doi: 10.1016/j.celrep.2015.10.037
20. Gioulbasani M, Aijo T, Liu S, Montgomery SA, Montgomery ND, Corcoran D, et al. Concomitant loss of TET2 and TET3 results in T cell expansion and genomic instability in mice. Commun Biol. (2024) 7:1606. doi: 10.1038/s42003-024-07312-0
21. Tsagaratou A, Aijo T, Lio CW, Yue X, Huang Y, Jacobsen SE, et al. Dissecting the dynamic changes of 5-hydroxymethylcytosine in T-cell development and differentiation. Proc Natl Acad Sci U S A. (2014) 111:E3306–15. doi: 10.1073/pnas.1412327111
22. Tsagaratou A, Gonzalez-Avalos E, Rautio S, Scott-Browne JP, Togher S, Pastor WA, et al. TET proteins regulate the lineage specification and TCR-mediated expansion of iNKT cells. Nat Immunol. (2017) 18:45–53. doi: 10.1038/ni.3630
23. Ichiyama K, Chen T, Wang X, Yan X, Kim BS, Tanaka S, et al. The methylcytosine dioxygenase Tet2 promotes DNA demethylation and activation of cytokine gene expression in T cells. Immunity. (2015) 42:613–26. doi: 10.1016/j.immuni.2015.03.005
24. Aijo T, Theofilatos D, Cheng M, Smith MD, Xiong Y, Baldwin AS, et al. TET proteins regulate T cell and iNKT cell lineage specification in a TET2 catalytic dependent manner. Front Immunol. (2022) 13:940995. doi: 10.3389/fimmu.2022.940995
25. Yue X, Trifari S, Aijo T, Tsagaratou A, Pastor WA, Zepeda-Martinez JA, et al. Control of Foxp3 stability through modulation of TET activity. J Exp Med. (2016) 213:377–97. doi: 10.1084/jem.20151438
26. Yue X, Samaniego-Castruita D, Gonzalez-Avalos E, Li X, Barwick BG, and Rao A. Whole-genome analysis of TET dioxygenase function in regulatory T cells. EMBO Rep. (2021) 22:e52716. doi: 10.15252/embr.202152716
27. Kafer GR, Li X, Horii T, Suetake I, Tajima S, Hatada I, et al. 5-hydroxymethylcytosine marks sites of DNA damage and promotes genome stability. Cell Rep. (2016) 14:1283–92. doi: 10.1016/j.celrep.2016.01.035
28. Bachman M, Uribe-Lewis S, Yang X, Burgess HE, Iurlaro M, Reik W, et al. 5-Formylcytosine can be a stable DNA modification in mammals. Nat Chem Biol. (2015) 11:555–7. doi: 10.1038/nchembio.1848
29. Bachman M, Uribe-Lewis S, Yang X, Williams M, Murrell A, and Balasubramanian S. 5-Hydroxymethylcytosine is a predominantly stable DNA modification. Nat Chem. (2014) 6:1049–55. doi: 10.1038/nchem.2064
30. Spruijt CG, Gnerlich F, Smits AH, Pfaffeneder T, Jansen PW, Bauer C, et al. Dynamic readers for 5-(hydroxy)methylcytosine and its oxidized derivatives. Cell. (2013) 152:1146–59. doi: 10.1016/j.cell.2013.02.004
31. Iurlaro M, Ficz G, Oxley D, Raiber EA, Bachman M, Booth MJ, et al. A screen for hydroxymethylcytosine and formylcytosine binding proteins suggests functions in transcription and chromatin regulation. Genome Biol. (2013) 14:R119. doi: 10.1186/gb-2013-14-10-r119
32. Cimmino L and Aifantis I. Alternative roles for oxidized mCs and TETs. Curr Opin Genet Dev. (2017) 42:1–7. doi: 10.1016/j.gde.2016.11.003
33. Cimmino L, Dawlaty MM, Ndiaye-Lobry D, Yap YS, Bakogianni S, Yu Y, et al. TET1 is a tumor suppressor of hematopoietic Malignancy. Nat Immunol. (2015) 16:653–62. doi: 10.1038/ni.3148
34. Lopez-Moyado IF, Tsagaratou A, Yuita H, Seo H, Delatte B, Heinz S, et al. Paradoxical association of TET loss of function with genome-wide DNA hypomethylation. Proc Natl Acad Sci U.S.A. (2019) 116:16933–42. doi: 10.1073/pnas.1903059116
35. An J, Gonzalez-Avalos E, Chawla A, Jeong M, Lopez-Moyado IF, Li W, et al. Acute loss of TET function results in aggressive myeloid cancer in mice. Nat Commun. (2015) 6:10071. doi: 10.1038/ncomms10071
36. Tsagaratou A. TET mediated epigenetic regulation of iNKT cell lineage fate choice and function. Mol Immunol. (2018) 101:564–73. doi: 10.1016/j.molimm.2018.08.020
37. Tsagaratou A. Deciphering the multifaceted roles of TET proteins in T-cell lineage specification and Malignant transformation. Immunol Rev. (2021) 300:22–36. doi: 10.1111/imr.12940
38. Tsagaratou A. TET proteins in the spotlight: emerging concepts of epigenetic regulation in T cell biology. Immunohorizons. (2023) 7:106–15. doi: 10.4049/immunohorizons.2200067
39. Tsagaratou A. Unveiling the regulation of NKT17 cell differentiation and function. Mol Immunol. (2019) 105:55–61. doi: 10.1016/j.molimm.2018.11.013
40. Wang L, Wildt KF, Zhu J, Zhang X, Feigenbaum L, Tessarollo L, et al. Distinct functions for the transcription factors GATA-3 and ThPOK during intrathymic differentiation of CD4(+) T cells. Nat Immunol. (2008) 9:1122–30. doi: 10.1038/ni.1647
41. Yang R, Qu C, Zhou Y, Konkel JE, Shi S, Liu Y, et al. Hydrogen sulfide promotes Tet1- and Tet2-mediated Foxp3 demethylation to drive regulatory T cell differentiation and maintain immune homeostasis. Immunity. (2015) 43:251–63. doi: 10.1016/j.immuni.2015.07.017
42. Tsagaratou A, Lio CJ, Yue X, and Rao A. TET methylcytosine oxidases in T cell and B cell development and function. Front Immunol. (2017) 8:220. doi: 10.3389/fimmu.2017.00220
43. Scherm MG, Serr I, Zahm AM, Schug J, Bellusci S, Manfredini R, et al. miRNA142-3p targets Tet2 and impairs Treg differentiation and stability in models of type 1 diabetes. Nat Commun. (2019) 10:5697. doi: 10.1038/s41467-019-13587-3
44. Nair VS, Song MH, Ko M, and Oh KI. DNA demethylation of the Foxp3 enhancer is maintained through modulation of ten-eleven-translocation and DNA methyltransferases. Mol Cells. (2016) 39:888–97. doi: 10.14348/molcells.2016.0276
45. Yue X, Lio CJ, Samaniego-Castruita D, Li X, and Rao A. Loss of TET2 and TET3 in regulatory T cells unleashes effector function. Nat Commun. (2019) 10:2011. doi: 10.1038/s41467-019-09541-y
46. Nakatsukasa H, Oda M, Yin J, Chikuma S, Ito M, Koga-Iizuka M, et al. Loss of TET proteins in regulatory T cells promotes abnormal proliferation, Foxp3 destabilization and IL-17 expression. Int Immunol. (2019) 31:335–47. doi: 10.1093/intimm/dxz008
47. Klein L, Kyewski B, Allen PM, and Hogquist KA. Positive and negative selection of the T cell repertoire: what thymocytes see (and don’t see). Nat Rev Immunol. (2014) 14:377–91. doi: 10.1038/nri3667
48. Hayes SM, Shores EW, and Love PE. An architectural perspective on signaling by the pre-, alphabeta and gammadelta T cell receptors. Immunol Rev. (2003) 191:28–37. doi: 10.1034/j.1600-065X.2003.00011.x
49. Burtrum DB, Kim S, Dudley EC, Hayday AC, and Petrie HT. TCR gene recombination and alpha beta-gamma delta lineage divergence: productive TCR-beta rearrangement is neither exclusive nor preclusive of gamma delta cell development. J Immunol. (1996) 157:4293–6. doi: 10.4049/jimmunol.157.10.4293
50. Krangel MS, Hernandez-Munain C, Lauzurica P, McMurry M, Roberts JL, and Zhong XP. Developmental regulation of V(D)J recombination at the TCR alpha/delta locus. Immunol Rev. (1998) 165:131–47. doi: 10.1111/j.1600-065X.1998.tb01236.x
51. Bassing CH, Swat W, and Alt FW. The mechanism and regulation of chromosomal V(D)J recombination. Cell. (2002) 109 Suppl:S45–55. doi: 10.1016/S0092-8674(02)00675-X
52. Fugmann SD, Lee AI, Shockett PE, Villey IJ, and Schatz DG. The RAG proteins and V(D)J recombination: complexes, ends, and transposition. Annu Rev Immunol. (2000) 18:495–527. doi: 10.1146/annurev.immunol.18.1.495
53. Schatz DG and Ji Y. Recombination centres and the orchestration of V(D)J recombination. Nat Rev Immunol. (2011) 11:251–63. doi: 10.1038/nri2941
54. Chang HHY, Pannunzio NR, Adachi N, and Lieber MR. Non-homologous DNA end joining and alternative pathways to double-strand break repair. Nat Rev Mol Cell Biol. (2017) 18:495–506. doi: 10.1038/nrm.2017.48
55. Boboila C, Alt FW, and Schwer B. Classical and alternative end-joining pathways for repair of lymphocyte-specific and general DNA double-strand breaks. Adv Immunol. (2012) 116:1–49. doi: 10.1016/B978-0-12-394300-2.00001-6
56. Dutta A, Zhao B, and Love PE. New insights into TCR beta-selection. Trends Immunol. (2021) 42:735–50. doi: 10.1016/j.it.2021.06.005
57. Michie AM and Zuniga-Pflucker JC. Regulation of thymocyte differentiation: pre-TCR signals and beta-selection. Semin Immunol. (2002) 14:311–23. doi: 10.1016/S1044-5323(02)00064-7
58. Aifantis I, Buer J, von Boehmer H, and Azogui O. Essential role of the pre-T cell receptor in allelic exclusion of the T cell receptor beta locus. Immunity. (1997) 7:601–7. doi: 10.1016/S1074-7613(00)80381-7
59. Brady BL, Steinel NC, and Bassing CH. Antigen receptor allelic exclusion: an update and reappraisal. J Immunol. (2010) 185:3801–8. doi: 10.4049/jimmunol.1001158
60. Love MI, Huber W, and Anders S. Moderated estimation of fold change and dispersion for RNA-seq data with DESeq2. Genome Biol. (2014) 15:550. doi: 10.1186/s13059-014-0550-8
61. Jackson AM and Krangel MS. Turning T-cell receptor beta recombination on and off: more questions than answers. Immunol Rev. (2006) 209:129–41. doi: 10.1111/j.0105-2896.2006.00342.x
62. Attaf M, Huseby E, and Sewell AK. alphabeta T cell receptors as predictors of health and disease. Cell Mol Immunol. (2015) 12:391–9. doi: 10.1038/cmi.2014.134
63. Foth S, Volkel S, Bauersachs D, Zemlin M, and Skevaki C. T cell repertoire during ontogeny and characteristics in inflammatory disorders in adults and childhood. Front Immunol. (2020) 11:611573. doi: 10.3389/fimmu.2020.611573
64. Verykokakis M, Boos MD, Bendelac A, and Kee BL. SAP protein-dependent natural killer T-like cells regulate the development of CD8(+) T cells with innate lymphocyte characteristics. Immunity. (2010) 33:203–15. doi: 10.1016/j.immuni.2010.07.013
65. Theofilatos D, Aijo T, and Tsagaratou A. Protocol to isolate mature thymic T cell subsets using fluorescence-activated cell sorting for assessing gene expression by RNA-seq and transcription factor binding across the genome by CUT&RUN. STAR Protoc. (2022) 3. doi: 10.1016/j.xpro.2022.101839
66. Picelli S, Faridani OR, Bjorklund AK, Winberg G, Sagasser S, and Sandberg R. Full-length RNA-seq from single cells using Smart-seq2. Nat Protoc. (2014) 9:171–81. doi: 10.1038/nprot.2014.006
67. Ruggiero E, Nicolay JP, Fronza R, Arens A, Paruzynski A, Nowrouzi A, et al. High-resolution analysis of the human T-cell receptor repertoire. Nat Commun. (2015) 6:8081. doi: 10.1038/ncomms9081
68. Lucero OM, Lee JA, Bowman J, Johnson K, Sapparapu G, Thomas JK, et al. Patient-specific targeting of the T-cell receptor variable region as a therapeutic strategy in clonal T-cell diseases. Clin Cancer Res. (2023) 29:4230–41. doi: 10.1158/1078-0432.CCR-22-0906
69. Lee PP, Fitzpatrick DR, Beard C, Jessup HK, Lehar S, Makar KW, et al. A critical role for Dnmt1 and DNA methylation in T cell development, function, and survival. Immunity. (2001) 15:763–74. doi: 10.1016/S1074-7613(01)00227-8
70. Kuczynski EA, Morlino G, Peter A, Coenen-Stass AML, Moss JI, Wali N, et al. A preclinical model of peripheral T-cell lymphoma GATA3 reveals DNA damage response pathway vulnerability. EMBO Mol Med. (2022) 14:e15816. doi: 10.15252/emmm.202215816
71. Moon CS, Reglero C, Cortes JR, Quinn SA, Alvarez S, Zhao J, et al. FYN-TRAF3IP2 induces NF-kappaB signaling-driven peripheral T cell lymphoma. Nat Cancer. (2021) 2:98–113. doi: 10.1038/s43018-020-00161-w
72. Carty SA. Biological insights into the role of TET2 in T cell lymphomas. Front Oncol. (2023) 13:1199108. doi: 10.3389/fonc.2023.1199108
73. Heavican TB, Bouska A, Yu J, Lone W, Amador C, Gong Q, et al. Genetic drivers of oncogenic pathways in molecular subgroups of peripheral T-cell lymphoma. Blood. (2019) 133:1664–76. doi: 10.1182/blood-2018-09-872549
74. Gong Q, Wang C, Zhang W, Iqbal J, Hu Y, Greiner TC, et al. Assessment of T-cell receptor repertoire and clonal expansion in peripheral T-cell lymphoma using RNA-seq data. Sci Rep. (2017) 7:11301. doi: 10.1038/s41598-017-11310-0
75. Cortes JR, Ambesi-Impiombato A, Couronne L, Quinn SA, Kim CS, da Silva Almeida AC, et al. RHOA G17V induces T follicular helper cell specification and promotes lymphomagenesis. Cancer Cell. (2018) 33:259–73 e7. doi: 10.1016/j.ccell.2018.01.001
76. Tsagaratou A and Rao A. TET proteins and 5-methylcytosine oxidation in the immune system. Cold Spring Harb Symp Quant Biol. (2013) 78:1–10. doi: 10.1101/sqb.2013.78.020248
77. Gioulbasani M, Aijo T, Valenzuela JE, Bettes JB, and Tsagaratou A. TET proteins regulate Drosha expression and impact microRNAs in iNKT cells. Front Immunol. (2024) 15:1440044. doi: 10.3389/fimmu.2024.1440044
78. Gioulbasani M and Tsagaratou A. Defining iNKT cell subsets and their function by flow cytometry. Curr Protoc. (2023) 3:e838. doi: 10.1002/cpz1.838
79. Chen S, Zhou Y, Chen Y, and Gu J. fastp: an ultra-fast all-in-one FASTQ preprocessor. Bioinformatics. (2018) 34:i884–i90. doi: 10.1093/bioinformatics/bty560
80. Bolotin DA, Poslavsky S, Mitrophanov I, Shugay M, Mamedov IZ, Putintseva EV, et al. MiXCR: software for comprehensive adaptive immunity profiling. Nat Methods. (2015) 12:380–1. doi: 10.1038/nmeth.3364
81. Genolet R, Bobisse S, Chiffelle J, Arnaud M, Petremand R, Queiroz L, et al. TCR sequencing and cloning methods for repertoire analysis and isolation of tumor-reactive TCRs. Cell Rep Methods. (2023) 3:100459. doi: 10.1016/j.crmeth.2023.100459
Keywords: TET proteins, TCR sequencing, TCR diversity, TCR clonality, TCR oligoclonal expansion
Citation: Äijö T, Gioulbasani M, Valenzuela JE and Tsagaratou A (2025) Assessing the impact of TET2 and TET3 deletion in TCRalpha and TCRbeta repertoire in murine CD4 T cells in physiological and pathophysiological conditions. Front. Immunol. 16:1638500. doi: 10.3389/fimmu.2025.1638500
Received: 30 May 2025; Accepted: 28 July 2025;
Published: 20 August 2025.
Edited by:
Sofia Kossida, Université de Montpellier, FranceReviewed by:
Aquib Ehtram, La Jolla Institute for Immunology (LJI), United StatesDeepak Kumar Rathore, Translational Health Science and Technology Institute (THSTI), India
Copyright © 2025 Äijö, Gioulbasani, Valenzuela and Tsagaratou. This is an open-access article distributed under the terms of the Creative Commons Attribution License (CC BY). The use, distribution or reproduction in other forums is permitted, provided the original author(s) and the copyright owner(s) are credited and that the original publication in this journal is cited, in accordance with accepted academic practice. No use, distribution or reproduction is permitted which does not comply with these terms.
*Correspondence: Ageliki Tsagaratou, YWdlbGlraV90c2FnYXJhdG91QG1lZC51bmMuZWR1
†These authors have contributed equally to this work and share first authorship