 Lauren K. Heine1,2†
 Rance Nault1,2†
 Jalen Jackson3
 Ashley N. Anderson3
 Jack R. Harkema1,2,4
 Andrew J. Olive3
 James J. Pestka2,3,5*
 Olivia F. McDonald1,2,3*
- 1Department of Pharmacology and Toxicology, Michigan State University, East Lansing, MI, United States
- 2Institute for Integrative Toxicology, Michigan State University, East Lansing, MI, United States
- 3Department of Microbiology, Genetics, and Immunology, Michigan State University, East Lansing, MI, United States
- 4Department of Pathobiology and Diagnostic Investigation, Michigan State University, East Lansing, MI, United States
- 5Department of Food Science and Human Nutrition, Michigan State University, East Lansing, MI, United States
Introduction: Systemic lupus erythematosus (SLE) is a complex autoimmune disorder characterized by aberrant inflammation, type I IFN-stimulated gene (ISG) expression, and autoantibody production. Glucocorticoids (GCs) like dexamethasone (DEX) are standard long-term SLE treatments but cause significant side effects, highlighting the need for safer steroid-sparing options. Preclinical and clinical studies suggest that dietary supplementation with omega-3 fatty acids (O3FAs), particularly docosahexaenoic acid (DHA), suppresses inflammation and autoimmunity associated with SLE disease progression. We explored the steroid-sparing potential of DHA to influence the suppressive effects of DEX on pathogenic gene expression.
Methods: Macrophages from SLE-prone NZBWF1 mice were first subjected to DHA (5, 10, or 25 µM), DEX (1, 10, 100, or 1000 nM), or DHA+DEX cotreatment. Following pretreatment, cells were exposed to lipopolysaccharide (LPS; 20 ng/mL) to model SLE hyperinflammation. Resultant gene expression was subjected to synergy and deconvolution analysis.
Results: qRT-PCR indicated that subinhibitory concentrations of DHA (5-10 µM) potentiated the efficacy of low-dose DEX (1–100 nM) in suppressing LPS-induced ISG expression (e.g., Irf7, Oasl1, Rsad2), amplifying the effects of DEX monotherapy by 10- to 100-fold. SynergyFinder analysis confirmed that DHA and DEX interacted synergistically in suppressing ISG expression, with significant inhibition observed at concentrations as low as 1 nM DEX and 5 µM DHA. RNA-seq revealed that combining suboptimal DHA (10 μM) and DEX (100 nM) induced 247 differentially expressed genes (DEGs) at 4 hr and 347 DEGs at 8 hr post-LPS, dramatically surpassing the effects of each treatment alone. Functional enrichment analysis indicated DHA+DEX cotreatment robustly suppressed immune and inflammatory pathways while promoting proliferative and metabolic processes, reflecting a shift from inflammatory (M1) to pro-resolving (M2) macrophage phenotypes. DHA and DEX countered LPS effects by i) downregulating common transcription factors (TFs) canonically associated with inflammation (e.g., NF-κB, AP-1, STATs, and IRF1), ii) upregulating shared regulatory factors involved in inflammation resolution (e.g., YBX1, EGR1, and BCL6), and iii) selectively influencing other regulatory factors.
Discussion: Altogether, DHA and DEX synergistically suppress inflammatory gene expression by targeting common and unique molecular pathways in SLE macrophages, favoring the pro-resolving M2 phenotype. O3FA-GC cotreatment might facilitate reducing requisite steroid dosages for SLE management.
1 Introduction
Systemic lupus erythematosus (SLE, lupus) is a debilitating autoimmune disease characterized by chronic inflammation, aberrant type I IFN-stimulated gene (ISG) responses, loss of self-tolerance, and multi-organ damage driven by genetic susceptibility and environmental triggers (1, 2). Genome-wide association studies in patients with SLE have identified more than 150 risk loci that converge on pathways regulating IFN signaling and immune cell activation (1, 3). Environmental exposures, such as airborne pollutants, infections, and ultraviolet light, amplify genetic predispositions to SLE by triggering oxidative stress and aberrant nucleic acid sensing (4, 5).
Macrophage hyperactivity plays a central role in SLE pathogenesis (6, 7) by perpetuating tissue injury through dysregulated cytokine production, phagocytic dysfunction, and sustained type I IFN secretion—a hallmark of SLE observed in 60-80% of patients (8, 9). Macrophage hyperactivity is mediated by the activation of pattern-recognition receptors such as toll-like receptors (TLRs), which detect both pathogen-associated molecular patterns (PAMPs) and damage-associated molecular patterns (DAMPs) (6, 7), or by activation of cytokine receptors specific for type I IFN, TNFα, IL-1, or IL-6 (8, 10, 11). This is exemplified preclinically in SLE-prone NZBWF1 mouse alveolar macrophages, which exhibit heightened pathogenic gene expression following activation of TLR4 by PAMPs like lipopolysaccharide (LPS) or DAMPs unleashed by toxic silica particles (5, 12, 13). TLR4 activation triggers MAPK/NF-κB signaling and IFN regulatory factors (IRFs), resulting in increased expression of proinflammatory and type I IFN-stimulated genes (ISGs) (14, 15). This cascade creates a feed-forward loop that enhances antigen presentation, promotes autoantibody production by plasma cells, and activates autoreactive T cells (16, 17). Accordingly, airborne environmental triggers, such as LPS and silica, accelerate the onset and progression of SLE in NZBWF1 mice, highlighting the crucial role of AM hyperactivity in lupus pathogenesis.
Glucocorticoids (GCs; steroids) remain the cornerstone of lupus treatment, as they suppress key inflammatory pathways, including NF-κB and MAPK signaling (18, 19). However, chronic GC use at moderate-to-high doses is associated with severe adverse side effects, including osteoporosis, hyperglycemia, muscle atrophy, cardiovascular complications, and increased infection risk (20–22). Consistent with this notion, we found that while moderate-to-high dose GC treatment of silica-exposed NZBWF1 mice at translationally relevant dosages inhibits proinflammatory and autoimmune gene expression, it also elicits significant muscle wasting and hyperglycemia without improving survival outcomes (23). These findings highlight the critical need for steroid-sparing adjunctive therapies that effectively control inflammation while minimizing patient health risks.
Emerging evidence positions marine oil-derived omega-3 fatty acids (O3FAs), such as docosahexaenoic acid (DHA), as promising anti-inflammatory agents for adjunctive treatment in SLE and other autoimmune diseases (24–26). Mechanistically, DHA exerts its effects through multiple pathways: i) altered receptor function due to lipid raft composition (27) and size (28), ii) activating anti-inflammatory transcription factors (TFs) such as PPARγ (29), iii) inhibiting NF-κB (30), iv) disrupting cholesterol synthesis, v) upregulating NFE2L2 (NRF2)-associated genes (31), and vi) producing specialized pro-resolving mediators like resolvins and maresins (32). We recently reported that, in a cohort of 418 participants with SLE, higher serum levels of O3FAs, particularly DHA, were associated with favorable outcomes, including reduced SLE scores, less pain, and improved sleep quality (33). In preclinical studies of silica-triggered SLE in NZBWF1 mice, we demonstrated that dietary DHA supplementation suppresses IFN-stimulated and proinflammatory gene expression and consequent pulmonary inflammation and lupus nephritis (5, 34–36).
Given their potential for complementary anti-inflammatory mechanisms, O3FAs might be valuable adjuncts to reduce GC dosages needed to suppress SLE progression. Here, we hypothesized that DHA could be used as an adjunct to reduce the DEX concentration required to suppress proinflammatory and IFN responses in lupus macrophages. To test this hypothesis, we preclinically modeled SLE hyperinflammation using LPS activation of novel self-renewing fetal liver-derived alveolar-like macrophages (FLAMs) derived from NZBWF1 mice (37). The results showed that combining subinhibitory concentrations of DHA with low-dose dexamethasone (DEX) creates a potent synergy that robustly suppresses IFN-stimulated and proinflammatory gene expression induced by LPS in the SLE macrophages. Cotreatment outperformed individual treatments by targeting key pathways and TFs involved in inflammation and resolution. These findings support the idea that O3FA-GC cotreatment may be a feasible steroid-sparing strategy for SLE management.
2 Methods
2.1 Self-renewing fetal liver-derived NZBWF1 lupus macrophages
The Institutional Animal Care and Use Committee (IACUC) at Michigan State University (MSU; AUF# 201800113) approved all animal experimental protocols for this study. SLE-prone NZBWF1 mice (Jackson Laboratories, Bar Harbor, ME) were housed at MSU’s animal facility, which was maintained at a constant temperature (21-24°C), humidity (40-55%), and a 12-hr light/dark cycle.
After the mice were bred, the dams were euthanized between gestational days 14 and 18. Specifically, dams were placed in Optimice cages and euthanized via CO2 inhalation (4.7 L CO2/min) for 10 minutes to ensure death to both the dam and neonates. Death of the dam via CO2 inhalation was confirmed by paw pinch. Cervical dislocation was used as a secondary form of euthanasia for the dam. Fetuses were promptly dissected from the dam by severing the placental arteries. Loss of access to the maternal blood supply served as the secondary form of euthanasia for the neonates.
Excised fetal livers were further processed to generate fetal liver-derived alveolar-like macrophage (FLAM) cell cultures as previously described (31, 37). Briefly, fetal livers were dissociated in sterile phosphate-buffered saline (PBS) to create a single-cell suspension. Suspensions were filtered through a 70-µm filter and centrifuged at 220 x g for 5 minutes. Two wash steps were performed using sterile PBS before resuspending cells in modified RPMI media (mRPMI, Thermo Fisher), which contained 10% fetal bovine serum (FBS, Thermo Fisher), 1% penicillin-streptomycin (P/S, Thermo Fisher), 30 ng/mL murine granulocyte-monocyte colony-stimulating factor (GM-CSF, PeproTech), and 20 ng/mL recombinant human TGF-β1 (PeproTech). Cells were plated in 10 cm culture plates (one liver per plate). mRPMI media was replaced every ~2 days until cells created an adherent monolayer and exhibited a round AM-like morphology (~1 wk). Cells were then frozen in liquid nitrogen until needed for this study.
FLAMs were thawed and cultured in mRPMI media for this experiment, and cells between passages 10–11 were used for subsequent studies. Upon LPS stimulation, NZBWF1 FLAMs exhibited significantly elevated type I IFN gene responses compared with FLAMs derived from C57BL/6 controls (Supplementary Figure 1), supporting their utility as a model for investigating therapeutic interventions targeting hyperinflammatory SLE-associated macrophages.
2.2 Study 1. Quantitative RT-PCR analysis of DHA and DEX cotreatment effects on LPS-induced ISG expression
2.2.1 Experimental design
FLAMs were seeded in 12-well plates at -48 hr in mRPMI media. At -24 hr, cells were gently washed with PBS, and media was replaced with mRPMI containing 0.25% FBS and 0, 5, 10, or 25 µM DHA (NuChek Prep, Elysian, MN). At -1 hr, FLAMs were treated with mRPMI media containing 0.25% FBS and 0, 1, 10, 100, or 1000 nM DEX (Sigma-Aldrich). At 0 hr, FLAMs were treated with mRPMI medium containing vehicle (VEH/CON) or containing 20 ng/mL LPS (LPS/VEH; Salmonella enterica serotype Typhimurium containing <1% impurities, Millipore Sigma). Cells were collected at 4 and 8 hr for qRT-PCR.
2.2.2 qRT-PCR
Total cellular RNA was extracted using RNeasy Mini Kits (Qiagen) according to the manufacturer’s instructions. RNA was eluted using RNase-free water provided by the RNeasy kit and quantified using the Nanodrop ND-1000 spectrophotometer (Thermo Fisher Scientific, Waltham, MA). cDNA was prepared from RNA using a High-Capacity cDNA Reverse Transcriptase Kit (Thermo Fisher Scientific). Taqman assays were performed in technical triplicate using the Takara Bio Smart Chip real-time PCR system, with assistance from the MSU Genomics Core, to assess gene expression. Expression of ISGs (Mx1, Irf7, Ifit1, Isg15, Oasl1, and Rsad2) and housekeeping genes (Actb and Hprt) was assessed. ΔCt values were calculated by subtracting the average raw Ct value of both housekeeping genes from the raw Ct value for each gene of interest. ΔΔCt values were calculated by subtracting the average ΔCt value of the respective VEH/CON group from the average ΔCt value of the LPS/VEH treatment. ΔΔCt values are shown in units of fold increase relative to LPS/VEH for each gene of interest. Similarly, to assess DHA/DEX treatment on LPS-stimulated FLAMs, ΔΔCt values were calculated by subtracting the average ΔCt value of the respective LPS/VEH group from the average ΔCt value of the corresponding DHA/DEX treatment. ΔΔCt values are shown in units of fold increase relative to LPS/VEH for each gene of interest.
2.3 Study 2. RNA-seq and functional analysis of DHA and DEX cotreatment effects on immune pathways
2.3.1 Experimental design
FLAMs were seeded in 6-well plates at -48 hr in mRPMI media. At -24 hr, cells were gently washed with PBS, and media was replaced with mRPMI media containing 0.25% FBS with or without 10 µM DHA. At -1 hr, FLAMs were treated with mRPMI media containing 0 or 100 nM DEX. At 0 hr, FLAMs were treated with mRPMI medium (VEH/CON) or media containing 20 ng/mL LPS. Culture cohorts were collected for fatty acid analysis (4 hr), gene expression by RNA-seq (4 and 8 hr), and cytokine secretion by ELISA (24 hr). Treatment groups were as follows: (i) VEH/CON, (ii) LPS/VEH, (iii) DHA/LPS, (iv) DEX/LPS, and (v) DHA+DEX/LPS.
2.3.2 Fatty acid analysis
Cell pellets were preserved in 100% methanol at -80°C before fatty acid composition analysis using gas chromatography with flame ionization detection at OmegaQuant (Sioux Falls, SD). The procedure involved transferring pellets to screw-cap glass vials and adding an internal standard, di-C23:0 PL. A modified Folch extraction was performed, followed by thin-layer chromatography (TLC) separation using a solvent mixture of hexane, ethyl ether, and acetic acid (8:2:0.15). The phospholipid band from the TLC plate was collected and treated with methanol containing 14% boron trifluoride. HPLC-grade water and hexane were added after heating at 100°C for 10 minutes. The mixture was vortexed and centrifuged for phase separation. The hexane layer underwent gas chromatography analysis using a GC2010 Gas Chromatograph with a specific capillary column. Fatty acids were quantified by comparison with a standard mixture and an internal standard. Di-C23:0 PL was used to calculate recovery efficiency. The analysis identified 24 different saturated fatty acids (SFAs), monounsaturated fatty acids (MUFAs), omega-6 fatty acids (O6FAs), and omega-3 fatty acids (O3FAs). Results were expressed as a percentage of total identified fatty acids.
2.3.3 RNA-seq
Cells were lysed using RLT lysis buffer (Qiagen), and RNA was isolated from cells using RNeasy Mini Kits (Qiagen). RNA was quantified with Qubit (Thermo Fisher Scientific), and integrity was verified with TapeStation (Agilent Technologies). Samples (RNA integrity numbers >8) were library-prepped at the MSU Genomics Core using the Illumina Stranded mRNA Library Preparation, Ligation Kit with IDT for Illumina Unique Dual Index adapters following the manufacturer’s recommendations, except that half-volume reactions were used. Libraries were pooled in equimolar proportions and quantified using the Invitrogen Collibri Quantification qPCR kit. Samples were sequenced on the NovaSeq 6000 S4 flow cell in a 2x150bp paired-end format using a NovaSeq v1.5, 300-cycle reagent kit. Base calling was performed using Illumina Real-Time Analysis (RTA) v3.4.4, and the RTA output was demultiplexed and converted to FastQ format with Illumina Bcl2fastq v2.20.0. Following quality control using FastQC, reads were aligned to the mouse reference genome (GRCm39, release 107) using STAR (version 2.3.7a) (38). Normalization and differential expression analysis were performed using DESeq2 (39) in R (version 4.1.2). Genes were considered differentially expressed when | fold change | ≥ 1.5 and the adjusted p-value ≤ 0.05.
2.3.4 Functional analysis
Gene set enrichment analysis was performed using the fgsea package in R on gene expression datasets ranked by fold-change and gene sets from the Gene Set Knowledgebase (GSKB) (40) filtered only to include Gene Ontology (GO) and KEGG gene sets (41). The pathway-level information extractor (PLIER) tool (42) was used to summarize gene expression signatures for all treatment conditions, except for unstimulated controls, using the same gene sets as prior knowledge. Differences in latent variable (LV) estimates between conditions were determined by three-way ANOVA with DHA treatment, DEX treatment, and time as factors.
2.3.5 Transcription factor (TF) analysis
TF analysis was performed using the decoupleR package (43). DESeq2 differential expression analyses sorted by fold-change were used as input with the DoRothEA collection of TF-gene interactions with a level of confidence “A – highest confidence” (44).
2.3.6 Enzyme-linked immunosorbent assay
Representative ISG-related proteins (i.e., IFN-β, CCL2, CXCL10) that were identified with qRT-PCR and RNA-seq were measured in supernatants of treated FLAMs by enzyme-linked immunosorbent assay (ELISA). Specifically, IFN-β was measured using a LumiKine™ Xpress mIFN-β 2.0 kit (InvivoGen, San Diego, CA), and other proteins were measured using corresponding DuoSet ELISA kits (R&D Systems, Minneapolis, MN) according to the manufacturer’s instructions.
2.4 Data visualization and statistics
GraphPad Prism Version 10 (GraphPad Software, La Jolla, California, USA, www.graphpad.com) was used to visualize fatty acid, quantitative RT-PCR, and cytokine data. These data were subjected to the ROUT outlier test (Q=1%) and then the Shapiro-Wilk test (p < 0.01) to identify outliers and assess normality, respectively. Data failing to meet the assumption for normality were analyzed using the non-parametric Kruskal-Wallis test, followed by Dunn’s post-hoc test. Data that met assumptions for normality and equal variances were analyzed by parametric one-way analysis of variance (ANOVA) followed by Tukey’s post-hoc test. Data are shown as mean ± standard error of the mean, with p < 0.05 considered statistically significant. The SynergyFinder 3.14.0 R package (45) was used to evaluate inhibitory interactions between DHA and DEX on ISG expression. Synergy scores were calculated using the zero-interaction potency (ZIP) model (46). Visualizations of RNA-seq differential expression and functional enrichment analyses were generated using GraphPad Prism and R.
3 Results
3.1 Study 1. DHA and DEX interact synergistically to inhibit ISG expression in SLE FLAMs
LPS stimulation in NZBWF1 FLAMs induced robust upregulation of representative ISGs, including Irf7, Mx1, Ifit1, Isg15, Oasl1, and Rsad2. DHA monotherapy concentration-dependently suppressed this IFN response. Significant ISG suppression was observed at 25 µM (p < 0.05 vs. LPS control) (Figure 1A), while lower concentrations (5 to 10 µM) showed a significant decrease (Figures 1B, C). DEX monotherapy at 1 µM effectively suppressed ISG expression, whereas lower doses (≤100 nM) demonstrated incomplete and variable transcriptional inhibition (Figures 1A–C). Combining subinhibitory DHA (5 to 10 µM) with low-dose DEX (1 to 100 nM) enhanced the suppression of LPS-driven ISGs (p < 0.05 vs. individual treatments), exceeding additive effects (Figures 1B, C). This combination amplified DEX’s potency by 10- to 100-fold, achieving near-complete transcriptional silencing. This potentiation was observed across multiple ISGs, indicating broad modulation of type I IFN-regulated genes and signaling pathways.
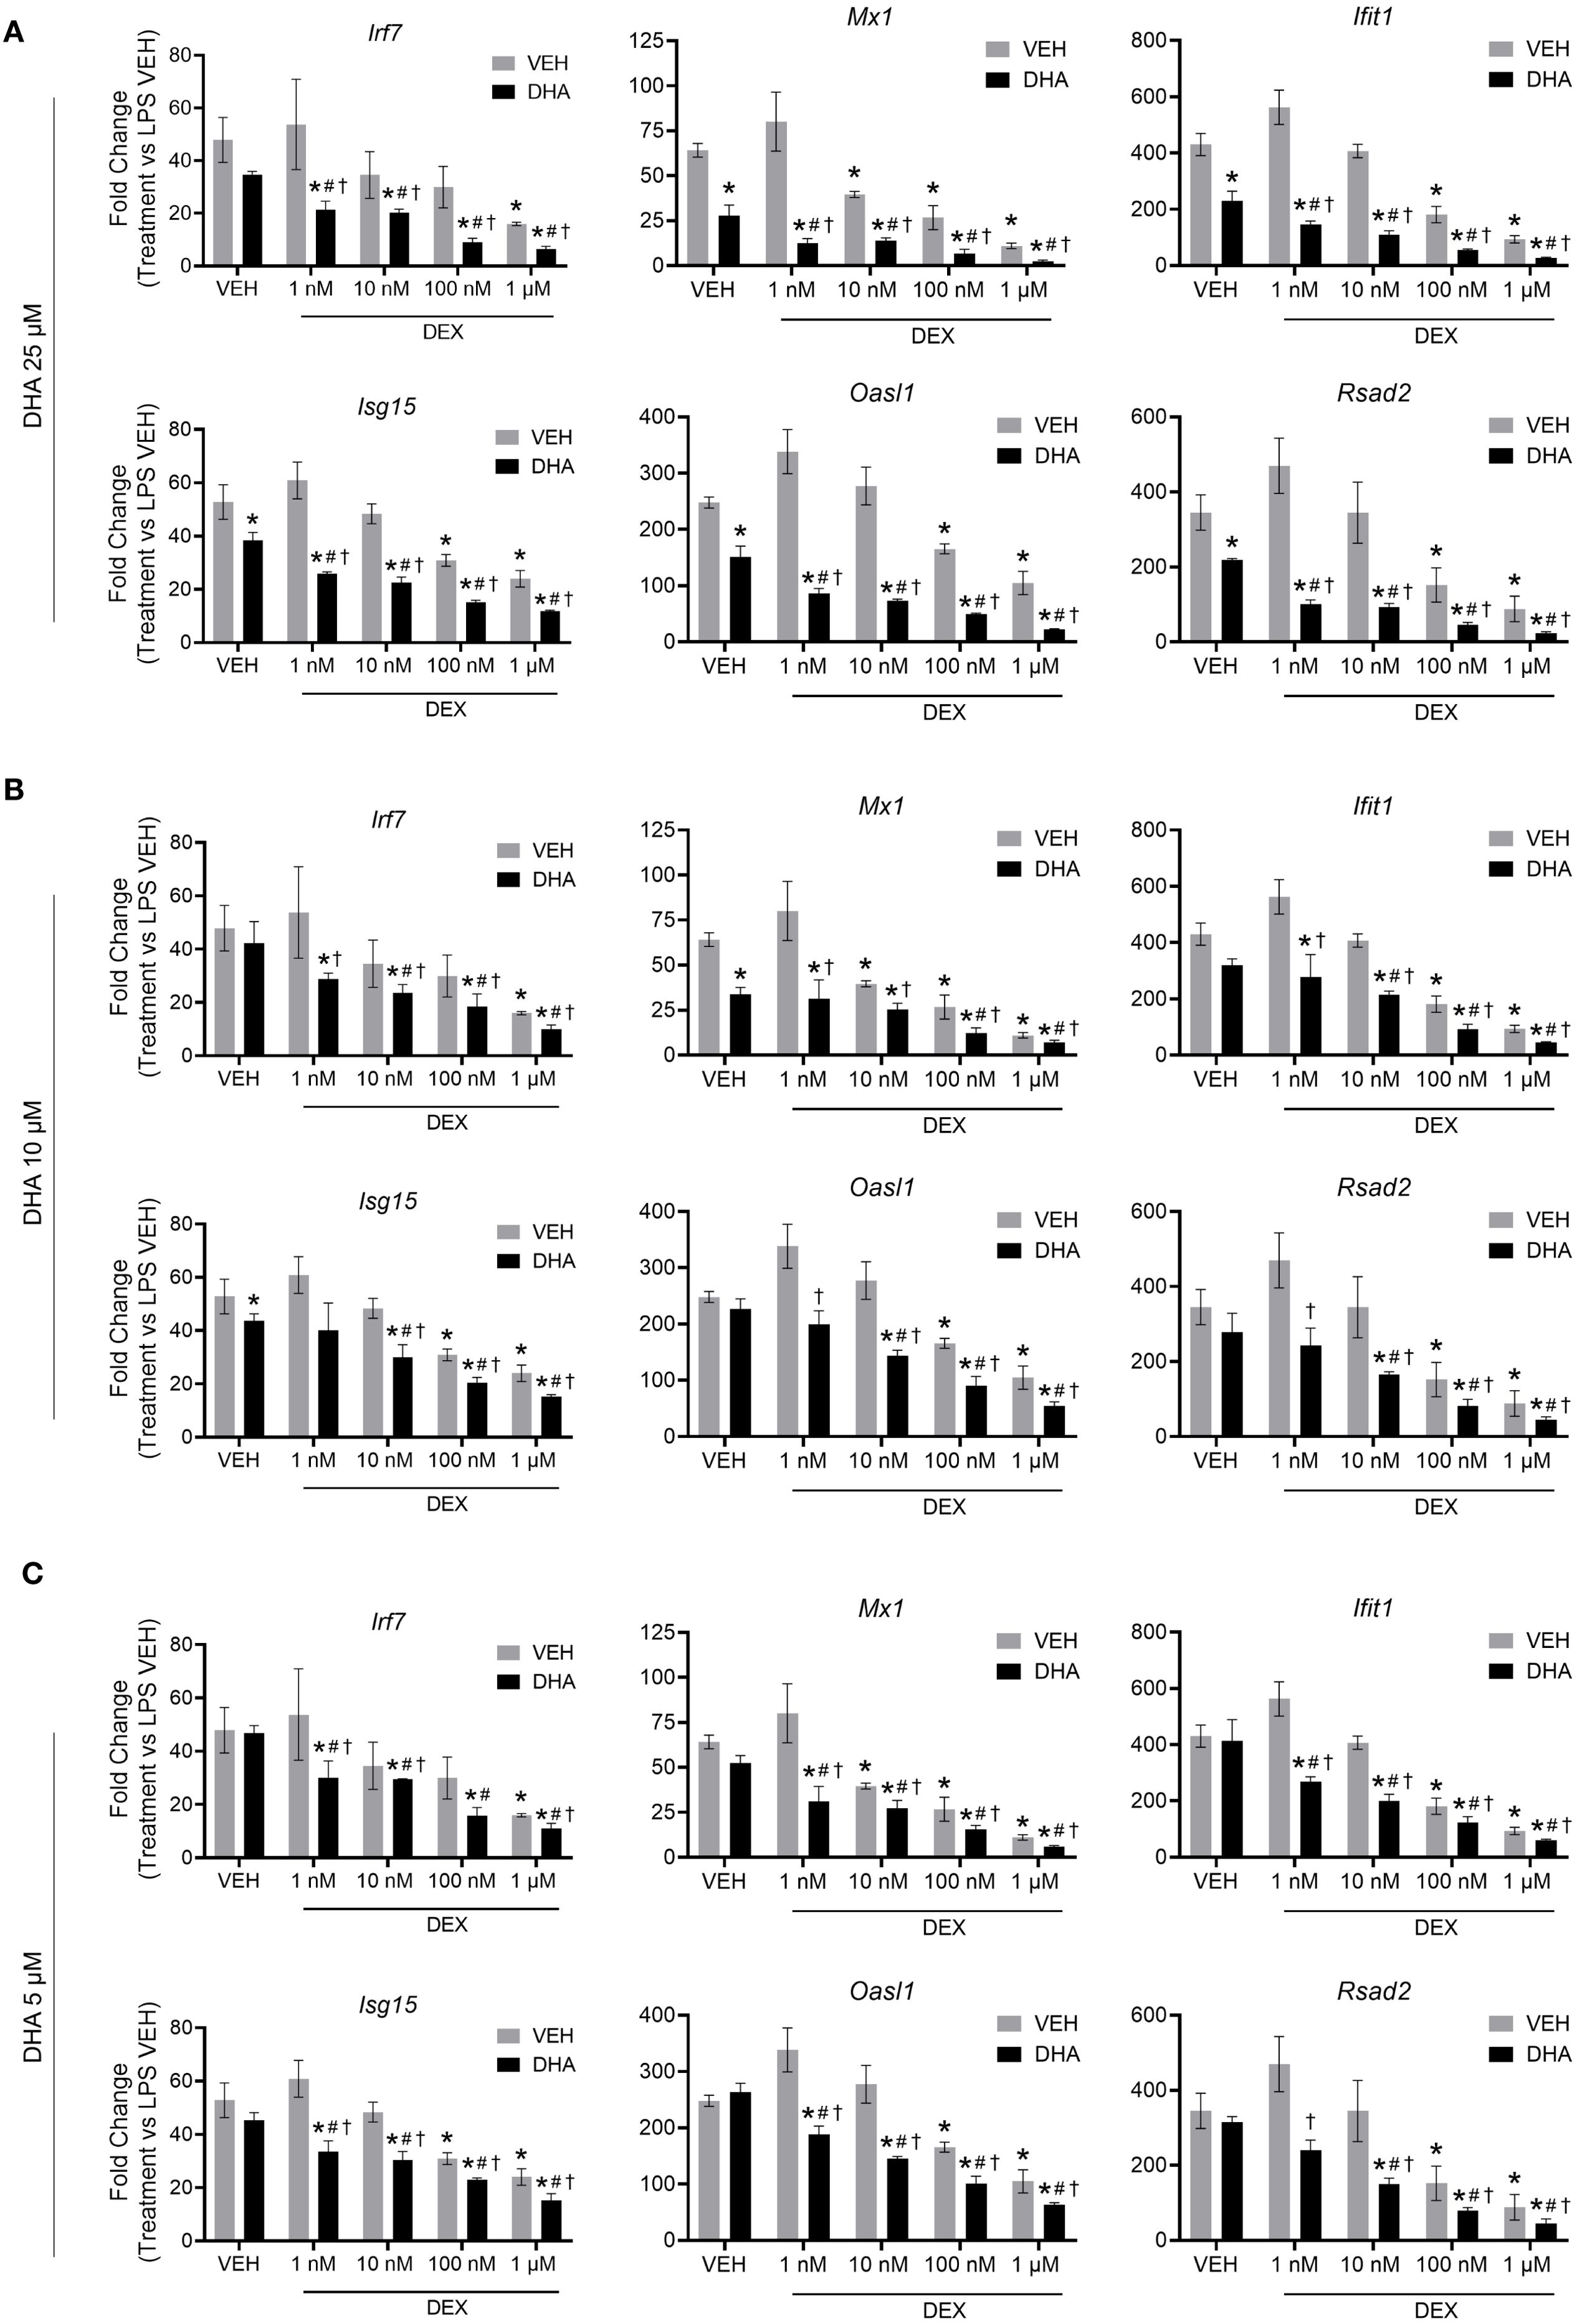
Figure 1. DHA and DEX monotherapy or cotreatment suppress IFN-stimulated gene expression. Cells were pretreated with either VEH containing no DHA or RPMI media containing 25 µM (A), 10 µM (B), or 5 µM (C) DHA at -24 hr. Cells were then treated with VEH containing no DEX or varying concentrations of DEX (1 nM to 1 µM) -1 hr prior to LPS treatment. qRT-PCR was performed on FLAMs stimulated with LPS (20 ng/mL) for 4 hr. Fold change is shown as DHA and/or DEX treatment relative to LPS VEH ± SEM. n=3 biological replicates. p<0.05; *Significant compared to LPS VEH; #Significant compared to DHA alone; †Significant compared to DEX alone.
Using SynergyFinder 3.14.0 and the ZIP synergy model, we quantified the synergy between DHA and DEX related to the inhibition of ISG expression. At all concentrations, DHA and DEX demonstrated significant synergistic interactions in inhibiting Irf7 (Figure 2A), Oasl1 (Figure 2B), Rsad2 (Figure 2C), Ifit1 (Supplementary Figure 1A), Isg15 (Supplementary Figure 1B), and Mx1 (Supplementary Figure 1C). Synergy was most robust when FLAMs were pretreated with 1 nM or 10 nM DEX in conjunction with 5 µM DHA (Figure 2 and Supplementary Figure 1). At higher concentrations of DHA (i.e., 10 µM and 25 µM) and DEX (i.e., 100 nM and 1000 nM), ZIP synergy scores were still greater than 0, indicating a smaller magnitude of synergy, as the pathways were more robustly inhibited by monotherapies at these higher concentrations.
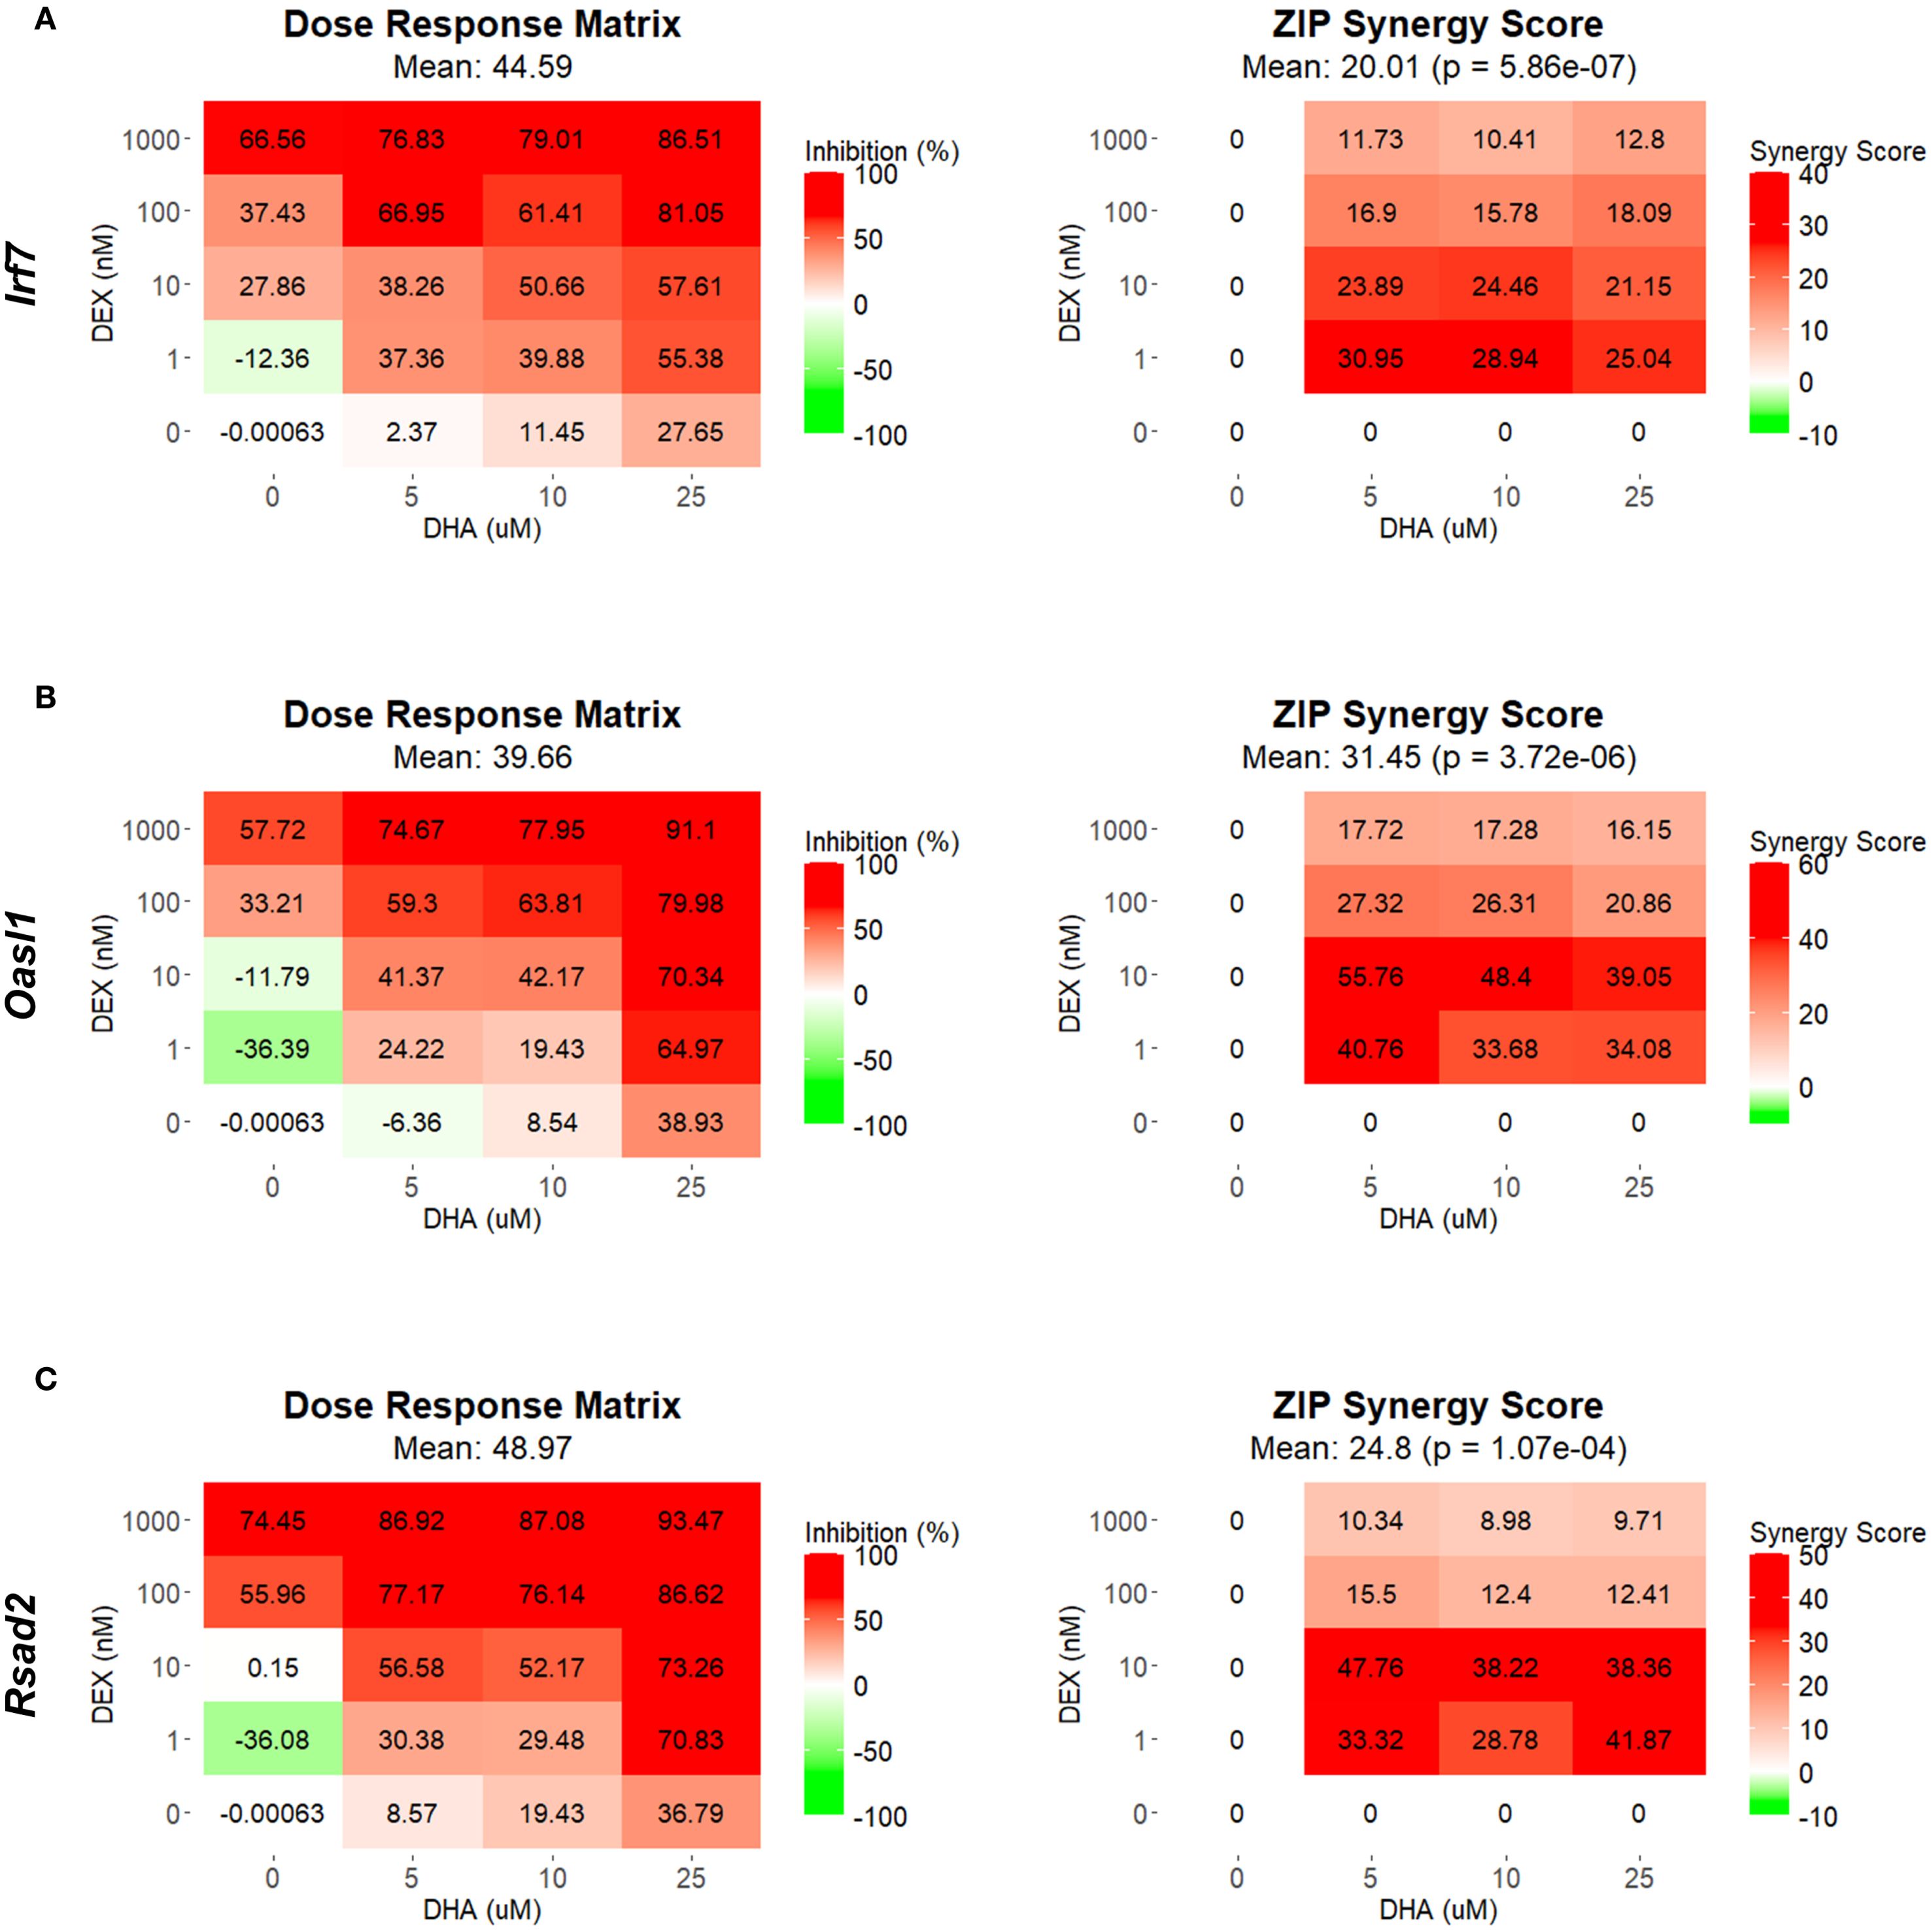
Figure 2. DHA and DEX synergistically inhibit the expression of IFN-stimulated genes. Irf7 (A), Oasl1 (B), and Rsad2 (C) were measured by qRT-PCR in FLAMs stimulated with LPS (20 ng/mL) for 4 hr. Cells were pretreated with either VEH containing no DHA or RPMI media containing 25 µM, 10 µM, or 5 µM DHA at -24 hr. Cells were then treated with VEH containing no DEX or varying concentrations of DEX (1 nM-1 µM) at -1 hr prior to LPS treatment. SynergyFinder version 3.14.0 generated inhibition matrices and ZIP synergy matrices for each gene. Inhibition matrices show the average of 3 experimental replicates. Individual and mean ZIP synergy scores were calculated using an average of 3 experimental replicates. Synergy score > 0, synergistic interaction; synergy score=0, additive effect; synergy score < 0, antagonistic interaction.
Consistent with gene expression, LPS exposure stimulated secretion of IFN-β and selected ISG products (CCL2 and CXCL10) after 24 hr compared to VEH-treated control cells (Supplementary Figure 2). These responses were significantly attenuated by DHA and DEX monotherapies. When DHA and DEX were administered in combination, the secretion of IFN-β, CCL2, and CXCL10 was further reduced. Accordingly, combining DHA and DEX enhanced suppression of ISG protein expression, further underscoring their potential as a combined therapeutic strategy for modulating TLR4-driven pathogenic gene responses.
3.2 Study 2. RNA-seq and functional analysis of DHA and DEX cotreatment effects on immune pathways in SLE FLAMs
3.2.1 Treatment with DHA but not DEX skews cellular phospholipid profiles
Fatty acid profiles of phospholipids were profoundly altered by 10 µM DHA treatment (Figures 3A, B). DHA, the primary O3FA, rose from 4.9% in the VEH/CON group to 12.0% and 11.9% in the LPS/DHA and LPS/DHA+DEX groups, respectively, with total O3FA levels reaching 18.0% and 17.8%, compared to 9.5% in the VEH/CON group. These findings are consistent with earlier work using C57BL/6 FLAMs (47), where we found that treatment with a higher dose (25 µM DHA) resulted in DHA incorporation of approximately 20% of total fatty acids. In addition, these DHA concentrations are comparable to those observed in red blood cells (14% of total fatty acids) of NZBWF1 mice fed 2 g/d human caloric equivalent DHA (34).
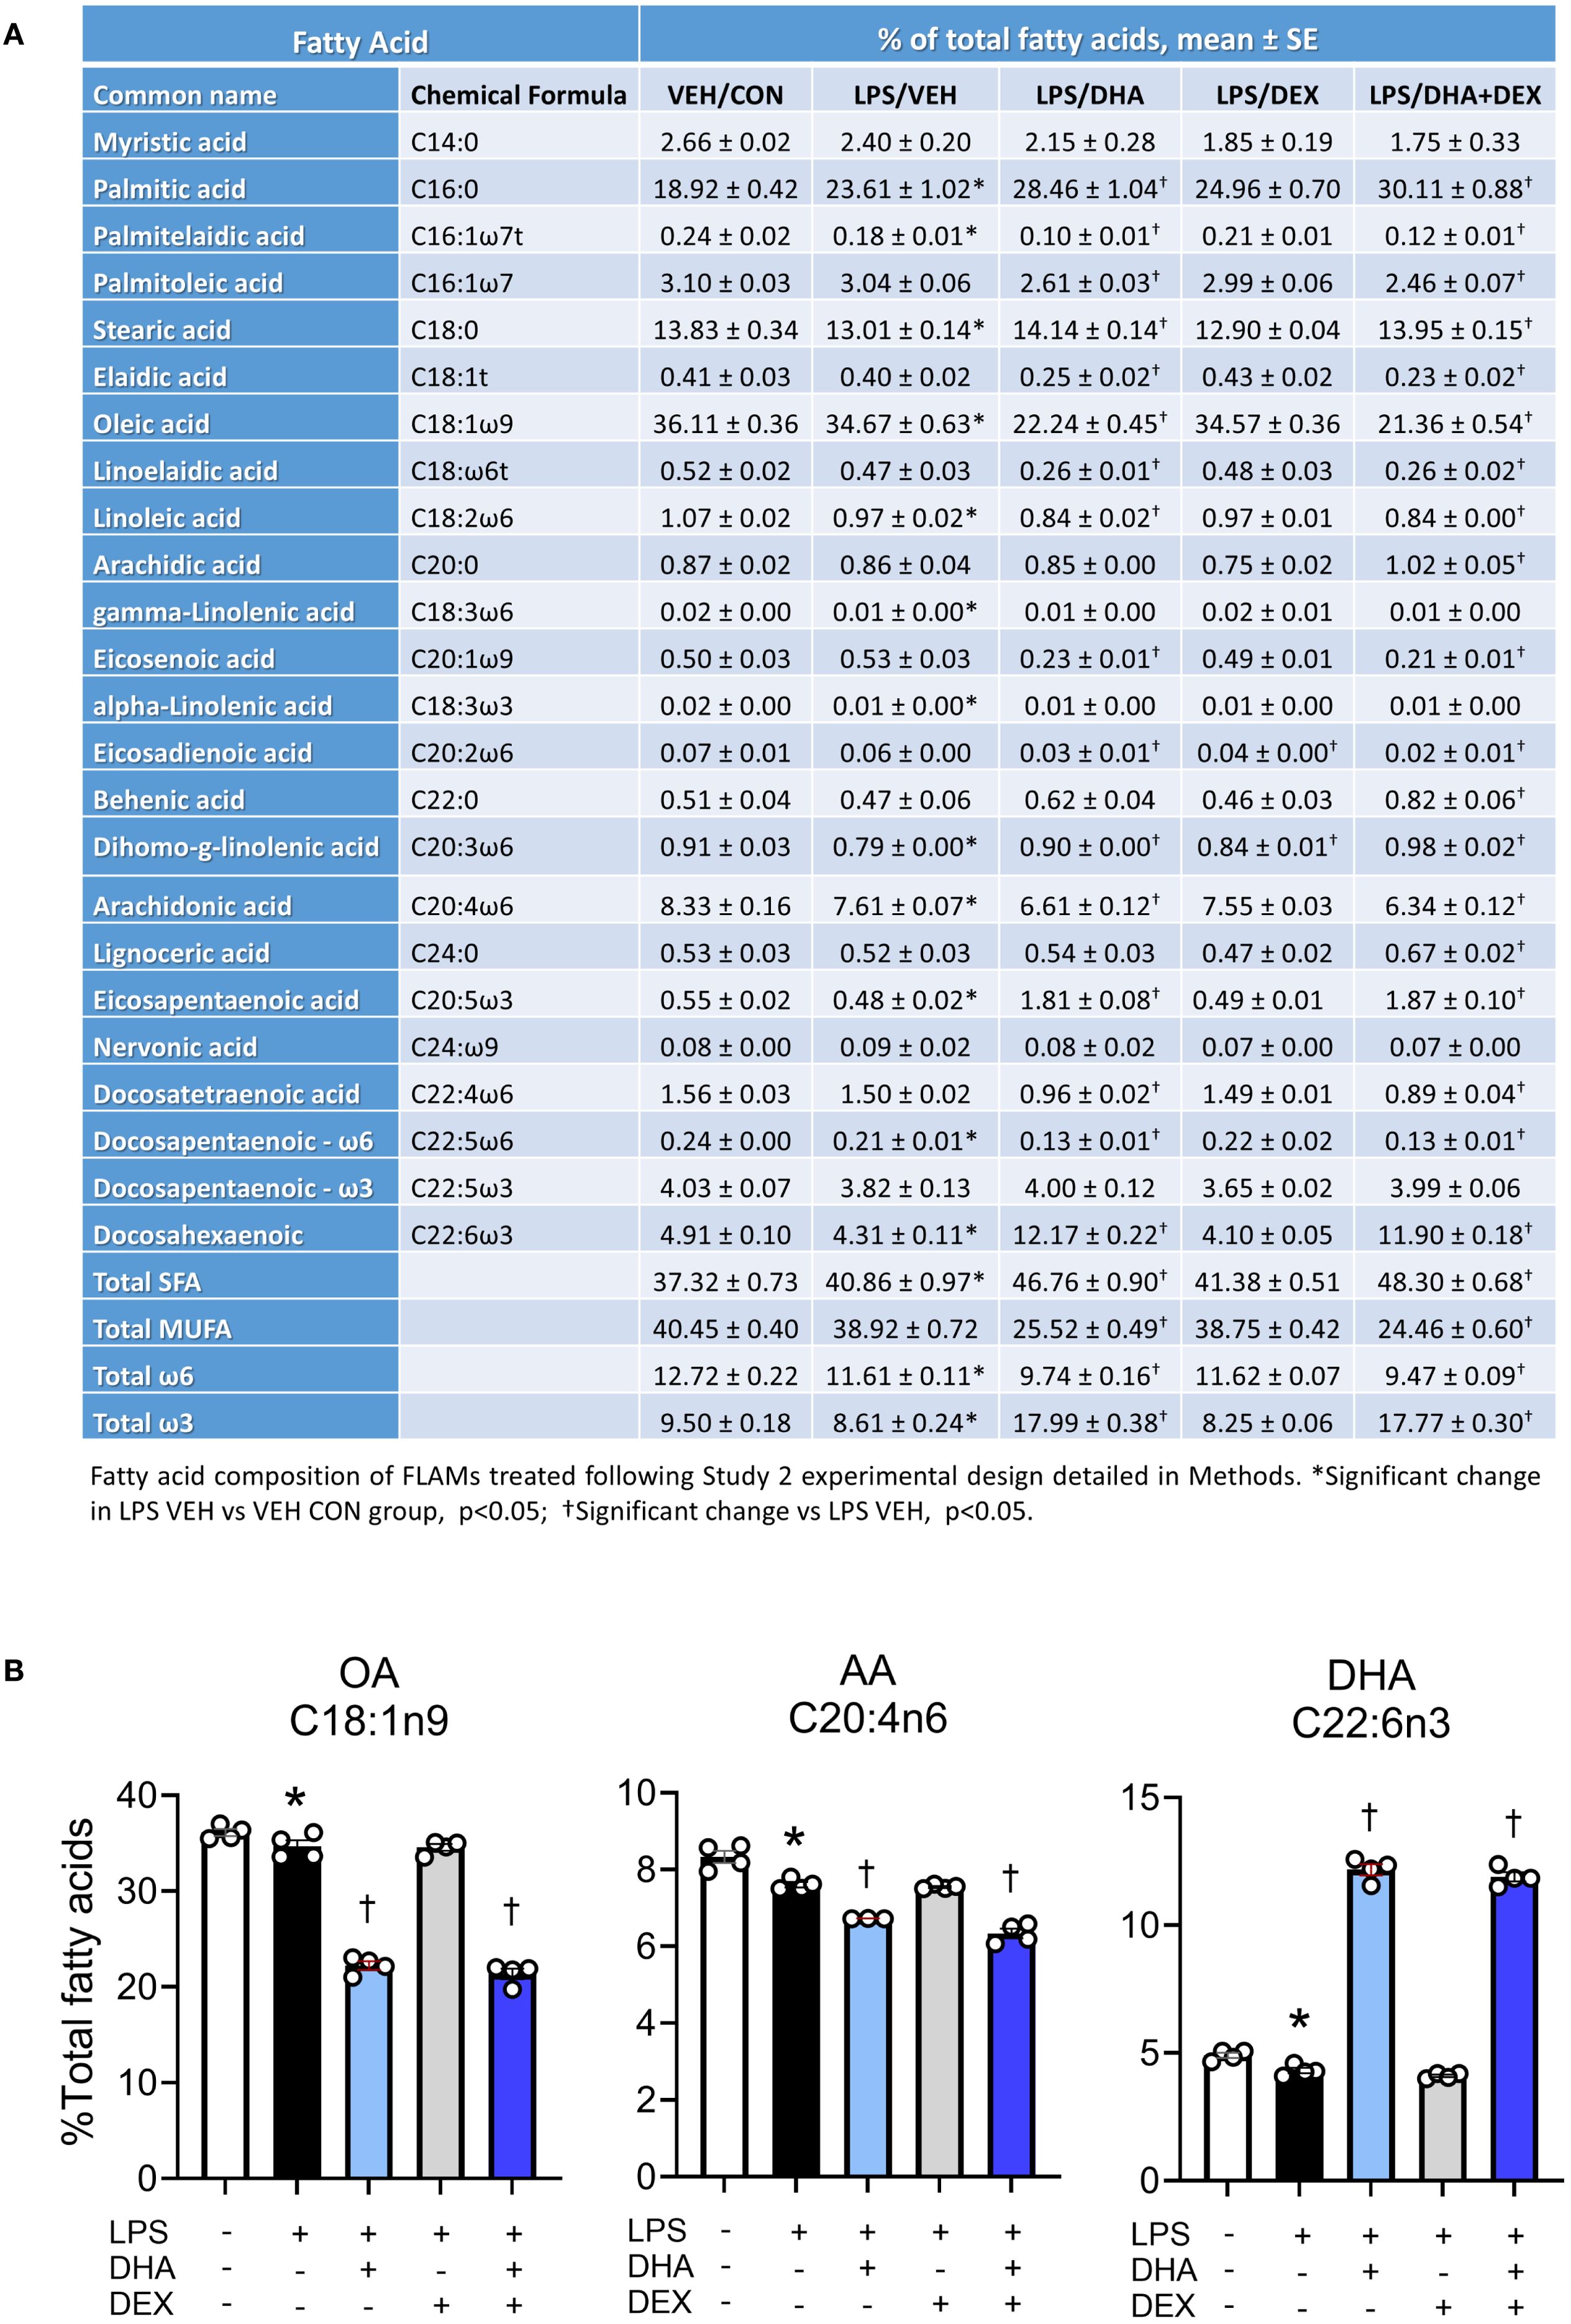
Figure 3. Treatment with DHA but not DEX skews cellular phospholipid profiles. (A) FLAMs were treated with DEX, DHA, and/or LPS as described and analyzed for major fatty acids as described in the Methods section. (B) DHA supplementation resulted in increased phospholipid DHA with accompanying decreases in arachidonic acid (AA) and oleic acid OA. *Significant differences (p<0.05) between VEH/CON and LPS/VEH were determined using Student’s t-test; †Significant differences (p<0.05) between LPS/VEH and LPS/DHA, LPS/DEX, or LPS/DHA+DEX treatments were determined using one-way ANOVA.
In tandem with these DHA and O3FA observations, O6FAs decreased in DHA-treated groups. Linoleic acid (C18:2ω6) fell from 1.1% in the VEH/CON group to 0.8% in the LPS/DHA+DEX group, while arachidonic acid (C20:4ω6) decreased from 8.3% to 6.6% and 6.3% in the LPS/DHA and LPS/DHA+DEX groups, respectively. Likewise, MUFAs declined significantly with DHA treatment. Oleic acid (C18:1ω9), the dominant MUFA, dropped from 36.1% in the VEH/CON group to 22.2% and 21.4% in the LPS/DHA and LPS/DHA+DEX groups, respectively. SFAs increased notably in the LPS/DHA and LPS/DHA+DEX groups compared to the VEH/CON group with palmitic acid (C16:0), the main SFA, rising from 18.9% in the VEH/CON group to 28.5% and 25.0% in the LPS/DHA and LPS/DHA+DEX groups, respectively. Similarly, stearic acid (C18:0) increased to 14.0% in both groups, compared to the VEH/CON group. Overall, DHA supplementation remodeled fatty acid profiles in the phospholipid fraction by increasing the levels of O3FA and SFA while reducing those of MUFA and O6FA. Adding DEX slightly enhanced some trends but did not significantly alter the effects of DHA.
3.2.2 LPS treatment significantly alters the transcriptome, enriching pathways related to inflammation and the immune response
RNA-seq analysis revealed that LPS treatment resulted in 3,632 significantly differentially expressed genes (DEGs) at 4 hr and 3,571 DEGs at 8 hr compared to VEH/CON-treated FLAMs (Figure 4A). Of these DEGs, 1860 were upregulated at 4 hr and 1998 at 8 hr. Conversely, 1772 DEGs were downregulated at 4 hr and 1573 at 8 hr. These responses highlight the dynamic nature of gene regulation during LPS-induced inflammation.
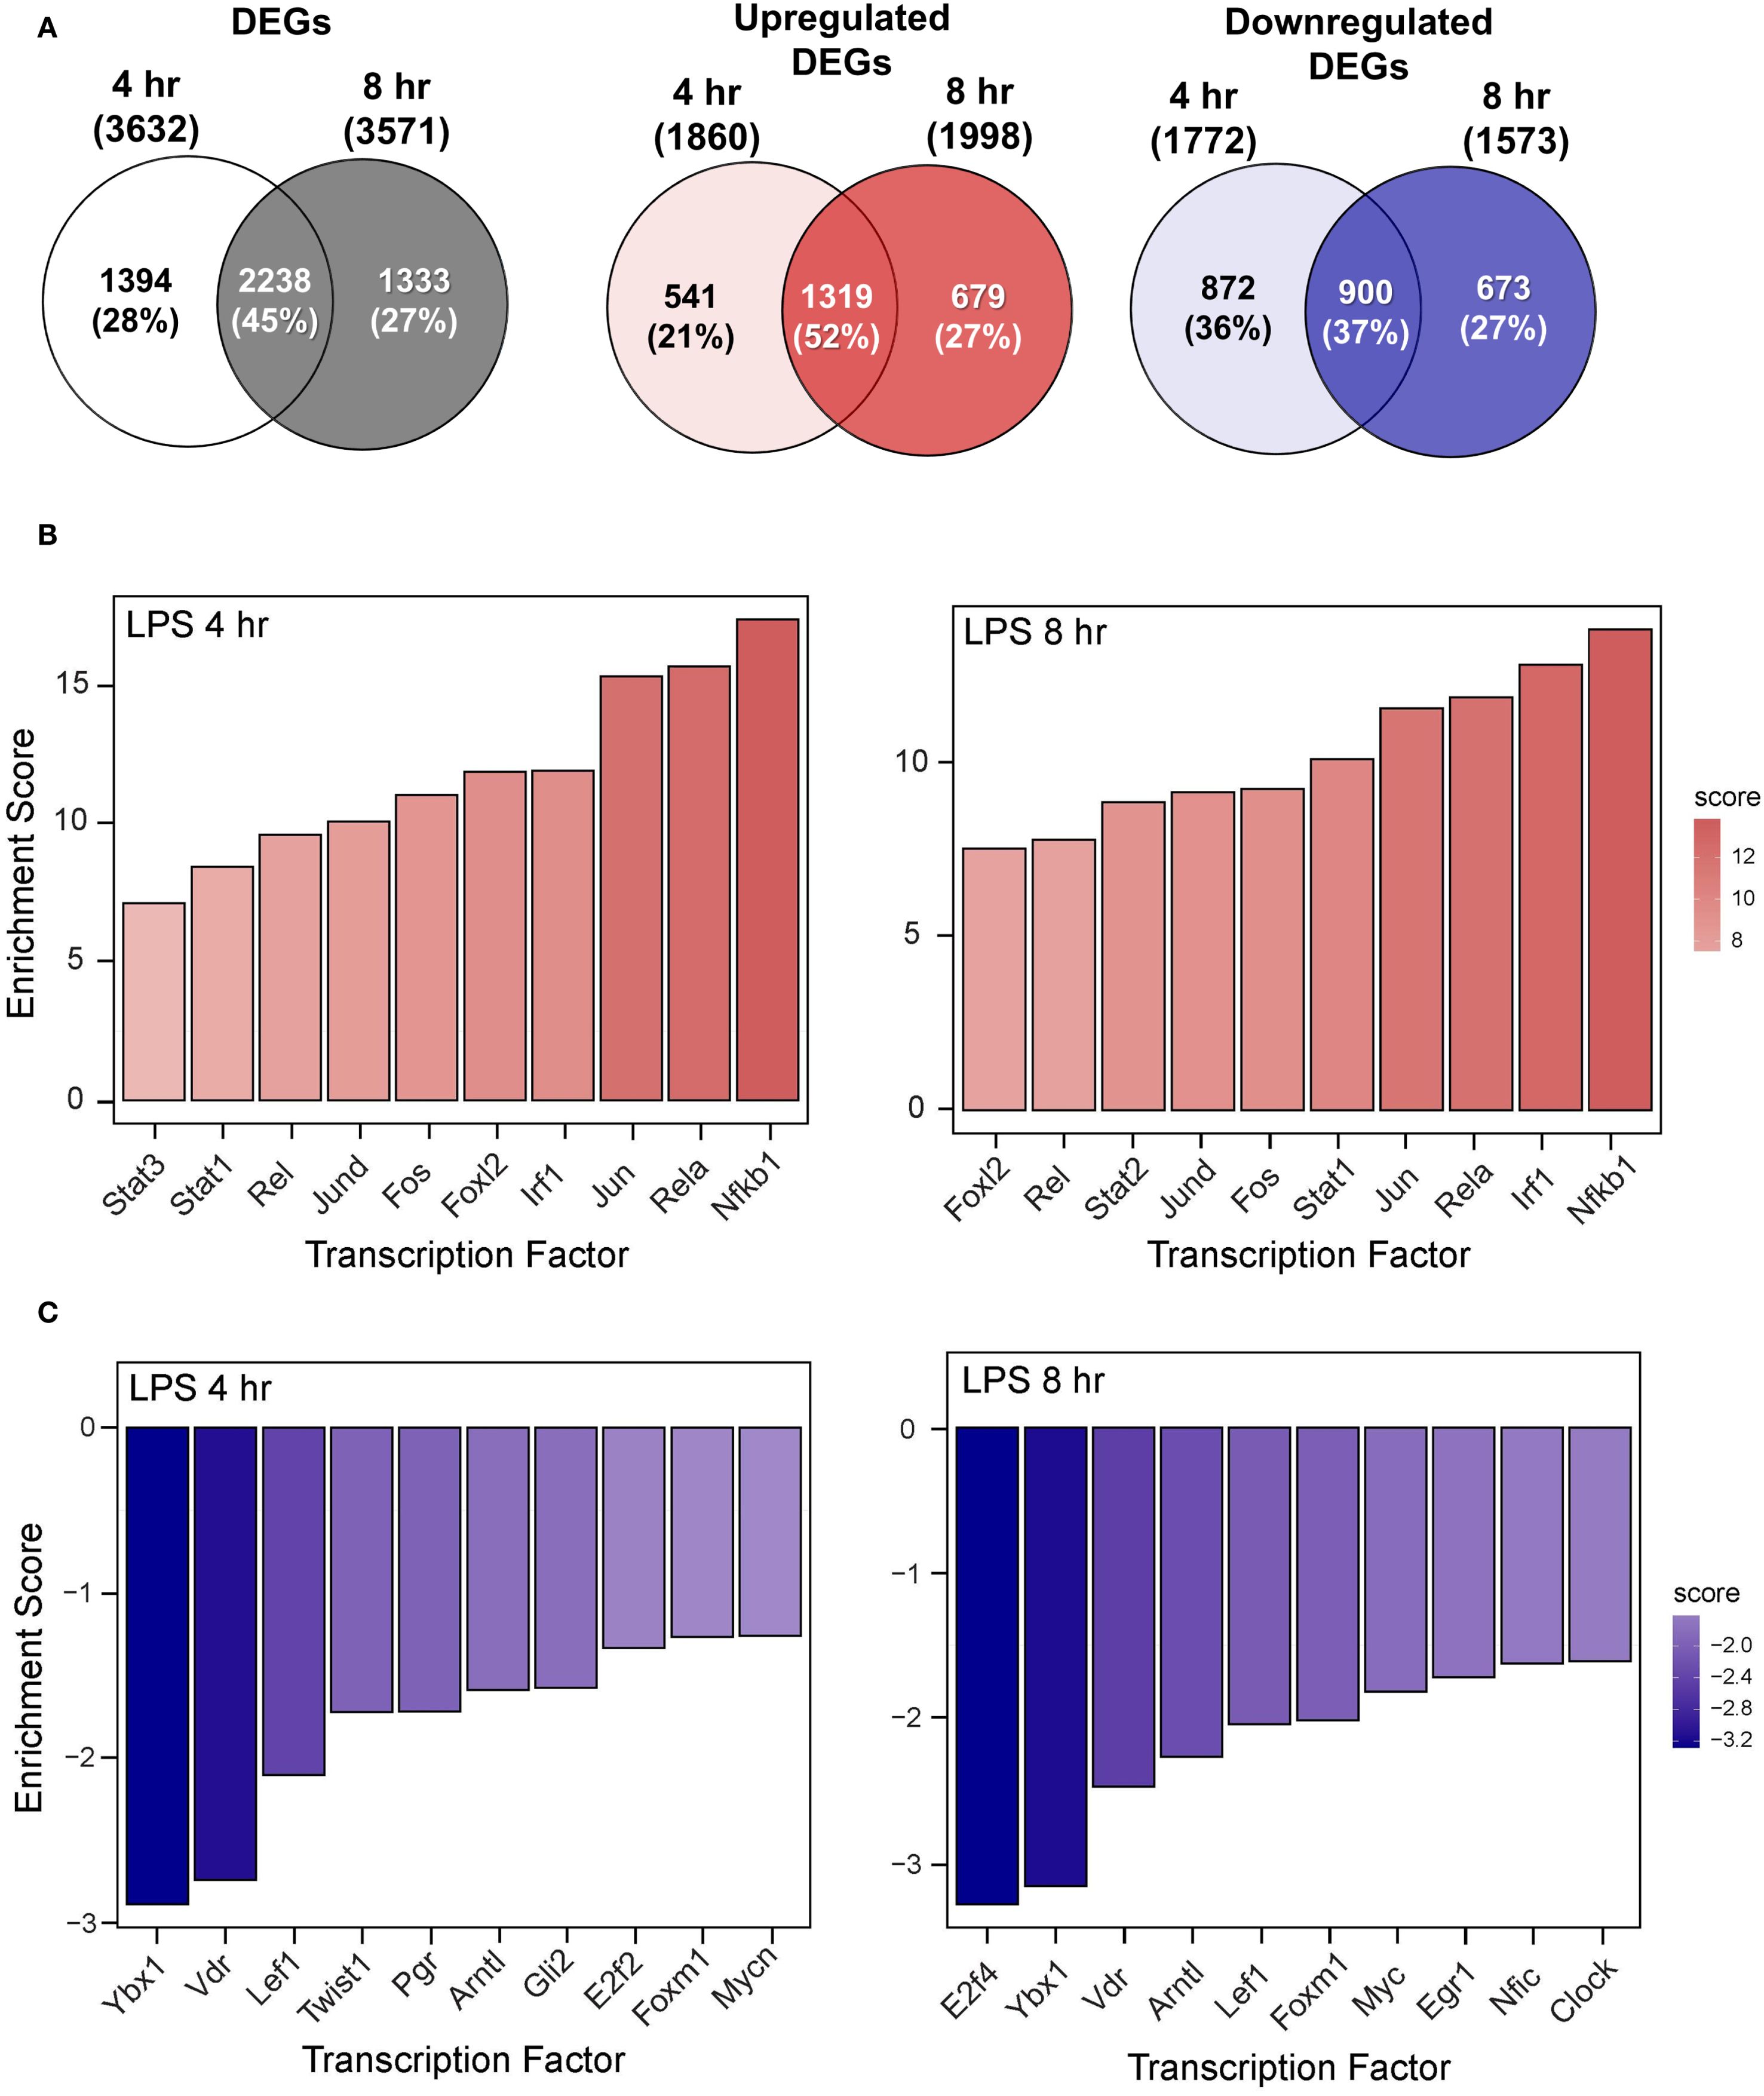
Figure 4. LPS induces proinflammatory transcriptional responses in FLAMs. (A) Differentially expressed genes (DEGs) were determined using DESeq2 (39), filtering for genes exhibiting a |log2 fold change| >= 2 and adjusted p-value <= 0.05 between the LPS/VEH group and VEH/CON group. Venn diagrams for total DEGs, upregulated DEGs, and downregulated DEGs are shown for the 4-hr time point (left circle), 8-hr time point (right circle), and both time points (intersection). (B, C) The top 10 inferred (B) active and (C) inactive TFs following LPS treatment were identified for both time points using decoupleR (43).
The top 10 inferred active and inactive transcription factors (TFs) responding to LPS treatment were identified using decoupleR for both 4- and 8-hr time points. Enrichment scores were elevated for canonical proinflammatory TFs, including NF-κB (Rel, Nfkb1), AP-1 (Jun, JunD, Fos), STATs (Stat1, 2, 3), and Irf1 (Figure 4B). Notably, nine out of ten TFs remained among the most positively enriched regulators across both time points, indicating a coordinated regulation of inflammatory responses through immediate-early transcriptional programs. In addition, anti-inflammatory and regulatory transcription factors (TFs), such as Ybx1, Lef1, E2f2/4, Vdr, and Mycn/Myc, were negatively enriched at both time points (Figure 4C). These coordinated TF signatures highlight their potential vital role in modulating LPS-induced immune and inflammatory signaling in FLAMs.
Functional enrichment analysis using GSEA revealed that LPS treatment at both time points induces distinct transcriptional responses, as shown by normalized enrichment scores (NES) across biological processes (Supplementary Figure 3). Positive NES were evident for immune/inflammatory responses, chemokine/cytokine activity, responses to viruses, LPS, IFN, and double-stranded DNA (dsDNA). Elevated NES values were equivalent or higher at 4 hr than at 8 hr, illustrating the temporal dynamics of LPS-induced immune activation. Conversely, negative NES were associated with cell division, DNA replication, lipid metabolism, spindle, and microtubule motor activity, consistent with suppression of proliferative and metabolic processes following LPS stimulation.
3.2.3 DHA+DEX cotreatment suppresses LPS proinflammatory responses in FLAMs
Sub-inhibitory DHA monotherapy (10 μM) in LPS-primed FLAMs resulted in 16 DEGs at 4 hr and 83 DEGs at 8 hr (Figure 5A). DEX monotherapy (100 μM) resulted in 48 DEGs at 4 hr and 160 DEGs at 8 hr. There were 0 and 10 common DEGs at 4 and 8 hr shared between DHA and DEX, respectively. Consistent with synergy observed in Study 1, DHA+DEX cotreatment significantly increased DEGs being expressed at 4 hr (247) and 8 hr (347). DHA+DEX cotreatment in LPS-primed FLAMs resulted in 247 DEGs at 4 hr and 347 DEGs at 8 hr. There were 15 and 40 percent overlaps of DEGs between cotreatment and monotherapies at 4 and 8 hr, respectively. Functional enrichment analysis using GSEA indicated strong negative enrichment for many LPS-upregulated gene pathways (Figure 5B).
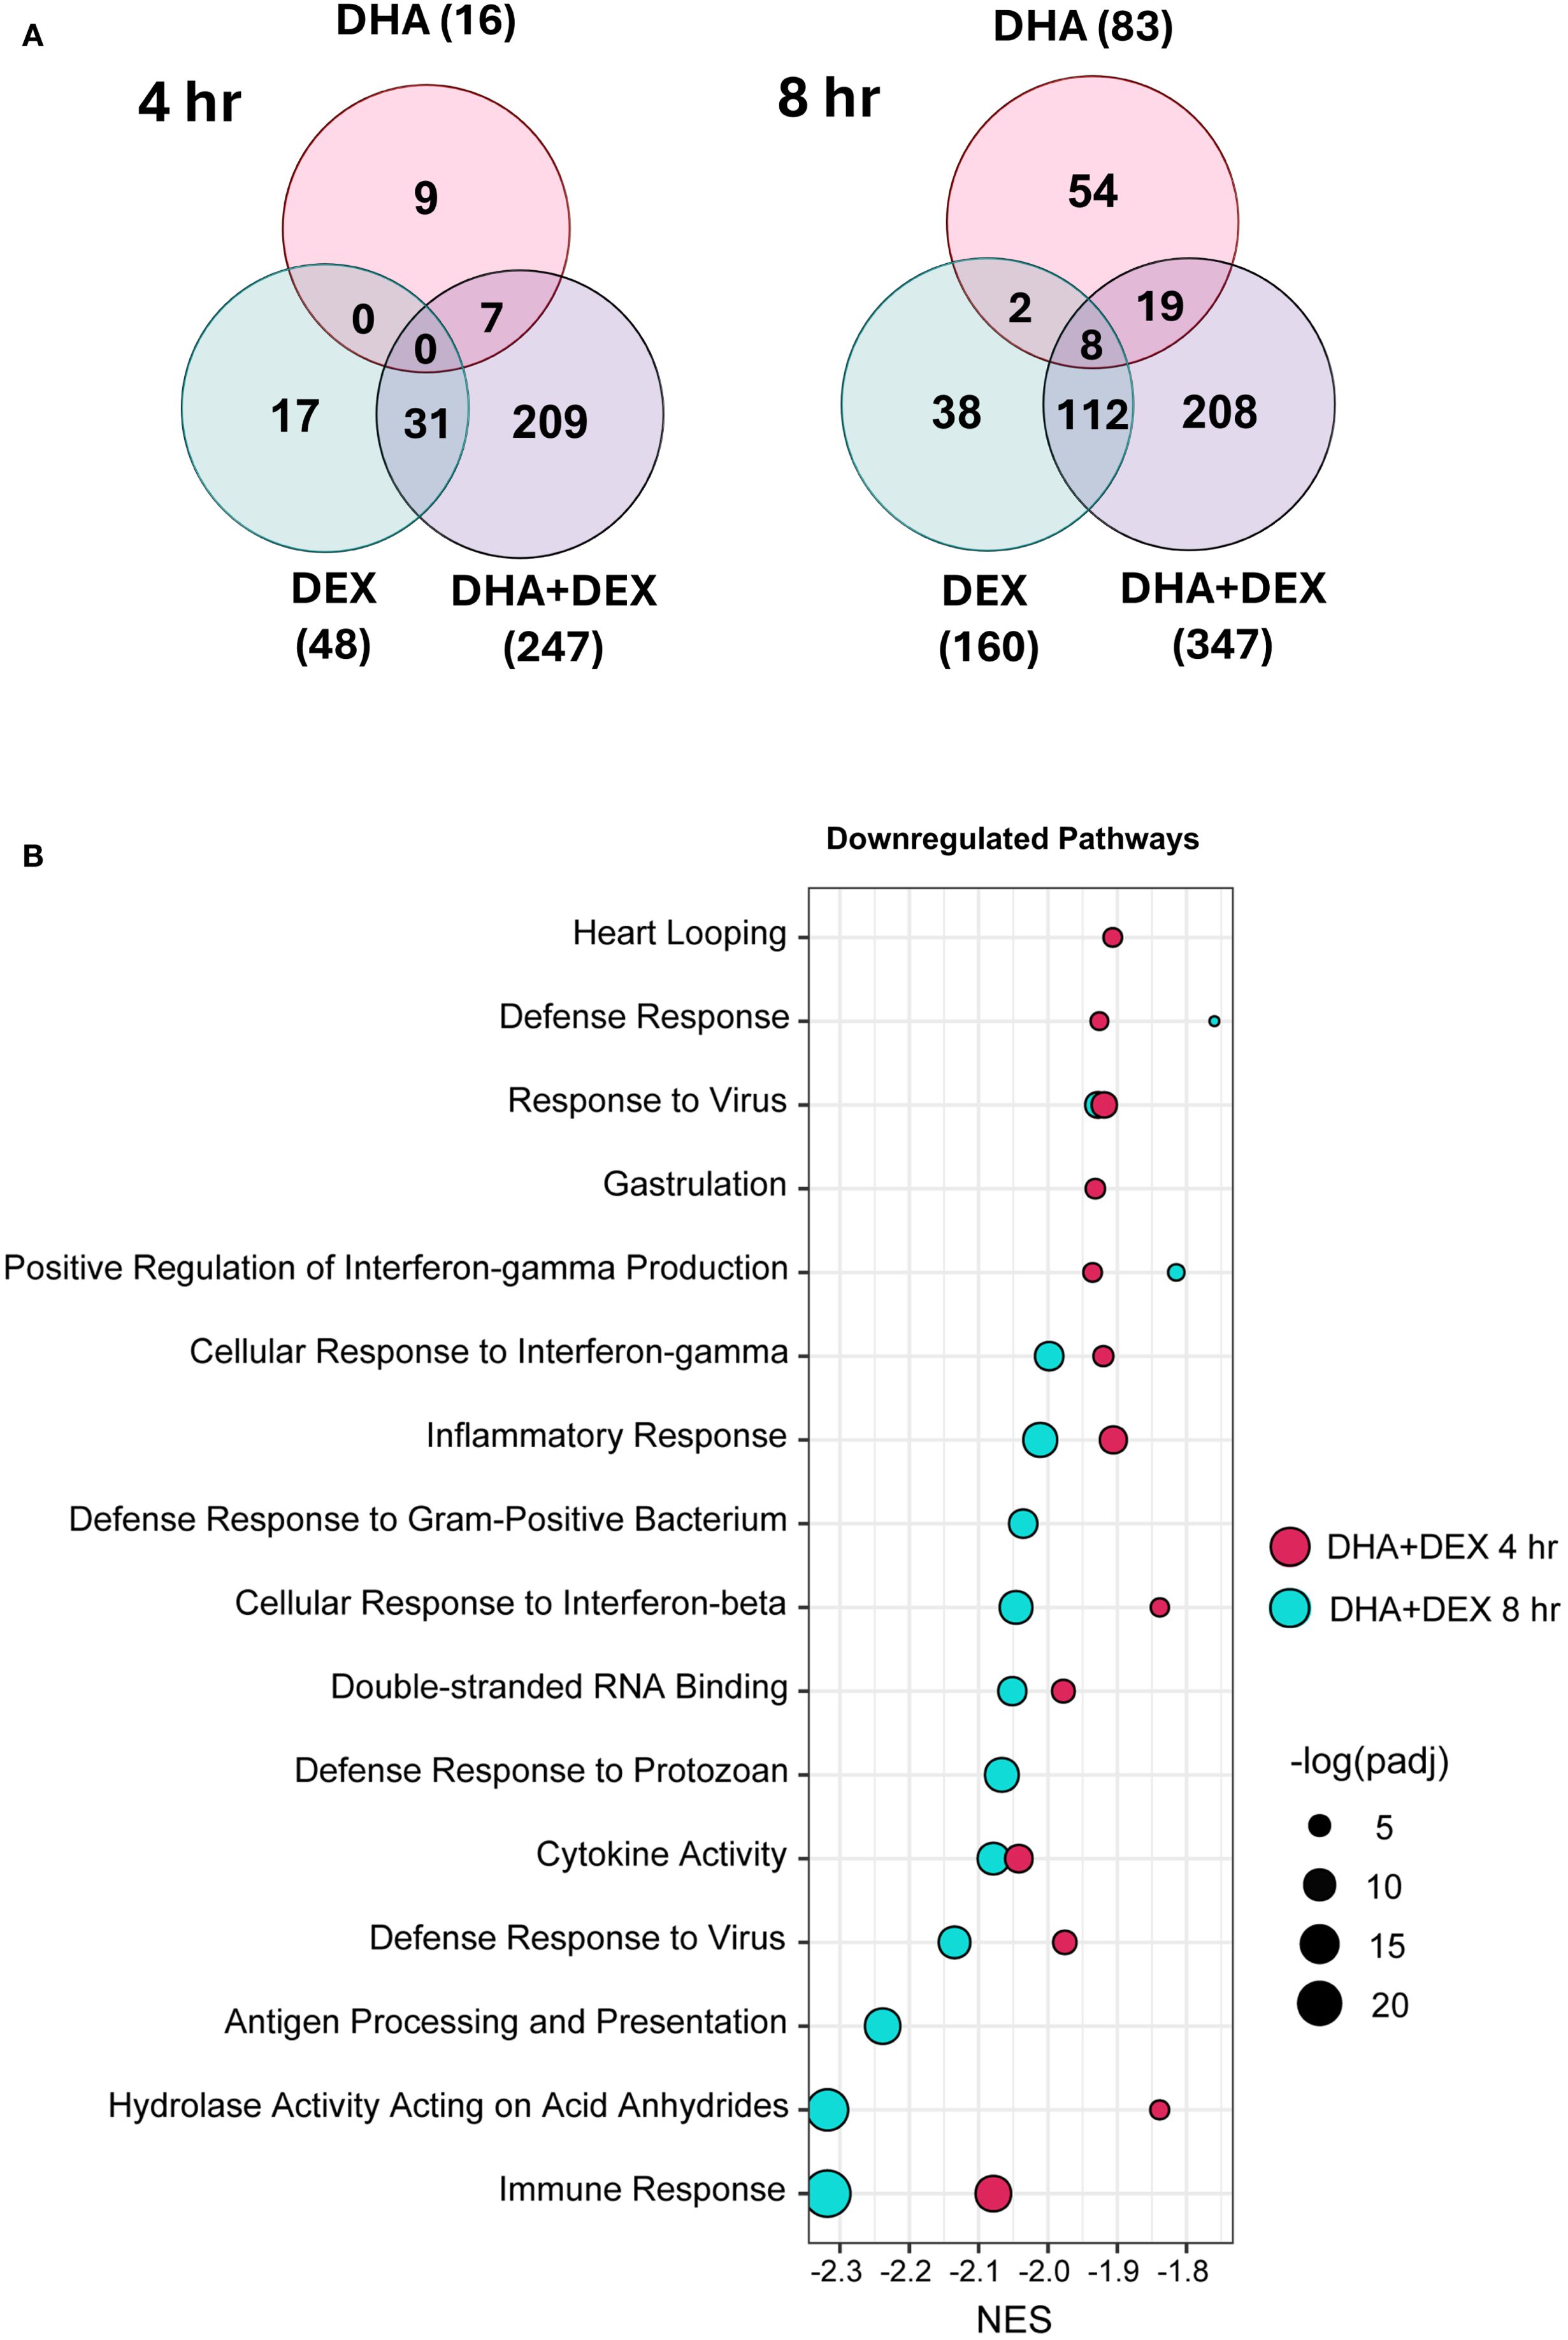
Figure 5. DHA and DEX monotherapies and DHA+DEX cotreatment suppress LPS-stimulated transcriptional responses in FLAMs. (A) Differentially expressed genes (DEGs) were determined using (39) filtering for genes exhibiting a |log2 fold change| >= 2 and adjusted p-value <= 0.05 between DHA, DEX, or DHA+DEX treatment relative to LPS/VEH. Venn diagrams for the number of treatment-dependent unique gene symbols for 4- and 8-hr time points. (B) Functional enrichment analysis using the GSEA method indicates negative enrichment for LPS-upregulated gene pathways.
Functional enrichment analysis using PLIER was further used to identify biological processes associated with DHA+DEX treatment, revealing that cotreatment significantly altered pathways related to the cellular response to IFN, antigen processing/presentation, and NAD ADP-ribosyl transferase (Figures 6A, B). The top 40 genes most significantly altered by DHA+DEX treatment were extracted from the identified pathways and depicted in a heatmap (Figure 6C). Genes altered with DEX+DHA treatment were associated with IFN and antiviral response (e.g., Mx1, Mx2, Oasl1, Ifit1, Sp140, Gm5431), MHC antigen processing and presentation (e.g., H2-DMa, H2-Ab1, H2-Aa, H2-Eb1), cytokine receptor signaling (e.g., CD74, Ccr5, Ccl2), and apoptosis and proliferation (e.g., Mxd1, Daxx, Zeb1).
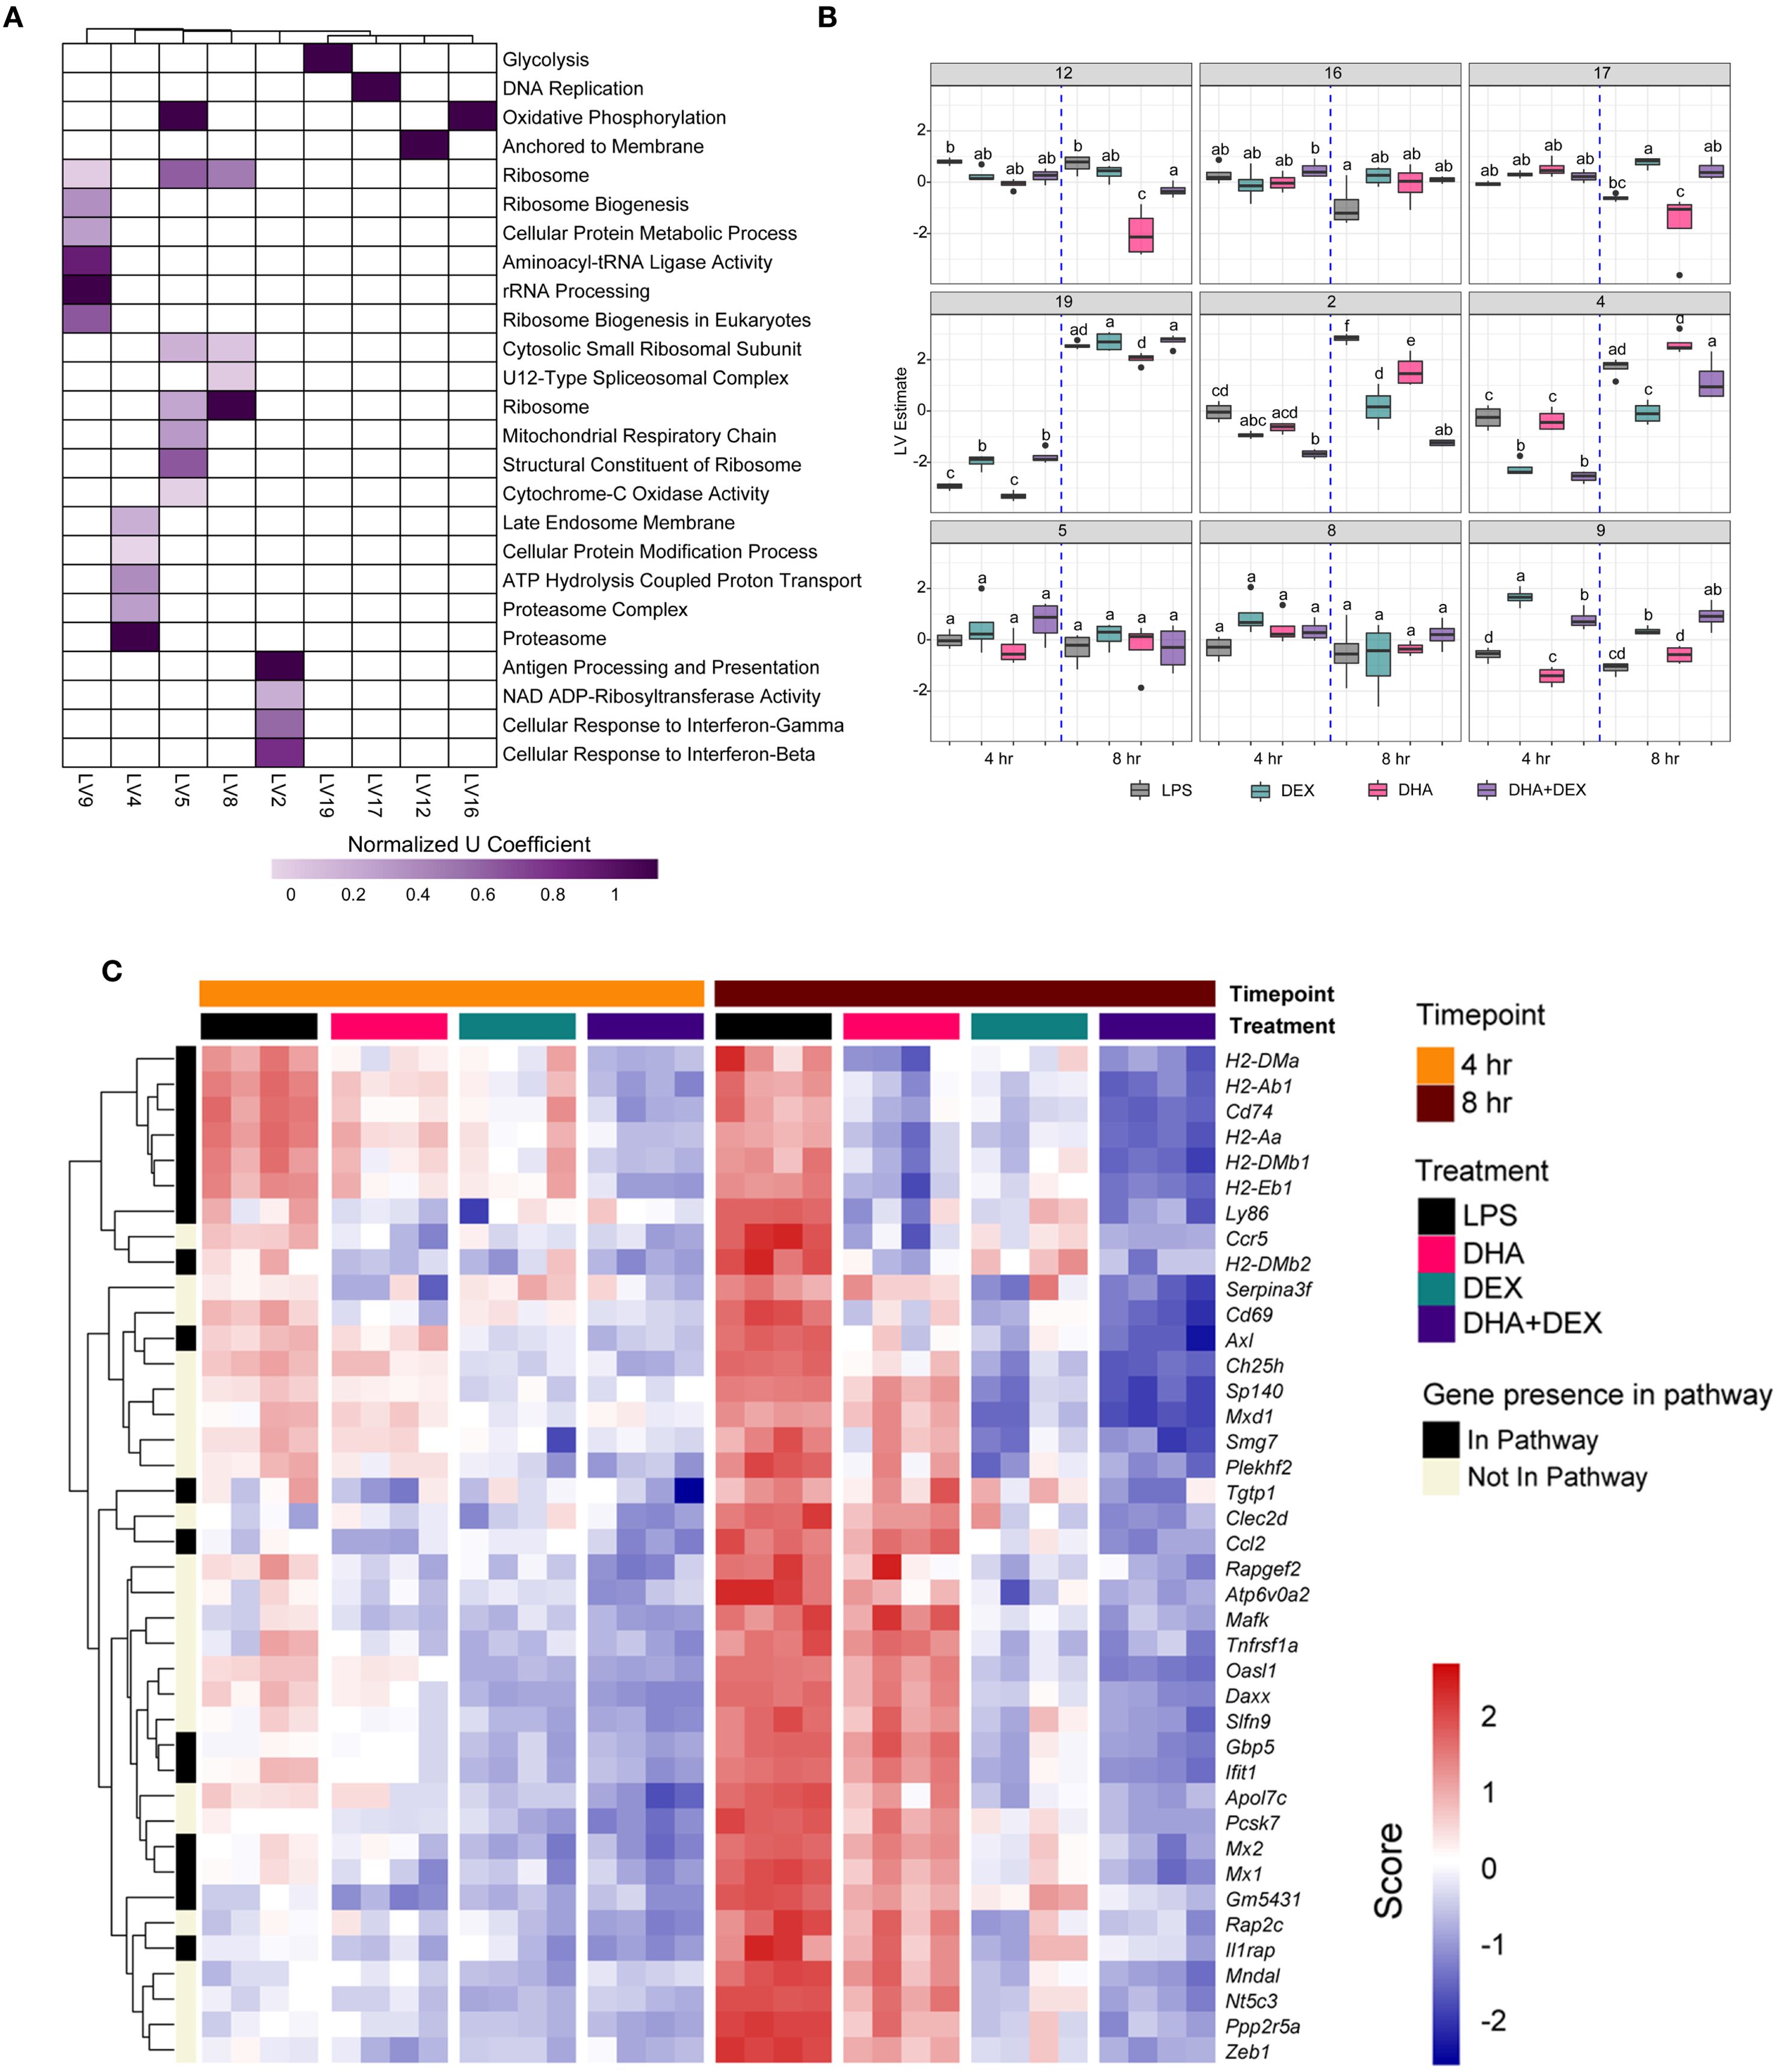
Figure 6. Identification of biological processes enriched by DHA+DEX cotreatment using PLIER analysis. (A) Functional enrichment analysis using the pathway-level information extractor (PLIER) method was used to identify significantly enriched biological processes associated with DHA+DEX treatment. PLIER was used to identify high-confidence latent variables (LVs; AUC >= 0.7 and FDR <= 0.05) mapped to Gene Ontology (GO) and KEGG gene sets. (B) LV estimates for high-confidence LVs are shown for each treatment group. Treatment groups were assessed by 3-way ANOVA, and different letters indicate significant differences (p <= 0.05). (C) Heat maps of the top 40 genes enriched by cotreatment were determined using PLIER. The color scale corresponds to the scaled expression value, with red being highly expressed genes and blue corresponding to downregulated genes.
Log2-fold changes in representative gene responses resulting from treatment are depicted in Figure 7. Individual DEGs pertaining to type I/II IFNs (Figure 7A), cytokine signaling (Figure 7B), and antigen processing and presentation (Figure 7C) were downregulated by DHA and/or DEX compared to LPS treatment at 8 hr. Downregulation of each gene was potentiated with cotreatment, and DHA+DEX treated cells were significantly different compared to cells treated with DHA and DEX individually. Combinatorial effects were observed for some, but not all, genes at the 4-hr time point.
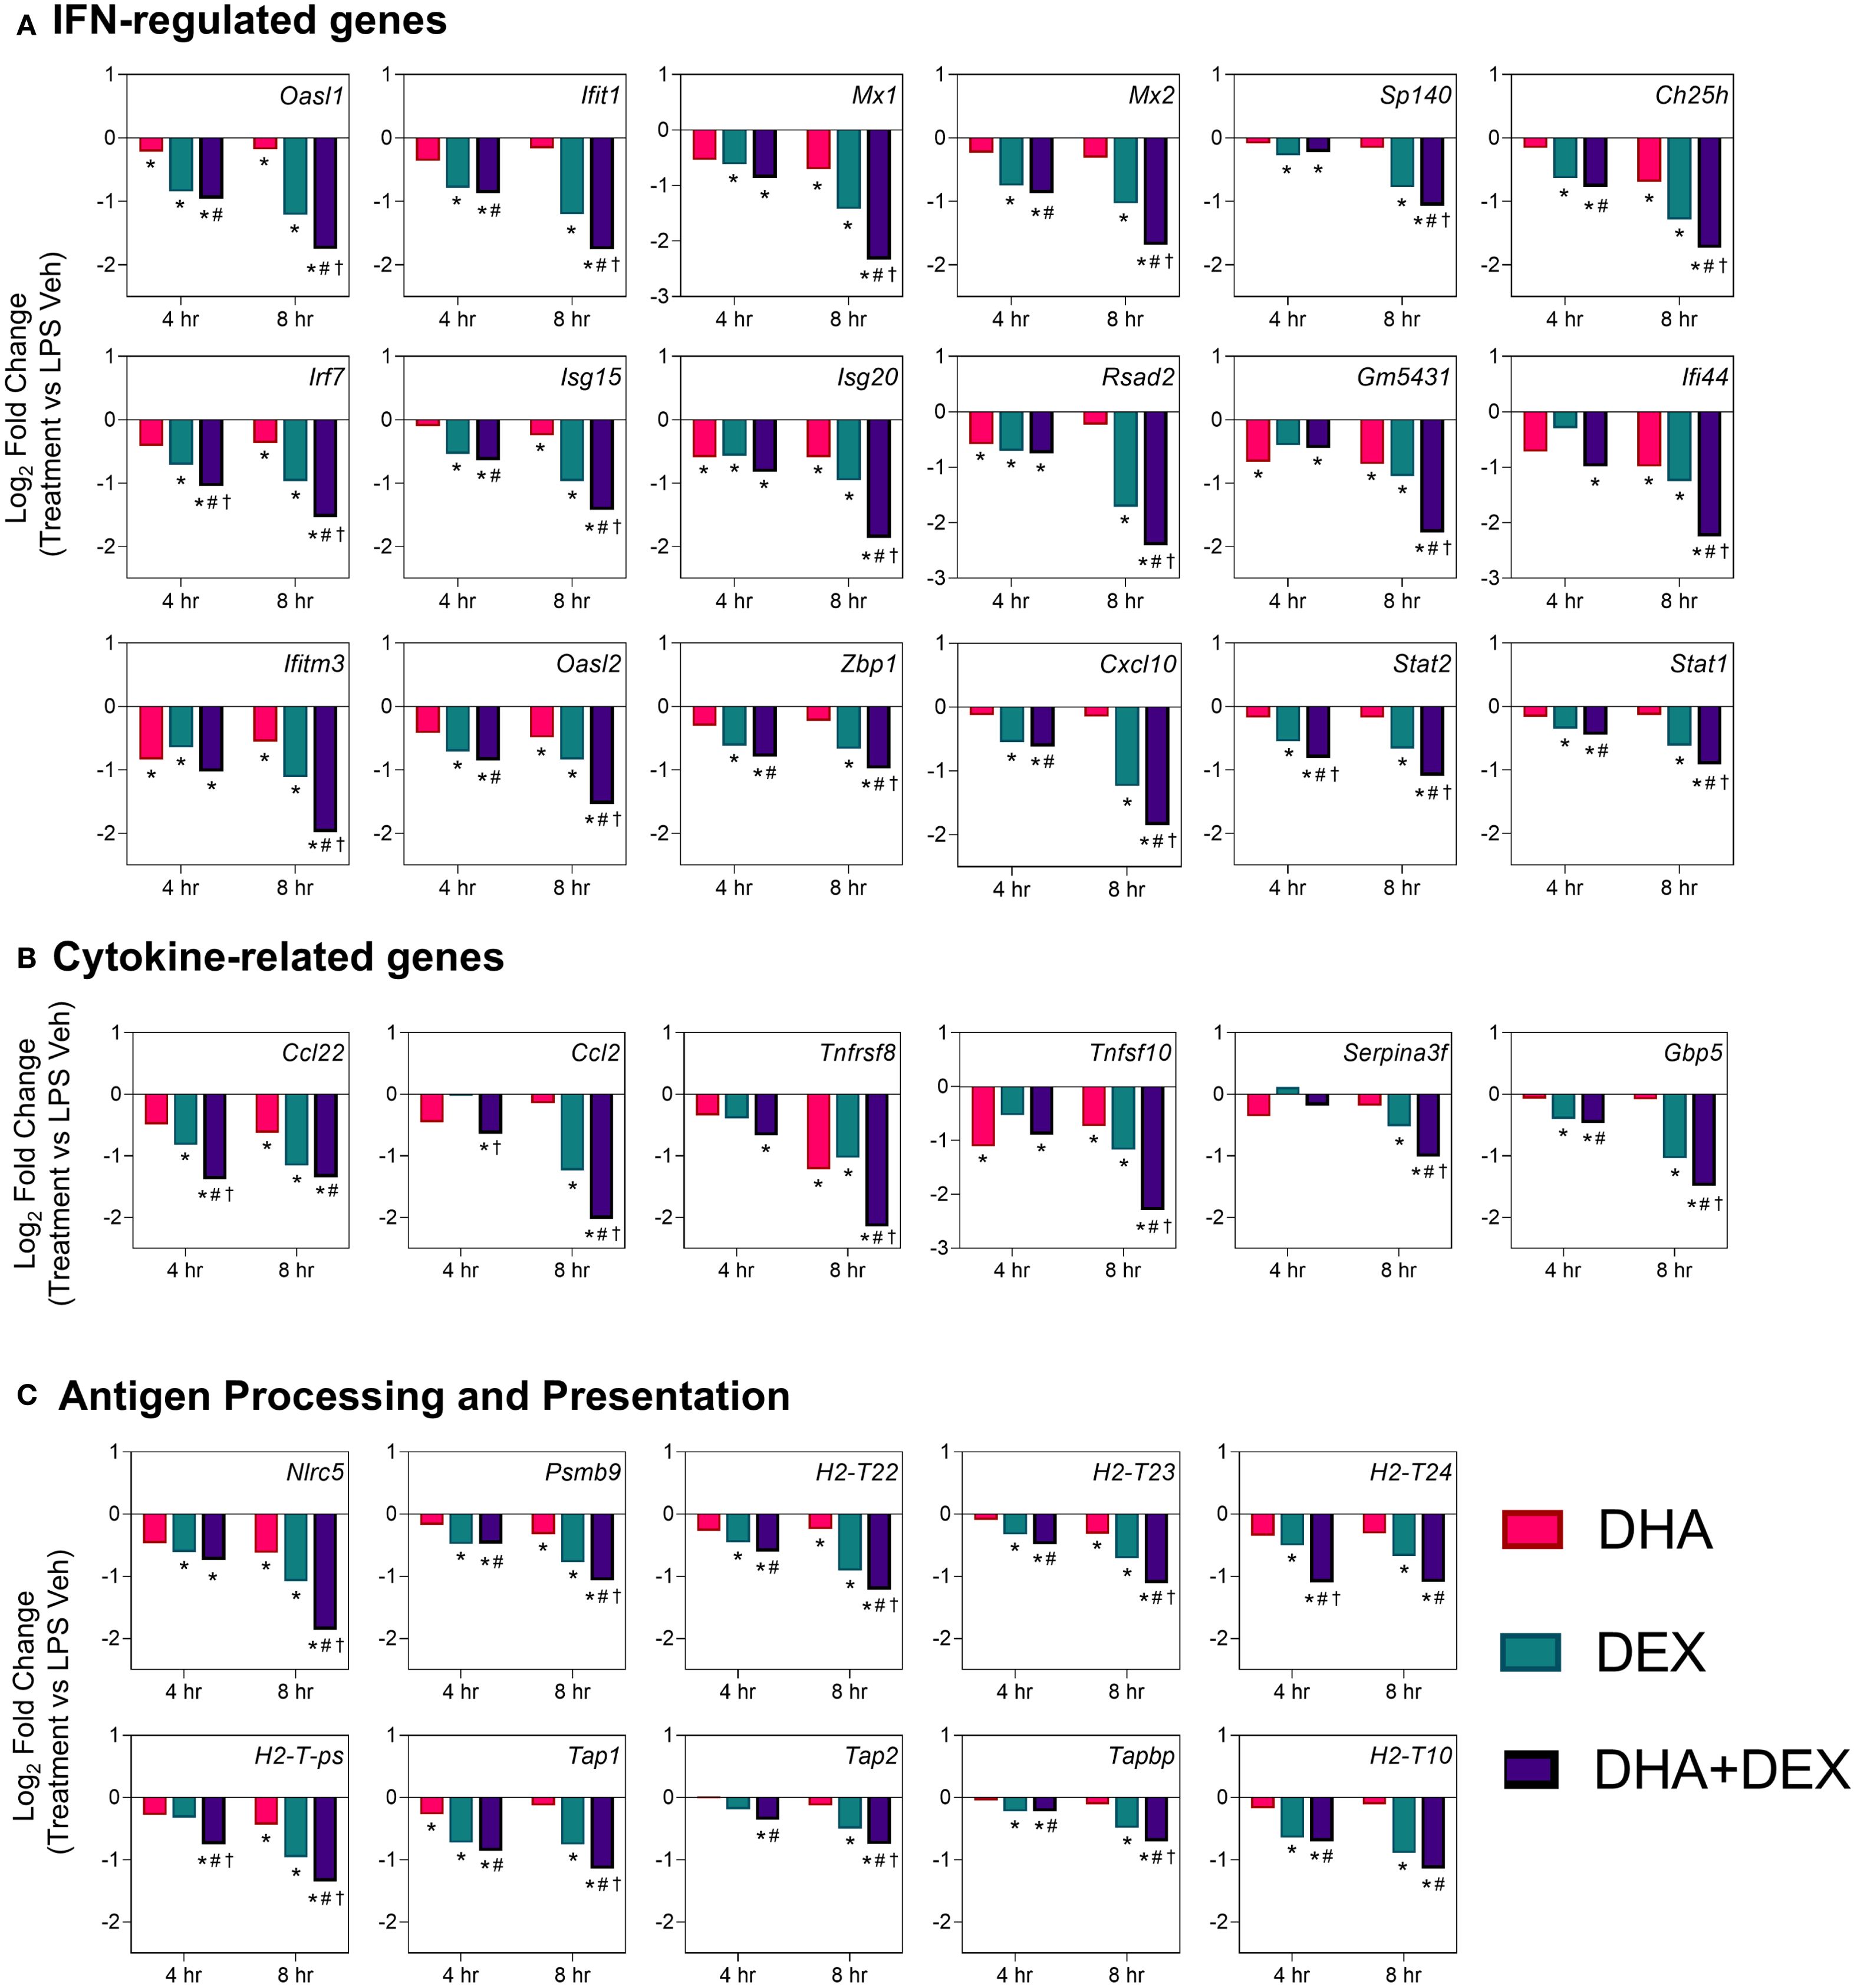
Figure 7. DHA+DEX combinatorial effects on suppression of innate immune response genes. Representative individual differentially expressed genes related to (A) type I IFNs, (B) cytokine signaling, and (C) antigen processing and presentation that exhibited combinatorial effects compared to individual DHA or DEX treatment were extracted from the RNA-seq dataset. Log2 fold change was determined relative to LPS/VEH. p<0.05; *Significant compared to LPS/VEH; #Significant compared to DHA monotherapy within respective time point; †Significant compared to DEX monotherapy within respective time point.
3.2.4 DHA, DEX, and DHA+DEX treatments impact transcriptional responses in LPS-primed FLAMs
The effects of DHA, DEX, and DHA+DEX treatment on LPS-induced DEGs and predicted TF activity regulation in LPS-primed cells are depicted in Figures 8–10. DHA treatment alone led to the upregulation of 5 DEGs at 4 hr and 13 DEGs at 8 hr with no overlapping DEGs, and the downregulation of 11 DEGs at 4 hr and 100 DEGs at 8 hr with 2 overlapping DEGs (Figure 8A). Treatment with DEX alone contributed to the upregulation of 21 DEGs at 4 hr and 41 DEGs at 8 hr, with 3 overlapping DEGs, and the downregulation of 18 DEGs at 4 hr and 110 DEGs at 8 hr, with 6 overlapping DEGs (Figure 9A). DHA+DEX combination treatment resulted in the upregulation of 112 DEGs at 4 hr and 48 DEGs at 8 hr, with 8 overlapping DEGs, and the downregulation of 75 DEGs at 4 hr and 239 DEGs at 8 hr, with 52 overlapping DEGs (Figure 10A).
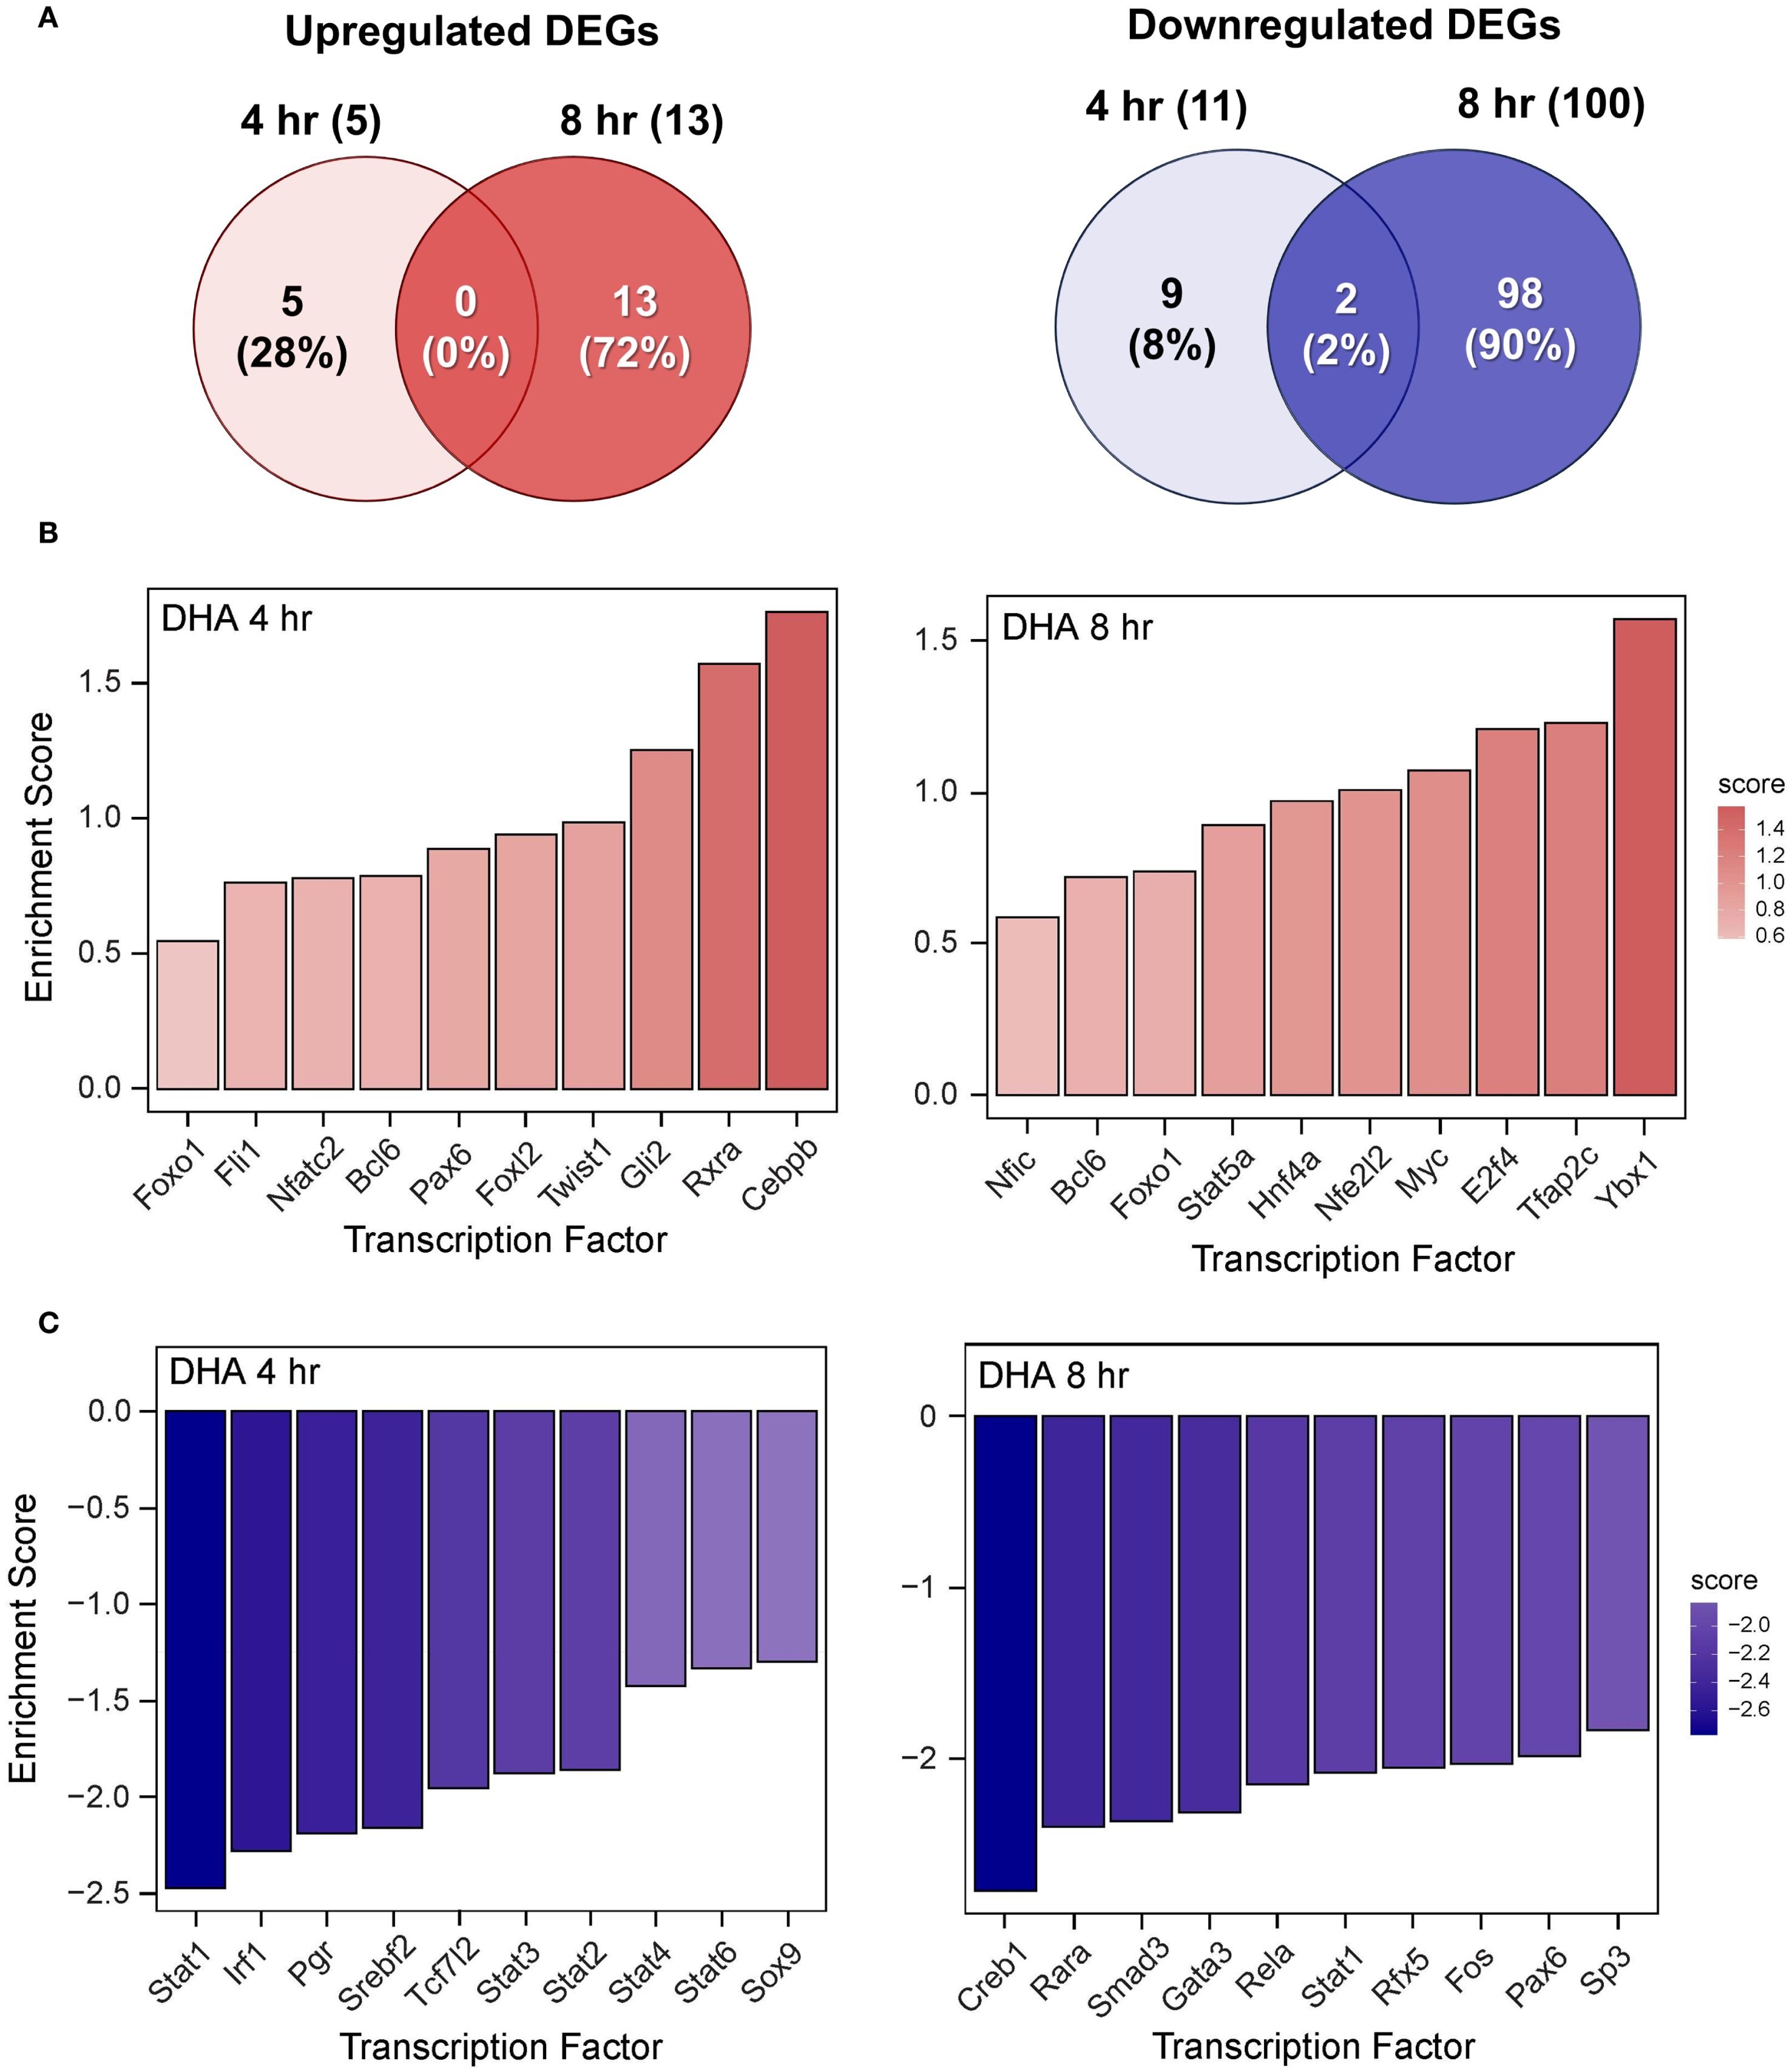
Figure 8. DHA monotherapy influences LPS-induced DEGs and transcription factor regulation. (A) Downregulated and upregulated differentially expressed genes (DEGs) were determined using DESeq2 (39), filtering for genes exhibiting a |log2 fold change| >= 2 and adjusted p-value <= 0.05 between the LPS/VEH group and VEH/CON group. Venn diagrams for downregulated DEGs are shown for the 4 hr time point (left circle), 8 hr time point (right circle), and both time points (intersection). The top 10 inferred (B) active and (C) inactive TFs following DHA treatment were identified at 4 hr and 8 hr using decoupleR (43).
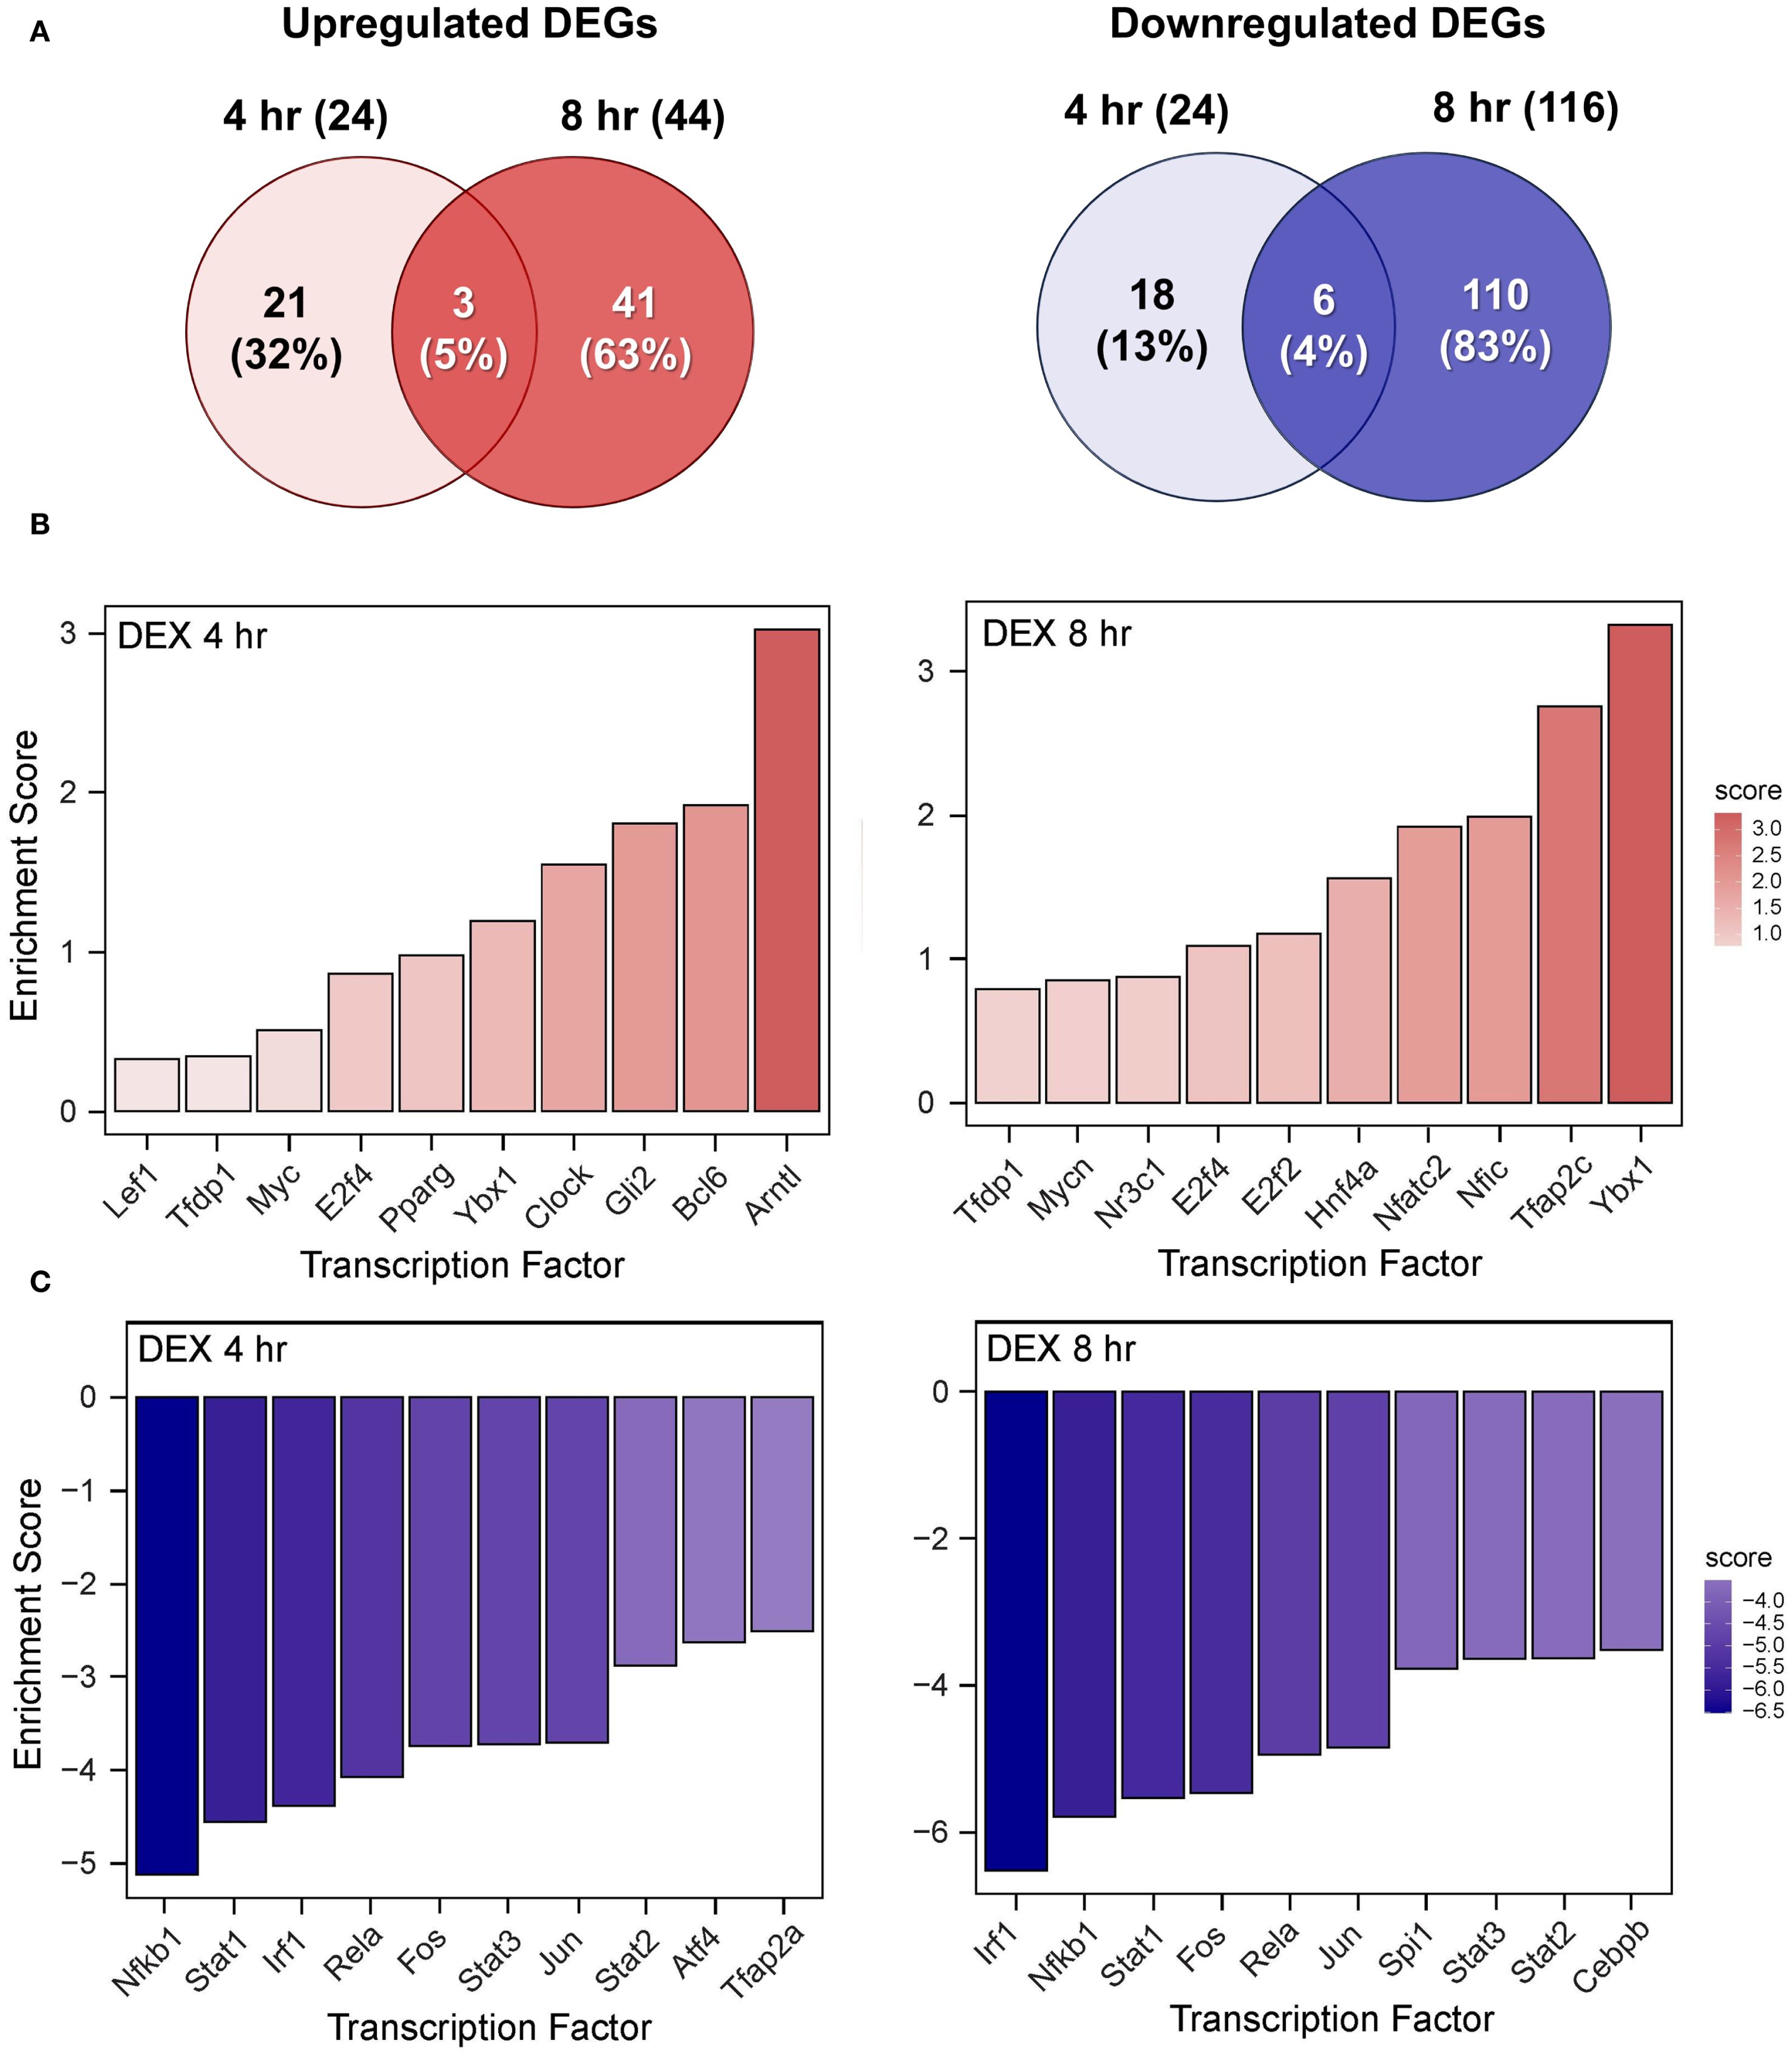
Figure 9. DEX monotherapy influences LPS-induced DEGs and transcription factor regulation. (A) Downregulated and upregulated differentially expressed genes (DEGs) were determined using DESeq2 (39), filtering for genes exhibiting a |log2 fold change| >= 2 and adjusted p-value <= 0.05 between the LPS/VEH group and VEH/CON group. Venn diagrams for downregulated DEGs are shown for the 4 hr time point (left circle), 8 hr time point (right circle), and both time points (intersection). The top 10 inferred (B) active and (C) inactive TFs following DHA treatment were identified at 4 hr and 8 hr using decoupleR (43).
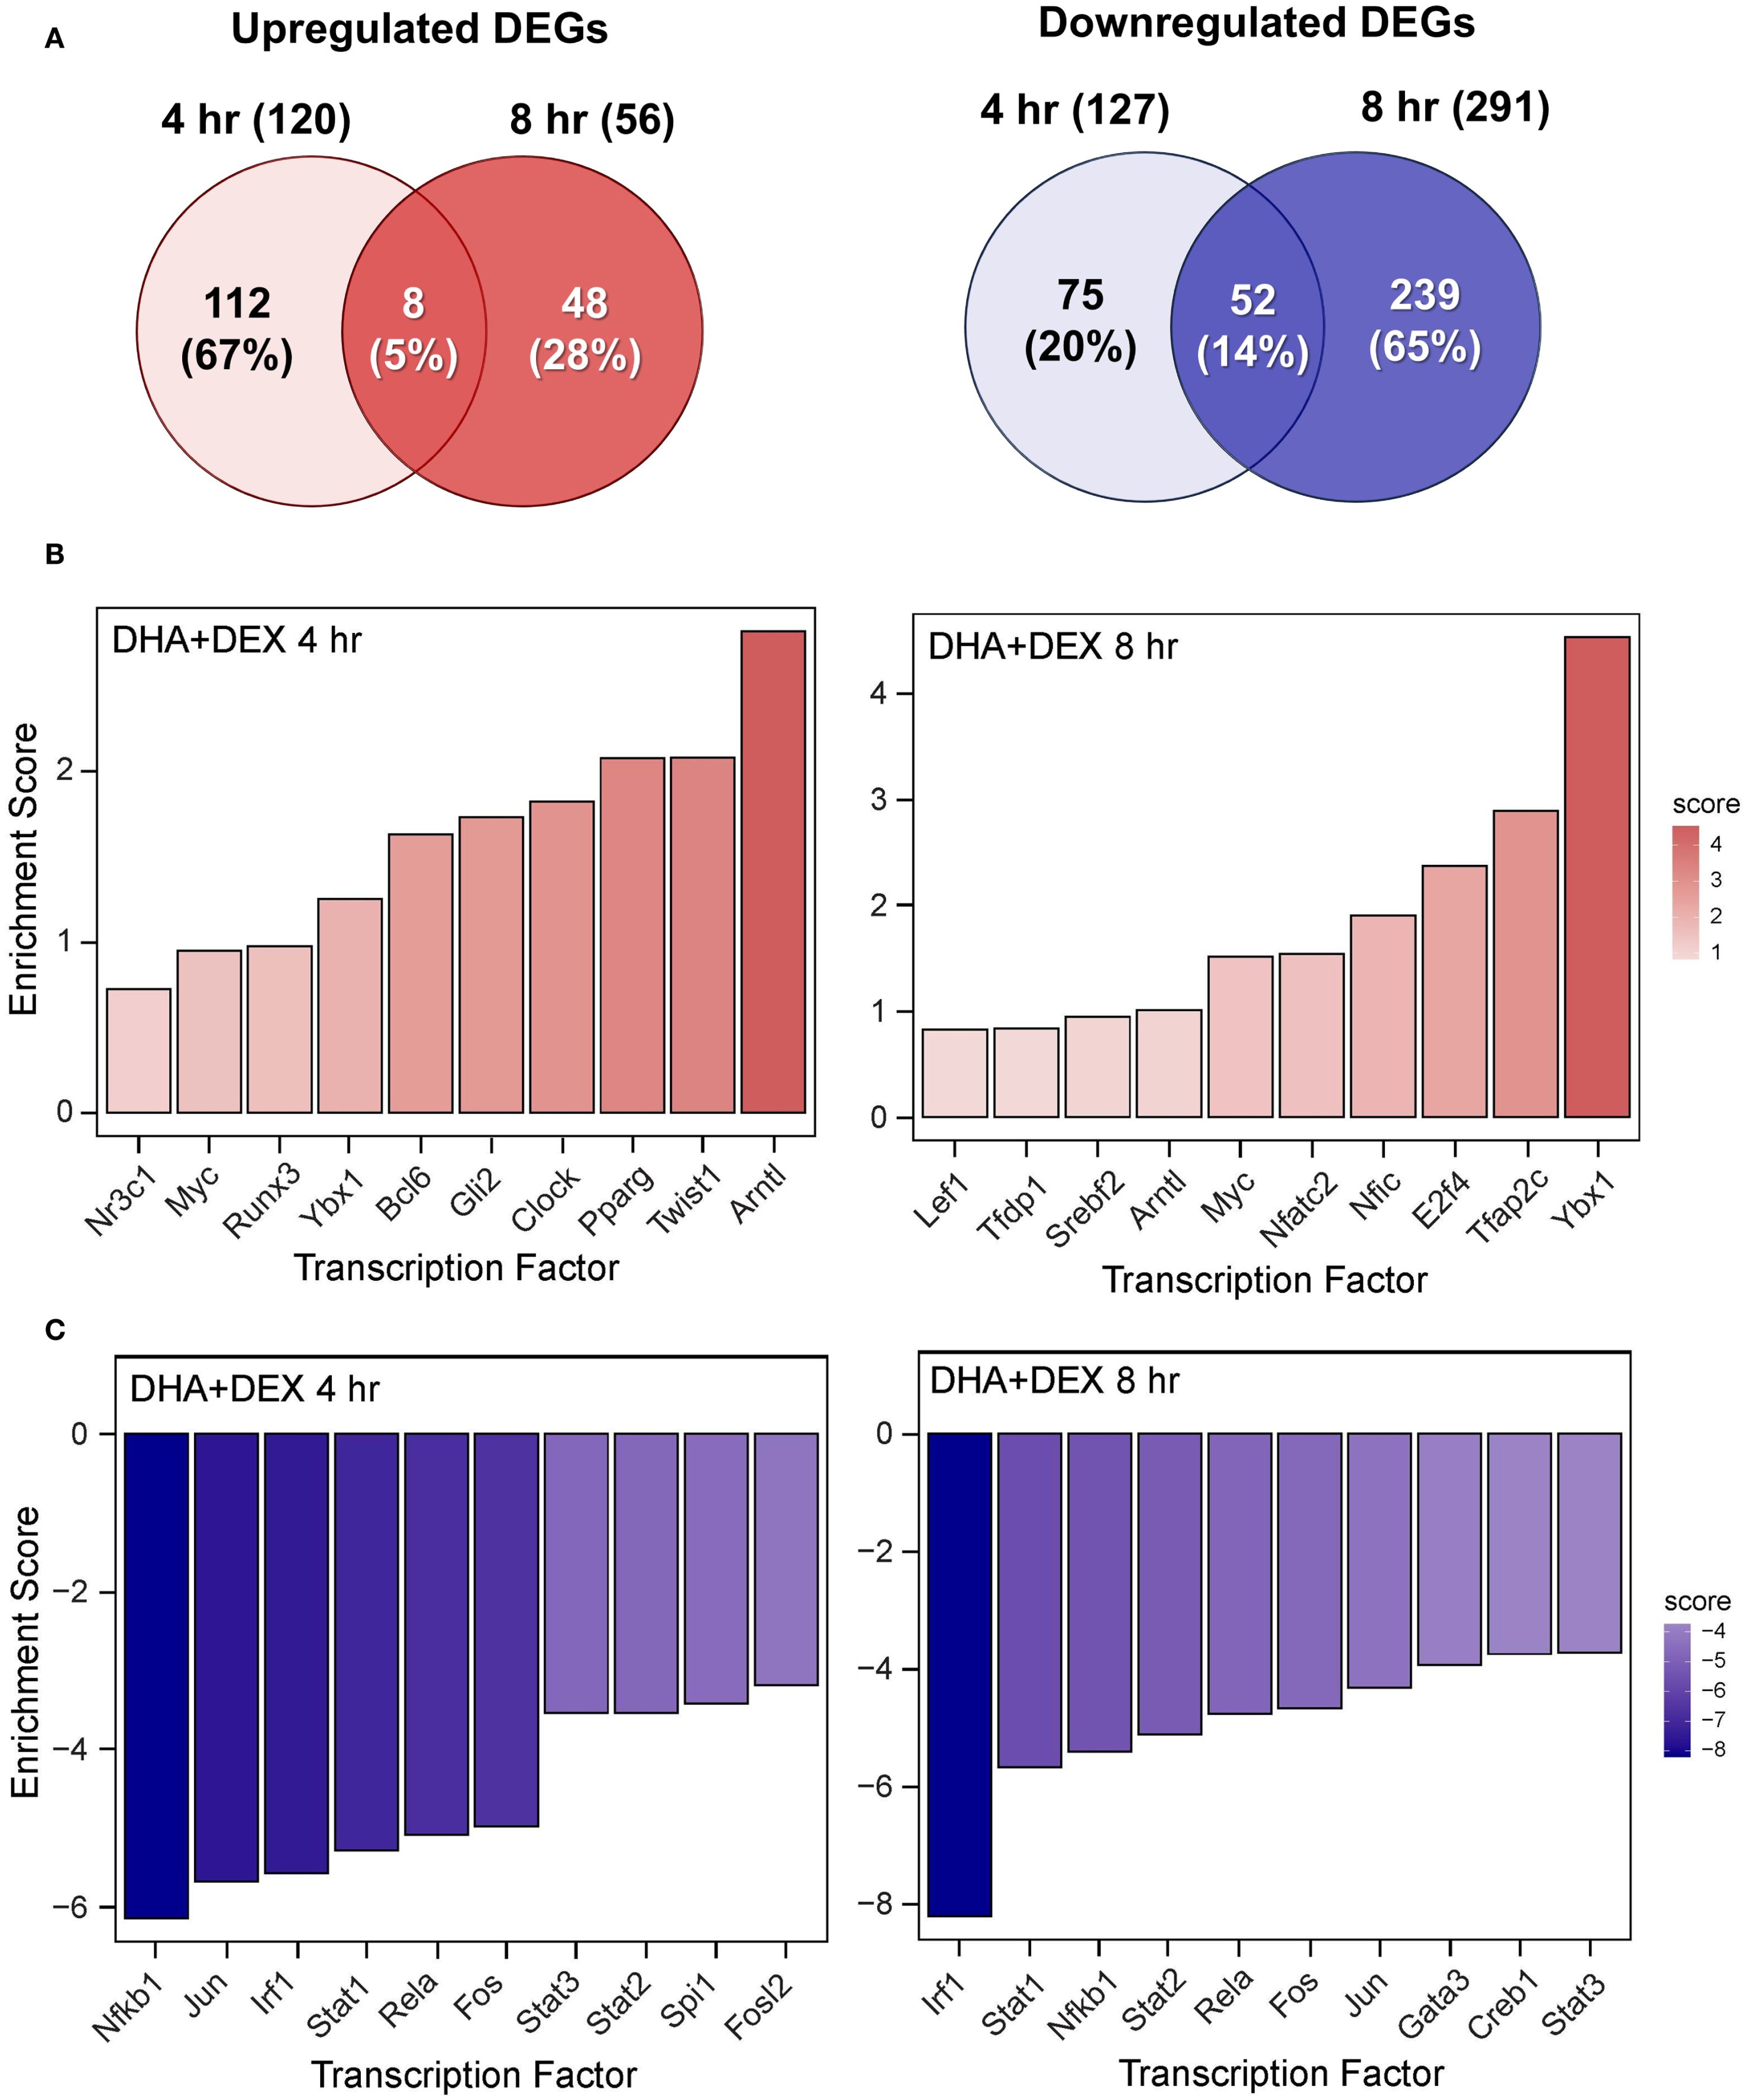
Figure 10. DHA+DEX cotreatment robustly modulates LPS-induced DEGs and transcription factor regulation. (A) Downregulated and upregulated differentially expressed genes (DEGs) were determined using DESeq2 (39), filtering for genes exhibiting a |log2 fold change| >= 2 and adjusted p-value <= 0.05 between the LPS/VEH group and VEH/CON group. Venn diagrams for downregulated DEGs are shown for the 4 hr time point (left circle), 8 hr time point (right circle), and both time points (intersection). The top 10 inferred (B) active and (C) inactive TFs following DHA+DEX cotreatment were identified at 4 hr and 8 hr using decoupleR (43).
DHA (Figure 8B), DEX (Figure 9B), and DHA+DEX (Figure 10B) treatments all resulted in positive enrichment of TFs that are involved with reducing inflammation (e.g., Ybx1) (48, 49), proliferation (e.g., Bcl6, E2f4) (50–53), differentiation and development (e.g., Myc, Gli2, Nfic) (54–58), and metabolism (e.g., Arntl) (59, 60). DEX and DHA+DEX treatment led to positive enrichment scores for Pparg, Nr3c1, and Clock, which are involved with fatty acid metabolism, GC signaling, and circadian rhythm regulation, respectively (21, 61, 62). DHA and DHA+DEX contributed to enrichment for Twist1, which is involved with reducing inflammation (63), while DHA alone selectively enriched for anti-inflammatory factors Cebpb, Rxra, Fli1, Nfe2l2, Stat5a, and Foxo1 (64–71) (Figure 8B).
DHA (Figure 8C), DEX (Figure 9C), and DHA+DEX (Figure 10C) treatments all led to negative enrichment of TFs that regulate proinflammatory cytokines (e.g., Rel, Fos) and ISGs (e.g., Irf1, Stat1, Stat2, Stat3). DHA specifically contributed to the negative enrichment of factors that were not affected by DEX, including Pgr, Srebf2, Tcf7l2, Sox9, Creb1, Rarα, Smad3, Gata3, Rfx5, Pax6, and Sp3 (Figure 8C). DEX and DHA+DEX treatment resulted in significant negative enrichment of Nfkb1 and Jun, which are components of the NF-κB and AP-1 heterodimers, respectively (Figures 9C, 10C).
4 Discussion
4.1 Synopsis
Macrophages orchestrate immune responses through gene expression finely tuned by a complex interplay of TFs to balance inflammation, antimicrobial defense, and resolution. Dysregulation of these pathways can contribute to SLE onset and drive pathogenesis, underscoring the importance of macrophages as therapeutic targets in SLE management. While cellular and molecular mechanisms of GC and O3FA treatments have been individually studied for their anti-inflammatory effects on macrophages (13, 31, 72–74), the combined impact of these treatments on transcriptional networks remains unexplored. Here, we hypothesized that O3FAs could be used as adjuncts to reduce GC dosages needed to suppress proinflammatory and type I IFN responses in lupus macrophages. We addressed this question by determining how cotreatment with DEX and DHA modulates critical regulatory hubs and the transcriptional landscape in LPS-stimulated NZBWF1 FLAMs. Following LPS stimulation, FLAMs derived from NZBWF1 mice demonstrated more robust type I IFN responses relative to FLAMs derived from C57BL/6 mice, which do not develop lupus, indicating their suitability as an experimental model for evaluating therapeutic strategies targeting hyperinflammatory macrophages in SLE. Our findings, as summarized in Figure 11, support the conclusion that DHA+DEX cotreatment synergistically quells LPS-induced changes in transcription and regulatory factor activities, markedly attenuating expression of IFN-stimulated and proinflammatory genes that contribute to SLE pathogenesis. The demonstrated synergy between O3FA and GC in lupus macrophages closely mirrors prior findings on the separate effects of these agents across TLR, NF-κB, AP-1, STAT, and IRF signaling axes. This synergy reveals novel crosstalk mechanisms between O3FAs and GCs, highlighting the potential therapeutic value of combining lipidomic and pharmacological approaches to combat SLE-associated inflammation.
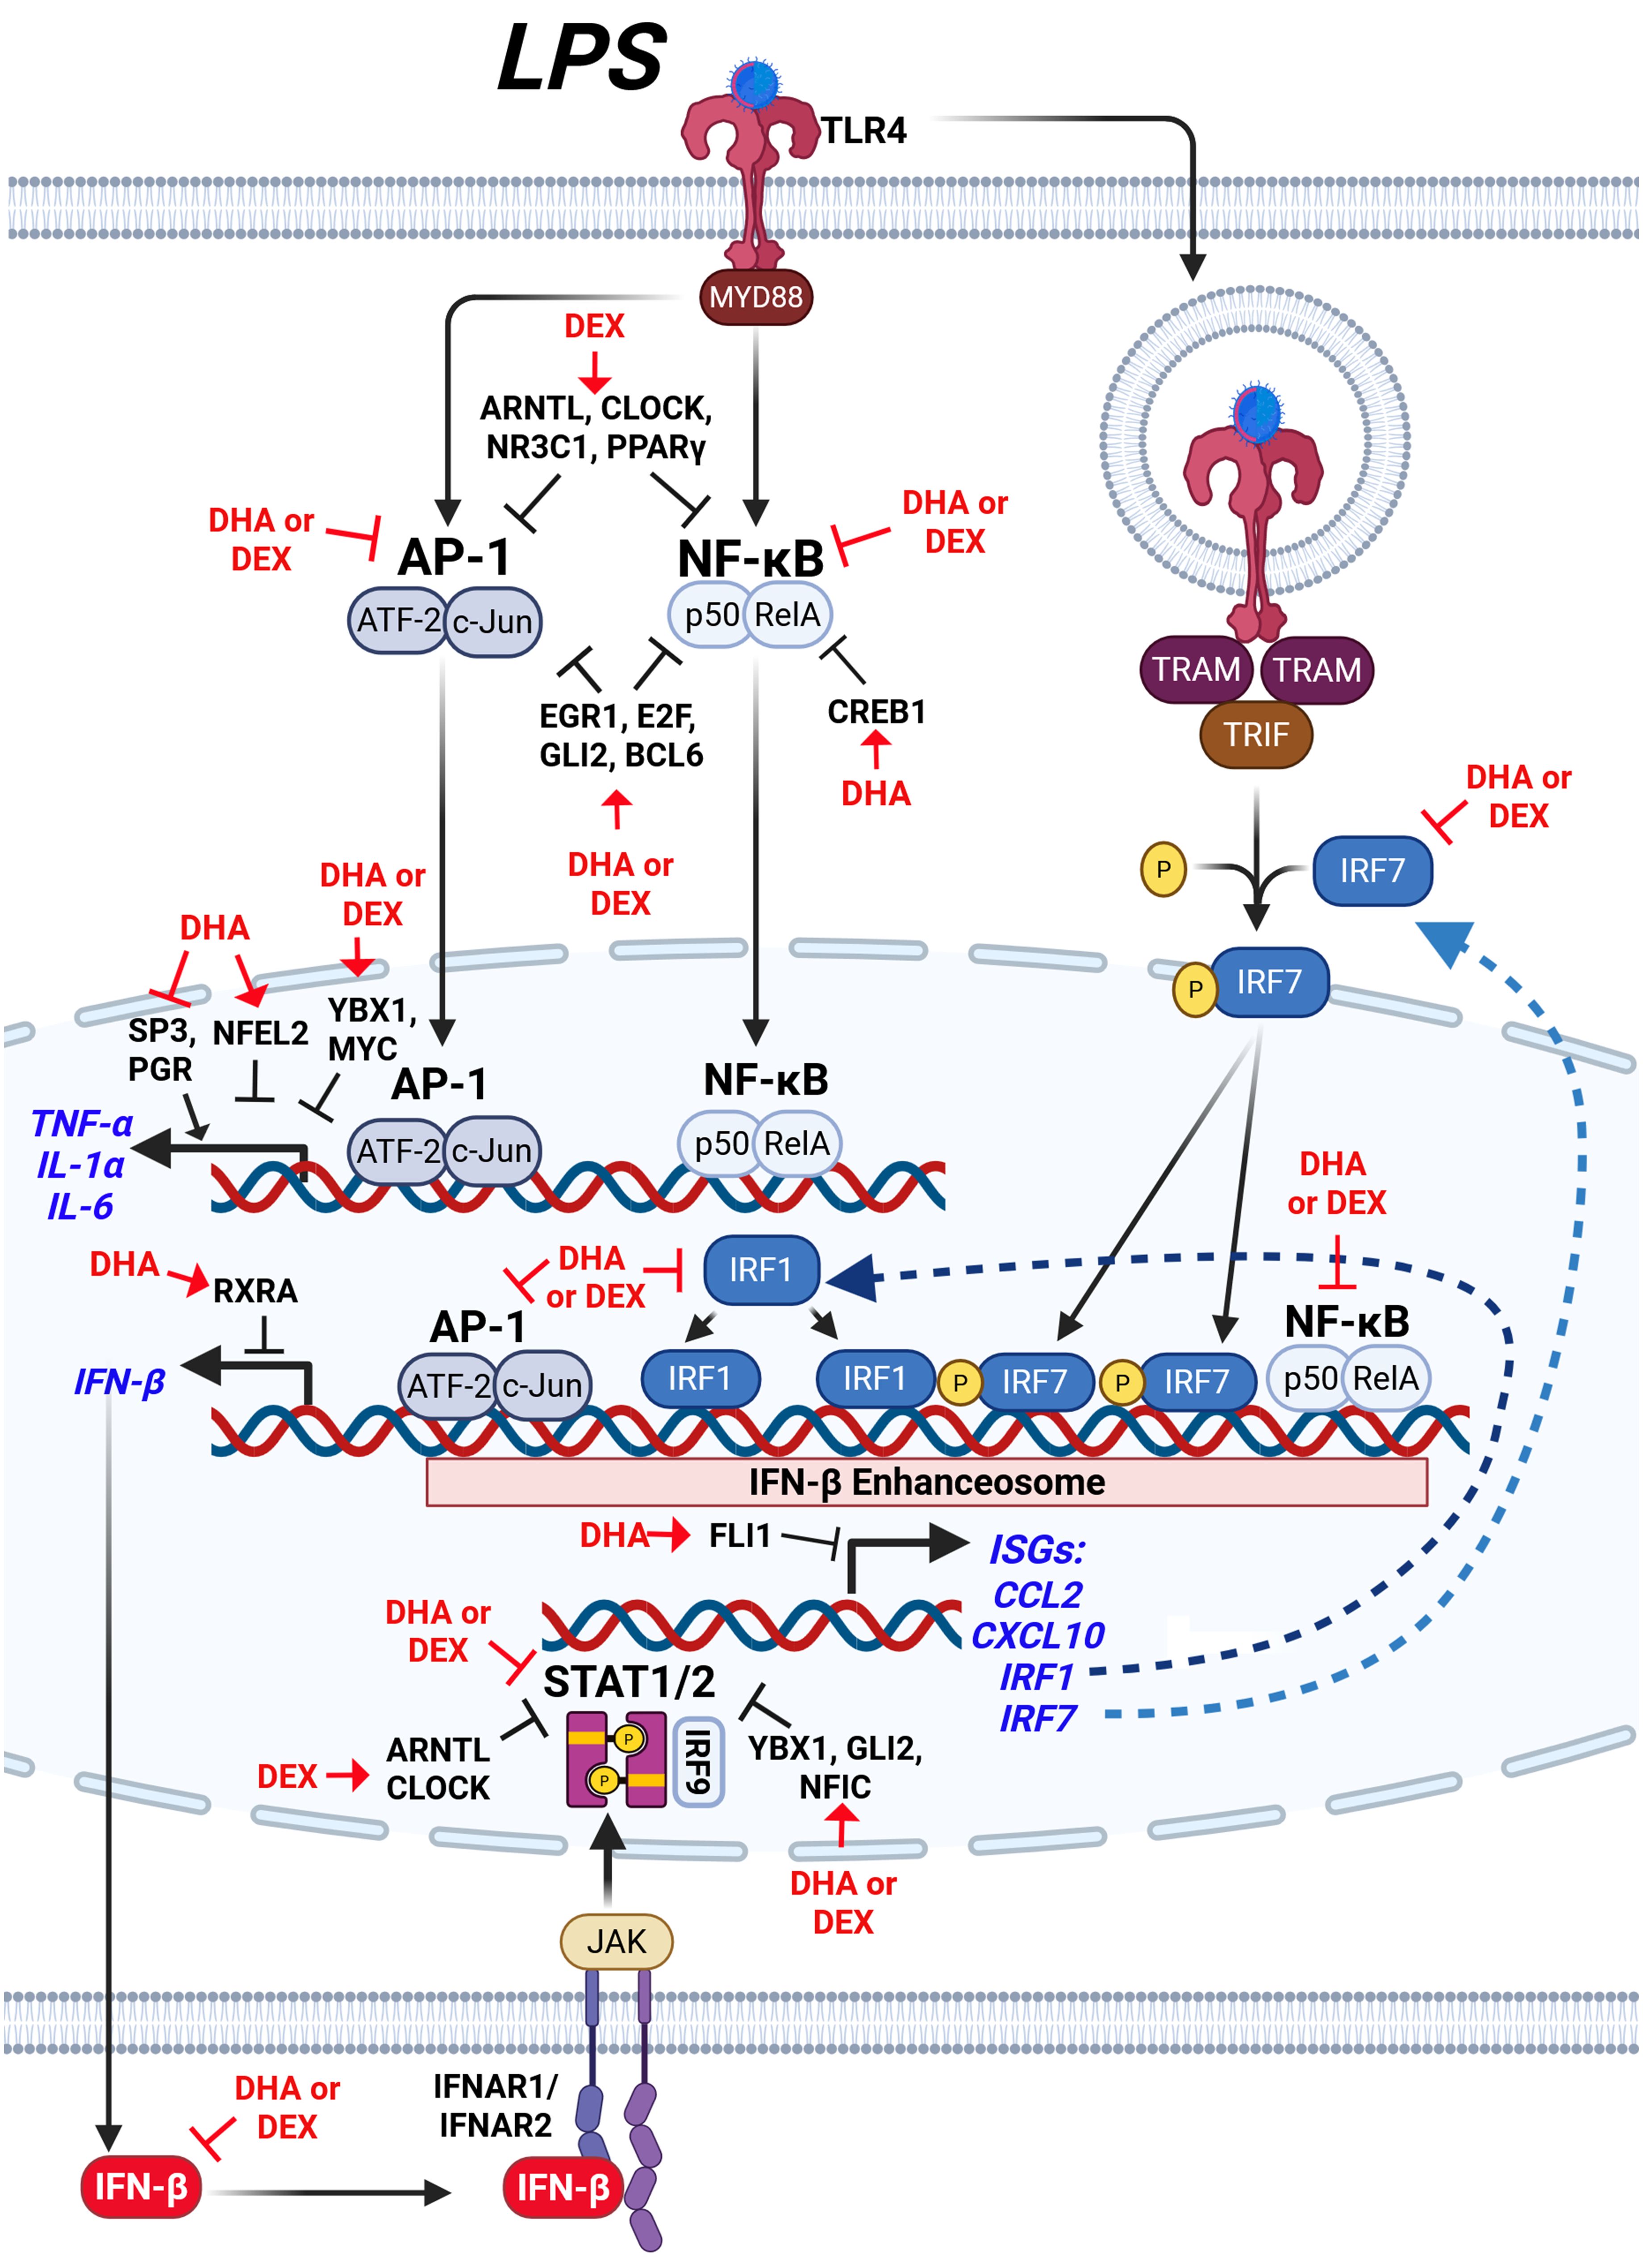
Figure 11. Hypothetical interplay between LPS-induced signaling pathways and the modulatory effects of DHA+DEX on type I IFN-regulated and proinflammatory gene expression. LPS stimulation activates toll-like receptor 4 (TLR4), initiating two major signaling pathways: 1) the MYD88-dependent pathway and 2) the TRIF-dependent pathway. The MYD88-dependent pathway leads to activation of the transcription factors (TFs) AP-1 (ATF-2/c-Jun) and NF-κB (p50/RelA), which induce expression of proinflammatory cytokines such as TNF-α, IL-1α, and IL-6, as well as IFN-β. Concurrently, the TRIF-dependent pathway phosphorylates IRF3/7, which forms a complex with NF-κB and AP-1, termed the IFN-β enhanceosome, to drive IFN-β production. IFN-β binds to its receptor (IFNAR1/IFNAR2), activating JAK/STAT signaling and inducing downstream ISGs such as CCL2, CXCL10, and IRF1. DHA combined with DEX suppresses the expression of inflammatory cytokines (TNF-α, IL-1α, IL-6) and IFN-β, as well as downstream genes regulated by STAT1/2, by inhibiting key IFN-β enhanceosome components. Symbols: →, increase activity; ┤, suppress activity. Created with BioRender.com.
4.2 O3FA and GC individually modulate regulation of proinflammatory gene expression: prior studies
O3FA and GC synergy is highly consistent with previous investigations of the individual effects of these agents on TLRs, NF-κB, AP-1, STATs, and IRFs. O3FAs, notably DHA, disrupt TLR signaling through biophysical and structural mechanisms. DHA’s highly unsaturated conformation prevents stable interaction with MD2, a co-receptor for TLR4, effectively blocking TLR4 dimerization and downstream NF-κB activation (75). Beyond direct receptor interference, DHA increases membrane fluidity by incorporating phospholipid bilayers, which disperses lipid raft microdomains critical for TLR4 colocalization with CD14 (76). These biophysical effects impair receptor clustering and signaling amplification, highlighting a dual mechanism of action via direct structural inhibition and indirect membrane remodeling. GC treatment can significantly reduce expression levels of TLR4 and MyD88 in monocytes (77). GCs also induce the expression of mitogen-activated protein kinase phosphatase-1 (MKP-1), which inhibits p38 MAPK activation downstream of TLR4, dampening cytokine production in macrophages (78). Additionally, GCs regulate TLR signaling through microRNA-mediated mechanisms, such as increasing miR-511-5p expression, which directly targets TLR4 to inhibit the production of proinflammatory cytokines (79).
O3FA suppression of NF-κB is mediated through interference with both canonical and non-canonical inflammatory pathways. DHA and EPA competitively inhibit arachidonic acid metabolism, reducing proinflammatory prostaglandin E2 and leukotriene B4 production, which are known to enhance NF-κB activity (80). Oxidized metabolites of O3FAs, such as 18-HEPE and 17-HDHA, exhibit enhanced potency by activating PPARα, which sequesters NF-κB coactivators and promotes its nuclear export (81, 82). O3FAs also directly inhibit IκB kinase (IKK) phosphorylation, preventing IκB degradation and NF-κB nuclear translocation in macrophages (83). GC interference with NF-κB signaling is multifaceted and central to its anti-inflammatory effects. GCs induce the synthesis of IκBα, which sequesters NF-κB in inactive cytoplasmic complexes, preventing its nuclear translocation and transcriptional activity (84). The GC receptor (GR) physically associates with the p65 subunit of NF-κB, disrupting its DNA-binding and transcriptional activation capabilities (55). GCs also induce the expression of GC-induced leucine zipper (GILZ), which binds to the transactivation domain of activated NF-κB p65, further inhibiting its activity (85).
O3FAs attenuate AP-1 signaling by targeting MAPK cascades. In murine macrophages, O3FAs suppress p44/42 and JNK/SAPK phosphorylation—steps preceding AP-1 activation—which leads to reduced AP-1 activity and subsequent downregulation of proinflammatory cytokine genes in macrophages, confirming transcriptional-level anti-inflammatory effects (86). EPA suppresses phosphorylation of p38 MAPK and JNK/SAPK in human monocytic THP-1 cells, reducing c-Fos/c-Jun heterodimer formation and AP-1 DNA-binding activity (87). O3FA inhibition of AP-1 may be linked to the upregulation of MAPK phosphatase-1 (MKP-1), which dephosphorylates and inactivates JNK (88). GC-mediated suppression of AP-1 signaling occurs through several mechanisms. GRs physically interact with c-Jun and c-Fos, components of AP-1, inhibiting their transcriptional activity without requiring GR binding to DNA (89, 90). GCs also inhibit the phosphorylation and activation of JNK, thereby reducing AP-1 activity (91, 92). The induction of MAPK phosphatase-1 (MKP-1) by GR activation further suppresses AP-1 activity by dephosphorylating and inactivating JNK (93).
O3FAs attenuate STAT activation. We have previously found that DHA inhibits the expression of STAT1/STAT2-target genes in LPS-treated macrophages (31). RvD2, a pro-resolving metabolite of DHA, suppresses phosphorylation of STAT1 in bone marrow-derived macrophages (94). DHA and its metabolites also inhibit STAT3 phosphorylation in cancer cells (95–98). GCs primarily inhibit STAT1 through the induction of SOCS1, which inhibits STAT1 activation by degrading phosphorylated JAK2 (74). Furthermore, GCs suppress TLR-mediated STAT1 phosphorylation at Ser727 and Tyr701 during later phases of activation, impairing its nuclear translocation and transcriptional activity. Recruitment of GR to DNA-bound STAT3 is associated with trans-repression or transcriptional antagonism (99).
O3FAs indirectly regulate IRFs and IFNAR signaling by inhibiting ISG expression in LPS-treated macrophages (31). DHA also attenuates IFNAR signaling by reducing STAT1 phosphorylation, thereby blunting IFN-driven inflammatory gene expression (100). Meanwhile, GCs have been shown to interfere with IRF signaling by suppressing STAT1 mRNA transcription, leading to reduced activation of IRF-dependent pathways and diminished IFN-inducible gene expression, particularly in macrophages (101). DEX inhibits IRF3 phosphorylation and nuclear translocation in macrophages by suppressing TBK1, a kinase crucial for IRF3 activation (102). The GC receptor sequesters GRIP1, a coactivator for IRF3 and IRF9, preventing their transcriptional activity and disrupting the activation of ISGs (72). GCs antagonize the co-recruitment of IRF3 and NF-κB subunit p65 to ISRE-containing promoters, thereby reducing ISG transcription (72). GCs interfere with IFN receptor signaling by inhibiting the assembly of the STAT1-STAT2-IRF9 (ISGF3) transcription complex, essential for type I IFN signaling, and also prevent the nuclear translocation of IRF9, a critical step for triggering IFN-responsive gene expression (103). Furthermore, GCs block IFN-induced IRF1 mRNA levels, disrupting transcriptional activation of interferon-responsive genes regulated by IRF elements in the GC receptor promoter region (104). These findings suggest a strong synergistic potential between O3FAs and GCs that are amenable to in vitro and in vivo investigations.
4.3 DHA+DEX co-therapy influences LPS-triggered pathway crosstalk in NZBWF1 FLAMS
Figure 11 illustrates how DHA+DEX co-therapy hypothetically impacts LPS activation targets in NZBWF1 FLAMs as revealed by deconvolution analysis. These agents appeared to act on LPS-induced activation of both MyD88-dependent and TRIF-dependent pathways to drive M1 macrophage polarization (105). The MyD88 pathway triggers IκBα degradation via IKK, enabling NF-κB subunits (e.g., NFKB1, REL) to translocate to the nucleus (106), while parallel MAPK activation phosphorylates AP-1 components (e.g., JUN, FOS) (107). These TFs collaborate with coactivators like p300 to remodel chromatin, initiating robust transcription of proinflammatory cytokines such as TNF-α, IL-6, and IL-1β (106). Simultaneously, the TRIF pathway phosphorylates IRF7, which synergizes with NF-κB and AP-1 at the IFN-β enhanceosome. This multi-protein complex recruits p300/CBP to stabilize enhancer assembly and drive IFN-β production (105, 108). Resultant IFN-β activates the expression of ISGs, including IRF1, via the JAK/STAT/IRF9 pathway. Although baseline IRF1 levels are constitutively low in resting macrophages, it integrates into the enhanceosome complex when induced, binding regulatory elements to potentiate IFN-β and ISG transcription (109). These actions constitute an autocrine/paracrine loop where IFN-β reinforces its production, enhancing antiviral responses and solidifying M1 polarization through sustained enhancer activity. Altogether, DHA+DEX suppressed this cooperative interplay between NF-κB, AP-1, and IRFs at the enhanceosome.
In complementary fashion, DHA+DEX co-therapy inhibits LPS-induced suppression of multiple transcriptional and post-transcriptional regulators such as EGR1, YBX1, E2F, GLI2, MYC/MYCN, and NFIC that form a collaborative network for suppressing macrophage inflammatory signaling. For example, EGR1, in association with the NuRD complex, drives chromatin compaction and decreases accessibility at inflammatory enhancers (110), while YBX1 exerts post-transcriptional control by binding to and silencing inflammatory gene mRNAs (48, 49). This dual-layer repression system may be especially critical for maintaining stringent control over key cytokine loci, as disruption of either EGR1 or YBX1 only partially restores inflammatory responses in experimental models (54, 56). The inhibition of GLI2 and E2F family members adds additional redundancy, with GLI2 attenuating NF-κB through Hedgehog signaling and E2F proteins modulating NF-κB dynamics and competing with AP-1 at shared promoters (50, 57). Meanwhile, MYC’s role in driving glycolytic flux and stabilizing IRF4 introduces a metabolic checkpoint that intersects with NFIC’s transcriptional regulation of PTEN and SENP8, which together serve to reduce oxidative stress and further dampen immune activation.
In addition to these LPS-sensitive regulators, DHA+DEX also enriched suppressive TF activities that were not markedly affected by LPS, including BCL6, NFATC2, and HNF4A. BCL6 acts as a transcriptional repressor to suppress NF-κB-driven proinflammatory genes (e.g., IL-6, Ccl2) and restrain type I IFN signaling (52, 111). At the same time, NFATC2 integrates calcium signaling, TLR4 activation, and interferon pathways to regulate macrophage immunity (112). HNF4A promotes M2 macrophage polarization via the NCOA2/GR/STAB1 axis and attenuates acute-phase gene expression, with its activation linked to improved outcomes in models of sepsis (113). The shared enrichment of these factors by DHA and DEX suggests that these therapies reinforce multiple layers of anti-inflammatory control, potentially providing a broader and more robust defense against excessive immune activation.
4.4 DHA monotherapy selectively modulates other regulators
DHA alone positively enriched regulatory TFs that promote anti-inflammatory and reparative functions, including NFE2L2, CEBPB, RXRA, TWIST1, STAT5A, FLI1, and FOXO1. These TFs play essential roles in resolving inflammation and maintaining macrophage homeostasis. NFE2L2 interferes with LPS-induced transcriptional upregulation of proinflammatory cytokines, including IL-6 and IL-1β, in macrophages by binding to the proximity of these genes and inhibiting RNA polymerase II recruitment (114). CEBPB is essential for M2 macrophage polarization, driving anti-inflammatory genes like Arg1 and IL-10 via CREB-mediated induction, which is critical for resolving tissue damage (65). RXRα (retinoid X receptor α) plays a significant role in modulating the host’s antiviral response by regulating the production of type I IFNs, particularly IFN-β (66, 115). RXRA also contributes to anti-inflammatory effects by modulating nuclear receptor-mediated gene expression networks. STAT5A activation promotes M2 macrophage polarization, favoring tissue repair and the production of anti-inflammatory cytokines (64). TWIST1 induces M2 macrophage polarization by upregulating profibrotic factors (ARG-1, CD206, IL-10, TGF-β) through direct activation of galectin-3 transcription, enhancing M2 phenotypic plasticity (63). FLI1 loss has been linked to increased IFN-regulated expression (116). FOXO1 activity is associated with both the M1 and M2 phenotypes, suggesting a more complex role in regulating macrophage polarization (68).
DHA monotherapy also uniquely negatively enriched the activity of other proinflammatory regulators, including SP3, PGR, and RFX5. SP3 plays a critical role in promoting proinflammatory macrophage activation (M1 phenotype) by driving NF-κB-mediated transcription activation. When SP3 activity is diminished, macrophages exhibit decreased expression of M1-associated proinflammatory genes, such as Nos2, Tnfa, Il1b, and Il6, and increased expression of M2-associated anti-inflammatory markers like Arg1 and Retnla. PGR, the progesterone receptor, modulates macrophage function through its activation. Stimulation of membrane-bound PGRs increases the transcription of proinflammatory genes such as Il1b, Tnfa, and Nos2 (117), suggesting that decreased PGR activity likely suppresses these proinflammatory responses, reducing the production of inflammatory cytokines. RFX5 regulates MHC class II expression and macrophage antigen presentation (118, 119). Reduced activity of RFX5 could impair antigen presentation capacity and potentially alter cytokine signaling pathways, indirectly influencing inflammatory responses. Collectively, the suppression of these TFs by DHA likely shifts macrophage activity away from a proinflammatory phenotype.
Interestingly, DHA alone also reduced enrichment scores for suppressive factors like TCF7L2 at the 4-hr time point and CREB1, RARα, SMAD3, and GATA3 at the 8-hr time point. TCF7L2 modulates inflammatory cytokine expression in macrophages by promoting polarization toward the anti-inflammatory M2 phenotype, which suppresses proinflammatory cytokines like TNF-α and IL-6 (120). CREB1 (cAMP response element-binding protein 1) primarily suppresses proinflammatory cytokines like TNF-α and inhibits NF-κB signaling in macrophages, maintaining anti-inflammatory responses. Reduced CREB1 activity diminishes IL-10 production and decreases NF-κB suppression, amplifying proinflammatory gene transcription (121). RARα is known for its anti-inflammatory effects through modulating macrophage polarization and proinflammatory gene expression (122). SMAD3 promotes an anti-inflammatory macrophage phenotype via TGF-β signaling; its suppression increases proinflammatory cytokines such as IL-1β and TNF-α while reducing anti-inflammatory mediators like IL-10 (123). GATA3 promotes M2 differentiation and suppresses proinflammatory cytokines; reduced GATA3 activity can increase these cytokines and ISGs (124). Given their anti-inflammatory roles, decreased enrichment of these pro-resolving regulatory factors by DHA might reflect complex, time-dependent homeostatic control and suggest the need for further investigation.
4.5 Selective modulation of regulatory pathways by DEX monotherapy
DEX monotherapy also negatively enriched TFAP2A and ATF4, which likely dampened inflammatory pathways, as these factors regulate stress-responsive and cytokine genes (125, 126). Accordingly, DEX orchestrates a dual mechanism in macrophages by activating anti-inflammatory TFs while suppressing key proinflammatory regulators. This comprehensive modulation attenuates LPS-induced cytokine and IFN-regulated gene expression, thereby reprogramming macrophages toward an anti-inflammatory state.
DEX alone further selectively enriched for factors that promote resolution, including NR3C1, PPARγ, ARNTL, CLOCK, LEF1, and TFDP1. NR3C1 (glucocorticoid receptor, GR) directly inhibits proinflammatory TFs AP-1 and NF-κB, a key mechanism for suppressing inflammation (127). PPARγ reinforces these anti-inflammatory effects by inhibiting AP-1 and NF-κB, another mechanism that promotes the M2 phenotype (128). ARNTL (BMAL1) and CLOCK are circadian regulators that suppress LPS-induced proinflammatory genes (e.g., TNF-α, IL-6) in macrophages by competitively displacing NF-κB/AP-1 at enhancers and reducing H3K27ac histone acetylation, thereby limiting transcriptional activation (59, 60). ARNTL further antagonizes STAT1-mediated IFN-β signaling and stabilizes metabolic rhythms, while CLOCK reinforces these anti-inflammatory effects by curbing excessive enhancer remodeling. LEF1 expression is positively correlated with the M2 phenotype (129). Although the role of TFDP1 in inflammation remains unclear, its association with E2F factors suggests regulatory influence over immune response genes (53).
4.6 Limitations
Although we present herein compelling evidence for O3FA+GC synergy in inhibiting LPS-induced inflammation in SLE macrophages, we acknowledge that our study has limitations. First, our use of an in vitro LPS-activated NZBWF1 macrophage model, while mechanistically informative, does not capture the full complexity of human SLE, as it lacks multicellular interactions and the tissue-specific microenvironment present in an in vivo model. Also, the lack of non-lupus control in these studies limits the generalizability to other diseases. Second, our analysis was limited to early transcriptional responses (4–8 hr post-LPS treatment), creating uncertainty about whether the observed DHA and DEX synergy is sustained or subject to rebound effects during chronic inflammation. Third, although key transcriptional regulators were identified by functional enrichment, the precise molecular mechanisms underlying the observed synergy, such as direct receptor crosstalk, demonstration of altered TF activity, epigenetic changes, or metabolic reprogramming, remain uncharacterized. Finally, the efficacy and safety of low-dose DHA and DEX cotreatment have not yet been validated in preclinical SLE models or clinical settings, where factors such as bioavailability, off-target effects, and patient heterogeneity could significantly impact therapeutic outcomes. These limitations highlight the need for further mechanistic, longitudinal, and preclinical studies to advance this promising combinatorial approach toward clinical application.
5 Conclusions
Our data reveal that low-dose DHA powerfully boosts the anti-inflammatory potency of DEX in SLE-modeled macrophages, synergistically suppressing LPS-driven hyperinflammation by up to 100-fold through coordinated targeting of both shared and unique transcriptional nodes. This cooperative effect not only dampens central proinflammatory signaling via NF-κB and STAT pathways but also activates resolution-promoting factors (such as TWIST1, BCL6) and drives macrophage metabolism toward a reparative, M2-like phenotype. Mechanistically, the DHA+DEX regimen appears to orchestrate a multifaceted network of transcriptional and lipid mediators—engaging context-dependent, overlapping regulators rather than acting through a single dominant pathway. The resultant working hypothetical model shown in Figure 11 provides a basis for further mechanistic studies, leveraging time-resolved transcriptomics, transcription factor analysis, and lipid mediator profiling, combined with CRISPR-mediated knockout approaches in our self-renewing SLE macrophage model and relevant control macrophages. Collectively, these studies should facilitate the dissection of hierarchy and interplay of these key effectors and resolve which nodes exert dominant control in vivo. Based on the findings shown in our present study, DHA might synergistically work with DEX to suppress inflammatory pathways in contexts outside of lupus treatment such as rheumatoid arthritis and asthma. Ultimately, by enabling potent steroid efficacy at markedly reduced doses, this O3FA–GC co-therapy strategy offers a mechanistically informed avenue to recalibrate macrophage responses, minimize glucocorticoid toxicity, and improve therapeutic outcomes for autoimmune hyperinflammation.
Data availability statement
The datasets presented in this study can be found in online repositories. The names of the repository/repositories and accession number(s) can be found below: https://www.ncbi.nlm.nih.gov/geo/, GSE298247.
Ethics statement
The animal study was approved by Michigan State University Institutional Animal Care and Committee (AUF# 201800113). The study was conducted in accordance with the local legislation and institutional requirements.
Author contributions
LH: Conceptualization, Data curation, Formal analysis, Investigation, Project administration, Visualization, Writing – original draft, Writing – review & editing. RN: Data curation, Formal analysis, Visualization, Writing – review & editing. JJ: Investigation, Writing – review & editing. AA: Conceptualization, Writing – review & editing. JH: Conceptualization, Funding acquisition, Writing – review & editing. AO: Conceptualization, Funding acquisition, Writing – review & editing. JP: Conceptualization, Funding acquisition, Project administration, Supervision, Writing – original draft, Writing – review & editing. OM: Formal analysis, Investigation, Software, Visualization, Writing – original draft, Writing – review & editing.
Funding
The author(s) declare financial support was received for the research and/or publication of this article. This research was funded by NIH T32ES007255 (LH), NIH ES027353 (JP, AO), NIH R35GM146795 (AO), Lupus Foundation of America (JP), and Dr. Robert and Carol Deibel Family Endowment (JP).
Acknowledgments
The authors thank the Michigan State University Genomics Core Facility for their expertise and assistance with sequencing all RNA-seq samples.
Conflict of interest
The authors declare that the research was conducted in the absence of any commercial or financial relationships that could be construed as a potential conflict of interest.
The author(s) declared that they were an editorial board member of Frontiers, at the time of submission. This had no impact on the peer review process and the final decision.
Generative AI statement
The author(s) declare that no Generative AI was used in the creation of this manuscript.
Any alternative text (alt text) provided alongside figures in this article has been generated by Frontiers with the support of artificial intelligence and reasonable efforts have been made to ensure accuracy, including review by the authors wherever possible. If you identify any issues, please contact us.
Publisher’s note
All claims expressed in this article are solely those of the authors and do not necessarily represent those of their affiliated organizations, or those of the publisher, the editors and the reviewers. Any product that may be evaluated in this article, or claim that may be made by its manufacturer, is not guaranteed or endorsed by the publisher.
Supplementary material
The Supplementary Material for this article can be found online at: https://www.frontiersin.org/articles/10.3389/fimmu.2025.1646133/full#supplementary-material
Glossary
AP-1: activator protein 1
BMAL1: brain and muscle ARNT-like 1
CCL2: chemokine (C-C motif) ligand 2
VEH/CON: vehicle control
CREB1: cAMP response element-binding protein 1
CXCL10: chemokine (C-X-C motif) ligand 10
DAMP: damage-associated molecular pattern
DEG: differentially expressed gene
DEX: dexamethasone
DHA: docosahexaenoic acid
dsDNA: double-stranded DNA
ELISA: enzyme-linked immunosorbent assay
FBS: fetal bovine serum
FLAM: fetal liver-derived alveolar-like macrophage
GC: glucocorticoid
GILZ: glucocorticoid-induced leucine zipper
GM-CSF: granulocyte-monocyte colony-stimulating factor
GO: Gene Ontology
GR: glucocorticoid receptor
GRIP1: glucocorticoid receptor-interacting protein 1
GSEA: gene set enrichment analysis
IFN: interferon
IFN-β: interferon beta
IL-1: interleukin 1
IL-6: interleukin 6
IRF1: interferon regulatory factor 1
ISG: interferon-stimulated gene
ISGF3: interferon-stimulated gene factor 3
ISRE: interferon-stimulated response element
KEGG: Kyoto Encyclopedia of Genes and Genomes
LDH: lactate dehydrogenase
LPS: lipopolysaccharide
LV: latent variable
MAPK: mitogen-activated protein kinase
MKP-1: mitogen-activated protein kinase phosphatase-1
mRPMI: modified RPMI media
MUFA: monounsaturated fatty acid
NES: normalized enrichment score
NF-κB: nuclear factor kappa-light-chain-enhancer of activated B cells
NCOA2: nuclear receptor coactivator 2
NZBWF1: New Zealand Black/White F1 lupus-prone mouse model
NuRD: nucleosome remodeling and deacetylase complex
O3FA: omega-3 fatty acid
O6FA: omega-6 fatty acid
PAMP: pathogen-associated molecular pattern
PBS: phosphate-buffered saline
PLIER: pathway-level information extractor
PPARα: peroxisome proliferator-activated receptor alpha
PPARγ: peroxisome proliferator-activated receptor gamma
PTEN: phosphatase and tensin homolog
P/S: penicillin-streptomycin
qRT-PCR: quantitative reverse transcription polymerase chain reaction
RARα: retinoic acid receptor alpha
RNA-seq: RNA sequencing
RXRA: retinoid X receptor alpha
SFA: saturated fatty acid
SLE: systemic lupus erythematosus
SOCS1: suppressor of cytokine signaling 1
STAT: signal transducer and activator of transcription
TCF7L2: transcription factor 7-like 2
TF: transcription factor
TGF-β1: transforming growth factor beta 1
TLC: thin-layer chromatography
TLR: toll-like receptor
TNFα: tumor necrosis factor alpha
YBX1: Y-box binding protein 1
17-HDHA: 17-hydroxydocosahexaenoic acid
18-HEPE: 18-hydroxyeicosapentaenoic acid
References
1. Tsokos GC. The immunology of systemic lupus erythematosus. Nat Immunol. (2024) 25:1332–43. doi: 10.1038/s41590-024-01898-7
2. Woo JMP, Parks CG, Jacobsen S, Costenbader KH, and Bernatsky S. The role of environmental exposures and gene-environment interactions in the etiology of systemic lupus erythematosus. J Intern Med. (2022) 291:755–78. doi: 10.1111/joim.13448
3. Caielli S, Wan Z, and Pascual V. Systemic lupus erythematosus pathogenesis: interferon and beyond. Annu Rev Immunol. (2023) 41:533–60. doi: 10.1146/annurev-immunol-101921-042422
4. Hoi A, Igel T, Mok CC, and Arnaud L. Systemic lupus erythematosus. Lancet. (2024) 403:2326–38. doi: 10.1016/S0140-6736(24)00398-2
5. Chauhan PS, Benninghoff AD, Favor OK, Wagner JG, Lewandowski RP, Rajasinghe LD, et al. Dietary docosahexaenoic acid supplementation inhibits acute pulmonary transcriptional and autoantibody responses to a single crystalline silica exposure in lupus-prone mice. Front Immunol. (2024) 15:1275265. doi: 10.3389/fimmu.2024.1275265
6. Li Y, Lee PY, and Reeves WH. Monocyte and macrophage abnormalities in systemic lupus erythematosus. Arch Immunol Ther Exp (Warsz). (2010) 58:355–64. doi: 10.1007/s00005-010-0093-y
7. Udalova IA, Mantovani A, and Feldmann M. Macrophage heterogeneity in the context of rheumatoid arthritis. Nat Rev Rheumatol. (2016) 12:472–85. doi: 10.1038/nrrheum.2016.91
8. Ahamada MM, Jia Y, and Wu X. Macrophage polarization and plasticity in systemic lupus erythematosus. Front Immunol. (2021) 12:734008. doi: 10.3389/fimmu.2021.734008
9. Northcott M, Jones S, Koelmeyer R, Bonin J, Vincent F, Kandane-Rathnayake R, et al. Type 1 interferon status in systemic lupus erythematosus: a longitudinal analysis. Lupus Sci Med. (2022) 9:e000625. doi: 10.1136/lupus-2021-000625
10. Richoz N, Tuong ZK, Loudon KW, Patino-Martinez E, Ferdinand JR, Portet A, et al. Distinct pathogenic roles for resident and monocyte-derived macrophages in lupus nephritis. JCI Insight. (2022) 7:e159751. doi: 10.1172/jci.insight.159751
11. Cheng Y, Liu L, Ye Y, He Y, Hu W, Ke H, et al. Roles of macrophages in lupus nephritis. Front Pharmacol. (2024) 15:1477708. doi: 10.3389/fphar.2024.1477708
12. Heine LK, Scarlett T, Wagner JG, Lewandowski RP, Benninghoff AD, Tindle AN, et al. Crystalline silica-induced pulmonary inflammation and autoimmunity in mature adult NZBW/f1 mice: age-related sensitivity and impact of omega-3 fatty acid intervention. Inhal Toxicol. (2024) 36:106–23. doi: 10.1080/08958378.2024.2318378
13. Wierenga KA, Wee J, Gilley KN, Rajasinghe LD, Bates MA, Gavrilin MA, et al. Docosahexaenoic acid suppresses silica-induced inflammasome activation and IL-1 cytokine release by interfering with priming signal. Front Immunol. (2019) 10:2130. doi: 10.3389/fimmu.2019.02130
14. Kovach MA and Standiford TJ. Toll-like receptors in diseases of the lung. Int Immunopharmacol. (2011) 11:1399–406. doi: 10.1016/j.intimp.2011.05.013
15. Heine LK, Rajasinghe LD, Wagner JG, Lewandowski RP, Li QZ, Richardson AL, et al. Subchronic intranasal lipopolysaccharide exposure induces pulmonary autoimmunity and glomerulonephritis in NZBWF1 mice. Autoimmunity. (2024) 57:2370536. doi: 10.1080/08916934.2024.2370536
16. Yu H, Nagafuchi Y, and Fujio K. Clinical and immunological biomarkers for systemic lupus erythematosus. Biomolecules. (2021) 11:928. doi: 10.3390/biom11070928
17. Herrada AA, Escobedo N, Iruretagoyena M, Valenzuela RA, Burgos PI, Cuitino L, et al. Innate immune cells’ Contribution to systemic lupus erythematosus. Front Immunol. (2019) 10:772. doi: 10.3389/fimmu.2019.00772
18. Furst R, Schroeder T, Eilken HM, Bubik MF, Kiemer AK, Zahler S, et al. MAPK phosphatase-1 represents a novel anti-inflammatory target of glucocorticoids in the human endothelium. FASEB J. (2007) 21:74–80. doi: 10.1096/fj.06-6752com
19. Jang BC, Lim KJ, Suh MH, Park JG, and Suh SI. Dexamethasone suppresses interleukin-1beta-induced human beta-defensin 2 mRNA expression: involvement of p38 MAPK, JNK, MKP-1, and NF-kappaB transcriptional factor in A549 cells. FEMS Immunol Med Microbiol. (2007) 51:171–84. doi: 10.1111/j.1574-695X.2007.00293.x
20. Flammer JR and Rogatsky I. Minireview: Glucocorticoids in autoimmunity: unexpected targets and mechanisms. Mol Endocrinol. (2011) 25:1075–86. doi: 10.1210/me.2011-0068
21. Cain DW and Cidlowski JA. Immune regulation by glucocorticoids. Nature Reviews (2017) 17:233–47. doi: 10.1038/nri.2017.1
22. Ugarte A, Danza A, and Ruiz-Irastorza G. Glucocorticoids and antimalarials in systemic lupus erythematosus: an update and future directions. NLM (Medline). (2018), 30(5):482–9. doi: 10.1097/BOR.0000000000000527
23. Heine LK, Benninghoff AD, Ross EA, Rajasinghe LD, Wagner JG, Lewandowski RP, et al. Comparative effects of human-equivalent low, moderate, and high dose oral prednisone intake on autoimmunity and glucocorticoid-related toxicity in a murine model of environmental-triggered lupus. Front Immunol. (2022) 13:972108. doi: 10.3389/fimmu.2022.972108
24. Akbar U, Yang M, Kurian D, and Mohan C. Omega-3 fatty acids in rheumatic diseases: A critical review. J Clin Rheumatol. (2017) 23:330–9. doi: 10.1097/RHU.0000000000000563
25. Adam O, Beringer C, Kless T, Lemmen C, Adam A, Wiseman M, et al. Anti-inflammatory effects of a low arachidonic acid diet and fish oil in patients with rheumatoid arthritis. Rheumatol Int. (2003) 23:27–36. doi: 10.1007/s00296-002-0234-7
26. Wierenga KA, Strakovsky RS, Benninghoff AD, Rajasinghe LD, Lock AL, Harkema JR, et al. Requisite omega-3 HUFA biomarker thresholds for preventing murine lupus flaring. Front Immunol. (2020) 11:1796. doi: 10.3389/fimmu.2020.01796
27. Wong SW, Kwon MJ, Choi AM, Kim HP, Nakahira K, and Hwang DH. Fatty acids modulate Toll-like receptor 4 activation through regulation of receptor dimerization and recruitment into lipid rafts in a reactive oxygen species-dependent manner. J Biol Chem. (2009) 284:27384–92. doi: 10.1074/jbc.M109.044065
28. Pennington ER, Virk R, Bridges MD, Bathon BE, Beatty N, Gray RS, et al. Docosahexaenoic acid controls pulmonary macrophage lipid raft size and inflammation. J Nutr. (2024) 154:1945–58. doi: 10.1016/j.tjnut.2024.04.006
29. Chang HY, Lee HN, Kim W, and Surh YJ. Docosahexaenoic acid induces M2 macrophage polarization through peroxisome proliferator-activated receptor gamma activation. Life Sci. (2015) 120:39–47. doi: 10.1016/j.lfs.2014.10.014
30. Xue B, Yang Z, Wang X, and Shi H. Omega-3 polyunsaturated fatty acids antagonize macrophage inflammation via activation of AMPK/SIRT1 pathway. PloS One. (2012) 7:e45990. doi: 10.1371/journal.pone.0045990
31. Wierenga KA, Riemers FM, Westendorp B, Harkema JR, and Pestka JJ. Single cell analysis of docosahexaenoic acid suppression of sequential LPS-induced proinflammatory and interferon-regulated gene expression in the macrophage. Front Immunol. (2022) 13:993614. doi: 10.3389/fimmu.2022.993614
32. Djuricic I and Calder PC. Beneficial outcomes of omega-6 and omega-3 polyunsaturated fatty acids on human health: an update for 2021. Nutrients. (2021) 13:2421. doi: 10.3390/nu13072421
33. Gilley KN, Fenton JI, Zick SM, Li K, Wang L, Marder W, et al. Serum fatty acid profiles in systemic lupus erythematosus and patient reported outcomes: The Michigan Lupus Epidemiology & Surveillance (MILES) Program. Front Immunol. (2024) 15:1459297. doi: 10.3389/fimmu.2024.1459297
34. Bates MA, Akbari P, Gilley KN, Wagner JG, Li N, Kopec AK, et al. Dietary docosahexaenoic acid prevents silica-induced development of pulmonary ectopic germinal centers and glomerulonephritis in the lupus-prone NZBWF1 mouse. Front Immunol. (2018) 9:2002. doi: 10.3389/fimmu.2018.02002
35. Bates MA, Brandenberger C, Langohr II, Kumagai K, Lock AL, Harkema JR, et al. Silica-triggered autoimmunity in lupus-prone mice blocked by docosahexaenoic acid consumption. PloS One. (2016) 11:e0160622. doi: 10.1371/journal.pone.0160622
36. Benninghoff AD, Bates MA, Chauhan PS, Wierenga KA, Gilley KN, Holian A, et al. Docosahexaenoic acid consumption impedes early interferon- and chemokine-related gene expression while suppressing silica-triggered flaring of murine lupus. Front Immunol. (2019) 10:2851. doi: 10.3389/fimmu.2019.02851
37. Thomas ST, Wierenga KA, Pestka JJ, and Olive AJ. Fetal liver-derived alveolar-like macrophages: A self-replicating ex vivo model of alveolar macrophages for functional genetic studies. Immunohorizons. (2022) 6:156–69. doi: 10.4049/immunohorizons.2200011
38. Dobin A, Davis CA, Schlesinger F, Drenkow J, Zaleski C, Jha S, et al. STAR: ultrafast universal RNA-seq aligner. Bioinformatics. (2013) 29:15–21. doi: 10.1093/bioinformatics/bts635
39. Love MI, Huber W, and Anders S. Moderated estimation of fold change and dispersion for RNA-seq data with DESeq2. Genome Biol. (2014) 15:550. doi: 10.1186/s13059-014-0550-8
40. Lai L, Hennessey J, Bares V, Son EW, Ban Y, Wang W, et al. GSKB: A gene set database for pathway analysis in mouse. bioRxiv. (2016), 082511. doi: 10.1101/082511
41. Cholico GN, Nault R, and Zacharewski TR. Genome-wide chIPseq analysis of ahR, COUP-TF, and HNF4 enrichment in TCDD-treated mouse liver. Int J Mol Sci. (2022) 23:1558. doi: 10.3390/ijms23031558
42. Mao W, Zaslavsky E, Hartmann BM, Sealfon SC, and Chikina M. Pathway-level information extractor (PLIER) for gene expression data. Nat Methods. (2019) 16:607–10. doi: 10.1038/s41592-019-0456-1
43. Badia IMP, Velez Santiago J, Braunger J, Geiss C, Dimitrov D, Muller-Dott S, et al. decoupleR: ensemble of computational methods to infer biological activities from omics data. Bioinform Adv. (2022) 2:vbac016. doi: 10.1093/bioadv/vbac016
44. Garcia-Alonso L, Holland CH, Ibrahim MM, Turei D, and Saez-Rodriguez J. Benchmark and integration of resources for the estimation of human transcription factor activities. Genome Res. (2019) 29:1363–75. doi: 10.1101/gr.240663.118
45. Zheng S, Wang W, Aldahdooh J, Malyutina A, Shadbahr T, Tanoli Z, et al. SynergyFinder plus: toward better interpretation and annotation of drug combination screening datasets. Genomics Proteomics Bioinf. (2022) 20:587–96. doi: 10.1016/j.gpb.2022.01.004
46. He L, Kulesskiy E, Saarela J, Turunen L, Wennerberg K, Aittokallio T, et al. Methods for High-throughput Drug Combination Screening and Synergy Scoring. In: von Stechow L, editor. Cancer Systems Biology: Methods and Protocols. Springer New York, New York, NY (2018). p. 351–98.
47. Favor OK, Rajasinghe LD, Wierenga KA, Maddipati KR, Lee KSS, Olive AJ, et al. Crystalline silica-induced proinflammatory eicosanoid storm in novel alveolar macrophage model quelled by docosahexaenoic acid supplementation. Front Immunol. (2023) 14:1274147. doi: 10.3389/fimmu.2023.1274147
48. Kloetgen A, Duggimpudi S, Schuschel K, Hezaveh K, Picard D, Schaal H, et al. YBX1 Indirectly Targets Heterochromatin-Repressed Inflammatory Response-Related Apoptosis Genes through Regulating CBX5 mRNA. Int J Mol Sci. (2020) 21:4453. doi: 10.3390/ijms21124453
49. Zhang W, Liu Y, Zhao Z, Zhang Y, Liang Y, and Wang W. YBX1: A multifunctional protein in senescence and immune regulation. Curr Issues Mol Biol. (2024) 46:14058–79. doi: 10.3390/cimb46120841
50. Ankers JM, Awais R, Jones NA, Boyd J, Ryan S, Adamson AD, et al. Dynamic NF-kappaB and E2F interactions control the priority and timing of inflammatory signalling and cell proliferation. Elife. (2016) 5:e10473. doi: 10.7554/eLife.10473
51. Hsu J and Sage J. Novel functions for the transcription factor E2F4 in development and disease. Cell Cycle. (2016) 15:3183–90. doi: 10.1080/15384101.2016.1234551
52. Li Q, Zhou L, Wang L, Li S, Xu G, Gu H, et al. Bcl6 modulates innate immunity by controlling macrophage activity and plays critical role in experimental autoimmune encephalomyelitis. Eur J Immunol. (2020) 50:525–36. doi: 10.1002/eji.201948299
53. Tran NT, Graf R, Acevedo-Ochoa E, Trombke J, Weber T, Sommermann T, et al. In vivo CRISPR/Cas9-mediated screen reveals a critical function of TFDP1 and E2F4 transcription factors in hematopoiesis. Leukemia. (2024) 38:2003–15. doi: 10.1038/s41375-024-02357-w
54. Bae S, Park PSU, Lee Y, Mun SH, Giannopoulou E, Fujii T, et al. MYC-mediated early glycolysis negatively regulates proinflammatory responses by controlling IRF4 in inflammatory macrophages. Cell Rep. (2021) 35:109264. doi: 10.1016/j.celrep.2021.109264
55. De Bosscher K, Vanden Berghe W, Vermeulen L, Plaisance S, Boone E, and Haegeman G. Glucocorticoids repress NF-kappaB-driven genes by disturbing the interaction of p65 with the basal transcription machinery, irrespective of coactivator levels in the cell. Proc Natl Acad Sci U S A. (2000) 97:3919–24. doi: 10.1073/pnas.97.8.3919
56. Jia P, Zhang W, and Shi Y. NFIC attenuates rheumatoid arthritis-induced inflammatory response in mice by regulating PTEN/SENP8 transcription. Tissue Cell. (2023) 81:102013. doi: 10.1016/j.tice.2023.102013
57. Liu Z, Lai K, Xie Y, He X, and Zhou X. Gli2 mediated activation of hedgehog signaling attenuates acute pancreatitis via balancing inflammatory cytokines in mice. Cell Physiol Biochem. (2018) 48:120–30. doi: 10.1159/000491668
58. Zacarias-Fluck MF, Soucek L, and Whitfield JR. MYC: there is more to it than cancer. Front Cell Dev Biol. (2024) 12:1342872. doi: 10.3389/fcell.2024.1342872
59. Oishi Y, Hayashi S, Isagawa T, Oshima M, Iwama A, Shimba S, et al. Bmal1 regulates inflammatory responses in macrophages by modulating enhancer RNA transcription. Sci Rep. (2017) 7:7086. doi: 10.1038/s41598-017-07100-3
60. Wang J, Bai Y, Yin S, Cui J, Zhang Y, Wang X, et al. Circadian clock gene BMAL1 reduces urinary calcium oxalate stones formation by regulating NRF2/HO-1 pathway. Life Sci. (2021) 265:118853. doi: 10.1016/j.lfs.2020.118853
61. Ahmadian M, Suh JM, Hah N, Liddle C, Atkins AR, Downes M, et al. PPARgamma signaling and metabolism: the good, the bad and the future. Nat Med. (2013) 19:557–66. doi: 10.1038/nm.3159
62. Schrader LA, Ronnekleiv-Kelly SM, Hogenesch JB, Bradfield CA, and Malecki KM. Circadian disruption, clock genes, and metabolic health. J Clin Invest. (2024) 134:e170998. doi: 10.1172/JCI170998
63. Wu Q, Sun S, Wei L, Liu M, Liu H, Liu T, et al. Twist1 regulates macrophage plasticity to promote renal fibrosis through galectin-3. Cell Mol Life Sci. (2022) 79:137. doi: 10.1007/s00018-022-04137-0
64. Nagenborg J, Jin H, Ruder AV, Temmerman L, Mees B, Schalkwijk C, et al. GM-CSF-activated STAT5A regulates macrophage functions and inflammation in atherosclerosis. Front Immunol. (2023) 14:1165306. doi: 10.3389/fimmu.2023.1165306
65. Ruffell D, Mourkioti F, Gambardella A, Kirstetter P, Lopez RG, Rosenthal N, et al. A CREB-C/EBPbeta cascade induces M2 macrophage-specific gene expression and promotes muscle injury repair. Proc Natl Acad Sci U S A. (2009) 106:17475–80. doi: 10.1073/pnas.0908641106
66. Núñez V, Alameda D, Rico D, Mota R, Gonzalo P, Cedenilla M, et al. Retinoid X receptor α controls innate inflammatory responses through the up-regulation of chemokine expression. Proc Natl Acad Sci. (2010) 107:10626–31. doi: 10.1073/pnas.0913545107
67. Zhang X-k, Su Y, Chen L, Chen F, Liu J, and Zhou H. Regulation of the nongenomic actions of retinoid X receptor-α by targeting the coregulator-binding sites. Acta Pharmacologica Sinica. (2015) 36:102–12. doi: 10.1038/aps.2014.109
68. Rong SJ, Yang CL, Wang FX, Sun F, Luo JH, Yue TT, et al. The essential role of foxO1 in the regulation of macrophage function. BioMed Res Int. (2022) 2022:1068962. doi: 10.1155/2022/1068962
69. Pfefferlé M and Vallelian F. Transcription factor NRF2 in shaping myeloid cell differentiation and function. Adv Exp Med Biol. (2024) 1459:159–95. doi: 10.1007/978-3-031-62731-6_8
70. Mills SJ, Ahangar P, Thomas HM, Hofma BR, Murray RZ, and Cowin AJ. Flightless I negatively regulates macrophage surface TLR4, delays early inflammation, and impedes wound healing. Cells. (2022) 11:2192. doi: 10.3390/cells11142192
71. Burger D, Fickentscher C, de Moerloose P, and Brandt KJ. F-actin dampens NLRP3 inflammasome activity via Flightless-I and LRRFIP2. Sci Rep. (2016) 6:29834. doi: 10.1038/srep29834
72. Flammer JR, Dobrovolna J, Kennedy MA, Chinenov Y, Glass CK, Ivashkiv LB, et al. The type I interferon signaling pathway is a target for glucocorticoid inhibition. Mol Cell Biol. (2010) 30:4564–74. doi: 10.1128/MCB.00146-10
73. Chinenov Y, Gupte R, Dobrovolna J, Flammer JR, Liu B, Michelassi FE, et al. Role of transcriptional coregulator GRIP1 in the anti-inflammatory actions of glucocorticoids. Proc Natl Acad Sci U S A. (2012) 109:11776–81. doi: 10.1073/pnas.1206059109
74. Bhattacharyya S, Zhao Y, Kay TW, and Muglia LJ. Glucocorticoids target suppressor of cytokine signaling 1 (SOCS1) and type 1 interferons to regulate Toll-like receptor-induced STAT1 activation. Proc Natl Acad Sci U S A. (2011) 108:9554–9. doi: 10.1073/pnas.1017296108
75. Lee JY, Plakidas A, Lee WH, Heikkinen A, Chanmugam P, Bray G, et al. Differential modulation of Toll-like receptors by fatty acids: preferential inhibition by n-3 polyunsaturated fatty acids. J Lipid Res. (2003) 44:479–86. doi: 10.1194/jlr.M200361-JLR200
76. Stillwell W and Wassall SR. Docosahexaenoic acid: membrane properties of a unique fatty acid. Chem Phys Lipids. (2003) 126:1–27. doi: 10.1016/S0009-3084(03)00101-4
77. Zhou J, Wang J, Gu MY, Zhang SQ, Chen SL, Zhang XW, et al. Effect of dexamethasone on TLR4 and MyD88 expression in monocytes of patients with tuberculous meningitis. Eur J Inflamm. (2017) 15:107–12. doi: 10.1177/1721727X17721829
78. Vandevyver S, Dejager L, Van Bogaert T, Kleyman A, Liu Y, Tuckermann J, et al. Glucocorticoid receptor dimerization induces MKP1 to protect against TNF-induced inflammation. J Clin Invest. (2012) 122:2130–40. doi: 10.1172/JCI60006
79. Curtale G, Renzi TA, Drufuca L, Rubino M, and Locati M. Glucocorticoids downregulate TLR4 signaling activity via its direct targeting by miR-511-5p. Eur J Immunol. (2017) 47:2080–9. doi: 10.1002/eji.201747044
80. Calder PC. Omega-3 polyunsaturated fatty acids and inflammatory processes: nutrition or pharmacology? Br J Clin Pharmacol. (2013) 75:645–62. doi: 10.1111/j.1365-2125.2012.04374.x
81. Mishra A, Chaudhary A, and Sethi S. Oxidized omega-3 fatty acids inhibit NF-kappaB activation via a PPARalpha-dependent pathway. Arterioscler Thromb Vasc Biol. (2004) 24:1621–7. doi: 10.1161/01.ATV.0000137191.02577.86
82. Sethi S, Ziouzenkova O, Ni H, Wagner DD, Plutzky J, and Mayadas TN. Oxidized omega-3 fatty acids in fish oil inhibit leukocyte-endothelial interactions through activation of PPAR alpha. Blood. (2002) 100:1340–6. doi: 10.1182/blood-2002-01-0316
83. Novak TE, Babcock TA, Jho DH, Helton WS, and Espat NJ. NF-kappa B inhibition by omega -3 fatty acids modulates LPS-stimulated macrophage TNF-alpha transcription. Am J Physiol Lung Cell Mol Physiol. (2003) 284:L84–9. doi: 10.1152/ajplung.00077.2002
84. Auphan N, DiDonato JA, Rosette C, Helmberg A, and Karin M. Immunosuppression by glucocorticoids: inhibition of NF-kappa B activity through induction of I kappa B synthesis. Science. (1995) 270:286–90. doi: 10.1126/science.270.5234.286
85. Ayroldi E and Riccardi C. Glucocorticoid-induced leucine zipper (GILZ): a new important mediator of glucocorticoid action. FASEB J. (2009) 23:3649–58. doi: 10.1096/fj.09-134684
86. Babcock TA, Kurland A, Helton WS, Rahman A, Anwar KN, and Espat NJ. Inhibition of activator protein-1 transcription factor activation by omega-3 fatty acid modulation of mitogen-activated protein kinase signaling kinases. JPEN J Parenter Enteral Nutr. (2003) 27:176–80; discussion 81. doi: 10.1177/0148607103027003176
87. Zhao Y and Chen LH. Eicosapentaenoic acid prevents lipopolysaccharide-stimulated DNA binding of activator protein-1 and c-Jun N-terminal kinase activity. J Nutr Biochem. (2005) 16:78–84. doi: 10.1016/j.jnutbio.2004.09.003
88. Engelbrecht AM, Engelbrecht P, Genade S, Niesler C, Page C, Smuts M, et al. Long-chain polyunsaturated fatty acids protect the heart against ischemia/reperfusion-induced injury via a MAPK dependent pathway. J Mol Cell Cardiol. (2005) 39:940–54. doi: 10.1016/j.yjmcc.2005.08.004
89. Karin M and Chang L. AP-1–glucocorticoid receptor crosstalk taken to a higher level. J Endocrinol. (2001) 169:447–51. doi: 10.1677/joe.0.1690447
90. Teurich S and Angel P. The glucocorticoid receptor synergizes with Jun homodimers to activate AP-1-regulated promoters lacking GR binding sites. Chem Senses. (1995) 20:251–5. doi: 10.1093/chemse/20.2.251
91. Gonzalez MV, Jimenez B, Berciano MT, Gonzalez-Sancho JM, Caelles C, Lafarga M, et al. Glucocorticoids antagonize AP-1 by inhibiting the Activation/phosphorylation of JNK without affecting its subcellular distribution. J Cell Biol. (2000) 150:1199–208. doi: 10.1083/jcb.150.5.1199
92. Bruna A, Nicolas M, Munoz A, Kyriakis JM, and Caelles C. Glucocorticoid receptor-JNK interaction mediates inhibition of the JNK pathway by glucocorticoids. EMBO J. (2003) 22:6035–44. doi: 10.1093/emboj/cdg590
93. Hoppstadter J and Ammit AJ. Role of dual-specificity phosphatase 1 in glucocorticoid-driven anti-inflammatory responses. Front Immunol. (2019) 10:1446. doi: 10.3389/fimmu.2019.01446
94. Zheng Z, Zhao M, Xu Y, Zhang J, Peng S, Liu J, et al. Resolvin D2/GPR 18 axis ameliorates pressure overload-induced heart failure by inhibiting proinflammatory macrophage polarization. J Lipid Res. (2024) 65:100679. doi: 10.1016/j.jlr.2024.100679
95. Luo HQ, Huang YM, Li J, Tang XD, Chen R, Wang Y, et al. DHA inhibits invasion and metastasis in NSCLC cells by interfering with CCL18/STAT3 signaling pathway. Clin Exp Med. (2023) 23:2311–20. doi: 10.1007/s10238-022-00906-0
96. Sun S, Wang L, Wang J, Chen R, Pei S, Yao S, et al. Maresin1 prevents sepsis-induced acute liver injury by suppressing NF-kappaB/Stat3/MAPK pathways, mitigating inflammation. Heliyon. (2023) 9:e21883. doi: 10.1016/j.heliyon.2023.e21883
97. Darwish NM, Elshaer MMA, Almutairi SM, Chen TW, Mohamed MO, Ghaly WBA, et al. Omega-3 polyunsaturated fatty acids provoke apoptosis in hepatocellular carcinoma through knocking down the STAT3 activated signaling pathway: in vivo and in vitro study. Molecules. (2022) 27:3032. doi: 10.3390/molecules27093032
98. Du H, You L, Wu A, Wang F, Yu J, and Chen C. Resolvin D1 inhibits IL-6-induced epithelial-mesenchymal transition of colorectal cancer cells by targeting IL-6/STAT3 signaling. Cell Biochem Biophys. (2024) 82:1453–61. doi: 10.1007/s12013-024-01299-5
99. Langlais D, Couture C, Balsalobre A, and Drouin J. The Stat3/GR interaction code: predictive value of direct/indirect DNA recruitment for transcription outcome. Mol Cell. (2012) 47:38–49. doi: 10.1016/j.molcel.2012.04.021
100. Irons R and Fritsche KL. Omega-3 polyunsaturated fatty acids impair in vivo interferon- gamma responsiveness via diminished receptor signaling. J Infect Dis. (2005) 191:481–6. doi: 10.1086/427264
101. Hu X, Li WP, Meng C, and Ivashkiv LB. Inhibition of IFN-gamma signaling by glucocorticoids. J Immunol. (2003) 170:4833–9. doi: 10.4049/jimmunol.170.9.4833
102. McCoy CE, Carpenter S, Palsson-McDermott EM, Gearing LJ, and O’Neill LA. Glucocorticoids inhibit IRF3 phosphorylation in response to Toll-like receptor-3 and -4 by targeting TBK1 activation. J Biol Chem. (2008) 283:14277–85. doi: 10.1074/jbc.M709731200
103. Jalkanen J, Pettila V, Huttunen T, Hollmen M, and Jalkanen S. Glucocorticoids inhibit type I IFN beta signaling and the upregulation of CD73 in human lung. Intensive Care Med. (2020) 46:1937–40. doi: 10.1007/s00134-020-06086-3
104. Nunez BS, Geng CD, Pedersen KB, Millro-Macklin CD, and Vedeckis WV. Interaction between the interferon signaling pathway and the human glucocorticoid receptor gene 1A promoter. Endocrinology. (2005) 146:1449–57. doi: 10.1210/en.2004-0672
105. Yamamoto M, Sato S, Hemmi H, Uematsu S, Hoshino K, Kaisho T, et al. TRAM is specifically involved in the Toll-like receptor 4-mediated MyD88-independent signaling pathway. Nat Immunol. (2003) 4:1144–50. doi: 10.1038/ni986
106. Yanagibashi T, Nagai Y, Watanabe Y, Ikutani M, Hirai Y, and Takatsu K. Differential requirements of MyD88 and TRIF pathways in TLR4-mediated immune responses in murine B cells. Immunol Lett. (2015) 163:22–31. doi: 10.1016/j.imlet.2014.11.012
107. Wolf BK, Zhao Y, McCray A, Hawk WH, Deary LT, Sugiarto NW, et al. Cooperation of chromatin remodeling SWI/SNF complex and pioneer factor AP-1 shapes 3D enhancer landscapes. Nat Struct Mol Biol. (2023) 30:10–21. doi: 10.1038/s41594-022-00880-x
108. Philips RL, Wang Y, Cheon H, Kanno Y, Gadina M, Sartorelli V, et al. The JAK-STAT pathway at 30: Much learned, much more to do. Cell. (2022) 185:3857–76. doi: 10.1016/j.cell.2022.09.023
109. Xie C, Liu C, Wu B, Lin Y, Ma T, Xiong H, et al. Effects of IRF1 and IFN-beta interaction on the M1 polarization of macrophages and its antitumor function. Int J Mol Med. (2016) 38:148–60. doi: 10.3892/ijmm.2016.2583
110. Trizzino M, Zucco A, Deliard S, Wang F, Barbieri E, Veglia F, et al. EGR1 is a gatekeeper of inflammatory enhancers in human macrophages. Sci Adv. (2021) 7:eaaz8836. doi: 10.1126/sciadv.aaz8836
111. Liongue C and Almohaisen FLJ. Ward AC. B cell lymphoma 6 (BCL6): A conserved regulator of immunity and beyond. Int J Mol Sci. (2024) 25:10968. doi: 10.3390/ijms252010968
112. Nagai J, Lin J, and Boyce JA. Macrophage P2Y6 receptor signaling selectively activates NFATC2 and suppresses allergic lung inflammation. J Immunol. (2022) 209:2293–303. doi: 10.4049/jimmunol.2200452
113. Yang YH, Wen R, Huang XM, Zhang T, Yang N, Liu CF, et al. HNF4A mitigates sepsis-associated lung injury by upregulating NCOR2/GR/STAB1 axis and promoting macrophage polarization towards M2 phenotype. Cell Death Dis. (2025) 16:120. doi: 10.1038/s41419-025-07452-z
114. Kobayashi EH, Suzuki T, Funayama R, Nagashima T, Hayashi M, Sekine H, et al. Nrf2 suppresses macrophage inflammatory response by blocking proinflammatory cytokine transcription. Nat Commun. (2016) 7:11624. doi: 10.1038/ncomms11624
115. Zhang XK, Su Y, Chen L, Chen F, Liu J, and Zhou H. Regulation of the nongenomic actions of retinoid X receptor-alpha by targeting the coregulator-binding sites. Acta Pharmacol Sin. (2015) 36:102–12. doi: 10.1038/aps.2014.109
116. Bujor AM, El Adili F, Parvez A, Marden G, and Trojanowska M. Fli1 downregulation in scleroderma myeloid cells has profibrotic and proinflammatory effects. Front Immunol. (2020) 11:800. doi: 10.3389/fimmu.2020.00800
117. Lu J, Reese J, Zhou Y, and Hirsch E. Progesterone-induced activation of membrane-bound progesterone receptors in murine macrophage cells. J Endocrinol. (2015) 224:183–94. doi: 10.1530/JOE-14-0470
118. Seguin-Estevez Q, De Palma R, Krawczyk M, Leimgruber E, Villard J, Picard C, et al. The transcription factor RFX protects MHC class II genes against epigenetic silencing by DNA methylation. J Immunol. (2009) 183:2545–53. doi: 10.4049/jimmunol.0900376
119. Villard J, Peretti M, Masternak K, Barras E, Caretti G, Mantovani R, et al. A functionally essential domain of RFX5 mediates activation of major histocompatibility complex class II promoters by promoting cooperative binding between RFX and NF-Y. Mol Cell Biol. (2000) 20:3364–76. doi: 10.1128/MCB.20.10.3364-3376.2000
120. Guo F, Gao Y, Zhou P, Wang H, Ma Z, Wang X, et al. Single-cell analysis reveals that TCF7L2 facilitates the progression of ccRCC via tumor-associated macrophages. Cell Signal. (2024) 124:111453. doi: 10.1016/j.cellsig.2024.111453
121. Wen AY, Sakamoto KM, and Miller LS. The role of the transcription factor CREB in immune function. J Immunol. (2010) 185:6413–9. doi: 10.4049/jimmunol.1001829
122. Cassim Bawa FN, Gopoju R, Xu Y, Hu S, Zhu Y, Chen S, et al. Retinoic acid receptor alpha (RARalpha) in macrophages protects from diet-induced atherosclerosis in mice. Cells. (2022) 11:3186. doi: 10.3390/cells11203186
123. Chen B, Huang S, Su Y, Wu YJ, Hanna A, Brickshawana A, et al. Macrophage smad3 protects the infarcted heart, stimulating phagocytosis and regulating inflammation. Circ Res. (2019) 125:55–70. doi: 10.1161/CIRCRESAHA.119.315069
124. Wan YY. GATA3: a master of many trades in immune regulation. Trends Immunol. (2014) 35:233–42. doi: 10.1016/j.it.2014.04.002
125. B’Chir W, Maurin AC, Carraro V, Averous J, Jousse C, Muranishi Y, et al. The eIF2alpha/ATF4 pathway is essential for stress-induced autophagy gene expression. Nucleic Acids Res. (2013) 41:7683–99. doi: 10.1093/nar/gkt563
126. Neill G and Masson GR. A stay of execution: ATF4 regulation and potential outcomes for the integrated stress response. Front Mol Neurosci. (2023) 16:1112253. doi: 10.3389/fnmol.2023.1112253
127. Desmet SJ and De Bosscher K. Glucocorticoid receptors: finding the middle ground. J Clin Invest. (2017) 127:1136–45. doi: 10.1172/JCI88886
128. Toobian D, Ghosh P, and Katkar GD. Parsing the role of PPARs in macrophage processes. Front Immunol. (2021) 12:783780. doi: 10.3389/fimmu.2021.783780
Keywords: fetal liver-derived alveolar-like macrophage (FLAM), glucocorticoid (GC), omega-3 fatty acid, autoimmunity, lupus, interferon (IFN)
Citation: Heine LK, Nault R, Jackson J, Anderson AN, Harkema JR, Olive AJ, Pestka JJ and McDonald OF (2025) Omega-3 fatty acid synergy with glucocorticoid in mouse lupus macrophage model: targeting pathogenic pathways to reduce steroid dependence. Front. Immunol. 16:1646133. doi: 10.3389/fimmu.2025.1646133
Received: 12 June 2025; Accepted: 19 September 2025;
Published: 15 October 2025.
Edited by:
Vito Racanelli, University of Trento, ItalyReviewed by:
Rebecca Kelley Martin, Virginia Commonwealth University, United StatesCharles Robert Brown, University of Missouri, United States
Copyright © 2025 Heine, Nault, Jackson, Anderson, Harkema, Olive, Pestka and McDonald. This is an open-access article distributed under the terms of the Creative Commons Attribution License (CC BY). The use, distribution or reproduction in other forums is permitted, provided the original author(s) and the copyright owner(s) are credited and that the original publication in this journal is cited, in accordance with accepted academic practice. No use, distribution or reproduction is permitted which does not comply with these terms.
*Correspondence: Olivia F. McDonald, ZmF2b3JvbGlAbXN1LmVkdQ==; James J. Pestka, cGVzdGthQG1zdS5lZHU=
†These authors have contributed equally to this work and share first authorship