 Ana Torres1,2,3†
 Ana Montero-Calle4†
 Marina Lozano-Rendal1
 Carmen Sánchez1
 Lorena Bernardo1,2*
 Jose Carlos Solana1,2*
 Juan Victor San Martin2,5
 Rodrigo Barderas4,6‡
 Javier Moreno1,2‡
 Eugenia Carrillo1,2‡
- 1WHO Collaborating Centre for Leishmaniasis, Spanish National Center for Microbiology, Instituto de Salud Carlos III, Majadahonda, Spain
- 2Centro de Investigación Biomédica en Red de Enfermedades Infecciosas, Instituto de Salud Carlos III, Madrid, Spain
- 3Escuela de Doctorado, Universidad Autónoma de Madrid, Madrid, Spain
- 4Chronic Disease Program (UFIEC), Instituto de Salud Carlos III, Madrid, Spain
- 5Dept. of Infectious Diseases, Internal Medicine, Hospital Universitario de Fuenlabrada, Fuenlabrada/Madrid, Spain
- 6Centro de Investigación Biomédica en Red de Fragilidad y Envejecimiento Saludable (CIBERFES), Instituto de Salud Carlos III, Madrid, Spain
Introduction: The most severe form of leishmaniasis, visceral leishmaniasis (VL), lacks standardized validated early predictors of treatment success or relapse. To distinguish between active infection and successful treatment, we searched for protein biomarkers in plasma-derived extracellular vesicles (EVs).
Methods: The proteomic profiles of EVs from immunocompetent patients with active VL (n=12) or 1, 3, or 6 months after completing a standard treatment regimen (n=12 each) were analyzed by LC-MS/MS. Six candidate biomarkers were further tested by ELISA in whole plasma.
Results: 132 human proteins were differentially expressed in active VL- versus successfully treated patients. Pathway analysis identified pathogenic mechanisms associated with VL and pathways related to effective cure. SAA is directly measurable in whole plasma and exhibits differential expression levels, emerging as a promising, easily measurable, non-specific prognostic biomarker for patient management. Remarkably, we also identified Leishmania spp. proteins in EV samples, indicating a new source of parasite biomarkers in human samples.
Conclusion: Plasma EVs contain protein biomarkers that can be used to monitor the response to treatment, some of which are detectable in whole plasma after 1 month of treatment. Our study also provides a proteomic landscape of plasma EVs involved in VL, offering insight into the pathogenesis of this complex disease.
1 Introduction
Leishmaniasis is a vector-borne tropical disease caused by the protozoan parasite Leishmania spp. Among its clinical forms, visceral leishmaniasis (VL) is the most severe due to its high morbidity and mortality rates (1). Although VL treatment is usually effective, relapses are common, especially in immunocompromised patients (2–4), as Leishmania infection resolution largely depends on an efficient cell-mediated immune response (5, 6).
The current method of confirming final cure in patients with VL relies on WHO guidelines, which define this as the absence of clinical symptoms 6 months after completion of treatment (7). Although the diagnosis of VL can be effectively undertaken, no early predictors of cure have been standardized and validated. This happens specially in immunocompromised individuals, such prognostic biomarkers are crucial to reduce the likelihood of therapeutic relapse and improve patient health and welfare. Parasite levels in the blood decline rapidly after the first dose of treatment, limiting the utility of polymerase chain reaction (PCR) for this purpose, particularly in field settings where most clinical cases occur. Likewise, the detection of antibodies in serum against Leishmania antigens - such as those targeted by rK39 inmunochromatographic test (rK39-ICT) rapid test- often remain positive post-treatment, making them unsuitable for determining when cure has been achieved. Since resolution of leishmaniasis is mediated by a cellular immune response that activates host macrophages to eliminate the parasite, cellular biomarkers are considered the most promising tools for assessing treatment outcomes. While some prognostic biomarkers have been identified over the last few decades, none have been successfully translated to clinic practice for confirming cure during post treatment follow-up (8–10). A positive leishmanin skin test (LST) has been associated to protective immunity (11, 12), its use is being phased out due to its invasive nature and the lack of GMP-grade leishmanin (13). Ex vivo assays measuring lymphoproliferative responses (CPA) and interferon (IFN)-γ production, or cytokine release—such as IFN-γ, interleukin (IL)-2, tumor necrosis factor (TNF), IP10 (CXCL10), and MIG (CXCL9)—via whole-blood assay (WBA) have shown promise for confirming cure (10, 14); however, these approaches rely on non-commercial antigens which lack standardization and may yield inconsistent results. These limitations underscore the translational gap and the urgent need for new, field-adaptable biomarkers, ideally measurable in minimally processed samples.
Extracellular vesicles (EVs) are emerging as a promising source of biomarkers, particularly those derived from readily available samples like plasma. The potential of these EVs lies in their ability to provide valuable information on both physiological and pathological processes (15–17). Hence, by analyzing the proteome of EVs, specific proteins have been identified that are useful biomarkers for diagnosing several infectious diseases, monitoring disease progression, and early predicting treatment responses (18, 19).
The protein contents of EVs derived from blood samples from patients with a neglected disease have been recently explored (20–25). In the context of leishmaniasis, so far biomarker research has mostly focused on dogs (26, 27) or in vitro models (28–30). While informative, these studies have limitations in simulating the complexity of this disease.
There is therefore a need for proteomic studies in EVs from human VL samples to gain a deeper understanding of EV dynamics during the disease, and to identify early changes in their composition in response to treatment. These studies could help uncover the mechanisms through which Leishmania interacts with host cells, and how these interactions contribute to the progression of the disease and cure after treatment, including key immune processes like the recruitment of phagocytic cells to the infection site and the induction of pro-inflammatory cytokines such as IFN-γ and TNF, both essential for mounting a Th1 immune response. Indeed, research efforts such as these could help identify Leishmania proteins not yet described in plasma-derived EVs from human VL patients.
Despite extensive research, significant gaps remain in our understanding of persistence regarding the mechanisms that determine disease progression in Leishmania-infected individuals. In particular, it remains unclear why some individuals can control the infection asymptomatically, while others progress to clinical VL. This uncertainty is compounded by the complex triad of interactions between the parasite, the human host, and the sandfly vector, involving immune evasion strategies and host genetic factors that are not yet fully elucidated (31).
In this study, we compared the proteomic profiles of plasma EVs from immunocompetent patients with active visceral leishmaniasis caused by L. infantum before and after 1, 3, and 6 months of treatment with liposomal amphotericin B (LAmB). Our objective was to explore the underlying pathophysiological mechanisms associated with this disease, and to identify and validate early biomarkers of clinical remission and effective cure.
2 Materials and methods
2.1 Plasma samples
Plasma samples were obtained from whole blood (10 mL) collected in heparin tubes from immunocompetent adult patients from the same VL endemic area in Madrid between 2013 and 2017 and allowed to rest overnight at room temperature. Plasma was then transferred to clean tubes and stored at -80 °C until use, as part of the Collection for Leishmaniasis Research of the CNM (ISCIII), registered at the Spanish National Biobank Register under ref. number C.0000898 (Royal Decree Act 1716/2011, 18th November). The study protocol for patients returning for voluntary follow-up was approved by the Ethics Committee (APR 12–66 and APR 12-67) of the Hospital Universitario de Fuenlabrada, Madrid, Spain, and by the ISCIII Ethics Committee (CEI PI 78_2022).
Samples for EV biological and proteomics analyses corresponded to 46 patients: 12 diagnosed with active VL before receiving treatment, 11 patients 1 month after treatment completion (VL_Tx1M), 12 patients 3 months after treatment completion (VL_Tx3M), and 11 patients 6 months after treatment completion (VL_Tx6M). For ELISA analysis, samples from a further 38 patients were included at the same time points. There were similar distributions of gender and age across patient groups; detailed summary is provided in Table 1.

Table 1. Demographic and clinical characteristics of VL patient plasma samples included in the study, grouped by follow-up time points (1, 3, and 6 months posttreatment).
Active cases of VL were defined as patients with clinical symptoms and a confirmed diagnosis of leishmaniasis by the rK39-ICT and/or PCR (14).
Treated VL patients were defined as patients diagnosed with visceral leishmaniasis treated with the standard regimen of liposomal amphotericin B (3 mg/kg/day, days 1-5, 14 and 21) who showed no symptoms and tested PCR negative at 6-months after the end of treatment in accordance with WHO guidelines (32). Additionally, the cellular proliferation assay (CPA) and/or IFN-γ production to soluble Leishmania antigen (SLA) were considered as indicators of cure as described by Botana et al. (14). Patients enrolled in our study voluntarily agreed to attend follow-up appointments at the hospital 1-, 3- and 6-months post end-treatment to provide blood samples to look for prognostic biomarkers of cure.
Samples were randomly pooled according to predefined groups to create composite samples for TMT quantitative proteomics analysis using data dependent acquisition (DDA) (33). Pooling reduces the impact of individual variability and enhances the detection of specific protein biomarkers associated with disease or early cure (34, 35).
2.2 Isolation of EVs
Plasma samples from each patient cohort were thawed on ice and then pooled mixed equal volumes of plasma to give 2 mL per group. Pooled samples were first centrifuged at increasing speeds at 4°C (300 x g for 10 min; 2,000 x g for 30 min, and 12,000 x g for 30 min) and the supernatants diluted with equal volumes of filtered PBS 1x (Thermo Fisher Scientific, Waltham, MA, USA). Secondly, pooled samples were processed using a combined method of size exclusion chromatography and ultracentrifugation (SEC+UC) (36). In brief, samples were passed through a 70 nm/qEV SEC column (Izon Science, Christchurch, New Zealand), and fractions 6–9 of the flowthrough were collected. Next, these fractions were pelleted via two steps of ultracentrifugation (100,000 x g for 2 h 15 min at 4°C) in a Beckman Coulter Optima XPN-100 ultracentrifuge with a SW60Ti swinging-bucket rotor (Beckman Coulter Inc, CA, USA). The resulting pellet was resuspended in filtered PBS, and EVs were characterized by nanoparticle tracking analysis (NTA) and transmission electron microscopy (TEM) to assess their size, concentration, and intrinsic markers.
2.3 Nanoparticle tracking analysis
EV samples were diluted 1:50 in filtered PBS 1x and analyzed using a NanoSight NS300 instrument (Malvern, Worcestershire, UK), following previously validated settings (36). Briefly, serial dilutions were tested using healthy plasma-derived EVs to ensure particle concentration remained within the optimal detection range of the instrument. Two measurements per sample were made under consistent instrument settings, and data analysis was performed using NTA 3.2 Software. For each measurement, three videos were recorded, with the sample continuously infused through an automatic syringe pump at a flow rate of 50 μL/min. The parameters included: camera level 12, auto background subtraction/blur/minimum track, length acquisition time 60 s, 3 videos and detection threshold 5. Final concentration was expressed based on the dilution factor employed.
2.4 Protein quantification
EV samples were concentrated by lyophilization to ensure precise measurement of protein concentration for SDS-PAGE and proteomics studies. Subsequently, the samples were rehydrated with milliQ water to achieve a minimum concentration of 0.2 μg/μL for further analysis.
Protein concentration was measured using the Micro BCA Protein Assay Reagent Kit (Thermo Fisher Scientific, Waltham, MA, USA) following the manufacturer’s instructions. Briefly, a dilution of 1/20 of each sample was prepared in a final reaction of 200 μL of BCA Working Reagent. The reaction mixture was incubated for 2 h at 37°C. Absorbance was measured at 562 nm using a Multiskan FC (Thermo Fisher Scientific, MA, USA). Protein concentrations were calculated based on a standard curve prepared with bovine serum albumin (BSA) and fitted using a four-parameter logistic model.
2.5 Transmission electron microscopy
EV samples were examined by electron microscopy (TEM) through negative staining. Samples were diluted 1:10 in PBS1x and fixed in a final concentration of 2% paraformaldehyde for 5 min. Then, samples were placed on glow-discharged, carbon-coated copper grids for 5 min, following by two washes with MilliQ water. The samples were negatively stained with 2% aqueous uranyl acetate for 1 min. EV particles were visualized using a FEI Tecnai 12 electron microscope equipped with a LaB6 filament operating at 120 kV, and images were captured with an FEI Ceta digital camera at 30,000× magnification. Approximately 30 images were acquired per group to evaluate vesicle morphology and size distribution.
2.6 Statistical analysis of EV characterizations
Statistical analyses were conducted using the program GraphPad Prism version 9.0 (GraphPad Software Inc, CA, USA). Differences between groups were assessed by one-way analysis of variance (ANOVA) followed by Tukey’s honestly significant difference (HSD) post hoc test for multiple comparisons. Significance was set at three levels: *p < 0.05, **p < 0.01, and ***p < 0.001.
2.7 18-plex TMT labelling and peptide fractionation
For proteomics analysis, a TMT 18-plex experiment was performed with the plasma-derived EV samples, each of which was analyzed in triplicate. Digestion was performed with trypsin (1:20, trypsin:protein ratio) and SP3 magnetic beads, as previously described (33, 37, 38). Briefly, 10 µg of pooled EVs for each group were resuspended in RIPA buffer to a final volume of 100 µL and lysed by 5 cycles of 5 min of incubation on ice and 5 min of incubation at 95 °C. Proteins were then reduced, alkylated, and trypsin digested in a 100 μL solution of 200 mM HEPES at pH 8.0. The resultant supernatants containing the digested proteins were collected and TMT labelled. After labelling, peptides were separated into 12 fractions using a high pH reversed-phase peptide fractionation kit (Pierce, Thermo Fisher Scientific) in 0.1% triethylamine 2.5-100% ACN. Finally, fractions 1 and 12 were pooled together, and the 11 fractions were dried under vacuum and stored at -80 °C until analysis in an Orbitrap Exploris 480 mass spectrometer equipped with a FAIMS pro Duo interface (33).
2.8 LC–MS/MS analysis
Prior to LC-MS/MS, peptides were resuspended in 10 μL of 0.1% formic acid (FA) in mass spectrometry grade H2O and 4 μL of fractions 1 and 12, and 2 and 3, and 2 μL of fractions 4 to 11 (800 ng) were injected using the Vanquish Neo UHPLC System (Thermo Fisher Scientific, Waltham, MA, USA). For LC, samples were loaded into a precolumn PepMap 100 C18 3 µm, 75 µm × 2 cm Nanoviper Trap 1200BA (Thermo Fisher Scientific, Waltham, MA, USA) and eluted in an Easy-Spray PepMap RSLC C18 2 µm, 75 µm × 50 cm (Thermo Fisher Scientific, Waltham, MA, USA) heated at 50 °C, and eluted in a 120 min gradient using a flow rate of 300 nL/min and 0.1% FA H2O (buffer A) and 0.1% FA in 80% ACN (buffer B) as elution buffers. The 2 h gradient used was 0–2% buffer B for 4 min, 2% buffer B for 2 min, 2–42% buffer B for 100 min, 42–72% buffer B for 14 min, 72–95% buffer B for 5 min, and 95% buffer B for 10 min.
For MS/MS, standard parameters were used according to established protocols described previously enabling the turboTMT and FAIMS Pro Duo Interface (33, 39, 40). Briefly, a data dependent acquisition (DDA) method was used with 1900 V of liquid junction voltage and 280 °C capillary temperature used for ionization. The full scan was acquired with a m/z 350–1400 mass selection, an Orbitrap resolution of 60,000 (at m/z 200), an automatic gain control (AGC) value of 300%, and a maximum injection time (IT) of 25 ms. After the survey scan, the 12 most intense precursor ions were selected for MS/MS fragmentation, which was performed with a normalized collision energy of 34, and MS/MS scans were acquired with a 100 m/z first mass, an AGC target of 100%, a resolution of 15,000 (at m/z 200), an intensity threshold of 2 × 10⁴, an isolation window of 0.7 m/z units, a maximum IT of 22 ms, and the TurboTMT enabled. Charge state screening was enabled to reject unassigned, singly charged, and greater than or equal to seven protonated ions. A dynamic exclusion time of 30 s was used to discriminate against previously selected ions. For FAIMS, a gas flow of 4.7 L/min and CVs = −45 V and −60 V were used.
2.9 MS data and statistical analysis
MS data were analyzed with MaxQuant (version 2.4.2) using standardized workflows. Mass spectra *.raw files were searched against UniProt UP000005640_9606.fasta Homo sapiens (human) 2022 database (20,577 protein entries, March 2022) or against the L. infantum database (8,575 protein entries) using Reporter ion MS2 type. Combined searches against both databases were performed to minimize cross-species peptide assignment and increase the reliability of parasite protein identification. Standard MaxQuant parameters were used, and reporter ion intensities were bias corrected for overlapping isotope contributions from the TMT tags according to the manufacturer’s certificate (37–39). Raw proteomics data obtained with the Orbitrap Exploris 480 mass spectrometer equipped with FAINS pro DUO interface were deposited to the ProteomeXchange Consortium via the PRIDE partner repository with the dataset identifier PXD060604.
Next, data normalization, sample loading (SL) and Trimmed Mean of M-value (TMM) normalizations were carried out with R Studio (version 4.1.1) according to established protocols (https://github.com/pwilmart, accessed on 2 November 2022), using the “tidyverse”, “psych”, “gridExtra”, “scales”, and “ggplot2” packages (version 4.1.1). Finally, statistical analysis was performed using an empirical Bayes-moderated t-statistics method in R Studio (version 4.1.1) using the packages “limma”, “dplyr”, “tidyverse”, “ggplot2”, and “rstatix” according to previously described procedures (33, 37, 41).
2.10 Enzyme linked immunosorbent assay on whole plasma
Potential biomarkers identified though proteomics analysis were evaluated using commercial sandwich ELISA kits for plasma samples according to the manufacturer’s guidelines.
For each ELISA, 100 µL of both diluted plasma samples and standard curve solutions were added to pre-coated plates specific to each protein. The required dilution of each sample was selected based on the theoretical concentrations available in ‘The Human Protein Atlas’ database (https://www.proteinatlas.org/, accessed January 2, 2025) and confirmed through preliminary dilution test to ensure accurate detection within the dynamic range of the assay. The proteins assayed were: FN1 (plasma dilution 1:1,000; DY1918-05, Bio-Techne, MSP, USA), SAA1 (1:10; DY3019-05, Bio-Techne, MSP, USA), SLC4A1 (1:100; EH6632, FineTest, CO, USA), SERPINA1 (1:10,000; EH3968, FineTest, CO, USA), YWHAZ (1:10; CSB-EL026293HU, Cusabio, TX, USA), and ITGB1 (1:10; Orb563558, Biorbyt, Cambride, UK).
In brief, after incubation for 2 h at room temperature (RT), the plates were washed and biotin-conjugated detection antibody added for an additional 2 h at RT. After washing, streptavidin was added and incubated for 20 to 60 min based on the specific protein. The plates were later incubated with 3,3’,5,5’-tetramethylbenzidine (TMB) substrate solution, and absorbance measured at 450–540 nm using a Multiskan FC (Thermo Fisher Scientific, MA, USA). Data analysis was performed using a four-parameter logistic curve with GraphPad Prism software version 9.0 (GraphPad Software Inc, USA). To determine differences between samples, data were compared using a two-tailed Student’s t-test for normally distributed data. For data not showing a normal distribution, the Mann-Whitney U test was employed. Differences between groups were considered significant at p < 0.05.
2.11 Biological analysis
In all protein-level tests, proteins were considered significantly differentially expressed when showed a p-value ≤ 0.05 and a fold change (FC) ≥ 1.5 or ≤ 0.67. Functional enrichment analysis of the proteins quantified was performed using the Gene Ontology (GO) database through DAVID 2021 (42, 43). Protein-protein interactions were assessed using STRING (version 12.0) (44), while the most enriched pathways were identified using the Reactome database (version 3.7) (45). In all biological enrichment analyses, significance was evaluated using Fisher’s exact test, and Benjamini-Hochberg correction was applied to control the false discovery rate (FDR). Only terms or pathways with adjusted p-values (FDR) ≤ 0.01 were considered significant. A heatmap was generated to visualize differential protein expression in patient groups using Flaski toolbox (version 3.16.14) (46). Hierarchical clustering was applied to both samples and proteins based on expression similarity. Prior to clustering, data were normalized and transformed to z-scores (row-wise), allowing visualization of relative expression levels across conditions. The databases TritrypDB (VEuPathDB) (47) (https://tritrypdb.org/, accessed January 2, 2025), Wikidata (https://www.wikidata.org/, accessed January 2, 2025), and UniProt (48) (https://www.uniprot.org/, accessed January 2, 2025) were consulted to identify and characterize Leishmania proteins.
3 Results
3.1 Characterization and proteomics analysis of extracellular vesicles
Plasma EVs isolated from immunocompetent patients with VL and after 1, 3 or 6 months of treatment completion (VL_Tx1M, VL_Tx3M, and VL_Tx6M) were characterized according to different techniques as depicted in Figure 1.
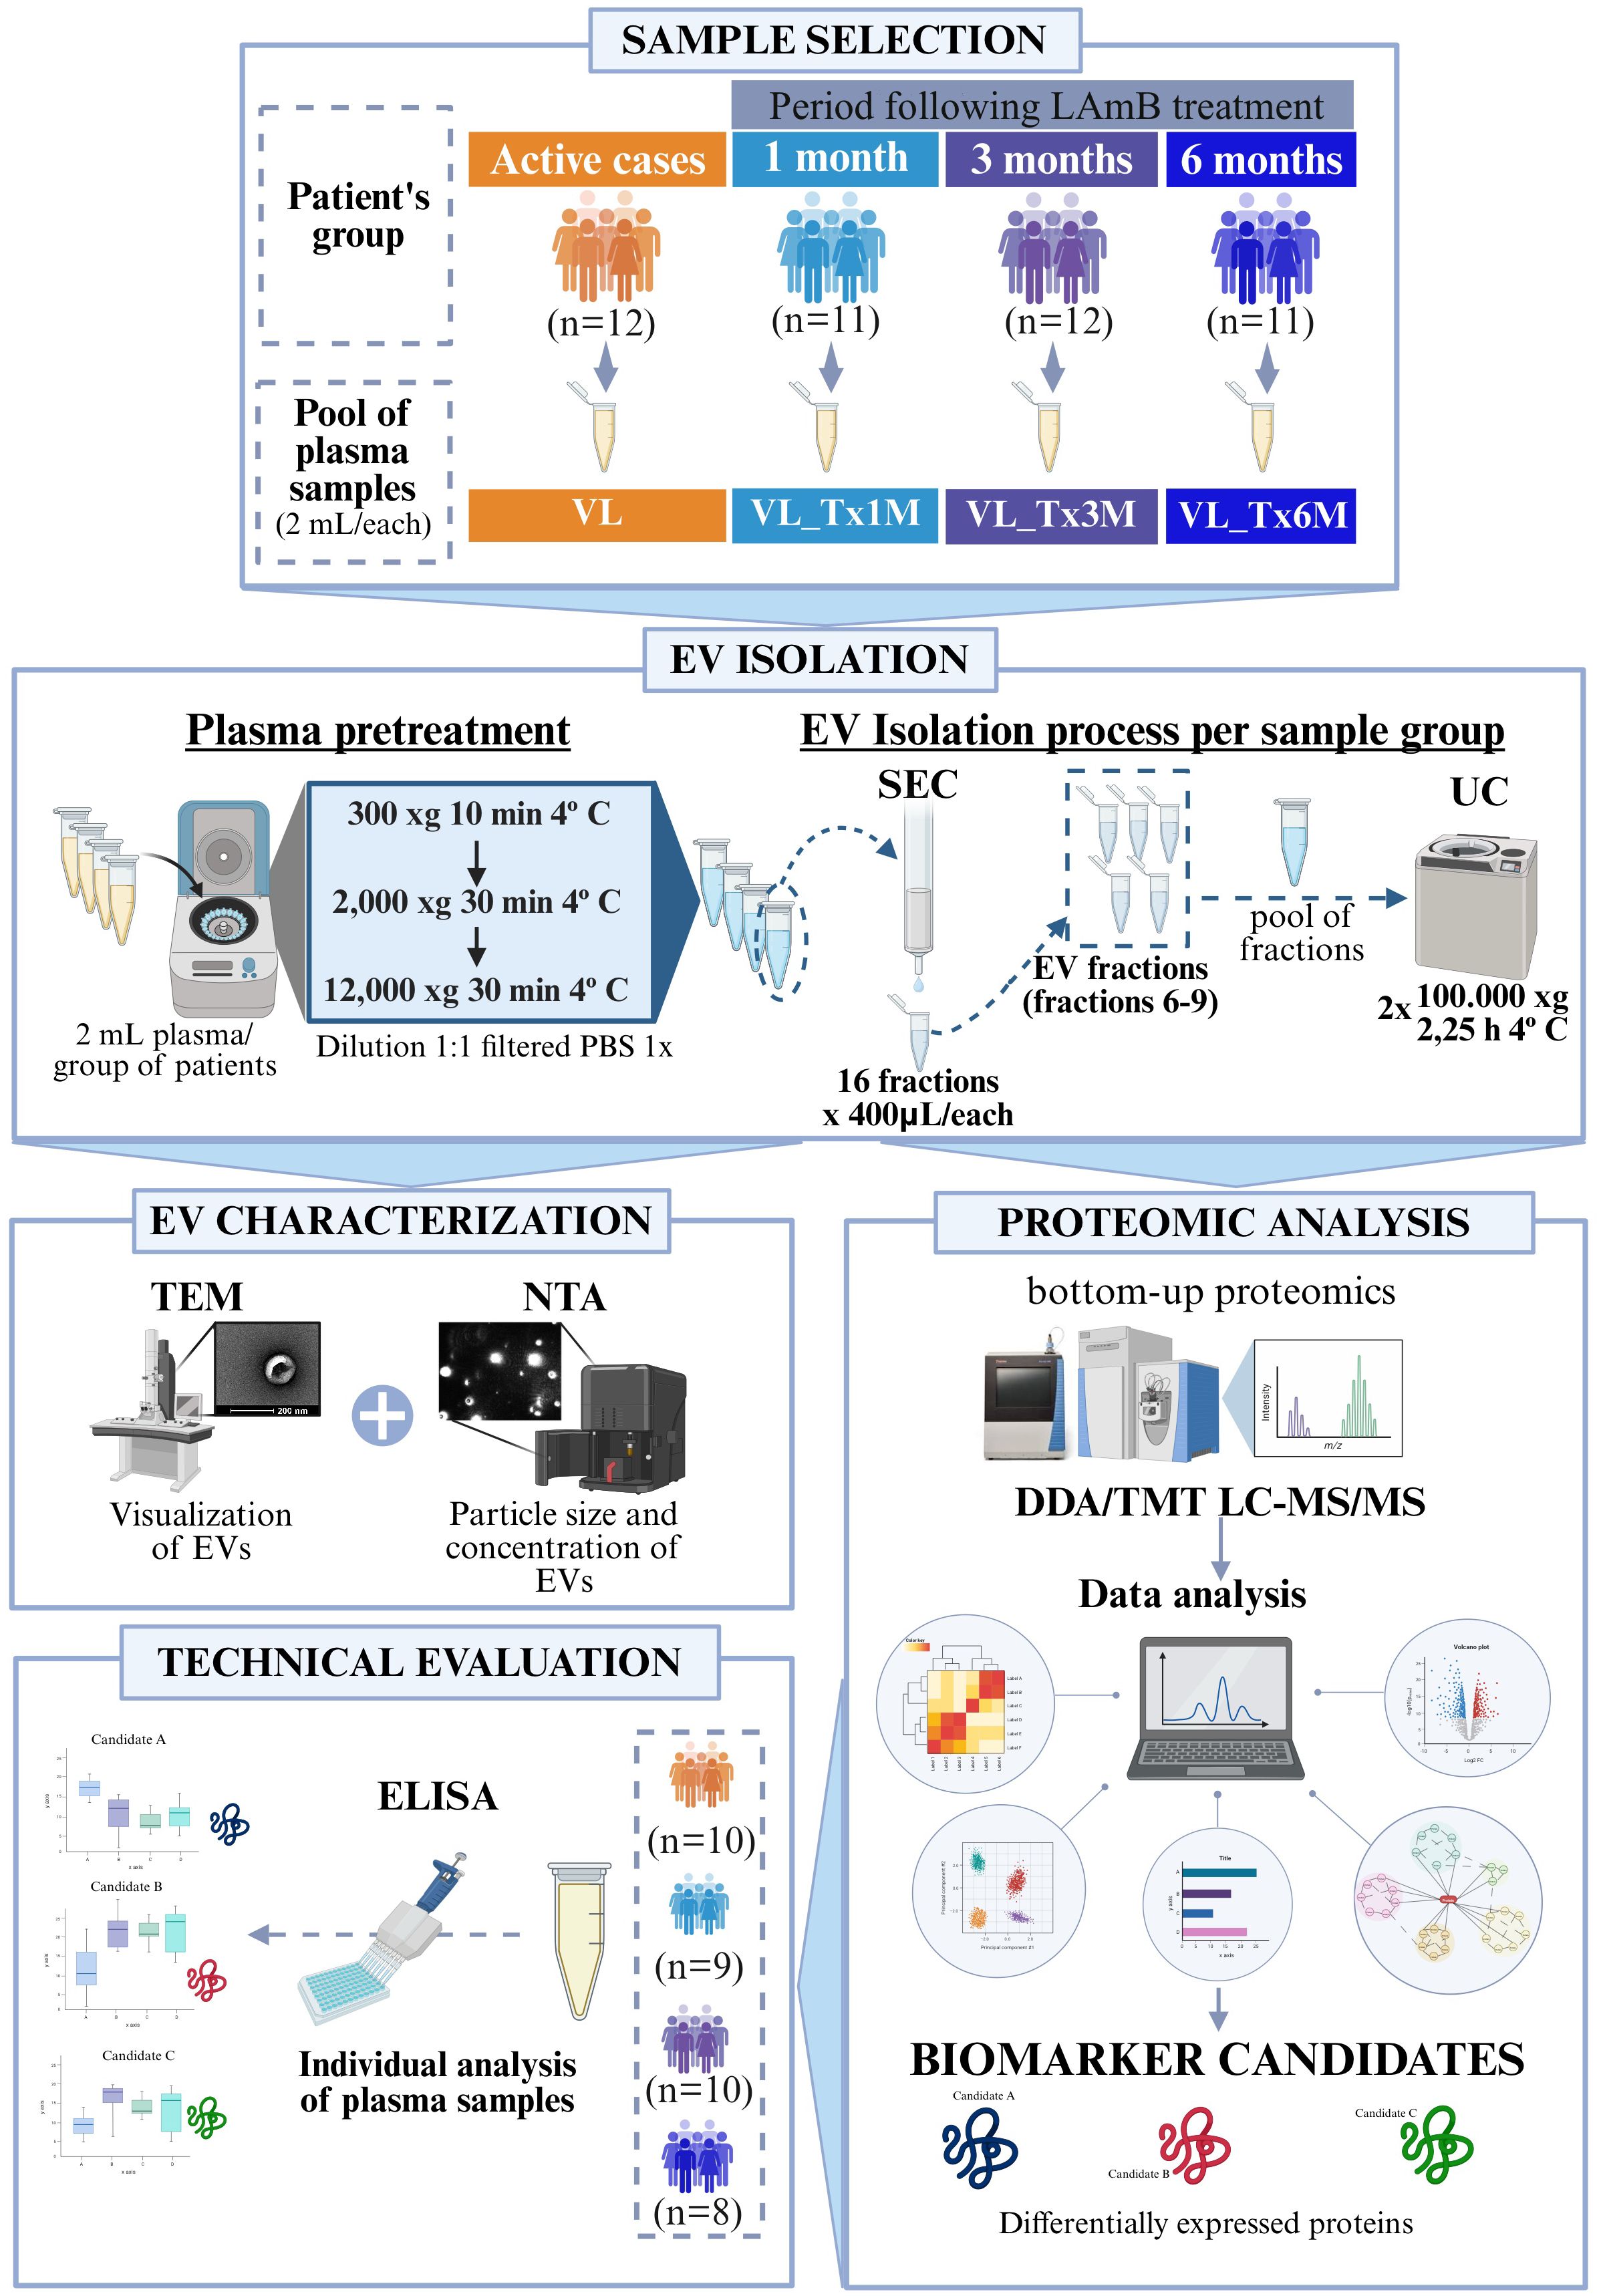
Figure 1. Workflow of the different techniques employed in this study. The flowchart illustrates the methodological steps: 1) Plasma samples from patients with active VL, or 1, 3, or 6 months after treatment; 2) EV isolation involving sample pretreatment followed by the combined SEC and UC method; 3) EV characterization using TEM, and NTA; 4) Bottom-up proteomic analysis using TMT LC-MS/MS followed by bioinformatics analysis to identify biomarker candidates; 5) Technical evaluation by ELISA assays on individual plasma samples to confirm the selected biomarkers.
NTA-determined particle sizes and distributions were consistent across all sample groups, indicating that the EVs isolated mainly contained particles within the 100–300 nm size range (Figure 2A). This range was confirmed by transmission electron microscopy (TEM) whereby the particles appeared cup-shaped alongside aggregates in all isolates (Figure 2B).

Figure 2. Characterization of EVs isolated and proteomics analysis. (A) Particle size distributions from NTA analysis of EVs from VL, VL_Tx1M, VL_Tx3M, and VL_Tx6M patients. Particle size distributions were expressed as percentages after normalization per total number of particles. (B) TEM images of the EVs (scale bar = 200 nm). (C) Top 10 enriched cellular component GO terms of EV proteins, with bars representing the number of proteins and percentages indicated.
To assess protein integrity and potential contamination with abundant plasma proteins, SDS-PAGE was performed on EV samples from each patient group (Supplementary Figure S1). All preparations displayed well-defined protein banding patterns without signs of degradation. Albumin (~66 kDa) was detected in varying amounts across samples, though it was not a predominant component. Through proteomics analysis, we were able to identify 443 human proteins enriched in the EV samples. These proteins were quantified and analyzed for their differential expression, as well as subjected to bioinformatics analysis at a FDR ≤ 0.01 across all samples (Supplementary Table 1).
To check for the presence of EV-related proteins and potential contaminants in the samples, we conducted a detailed analysis in accordance with recommendations of Minimal information for studies on extracellular vesicles (MISEV2023) (49). Three categories were analyzed to confirm the presence of EVs as depicted in Supplementary Table 2. Almost all the protein markers of categories 1 (transmembrane or GPI-anchored proteins) and 2 (cytosolic proteins) were detected. Among the proteins identified for category 1 were tetraspanins CD81 and CD9, integrins (ITG), transferrin (TRF1), or 5’-nucleotidase (NT5E). In category 2, proteins such as flotillin (FLOT2), syntenin (SDCBP), heat shock proteins (HSPA8 and HSP90AB1), actins (ACTA and ACTB), or tubulins (TUBA and TUBB) were detected, among others. Plasma contaminant proteins (Category 3), such as immunoglobulins (IGH) and apolipoproteins (APO), were also detected in all samples. To further evaluate the enrichment of EV-associated proteins and the presence of co-isolated components, we compared the relative abundance (log2TMT intensity) of representative proteins from the three MISEV categories across EV and non-EV fractions (Figure 3). Most proteins enriched in the EV fraction corresponded to category 1b (single-pass transmembrane proteins), including canonical markers such as TRF1, ITGB3, and ITGA2B, as well as category 1a proteins (multipass transmembrane), such as CD9. These findings reinforce the vesicular origin of the isolated fractions. In contrast, proteins assigned to category 3 (potential plasma contaminants depicted as NVEP) were mainly enriched of apolipoproteins (APOA1, APOB) and immunoglobulins, such as IGHM and IGHK were particularly abundant. Their presence is consistent with the known co-isolation of soluble plasma proteins; however, this did not compromise the identification of bona fide EV markers. Altogether, the abundance profiles support the enrichment of vesicle-associated proteins in the EV fraction, despite the co-detection of plasma-derived components.
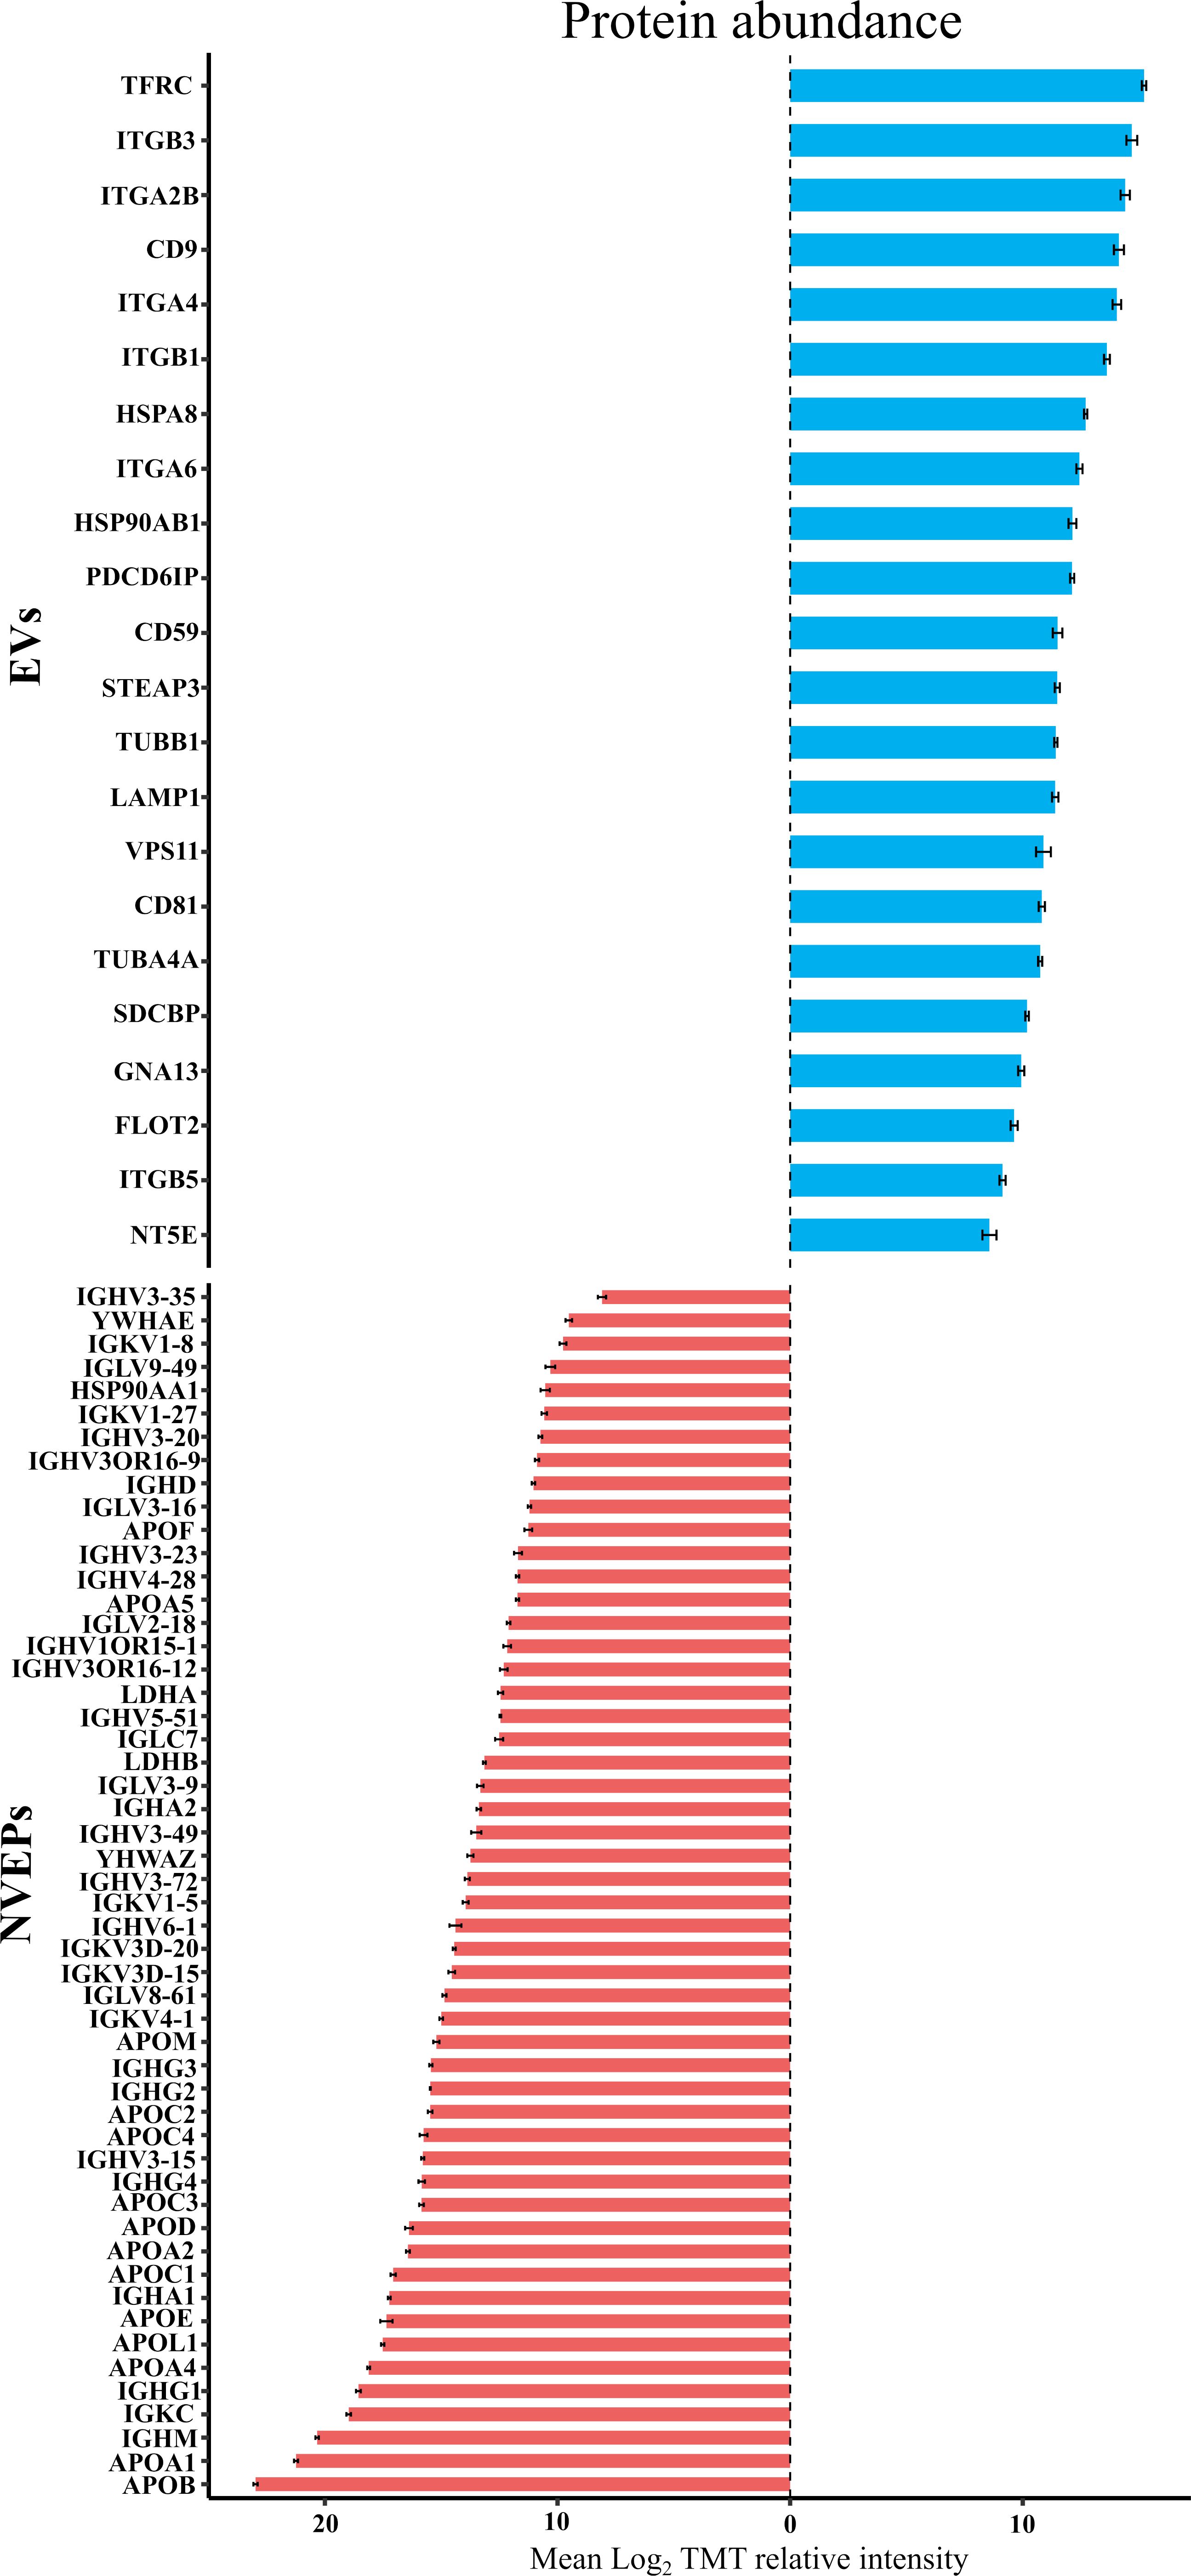
Figure 3. Relative abundance of selected proteins from plasma-derived extracellular vesicle (EV) and non-EV fractions (NVEPs). Barplot showing the mean relative intensity (log2TMT) of proteins classified according to MISEV2023 guidelines as EV-associated (blue bars) or non-EV proteins (red bars). Each bar corresponds to an individual protein, identified by its UniProt code. Protein classification was based on established EV markers, contaminants, and co-isolated components as defined in MISEV2023. The graph illustrates the relative abundance and distribution of representative proteins across both fractions, highlighting the enrichment or depletion of canonical EV proteins versus lipoproteins and plasma proteins frequently co-purified in EV preparations.
We then went on to analyze the GO enrichment of the cellular component (CC) category based on the DAVID database using the human genome as background. Out of 433 proteins, 364 showed strong association with extracellular vesicles, specifically with the enriched term ‘extracellular exosome’ (GO: 0070062), representing 63.1% of the identified proteins (Figure 2C). Moreover, other enriched terms such as ‘extracellular region’ (GO: 0005576), ‘plasma membrane’ (GO: 0005886), ‘extracellular space’ (GO: 0005615), and ‘cytosol’ (GO: 0005829) were notably prominent at percentages of 52.2%, 47.8%, 47.5%, and 32.1% respectively.
These results indicate that the isolated EVs in this study met the criteria for subsequent analysis.
3.2 Differences in the proteomic profiles of plasma-derived EVs in active VL- and successfully treated patients
To determine whether active VL- and successfully treated patients could be distinguished based on their EV protein signatures, we performed a principal component analysis (PCA) including expression levels of the proteins identified. Four separate components, or clusters, corresponding to the four patient groups were detected indicating differences in protein expression profiles according to their disease state (Figure 4A).
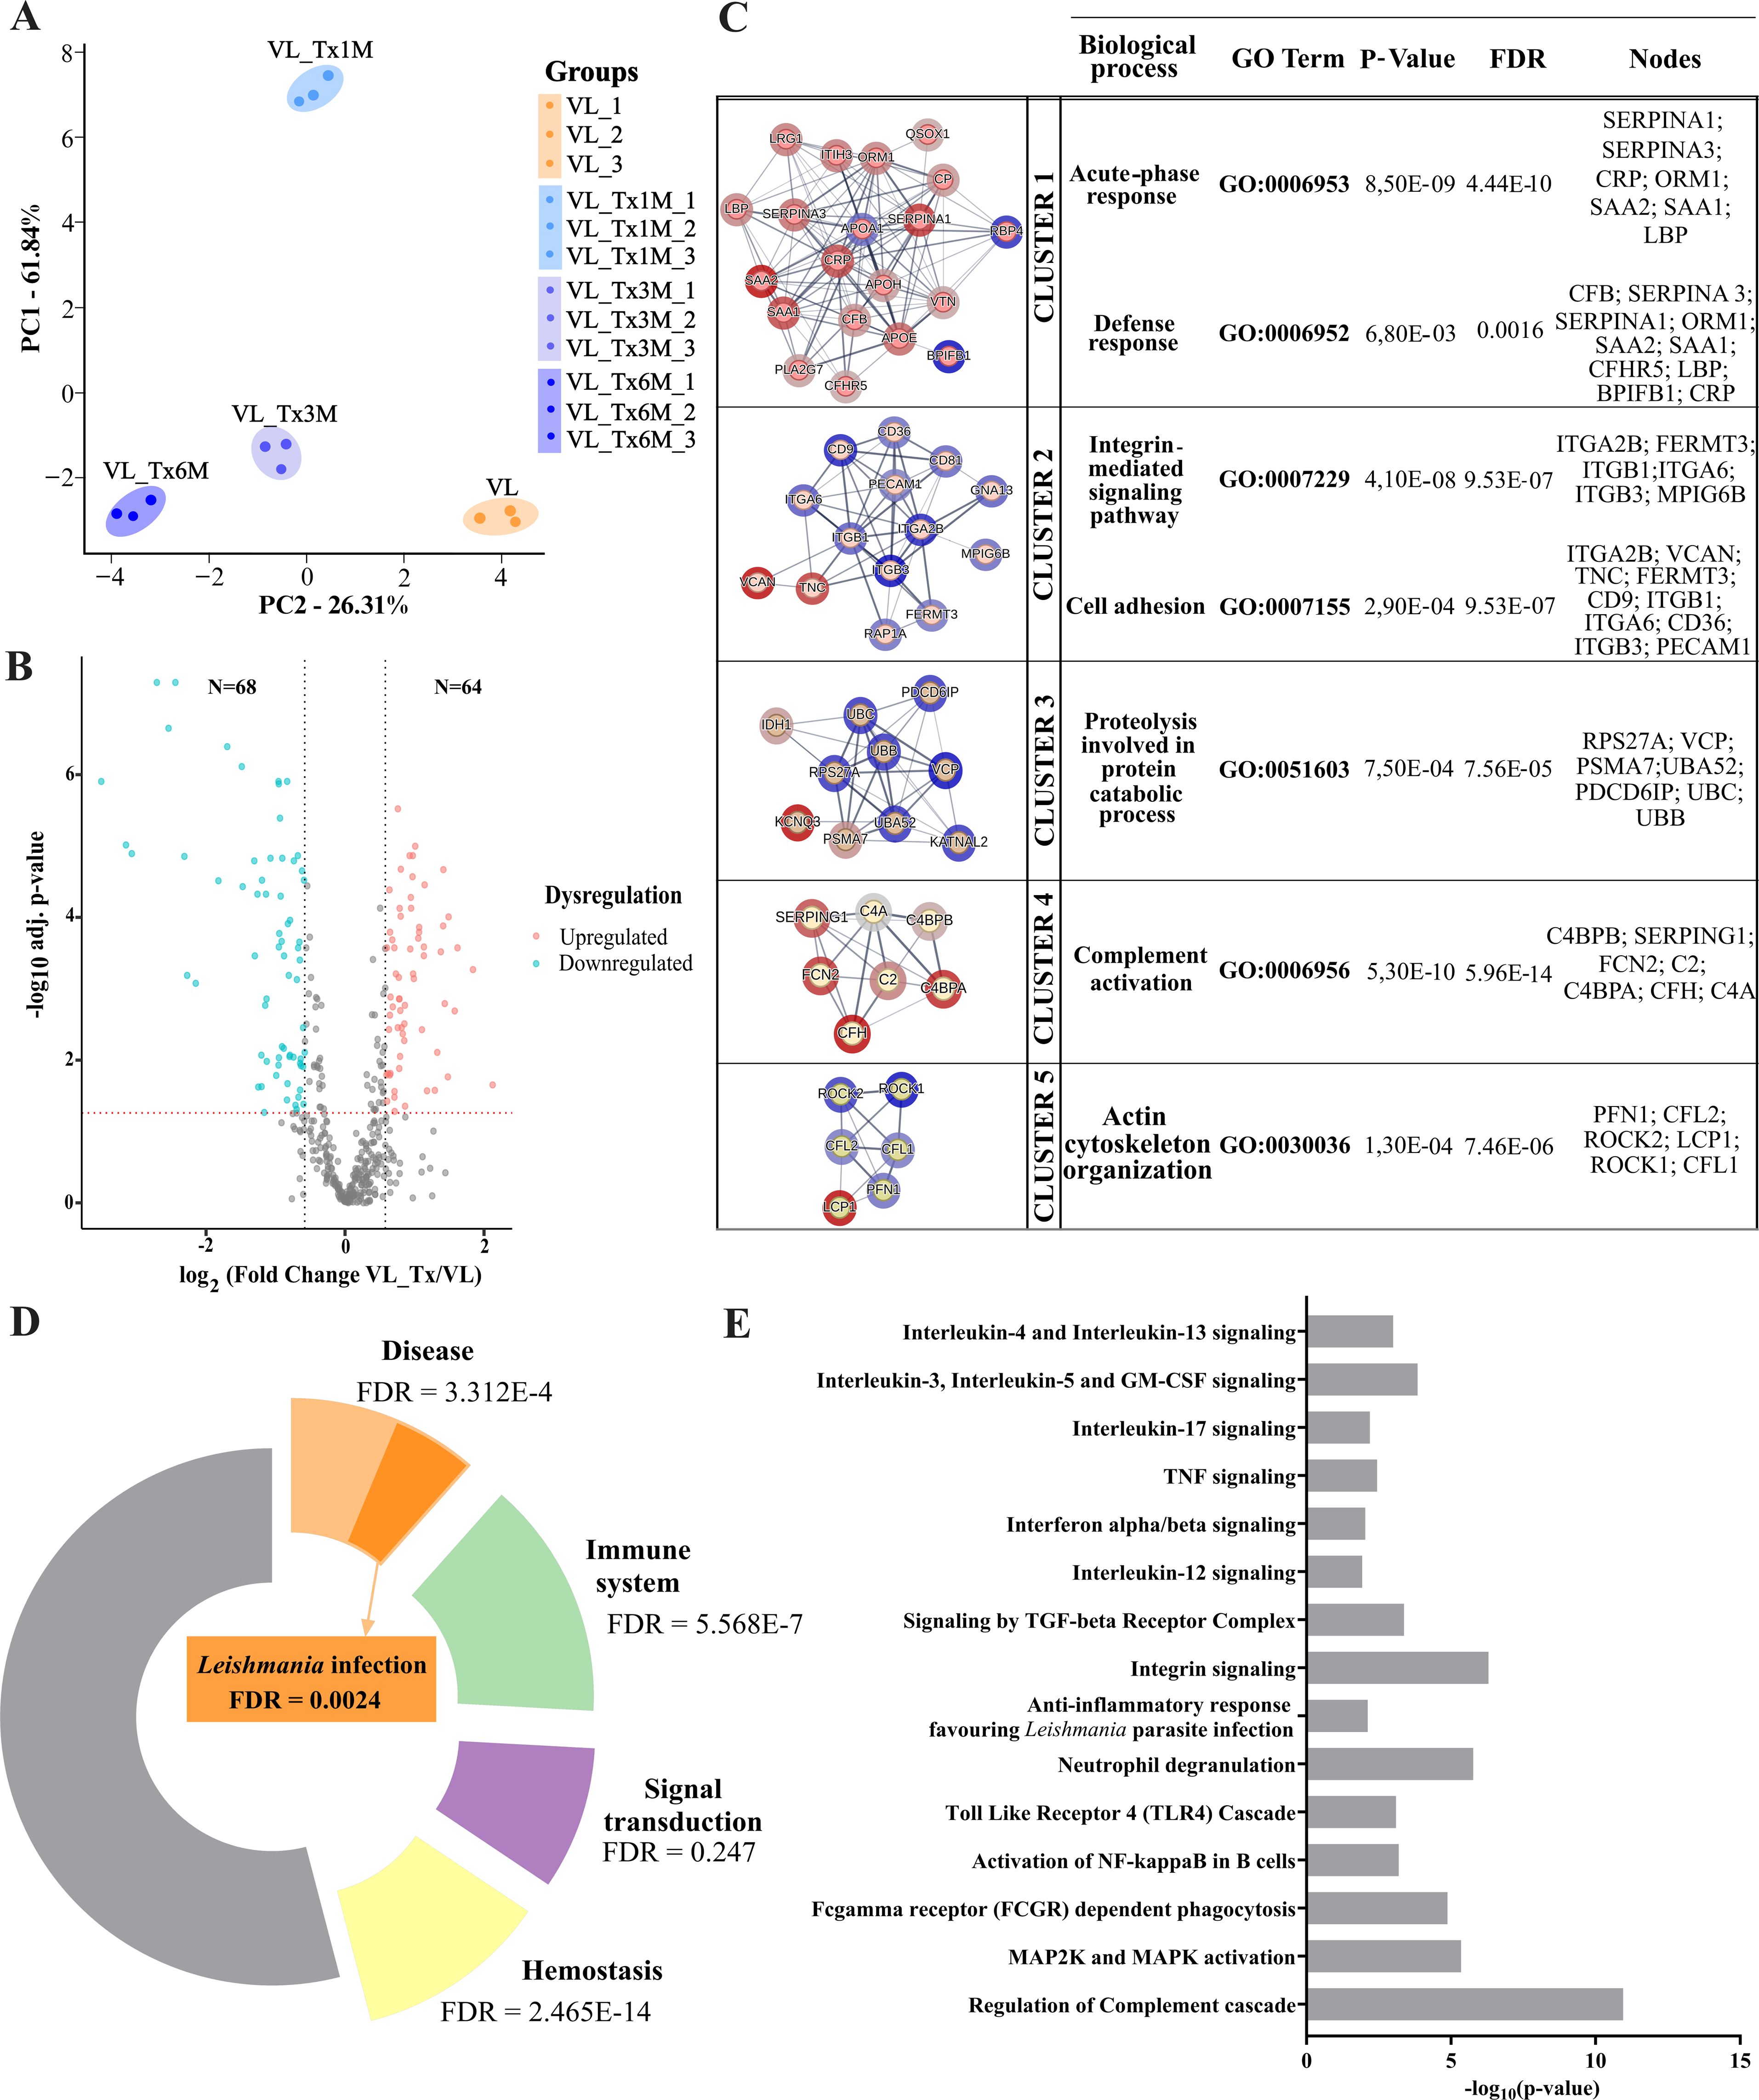
Figure 4. Proteomic profiles of VL and posttreatment groups-host proteins. (A) PCA plot showing variance distribution across different groups (VL, VL_Tx1M, VL_Tx3M, and VL_Tx6M) observed in triplicate samples. (B) Volcano plot illustrating differential protein expression levels in group VL versus VL_Tx. The two black dashed lines represent a log2fold change equal to 0.58 or -0.58. The red dashed line represents a FDR = 0.05. (C) Cluster analysis of dysregulated human proteins identified by STRING, highlighting the top five clusters associated with the Leishmania infection response. Upregulated proteins are marked in blue and downregulated proteins in red. Adjacent to each cluster network, associated biological processes, p-values, and FDR values, along with the proteins contributing to each process are indicated. (D) Donut chart of enriched pathways detected by Reactome. (E) Bar chart of enriched biological processes related to Leishmania infection and the immune response identified through Reactome analysis.
In a volcano plot comparing protein expression levels in active VL- and successfully treated patients, all groups of treated patients merged (VL_Tx) separately to the active VL patients, or VL group. 132 differentially expressed proteins (DEPs) (FC ≥ 1.5, FC ≤ 0.67, p ≤ 0.05) were identified, 64 of which were upregulated and 68 downregulated in the treated patient compared to VL group (Figure 4B).
To gain insight into the biological roles of distinctively expressed EV proteins in active VL- and treated patients, we compared dysregulated proteins between the groups VL and VL_Tx through STRING analysis. This tool revealed intercellular interactions and different gene ontology categories (FDR = 0.01). A total of 20 clusters were identified and the top 5 clusters were further analyzed for the biological pathways of the genes involved in the modules (Figure 4C). Functions strongly associated with inflammatory processes were unveiled. Cluster 1 included defense response (10/1,394 proteins, p = 8.50E-09; FDR = 4.44E-10) and acute-phase response (7/42 proteins, p = 6.80E-03; FDR = 0.0016), both crucial for activating the immune system during infection. Cluster 2 involved integrin-mediated signaling (6/100 proteins, p = 4.10E-08; FDR = 9.53E-07) and cell adhesion (10/965 proteins, p = 2.90E-04; FDR = 9.53E-07), emphasizing cell communication and attachment. Cluster 3 was enriched in proteolysis involved in protein catabolic processes (7/649 proteins, p = 7.50E-04; FDR = 7.56E-05), reflecting protein degradation processes. Cluster 4 focused on complement activation (7/60 proteins, p = 5.30E-10; FDR = 5.96E-14), a key component of innate immunity, and Cluster 5 on actin cytoskeleton organization (6/547 proteins, p = 1.30E-04; FDR = 7.46E-06), which is important for cell structure and movement. The upregulated and downregulated proteins in each cluster are listed in columns alongside the corresponding cluster (Figure 4C).
Additionally, a Reactome pathway analysis was conducted to characterize the main pathways associated with the significantly altered proteome in patients with active disease compared to treated patients, to further support the involvement of inflammation-related pathways identified in the STRING clusters. Among the pathways identified, several key processes were enriched in the majority of these DEP, including signal transduction (30/2,606 proteins, FDR = 2.47E-1), hemostasis (40/727 proteins, FDR = 2.46E-14), immune system (50/2,219 proteins, FDR = 5.57E-7), and disease pathways (40/2,188 proteins, FDR = 3.31E-4), as shown in Figure 4D. Notably, within the disease group, the Leishmania infection pathway was particularly enriched in DEP (9/254 proteins, FDR = 2.39E-3).
In a more in-depth analysis of the most enriched groups, we identified several key processes associated with the immune response to Leishmania. These included signaling pathways mediated by interleukin-17 (4 proteins, p = 0.006; FDR = 0.006), interferon alpha/beta (4 proteins, p = 0.009; FDR = 0.009), TNF (4 proteins, p = 0.003; FDR = 0.004), interleukin-12 (3 proteins, p = 0.01; FDR = 0.01), interleukin-3, interleukin-5 and GM-CSF (5 proteins, p = 1.42E-4; FDR = 5.69E-4). We also observed pathways involving receptor activation, including the ‘toll-like receptor 4 (TLR4) cascade’ (7 proteins, p = 8.02E-4; FDR = 0.001) and ‘FCGR-dependent phagocytosis’ (10 proteins, p = 1.32E-5; FDR = 1.59E-4). Additionally, pathways related to communication processes, such as ‘integrin signaling’ (6 proteins, p = 5.10E-7; FDR = 1.88E-5), and host defense mechanisms like ‘neutrophil degranulation’ (18 proteins, p = 1.71E-6; FDR = 5.07E-5) and ‘regulation of the complement cascade’ (15 proteins, p = 1.11E-11; FDR = 1.39E-9) were enriched. Further, cascade-like pathways, such as ‘MAP2K and MAPK activation’ (6 proteins, p = 4.52E-6; FDR = 8.13E-5), were also identified. Other pathways highlighted were related to anti-inflammatory responses, including the pathway ‘anti-inflammatory responses that favor Leishmania parasite infection’ (6 proteins, p = 0.007; FDR = 0.007) and ‘interleukin-4 and interleukin-13 signaling’ (6 proteins, p = 0.001; FDR = 0.002) (Figure 4E). The full list of pathways identified through Reactome, along with the corresponding proteins involved in each pathway, is provided in Supplementary Table 3.
3.3 Differential abundance of EV proteins in VL- and treated patients as potential host biomarkers of cure
Our volcano plot analysis was designed to examine the proteomic signatures of patients at different time points after treatment and to compare these to that of patients with active disease. Differences were detected among groups in the total number of DEPs, with 178 identified in the 1- and 3- month posttreatment groups, and 153 in the 6-month posttreatment group, suggesting that treatment affects the overall protein signature of patients (Supplementary Figure 2). To further investigate these temporal changes in proteomic profiles during treatment, a heatmap was prepared with expression values of all quantifiable proteins. This analysis was based on described categories, with detailed pathways from the DAVID and Reactome databases included for a more comprehensive assessment. Our results illustrated in Figure 5 highlight not only the most enriched pathways related to the immunology of Leishmania infection, but also revealed distinct clusters of proteins with unique temporal expression patterns (Supplementary Table 4).
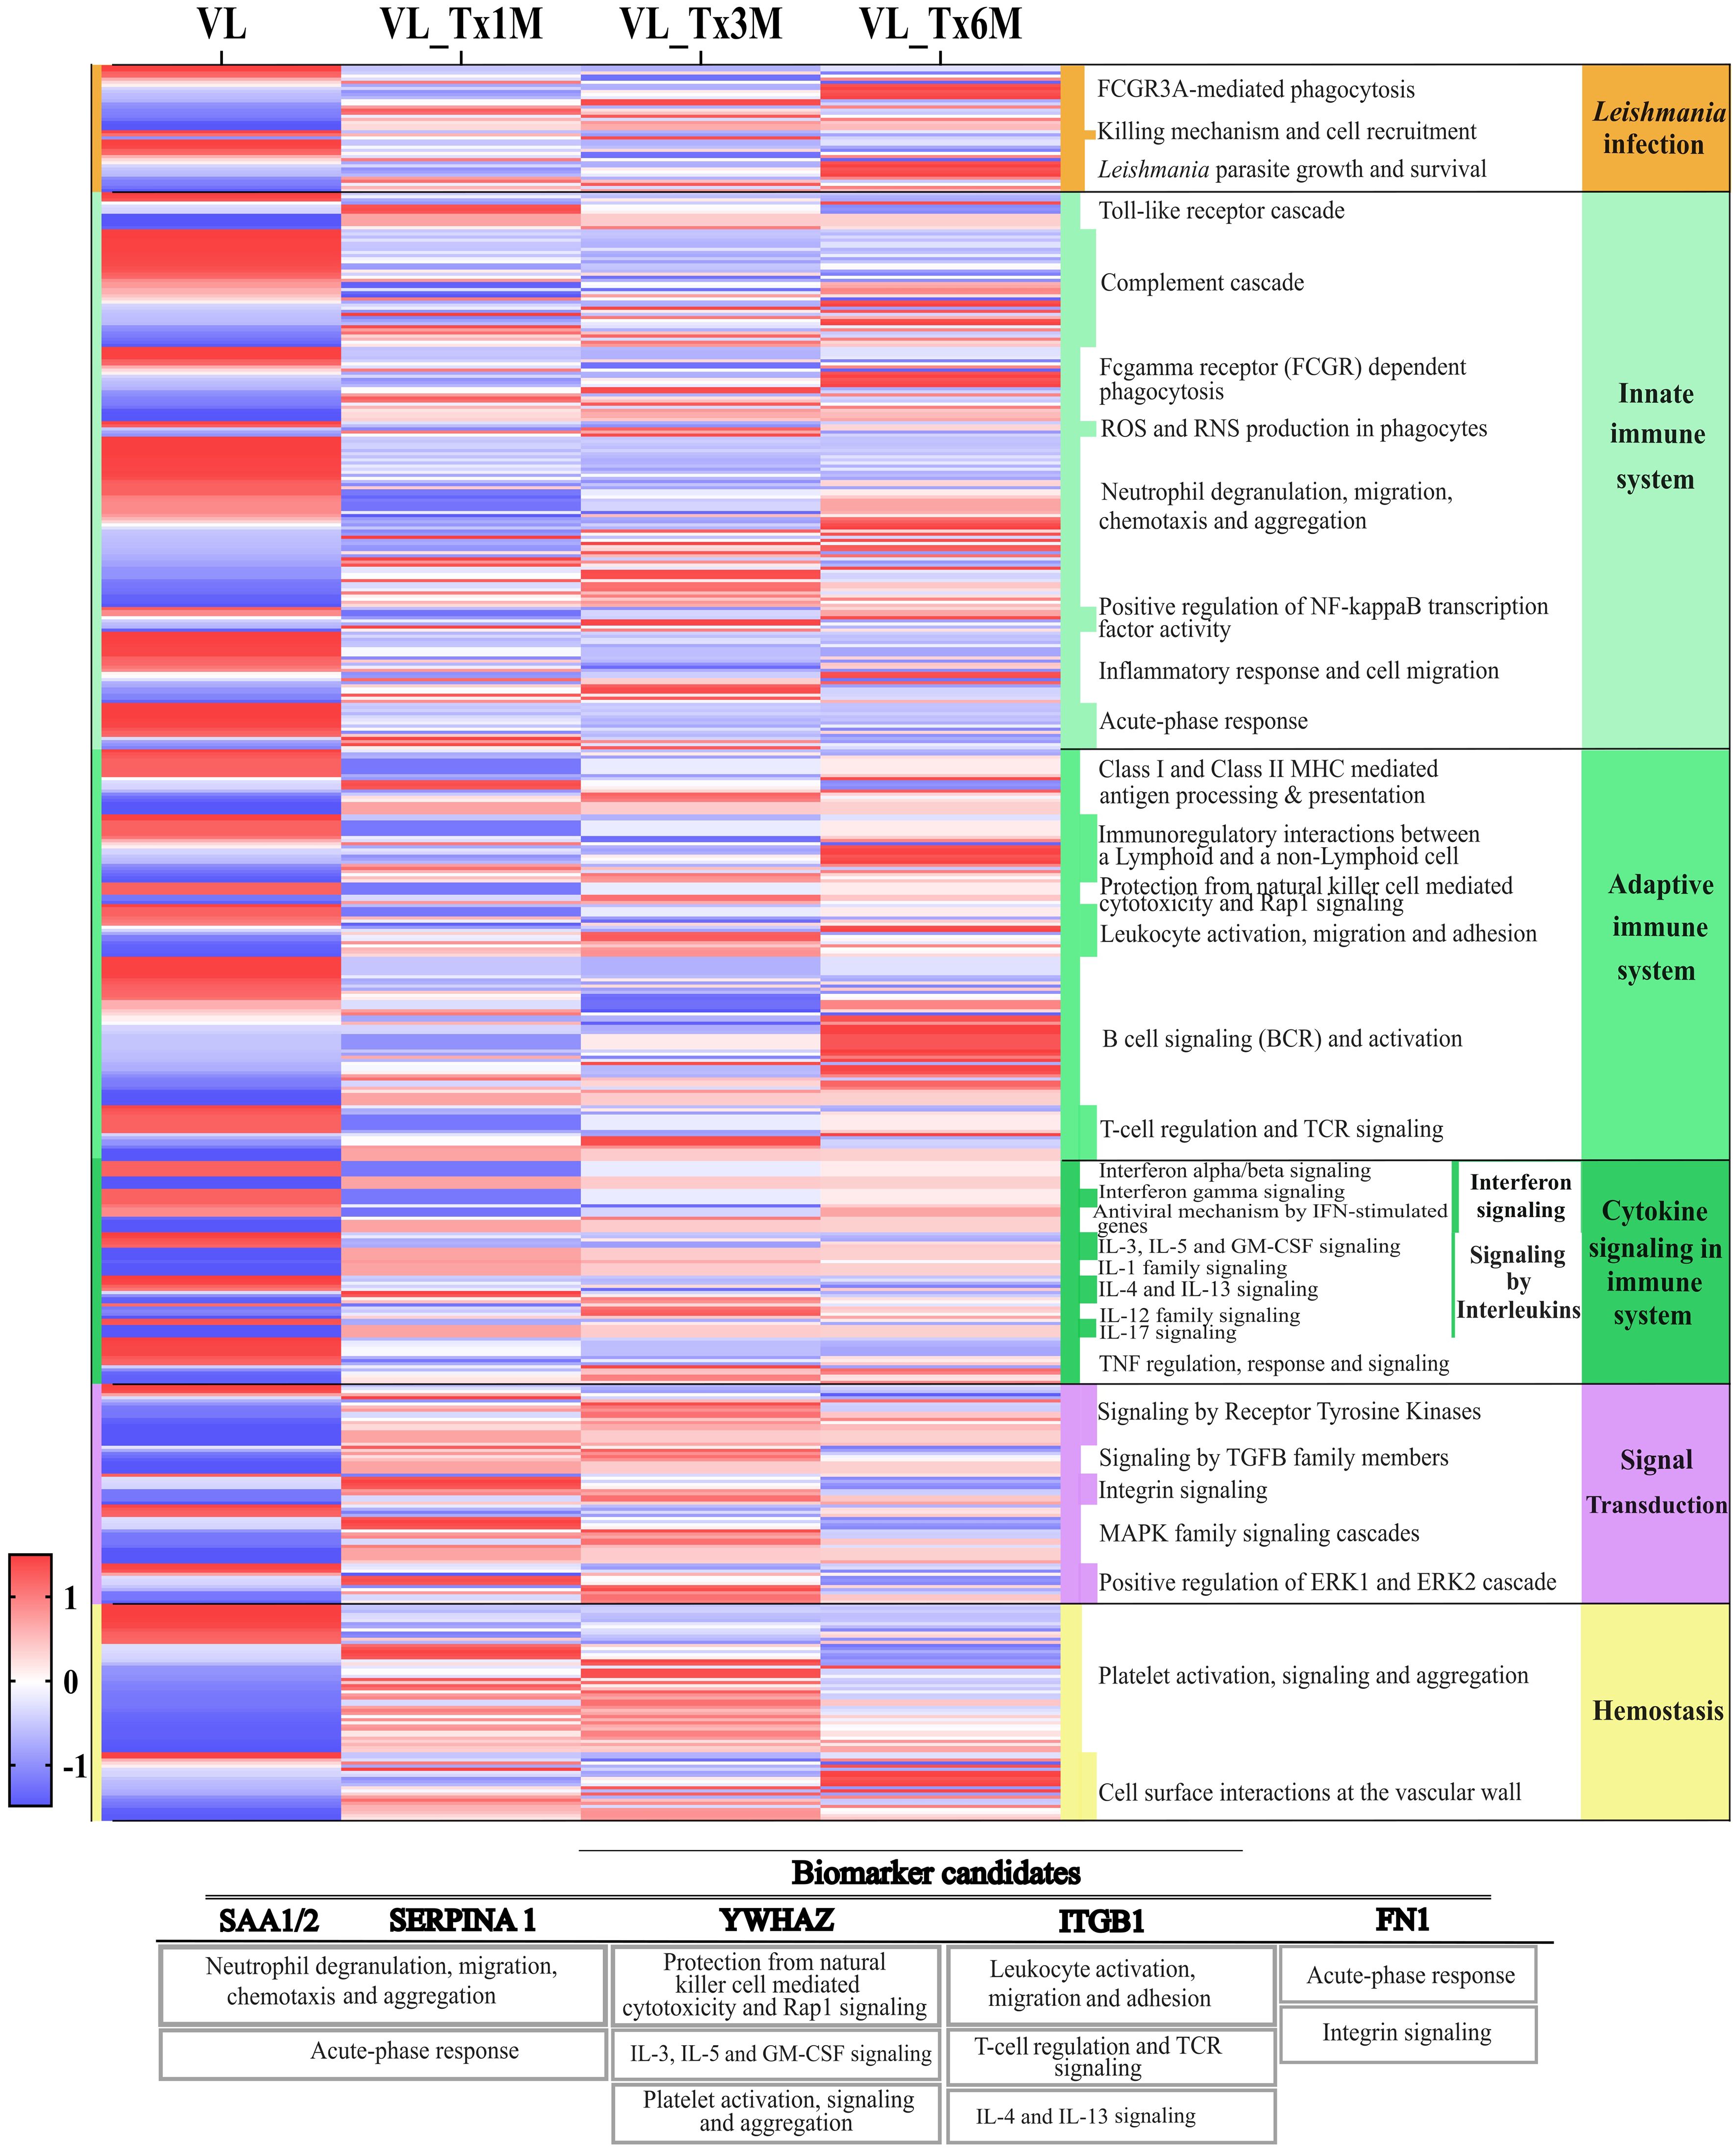
Figure 5. Heatmap of the proteomic profiles of the patient groups VL and VL_Tx1M, VL_Tx3M, and VL_Tx6M across different pathways. Columns represent the human proteins identified in each group, and rows indicate expression levels of these proteins across the groups. Protein expression levels were normalized using z-score transformation and visualized on a red-to-blue scale indicating relative enrichment or depletion, respectively. Associated Reactome pathway categories are shown on the right side of the heatmap. Additionally, a table with the biomarker candidates is included below, indicating each candidate protein and its principal associated biological processes.
Distinct expression patterns were observed in pathways associated with Leishmania infection in patients with VL compared to treated patients. In samples from patients with active VL, ‘FCGR3A-mediated phagocytosis’ and ‘Leishmania parasite growth and survival’ were pathways showing most of their proteins downregulated (Figure 5). From the first month posttreatment, a change in DEPs was observed, until 6 months, when a contrasting profile to that of active VL was observed in that 11/15 and 9/14 proteins were upregulated, respectively for the two pathways. Further, proteins linked to the ‘killing mechanisms and cell recruitment’ pathway were upregulated during active VL, whereas 2/3 of these proteins were negatively expressed in the 3- and 6-month posttreatment groups (Figure 5).
The innate immune system pathways ‘complement cascade’, ‘inflammatory response and cell migration’ and ‘acute-phase response’ were highly enriched in the active VL group. As with the Leishmania infection pathways described above, the proteins involved in these three pathways were significantly downregulated in the 1- and 3-month posttreatment groups. Particularly, for the ‘acute-phase response’, 10 DEPs were all downregulated in VL_Tx6M (Supplementary Table 4). In relation to the proteins involved in the ‘neutrophil degranulation, migration, chemotaxis, and aggregation’ pathway, we observed a mixed expression profile with half of the 55 identified proteins enriched and the other half depleted during VL. 70% (25/36) of the upregulated proteins in this pathway were underexpressed in VL_Tx1M. However, this depleted expression pattern was slightly modified in the other treatment groups compared to the active VL group (54% and 53% of proteins downregulated in VL_Tx3M and VL_Tx6M, respectively).
Within the adaptive immune response, the most obvious change in protein expression was noticed in the ‘B cell signaling (BCR) and activation’ pathway, for which 71% of dysregulated proteins in the VL group (22/31) were upregulated in VL_Tx6M. However, in the earlier stages of treatment, this pathway showed no significant differences in DEPs. In the pathways ‘protection from natural killer cells mediated cytotoxicity and Rap1 signaling’ and ‘leukocyte activation, migration, and adhesion’, 3/3 and 8/11 proteins were upregulated in VL_Tx3M and VL, respectively, and this situation persisted 6 months after treatment. Among proteins related to ‘T-cell regulation and TCR signaling’, 8/14 (57%) were still downregulated 1 month after treatment but this scenario was reversed at VL_Tx3M and VL_Tx6M, when most proteins were significantly upregulated compared to the VL group.
Within the ‘interferon signaling’ pathways, in which we found proteins involved in ‘interferon alpha/beta signaling’ and ‘interferon gamma signaling’, consistent significant dysregulation was observed after the first month of treatment. This group was the only one in which downregulated proteins versus the VL group were identified (13/23, 57%). When we considered pathways related to interleukin signaling, we found that 50%-56% proteins (17/34 at VL_Tx1M and VL_Tx6M, 19/34 at VL_Tx3M) were significantly upregulated in the VL_Tx groups compared to VL. Particularly ‘IL-3, IL-5, and GM-CSF signaling’ and ‘IL-17 signaling’ pathways showed sustained upregulation over the first month posttreatment.
Finally, in signal transduction and hemostasis-related pathways, proteins were mostly downregulated in active VL. Following treatment, significant enrichment was observed compared to VL, particularly 1 and 3 months after treatment, suggesting the recovery of these processes. This trend was particularly evident in pathways like ‘signaling by TGF-beta family members’, ‘MAPK family signaling cascade’, and ‘platelet activation, signaling, and aggregation’.
These results offer information on the specific protein signature associated with plasma-derived EVs from individuals affected by this disease, including differences in its expression produced in response to treatment. To further explore the biological significance of early posttreatment changes, we performed two separate Gene Ontology (GO) enrichment analyses on proteins found dysregulated 1 month and 3 months after treatment, in an effort to identify the most affected biological processes during the initial stages of posttreatment recovery (Supplementary Table 5). In total, 405 biological processes were identified, with 208 shared between both time points, 116 unique to VL_Tx1M and 81 to VL_Tx3M. The most enriched biological terms, including those common to both treatment time points and those unique to each, are illustrated in Figure 6, with processes grouped by functional category.

Figure 6. GO analysis of biological processes associated with proteins dysregulated in patients 1 month (1M) or 3 months (3M) posttreatment. The bar chart illustrates the most significantly enriched biological processes (FDR ≤ 0.01) grouped into functional categories. Bars indicate the significance of each process (-log10(FDR)), with lighter blue bars representing 1M processes and darker blue bars representing 3M processes. Circle sizes (small, medium, large) indicate the number of proteins contributing to each process, as shown in the key. Processes are classified into functional groups.
Common processes between the 1- and 3-month posttreatment time points suggest an ongoing process of immune response modulation compared to VL. Among them, ‘humoral immune response’ (FDR = 4.51E-14 and 1.33E-07), ‘innate immune response’ (FDR = 9.85E-08 and 3.8E-04), ‘adaptive immune response’ (FDR = 9.38E-06 and 3.4E-03), and ‘regulation of cytokine production’ (FDR = 9.17E-05 and 0.014) were highly enriched in VL_Tx1M compared to VL_Tx3M. ‘B cell mediated immunity’, ‘antimicrobial humoral response’ and ‘lymphocyte mediated immunity’ were only enriched after 1 month of treatment, whereas ‘immunoglobulin mediated immune response’, ‘regulation of leukocyte migration’, and ‘cellular extravasation’ were only present after 3 months. In addition, other common processes with higher quantities of proteins involved at 1 month were ‘response to stress’ (FDR = 3.82E-18 and 4.94E-12), ‘integrin-mediated signaling pathways’ (FDR = 4.51E-08 and 1.55E-05) or ‘platelet activation’ (FDR = 1.60E-13 and 2.65E-08). In contrast, among the common processes found to be more enriched at 3 months we identified ‘cell adhesion’ (FDR = 3.87E-08 at 1M vs 5.05E-10 at 3M) and ‘regulation of cell migration’ (FDR = 0.00013 and 1.29E-05). Finally, the processes ‘apoptotic cell clearance’ or ‘phagocytosis, engulfment’ were only identified at 3 months posttreatment.
Potential biomarker candidates were then identified by considering fold change values (FC ≥ 1.5, FC ≤ 0.67) of proteins involved in several of the described pathways using data from Supplementary Table 1. We focused on proteins found to be dysregulated from the first to the third month after treatment, which are considered early stages of cure (Table 2). Further, we selected proteins whose biological processes and associated pathways were related to immune response and parasite infection, as these are critical for VL progression and treatment response. Among proteins showing different expression patterns over time, the heat shock protein HSP90AB1, alpha-1-antitrypsin (SERPINA1), serum amyloid A-1 and A-2 (SAA-1; SAA-2) and plastin-2 (LCP1) were consistently downregulated in all three treatment groups. SERPINA1 and SAA-1/SAA-2 showed the lowest expression of all proteins, FC VL_Tx1M = 0.14 (p = 2.71E-11; FDR = 6.01E-9) and FC VL_Tx3M = 0.18 (p = 1.01E-7; FDR = 2.89E-6), respectively, and were therefore considered for further validation analysis. Both these proteins play a role in ‘neutrophil degranulation, migration, chemotaxis and aggregation’ and ‘acute-phase response’ pathways. Other downregulated proteins related to both the innate and adaptive immune system pathways, were S100-A9 (FC = 0.61; p = 9.85E-5; FDR = 0.0003) and CAMP (FC = 0.28; p = 4.31E-9; FDR = 1.12E-7), which were only found significantly dysregulated 1 month after treatment compared to the state of active disease. In addition, kiminogen-1 (KNG1) and vascular cell adhesion protein 1 (VCAM1), involved in ‘inflammatory response and cell migration’, were only dysregulated at VL_Tx3M (FC = 0.63, p = 9.15E-6 and FDR = 6.64E-5 and 0.42, p = 0.0001 and FDR = 0.0006, respectively).
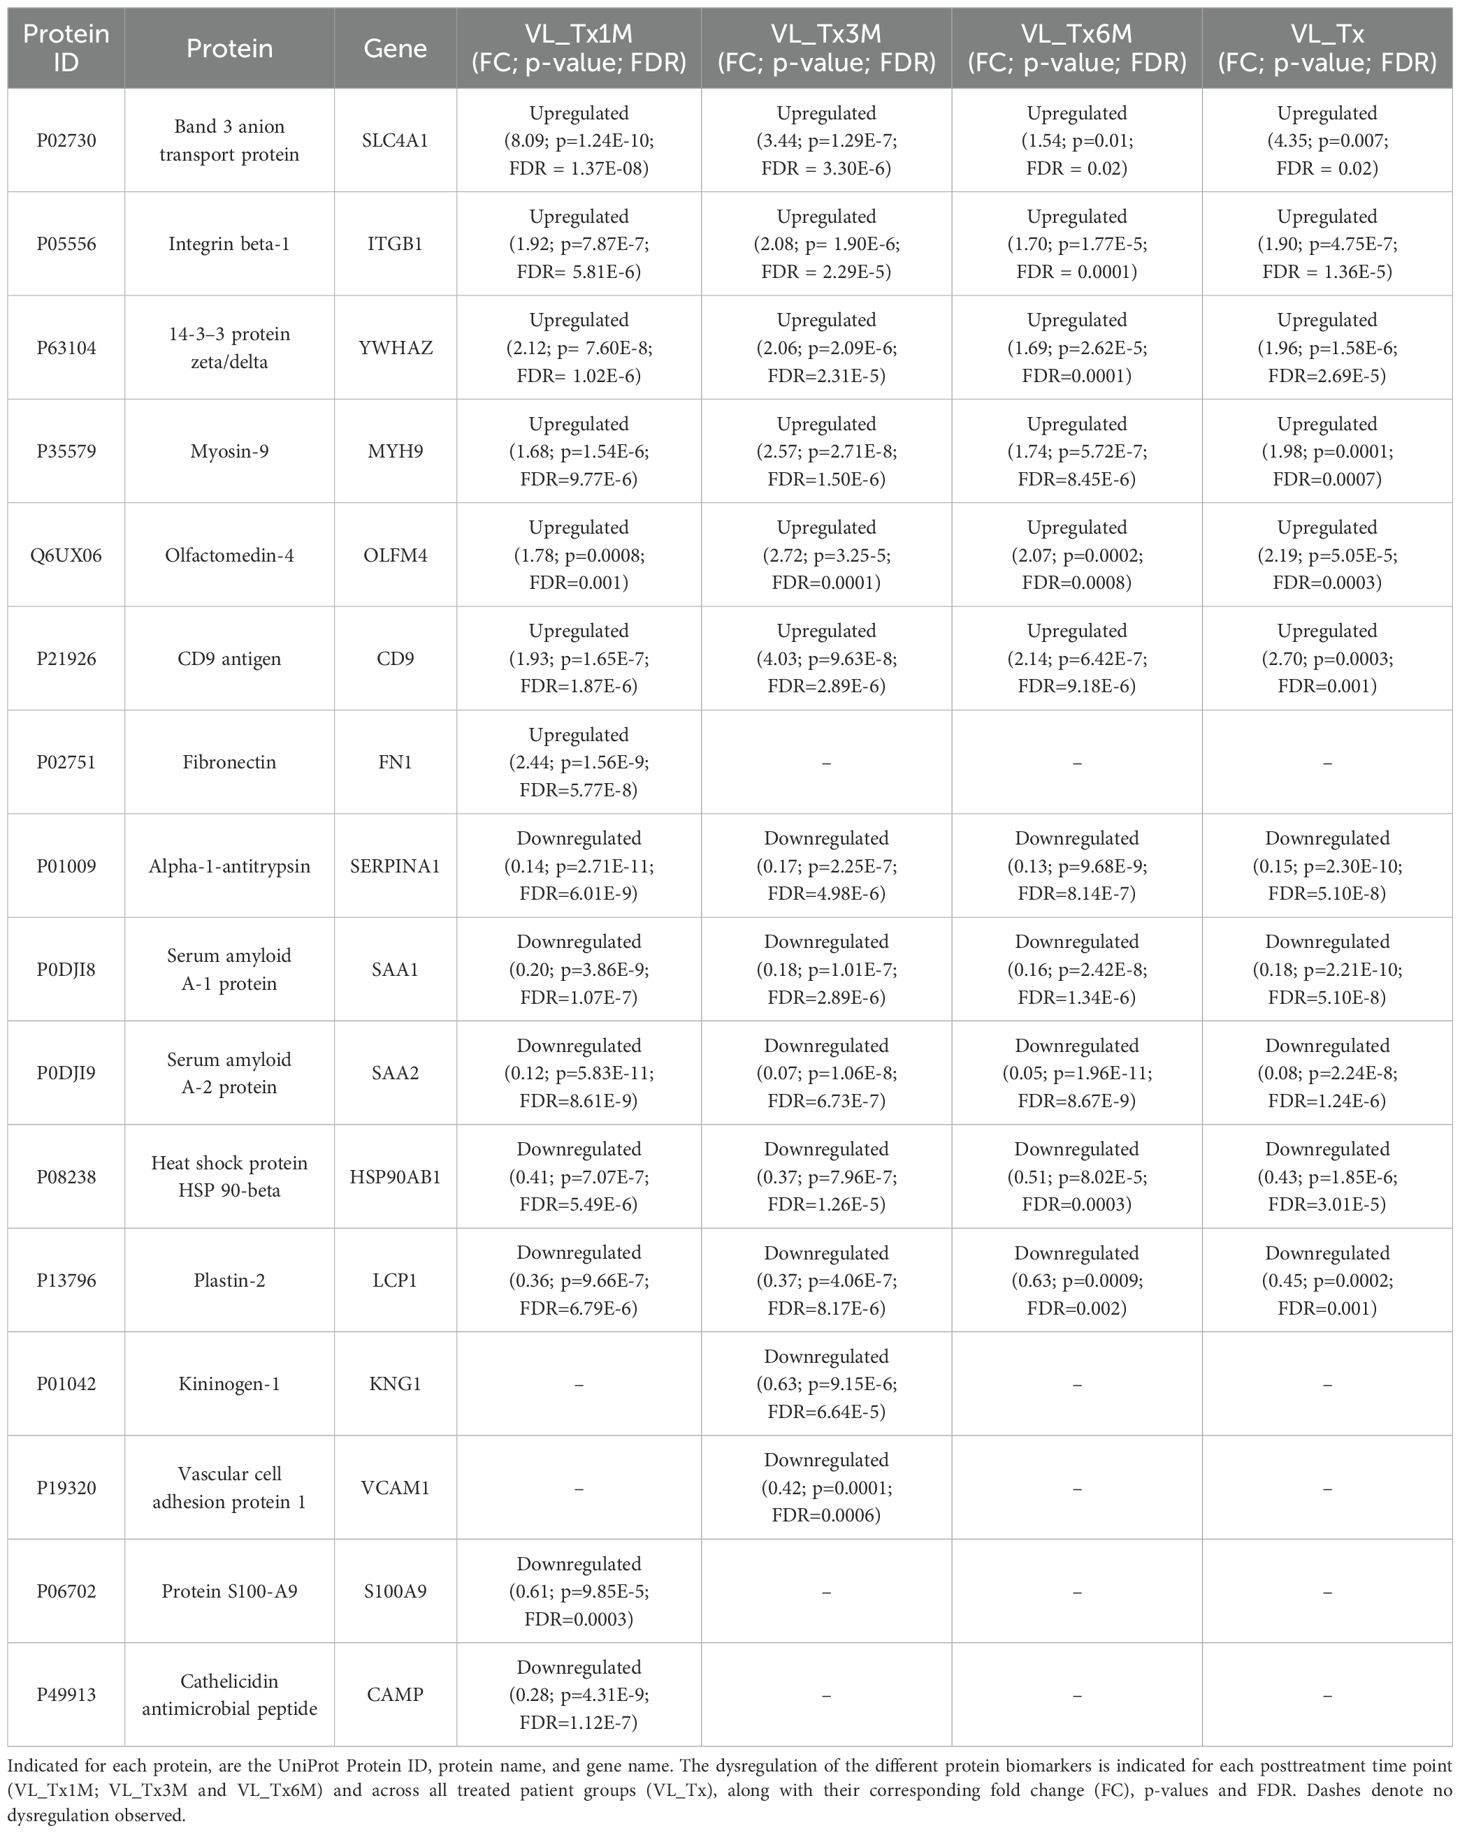
Table 2. Candidate EV protein biomarkers based on their roles in pathways related to the immune response and Leishmania infection comparing samples from treated patients to those with VL.
In contrast, myosin-9 (MYH9), olfactomedin-4 (OLFM4), 14-3–3 protein zeta/delta (YWHAZ), CD9 and integrin beta-1 (ITGB1) were upregulated across all treatment groups. YWHAZ emerged as a possible candidate due to its consistent upregulation in the early posttreatment stages compared to VL (FC VL_Tx1M = 2.12, p = 7.60E-8, FDR = 1.02E-6; VL_Tx3M = 2.06, p = 2.09E-6, FDR = 2.31E-5). This protein participates in ‘IL-3, IL-5, and GM-CSF signaling’, ‘platelet activation, signaling and aggregation’ and ‘protection from natural killer cell mediated cytotoxicity’ pathways. ITGB1 was found to be predominantly upregulated 3 months after treatment (FC VL_Tx3M = 2.08, p = 1.90E-6, FDR = 2.29E-5). This protein plays a role in ‘leukocyte activation, migration and adhesion’, ‘T-cell regulation and TCR signaling’ and ‘IL-4 and IL-13 signaling’. Finally, fibronectin (FN1), which is involved in ‘acute-phase response’, ‘IL-4 and IL-13 signaling’ and ‘integrin signaling’, was only found upregulated at 1 month. This protein showed a FC = 2.44 (p = 1.56E-9; FDR = 5.77E-8) compared to the VL state.
The band 3 anion transport protein (SLC4A1) emerged as another protein of interest due to its remarkable increase in expression noted early after treatment, with its highest fold change observed at 1 month posttreatment (FC VL_Tx1M = 8.09, p = 1.24E-10, FDR = 1.37E-8).
3.4 Potential biomarkers for monitoring VL treatment
To identify host proteins relevant to Leishmania infection in whole plasma by ELISA, we searched for those proteins showing fold change differences in the VL and early posttreatment groups by examining SAA1/2, SERPINA1, SLC4A1, ITGB1, FN1, and YWHAZ.
Plasma expression levels of FN1, SERPINA1, SLC4A1 and YWHAZ concentrations (Figures 7A–D) showed no significant differences across the different patient groups.). ITGB1 levels showed a non-significant differing trend (p = 0.633) in plasma samples from patients after 6 months of treatment (mean = 1622 pg/mL) compared to other groups, the most notable difference observed with respect to active VL patients (mean = 663 pg/mL) (Figure 7E).
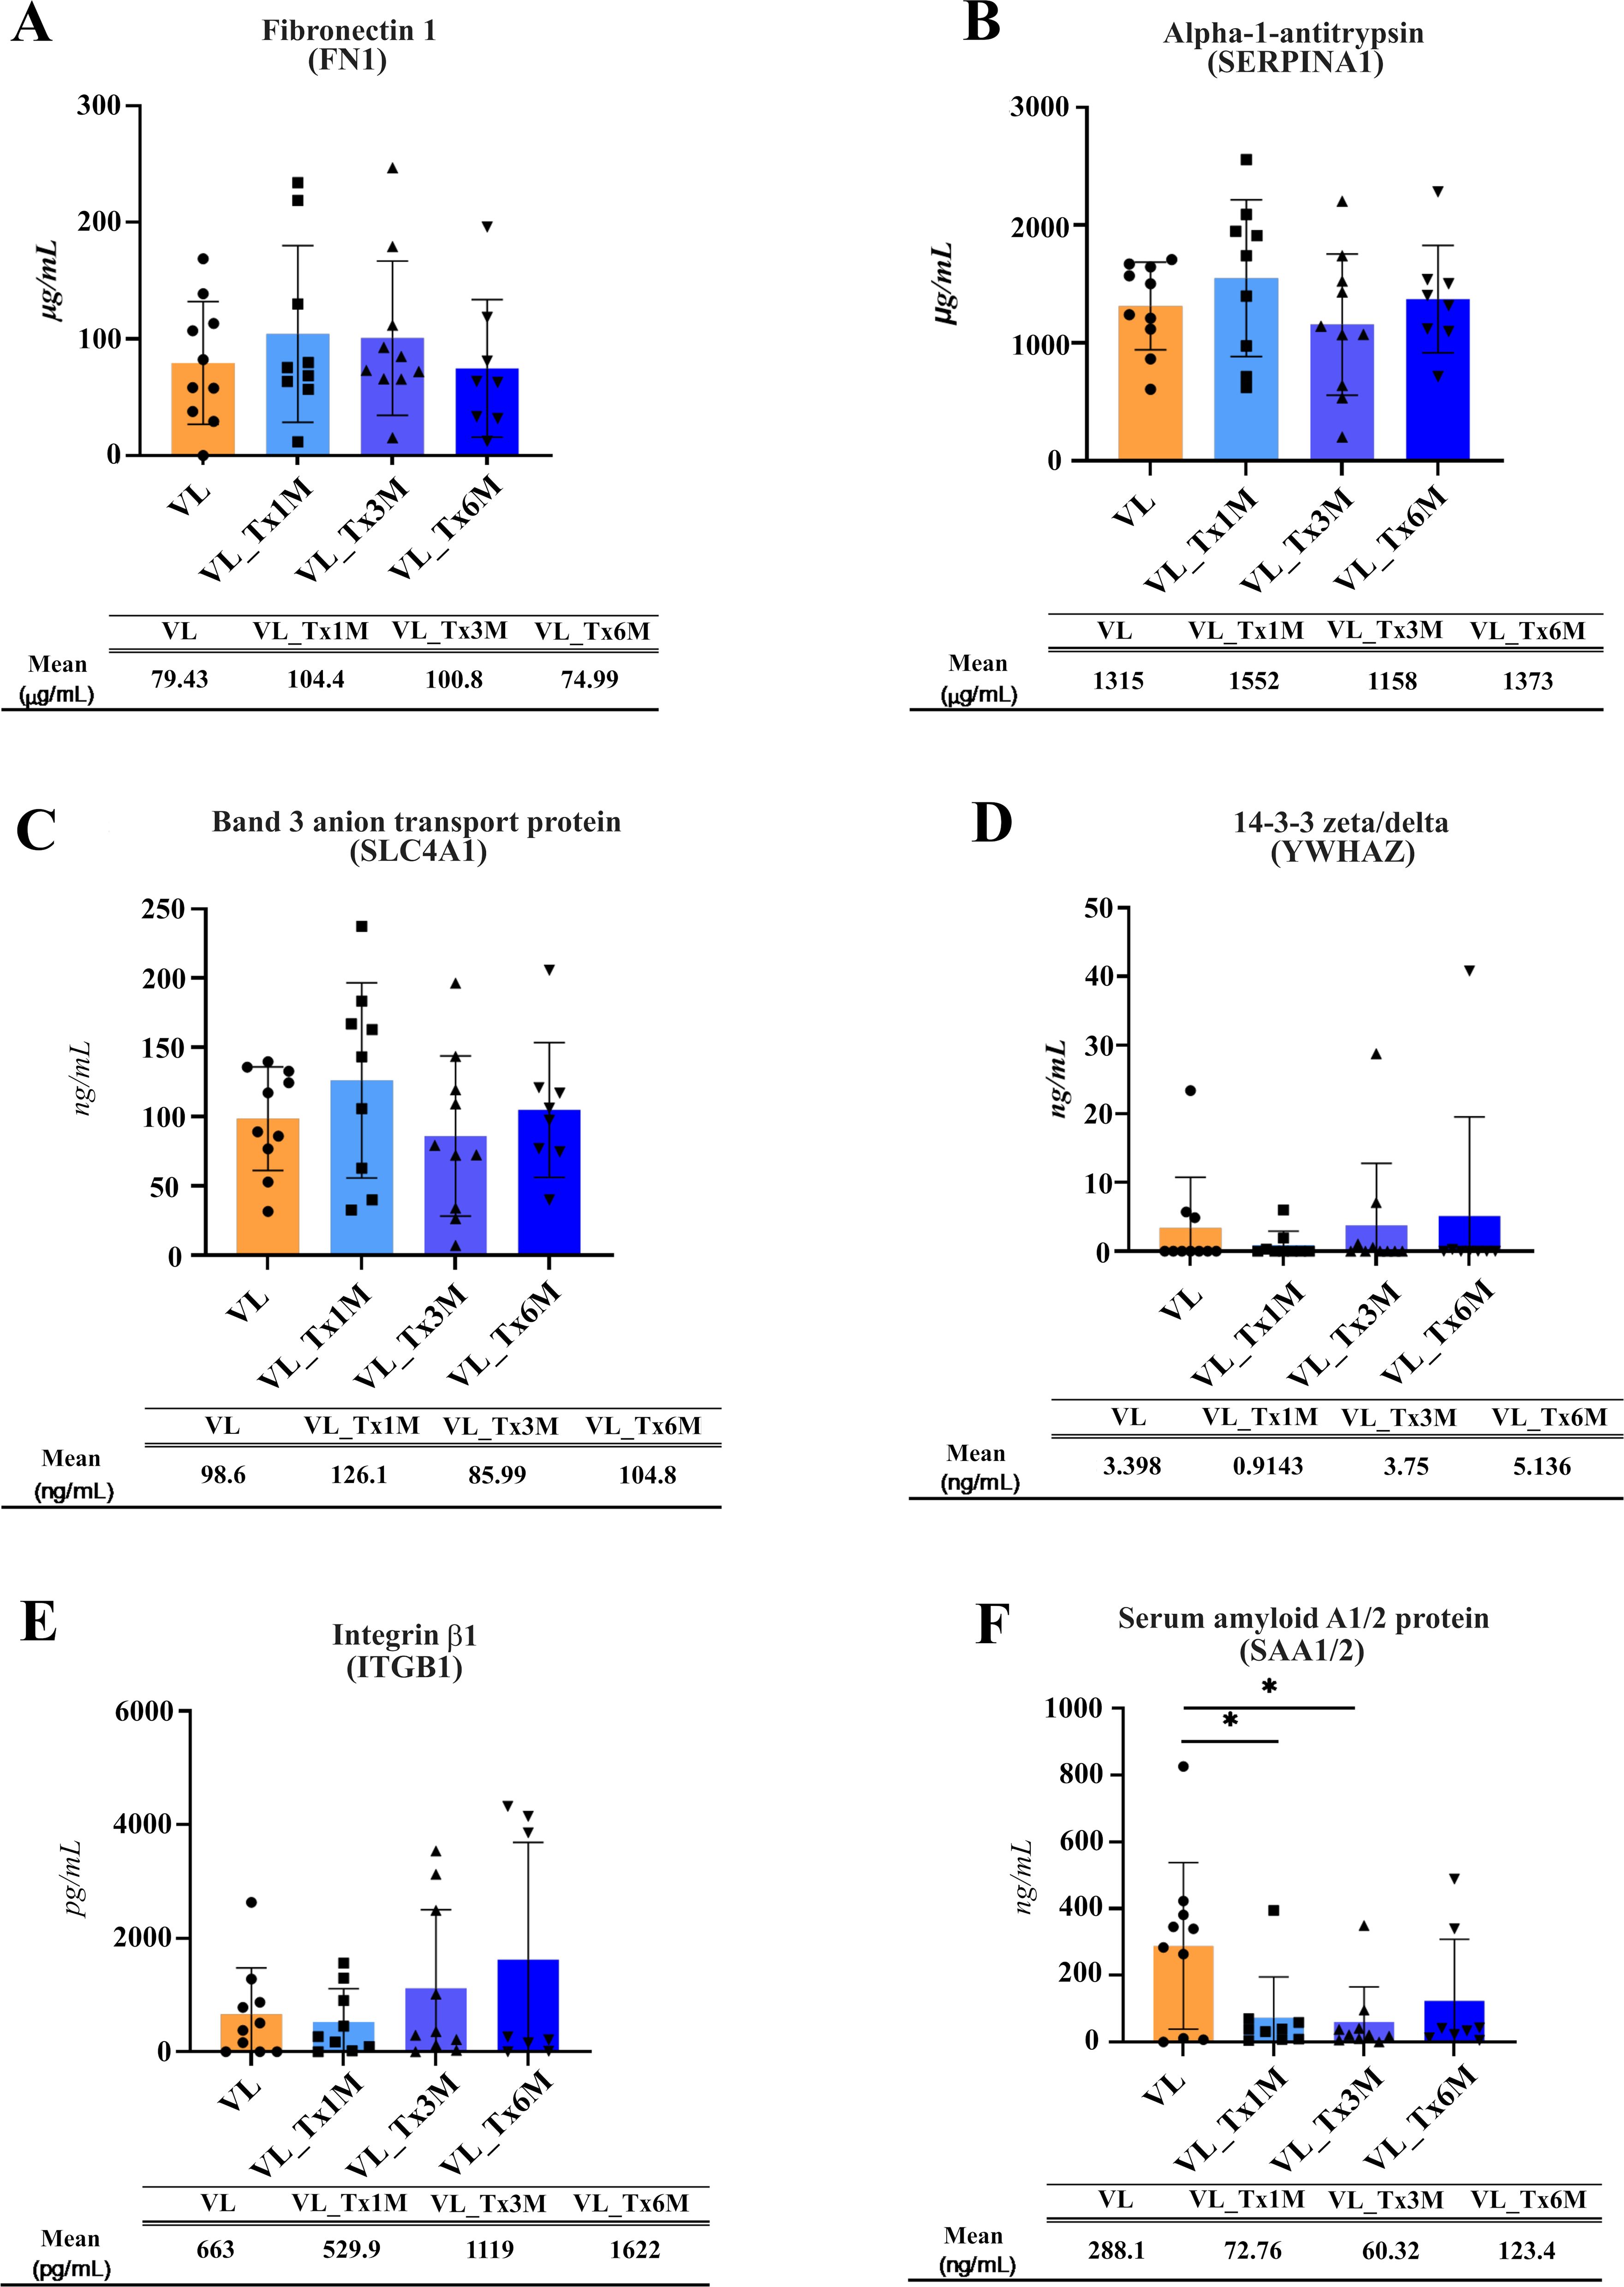
Figure 7. Plasma concentrations of proteins selected as possible biomarkers of cure. The concentration of each selected protein measured via a sandwich ELISA is shown individually for each patient: (A) Fibronectin, (B) Alpha-1-antitrypsin, (C) Band 3 anion transport protein, (D) 14-3-3 zeta/deta, (E) Integrin β1, (F) Serum amyloid A1/2 protein. The mean and standard error for each patient group is also provided. Significant differences are indicated for *p ≤ 0.05. Beneath each figure appears the mean protein concentration recorded for each group.
Significant differences were effectively found for SAA1 (Figure 7F). SAA1/2 levels were significantly lower in plasma samples from patients at 1 (mean = 72.76 ng/mL) or 3 (mean = 60.32 ng/mL) versus samples from patients with active VL (mean = 288.1 ng/mL; p = 0.0317 and 0.016, respectively). For this protein, ELISA whole plasma and proteomic plasma-derived EV results were consistent, both indicating marked downregulation.
3.5 Leishmania protein abundances in active VL and treated patients
We also looked for the presence of L. infantum-associated proteins in our samples, as identifying parasite proteins is crucial for diagnosis and prognosis and understanding the host-parasite relationship during infection. Peptide sequences were mapped against a protein database derived from the L. infantum JPCM5 reference genome (based on v2/2018; http://leish-esp.cbm.uam.es/(50); TriTryDB.org), excluding peptides that also matched the host proteome (human). This analysis identified a total of 46 potential Leishmania proteins.
Since only one unique peptide was identified for each protein, we performed additional analyses to ensure the specificity of these proteins as unique to Leishmania. To assess potential sequence homologies with proteins from other organisms that could be present in the biological samples, peptides sequences were queried using UniProt BLAST and Peptide search tools, to exclude potential cross-reactivity. This analysis revealed that 19 peptide sequences also showed homology with proteins from other microorganisms, raising doubts about the presence of the corresponding Leishmania proteins in the plasma samples (Supplementary Table 6). In consequence, we identified 29 bona fide proteins associated with the Leishmania genome (Table 3).
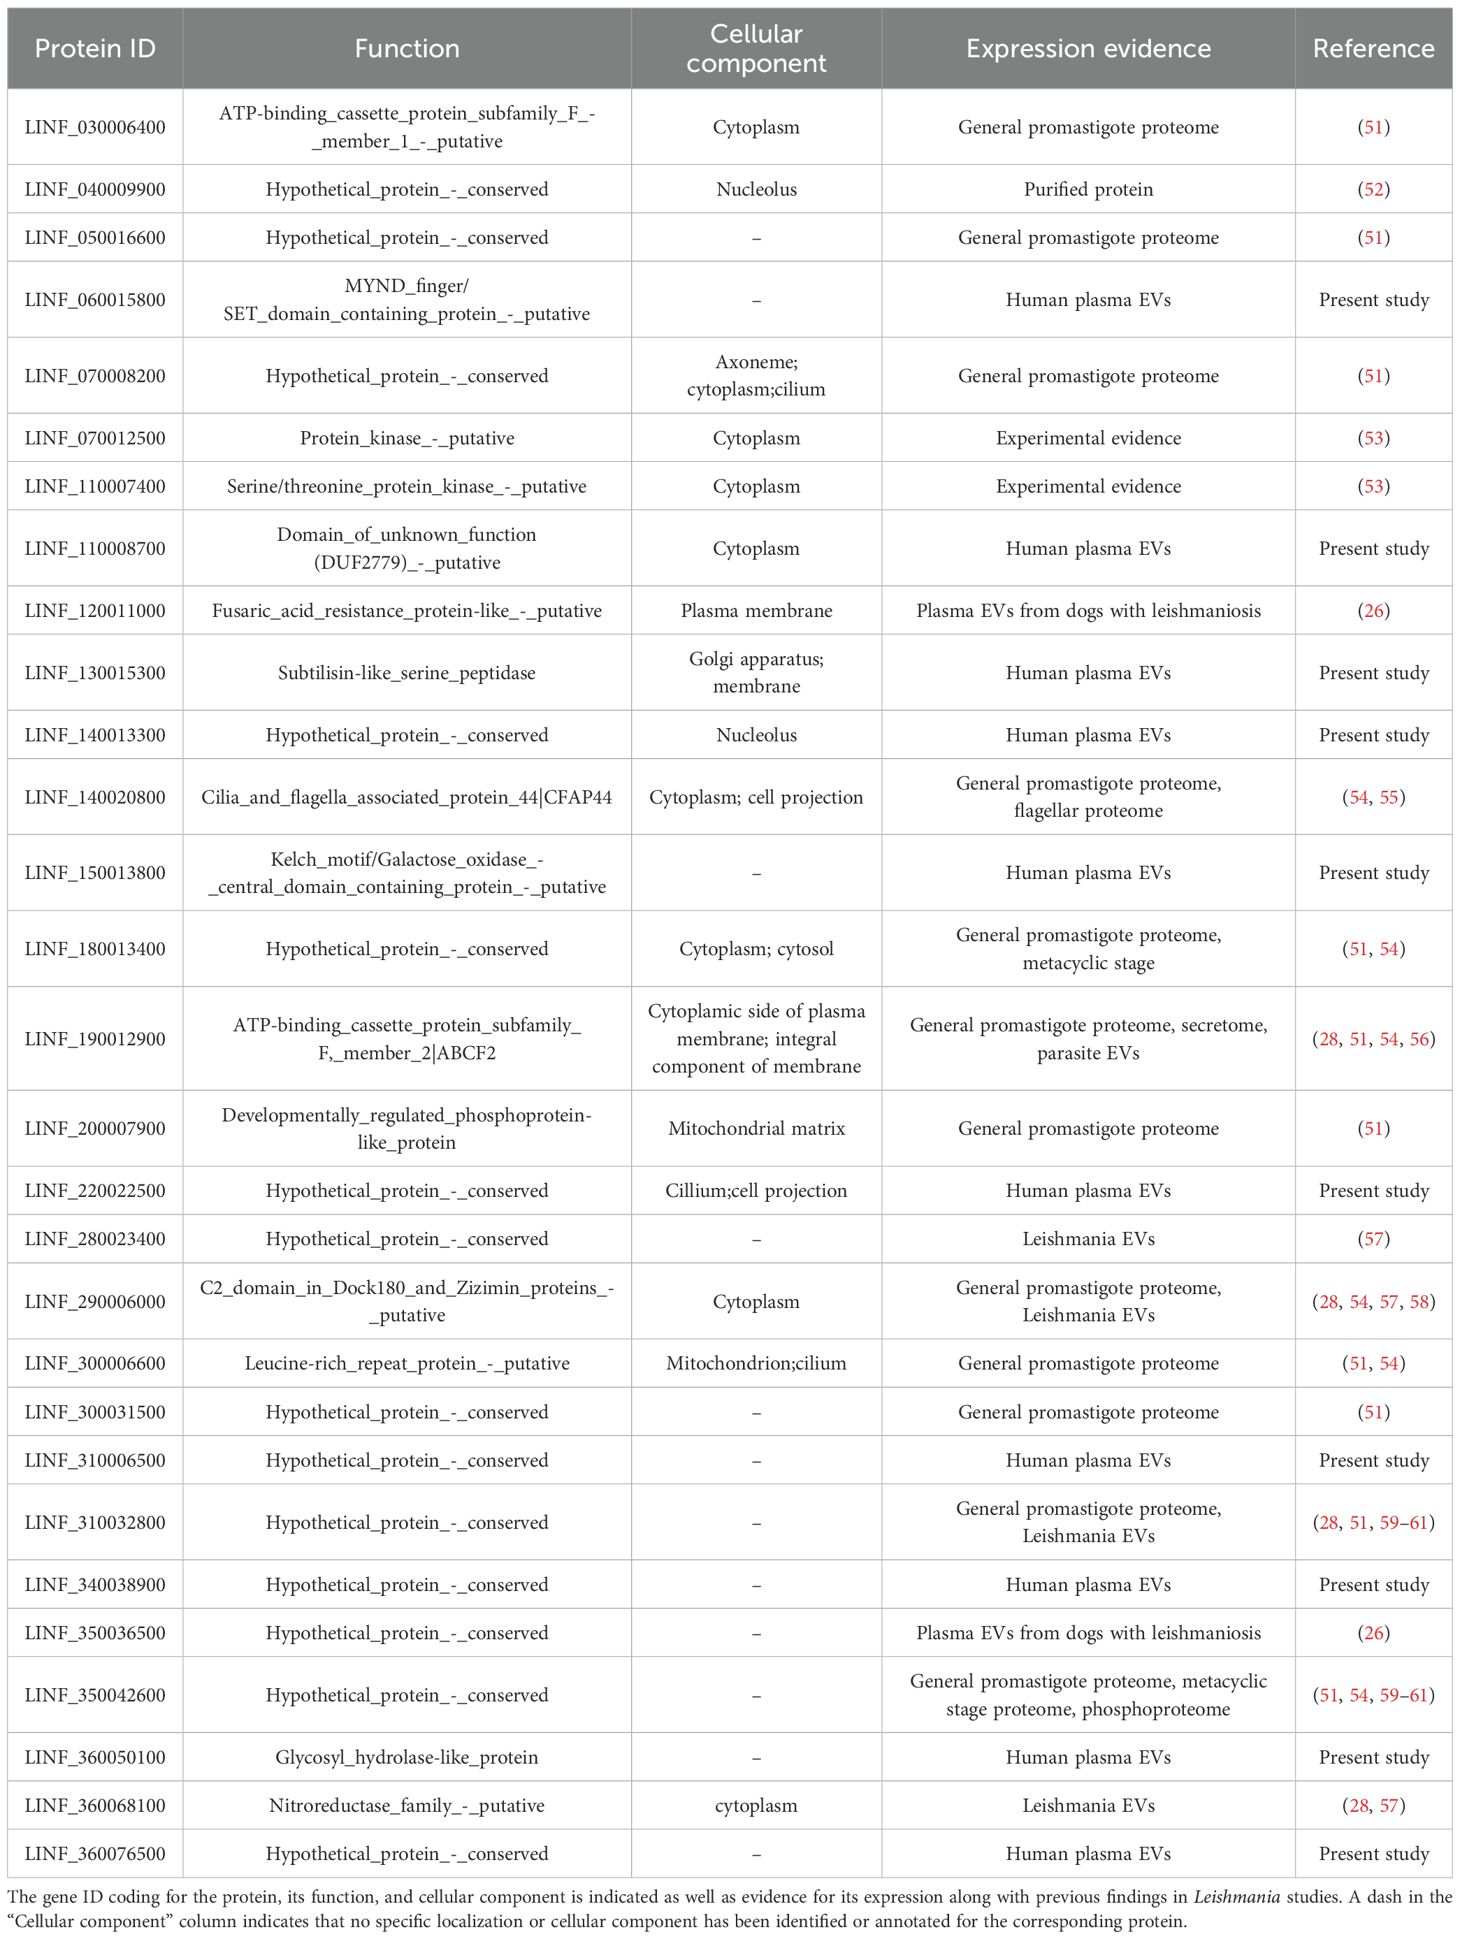
Table 3. Identification of Leishmania bona fide proteins found in samples from VL patients.
Additionally, we conducted an in-depth analysis of the identified Leishmania proteins in the literature and the databases TriTrypDB.org, Wikidata, and UniProt to further explore the molecular characteristics and functional annotations of these proteins. Of 46 possible Leishmania proteins present in plasma, 36.96% (17 proteins) were classified as ‘hypothetical protein_conserved’ and 41.30% (19 proteins) were classified as ‘putative’, whose functions or biological processes are not yet fully understood. Among the 29 bona fide proteins, 14 (48.28%) were classified as ‘hypothetical’ and 10 (34.48%) as ‘putative’. Hypothetical proteins in Leishmania constitute a substantial portion of its annotated genome, whose existence is predicted but has not yet been experimentally validated. Their functional annotation is further hindered by the lack of significant sequence homology to proteins of known function. However, their detection in this study confirms their expression and suggests that these proteins may be involved in essential biological processes and represent potential targets for diagnostic and follow-up of VL. Further characterization of these proteins could significantly enhance our understanding of Leishmania biology and open new avenues for diagnostic and therapeutic development. For that reason, a literature review was conducted to determine whether these proteins had been previously identified. This review also considered their presence in different parasite forms (amastigotes or promastigotes), their inclusion within the parasite’s secretome or exoproteome, and their description in parasite-derived exosomes. According to the literature and databases, 34 of those 46 proteins have been previously reported. Of these, 26 proteins were described in the L. infantum proteome of the Spanish reference L. infantum JPCM5 strain, already reported in the different databases and publications (51). Notably, 11 proteins were associated with the secretomes of different species of Leishmania (56), and 15 proteins were found in EVs derived from cultured parasites (28, 57, 62). Two proteins were detected in EVs from infected sandfly guts (63), and four were found in EVs from plasma samples from infected dogs (26). Further, two proteins aligned with those described in the exoproteome of L. infantum (64), and 14 matched the proteome of L. donovani as reported by Adan-Jimenez et al. (54). Importantly, among the 29 bona fide Leishmania proteins, 19 have been described in Leishmania proteomes while there is no prior evidence for the remaining 10, indicating these could represent novel Leishmania proteins experimentally validated in this study and should no longer be considered hypothetical. Detailed descriptions, including molecular functions, peptide sequences, and their literature citings, are provided in Supplementary Table 6.
Our analysis of Gene Ontology (GO) terms for the identified proteins served to characterize their potential roles and localization within the parasite (Supplementary Table 6). According to the cellular component (CC) terms, most of the identified proteins were localized in the cytoplasm (GO:0005737) or cytosol (GO:0005829), but also associated with membrane structures such as plasma membrane (GO:0005886), Golgi apparatus (GO:0005886), and specific structures within the parasite like axoneme (GO:0005930) and cilium (GO:0005929). In the biological processes (BP) analysis, the proteins identified were related to protein phosphorylation (GO:0006468), intracellular signal transduction (GO:0035556), transmembrane transport (GO:0055085), and ribosomal biogenesis (GO:0042254), reflecting their regulatory roles in metabolism and protein synthesis. Additionally, some proteins are implicated in other processes such as methylation (GO:0042254), redox homeostasis (GO:0045454), and responses to oxidative stress (GO:0034599), suggesting a role in adaptation of the parasite to its environment.
Finally, molecular function (MF) analyses revealed a variety of binding activities, such as ion binding (GO:0043167), ATP binding (GO:0005524), and ribosome binding (GO:0043022), which underscores their importance in energy metabolism and translation. Enzymatic roles include kinase (GO: 0004672), hydrolase (GO:0016787), and oxidoreductase activities (GO:0016491), emphasizing their participation in essential metabolic and signaling pathways.
The 29 selected proteins were subjected to further analysis to evaluate their expression levels across the different patient groups (Supplementary Table 6). Proteins whose identified peptides could be also associated with other microorganisms were excluded to avoid introducing noise or generating misleading results. The initial analysis focused on conducting a principal component analysis of the identified proteins. PCA results revealed complete separation of protein expression profiles in active VL patients versus VL_Tx1M, VL_Tx3M and VL_Tx6M, as may be seen in Figure 8A. Subsequently, we prepared a volcano plot to compare Leishmania protein expression levels between patients with active VL and treated patients (VL_Tx). This analysis revealed that 10 proteins were differentially expressed, all being downregulation in the treated patient compared to the VL group (FC < 0.67) (Figure 8B). Finally, we examined the differential expression of these 29 proteins among groups to assess the behavior of their expression following treatment (Figure 8C).
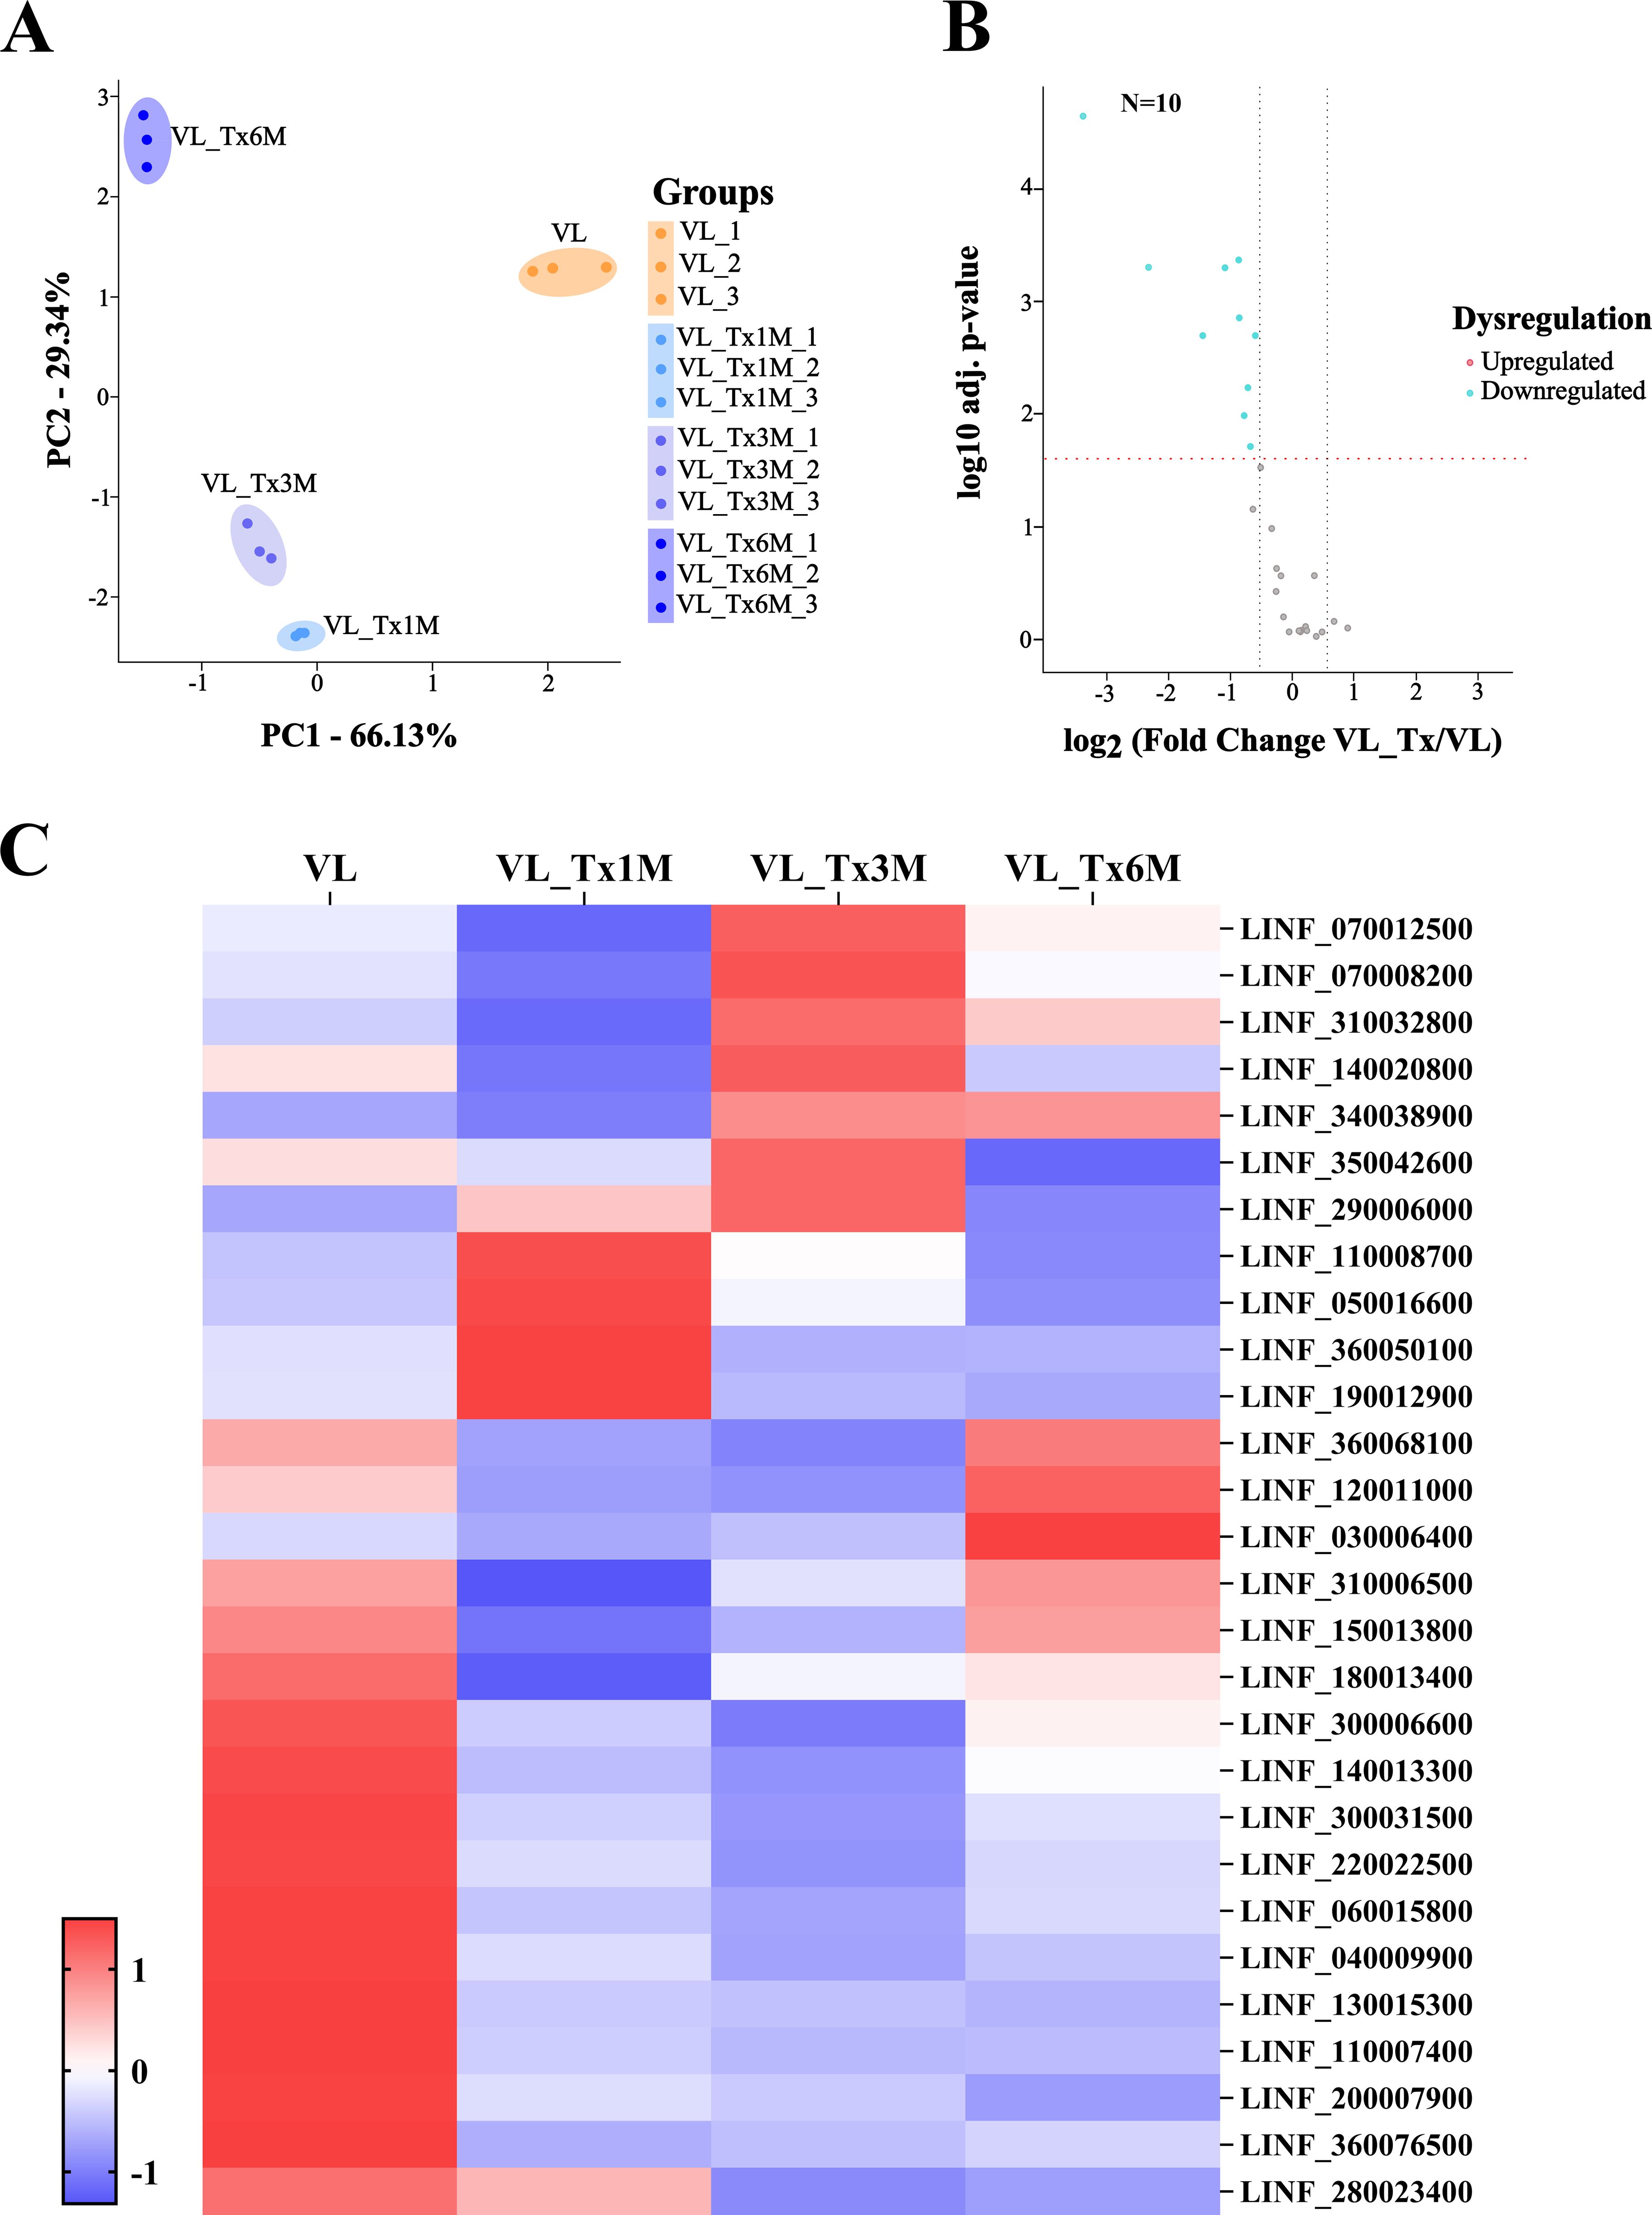
Figure 8. Proteomic profiles of the patient groups VL and VL_Tx-L. infantum proteins. (A) Variance distributions across different groups (VL, VL_Tx1M, VL_Tx3M, and VL_Tx6M) observed in triplicate samples by PCA showing distinct clustering patterns. (B) Volcano plot illustrating differential protein expression in groups VL versus VL_Tx indicating the significant downregulation of 10 proteins (FC≤ 0.67). The two black dashed lines represent a log2fold change equal to 0.58 or -0.58. The red dashed line represents a FDR = 0.05. (C) Heatmap displaying the proteomic profiles of VL and VL_Tx1M, VL_Tx3M, and VL_Tx6M. Columns correspond to patient groups, while rows represent individual L. infantum proteins (LINF), showing their expression patterns across groups.
The heatmap highlights the expression patterns of 8 of the 10 proteins identified in the volcano plot that showed a FDR < 0.01; these were highly expressed in samples from VL patients. These proteins, LINF_040009900, LINF_060015800, LINF_110007400, LINF_130015300, LINF_140013300, LINF_220022500, LINF_300031500, and LINF_360076500, showed a marked and significant decrease in expression levels in pooled samples after treatment (VL_Tx group). This reduction reflects the therapeutic impact on the disease, suggesting these proteins could be considered biomarkers to monitor disease progression and treatment efficacy.
Interestingly, the heatmap also reveals differences in the abundance of Leishmania proteins depending on the time point posttreatment (Supplementary Table 6). For instance, 16 proteins showed significant downregulation as early as at 1 month or 3 months posttreatment (Table 4). This rapid decline in their expression levels suggests they could serve as early biomarkers of cure.
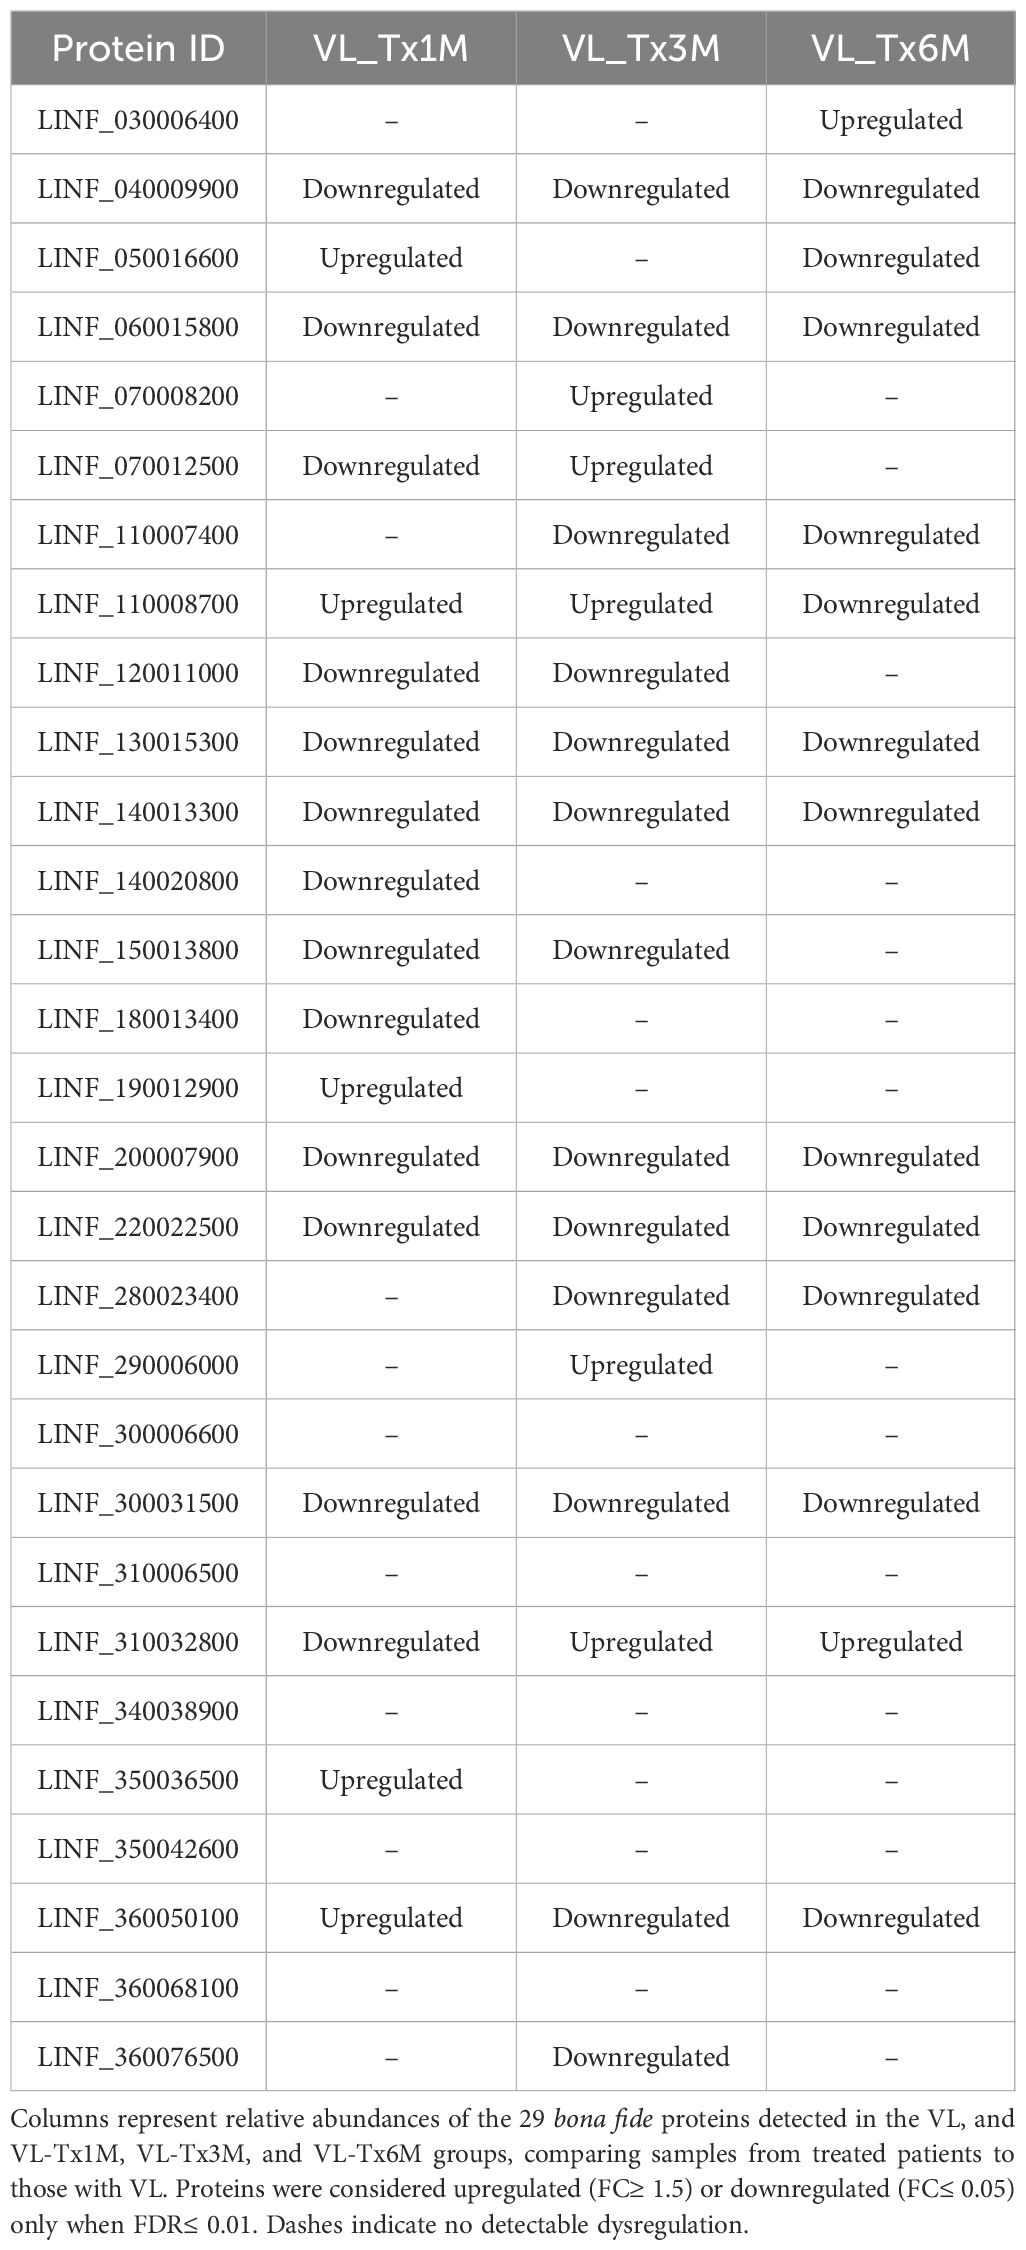
Table 4. Dysregulated Leishmania proteins identified in plasma EVs samples from VL patients after treatment compared with VL.
Intriguingly, some of the Leishmania proteins featured higher abundances at specific posttreatment time points compared to levels observed during active disease. For example, five proteins LINF_050016600, LINF_110008700, LINF_190012900, LINF_350036500, and LINF_360050100 showed an increased abundance 1 month after treatment. Similarly, in the 3-month posttreatment group, a distinct set of five proteins LINF_070008200, LINF_070012500, LINF_110008700 (which was already elevated in VL_Tx1M), LINF_290006000, and LINF_310032800 were overexpressed. Even 6 months after treatment, LINF_030006400 and LINF_310032800 (the latter was also elevated from VL_Tx3M) were more abundant than in the VL patients.
4 Discussion
There is an urgent need for biomarkers of VL able to predict the course of this disease and guide therapeutic decisions. To explore new prognostic indicators, we here conducted a comprehensive analysis of the proteomic profile of the contents of EVs derived from plasma samples of VL patients at different stages, from an active state of disease to different posttreatment time points. Although some proteomic studies have tried to identify biomarkers related to disease-alterations in plasma from L. donovani patients (65) and in plasma-derived EVs from L. infantum infected dogs (26), no previous study has examined the proteomic profile of plasma-derived EVs from patients infected with L. infantum after treatment.
4.1 Host immune response and pathways affected by treatment with LAmB
After Leishmania infection, the innate system develops an initial acute inflammatory response, including the activation of pathways such as ‘inflammatory response and cell migration’, ‘acute-phase response’, or ‘complement cascade’. Some of the proteins involved in these pathways were found to be predominantly expressed in the EVs of our VL patients when compared to the contents of posttreatment samples. This finding is consistent with an intricate immune response to combat systemic invading pathogens. Following the bite of an infected sandfly, cellular activation triggers the release of molecular mediators that facilitate leukocyte recruitment to the site of Leishmania infection. This activation promotes key intracellular signaling pathways, including those regulated by mitogen-activated protein kinase (MAPK), nuclear factor kappa-B (NF-κB), and Janus kinase (JAK)/signal transducer and activator of transcription (STAT) (66). In plasma EVs from patients at 1- and 3 months posttreatment, we observed upregulation of the pathways ‘MAPK family signalling cascade’, ‘integrin signalling’, and ‘regulation of ERK1 and ERK2 cascade’ when compared to patients with active VL. Activation of these pathways could induce the release of proinflammatory cytokines IL-1, IL-6, TNF, transforming growth factor (TGF), and type I interferons (IFN-I), which stimulate the production of acute phase reactants in the liver, such as serum amyloid A (SAA) and alpha-1 antitrypsin (A1AT) (67). We observed higher expression of these proteins in EVs from patients with active disease compared to treated patients. This increase in acute-phase reactants produced in plasma during VL infection has been reported (65, 68–70) and linked to systemic inflammation mediated by cytokines (71, 72). Specifically, an increase in these reactants has been related to a lack of an appropriate response to treatment in canine leishmaniosis (70, 73). According to the latter authors, this suggests that concentrations of acute phase proteins, such as C-reactive protein, are a useful clinical tool to characterize and manage this disease in dogs. However, this biomarker is neither used in veterinary practice today nor suggested for human VL patients. To assess the potential of SERPINA1 (encoding A1AT) and SAA as easily detectable markers of cure, we quantified their levels in whole plasma via ELISA. Contrarily to SERPINA1 which failed to vary across our study groups, SAA levels showed a significant decline soon after treatment (1 month). Given this protein is a marker of inflammation (74), we propose it should be considered an early molecule for use within a biomarker panel for VL follow-up. Other affected pathways were ‘leukocyte activation, migration and adhesion’, and ‘immunoregulatory interactions between a lymphoid and a non-lymphoid cell’. These processes are associated with changes in cell morphology, actin cytoskeleton reorganization, and cellular dynamics. Some peptides such as cathelicidin antimicrobial peptide (CAMP) (75, 76) and vascular cell adhesion protein 1 (VCAM-1) are involved in these mechanisms (77, 78). In a study examining serum levels of VCAM-1 as a marker of relapse in L. donovani VL patients, consistently lower levels of this protein were found in cured patients versus those who experienced relapse (79). In line with this observation, we observed the downregulation of VCAM-1 in EVs from L. infantum VL patients at 3 months posttreatment, suggesting the potential use of this early biomarker in patients undergoing treatment for VL. Further work involving ELISA is needed to consider VCAM-1 an early easy-to-detect biomarker of relapse in treated VL patients.
As a survival mechanism, Leishmania also modulates the VCAM-1/VLA-4 complex, altering the kinetics of infected-monocyte spreading over fibronectin (FN1) (80, 81). By interacting with this protein, Leishmania promastigotes impair the activation of parasite-infected macrophages (82, 83). Upregulated FN1 gene expression has been observed in the lymph nodes of Sudanese VL patients after treatment with sodium stibogluconate, compared to the levels observed prior to treatment (84). Similarly, we observed an increase in FN1 levels as well as in ITGB1 and CD9, and ‘integrin signalling’ upregulation in our patients infected with L. infantum successfully treated with LAmB, especially at 1 month posttreatment. In agreement, we also observed upregulation of the pathways ‘cellular adhesion’ and ‘regulation of cellular adhesion’ at this time point, suggesting the early recovery of adhesion mechanisms likely contributing to tissue repair and immune cell trafficking. Changes in the levels of these proteins may be related to the immune system’s attempt to re-establish normal cellular adhesion processes and immune cell motility postinfection (78, 80). Although CD9 has been described to modulate viral and bacterial infections, the role of tetraspanins in the pathogenesis of parasitic infections remains unclear (85). Given the systemic effects of ITGB1 and FN1 and the impacts of Leishmania on them, both proteins were measured in whole plasma. Only ITGB1 showed a similar profile to that observed in our EV samples by proteomics whereby elevated levels were detected in treated patients, although differences between groups were not significant. As is widely known, EVs can be enriched in certain proteins whose presence varies in whole plasma.
After treatment, we also observed the progressive upregulation of the pathway ‘cell surface interactions at the vascular wall’ and downregulation of proinflammatory kininogen 1 (KNG1). This protein interacts with plasma kallikrein, which plays a role in vessel patency, increasing blood flow, and has anti-thrombotic/profibrinolytic properties (86, 87). Increased vascular permeability induces the entry of leukocytes into inflammation sites, and the downregulation of KNG1 suggests diminished inflammation posttreatment. According to their lower urine levels in patients recovered from L. donovani VL, kininogens have been proposed as biomarkers for the diagnosis of infection (88). However, once again, these markers are currently not used for VL patients and there are no commercial assays available to measure urine biomarkers of leishmaniasis.
Another immune system observation noted here after successful treatment was the downregulation of the pathway ‘neutrophil degranulation, migration, chemotaxis and aggregation’ and the upregulation of olfactomedin 4 (OLFM4). This protein is a negative regulator of the NF-κβ pathway, helping prevent excessive inflammation (89). Consistently, our data indicate that the ‘acute inflammatory response’ is already diminished at 1 month posttreatment, reflecting an early shift towards recovery from leishmaniasis. In addition to neutrophils, other phagocytic cells, including monocytes, dendritic cells and macrophages are also recruited to the site of infection. These cells intensely express and secrete S100A9 to modulate inflammatory processes with the induction of inflammatory cytokines, reactive oxygen species (ROS), and nitric oxide (NO) (90). Elevated S100A9 levels have been observed in the serum of experimental mice models infected with L. infantum (91). In our study, we found that S100A9 was notably downregulated in patients 1 month after treatment compared to those with active disease. This is consistent with downregulation of the ‘ROS and RNS production’ pathway, suggesting a reduced oxidative stress response as the immune system shifts from active inflammation to a more regulated posttreatment state.
Posttreatment immune modulation also sets the stage for the adaptive immune system’s activation. Plastin-2 (LCP-1) is a protein involved in T-cell polarization, migration, and T-cell–dependent antibody responses (92). This protein has been found upregulated in L. infantum infected dogs (93). In our treated patients, LCP-1 expression was downregulated, as well as the pathways associated with antigen processing and presentation, specifically ‘Class I and II MHC mediated antigen processing and presentation’, ‘FCGR dependent phagocytosis’, and ‘T-cell regulation and TCR signalling’. The downregulation of antigen presentation pathways and LCP-1 expression in treated patients likely reflects a reduced antigen load and immune activation, consistent with parasite elimination through effective treatment.
14-3–3 protein zeta/delta (YWHAZ) also plays an important role in promoting T-cell polarization toward Th1 and Th17 populations (94). Additionally, this protein along with UBC and HSP90A, has been identified as a pivotal modulatory factor influencing the immune response, parasite survival and visceralization pathways during L. donovani infection (95). Upon differentiation of Th1 cells, these migrate to the infection site to initiate cytotoxic responses. During T-cell transmigration, there is an accumulation of MYH9 at the rear of the cells, facilitating their passage through the membrane (96, 97). In our treated patients, YWHAZ and MYH9 were found upregulated in EVs, indicating polarization to an effective T response following treatment. Our ELISA assay detected increased levels of YWHAZ in the whole plasma of VL patients compared to the levels found 1 month after treatment. High levels of this protein have also been linked to T cell exhaustion markers, thus resulting in T cell dysfunction (98). Closely linked to immune-mediated mechanisms, VL causes significant hematological complications such as hemolytic anemia and premature red blood cell lysis. Infected individuals can show marked degradation of anion channel protein band 3, also known as SLC4A1 (99). This protein plays an important role in maintaining the stability and integrity of the red cell (100). In canine leishmaniosis, studies have shown reduced membrane fluidity and increased cell rigidity, which leads to a greater likelihood of erythrocyte removal from the bloodstream. This could explain the SLC4A1 deficiency observed in erythrocytes from infected dogs (101). In our treated patients, we observed the increased expression of this protein in EVs. This increase could be attributed to the removal of damaged cells and the resolution of hemolysis. Unfortunately, this increase was not mirrored in whole plasma.
Our proteomics analysis of plasma-derived EVs revealed several pathways affected by Leishmania infection related to cell adhesion and migration, inflammation and other immune-mediated mechanisms that could also be related to macrophage activation syndrome (102). We found 7 upregulated (SLC4A1, ITGB1, YWHATZ, MYH9, OLFM4, CD9, and FN1) and 9 downregulated (SERPINA1, SAA1, SAA2, HSP90AB1, LCP1, KNG1, VCAM1, S100A9, and CAMP) proteins in EVs from patients treated with LAmB when compared to the active disease state, even early after completing treatment (one month). Among these, six key proteins (SAA, SERPINA1, YWHAZ, ITGB1, FN1, and SLC4A1) were ELISA-detected in whole plasma. Plasma is preferred over EVs due to its broader representation of circulating proteins, ease of processing, and the non-requirement of complex isolation steps. Further, plasma-based assays offer greater accessibility and adaptability, making them attractive for use in the field.
The variations in the levels of two of these proteins (ITGB1 and SAA1) over time were mostly consistent with the EV proteomics results. Importantly, whole plasma SAA1/2 levels significantly declined after effective treatment, indicating their possible use as early biomarkers in the follow-up of VL patients by ELISA. While the trend in ITGB1 levels over time observed here was non-significant, the behavior of this protein may still be interesting for further investigation. Although the potential of SAA1/2 and ITGB1 as biomarkers has been described in other systemic diseases (21, 103–105), this study highlights their significance specifically in the context of leishmaniasis.
4.2 Leishmania-derived proteins after successful treatment
Our study also identified a subset of Leishmania proteins that could serve as biomarkers for monitoring visceral leishmaniasis (VL) and assess treatment efficacy. While previous research has focused on in vitro cultured promastigotes (51, 54), their secretomes (56) or EVs derived from cultured parasites (28, 57, 62), or recovered from sandfly guts (63) or from infected animal models (26), this study is the first to detect Leishmania-derived proteins in EVs isolated from human patient VL samples.
The framework provided by Esteves et al. (26), who employed canine plasma for the isolation of EVs, guided our analysis of human samples. Among the Leishmania proteins identified by these authors in plasma-derived EVs from healthy and diseased dogs, four, LINF_120011000, LINF_350036500, LINF_140007000, and LINF_160020100, were also detected here. These findings not only confirm the detectability of certain proteins across different hosts but also emphasize the need for further studies designed to elucidate their roles in this disease.
Our expression analysis revealed changes in the abundance of Leishmania proteins over time, whereby 16 proteins were significantly downregulated as early as 1- or 3 months posttreatment. This stresses the importance of analyzing proteins in detail, as tracking their expression over time can help identify those associated with a rapid response to treatment. Through this analysis, we identified 16 proteins as potential biomarkers of active disease. In effect, these markers could complement the biomarker panel for monitoring cure. In this regard, the peptides and proteins identified could be used to monitor infection via targeted proteomics. Interestingly, we observed higher abundances of certain Leishmania proteins at specific time points after treatment compared to the levels detected during active disease.
The detection of Leishmania-derived peptides in EVs in treated patients suggests that mass spectrometry can identify low-abundance proteins beyond PCR sensitivity. This highlights the potential of proteomic approaches in uncovering residual parasitic components and underscores the complexity of interpreting antigen persistence. In Trypanosoma cruzi infection, it has been already demonstrated that EVs can carry exoantigens during the asymptomatic chronic phase of the disease (106). This may be the result of proteins from dead parasites persisting in plasma EVs, or they could be derived from EVs actively secreted by Leishmania during infection that continue to circulate in the bloodstream. Alternatively, they could arise from surviving parasites in visceral tissues that modulate concomitant immunity (107) Notably, 29 of the 33 proteins identified in other studies were found in secretomes or EVs from cultured parasites, or in infected animal models. Among the 10 analyzed proteins featuring a higher abundance pre-treatment than after treatment, 4 had been previously detected in these extracellular components (26, 28, 56, 57, 62). These findings raise concerns about the true origins of Leishmania proteins that need to be addressed in future studies.
4.3 Study limitations
Our study has some limitations. One limitation is the relatively small sample size and the exclusive use of L. infantum samples, which may limit the generalizability to other populations infected with other species of Leishmania. Another limitation is the use of pooled samples prior to SC and UC for EV enrichment, which could introduce bias due to potential protein aggregates; nonetheless, PCA analysis supports this approach by revealing distinct protein profiles at VL time points. Additionally, we could not afford the study of all key dysregulated proteins discovered in this study via ELISA in plasma samples. Other candidates could also enrich the suggested panel. In addition, our findings need validation in larger populations. Lastly, the use of plasma instead of EVs for validation could impact the specificity of the detected biomarkers, possibly influencing their diagnostic and prognostic accuracy.
4.4 Conclusions and translational impact
In conclusion, the purpose of this study was to compare the proteome of plasma derived EVs during active stage VL and following successful treatment. In addition to a broad set of dysregulated proteins in these vesicles, we discovered several potential markers that could help monitor treatment efficacy by ELISA. Pending confirmation and validation of our results in larger cohorts, we speculate that this approach could be an important new tool to assess the response to therapy. Additionally, detection of Leishmania derived proteins in extracellular vesicles provides new insights into infection dynamics and potential biomarkers for future field adapted diagnostic approaches. Our results also provide direction for future studies designed to characterize essential proteins with a role in the pathogenesis of VL or other systemic diseases.
Data availability statement
The mass spectrometry proteomics data have been deposited at the ProteomeXchange Consortium via the PRIDE partner repository with the dataset identifier PXD060604.
Ethics statement
The study protocol for patients returning for voluntary follow-up was approved by the Ethics Committee (APR 12-66 and APR 12-67) of the Hospital Universitario de Fuenlabrada, Madrid, Spain, and by the ISCIII Ethics Committee (CEI PI 78_2022). The studies were conducted in accordance with the local legislation and institutional requirements. The participants provided their written informed consent to participate in this study.
Author contributions
AT: Formal analysis, Writing – original draft, Methodology, Data curation, Conceptualization, Writing – review & editing, Investigation. AM-C: Writing – original draft, Writing – review & editing, Formal analysis, Data curation, Investigation, Methodology. ML-R: Writing – original draft, Formal analysis, Investigation, Methodology. CS: Writing – original draft, Methodology, Formal analysis, Investigation. LB: Investigation, Formal analysis, Writing – review & editing, Methodology. JS: Formal analysis, Writing – review & editing, Writing – original draft, Methodology, Investigation, Data curation, Conceptualization. JSM: Writing – review & editing. RB: Methodology, Writing – review & editing. JM: Writing – review & editing, Funding acquisition. EC: Conceptualization, Writing – original draft, Funding acquisition, Writing – review & editing.
Funding
The author(s) declare financial support was received for the research and/or publication of this article. This study was funded by the Instituto de Salud Carlos III through the ISCIII-AES project (PI22/00009, PI24CIII/00023). JS was supported by a contract from CIBERINFEC (CB21/13/00018). The funders had no role in the study design, data collection and analysis, decision to publish, or preparation of the manuscript.
Acknowledgments
We would like to thank María Carmen Terrón and Félix Docando from the Electron Microscopy Unit (Instituto de Salud Carlos III, Majadahonda, Spain) for performing the TEM imaging.
Conflict of interest
The authors declare that the research was conducted in the absence of any commercial or financial relationships that could be construed as a potential conflict of interest.
The author(s) declared that they were an editorial board member of Frontiers, at the time of submission. This had no impact on the peer review process and the final decision.
Generative AI statement
The author(s) declare that no Generative AI was used in the creation of this manuscript.
Any alternative text (alt text) provided alongside figures in this article has been generated by Frontiers with the support of artificial intelligence and reasonable efforts have been made to ensure accuracy, including review by the authors wherever possible. If you identify any issues, please contact us.
Publisher’s note
All claims expressed in this article are solely those of the authors and do not necessarily represent those of their affiliated organizations, or those of the publisher, the editors and the reviewers. Any product that may be evaluated in this article, or claim that may be made by its manufacturer, is not guaranteed or endorsed by the publisher.
Supplementary material
The Supplementary Material for this article can be found online at: https://www.frontiersin.org/articles/10.3389/fimmu.2025.1646335/full#supplementary-material
References
1. WHO. The Global Health Observatory. In: Explore a world of health data. World Health Organization. Available online at: https://www.who.int/data/gho/data/themes/topics/topic-details/GHO/leishmaniasis (accessed April 1, 2025).
2. Monge-Maillo B, Norman FF, Cruz I, Alvar J, and López-Vélez R. Visceral leishmaniasis and HIV coinfection in the mediterranean region. PloS Negl Trop Diseases. (2014) 8:e3021. doi: 10.1371/journal.pntd.0003021
3. Rijal S, Ostyn B, Uranw S, Rai K, Bhattarai NR, Dorlo TPC, et al. Increasing failure of miltefosine in the treatment of kala-azar in Nepal and the potential role of parasite drug resistance, reinfection, or noncompliance. Clin Infect Diseases. (2013) 56:1530–8. doi: 10.1093/cid/cit102
4. Van Griensven J, Carrillo E, López-Vélez R, Lynen L, and Moreno J. Leishmaniasis in immunosuppressed individuals. Clin Microbiol Infection. (2014) 20:286–99. doi: 10.1111/1469-0691.12556
5. Kumar R, Chauhan SB, Ng SS, Sundar S, and Engwerda CR. Immune checkpoint targets for host-directed therapy to prevent and treat leishmaniasis. Front Immunol. (2017) 8. doi: 10.3389/fimmu.2017.01492
6. Costa-Da-Silva AC, Nascimento DDO, Ferreira JRM, Guimarães-Pinto K, Freire-De-Lima L, Morrot A, et al. Immune responses in leishmaniasis: an overview. Trop Med Infect Disease. (2022) 7:54. doi: 10.3390/tropicalmed7040054
7. Control of Neglected Tropical Diseases (NTD) GRC and WHO Headquarters (HQ). WHO guideline for the treatment of visceral leishmaniasis in HIV co-infected patients in East Africa and South-East Asia. Geneva: World Health Organization. (2022) 89.
8. Rostami MN and Khamesipour A. Potential biomarkers of immune protection in human leishmaniasis. Med Microbiol Immunol. (2021) 210:81–100. doi: 10.1007/s00430-021-00703-8
9. Pacheco-Fernandez T, Volpedo G, Gannavaram S, Bhattacharya P, Dey R, Satoskar A, et al. Revival of leishmanization and leishmanin. Front Cell Infection Microbiol. (2021) 11. doi: 10.3389/fcimb.2021.639801
10. Ibarra-Meneses AV, Moreno J, and Carrillo E. New strategies and biomarkers for the control of visceral leishmaniasis. Trends Parasitol. (2020) 36:29–38. doi: 10.1016/j.pt.2019.10.005
11. Zijlstra EE, el-Hassan AM, Ismael A, and Ghalib HW. Endemic kala-azar in eastern Sudan: a longitudinal study on the incidence of clinical and subclinical infection and post-kala-azar dermal leishmaniasis. Am J Trop Med Hyg. (1994) 51:826–36. doi: 10.4269/ajtmh.1994.51.826
12. Bern C, Amann J, Haque R, Chowdhury R, Ali M, Kurkjian KM, et al. Loss of leishmanin skin test antigen sensitivity and potency in a longitudinal study of visceral leishmaniasis in Bangladesh. Am J Trop Med hygiene. (2006) 75:744–8. doi: 10.4269/ajtmh.2006.75.744
13. Dey R, Alshaweesh J, Singh KP, Lypaczewski P, Karmakar S, Klenow L, et al. Production of leishmanin skin test antigen from Leishmania donovani for future reintroduction in the field. Nat Commun. (2023) 14:7028. doi: 10.1038/s41467-023-42732-2
14. Botana L, Matía B, San Martin JV, Romero-Maté A, Castro A, Molina L, et al. Cellular markers of active disease and cure in different forms of leishmania infantum-induced disease. Front Cell Infect Microbiol. (2018) 8:381. doi: 10.3389/fcimb.2018.00381
15. Doyle L and Wang M. Overview of extracellular vesicles, their origin, composition, purpose, and methods for exosome isolation and analysis. Cells. (2019) 8:727. doi: 10.3390/cells8070727
16. Kumar MA, Baba SK, Sadida HQ, Marzooqi SA, Jerobin J, Altemani FH, et al. Extracellular vesicles as tools and targets in therapy for diseases. Signal Transduction Targeted Ther. (2024) 9(1):27. doi: 10.1038/s41392-024-01735-1
17. Yáñez-Mó M, Siljander PRM, Andreu Z, Bedina Zavec A, Borràs FE, Buzas EI, et al. Biological properties of extracellular vesicles and their physiological functions. J Extracellular Vesicles. (2015) 4:27066. doi: 10.3402/jev.v4.27066
18. Kawasaki T, Takeda Y, and Kumanogoh A. Proteomics of blood extracellular vesicles in inflammatory respiratory diseases for biomarker discovery and new insights into pathophysiology. Inflammation Regeneration. (2024) 44:38. doi: 10.1186/s41232-024-00351-4
19. Zhang R, Yuan M, Giri BR, Li S, Cheng G, and Wu Z. Extracellular vesicle biomarkers for infectious diseases. In: Wang Q and Zheng L (eds) Extracellular Vesicles. Springer, Singapore. (2024), 385–407. doi: 10.1007/978-981-99-8365-0_20
20. Fratini F, Tamarozzi F, Macchia G, Bertuccini L, Mariconti M, Birago C, et al. Proteomic analysis of plasma exosomes from Cystic Echinococcosis patients provides in vivosupport for distinct immune response profiles in active vs inactive infection and suggests potential biomarkers. PloS Negl Trop Diseases. (2020) 14:e0008586. doi: 10.1371/journal.pntd.0008586
21. Cortes-Serra N, Mendes MT, Mazagatos C, Segui-Barber J, Ellis CC, Ballart C, et al. Plasma-derived extracellular vesicles as potential biomarkers in heart transplant patient with chronic chagas disease. Emerging Infect Diseases. (2020) 26:1846–51. doi: 10.3201/eid2608.191042
22. Jung AL, Møller Jørgensen M, Bæk R, Artho M, Griss K, Han M, et al. Surface proteome of plasma extracellular vesicles as mechanistic and clinical biomarkers for malaria. Infection. (2023) 51:1491–501. doi: 10.1007/s15010-023-02022-x
23. Madeira RP, Dal’Mas Romera LM, De Cássia Buck P, Mady C, Ianni BM, and Torrecilhas AC. New biomarker in chagas disease: extracellular vesicles isolated from peripheral blood in chronic chagas disease patients modulate the human immune response. J Immunol Res. (2021) 2021:1–14. doi: 10.1155/2021/6650670
24. Aparici-Herraiz I, Gualdrón-López M, Castro-Cavadía CJ, Carmona-Fonseca J, Yasnot MF, Fernandez-Becerra C, et al. Antigen discovery in circulating extracellular vesicles from plasmodium vivax patients. Front Cell Infection Microbiol. (2022) 11. doi: 10.3389/fcimb.2021.811390
25. Guo X, Wang S, Zhang J, Li R, Zhang YE, Wang Z, et al. Proteomic profiling of serum extracellular vesicles identifies diagnostic markers for echinococcosis. PloS Negl Trop Diseases. (2022) 16:e0010814. doi: 10.1371/journal.pntd.0010814
26. Esteves S, Lima C, Costa I, Osório H, Fernandez-Becerra C, Santarém N, et al. Characterization and proteomic analysis of plasma EVs recovered from healthy and diseased dogs with canine leishmaniosis. Int J Mol Sci. (2023) 24:5490. doi: 10.3390/ijms24065490
27. da Cruz AB, Carneiro FM, Maia MM, Pereira IDS, Taniwaki NN, Namiyama GM, et al. Dogs with canine visceral leishmaniasis have a boost of extracellular vesicles and miR-21-5p up-expression. Parasite Immunol. (2023) 45:e13004. doi: 10.1111/pim.13004
28. Forrest DM, Batista M, Marchini FK, Tempone AJ, and Traub-Csekö YM. Proteomic analysis of exosomes derived from procyclic and metacyclic-like cultured Leishmania infantum chagasi. J Proteomics. (2020) 227:103902. doi: 10.1016/j.jprot.2020.103902
29. Hassani K and Olivier M. Immunomodulatory impact of leishmania-induced macrophage exosomes: A comparative proteomic and functional analysis. PloS Negl Trop Diseases. (2013) 7:e2185. doi: 10.1371/journal.pntd.0002185
30. Gioseffi A, Hamerly T, Van K, Zhang N, Dinglasan RR, Yates PA, et al. Leishmania-infected macrophages release extracellular vesicles that can promote lesion development. Life Sci Alliance. (2020) 3:e202000742. doi: 10.26508/lsa.202000742
31. Lodi L, Voarino M, Stocco S, Ricci S, Azzari C, Galli L, et al. Immune response to viscerotropic Leishmania: a comprehensive review. Front Immunol. (2024) 15:1402539. doi: 10.3389/fimmu.2024.1402539
32. Organization WH. Control of the leishmaniases: report of a meeting of the WHO Expert Committee on the Control of Leishmaniases. Geneva: World Health Organization(2010) p. 22–6.
33. Montero-Calle A, Garranzo-Asensio M, Rejas-González R, Feliu J, Mendiola M, Peláez-García A, et al. Benefits of FAIMS to improve the proteome coverage of deteriorated and/or cross-linked TMT 10-plex FFPE tissue and plasma-derived exosomes samples. Proteomes. (2023) 11:35. doi: 10.3390/proteomes11040035
34. Nakayasu ES, Gritsenko M, Piehowski PD, Gao Y, Orton DJ, Schepmoes AA, et al. Tutorial: best practices and considerations for mass-spectrometry-based protein biomarker discovery and validation. Nat Protoc. (2021) 16:3737–60. doi: 10.1038/s41596-021-00566-6
35. Diz AP, Truebano M, and Skibinski DOF. The consequences of sample pooling in proteomics: an empirical study. Electrophoresis. (2009) 30:2967–75. doi: 10.1002/elps.200900210
36. Torres A, Bernardo L, Sánchez C, Morato E, Solana JC, and Carrillo E. Comparing the proteomic profiles of extracellular vesicles isolated using different methods from long-term stored plasma samples. Biol Procedures Online. (2024) 26(1):18. doi: 10.1186/s12575-024-00243-4
37. Montero-Calle A, Coronel R, Garranzo-Asensio M, Solís-Fernández G, Rábano A, De Los Ríos V, et al. Proteomics analysis of prefrontal cortex of Alzheimer’s disease patients revealed dysregulated proteins in the disease and novel proteins associated with amyloid-β pathology. Cell Mol Life Sci. (2023) 80:141. doi: 10.1007/s00018-023-04791-y
38. Montero-Calle A, Aranguren-Abeigon I, Garranzo-Asensio M, Poves C, Fernández-Aceñero MJ, Martínez-Useros J, et al. Multiplexed biosensing diagnostic platforms detecting autoantibodies to tumor-associated antigens from exosomes released by CRC cells and tissue samples showed high diagnostic ability for colorectal cancer. Engineering. (2021) 7:1393–412. doi: 10.1016/j.eng.2021.04.026
39. Rejas-González R, Montero-Calle A, Pastora Salvador N, Crespo Carballés MJ, Ausín-González E, Sánchez-Naves J, et al. Unraveling the nexus of oxidative stress, ocular diseases, and small extracellular vesicles to identify novel glaucoma biomarkers through in-depth proteomics. Redox Biol. (2024) 77:103368. doi: 10.1016/j.redox.2024.103368
40. Rejas-González R, Montero-Calle A, Valverde A, Salvador NP, Carballés MJC, Ausín-González E, et al. Proteomics analyses of small extracellular vesicles of aqueous humor: identification and validation of GAS6 and SPP1 as glaucoma markers. Int J Mol Sci. (2024) 25:6995. doi: 10.3390/ijms25136995
41. Montero-Calle A, Jiménez De Ocaña S, Benavente-Naranjo R, Rejas-González R, Bartolomé RA, Martínez-Useros J, et al. Functional proteomics characterization of the role of SPRYD7 in colorectal cancer progression and metastasis. Cells. (2023) 12:2548. doi: 10.3390/cells12212548
42. Sherman BT, Hao M, Qiu J, Jiao X, Baseler MW, Lane HC, et al. DAVID: a web server for functional enrichment analysis and functional annotation of gene lists (2021 update). Nucleic Acids Res. (2022) 50:W216–W21. doi: 10.1093/nar/gkac194
43. Huang DW, Sherman BT, and Lempicki RA. Systematic and integrative analysis of large gene lists using DAVID bioinformatics resources. Nat Protoc. (2009) 4:44–57. doi: 10.1038/nprot.2008.211
44. Szklarczyk D, Kirsch R, Koutrouli M, Nastou K, Mehryary F, Hachilif R, et al. The STRING database in 2023: protein–protein association networks and functional enrichment analyses for any sequenced genome of interest. Nucleic Acids Res. (2023) 51:D638–D46. doi: 10.1093/nar/gkac1000
45. Milacic M, Beavers D, Conley P, Gong C, Gillespie M, Griss J, et al. The reactome pathway knowledgebase 2024. Nucleic Acids Res. (2024) 52:D672–D8. doi: 10.1093/nar/gkad1025
46. Iqbal A, Duitama C, Metge F, Rosskopp D, and Boucas J. Flaski. Zenodo (2021). doi: 10.5281/zenodo.4890981
47. Alvarez-Jarreta J, Amos B, Aurrecoechea C, Bah S, Barba M, Barreto A, et al. VEuPathDB: the eukaryotic pathogen, vector and host bioinformatics resource center in 2023. Nucleic Acids Res. (2023) 52:D808–D16. doi: 10.1093/nar/gkad1003
48. Consortium TU. UniProt: the universal protein knowledgebase in 2025. Nucleic Acids Res. (2024) 53:D609–D17. doi: 10.1093/nar/gkae1010
49. Welsh JA, Goberdhan DCI, O'Driscoll L, Buzas EI, Blenkiron C, Bussolati B, et al. Minimal information for studies of extracellular vesicles (MISEV2023): From basic to advanced approaches. J Extracellular Vesicles. (2024) 13:e12404. doi: 10.1002/jev2.12404
50. González-de la Fuente S, Peiró-Pastor R, Rastrojo A, Moreno J, Carrasco-Ramiro F, Requena JM, et al. Resequencing of the Leishmania infantum (strain JPCM5) genome and de novoassembly into 36 contigs. Sci Rep. (2017) 7:18050. doi: 10.1038/s41598-017-18374-y
51. Sanchiz Á, Morato E, Rastrojo A, Camacho E, González-de la Fuente S, Marina A, et al. The experimental proteome of leishmania infantum promastigote and its usefulness for improving gene annotations. Genes. (2020) 11:1036. doi: 10.3390/genes11091036
52. Nepomuceno-Mejía T, Florencio-Martínez LE, Pineda-García I, and Martínez-Calvillo S. Identification of factors involved in ribosome assembly in the protozoan parasite Leishmania major. Acta Trop. (2022) 228:106315. doi: 10.1016/j.actatropica.2022.106315
53. Baker N, Catta-Preta CMC, Neish R, Sadlova J, Powell B, Alves-Ferreira EVC, et al. Systematic functional analysis of Leishmania protein kinases identifies regulators of differentiation or survival. Nat Commun. (2021) 12:1244. doi: 10.1038/s41467-021-21360-8
54. Adán-Jiménez J, Sánchez-Salvador A, Morato E, Solana JC, Aguado B, and Requena JM. A proteogenomic approach to unravel new proteins encoded in the leishmania donovani (HU3) genome. Genes (Basel). (2024) 15(6):775. doi: 10.3390/genes15060775
55. Beneke T, Demay F, Hookway E, Ashman N, Jeffery H, Smith J, et al. Genetic dissection of a Leishmania flagellar proteome demonstrates requirement for directional motility in sand fly infections. PloS Pathog. (2019) 15:e1007828. doi: 10.1371/journal.ppat.1007828
56. Pissarra J, Pagniez J, Petitdidier E, Séveno M, Vigy O, Bras-Gonçalves R, et al. Proteomic analysis of the promastigote secretome of seven leishmania species. J Proteome Res. (2022) 21:30–48. doi: 10.1021/acs.jproteome.1c00244
57. Douanne N, Dong G, Douanne M, Olivier M, and Fernandez-Prada C. Unravelling the proteomic signature of extracellular vesicles released by drug-resistant Leishmania infantum parasites. PloS Negl Trop Diseases. (2020) 14:e0008439. doi: 10.1371/journal.pntd.0008439
58. Martin JL, Yates PA, Soysa R, Alfaro JF, Yang F, Burnum-Johnson KE, et al. Metabolic reprogramming during purine stress in the protozoan pathogen Leishmania donovani. PloS Pathog. (2014) 10:e1003938. doi: 10.1371/journal.ppat.1003938
59. Rosenzweig D, Smith D, Myler PJ, Olafson RW, and Zilberstein D. Post-translational modification of cellular proteins during Leishmania donovani differentiation. Proteomics. (2008) 8:1843–50. doi: 10.1002/pmic.200701043
60. Tsigankov P, Gherardini PF, Helmer-Citterich M, Späth GF, and Zilberstein D. Phosphoproteomic analysis of differentiating Leishmania parasites reveals a unique stage-specific phosphorylation motif. J Proteome Res. (2013) 12:3405–12. doi: 10.1021/pr4002492
61. Brotherton MC, Racine G, Foucher AL, Drummelsmith J, Papadopoulou B, and Ouellette M. Analysis of stage-specific expression of basic proteins in Leishmania infantum. J Proteome Res. (2010) 9:3842–53. doi: 10.1021/pr100048m
62. Silverman JM, Clos J, de'Oliveira CC, Shirvani O, Fang Y, Wang C, et al. An exosome-based secretion pathway is responsible for protein export from Leishmania and communication with macrophages. J Cell Sci. (2010) 123:842–52. doi: 10.1242/jcs.056465
63. Atayde VD, Aslan H, Townsend S, Hassani K, Kamhawi S, and Olivier M. Exosome secretion by the parasitic protozoan leishmania within the sand fly midgut. Cell Rep. (2015) 13:957–67. doi: 10.1016/j.celrep.2015.09.058
64. Braga MS, Neves LX, Campos JM, Roatt BM, de Oliveira Aguiar Soares RD, Braga SL, et al. Shotgun proteomics to unravel the complexity of the Leishmania infantum exoproteome and the relative abundance of its constituents. Mol Biochem Parasitol. (2014) 195:43–53. doi: 10.1016/j.molbiopara.2014.07.001
65. Bag AK, Saha S, Sundar S, Saha B, Chakrabarti A, and Mandal C. Comparative proteomics and glycoproteomics of plasma proteins in Indian visceral leishmaniasis. Proteome Science. (2014) 12(1):48. doi: 10.1186/s12953-014-0048-z
66. Fioranelli M, Roccia MG, Flavin D, and Cota L. Regulation of inflammatory reaction in health and disease. Int J Mol Sci. (2021) 22:5277. doi: 10.3390/ijms22105277
67. Jain S, Gautam V, and Naseem S. Acute-phase proteins: As diagnostic tool. J Pharm Bioallied Sci. (2011) 3:118–27. doi: 10.4103/0975-7406.76489
68. Wasunna KM, Raynes JG, Were JB, Muigai R, Sherwood J, Gachihi G, et al. Acute phase protein concentrations predict parasite clearance rate during therapy for visceral leishmaniasis. Trans R Soc Trop Med Hyg. (1995) 89:678–81. doi: 10.1016/0035-9203(95)90442-5
69. Siebers K, Fink B, Zakrzewicz A, Agné A, Richter K, Konzok S, et al. Alpha-1 antitrypsin inhibits ATP-mediated release of interleukin-1β via CD36 and nicotinic acetylcholine receptors. Front Immunol. (2018) 9. doi: 10.3389/fimmu.2018.00877
70. Martinez-Subiela S, Strauss-Ayali D, Cerón JJ, and Baneth G. Acute phase protein response in experimental canine leishmaniasis. Vet Parasitol. (2011) 180:197–202. doi: 10.1016/j.vetpar.2011.03.032
71. Costa CHN, Chang K-P, Costa DL, and Cunha FVM. From infection to death: an overview of the pathogenesis of visceral leishmaniasis. Pathogens. (2023) 12:969. doi: 10.3390/pathogens12070969
72. Abdulkhaleq LA, Assi MA, Abdullah R, Zamri-Saad M, Taufiq-Yap YH, and Hezmee MNM. The crucial roles of inflammatory mediators in inflammation: A review. Veterinary World. (2018) 11:627–35. doi: 10.14202/vetworld.2018.627-635
73. Ceron JJ, Pardo-Marin L, Caldin M, Furlanello T, Solano-Gallego L, Tecles F, et al. Use of acute phase proteins for the clinical assessment and management of canine leishmaniosis: general recommendations. BMC Veterinary Res. (2018) 14:196. doi: 10.1186/s12917-018-1524-y
74. Gulhar R, Ashraf MA, and Jialal I. Physiology, Acute Phase Reactants. Treasure Island (FL: StatPearls(2024).
75. Höpfinger A, Schmid A, Schweitzer L, Patz M, Weber A, Schäffler A, et al. Regulation of cathelicidin antimicrobial peptide (CAMP) gene expression by TNFα and cfDNA in adipocytes. Int J Mol Sci. (2023) 24:15820. doi: 10.3390/ijms242115820
76. El-Dirany R, Shahrour H, Dirany Z, Abdel-Sater F, Gonzalez-Gaitano G, Brandenburg K, et al. Activity of anti-microbial peptides (AMPs) against leishmania and other parasites: an overview. Biomolecules. (2021) 11(7):984. doi: 10.3390/biom11070984
77. Kong D-H, Kim Y, Kim M, Jang J, and Lee S. Emerging roles of vascular cell adhesion molecule-1 (VCAM-1) in immunological disorders and cancer. Int J Mol Sci. (2018) 19:1057. doi: 10.3390/ijms19041057
78. Stanley AC, Dalton JE, Rossotti SH, Macdonald KP, Zhou Y, Rivera F, et al. VCAM-1 and VLA-4 modulate dendritic cell IL-12p40 production in experimental visceral leishmaniasis. PloS Pathogens. (2008) 4:e1000158. doi: 10.1371/journal.ppat.1000158
79. Makis A, Tsabouri S, Karagouni P, Rogalidou M, Sionti I, and Chaliasos N. VCAM-1 and ICAM-1 serum levels as markers of relapse in visceral leishmaniasis. Mediterr J Hematol Infect Diseases. (2016) 9:e2017011. doi: 10.4084/mjhid.2017.011
80. Figueira CP, Carvalhal DGF, Almeida RA, Hermida MDE-R, Touchard D, Robert P, et al. Leishmania infection modulates beta-1 integrin activation and alters the kinetics of monocyte spreading over fibronectin. Sci Rep. (2015) 5:12862. doi: 10.1038/srep12862
81. Pinheiro NF, Hermida MDR, Macedo MP, Mengel J, Bafica A, and Dos-Santos WLC. Leishmania infection impairs β1-integrin function and chemokine receptor expression in mononuclear phagocytes. Infection Immunity. (2006) 74:3912–21. doi: 10.1128/IAI.02103-05
82. Kulkarni MM, Jones EA, McMaster WR, and McGwire BS. Fibronectin binding and proteolytic degradation by leishmania and effects on macrophage activation. Infection Immunity. (2008) 76:1738–47. doi: 10.1128/IAI.01274-07
83. Vannier-Santos MA, Saraiva EM, Martiny A, Neves A, and de Souza W. Fibronectin shedding by Leishmania may influence the parasite-macrophage interaction. Eur J Cell Biol. (1992) 59(2):389–97.
84. Salih MAM, Fakiola M, Lyons PA, Younis BM, Musa AM, Elhassan AM, et al. Expression profiling of Sudanese visceral leishmaniasis patients pre- and post-treatment with sodium stibogluconate. Parasite Immunol. (2017) 39:e12431. doi: 10.1111/pim.2017.39.issue-6
85. van Spriel AB and Figdor CG. The role of tetraspanins in the pathogenesis of infectious diseases. Microbes Infect. (2010) 12:106–12. doi: 10.1016/j.micinf.2009.11.001
86. Sugi T and Makino T. Plasma contact system, kallikrein-kinin system and antiphospholipid-protein antibodies in thrombosis and pregnancy. J Reprod Immunol. (2000) 47:169–84. doi: 10.1016/S0165-0378(00)00061-9
87. Wong MK-S. Subchapter 43B - Kallikrein. In: Ando H, Ukena K, and Nagata S, editors. Handbook of Hormones, 2nd ed. Academic Press, San Diego(2021). p. 517–9.
88. Kumar V, Mishra M, Rajput SK, Bajpai S, and Singh RK. Detection and diagnostic applicability of human urinary kininogen in kala-azar patients. Parasitol Res. (2012) 111:1851–5. doi: 10.1007/s00436-012-2931-9
89. Liu W and Rodgers GP. Olfactomedin 4 is a biomarker for the severity of infectious diseases. Open Forum Infect Diseases. (2022) 9(4):ofac061. doi: 10.1093/ofid/ofac061
90. Wang S, Song R, Wang Z, Jing Z, Wang S, and Ma J. S100A8/A9 in inflammation. Front Immunol. (2018) 9. doi: 10.3389/fimmu.2018.01298
91. Agallou M, Athanasiou E, Kammona O, Tastsoglou S, Hatzigeorgiou AG, Kiparissides C, et al. Transcriptome analysis identifies immune markers related to visceral leishmaniasis establishment in the experimental model of BALB/c mice. Front Immunol. (2019) 10. doi: 10.3389/fimmu.2019.02749
92. Wabnitz G, Balta E, and Samstag Y. L-plastin regulates the stability of the immune synapse of naive and effector T-cells. Adv Biol Regulation. (2017) 63:107–14. doi: 10.1016/j.jbior.2016.09.009
93. Martinković F, Popović M, Smolec O, Mrljak V, Eckersall PD, and Horvatić A. Data independent acquisition reveals in-depth serum proteome changes in canine leishmaniosis. Metabolites. (2023) 13:365. doi: 10.3390/metabo13030365
94. McGowan J, Peter C, Chattopadhyay S, and Chakravarti R. 14-3-3ζ-A novel immunogen promotes inflammatory cytokine production. Front Immunol. (2019) 10. doi: 10.3389/fimmu.2019.01553
95. Panditrao G, Ganguli P, and Sarkar RR. Delineating infection strategies of Leishmania donovani secretory proteins in Human through host-pathogen protein Interactome prediction. Pathog Dis. (2021) 79(8):ftab051. doi: 10.1093/femspd/ftab051
96. Zehrer A, Pick R, Salvermoser M, Boda A, Miller M, Stark K, et al. A fundamental role of myh9 for neutrophil migration in innate immunity. J Immunol. (2018) 201:1748–64. doi: 10.4049/jimmunol.1701400
97. Jacobelli J, Bennett FC, Pandurangi P, Tooley AJ, and Krummel MF. Myosin-IIA and ICAM-1 regulate the interchange between two distinct modes of T cell migration. J Immunol. (2009) 182:2041–50. doi: 10.4049/jimmunol.0803267
98. Wang X, Shen H, Zhangyuan G, Huang R, Zhang W, He Q, et al. 14-3-3ζ delivered by hepatocellular carcinoma-derived exosomes impaired anti-tumor function of tumor-infiltrating T lymphocytes. Cell Death Dis. (2018) 9(2):159. doi: 10.1038/s41419-017-0180-7
99. Roy SS, Sen G, and Biswas T. Role of sulfhydryl groups in band 3 in the inhibition of phosphate transport across erythrocyte membrane in visceral leishmaniasis. Arch Biochem Biophys. (2005) 436:121–7. doi: 10.1016/j.abb.2005.01.015
100. Bruce LJ and Tanner MJ. Erythroid band 3 variants and disease. Baillieres Best Pract Res Clin Haematol. (1999) 12:637–54. doi: 10.1053/beha.1999.0046
101. Morabito R, Remigante A, Cavallaro M, Taormina A, La Spada G, and Marino A. Anion exchange through band 3 protein in canine leishmaniasis at different stages of disease. Pflügers Archiv - Eur J Physiol. (2017) 469:713–24. doi: 10.1007/s00424-017-1974-2
102. Mouhoub B, Bensalah M, Berhili A, Azghar A, El Malki J, El Mezgueldi I, et al. Visceral leishmaniasis associated with macrophage activation syndrome: Case report and literature review. IDCases. (2021) 26:e01247. doi: 10.1016/j.idcr.2021.e01247
103. Huimin Z, Ningning W, Yingying C, Ying Z, Shihe J, Xiaoping R, et al. Extracellular vesicles bearing serum amyloid A1 exacerbate neuroinflammation after intracerebral haemorrhage. Stroke Vasc Neurol. (2025) 10(3):347–58. doi: 10.1136/svn-2024-003525
104. You Y, Muraoka S, Jedrychowski MP, Hu J, McQuade AK, Young-Pearse T, et al. Human neural cell type-specific extracellular vesicle proteome defines disease-related molecules associated with activated astrocytes in Alzheimer’s disease brain. J Extracell Vesicles. (2022) 11:e12183. doi: 10.1002/jev2.12183
105. Mallawaaratchy DM, Hallal S, Russell B, Ly L, Ebrahimkhani S, Wei H, et al. Comprehensive proteome profiling of glioblastoma-derived extracellular vesicles identifies markers for more aggressive disease. J Neuro-Oncology. (2017) 131:233–44. doi: 10.1007/s11060-016-2298-3
106. Dantas-Pereira L, Menna-Barreto R, and Lannes-Vieira J. Extracellular vesicles: potential role in remote signaling and inflammation in trypanosoma cruzi-triggered disease. Front Cell Dev Biol. (2021) 9. doi: 10.3389/fcell.2021.798054
Keywords: extracellular vesicles, proteomics, plasma, biomarkers, visceral leishmaniasis, cured patients
Citation: Torres A, Montero-Calle A, Lozano-Rendal M, Sánchez C, Bernardo L, Solana JC, San Martin JV, Barderas R, Moreno J and Carrillo E (2025) Proteomics of plasma-derived extracellular vesicles from human patients identifies biomarkers for monitoring visceral leishmaniasis therapy. Front. Immunol. 16:1646335. doi: 10.3389/fimmu.2025.1646335
Received: 13 June 2025; Accepted: 21 August 2025;
Published: 12 September 2025.
Edited by:
Victor Corasolla Carregari, State University of Campinas, BrazilReviewed by:
Ulrike Resch, Medical University of Vienna, AustriaFederica Iavarone, Catholic University of the Sacred Heart, Rome, Italy
Copyright © 2025 Torres, Montero-Calle, Lozano-Rendal, Sánchez, Bernardo, Solana, San Martin, Barderas, Moreno and Carrillo. This is an open-access article distributed under the terms of the Creative Commons Attribution License (CC BY). The use, distribution or reproduction in other forums is permitted, provided the original author(s) and the copyright owner(s) are credited and that the original publication in this journal is cited, in accordance with accepted academic practice. No use, distribution or reproduction is permitted which does not comply with these terms.
*Correspondence: Lorena Bernardo, bG9yZW5hLmJlcm5hcmRvQGlzY2lpaS5lcw==; Jose Carlos Solana, amMuc29sYW5hQGV4dGVybm9zLmlzY2lpaS5lcw==
†These authors share first authorship
‡These authors share last authorship