 Lukas Heger
 Carola Berking
 Holger Hackstein1
- 1Department of Transfusion Medicine and Hemostaseology, Universitätsklinikum Erlangen, Friedrich-Alexander-Universität Erlangen-Nürnberg, Erlangen, Germany
- 2Department of Dermatology, Universitätsklinikum Erlangen, Friedrich-Alexander-Universität Erlangen-Nürnberg, Erlangen, Germany
- 3Deutsches Zentrum Immuntherapie, Universitätsklinikum Erlangen, Friedrich-Alexander-Universität Erlangen-Nürnberg, Erlangen, Germany
Introduction: Extracorporeal photopheresis (ECP) is an immunomodulatory treatment option for different T cell-mediated diseases such as cutaneous T cell lymphoma (CTCL) and chronic graft-versus-host disease (GvHD). While in CTCL the polarization of T cells is shifted towards T helper cells type 1 (TH1) and an immune response against the lymphoma is induced, ECP in GvHD rather leads to the expansion of regulatory T cells (Treg). How ECP regulates the immune response dependent on the underlying disease is still not exactly known. As dendritic cells (DCs) are crucial regulators of the immune response, it is supposed that they are key players in the immunomodulatory effects of ECP. However, due to the scarcity of primary DCs in blood, research has focused on in vitro-generated monocyte-derived DCs so far.
Methods: Here, we present for the first time how the primary human blood DC subpopulations, i.e., conventional DCs type 1 (cDC1), cDC2, DC3, and plasmacytoid DCs (pDC), directly isolated from blood of healthy donors, respond to in vitro ECP treatment.
Results: We demonstrate that the exposure to 8-methoxypsoralen and UV-A light irradiation induces apoptosis in Toll-like receptor ligand-activated cDC1 and pDC as well as - to a minor extent - in steady state cDC1, cDC2, and DC3. However, the selective effect of ECP on viability of DC subpopulations was dependent on culture duration (18h vs. 42h) as well as condition (steady state vs. TLR ligand activated). Further, ECP modulates the expression of the co-stimulatory and co-regulatory molecules CD40, CD86, and PD-L1 on DC subpopulations. While ECP did not affect the T cell stimulatory capacity of cDC2 and DC3, ECP-treated cDC1 and - to a minor extent - pDC showed reduced activation of memory T cells and diminished secretion of TH1- and TH17-associated cytokines.
Conclusion: Thus, especially blood cDC1 are direct targets of ECP and the reduction of their T cell stimulatory capacity might contribute to the clinical efficacy observed in chronic GvHD patients.
1 Introduction
Extracorporeal photopheresis (ECP) is an immunomodulatory treatment for different T cell-mediated diseases. For the treatment, leukocytes of the patient are collected by apheresis, incubated with 8-methoxypsoralen (8-MOP), a photoactivatable substance, and exposed to UV-A irradiation followed by reinfusion of the treated leukocytes into the patient. Typically, patients are treated on two consecutive days with ECP in cycles every two to six weeks dependent on the severity of the symptoms. Mechanistically, UV-A light-activated 8-MOP induces single strand breaks in the DNA of the cells by forming adducts with pyrimidine bases of the DNA (1). Subsequently, the leukocytes undergo apoptosis when the repair mechanism of the cells are overloaded (1). ECP was first discovered in the 1980s to be effective for the treatment of cutaneous T cell lymphoma (CTCL) but is now also used to treat other T cell-mediated diseases, such as chronic graft-versus-host disease (GvHD) and chronic allograft rejection (2–5). In addition, ECP has been demonstrated to be effective as prophylactic treatment for the prevention of acute cellular rejection in lung allograft patients (6) and in reducing immune-related adverse events in cancer patients treated with immune checkpoint inhibitors (7, 8).
However, despite its broad use and effectiveness, the exact mechanism how ECP leads to immunomodulation is unclear and seems to depend on the underlying disease. In CTCL, ECP induces a shift from an IL-4-driven T helper cell (TH) type 2 environment to an IFNγ/IL-12-mediated TH1 immune response against the lymphoma (9). In contrast, murine models of GvHD showed an increase in regulatory T cells (Treg) in response to ECP treatment (10). Polarization of T cells into certain subtypes, such as TH1, TH2, or Treg, is usually regulated by dendritic cells (DCs) (11). DCs belong to the group of antigen-presenting cells (APCs) and are the most efficient cell type in inducing naïve T cell responses. DCs are present in both lymphoid as well as non-lymphoid tissues and are equipped with pattern recognition receptors, such as Toll-like receptors (TLRs), C-type lectin receptors, and NOD-like receptors, to sense the environment for pathogen- and danger-associated molecular patterns (PAMPs and DAMPs) (12). After the uptake of antigens by pinocytosis, phagocytosis, or receptor-mediated endocytosis, DCs process the antigens and present the fragments on the cell surface as peptide-MHC (major histocompatibility complex) complexes to T cells (11). Dependent on the environment, DCs either induce tolerance in steady state or T cell immunity under inflammatory conditions. In human and mice, several DC subpopulations exist that can be differentiated based on ontogeny, function, and surface marker expression (11). Conventional DC type 1 (cDC1) depend on the transcription factors IRF8 and BATF3 and human cDC1 can be identified by the expression of XCR1, CLEC9A, and CD141 (13–16). cDC1 excel in the cross-presentation of cell-associated antigens and, therefore, play a crucial role in anti-tumor immunity (17–22). cDC2 partly depend on the transcription factor IRF4 and human cDC2 are characterized by the expression of CD1c, FcϵR1A, and CLEC10A and also termed CD1c+ DCs (22–25). CD1c+ DCs are superior in the induction of T helper cell responses and can be further divided into bona fide CD5+ cDC2 with higher T cell-stimulatory capacity and monocyte-related CD163+CD64+ DC3 with a more pro-inflammatory phenotype (18, 26–32). In addition, plasmacytoid DCs (pDC) exist that rely on transcription factors such as E2–2 and SpiB and are identified in humans by the expression of CD123 and CD303 (33–36). pDC are known for their capacity to secrete high amounts of type I interferons and, thus, for their role in antiviral immunity (37, 38).
Due to their important role in the regulation of T cell immunity, ECP might influence DCs to either induce immunity in CTCL or tolerance in GvHD. However, as primary DCs are very rare cell types, accounting for less than 1% of peripheral blood mononuclear cells (PBMCs), much of the research has focused on monocyte-derived DCs (moDCs) or bone marrow-derived DCs (BMDCs), which can be generated in large quantities in vitro by culturing purified monocytes or bone marrow cells, respectively, in the presence of GM-CSF and IL-4 (39, 40). moDCs treated in vitro with ECP showed strong induction of apoptosis in the steady state as well as under inflammatory conditions (41). Further, ECP prevented the expression of co-stimulatory molecules as well as the secretion of IL-12 leading to a reduced induction of naïve T cell responses (41). When untreated moDCs were co-cultured with ECP-treated apoptotic lymphocytes, the moDCs showed reduced expression of co-stimulatory molecules as well as enhanced secretion of the anti-inflammatory cytokine IL-10 (42). Similarly, rat BMDCs showed a decreased expression of co-stimulatory molecules, an increased secretion of IL-10, and a reduced capacity to induce naïve T cell responses, when co-cultured with ECP-treated splenic cells (43). Thus, in vitro-generated BMDCs and moDCs seem to respond to ECP. However, moDCs do not reflect the primary blood DCs present in the apheresate of patients but rather correspond to inflammatory DCs (44).
Thus, data on the response of human primary blood DCs to ECP are still largely missing. Since infusion of ECP-treated enriched DCs was sufficient to transfer the therapeutic effect of ECP in a murine model of contact hypersensitivity (45), we investigated how human primary blood DCs respond to in vitro treatment with ECP. For this purpose, cDC1, cDC2, DC3, and pDC were isolated from the blood of healthy donors by cell sorting and treated with 8-MOP and UV-A light in steady state and in presence of TLR ligands. Subsequently, the induction of cell death, the expression of co-stimulatory and co-inhibitory molecules, cytokine secretion as well as the capacity to activate memory T cell responses were determined. We demonstrate that in vitro ECP induces apoptosis preferentially in cDC1 and pDC after stimulation with TLR ligands and strongly reduces the capacity of cDC1 to activate CD4+ and CD8+ memory T cell responses. Thus, in an inflammatory setting as observed in GvHD patients, the reduction of the T cell stimulatory capacity of cDC1 might contribute to the effector mechanism of ECP.
2 Materials and methods
2.1 Isolation of peripheral blood mononuclear cells from healthy blood donors
Leukocyte reduction system (LRS) cones and thrombocyte apheresis cassettes (TACs) were retrieved from healthy adults undergoing thrombocytapheresis at the Department of Transfusion Medicine and Hemostaseology of the University Hospital Erlangen. This study was performed with the informed written consents of all donors in accordance with the Declaration of Helsinki (approved by the local ethics committee [Ethikkommission der Friedrich-Alexander-Universität Erlangen-Nürnberg]; ethics vote 346_18 B). Peripheral blood mononuclear cells (PBMCs) were isolated from LRS cones and TACs as described before (46, 47). Briefly, the blood product was extracted and diluted with PBS. Subsequently, 20 ml of diluted blood product was overlaid onto 14 ml of Lymphocyte Separation Medium (Anprotec) and centrifuged for 20 min with 520 x g at room temperature without brakes. Then, the interphase containing the mononuclear cells was transferred to a 50 ml tube and washed twice with phosphate-buffered saline (PBS). After washing, cell numbers were determined using a Luna-FL Automated Fluorescence Cell Counter (Logos Biosystems) and the cells used for the experiments.
2.2 Cell sorting of human primary dendritic cell subpopulations
For experiments with human dendritic cell (DC) subpopulations, DCs were isolated from PBMCs of healthy adults by cell sorting as described before (16, 31, 46). Briefly, PBMCs were resuspended in PBS + 2% fetal calf serum (FCS) + 1 mM EDTA (EasySep Buffer) with a concentration of 1 x 10⁸ cells/ml. Up to 9 ml of cell suspension were transferred to 14 ml roundbottom tubes and enriched using the EasySep Human Pan-DC Pre-Enrichment Kit (Stemcell Technologies). Subsequently, enriched DCs were stained with a panel of fluorochrome-coupled antibodies and stained on ice for 30 min. After washing, cells were resuspended in EasySep Buffer + DAPI (100 ng/ml) and sorted into sterile FACS tubes using a BD FACSAria II cell sorter with a 70 µm nozzle. DCs were defined as Lin- (CD3/CD19/CD20/CD56 and CD14/CD16) and sorted as cDC1 (HLA-DR+CD141+CD11cintCD1c-CD123-), cDC2 (HLA-DR+CD1c+CD11c+CD64-CD163-CD123-), DC3 (HLA-DR+CD1c+CD11c+CD64+CD163+CD123-), and pDC (HLA-DR+CD123+CD141intCD1c-CD11c-) as shown in Figure 1.
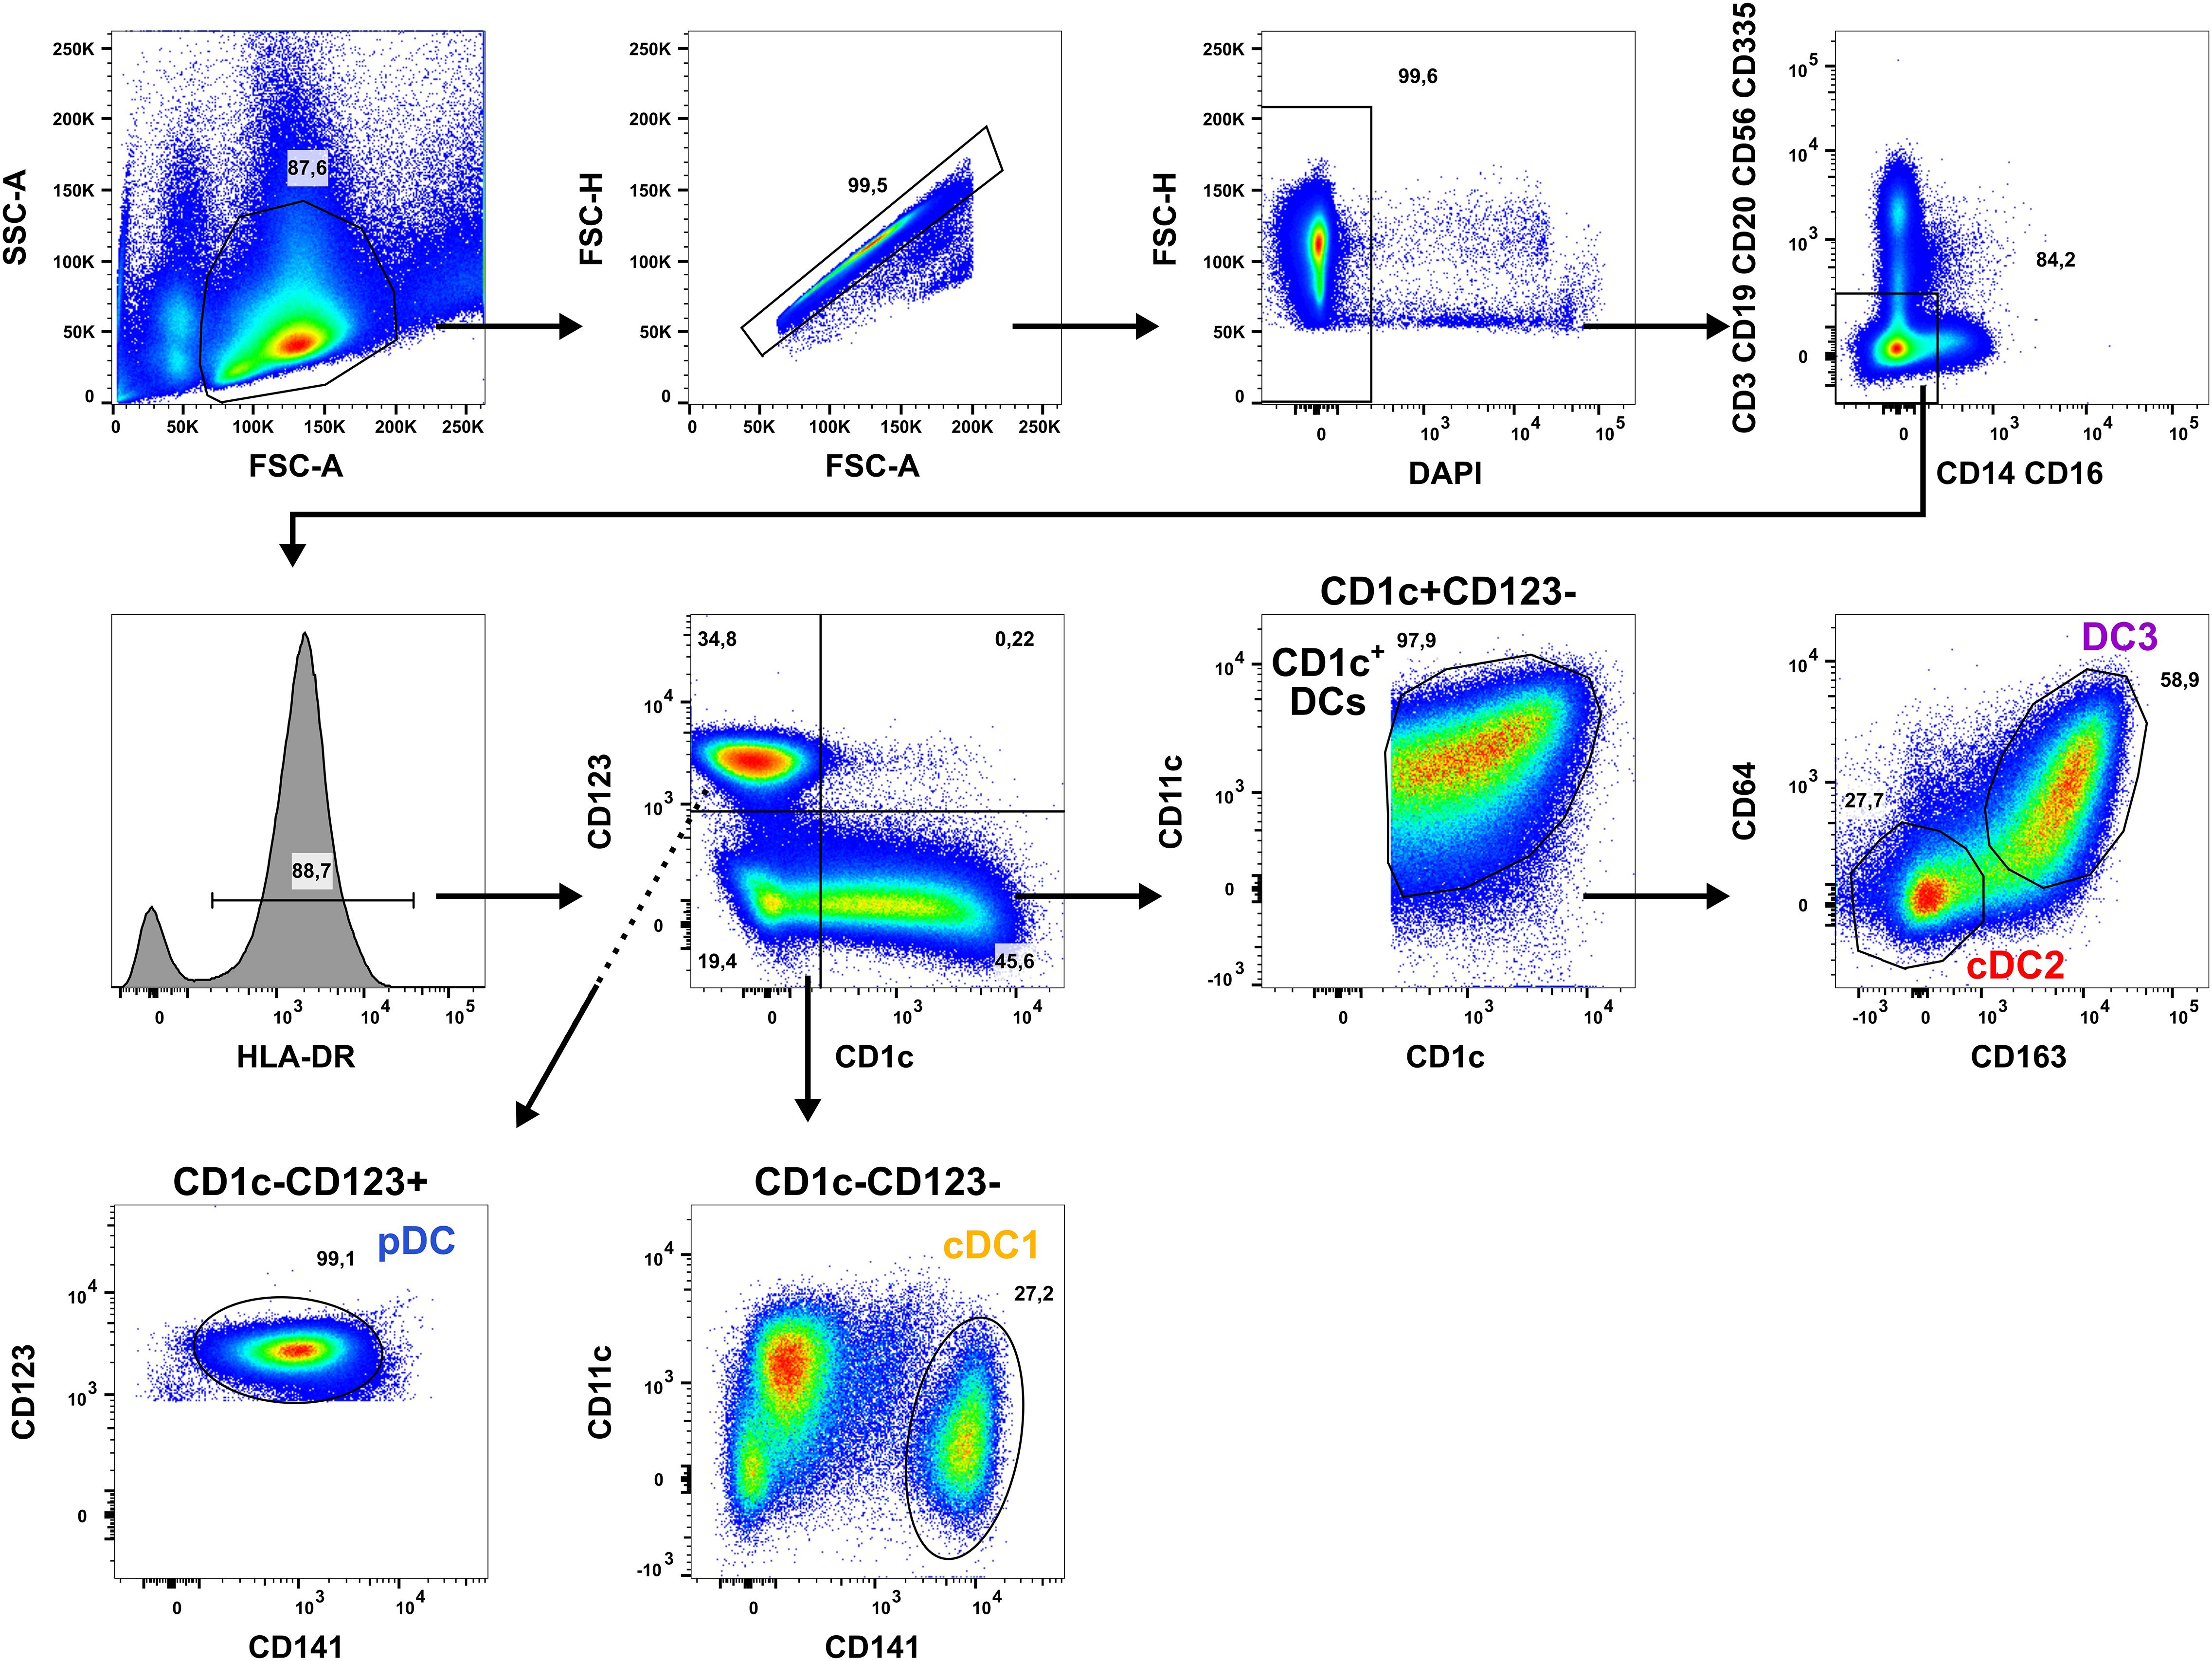
Figure 1. Applied gating strategy for the isolation of human DC subpopulations. PBMCs of healthy human adults undergoing thrombocytapheresis were enriched using the EasySep Pan-DC Pre-Enrichment kit and stained with a panel of fluorochrome-conjugated antibodies (Table 1). Then, DC subpopulations were sorted using a BD Aria II by gating for the morphology of leukocytes (FSC-A/SSC-A), singlets (FSC-A/FSH-H), and living cells (DAPI-). After exclusion of T cells (CD3+), B cells (CD19/CD20+), NK cells (CD56/CD335+), and monocytes (CD14/CD16+), DCs were selected by gating for HLA-DR+ cells. DCs were divided into CD1c+CD123-, CD1c-CD123-, and CD1c-CD123+ cells using a quadrant gate. CD1c+ DCs were identified in CD1c+CD123- cells by co-expression of CD1c and CD11c and sorted into CD64-CD163- cDC2 (red) and CD64+CD163+ DC3 (purple). cDC1 were gated in the CD1c-CD123- fraction as CD141+CD11cint cells (yellow-orange). In the CD1c-CD123+ quadrant, pDC were sorted as CD123+CD141int cells. One representative donor is shown.
2.3 In vitro treatment with extracorporeal photopheresis
For in vitro treatment with ECP, sorted human primary DC subpopulations were resuspended in DC medium (RPMI-1640 + 10% human serum type AB + 1% L-Glutamax + 1% Penicillin/Streptomycin + 1% Na-Pyruvat + 1% non-essential amino acids + 1% HEPES) and seeded in sterile 96-well plates (V-bottom). Then, either 400 ng/ml 8-MOP or solvent control (equal volume ethanol) were added and the cells incubated at 37°C for 30 min. After incubation, plates were either irradiated with 2 J/cm² UV-A light (BIO-LINK BLX-365 irradiation chamber) or MOCK treated (48). After centrifugation for 10 min at room temperature with 300 x g, supernatant was removed and the cells resuspended either in DC medium (steady state) or in DC medium + 5 µg/ml R848, 5 µg/ml pIC, 100 ng/ml CRX-527, or 2.5 µM CpG (ODN2216) (inflammatory conditions). Cells were cultured for different time points (18 h, 42 h) before flow cytometric analysis and harvesting of supernatants for cytometric bead assay (CBA) analysis. For flow cytometric analysis, cells were stained with BV605-coupled anti-CD1c (clone: L161, BioLegend), PE/Cy7-coupled anti-CD11c (clone: 3.9, BioLegend), A647-coupled anti-CD64 (clone: 10.1, BioLegend), BV510-coupled anti-CD123 (clone: 6H6, BioLegend), BV421-coupled anti-CD141 (clone: M80, BioLegend), PE/Dazzle 594-coupled anti-CD163 (clone: GHI/61, BioLegend), and APC/Cy7-coupled anti-HLA-DR (clone: L243, BioLegend) for identification of DC subpopulations. In addition, they were stained with either A700-coupled anti-CD40 (clone: 5C3, BioLegend), FITC-coupled anti-CD86 (clone: Bu63, BioLegend), BV650-coupled anti-PD-L1 (clone: 29E2A3, BioLegend) or respective isotype controls for 30 min on ice. After washing, cells were stained with PE-coupled Annexin V (BioLegend) and 7-AAD (BioLegend) for 20 min on ice. After washing, cells were acquired using a Cytoflex S (Beckman Coulter) and analyzed using FlowJo Software (V10). Supernatants of the cells were stored at -80°C until analysis for secreted cyto- and chemokines by CBA using the LEGENDplex Human Macrophage/Microglia Panel (BioLegend). Supernatants were thawed and concentrations of the cytokines IL-12p70, TNF-α, IL-6, IL-4, IL-10, IL-1β, Arginase, CCL17 (TARC), IL-1RA, IL-12p40, IL-23, IFN-γ, and CXCL10 (IP-10) determined as described by the manufacturer. Subsequently, samples were acquired using a Cytoflex S (Beckman Coulter) and analyzed using the LEGENDplex Data Analysis Software Suite (Qognit). Then, the data were normalized based on the highest measured value (median of six/five individual values for each condition) in the complete dataset for each cytokine and plotted as heatmap. The maximal measured median value was given as reference in the figure. Based on the color code (% of max. values) and the max. value measured in the dataset, the median concentration for each subset and condition can be determined.
2.4 Activation of antigen-specific memory T cells
In order to perform co-cultures of DC subpopulations and autologous memory T cells, cDC1, cDC2, DC3, and pDC were sorted from healthy blood donors as described above. Autologous memory T cells were isolated from the same blood donor by negative enrichment using the MojoSort Human CD3 T Cell Isolation Kit (BioLegend) with addition of biotinylated anti-CD45RA antibody (clone: HI100, BioLegend) to deplete naïve T cells. To measure proliferation of T cells, isolated memory T cells were labeled with 5 µM CFSE (BioLegend) for 15 min at 37°C prior to the co-culture.
Before the co-culture, DCs were incubated with 400 ng/ml 8-MOP or solvent control for 30 min at 37°C. Then, DCs were irradiated with 2 J/cm2 UV-A light (BIO-LINK BLX-365 irradiation chamber) or MOCK treated. After centrifugation for 8 min with 300 x g at 30°C, supernatant was removed and DCs resuspended in medium either with 1 nM CEFT peptides for presentation on MHC-I and MHC-II molecules (JPT petide technologies), 1 nM CEFT peptides + 1 µg/ml R848, or 10 CFU/DC heat-killed E. coli (Invivogen). After 18 h at 37°C, autologous CFSE+ memory T cells were added in a 1:10 DC:T cell ratio and co-cultured for five days. After the co-culture, supernatants were stored at -80°C until analysis for cytokine secretion using the LEGENDplex Hu Th Cytokine Panel (BioLegend). The T cells were analyzed by flow cytometry for proliferation (dilution of CFSE signal) as well as phenotype (activation and exhaustion markers). Therefore, cells were stained with BV510-coupled anti-CD3 (clone: OKT3, BioLegend), APC/Cy7-coupled anti-CD4 (clone: OKT4, BioLegend), PE/Cy5-coupled anti-CD8a (clone: HIT8a, BioLegend) as well as either APC-coupled anti-CD25 (clone: BC96, BioLegend), PE-coupled anti-CD71 (clone: CY1G4, BioLegend), A700-coupled anti-CD197 (clone: G043H7, BioLegend), BV605-coupled anti-CD223 (clone: 11C3C65, BioLegend), as well as PE/Cy7-coupled anti-CD178 (clone: NOK-1, BioLegend) or respective isotype controls for 30 min on ice. After washing, cells were stained with 100 ng/ml DAPI (Carl Roth) for 5 min on ice. Then, cells were acquired using a Cytoflex S (Beckman Coulter) and analyzed using FlowJo Software.
2.5 Statistical analysis
Statistical analysis was performed in GraphPad Prism (V10) using 2way ANOVA for grouped data with Dunnett’s multiple comparisons tests as posthoc test. Individual symbols were used for each donor. In figures showing data from the same timepoint, donors can be traced by these individual symbols (all Figures for 18h time point, all Figure for 42h time point as well as all Figures and all Supplementary Figures for memory T cell assay).
3 Results
3.1 Extracorporeal photopheresis induces apoptosis especially in cDC1 and pDCs stimulated with TLR ligands
ECP is an immunomodulatory treatment inducing apoptosis in lymphocytes as well as modulating the immune response towards TH1 in CTCL or Tregs in GvHD. In contact hypersensitivity in mice, ECP-treated DCs are sufficient to transfer the tolerogenic effect of ECP (45). However, it is unclear how primary human DCs, which are present in the photopheresate of patients, respond to the treatment with 8-MOP and UV-A light irradiation. As DCs are the main regulators of T cell responses, we speculated that ECP affects DCs directly. Due to the scarcity of DCs, we decided to perform in vitro ECP of sorted human primary blood DCs from healthy blood donors. Therefore, we enriched all human DC subpopulations from blood of healthy donors by negative enrichment followed by cell-sorting as described recently (31, 46). For cell sorting, enriched DCs were stained with a panel of fluorochrome-coupled antibodies (Table 1) and sorted into CD141+CD11cint cDC1, CD1c+CD11c+CD64-CD163- cDC2, CD1c+CD11c+CD14-CD64+CD163+ DC3 (CD14- DC3), and CD123+CD141intCD11c- pDC (Figure 1). When we cultured the DCs for 18h at 37°C, the phenotype of the DC subpopulations was stable: cDC1 showed expression of CD141 and CD11c but lacked markers of the DC2 lineage (Supplementary Figure 1). Both cDC2 and CD14- DC3 remained CD1c+CD11c+. While they still could be differentiated based on CD163 and CD64 expression, the signal was weaker compared to freshly isolated DC3 (Supplementary Figure 1). Further, pDC could be identified by CD123 and CD141 expression as during cell sorting and did not express DC2-associated markers such as CD1c (Supplementary Figure 1). For the in vitro treatment with ECP, the purified DC subpopulations were incubated with 400 ng/ml 8-MOP or ethanol as solvent control for 30 minutes at 37°C followed by irradiation with 2 J/cm² UV-A or mock treatment. Subsequently, the medium containing 8-MOP or ethanol was replaced with fresh medium to mimic reinfusion of the photophoresate into the patients resulting in strong dilution of the photophoresate. The DCs were then either cultured in presence of the TLR ligand R848, as a model for DC activation in inflammatory conditions, or in medium to mimic steady state conditions. Since ECP induces apoptosis in lymphocytes such as T cells, we analyzed the induction of cell death using flow cytometry by staining the cells with Annexin V and 7-AAD to distinguish between early (Annexin V+/7-AAD-) and late apoptosis (Annexin V+/7-AAD+) as well as necrosis (Annexin V-/7-AAD+) (Supplementary Figure 2). After 18 h of culture, we observed induction of apoptosis in cDC1 and cDC2 in steady state conditions as well as in cDC1, cDC2, and CD14- DC3 after TLR stimulation (Figure 2). Since ECP has been shown to influence the phenotype of immune cells such as monocytes (49, 50), we were interested in how in vitro ECP would modulate the expression of co-stimulatory and -regulatory molecules and the secretion of cyto- and chemokines in steady state as well as upon TLR stimulation. Therefore, we analyzed the living DCs (Annexin V-/7-AAD-) for the expression of co-stimulatory (CD40, CD86) and -regulatory (PD-L1) molecules by flow cytometry (Supplementary Figure 3), while the supernatants of the cells were collected for analysis of secreted cyto- and chemokines. After 18h, we observed only minor changes in the expression of co-stimulatory and -regulatory molecules (Figure 3). In steady state, 8-MOP/UV-A-treated cDC1 showed enhanced expression of CD40, whereas upon TLR stimulation CD86 and PD-L1 were enhanced on in vitro ECP-treated cDC1 (Figure 3). The phenotype of CD14- DC3 was more pro-inflammatory under ECP conditions both in steady state (CD86) as well as after stimulation with R848 (CD40 and CD86), whereas ECP-treated pDC showed enhanced expression of the immunoregulatory molecule PD-L1 after TLR stimulation (Figure 3). The surface phenotype of cDC2 remained largely unchanged except for increased CD40 expression after ECP in presence of the TLR ligand R848 (Figure 3). In order to analyze whether these changes were specific to stimulation of TLR7/8, we used the TLR3 ligand pIC for cDC1, the TLR4 ligand CRX-527 for cDC2 and CD14- DC3, and the TLR9 ligand CpG for pDC. Then, we analyzed the induction of cell death as well as co-stimulatory and -regulatory molecule expression as before. As with R848, we observed induction of apoptosis in cDC1 and CD14- DC3 after TLR3 and TLR4 stimulation, respectively, whereas the cell death of cDC2 were rather dependent on UV-A light irradiation (Supplementary Figure 4A). Except for upregulation of PD-L1 on DC3 and pDC, we did not observe changes in the expression of co-stimulatory or -regulatory molecules (Supplementary Figure 5A).
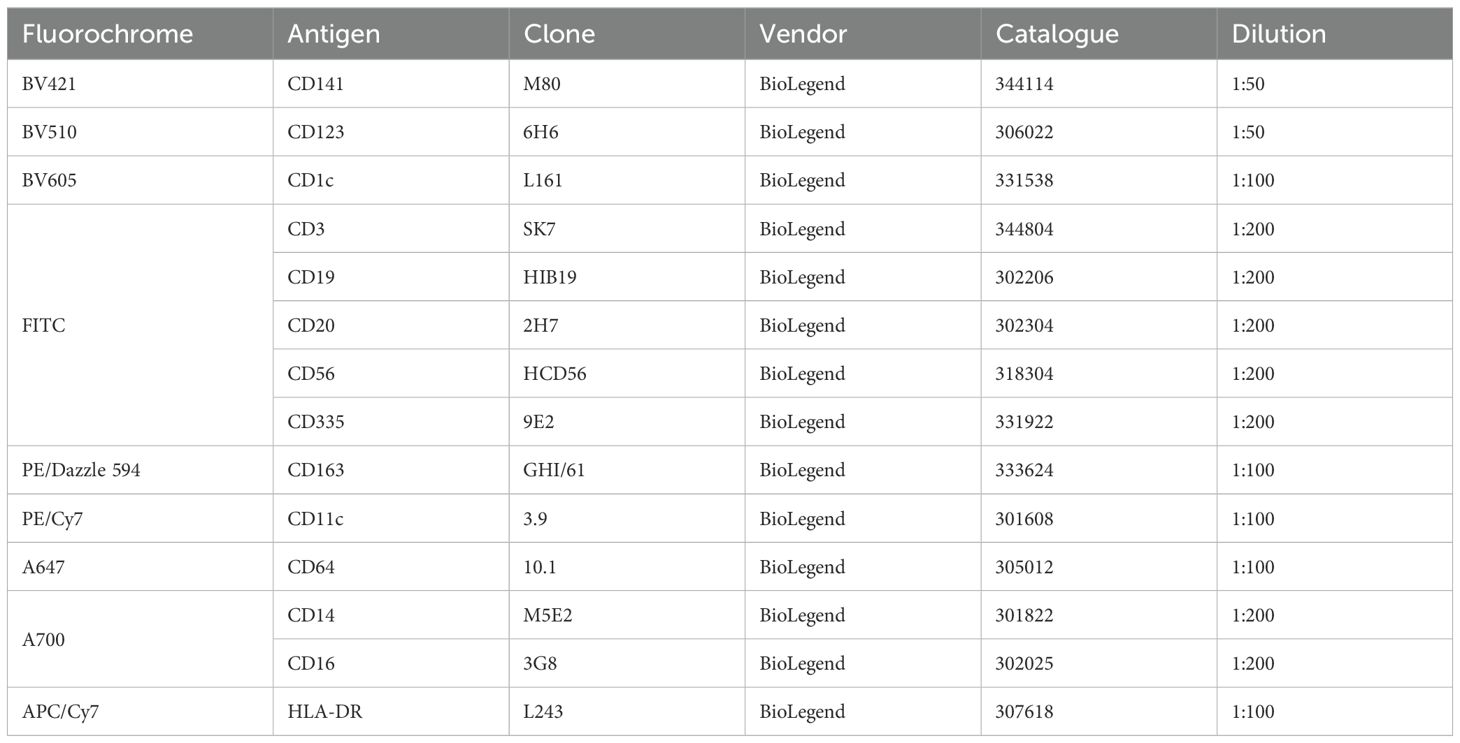
Table 1. Antibody panel for cell sorting of human DCs.
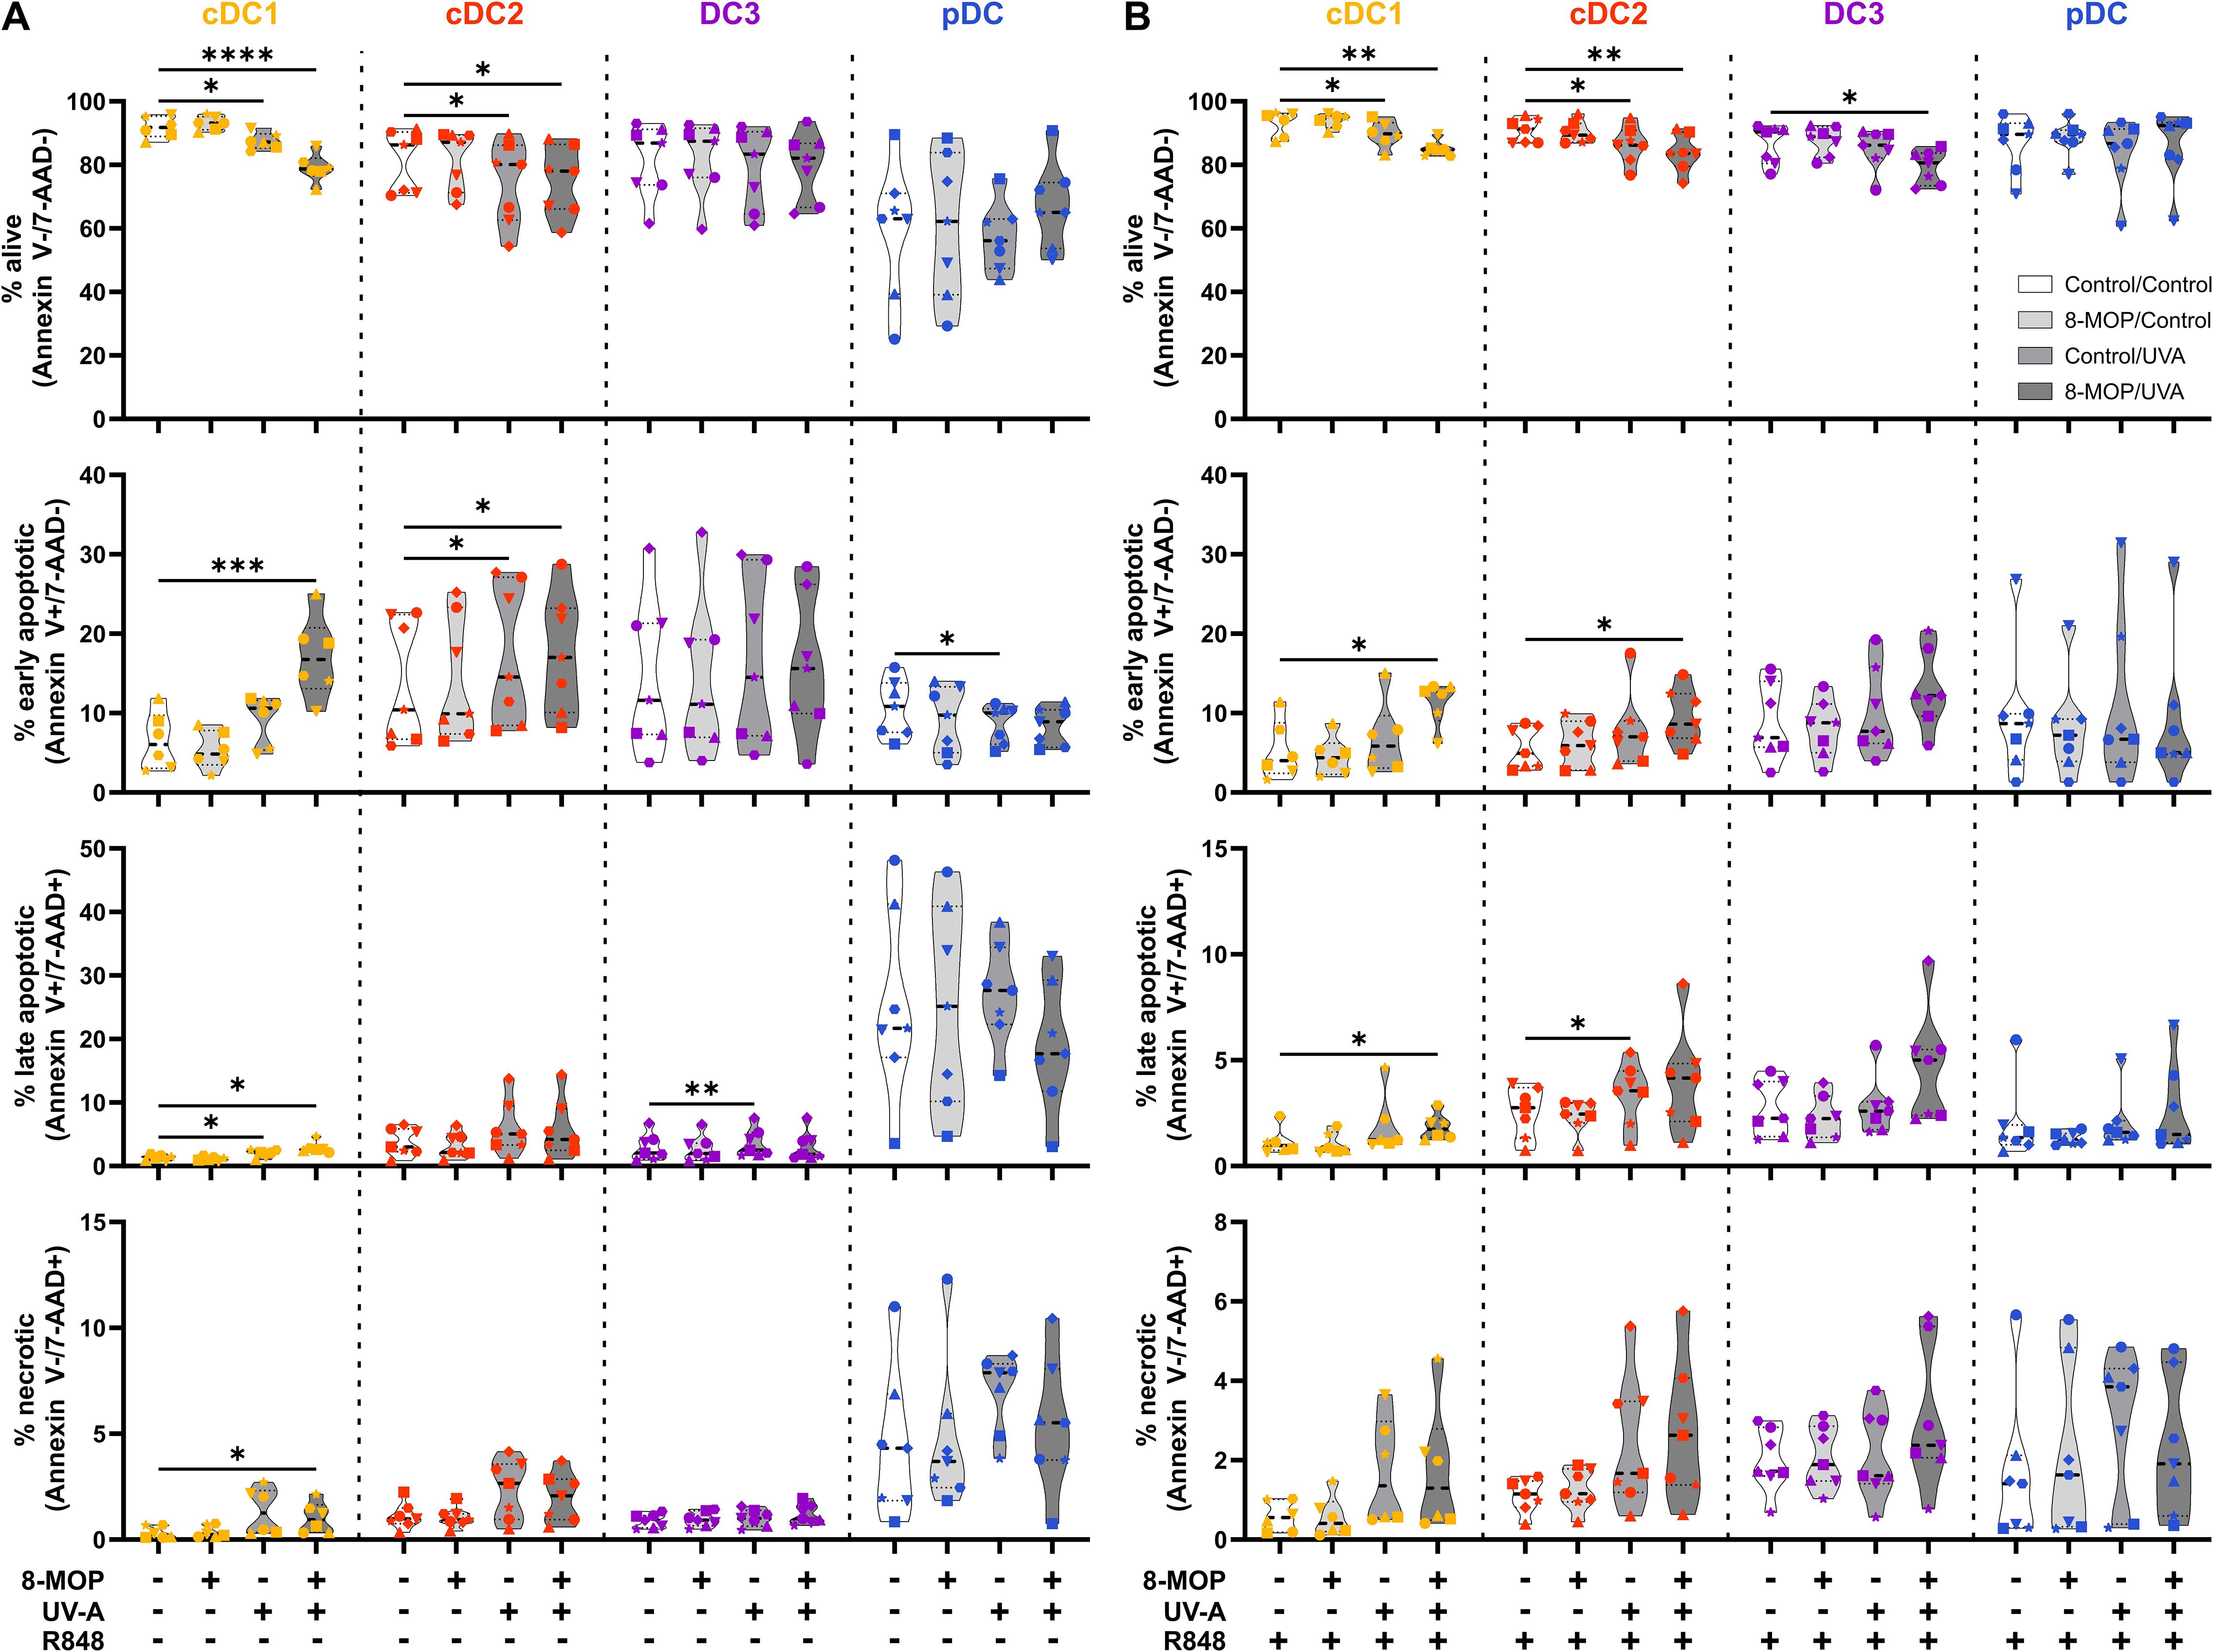
Figure 2. Experimental ECP induces apoptosis primarily in human blood cDC1 after 18 h of culture. Cell sorter-purified cDC1, cDC2, CD14- DC3, and pDC were incubated either with 400 ng/ml 8-MOP or equal amount of solvent control (ethanol) for 30 min at 37°C as indicated below the figure. Then, cells were either irradiated with 2 J/cm2 UV-A light or mock-treated. After centrifugation to remove the solvent, cells were resuspended in (A) medium or (B) medium containing 5 µg/ml R848. After 18 h of culture, DCs were stained with the antibodies used for cell sorting and 7-AAD and Annexin V-PE to determine viability. Truncated violin plots depict percentages of alive (Annexin V-/7-AAD-), early apoptotic (Annexin V+/7-AAD-), late apoptotic (Annexin V+/7-AAD+), and necrotic (Annexin V-/7-AAD+) cDC1 (yellow-orange symbols), cDC2 (red symbols), DC3 (purple symbols) and pDC (blue symbols) of six donors (each donor with an individual symbol). Statistical analysis was performed in GraphPad Prism (V10) using 2way ANOVA for grouped data with Dunnett’s multiple comparisons tests as posthoc test (*p < 0.05, **p < 0.01, ***p < 0.001, ****p < 0.0001).
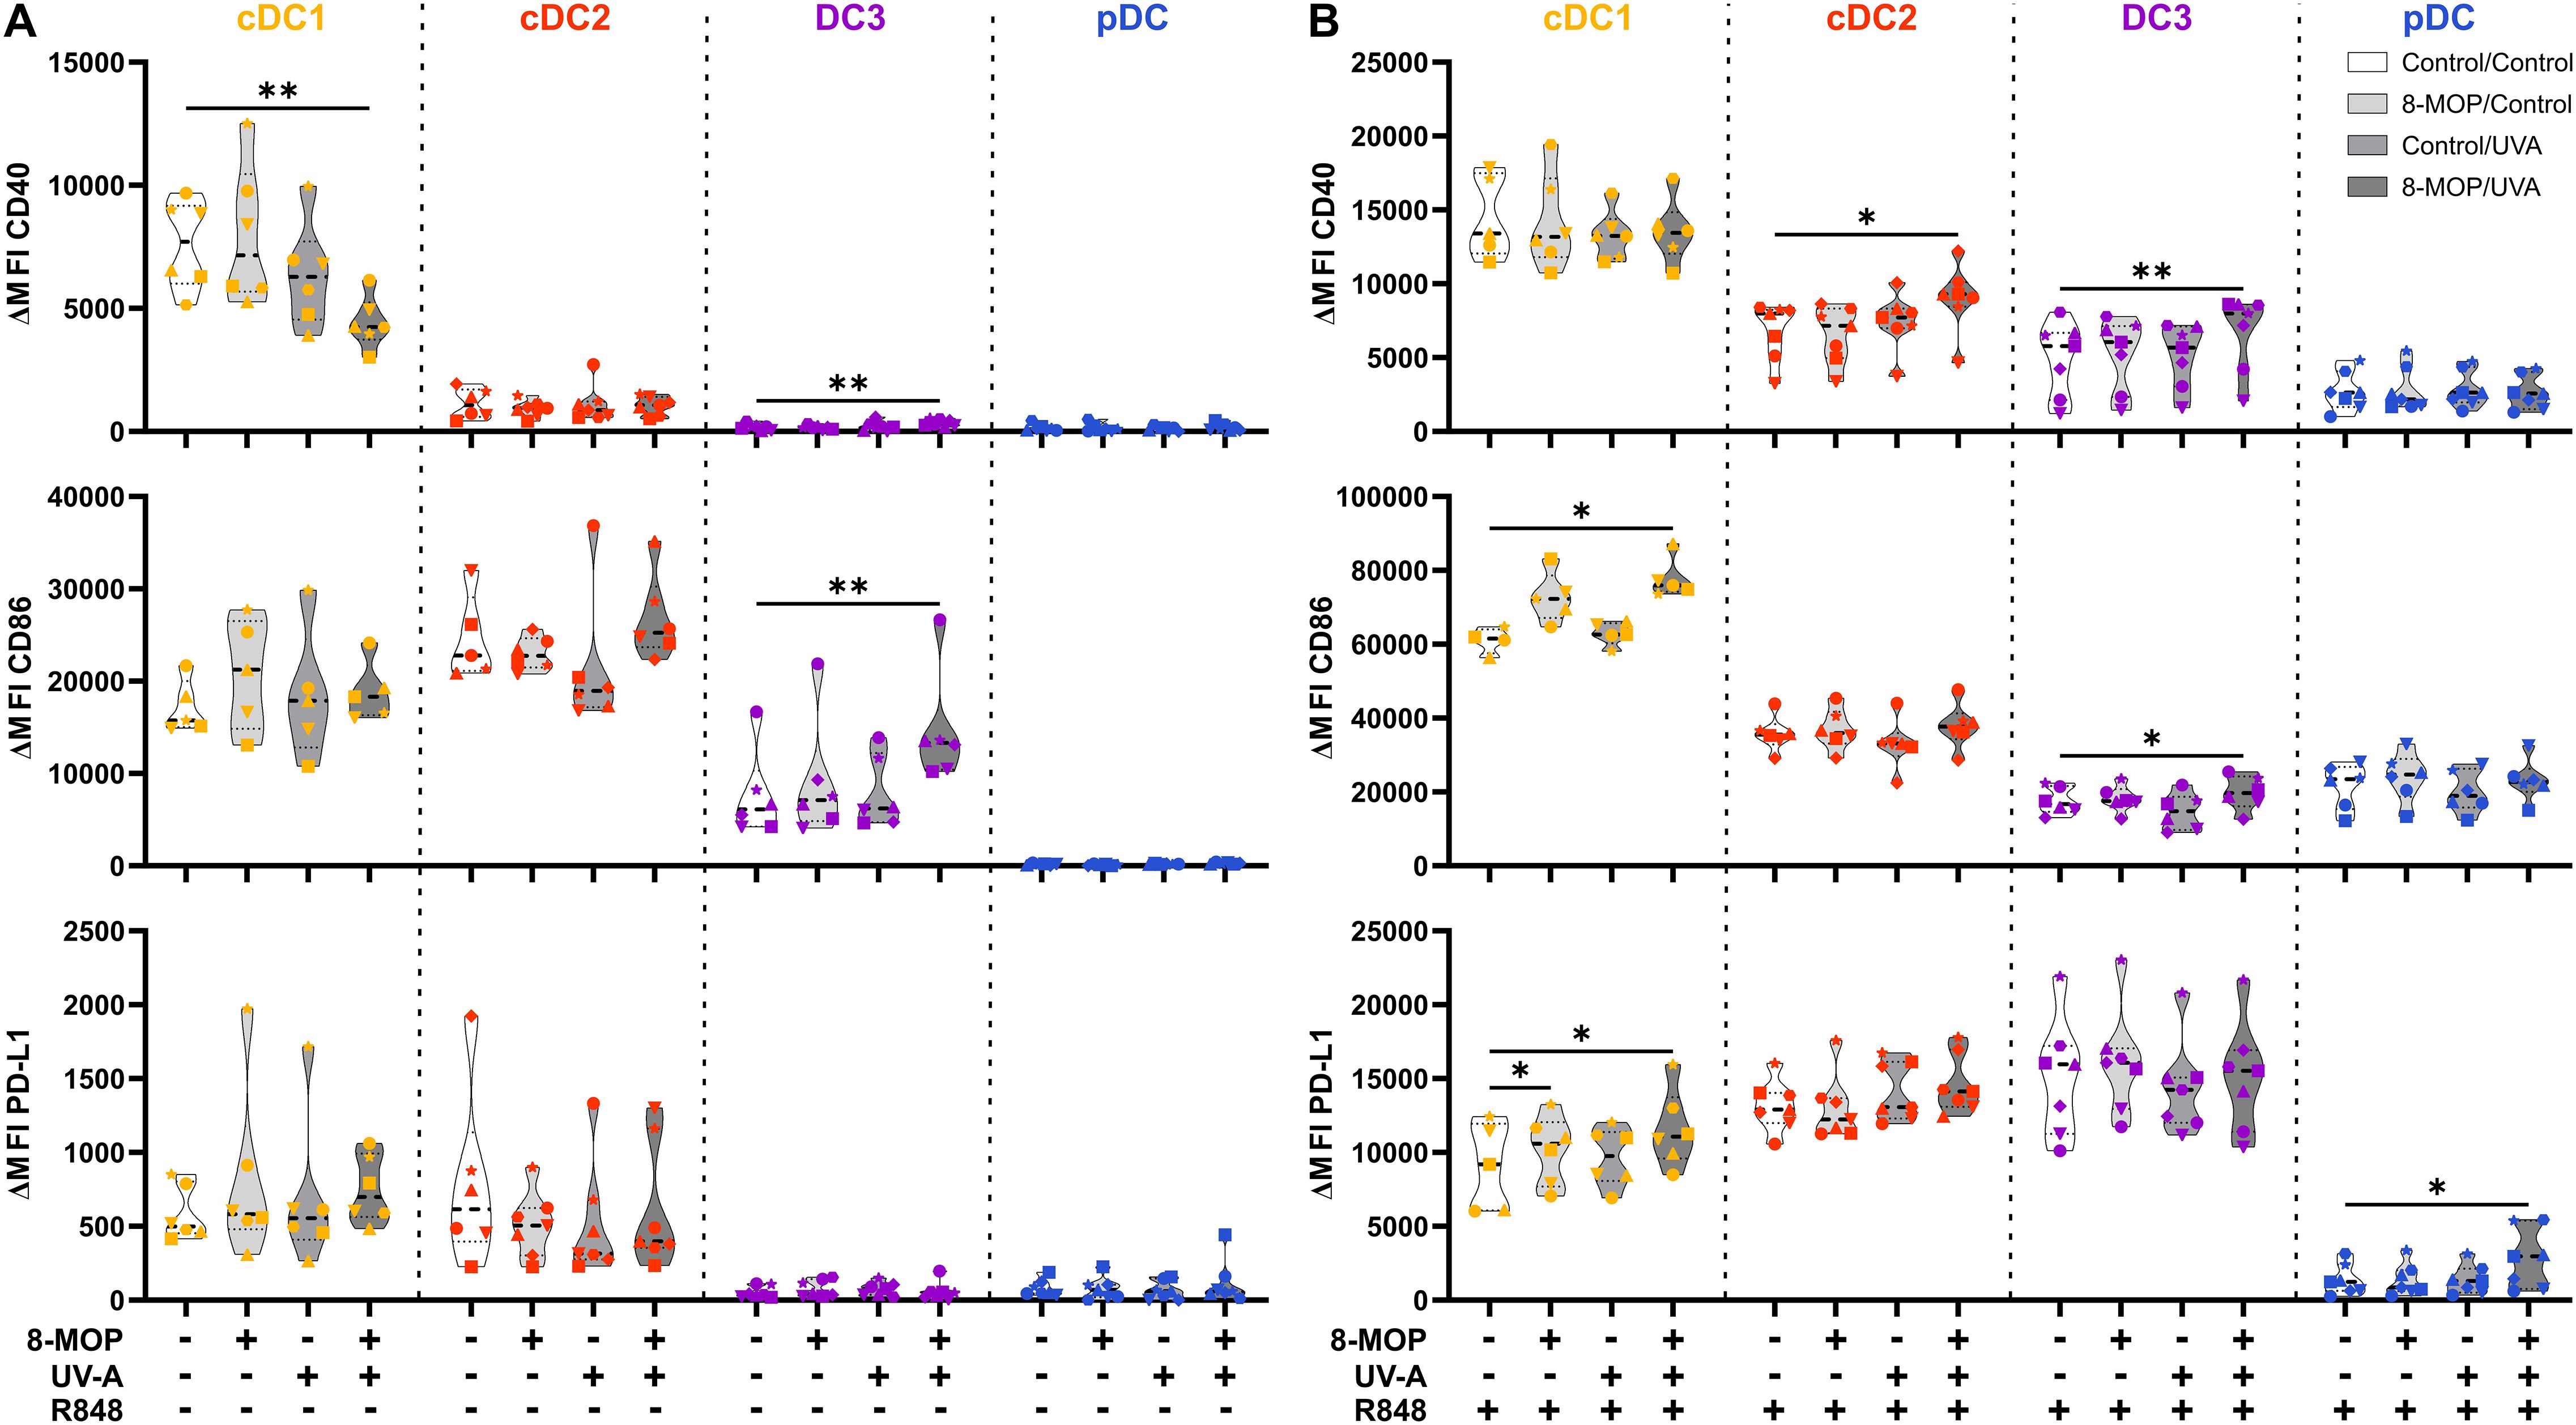
Figure 3. Experimental ECP modulates the expression of co-stimulatory and -regulatory molecules on human primary DCs after 18 h of culture. Cell sorter-purified cDC1, cDC2, CD14- DC3, and pDC were incubated either with 400 ng/ml 8-MOP or equal amount of solvent control (ethanol) for 30 min at 37°C as indicated below the figure. Then, cells were either irradiated with 2 J/cm2 UV-A light or mock-treated. After centrifugation to remove the solvent, cells were resuspended in (A) medium or (B) medium containing 5 µg/ml R848. After 18 h of culture, DCs were stained with the antibodies used for cell sorting and A700-coupled anti-CD40, FITC-coupled anti-CD86, and BV650-coupled anti-PD-L1 or respective isotype controls. Truncated violin plots show ΔMFI on alive (Annexin V-/7-AAD-) cDC1 (yellow-orange symbols), cDC2 (red symbols), DC3 (purple symbols) and pDC (blue symbols) of six donors (each donor with an individual symbol). Statistical analysis was performed in GraphPad Prism (V10) using 2way ANOVA for grouped data with Dunnett’s multiple comparisons tests as posthoc test (*p < 0.05, **p < 0.01, ***p < 0.001, ****p < 0.0001).
As ECP was reported to induce spontaneous release of IL-10 by myeloid CD1c+ DCs isolated from the photophoresate of refractory chronic GvHD patients (51), we were interested in how in vitro ECP would affect the secretion of cyto- and chemokines by sorted DCs. We determined the concentration of secreted cyto- and chemokines in the supernatants of the treated DCs by CBA using the LEGENDplex Human Macrophage/Microglia Panel. As expected, cDC1 were the main producers of IL-12 family members, i.e., IL-12p70, IL-12p40, and IL-23, after stimulation with R848, while cDC2 and CD14- DC3 excelled in the secretion of the pro-inflammatory cytokines IL-6, TNFα, and IL-1β as well as the anti-inflammatory cytokines IL-10 and IL-1RA (Figure 4A). In contrast, pDC were the main producers of the chemokine CXCL10 (IP-10) that is dependent on signaling of interferon response factors (IRFs) (Figure 4A). When analyzing the impact of in vitro ECP, we did not observe induction of pro- or anti-inflammatory cytokines in steady state conditions and only slight changes on the secretion of cyto- and chemokines after TLR stimulation (cDC2: TNFα↑, IL-1β↑, IL10↑, IL-1RA↑; CD14- DC3: IL-10↓; pDC: CXCL10↓; Figure 4A).
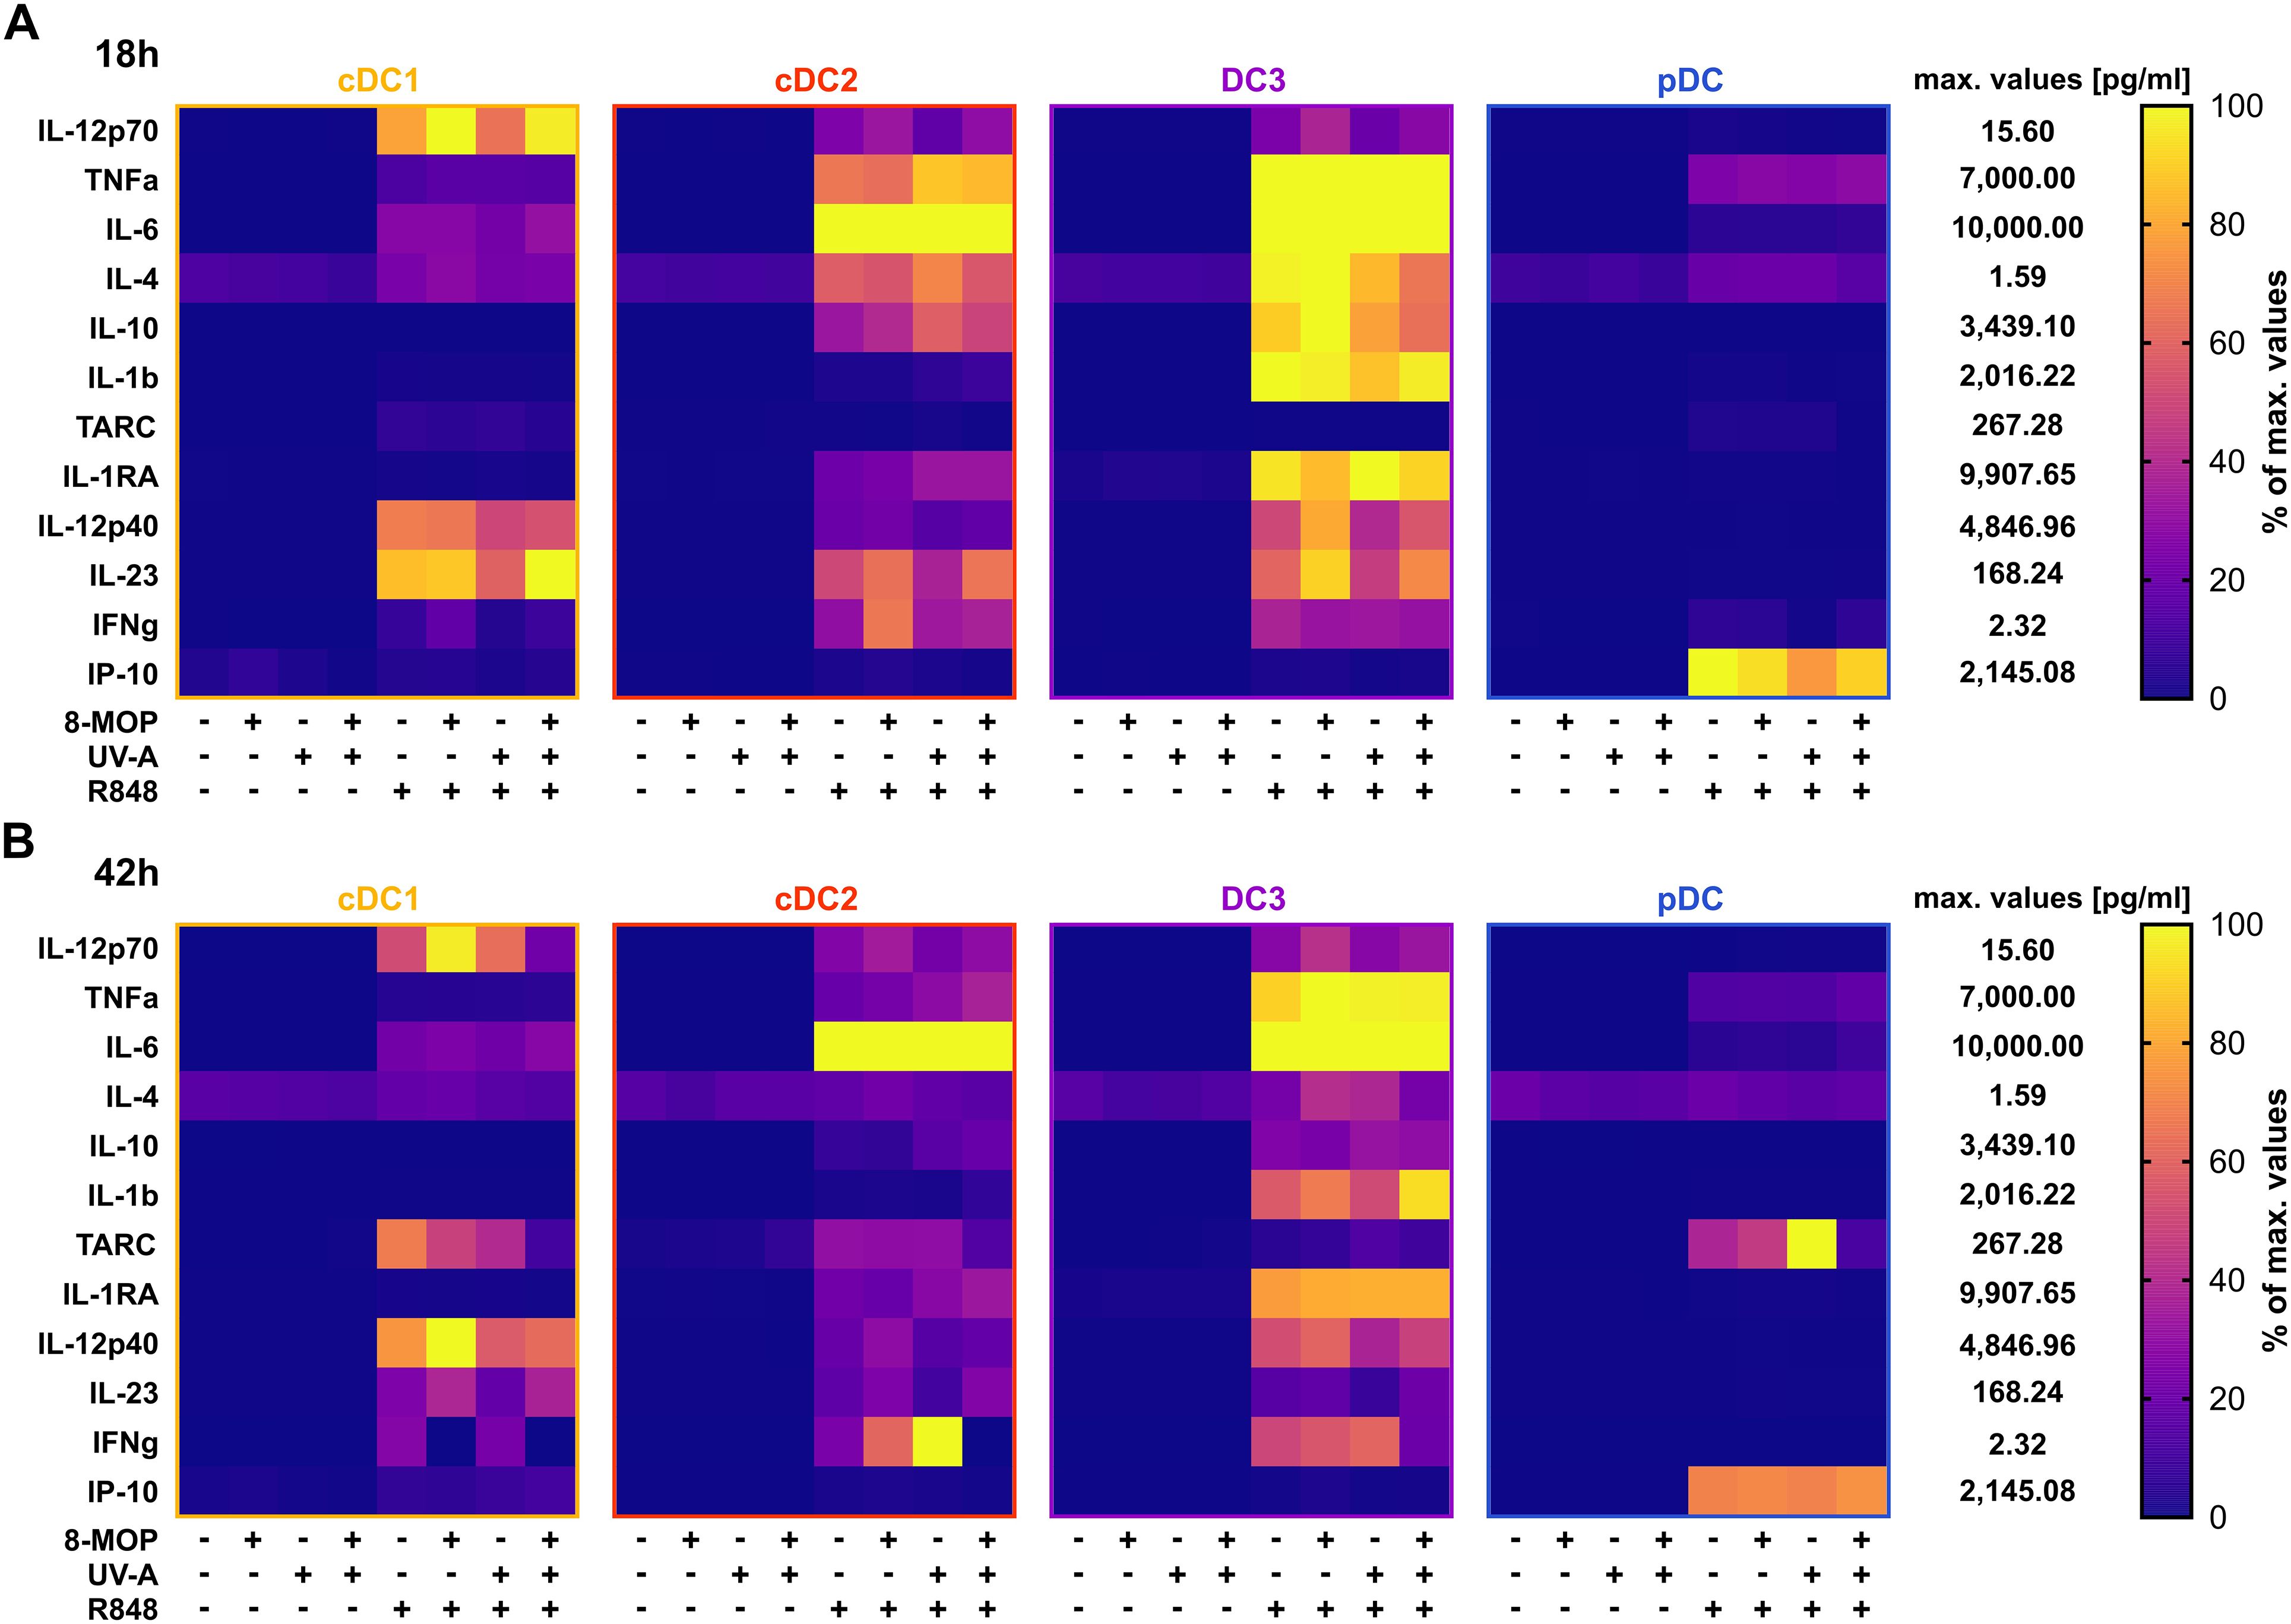
Figure 4. R848-induced cyto- and chemokine secretion by DCs is minorily influenced by in vitro treatment with ECP. Supernatants of DC subpopulations treated either with ECP (8-MOP/UV-A) or control conditions for (A) 18 h or (B) 42 h were analyzed by LEGENDplex Human Macrophage/Microglia Panel (BioLegend) for the secretion of cyto- and chemokines. Measured concentrations (pg/ml) were normalized based on the highest measured median value for each analyte in the whole data set. Percentage of maximum for cDC1, cDC2, CD14- DC3, pDC is shown (each square shows the mean of (A) six or (B) five donors).
In order to monitor how ECP would affect DCs at a later time point after reinfusion of the photophoresate, we performed the same analyses after 42 h of incubation at 37°C. The majority of DCs were apoptotic or necrotic in steady state conditions, but ECP reduced further the survival of CD14- DC3 and pDC (Figure 5A). The low viability of the different DC subpopulations is in accordance with data on the circulating lifespan of human DCs in vivo showing a shorter lifetime of cDC1 (1.3 days) compared to DC2 and DC3 (2.2 days) (52). However, after TLR stimulation the survival of cDC1 (R848 and pIC) and pDCs (R848 and CpG) was strongly increased in control conditions, which was completely abrogated when cDC1 and pDC were treated with ECP in vitro (Figure 5B, Supplementary Figure 4A). In contrast, we did not observe enhanced cell death in cDC2 and CD14- DC3 after in vitro ECP after stimulation with R848 (Figure 5B). As R848 can activate the NLRP3 inflammasome in human CD14- DC3 (31), we used the TLR4 ligand CRX-527 to avoid the induction of cell death by the TLR ligand alone. Notably, in vitro ECP strongly induced cell death in CRX-527-activated CD14- DC3 and to a minor extend in cDC2 (Supplementary Figure 4B). Thus, in vitro ECP seems to reduce the viability of cDC1 and pDC in general in response to TLR ligands, whereas it depends on the stimulated pattern recognition receptor for human cDC2 and CD14- DC3. We also measured co-stimulatory and -inhibitory molecule expression by flow cytometry but did not observe strong changes on ECP-treated DCs compared to the control treatment (Figure 6). cDC1 showed enhanced expression of immunoregulatory PD-L1 in steady state conditions, whereas PD-L1 was enhanced on pDC after in vitro ECP upon stimulation irrespective of the TLR ligand (Figure 6, Supplementary Figure 5B). CD14- DC3 showed slightly increased expression of the co-stimulatory molecule CD86 after R848 stimulation, when they were treated prior with ECP (Figure 6). The analysis of cytokine secretion showed that anti-inflammatory IL-1RA released by cDC2 and CD14- DC3 and IL-10 released by cDC2 were increased by ECP upon TLR stimulation (Figure 4B). Overall, changes on phenotype and cytokine secretion by DCs due to ECP were low. Thus, in vitro ECP of human DC subpopulations showed minor effects on the phenotype of the DCs but strongly induced apoptosis in cDC1 and pDCs after activation by TLR ligands as well as in CD14- DC3 dependent on the used TLR ligand.
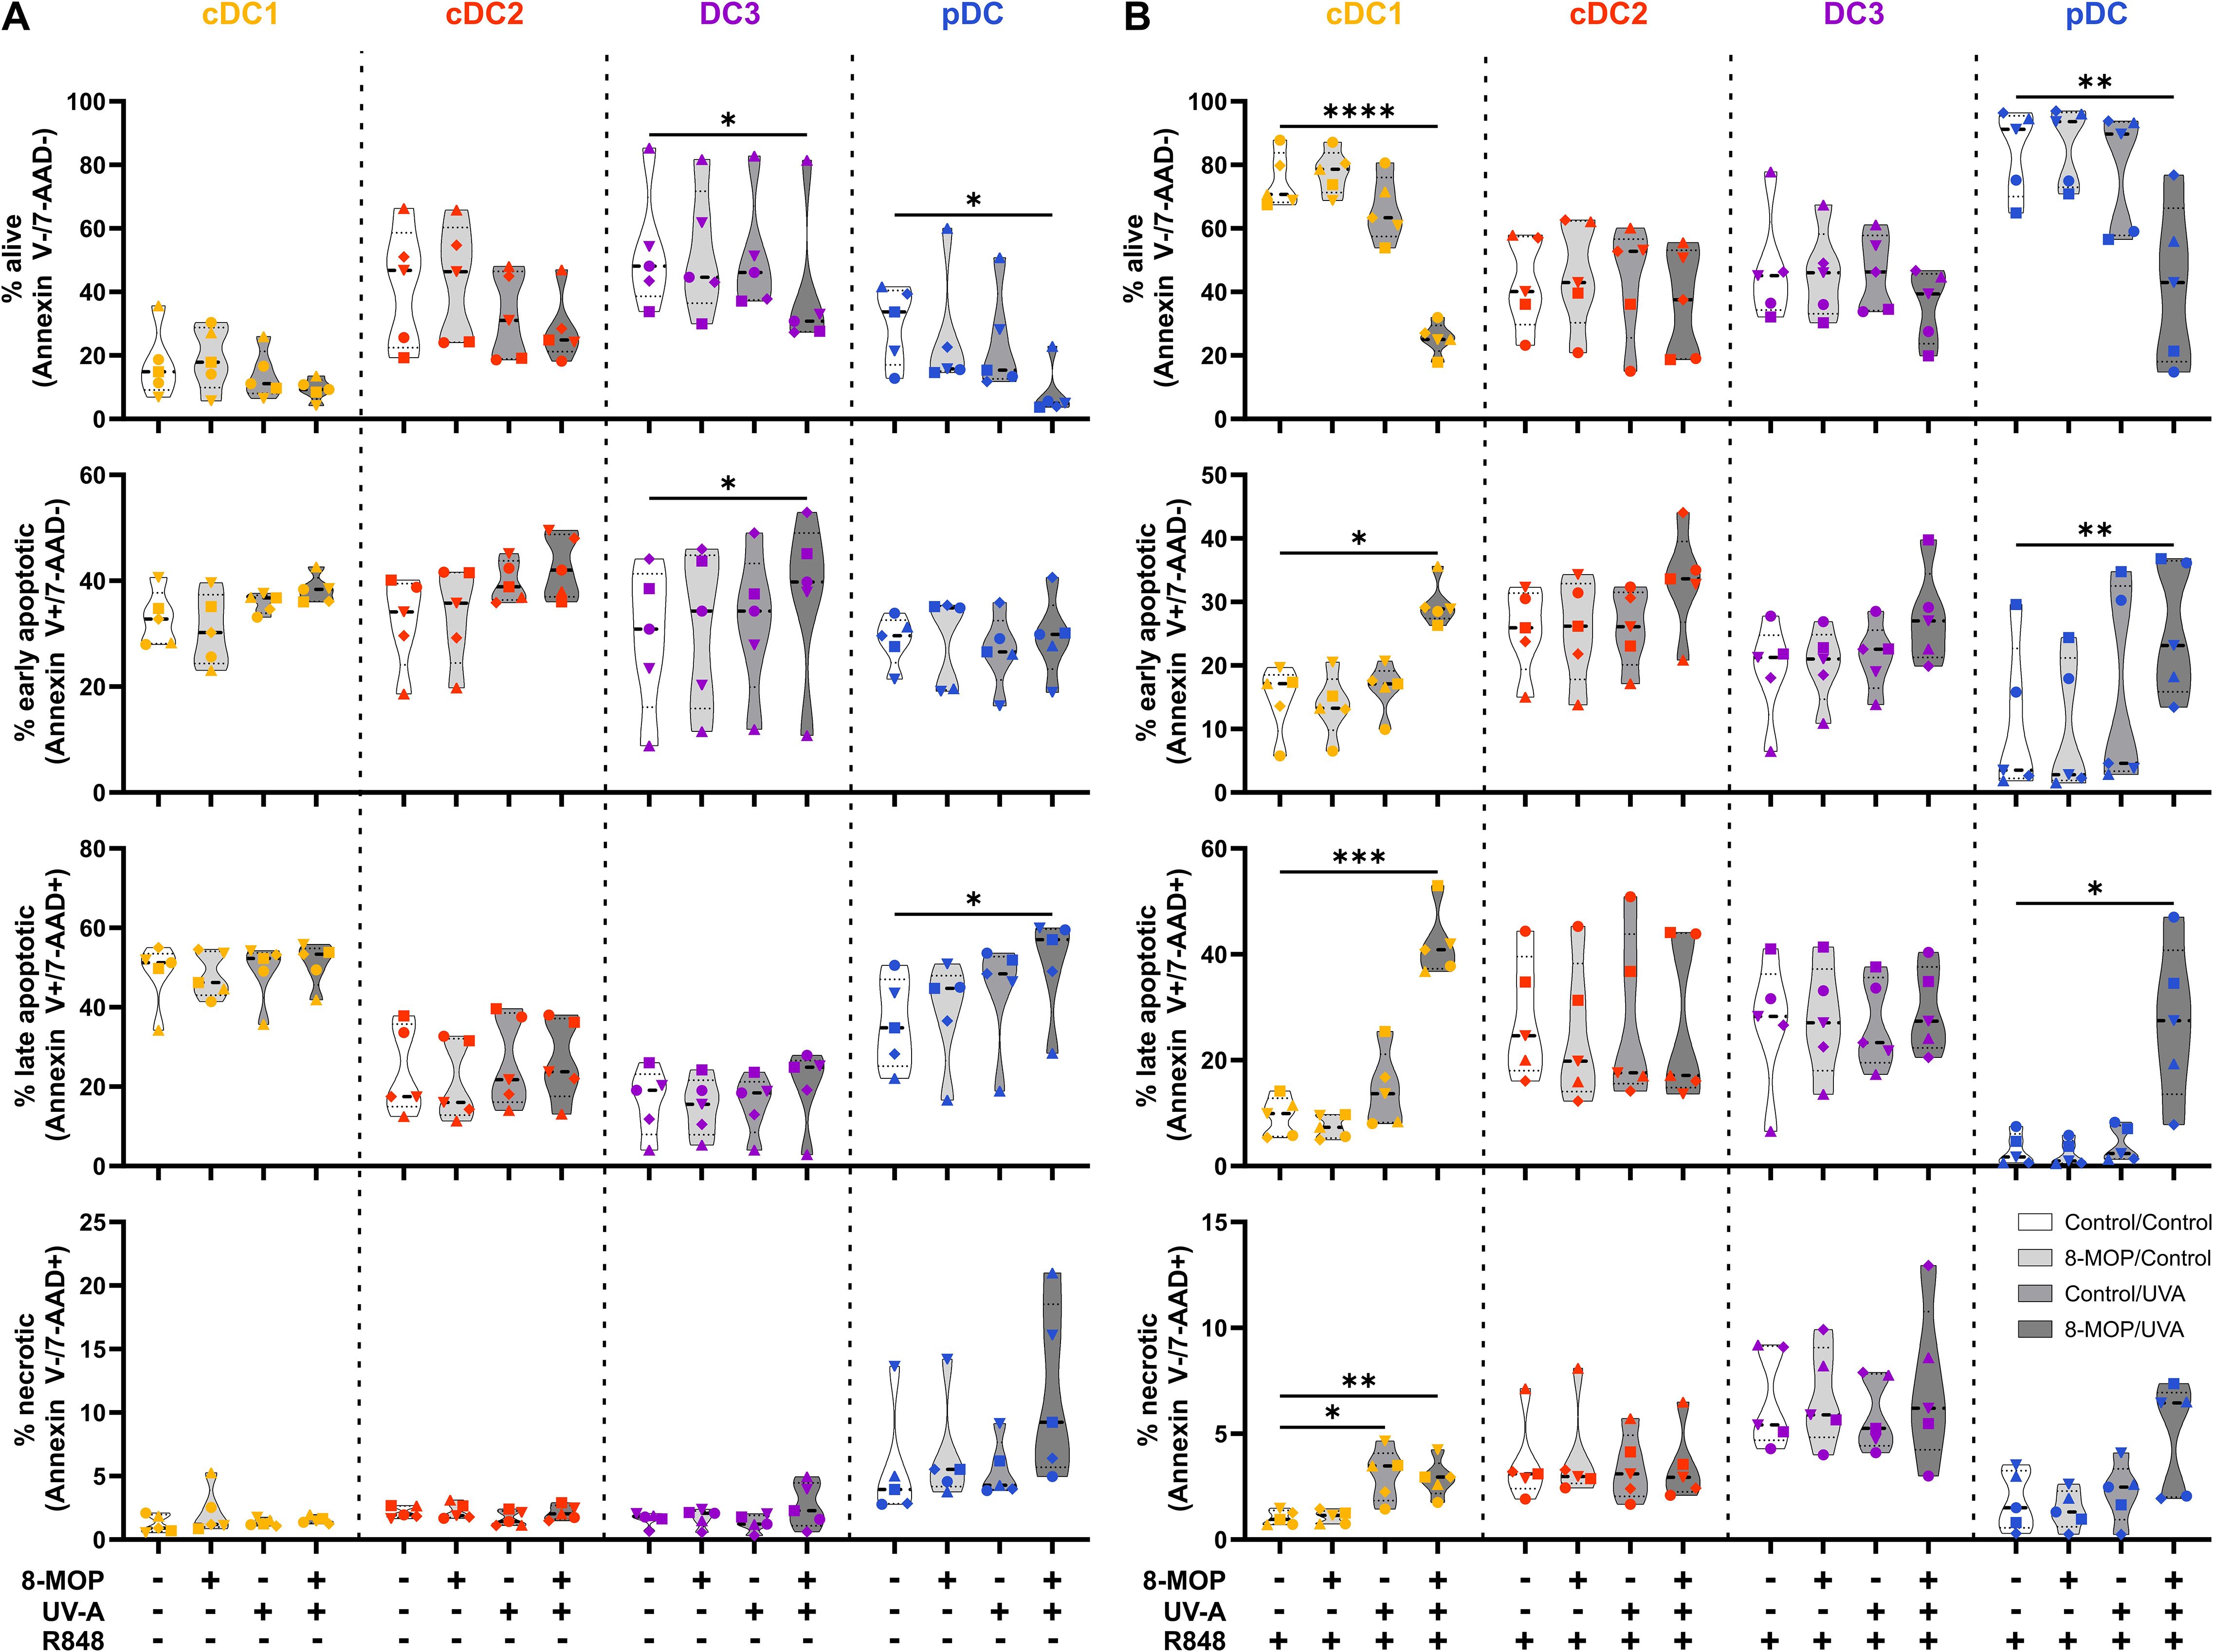
Figure 5. Experimental ECP induces apoptosis primarily in human blood cDC1 and pDC after 42 h of culture. Cell sorter-purified cDC1, cDC2, CD14- DC3, and pDC were incubated either with 400 ng/ml 8-MOP or equal amount of solvent control (ethanol) for 30 min at 37°C as indicated below the figure. Then, cells were either irradiated with 2 J/cm2 UV-A light or mock-treated. After centrifugation to remove the solvent, cells were resuspended in (A) medium or (B) medium containing 5 µg/ml R848. After 42 h of culture, DCs were stained with the antibodies used for cell sorting and 7-AAD and Annexin V-PE to determine viability. Truncated violin plots depict percentages of alive (Annexin V-/7-AAD-), early apoptotic (Annexin V+/7-AAD-), late apoptotic (Annexin V+/7-AAD+), and necrotic (Annexin V-/7-AAD+) cDC1 (yellow-orange symbols), cDC2 (red symbols), DC3 (purple symbols) and pDC (blue symbols) of five donors (each donor with an individual symbol). Statistical analysis was performed in GraphPad Prism (V10) using 2way ANOVA for grouped data with Dunnett’s multiple comparisons tests as posthoc test (*p < 0.05, **p < 0.01, ***p < 0.001, ****p < 0.0001).
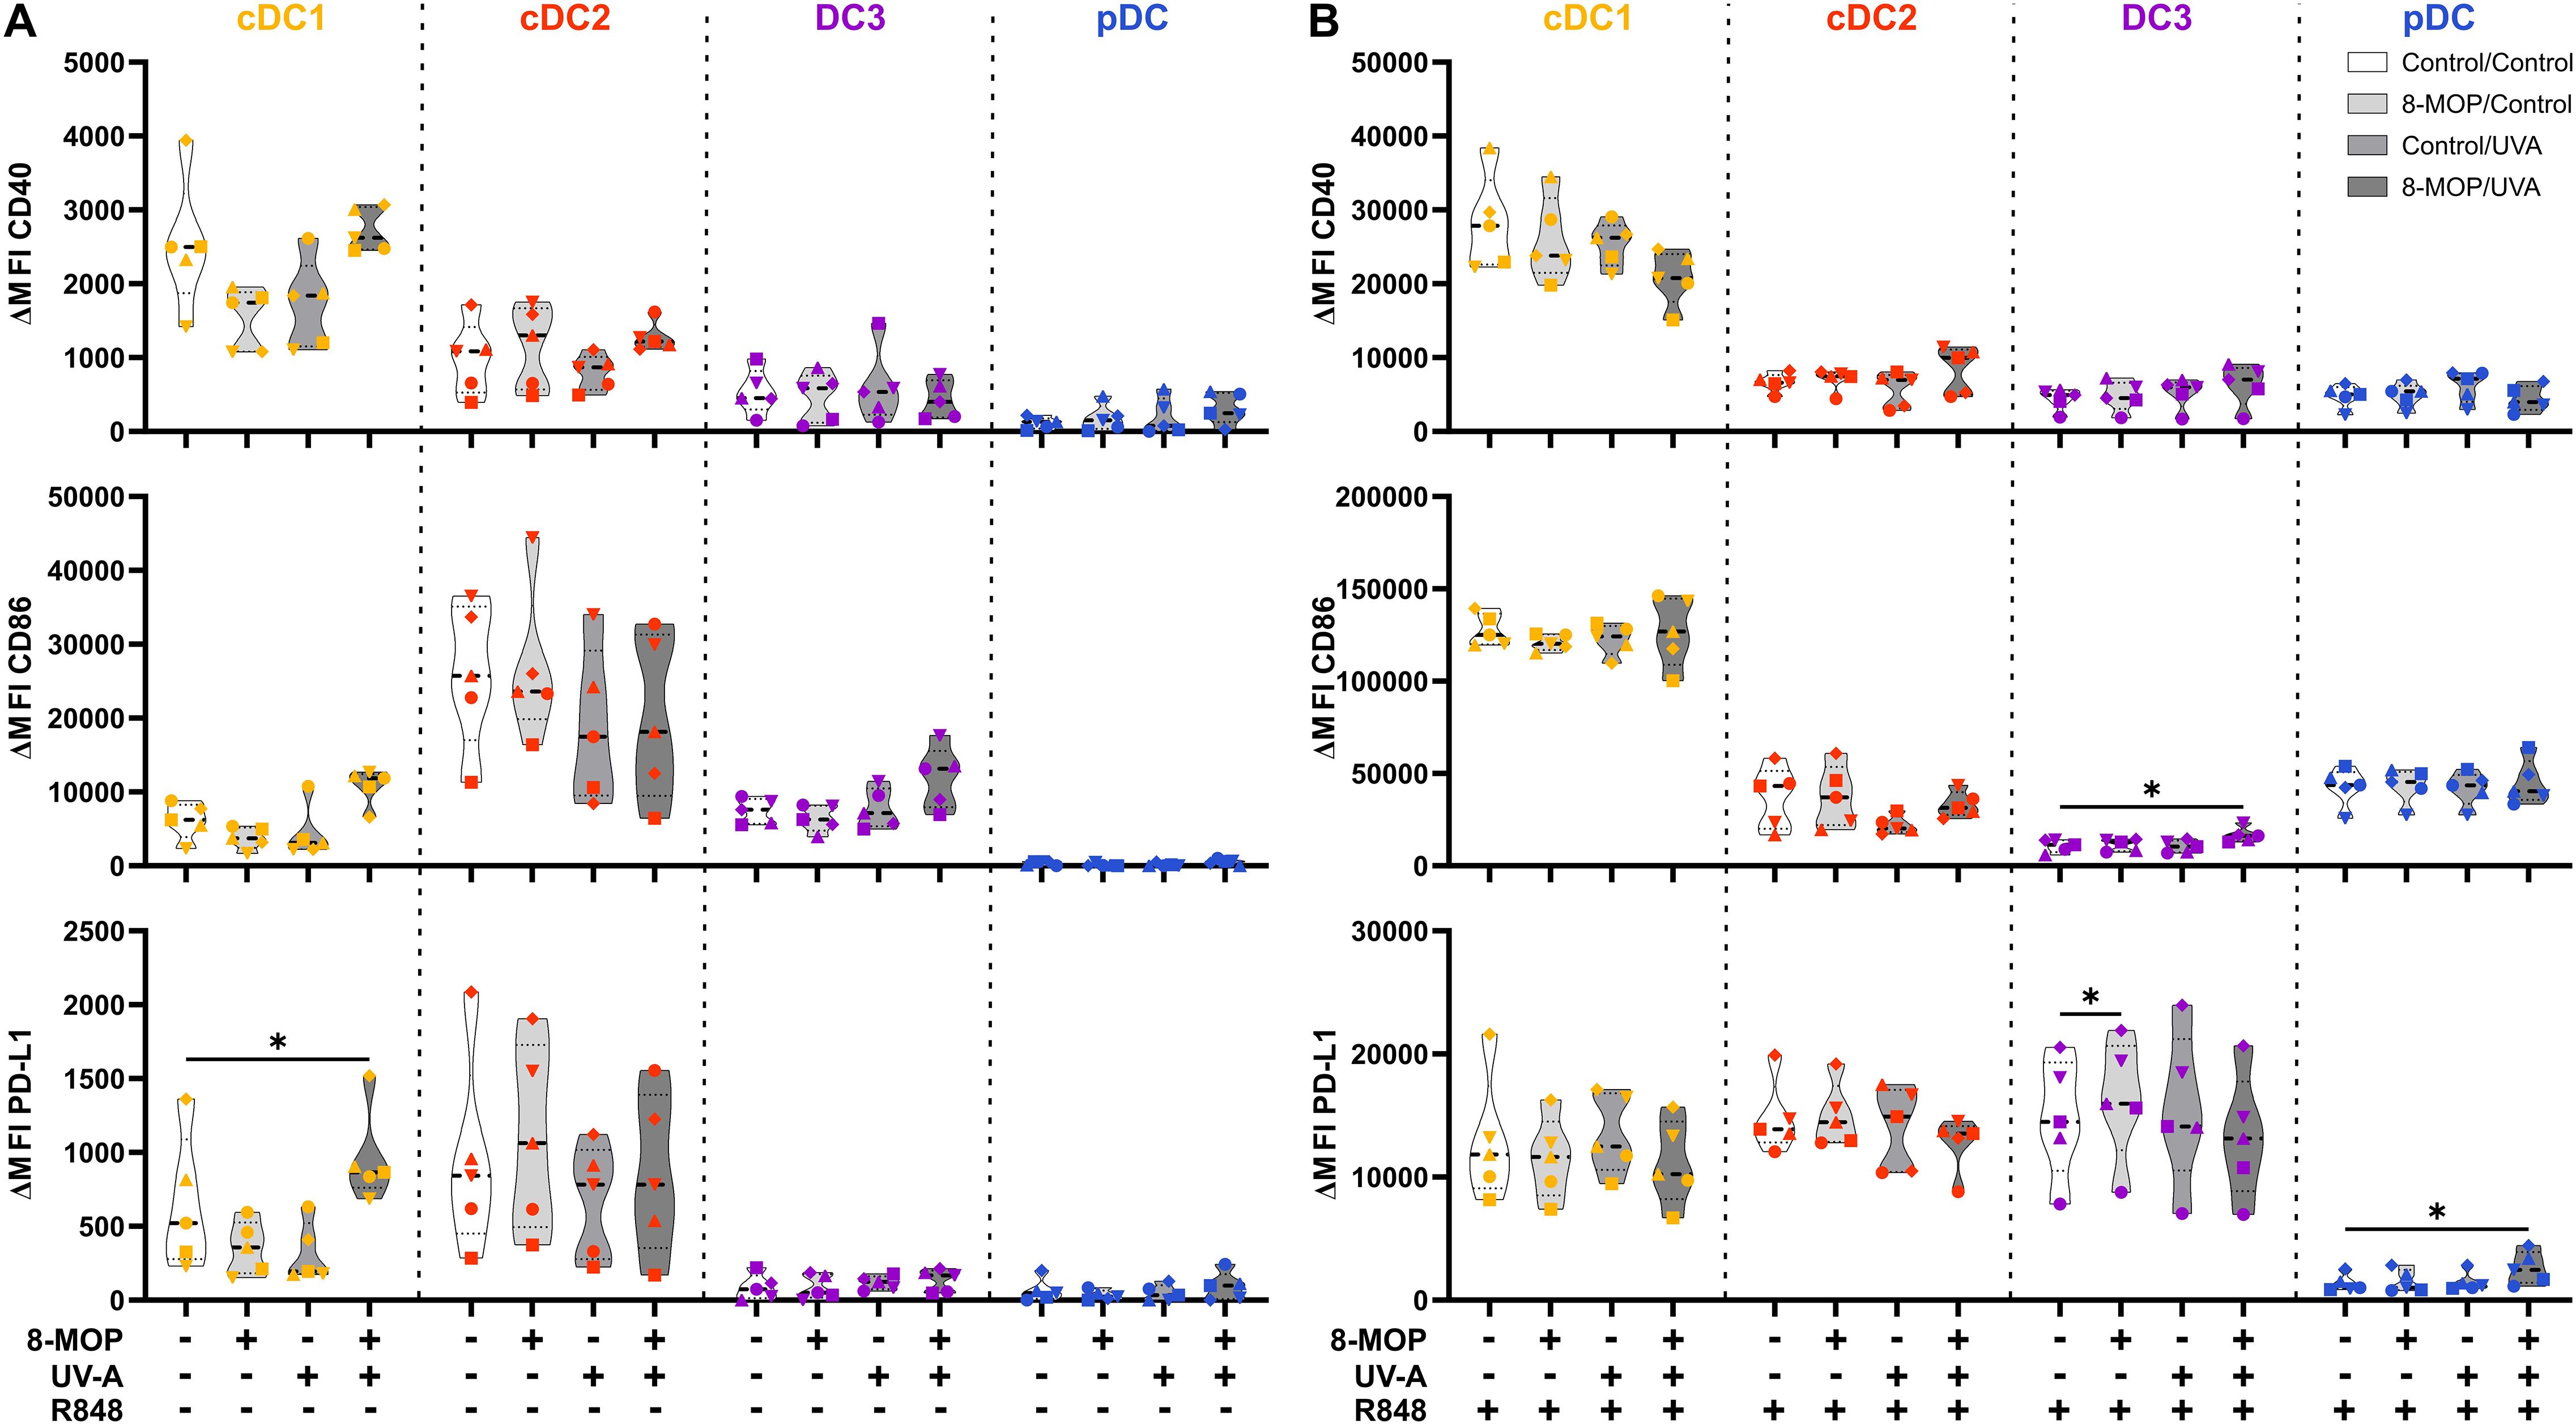
Figure 6. Experimental ECP induces minor changes in the expression of co-stimulatory and -regulatory molecules on human primary DCs after 42 h of culture. Cell sorter-purified cDC1, cDC2, CD14- DC3, and pDC were incubated either with 400 ng/ml 8-MOP or equal amount of solvent control (ethanol) for 30 min at 37°C as indicated below the figure. Then, cells were either irradiated with 2 J/cm2 UV-A light or mock-treated. After centrifugation to remove the solvent, cells were resuspended in (A) medium or (B) medium containing 5 µg/ml R848. After 42 h of culture, DCs were stained with the antibodies used for cell sorting and A700-coupled anti-CD40, FITC-coupled anti-CD86, and BV650-coupled anti-PD-L1 or respective isotype controls. Truncated violin plots show ΔMFI on alive (Annexin V-/7-AAD-) cDC1 (yellow-orange symbols), cDC2 (red symbols), DC3 (purple symbols) and pDC (blue symbols) of five donors (each donor with an individual symbol). Statistical analysis was performed in GraphPad Prism (V10) using 2way ANOVA for grouped data with Dunnett’s multiple comparisons tests as posthoc test (*p < 0.05, **p < 0.01, ***p < 0.001, ****p < 0.0001).
3.2 ECP reduces the capacity of human blood cDC1 to activate memory T cell responses
Since it has been reported that ECP induces amelioration of different T cell-mediated diseases, such as GvHD, we were interested in whether in vitro ECP would influence the T cell stimulatory capacity of human DCs. As ECP affects preexisting immune responses in patients, we analyzed the T cell stimulatory capacity of DCs by co-culturing them with autologous CD4+ and CD8+ memory T cells in the presence of common viral and bacterial antigens. DCs were sorted after negative enrichment and memory T cells were purified from PBMCs of the same donor by magnetic bead-based enrichment kits. Then, sorted DCs were treated with in vitro ECP as described above. They were either loaded with a pool of pre-processed MHCI- and MHCII-specific peptides derived from common antigens (CEFT: CMV, EBV, Influenza, and Tetanus Toxoid) which can be loaded on a broad array of HLA molecules with or without additional stimulation with the TLR ligand R848 as it strongly activates all human DC subpopulations. As loading with peptides is a passive process that does not require processing of antigens, we were interested in how in vitro ECP would influence the capacity to process antigens. Here, the sorted DCs were incubated with heat-killed E. coli that have to be phagocytosed and processed in order to present peptides on HLA molecules to T cells. Further, as E. coli is a complex pathogen, it is able to activate diverse pattern recognition receptors, such as TLR2, TLR4, and TLR8 (53–57). Thereby, influence of the activated TLR on cell death induction might be minimized. After 18 h of culture with the peptides or E. coli, CFSE-labelled memory T cells were added and co-cultured with the sorted DCs for five days. Then, T cells were analyzed by flow cytometry for proliferation (dilution of CFSE signal), activation (expression of CD25 and CD71), and phenotype (expression of CD178, CD223, and CCR7) (Supplementary Figure 6). When DCs were loaded with CEFT peptides in steady state conditions, the DCs could hardly activate memory CD4+ and CD8+ T cells and we did not observe any influence of in vitro ECP on the induction of memory T cell proliferation (Figure 7A). Simultaneous stimulation and peptide loading (CEFT + R848) boosted the capacity of cDC1 and pDC to induce memory T cell proliferation but in vitro ECP showed only a minor reduction by cDC1 and pDC to activate memory T cells (Figure 7B). However, when DCs were cultured with heat-killed E. coli, which have to be phagocytosed and processed in order to restimulate E. coli-reactive memory T cells, we observed a strong decline in proliferated memory CD4+ and CD8+ T cells when cDC1 were exposed to in vitro ECP (Figure 7C). ECP also reduced the capacity of pDC to activate memory CD4+ T cells (Figure 7C). While in vitro ECP did not influence the capacity of cDC2 and CD14- DC3 to induce T cell proliferation (Figure 7C), we observed changes of the phenotype of the proliferated CD4+ T cells (Figure 8). T cells stimulated by steady state cDC2 and CD14- DC3 showed lower expression of the activation markers CD25 and CD71 as well as of the exhaustion marker CD223 (LAG-3), when DCs were treated with ECP prior to the co-culture (Figure 8A). This was also the case when CD14- DC3 were stimulated with heat-killed E. coli prior to the co-culture with memory T cells (Figure 8C). As ECP modulates the polarization of T cells (8, 10), we were interested whether ECP-treated DCs influence the secretion of cytokines by activated T cells. Therefore, we analyzed the supernatants of DC:T cell co-culture for cytokines associated with different subsets of T helper cells by CBA assay. When DCs were only loaded with CEFT peptide without TLR stimulation, levels of secreted cytokines were low and not influenced by ECP-treatment (Supplementary Figure 7). When DCs were simultaneously activated during peptide loading, we observed higher level of TH1-associated cytokines such as IFNγ but they were not influenced by the treatment with ECP (Supplementary Figure 8). However, in accordance with the T cell proliferation data (Figure 7C), we observed a strong reduction in TH1- and TH17-associated cytokines (IFNγ, IL-22, IL-17A, and IL-17F) as well as IL-2, when cDC1 were stimulated with E. coli after pretreatment with in vitro ECP (Figure 9). In contrast, in vitro ECP did not influence the secretion of cytokines when T cells were co-cultured with cDC2, CD14- DC3 and only slightly with pDC (Figure 9). Further, in vitro ECP did not influence the secretion of TH2- (IL-4, IL-5, IL-13) or Treg-associated cytokines (IL-10) irrespective of the DC subset and the antigen (Figure 9, Supplementary Figures 7, 8). Thus, in vitro ECP of human primary blood DCs directly influences the capacity of cDC1 and pDC to induce memory T cell activation as well as changes the phenotype of memory T cells activated by cDC2 and CD14- DC3. Further, it reduces the secretion of TH1- and TH17-associated cytokines by T cells, when restimulated with ECP-treated cDC1.
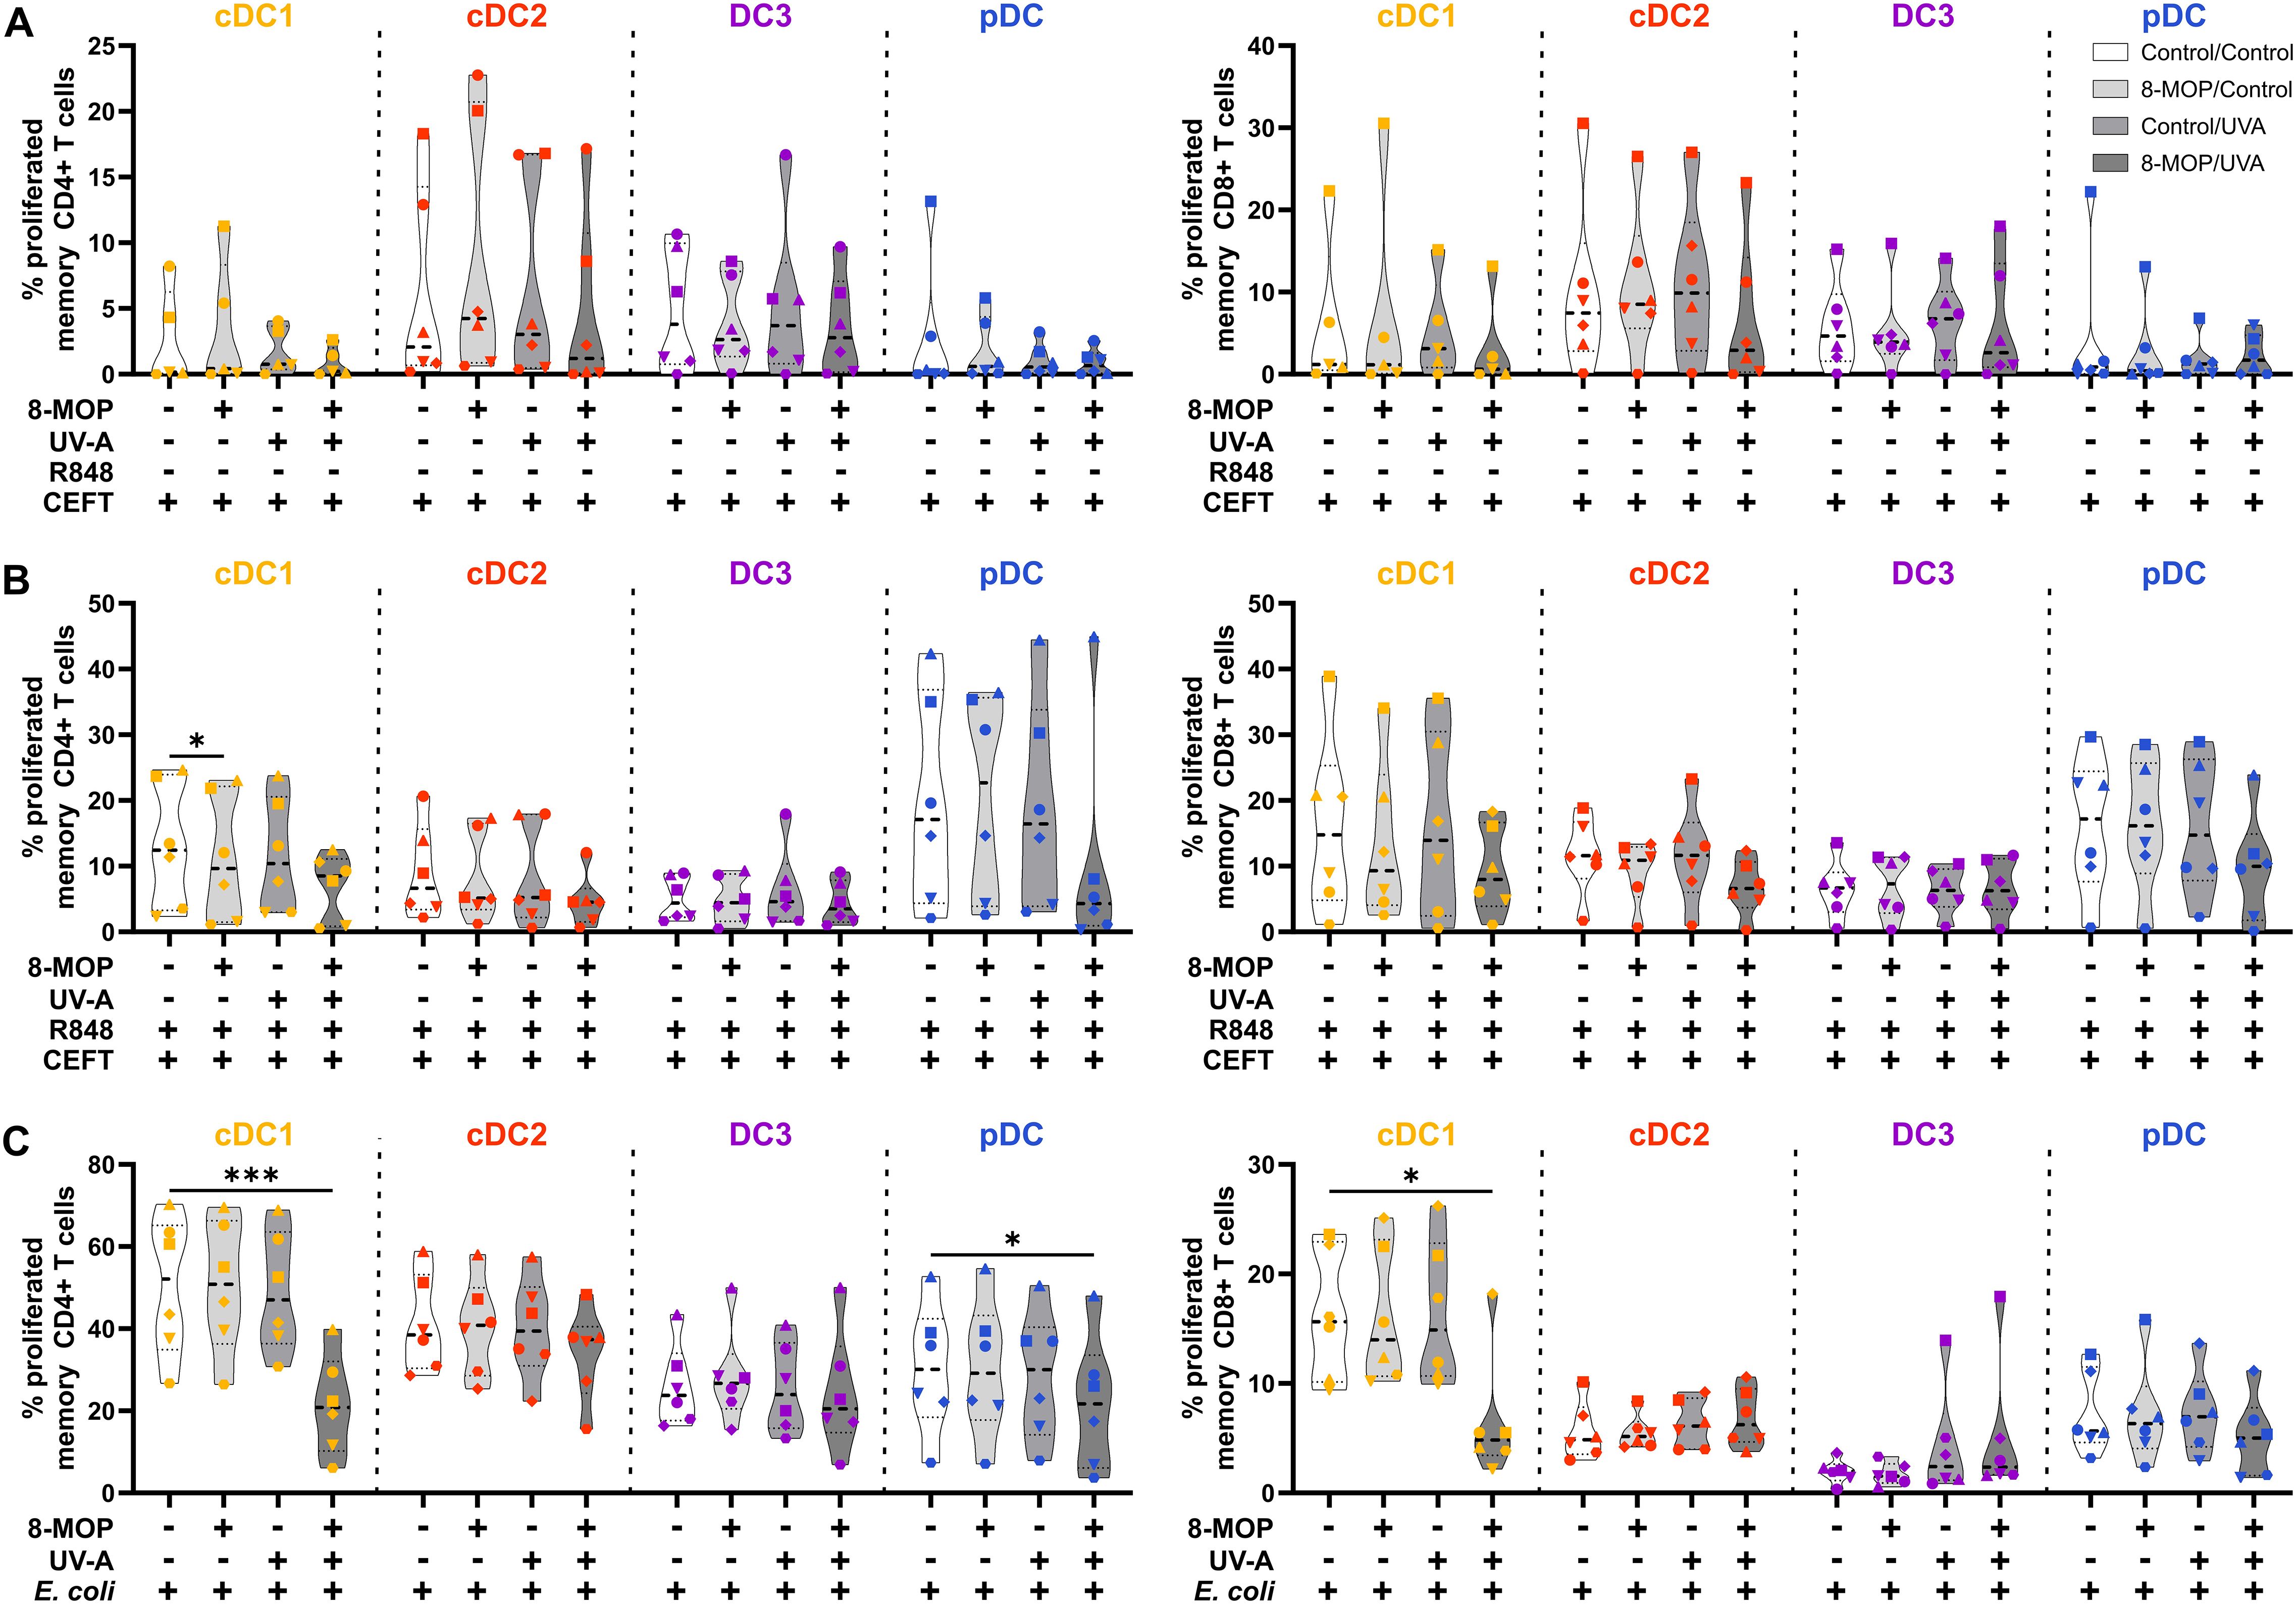
Figure 7. In vitro ECP of human primary blood cDC1 strongly reduces their capacity to activate memory T cells. Cell-sorted cDC1 (yellow-orange), cDC2 (red), CD14- DC3 (purple), and pDC (blue) were treated with 8-MOP and UV-A light. After washing, DCs were (A) pulsed with CEFT peptides, (B) pulsed with CEFT peptides in presence of 1 µg/ml R848, or (C) incubated with 10 CFU/DC heat-killed E. coli. After 18 h of culture, autologous CFSE-labelled memory T cells were added (1:10 DC:T cell ratio) and co-cultured for five days. T cells were stained with a panel of fluorochrome-coupled antibodies and acquired using a Cyoflex S (Beckman Coulter). T cells were gated as shown in Supplementary Figure 6. Truncated violin plots depict percentages of proliferated and activated (CFSE-CD25+) CD4+ (left panel) and CD8+ (right panel) memory T cells of six donors (cDC1 in (A) five donors; each donor with an individual symbol). Statistical analysis was performed in GraphPad Prism (V10) using 2way ANOVA for grouped data with Dunnett’s multiple comparisons tests as posthoc test (*p < 0.05, **p < 0.01, ***p < 0.001, ****p < 0.0001).
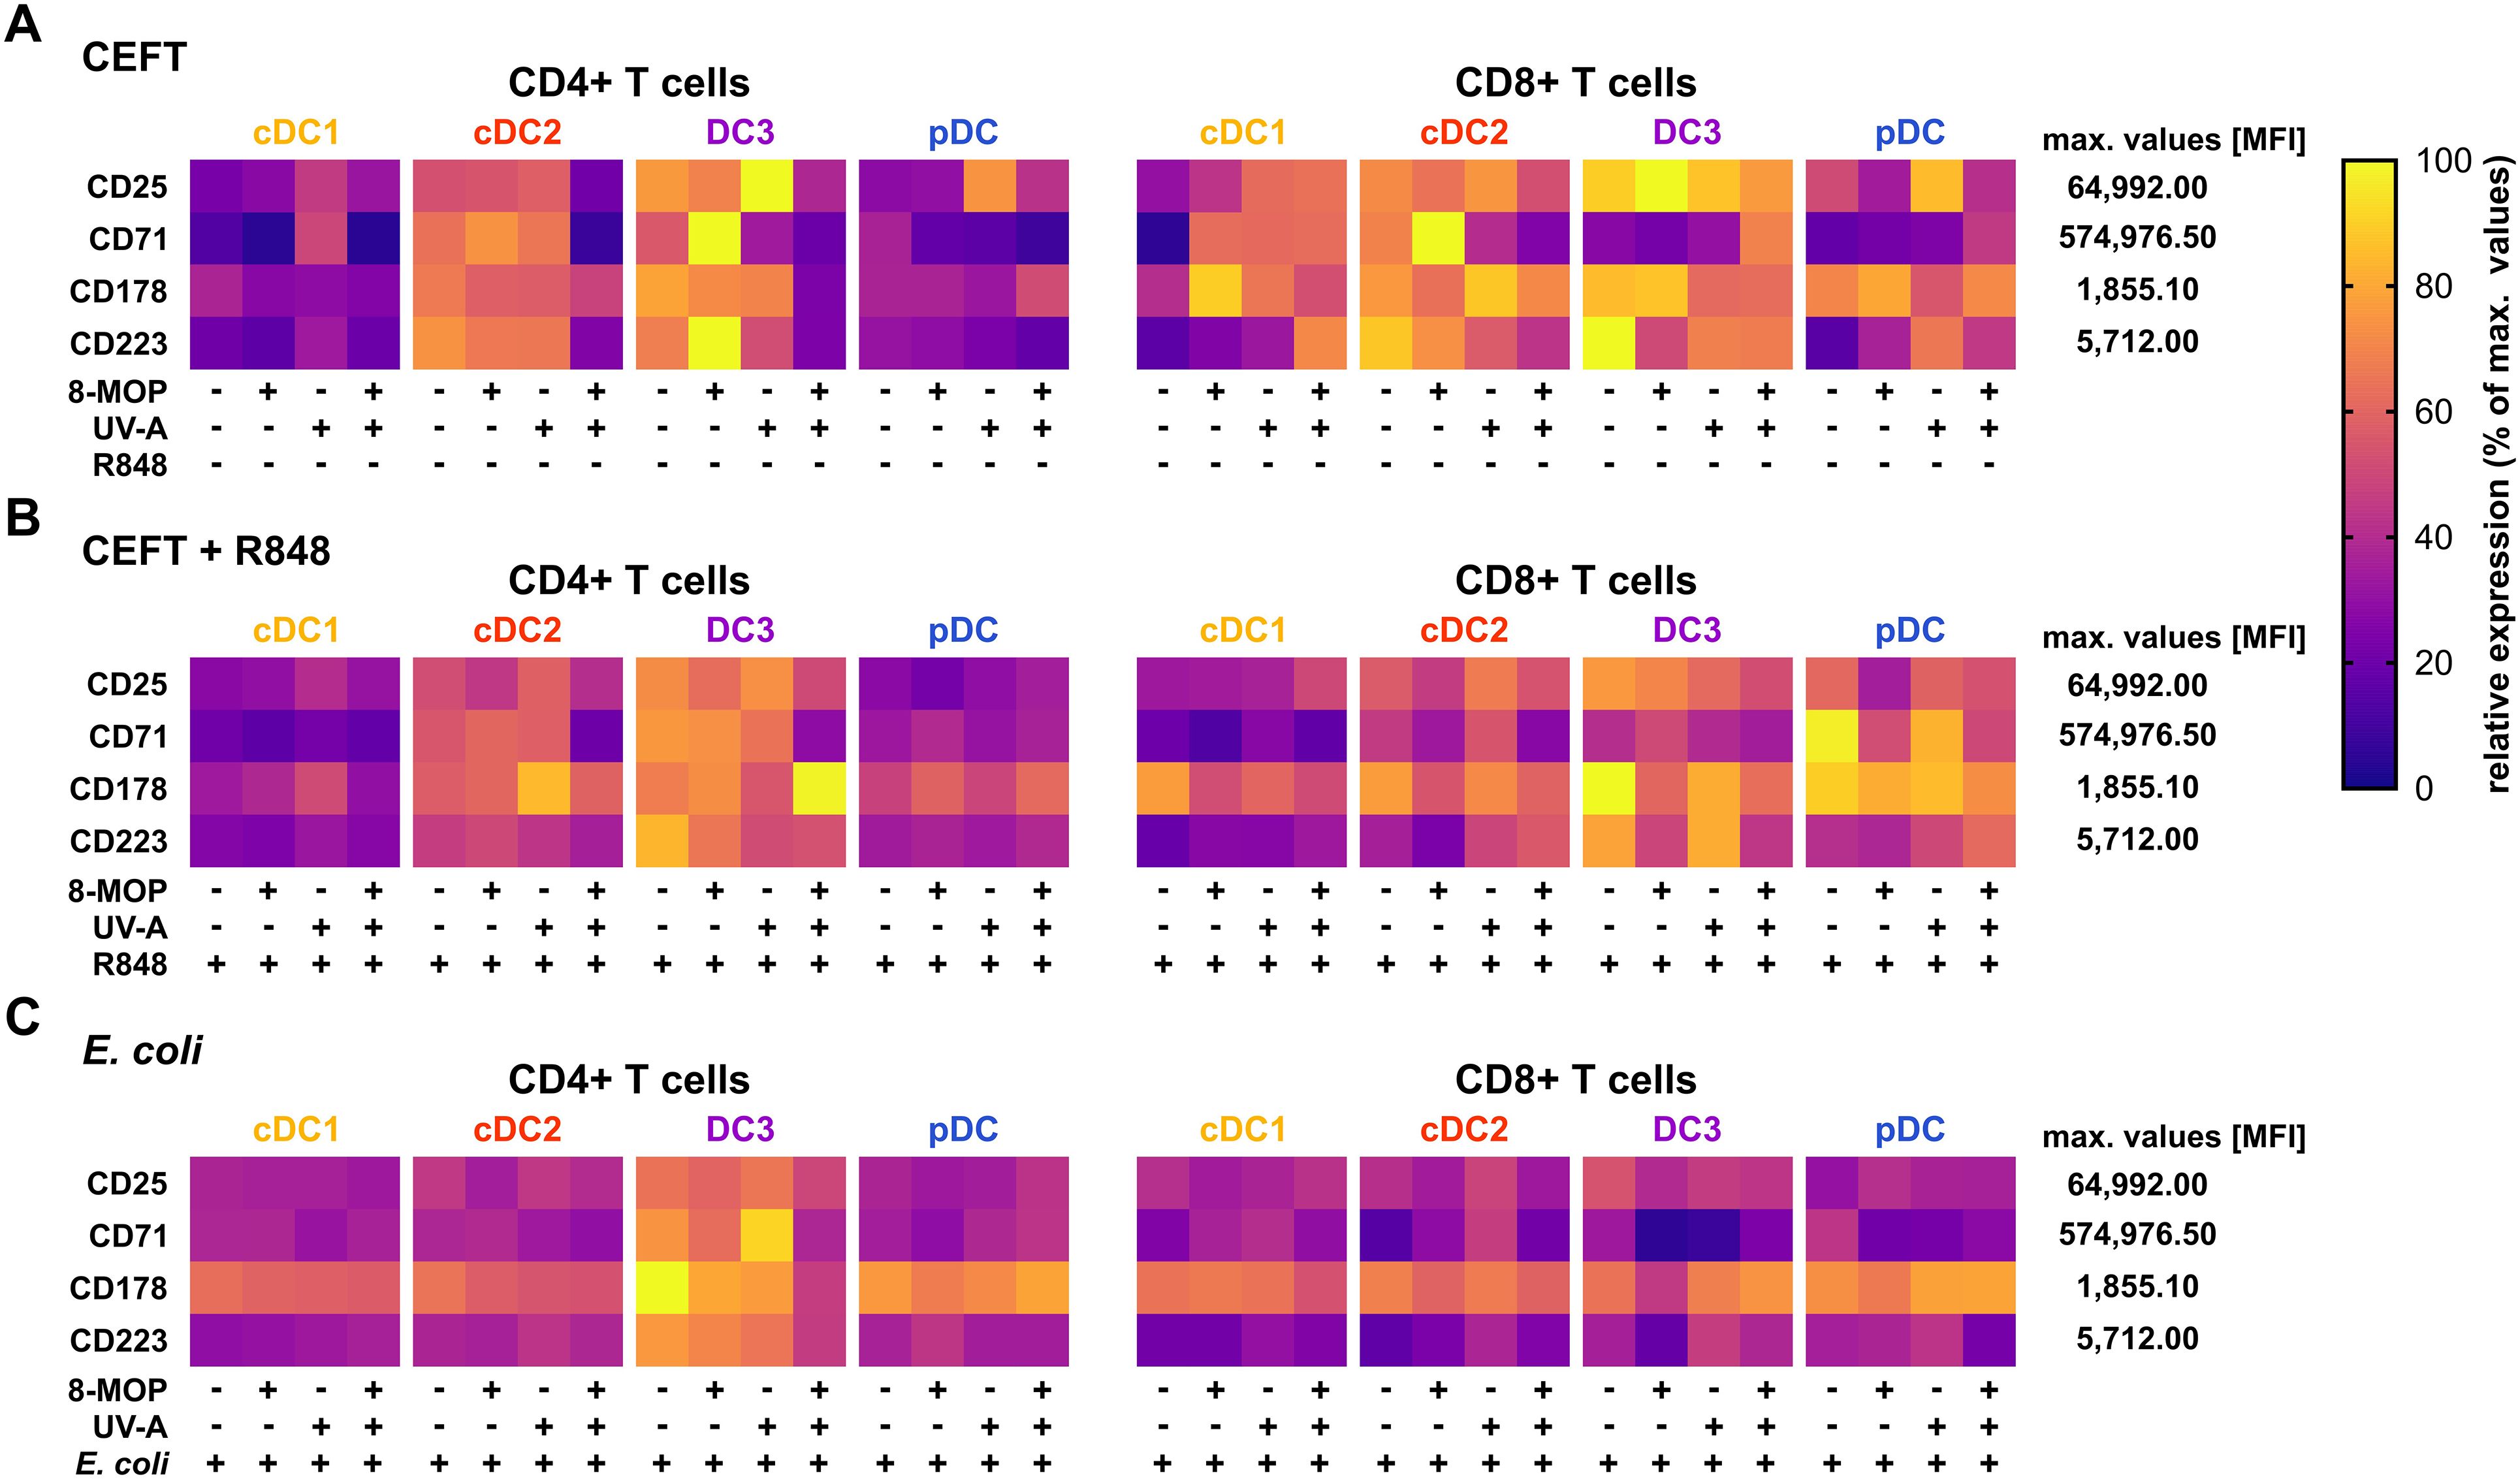
Figure 8. Experimental ECP of primary blood DCs does not enhance the expression of exhaustion markers or death receptors on activated memory T cells. Proliferated and activated memory T cells from Figure 7 were analyzed for the expression of CD25, CD71, CD178, and CD223 by flow cytometry. Data were normalized to the highest measured value in the data set and the relative values (percentage of maximum) plotted as heatmap. Each square shows the mean of six donors (cDC1 in (A) five donors).
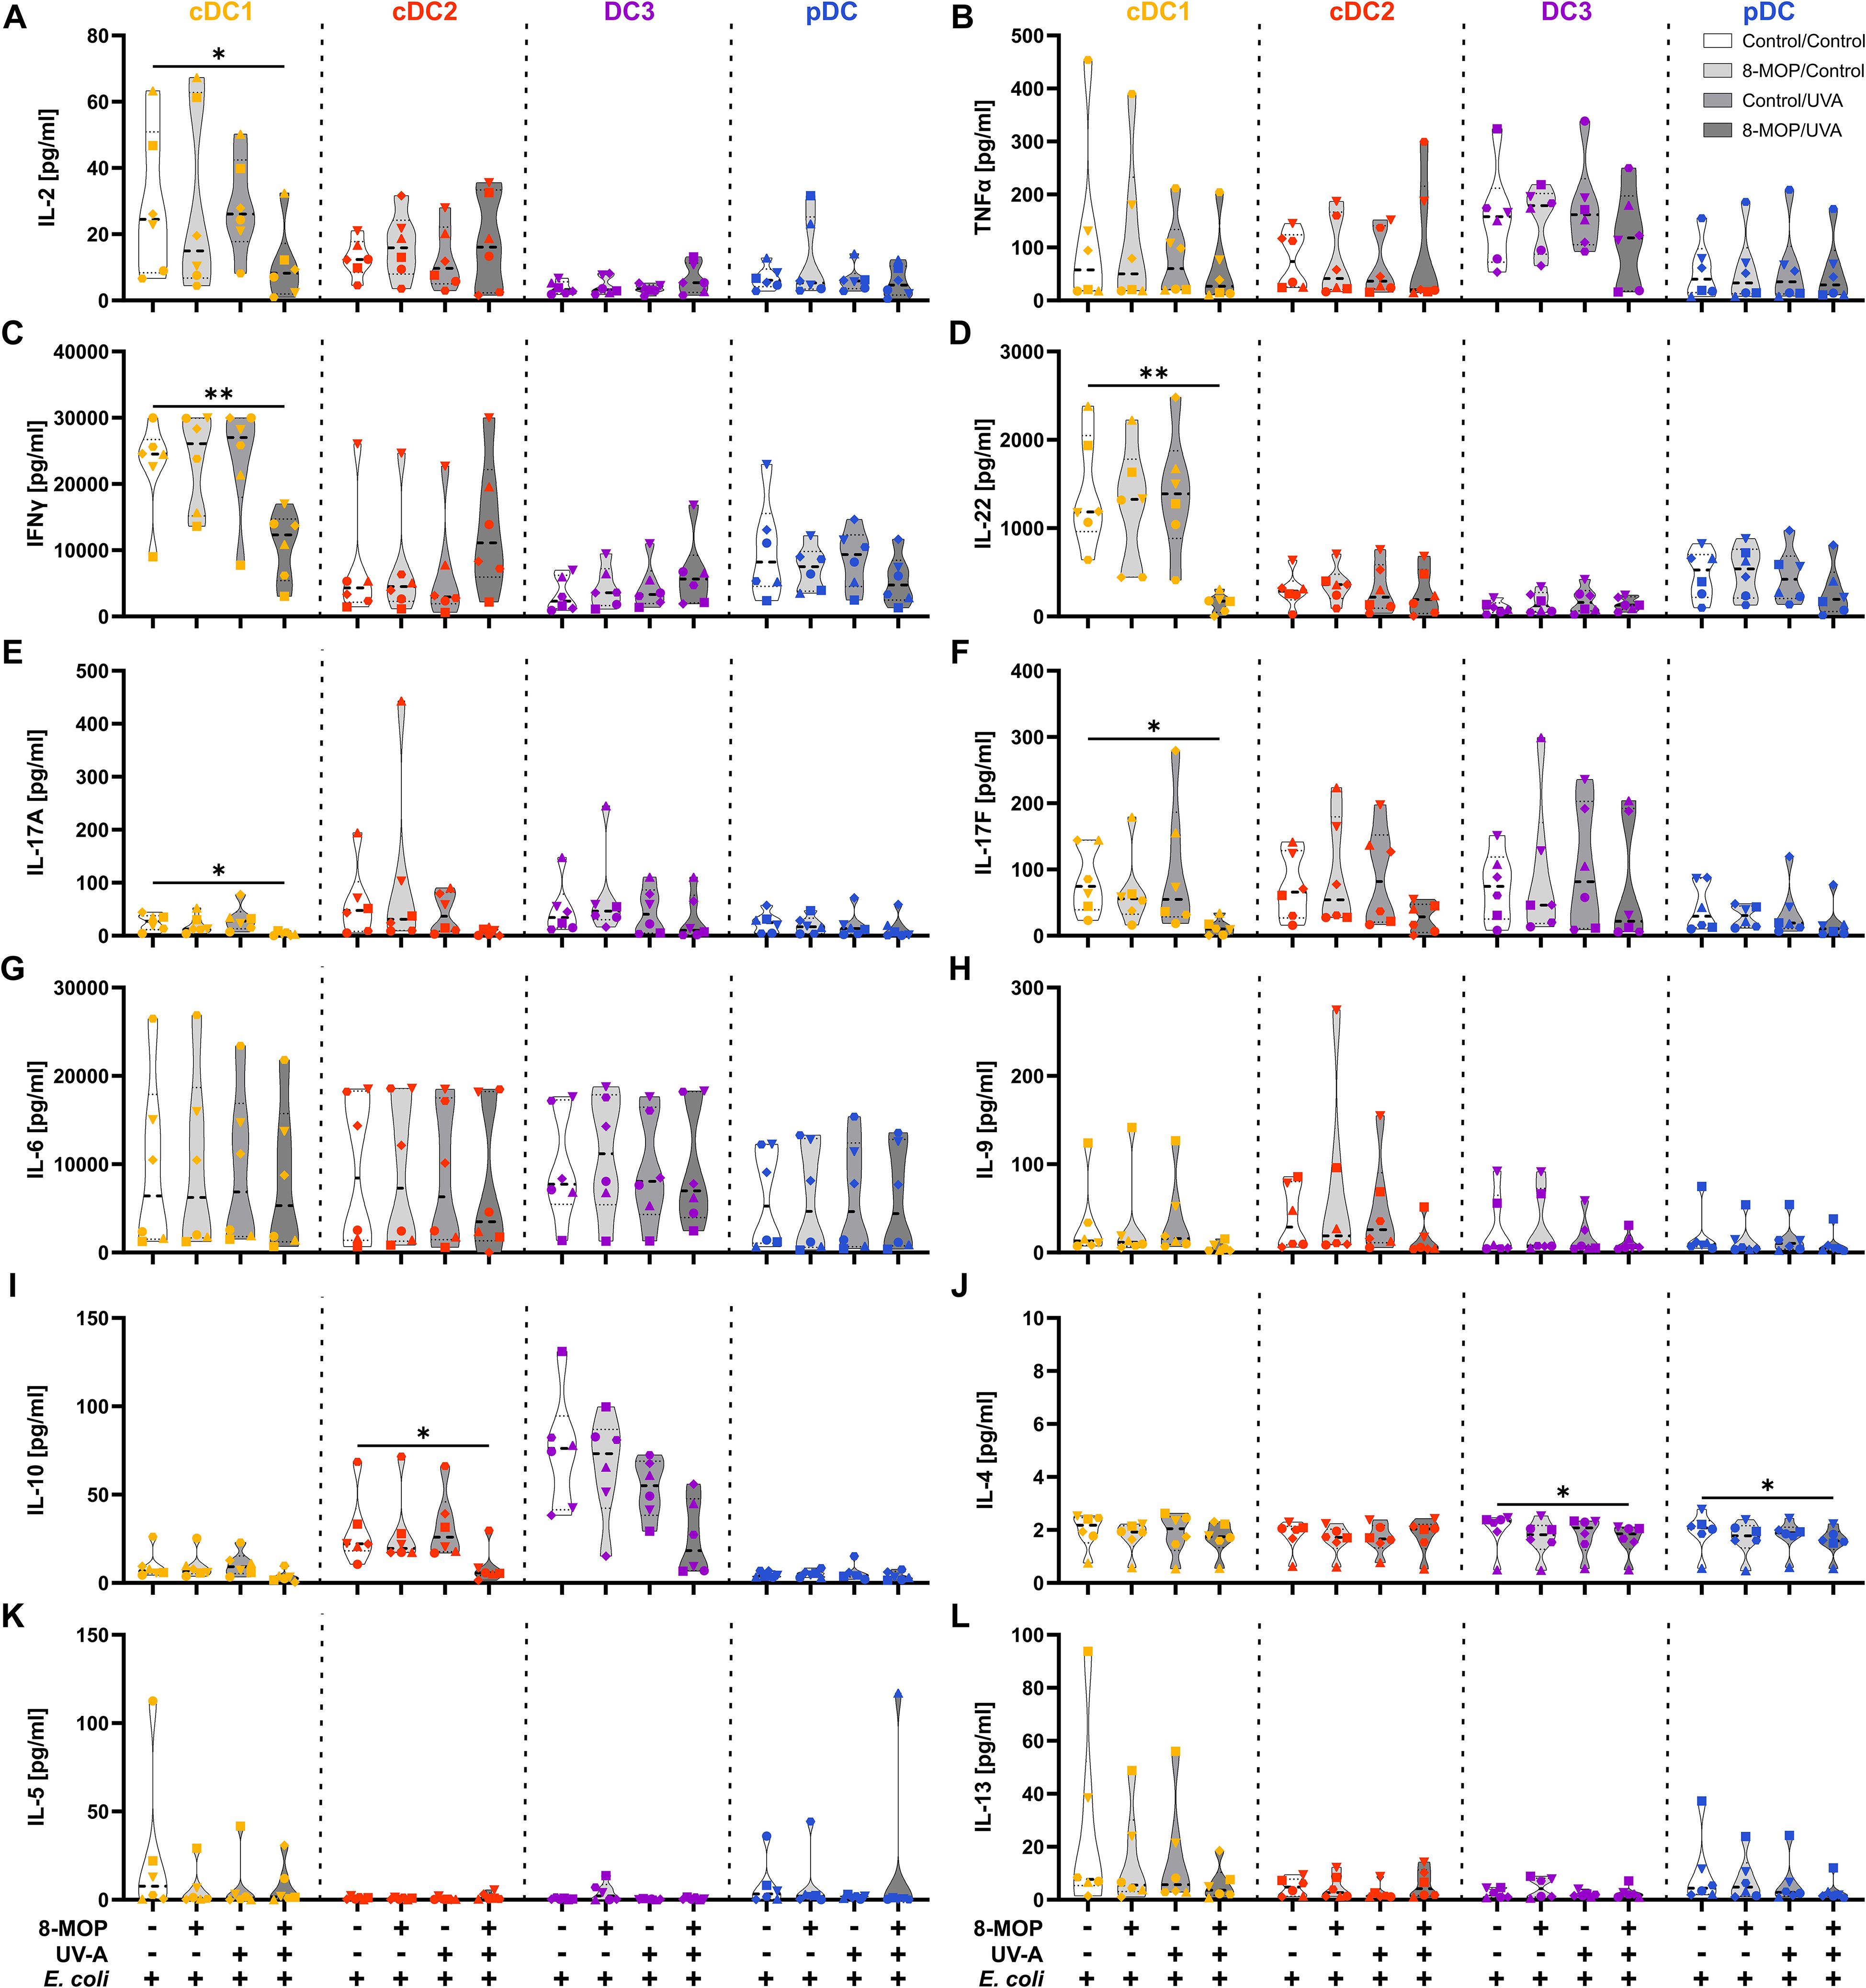
Figure 9. In vitro ECP-treatment of human cDC1 reduces the secretion of TH1- and TH17-associated cytokines by memory T cells. Supernatants from DC:T cell co-cultures shown in Figure 9C were analyzed for the concentration of T cell-associated cytokines using the LEGENDplex Hu Th Cytokine Panel (BioLegend). Truncated violin plots show the concentrations of (A) IL-2, (B) TNFα, (C) IFNγ, (D) IL-22, (E) IL-17A, (F) IL-17F, (G) IL-6, (H) IL-9, (I) IL-10, (J) IL-4, (K) IL-5, and (L) IL-13 for T cells co-cultured with cDC1 (yellow-orange symbols), cDC2 (red symbols), DC3 (purple symbols) and pDC (blue symbols) of six donors (each donor with an individual symbol). Statistical analysis was performed in GraphPad Prism (V10) using 2way ANOVA for grouped data with Dunnett’s multiple comparisons tests as posthoc test (*p < 0.05, **p < 0.01, ***p < 0.001, ****p < 0.0001).
4 Discussion
ECP is a widely used immunomodulating therapy for various T cell-mediated diseases, such as CTCL, GvHD, and allograft rejection. Although ECP has been used for more than 30 years, the exact mechanism of action remains enigmatic. While it has been known that ECP induces apoptosis in treated leukocytes, analysis of the response of human primary DCs to ECP was hampered by the scarcity of the cells in human blood. In this study, we show that ECP induces apoptosis in the DC subpopulations cDC1 and pDC upon TLR stimulation, whereas cDC2 and CD14- DC3 are less affected. While ECP has only a minor influence on the expression of co-stimulatory and -regulatory molecules as well as on the secretion of cytokines by DCs, it strongly reduces the capacity of cDC1 and - to a minor extent - of pDC to activate memory T cell responses. Further, secretion of TH1- and TH17-associated cytokines after co-culture with ECP-treated cDC1 were strongly diminished. Since especially cDC1 have a pivotal role in the T cell-mediated immune response, our data suggest that reducing the function of cDC1 might contribute to the immunomodulating effect of ECP.
Currently, DCs in mice and men are classified in four main DC subpopulations, namely cDC1, cDC2, DC3, and pDC, with functional specialization. In our experimental ECP model, we observed the strongest effect on human cDC1 with apoptosis induction as well as reduced activation of CD4+ and CD8+ memory T cell responses. cDC1 are known for their high capacity to cross-present antigens to CD8+ T cells as well as the ability to prime TH1 cells (17, 18, 58–61). Therefore, they are crucial for the induction of anti-tumor T cell responses (14, 20, 21). However, the role of cDC1, and DCs in general, is controversial in GvHD (62–69). Host and donor DCs seem to be necessary for the induction of GvHD and additional transfusion of DCs deteriorates the symptoms of GvHD (62, 68, 69). Further, the depletion of DCs ameliorates the disease indicating a GvHD-promoting effect of DCs (63, 64). Based on these studies, induction of apoptosis and reducing the T cell-stimulatory capacity of DCs might contribute to the positive effects of ECP in the treatment of GvHD. However, other studies demonstrated rather protective effects of cDC1 and pDCs against GvHD (65–67, 70). In mice, expansion of cDC1 by FLT3L injection prior to bone marrow (BM) transfer reduced GvHD mortality by clonal deletion of alloreactive T cells (66, 67). Moreover, transfer of tolerogenic CCR9+ pDCs together with the BM reduced GvHD mortality by inducing Tregs (70). Batf3-/- mice lacking selectively the cDC1 population showed aggravated GvHD and faster mortality compared to wild type mice (65). Thus, the role of DCs in murine models of GvHD is still unclear. However, our results are in accordance with data from a murine model of contact hypersensitivity (45). Here, the transfer of ECP-treated enriched DCs was sufficient to suppress antigen-specific T cell responses (45). While several studies showed enhanced induction of Tregs after therapy with ECP (10, 43, 71–73), we observed mainly a decrease in TH1- and TH17-associated cytokines by in vitro ECP of human cDC1. As we restimulated the already polarized memory T cells only once with ECP-treated DCs, this might not be sufficient for a repolarization of TH1 or Th17 cells into Tregs as observed in patients treated with ECP over a longer period of time.
In contrast to T cell-mediated inflammatory diseases such as GvHD, treatment of CTCL patients with ECP rather induces T cell responses against the lymphoma cells by differentiation of monocytes into DC-like cells (50, 74, 75). However, the differentiation of monocytes to DC-like cells is not directly dependent on treatment with 8-MOP and UV-A light but rather on the interaction of monocytes with platelets in the device which are activated due to the plastic surface (49). While DCs in GvHD patients show rather tolerogenic responses to ECP (42, 43, 51), the monocyte-derived DC-like cells in CTCL patients are rather proinflammatory and thought to induce anti-lymphoma T cell responses (50, 74, 76). Whether these controversial reports are due to cell type-specific responses to ECP (monocytes vs. DCs) or because of different environments in patients (suppressive TH2 prone environment in CTCL vs. inflammatory TH1 prone environment in GvHD) is not clear yet. However, we also observed subtype-specific reaction to in vitro ECP, as monocyte-related DC3 showed a more proinflammatory phenotype, whereas bona fide cDC1 underwent apoptosis and lost their T cell stimulatory capacity (77). These differences might also explain why treatment of GvHD patients with ECP is not associated with an increased risk for infections and has less severe side effects than immunosuppressive regimens (78, 79). As cDC2 and CD14- DC3 still have the capacity to activate T cells, they might be responsible for the induction of immune responses against invading pathogens and compensate for the loss of cDC1.
In order to analysis the impact of the underlying disease on the response of the primary DCs to ECP, DCs have to be isolated from patients suffering from CTCL or GvHD. However, this is currently not possible due to the scarcity of DCs. We additionally observed an influence of ECP on pDCs. Due to our gating strategy (see Figure 1), we cannot exclude that the sorted pDC contain transitional DCs (tDC). tDC have a pDC-like phenotype based on marker expression such as CD123 and CD303 (BDCA-2) but have the potential to differentiate into DC2-like cells (80–84). However, we did not observe the emergence of CD1c+ cells during the culture of sorted pDC (Supplementary Figure 1) implying that either tDC were depleted during the enrichment process or the time frame of the experiments was too short for efficient differentiation of tDC into DC2-like cells. To exclude contamination with tDC in future studies, Axl might be added to the staining panel used for cell-sorting.
While we concentrated in our study on the direct influence of ECP on DC subpopulations, it is clear that ECP in certain conditions has an indirect effect on the immune system via the recognition of apoptotic lymphocytes by immune cells. When ECP is used to treat immune-related adverse events in cancer patients due to treatment with immune checkpoint inhibitors, the apoptotic leukocytes induced by ECP are ingested by intestinal macrophages leading to an anti-inflammatory M2-like polarization of macrophages by STAT6 signaling (7). This induces the secretion of adiponectin and the subsequent expression of arginase-1 leading to tolerogenic T cell responses (7). ECP-treated apoptotic lymphocytes induced a tolerogenic phenotype in untreated BMDCs and moDCs in an in vitro model, thereby leading to increased Treg induction in a cardiac allograft rejection model and a mixed lymphocyte response, respectively (43, 71). Thus, ECP might additionally induce a tolerogenic phenotype in untreated DCs by the recognition of apoptotic cells, which might be analyzed in future studies. However, this is only possible in cultures of whole PBMCs that are treated with ECP. Unambiguous identification of DC subpopulations in cultures of whole PBMCs is not possible over a longer period of time, as the surface marker expression on DCs as well as on monocytes changes during the culture and due to the scarcity of DCs. Therefore, we were limited to analyze effects of ECP on DCs in cultures of cell-sorter purified DCs of healthy donors. Thus, we cannot exclude that the presence of other cells and the secretion of soluble molecules by ECP-treated leukocytes might influence the response of DCs to ECP. In order to mimic inflammatory conditions present in GvHD, we used the TLR ligand R848 in our study. However, the environment in GvHD patients is very complex and additionally influenced by the treatment with corticosteroids and other immunosuppressive drugs. Nevertheless, TLR signaling is involved in GvHD pathogenesis with contributions of different TLRs, such as TLR4, TLR7, and TLR9 (85–91). In conclusion, we demonstrate that ECP directly induced apoptosis in cDC1 and pDC upon TLR stimulation and strongly reduced the capacity of especially cDC1 to activate memory CD4+ and CD8+ T cell responses.
Data availability statement
The raw data supporting the conclusions of this article will be made available by the authors, without undue reservation.
Ethics statement
The studies involving humans were approved by Ethikkommission der Friedrich-Alexander-Universität Erlangen-Nürnberg (ethics vote 346_18 B). The studies were conducted in accordance with the local legislation and institutional requirements. The participants provided their written informed consent to participate in this study.
Author contributions
LH: Methodology, Visualization, Conceptualization, Project administration, Supervision, Investigation, Writing – review & editing, Writing – original draft. CB: Resources, Writing – review & editing. HH: Project administration, Writing – review & editing, Conceptualization, Supervision, Funding acquisition.
Funding
The author(s) declare financial support was received for the research and/or publication of this article. HH was supported by the European Union (Grant number: 101119855 - exTra).
Acknowledgments
We thank all blood donors at the blood donation center of the Department of Transfusion Medicine and Hemostaseology.
Conflict of interest
The authors declare that the research was conducted in the absence of any commercial or financial relationships that could be construed as a potential conflict of interest.
Generative AI statement
The author(s) declare that no Generative AI was used in the creation of this manuscript.
Publisher’s note
All claims expressed in this article are solely those of the authors and do not necessarily represent those of their affiliated organizations, or those of the publisher, the editors and the reviewers. Any product that may be evaluated in this article, or claim that may be made by its manufacturer, is not guaranteed or endorsed by the publisher.
Supplementary material
The Supplementary Material for this article can be found online at: https://www.frontiersin.org/articles/10.3389/fimmu.2025.1646421/full#supplementary-material
References
1. Marks DI, Rockman SP, Oziemski MA, and Fox RM. Mechanisms of lymphocytotoxicity induced by extracorporeal photochemotherapy for cutaneous T cell lymphoma. J Clin Invest. (1990) 86:2080–5. doi: 10.1172/JCI114945
2. Edelson R, Berger C, Gasparro F, Jegasothy B, Heald P, Wintroub B, et al. Treatment of cutaneous T-cell lymphoma by extracorporeal photochemotherapy. N Engl J Med. (1987) 316:297–303. doi: 10.1056/NEJM198702053160603
3. Costanzo-Nordin MR, Hubbell EA, O’Sullivan EJ, Johnson MR, Mullen GM, Heroux AL, et al. Successful treatment of heart transplant rejection with photopheresis. Transplantation. (1992) 53:808–15. doi: 10.1097/00007890-199204000-00021
4. Slovis BS, Loyd JE, and King LE. Photopheresis for chronic rejection of lung allografts. N Engl J Med. (1995) 332:962–2. doi: 10.1056/NEJM199504063321417
5. Greinix HT, Volc-Platzer B, Rabitsch W, Gmeinhart B, Guevara-Pineda C, Kalhs P, et al. Successful use of extracorporeal photochemotherapy in the treatment of severe acute and chronic graft-versus-host disease. Blood. (1998) 92:3098–104. doi: 10.1182/blood.v92.9.3098
6. Benazzo A, Cho A, Auner S, Schwarz S, Kovacs Z, Ramazanova D, et al. Extracorporeal photopheresis for the prevention of rejection after lung transplantation: a prospective randomised controlled trial. Eur Respir J. (2025) 65:2400733. doi: 10.1183/13993003.00733-2024
7. Braun LM, Giesler S, Andrieux G, Riemer R, Talvard-Balland N, Duquesne S, et al. Adiponectin reduces immune checkpoint inhibitor-induced inflammation without blocking anti-tumor immunity. Cancer Cell. (2025) 43:269–291.e19. doi: 10.1016/j.ccell.2025.01.004
8. Ertl C, Ruf T, Hammann L, Piseddu I, Wang Y, Schmitt C, et al. Extracorporeal photopheresis vs. systemic immunosuppression for immune-related adverse events: Interim analysis of a prospective two-arm study. Eur J Cancer. (2024) 212:115049. doi: 10.1016/j.ejca.2024.115049
9. Di Renzo M, Rubegni P, De Aloe G, Paulesu L, Pasqui AL, Andreassi L, et al. Extracorporeal photochemotherapy restores Th1/Th2 imbalance in patients with early stage cutaneous T-cell lymphoma. Immunology. (1997) 92:99–103. doi: 10.1046/j.1365-2567.1997.00325.x
10. Gatza E, Rogers CE, Clouthier SG, Lowler KP, Tawara I, Liu C, et al. Extracorporeal photopheresis reverses experimental graft-versus-host disease through regulatory T cells. Blood. (2008) 112:1515–21. doi: 10.1182/blood-2007-11-125542
11. Heger L, Amon L, Lehmann CHK, Baranska A, Heidkamp GF, and Dudziak D. Functional specialization of dendritic cell subsets. In: Encyclopedia of Cell Biology. Amsterdam, Netherlands: Elsevier (2023). p. 446–71. doi: 10.1016/B978-0-12-821618-7.00257-1
12. Amon L, Hatscher L, Heger L, Dudziak D, and Lehmann CHK. Harnessing the complete repertoire of conventional dendritic cell functions for cancer immunotherapy. Pharmaceutics. (2020) 12:1–83. doi: 10.3390/pharmaceutics12070663
13. Dorner BG, Dorner MB, Zhou X, Opitz C, Mora A, Güttler S, et al. Selective expression of the chemokine receptor XCR1 on cross-presenting dendritic cells determines cooperation with CD8+ T cells. Immunity. (2009) 31:823–33. doi: 10.1016/j.immuni.2009.08.027
14. Hildner K, Edelson BT, Purtha WE, Diamond MS, Matsushita H, Kohyama M, et al. Batf3 deficiency reveals a critical role for CD8 + Dendritic cells in cytotoxic T cell immunity. Science (80-). (2008) 322:1097–100. doi: 10.1126/science.1164206
15. Sancho D, Joffre OP, Keller AM, Rogers NC, Martínez D, Hernanz-Falcón P, et al. Identification of a dendritic cell receptor that couples sensing of necrosis to immunity. Nature. (2009) 458:899–903. doi: 10.1038/nature07750
16. Heger L, Hatscher L, Liang C, Lehmann CHK, Amon L, Lühr JJ, et al. XCR1 expression distinguishes human conventional dendritic cell type 1 with full effector functions from their immediate precursors. Proc Natl Acad Sci. (2023) 120:2017. doi: 10.1073/pnas.2300343120
17. den Haan JMM, Lehar SM, and Bevan MJ. Cd8+ but not cd8– dendritic cells cross-prime cytotoxic T cells in vivo. J Exp Med. (2000) 192:1685–96. doi: 10.1084/jem.192.12.1685
18. Dudziak D, Kamphorst AO, Heidkamp GF, Buchholz VR, Trumpfheller C, Yamazaki S, et al. Differential antigen processing by dendritic cell subsets in vivo. Science (80-). (2007) 315:107–11. doi: 10.1126/science.1136080
19. Jongbloed SL, Kassianos AJ, McDonald KJ, Clark GJ, Ju X, Angel CE, et al. Human CD141+ (BDCA-3)+ dendritic cells (DCs) represent a unique myeloid DC subset that cross-presents necrotic cell antigens. J Exp Med. (2010) 207:1247–60. doi: 10.1084/jem.20092140
20. Barry KC, Hsu J, Broz ML, Cueto FJ, Binnewies M, Combes AJ, et al. A natural killer–dendritic cell axis defines checkpoint therapy–responsive tumor microenvironments. Nat Med. (2018) 24:1178–91. doi: 10.1038/s41591-018-0085-8
21. Böttcher JP, Bonavita E, Chakravarty P, Blees H, Cabeza-Cabrerizo M, Sammicheli S, et al. NK Cells Stimulate Recruitment of cDC1 into the Tumor Microenvironment Promoting Cancer Immune Control. Cell. (2018) 172:1022–1028.e14. doi: 10.1016/j.cell.2018.01.004
22. Heidkamp GF, Sander J, Lehmann CHK, Heger L, Eissing N, Baranska A, et al. Human lymphoid organ dendritic cell identity is predominantly dictated by ontogeny, not tissue microenvironment. Sci Immunol. (2016) 1:eaai7677–eaai7677. doi: 10.1126/sciimmunol.aai7677
23. Schlitzer A, McGovern N, Teo P, Zelante T, Atarashi K, Low D, et al. IRF4 transcription factor-dependent CD11b+ Dendritic cells in human and mouse control mucosal IL-17 cytokine responses. Immunity. (2013) 38:970–83. doi: 10.1016/j.immuni.2013.04.011
24. Heger L, Balk S, Lühr JJ, Heidkamp GF, Lehmann CHK, Hatscher L, et al. CLEC10A Is a specific marker for human CD1c+ dendritic cells and enhances their toll-like receptor 7/8-Induced cytokine secretion. Front Immunol. (2018) 9:744. doi: 10.3389/fimmu.2018.00744
25. Dutertre CA, Becht E, Irac SE, Khalilnezhad A, Narang V, Khalilnezhad S, et al. Single-cell analysis of human mononuclear phagocytes reveals subset-defining markers and identifies circulating inflammatory dendritic cells. Immunity. (2019) 51:573–589.e8. doi: 10.1016/j.immuni.2019.08.008
26. Tussiwand R, Everts B, Grajales-Reyes GE, Kretzer NM, Iwata A, Bagaitkar J, et al. Klf4 expression in conventional dendritic cells is required for T helper 2 cell responses. Immunity. (2015) 42:916–28. doi: 10.1016/j.immuni.2015.04.017
27. Lewis KL, Caton ML, Bogunovic M, Greter M, Grajkowska LT, Ng D, et al. Notch2 receptor signaling controls functional differentiation of dendritic cells in the spleen and intestine. Immunity. (2011) 35:780–91. doi: 10.1016/j.immuni.2011.08.013
28. Yin X, Yu H, Jin X, Li J, Guo H, Shi Q, et al. Human Blood CD1c + Dendritic Cells Encompass CD5 high and CD5 low Subsets That Differ Significantly in Phenotype, Gene Expression, and Functions. J Immunol. (2017) 198:1553–64. doi: 10.4049/jimmunol.1600193
29. Bakdash G, Buschow SI, Gorris MAJ, Halilovic A, Hato SV, Sköld AE, et al. Expansion of a BDCA1+ CD14+ myeloid cell population in melanoma patients may attenuate the efficacy of dendritic cell vaccines. Cancer Res. (2016) 76:4332–46. doi: 10.1158/0008-5472.CAN-15-1695
30. Bourdely P, Anselmi G, Vaivode K, Ramos RN, Missolo-Koussou Y, Hidalgo S, et al. Transcriptional and functional analysis of CD1c+ Human dendritic cells identifies a CD163+ Subset priming CD8+CD103+ T cells. Immunity. (2020) 0:1–18. doi: 10.1016/j.immuni.2020.06.002
31. Hatscher L, Kaszubowski T, Amon L, Dudziak D, and Heger L. Circumventing pyroptosis via hyperactivation shapes superior immune responses of human type 2 dendritic cells compared to type 3 dendritic cells. Eur J Immunol. (2023) 53(9):2250123. doi: 10.1002/eji.202250123
32. Heger L, Hofer TP, Bigley V, de Vries IJM, Dalod M, Dudziak D, et al. Subsets of CD1c+ DCs: dendritic cell versus monocyte lineage. Front Immunol. (2020) 11:559166. doi: 10.3389/fimmu.2020.559166
33. Cisse B, Caton ML, Lehner M, Maeda T, Scheu S, Locksley R, et al. Transcription factor E2–2 is an essential and specific regulator of plasmacytoid dendritic cell development. Cell. (2008) 135:37–48. doi: 10.1016/j.cell.2008.09.016
34. Nagasawa M, Schmidlin H, Hazekamp MG, Schotte R, and Blom B. Development of human plasmacytoid dendritic cells depends on the combined action of the basic helix-loop-helix factor E2–2 and the Ets factor Spi-B. Eur J Immunol. (2008) 38:2389–400. doi: 10.1002/eji.200838470
35. MacDonald KPA, Munster DJ, Clark GJ, Dzionek A, Schmitz J, and Hart DNJ. Characterization of human blood dendritic cell subsets. Blood. (2002) 100:4512–20. doi: 10.1182/blood-2001-11-0097
36. Dzionek A, Fuchs A, Schmidt P, Cremer S, Zysk M, Miltenyi S, et al. BDCA-2, BDCA-3, and BDCA-4: three markers for distinct subsets of dendritic cells in human peripheral blood. J Immunol. (2000) 165:6037–46. doi: 10.4049/jimmunol.165.11.6037
37. Cao W, Manicassamy S, Tang H, Kasturi SP, Pirani A, Murthy N, et al. Toll-like receptor-mediated induction of type I interferon in plasmacytoid dendritic cells requires the rapamycin-sensitive PI(3)K-mTOR-p70S6K pathway. Nat Immunol. (2008) 9:1157–64. doi: 10.1038/ni.1645
38. Chopin M, Preston SP, Lun ATL, Tellier J, Smyth GK, Pellegrini M, et al. RUNX2 mediates plasmacytoid dendritic cell egress from the bone marrow and controls viral immunity. Cell Rep. (2016) 15:866–78. doi: 10.1016/j.celrep.2016.03.066
39. Lutz MB, Strobl H, Schuler G, and Romani N. GM-CSF monocyte-derived cells and langerhans cells as part of the dendritic cell family. Front Immunol. (2017) 8:1388. doi: 10.3389/fimmu.2017.01388
40. Yakut E, Jakobs C, Peric A, Michel G, Baal N, Bein G, et al. Extracorporeal photopheresis promotes IL-1β Production. J Immunol. (2015) 194:2569–77. doi: 10.4049/jimmunol.1400694
41. Holtick U, Marshall SR, Wang XN, Hilkens CMU, and Dickinson AM. Impact of Psoralen/UVA-treatment on survival, activation, and immunostimulatory capacity of monocyte-derived dendritic cells. Transplantation. (2008) 85:757–66. doi: 10.1097/TP.0b013e31816650f6
42. Di Renzo M, Sbano P, De Aloe G, Pasqui AL, Rubegni P, Ghezzi A, et al. Extracorporeal photopheresis affects co-stimulatory molecule expression and interleukin-10 production by dendritic cells in graft-versus-host disease patients. Clin Exp Immunol. (2008) 151:407–13. doi: 10.1111/j.1365-2249.2007.03577.x
43. Zheng DH, Dou LP, Wei YX, Du GS, Zou YP, Song JY, et al. Uptake of donor lymphocytes treated with 8-methoxypsoralen and ultraviolet A light by recipient dendritic cells induces CD4+CD25+Foxp3+ regulatory T cells and down-regulates cardiac allograft rejection. Biochem Biophys Res Commun. (2010) 395:540–6. doi: 10.1016/j.bbrc.2010.04.062
44. Sander J, Schmidt SV, Cirovic B, McGovern N, Papantonopoulou O, Hardt AL, et al. Cellular differentiation of human monocytes is regulated by time-dependent interleukin-4 signaling and the transcriptional regulator NCOR2. Immunity. (2017) 47:1051–1066.e12. doi: 10.1016/j.immuni.2017.11.024
45. Hackstein H, Kalina A, Dorn B, Keil IS, Baal N, Michel G, et al. CD11c+dendritic cells mediate antigen-specific suppression in extracorporeal photopheresis. Clin Exp Immunol. (2021) 203:329–39. doi: 10.1111/cei.13539
46. Heger L, Dudziak D, Amon L, Hatscher L, Kaszubowski T, and Lehmann CHK. Guidelines for DC preparation and flow cytometric analysis of human lymphohematopoietic tissues. Eur J Immunol. (2022) 53(12):2249917. doi: 10.1002/eji.202249917
47. Cunningham S, Buchele V, Brox R, Strasser E, and Hackstein H. Thrombocyte apheresis cassettes as a novel source of viable peripheral blood mononuclear cells. Transfusion. (2020) 60:1500–7. doi: 10.1111/trf.15756
48. Buchele V and Hackstein H. A simplified extracorporeal photopheresis procedure based on single high-dose ultraviolet A light irradiation shows similar in vitro efficacy. Transfusion. (2021) 61:883–93. doi: 10.1111/trf.16209
49. Durazzo TS, Tigelaar RE, Filler R, Hayday A, Girardi M, and Edelson RL. Induction of monocyte-to-dendritic cell maturation by extracorporeal photochemotherapy: Initiation via direct platelet signaling. Transfus Apher Sci. (2014) 50:370–8. doi: 10.1016/j.transci.2013.11.008
50. Ventura A, Vassall A, Robinson E, Filler R, Hanlon D, Meeth K, et al. Extracorporeal photochemotherapy drives monocyte-to-dendritic cell maturation to induce anticancer immunity. Cancer Res. (2018) 78:4045–58. doi: 10.1158/0008-5472.CAN-18-0171
51. Spisek R, Gasova Z, and Bartunkova J. Maturation state of dendritic cells during the extracorporeal photopheresis and its relevance for the treatment of chronic graft-versus-host disease. Transfusion. (2006) 46:55–65. doi: 10.1111/j.1537-2995.2005.00670.x
52. Lubin R, Patel AA, Mackerodt J, Zhang Y, Gvili R, Mulder K, et al. The lifespan and kinetics of human dendritic cell subsets and their precursors in health and inflammation. J Exp Med. (2024) 221. doi: 10.1084/jem.20220867
53. Krüger A, Oldenburg M, Chebrolu C, Beisser D, Kolter J, Sigmund AM, et al. Human TLR 8 senses UR/URR motifs in bacterial and mitochondrial RNA. EMBO Rep. (2015) 16:1656–63. doi: 10.15252/embr.201540861
54. Eigenbrod T, Pelka K, Latz E, Kreikemeyer B, and Dalpke AH. TLR8 senses bacterial RNA in human monocytes and plays a nonredundant role for recognition of streptococcus pyogenes. J Immunol. (2015) 195:1092–9. doi: 10.4049/jimmunol.1403173
55. Eigenbrod T and Dalpke AH. Bacterial RNA: an underestimated stimulus for innate immune responses. J Immunol. (2015) 195:411–8. doi: 10.4049/jimmunol.1500530
56. van Riet E, Everts B, Retra K, Phylipsen M, van Hellemond JJ, Tielens AGM, et al. Combined TLR2 and TLR4 ligation in the context of bacterial or helminth extracts in human monocyte derived dendritic cells: Molecular correlates for Th1/Th2 polarization. BMC Immunol. (2009) 10:1–12. doi: 10.1186/1471-2172-10-9
57. Takeuchi O, Hoshino K, Kawai T, Sanjo H, Takada H, Ogawa T, et al. Differential Roles of TLR2 and TLR4 in recognition of gram-negative and gram-positive bacterial cell wall components. Immunity. (1999) 11:443–51. doi: 10.1016/S1074-7613(00)80119-3
58. Pulendran B, Smith JL, Caspary G, Brasel K, Pettit D, Maraskovsky E, et al. Distinct dendritic cell subsets differentially regulate the class of immune response in vivo. Proc Natl Acad Sci U.S.A. (1999) 96:1036–41. doi: 10.1073/pnas.96.3.1036
59. Maldonado-López R, De Smedt T, Michel P, Godfroid J, Pajak B, Heirman C, et al. CD8α+ and CD8α- Subclasses of dendritic cells direct the development of distinct T helper cells in vivo. J Exp Med. (1999) 189:587–92. doi: 10.1084/jem.189.3.587
60. Maldonado-López R, Maliszewski C, Urbain J, and Moser M. Cytokines regulate the capacity of CD8α+ and CD8α– dendritic cells to prime th1/th2 cells in vivo. J Immunol. (2001) 167:4345–50. doi: 10.4049/jimmunol.167.8.4345
61. Martínez-López M, Iborra S, Conde-Garrosa R, and Sancho D. Batf3-dependent CD103+ dendritic cells are major producers of IL-12 that drive local Th1 immunity against Leishmania major infection in mice. Eur J Immunol. (2015) 45:119–29. doi: 10.1002/eji.201444651
62. Koyama M, Hashimoto D, Aoyama K, Matsuoka KI, Karube K, Niiro H, et al. Plasmacytoid dendritic cells prime alloreactive T cells to mediate graft-versus-host disease as antigen-presenting cells. Blood. (2009) 113:2088–95. doi: 10.1182/blood-2008-07-168609
63. Markey KA, Banovic T, Kuns RD, Olver SD, Don ALJ, Raffelt NC, et al. Conventional dendritic cells are the critical donorAPC presenting alloantigen after experimental bone marrow transplantation. Blood. (2009) 113:5644–9. doi: 10.1182/blood-2008-12-191833
64. Koyama M, Cheong M, Markey KA, Gartlan KH, Kuns RD, Locke KR, et al. Donor colonic CD103+ dendritic cells determine the severity of acute graft-versus-host disease. J Exp Med. (2015) 212:1303–21. doi: 10.1084/jem.20150329
65. Weber M, Rudolph B, Stein P, Yogev N, Bosmann M, Schild H, et al. Host-Derived CD8+ dendritic cells protect against acute graft-versus-host disease after experimental allogeneic bone marrow transplantation. Biol Blood Marrow Transplant. (2014) 20:1696–704. doi: 10.1016/j.bbmt.2014.08.005
66. Markey KA, Kuns RD, Browne DJ, Gartlan KH, Robb RJ, Paulo Martins J, et al. Flt-3L expansion of recipient CD8aþ dendritic cells deletes alloreactive donor T cells and represents an alternative to posttransplant cyclophosphamide for the prevention of GVHD. Clin Cancer Res. (2018) 24:1604–16. doi: 10.1158/1078-0432.CCR-17-2148
67. Teshima T, Reddy P, Lowler KP, Kukuruga MA, Liu C, Cooke KR, et al. Flt3 ligand therapy for recipients of allogeneic bone marrow transplants expands host CD8α+ dendritic cells and reduces experimental acute graft-versus-host disease. Blood. (2002) 99:1825–32. doi: 10.1182/blood.V99.5.1825
68. Shlomchik WD, Couzens MS, Tang CB, McNiff J, Robert ME, Liu J, et al. Prevention of graft versus host disease by inactivation of host antigen- presenting cells. Science (80-). (1999) 285:412–5. doi: 10.1126/science.285.5426.412
69. Matte CC, Liu J, Cormier J, Anderson BE, Athanasiadis I, Jain D, et al. Donor APCs are required for maximal GVHD but not for GVL. Nat Med. (2004) 10:987–92. doi: 10.1038/nm1089
70. Hadeiba H, Sato T, Habtezion A, Oderup C, Pan J, and Butcher EC. CCR9 expression defines tolerogenic plasmacytoid dendritic cells able to suppress acute graft-versus-host disease. Nat Immunol. (2008) 9:1253–60. doi: 10.1038/ni.1658
71. Lamioni A, Parisi F, Isacchi G, Giorda E, Di Cesare S, Landolfo A, et al. The immunological effects of extracorporeal photopheresis unraveled: Induction of tolerogenic dendritic cells in vitro and regulatory T cells in vivo. Transplantation. (2005) 79:846–50. doi: 10.1097/01.TP.0000157278.02848.C7
72. Meloni F, Cascina A, Miserere S, Perotti C, Vitulo P, and Fietta AM. Peripheral CD4+CD25+ TREG cell counts and the response to extracorporeal photopheresis in lung transplant recipients. Transplant Proc. (2007) 39:213–7. doi: 10.1016/j.transproceed.2006.10.227
73. Mottola M, Bruzzaniti S, Piemonte E, Lepore MT, Petraio A, Romano R, et al. Extracorporeal photopheresis enhances the frequency and function of highly suppressive foxP3+ Treg subsets in heart transplanted individuals. Transplantation. (2025) 109:638–45. doi: 10.1097/TP.0000000000005201
74. Kibbi N, Sobolev O, Girardi M, and Edelson RL. Induction of anti-tumor CD8 T cell responses by experimental ECP-induced human dendritic antigen presenting cells. Transfus Apher Sci. (2016) 55:146–52. doi: 10.1016/j.transci.2016.06.001
75. Berger C, Hoffmann K, Vasquez JG, Mane S, Lewis J, Filler R, et al. Rapid generation of maturationally synchronized human dendritic cells: Contribution to the clinical efficacy of extracorporeal photochemotherapy. Blood. (2010) 116:4838–47. doi: 10.1182/blood-2009-11-256040
76. Berger CL, Xu AL, Hanlon D, Lee C, Schechner J, Glusac E, et al. Induction of human tumor-loaded dendritic cells. Int J Cancer. (2001) 91:438–47. doi: 10.1002/1097-0215(200002)9999:9999<::aid-ijc1073>3.0.co;2-r
77. Cytlak U, Resteu A, Pagan S, Green K, Milne P, Maisuria S, et al. Differential IRF8 transcription factor requirement defines two pathways of dendritic cell development in humans. Immunity. (2020) 53:353–370.e8. doi: 10.1016/j.immuni.2020.07.003
78. Velickovic VM, McIlwaine E, Zhang R, and Spelman T. Adverse events in second- and third-line treatments for acute and chronic graft-versus-host disease: systematic review. Ther Adv Hematol. (2020) 11:1–18. doi: 10.1177/2040620720977039
79. Thevenet U, Daguenet E, Beszera SM, Cornillon J, Tavernier E, Schein F, et al. Infectious risks in patients treated with extracorporeal photopheresis for graft-versus-host disease: A retrospective cohort study. J Clin Apher. (2022) 37:106–16. doi: 10.1002/jca.21957
80. Rodrigues PF, Kouklas A, Cvijetic G, Bouladoux N, Mitrovic M, Desai JV, et al. pDC-like cells are pre-DC2 and require KLF4 to control homeostatic CD4 T cells. Sci Immunol. (2023) 8:37–40. doi: 10.1126/sciimmunol.add4132
81. Sulczewski FB, Maqueda-Alfaro RA, Alcántara-Hernández M, Perez OA, Saravanan S, Yun TJ, et al. Transitional dendritic cells are distinct from conventional DC2 precursors and mediate proinflammatory antiviral responses. Nat Immunol. (2023) 24:1265–1280. doi: 10.1038/s41590-023-01545-7
82. Leylek R, Alcántara-Hernández M, Lanzar Z, Lüdtke A, Perez OA, Reizis B, et al. Integrated cross-species analysis identifies a conserved transitional dendritic cell population. Cell Rep. (2019) 29:3736–3750.e8. doi: 10.1016/j.celrep.2019.11.042
83. Villani A-C, Satija R, Reynolds G, Sarkizova S, Shekhar K, Fletcher J, et al. Single-cell RNA-seq reveals new types of human blood dendritic cells, monocytes, and progenitors. Science (80-). (2017) 356:eaah4573. doi: 10.1126/science.aah4573
84. See P, Dutertre C-A, Chen J, Günther P, McGovern N, Irac SE, et al. Mapping the human DC lineage through the integration of high-dimensional techniques. Science (80-). (2017) 3009. doi: 10.1126/science.eaag3009
85. Chakraverty R, Côté D, Buchli J, Cotter P, Hsu R, Zhao G, et al. An inflammatory checkpoint regulates recruitment of graft-versus-host reactive T cells to peripheral tissues. J Exp Med. (2006) 203:2021–31. doi: 10.1084/jem.20060376
86. Taylor PA, Ehrhardt MJ, Lees CJ, Panoskaltsis-Mortari A, Krieg AM, Sharpe AH, et al. TLR agonists regulate alloresponses and uncover a critical role for donor APCs in allogeneic bone marrow rejection. Blood. (2008) 112:3508–16. doi: 10.1182/blood-2007-09-113670
87. Lorenz E, Schwartz DA, Martin PJ, Gooley T, Lin MT, Chien JW, et al. Association of TLR4 mutations and the risk for acute GVHD after HLA-matched-sibling hematopoietic stem cell transplantation. Biol Blood Marrow Transplant. (2001) 7:384–7. doi: 10.1053/bbmt.2001.v7.pm11529488
88. Elmaagacli AH, Steckel N, Ditschkowski M, Hegerfeldt Y, Ottinger H, Trenschel R, et al. Toll-like receptor 9, NOD2 and IL23R gene polymorphisms influenced outcome in AML patients transplanted from HLA-identical sibling donors. Bone Marrow Transplant. (2011) 46:702–8. doi: 10.1038/bmt.2010.166
89. Elmaagacli AH, Koldehoff M, Hindahl H, Steckel NK, Trenschel R, Peceny R, et al. Mutations in innate immune system NOD2/CARD 15 and TLR-4 (Thr399Ile) genes influence the risk for severe acute graft-versus-host disease in patients who underwent an allogeneic transplantation. Transplantation. (2006) 81:247–54. doi: 10.1097/01.tp.0000188671.94646.16
90. Rozmus J, Ivison S, Kariminia A, Leung VM, Sung S, Subrt P, et al. Higher levels of free plasma mitochondrial DNA are associated with the onset of chronic GvHD. Bone Marrow Transplant. (2018) 53:1263–9. doi: 10.1038/s41409-018-0156-y
Keywords: extracorporeal photopheresis, ECP, graft-versus-host disease, GvHD, dendritic cells, cDC1, apoptosis, T cells
Citation: Heger L, Berking C and Hackstein H (2025) Extracorporeal photopheresis reduces the T cell stimulatory capacity of human primary blood conventional dendritic cells type 1. Front. Immunol. 16:1646421. doi: 10.3389/fimmu.2025.1646421
Received: 13 June 2025; Accepted: 24 July 2025;
Published: 13 August 2025.
Edited by:
Stefanie Scheu, Rostock University Medical Center, GermanyReviewed by:
Mario Galgani, University of Naples Federico II, ItalyStephanie C. Talker, Institute of Virology and Immunology (IVI), Switzerland
Copyright © 2025 Heger, Berking and Hackstein. This is an open-access article distributed under the terms of the Creative Commons Attribution License (CC BY). The use, distribution or reproduction in other forums is permitted, provided the original author(s) and the copyright owner(s) are credited and that the original publication in this journal is cited, in accordance with accepted academic practice. No use, distribution or reproduction is permitted which does not comply with these terms.
*Correspondence: Lukas Heger, THVrYXMuaGVnZXJAdWstZXJsYW5nZW4uZGU=