 Junjie Sun†
 Guangyi Zhu
 Xuyong Sun
- Institute of Transplant Medicine, The Second Affiliated Hospital of Guangxi Medical University, Guangxi Clinical Research Center for Organ Transplantation, Guangxi Key Laboratory of Organ Donation and Transplantation, Nanning, China
Objective: Perioperative T-cell-mediated rejection (TCMR) and pneumonia occurrence significantly impair graft function and patient survival following liver transplantation (LT). This article aims to develop a machine learning (ML)-based model to predict perioperative co-occurrence of TCMR and pneumonia.
Methods: Recipient-related data were retrospectively collected. Predictive Variables were identified through LASSO regression analysis. Five machine learning algorithms, including support vector machine (SVM), were employed to develop predictive models. Model performance was appraised via the receiver operating characteristic (ROC) curve, and calibration curve. SHapley Additive exPlanations (SHAP) method was employed to visualize model characteristics and individual predictions.
Results: This study enrolled 717 LT recipients, including 93 patients with perioperative co-occurrence of TCMR and pneumonia. LASSO regression identified postoperative direct bilirubin, postoperative international normalized ratio, high-density lipoprotein, postoperative alanine aminotransferase, natural killer cell, tacrolimus (FK506) concentration, Na+, operative time, anhepatic phase, induction regimen, and ICU stay as significant predictors. The SVM model demonstrated superior predictive performance, with area under the curve values of 0.881 (95% CI: 0.83–0.93) and 0.786 (95% CI: 0.69–0.88) in the training and test sets, respectively. The calibration curve showed high agreement between the predicted and observed risks. The SVM model demonstrated superior specificity, sensitivity, F1 score, and recall compared to other models. SHAP analysis identified variables that contributed to the model predictions.
Conclusions: This study constructed a robust predictive model for the perioperative co-occurrence of TCMR and pneumonia. The SVM model demonstrated superior predictive performance.
Introduction
Liver transplantation (LT) has become the optimal treatment for end-stage liver disease. Although liver is considered an immunologically privileged organ among solid organ transplants (1), the incidence of acute rejection following LT can still reach 10–30% (2, 3). Theoretically, T-cell-mediated rejection (TCMR) typically occurs within 4 to 6 weeks post-transplantation, representing the period of most intense immune rejection in LT recipients (4). If not promptly intervened, it can lead to graft dysfunction and even graft failure (5). Although Banff classification criteria remain the gold standard for diagnosing TCMR (6), percutaneous liver biopsy, has limitations in the prompt identification. Concurrently, pneumonia is a common infectious complication during the perioperative period. It exacerbates hepatic ischemia-reperfusion injury, contributing to delayed graft function recovery (7), adversely impacting clinical outcomes of LT and posing a significant threat to recipient survival (8). Hence, it is critically urgent to refine prognostic tools. Precise risk stratification for TCMR and pneumonia occurrence is essential for optimizing perioperative care. This may provide a framework for elucidating the pathophysiological mechanisms of perioperative TCMR and pneumonia in LT and developing individualized dynamic surveillance protocols. Such advancements hold significant implications for enhancing patient quality of life and prolonging survival outcomes, thereby optimizing long-term prognosis in this high-risk population. Postoperative pneumonia risk stratification has been enhanced by recently developed scoring systems, including the ISAN score (Intracerebral Hemorrhage, Sex, Age, NIH Stroke Scale) (9), Pneumonia Risk Index (non-cardiac surgery) (10), and Systemic Inflammation Score (post-gastrectomy) (11). However, these scoring systems are not applicable for assessing pneumonia after LT. They fail to account for the multifactorial synergy driving the co-occurrence of TCMR and pneumonia and struggle to capture nonlinear relationships or higher-order interactions among variables. Furthermore, conventional models exhibit low sensitivity in predicting TCMR post-LT (12), making it difficult to optimize immunosuppressive regimens for individual patients. For instance, while pulse steroid therapy can reduce rejection risk, it increases infection probability; traditional models are inadequate for quantifying such dynamic trade-offs.
In contrast, machine learning (ML) algorithms—through automated feature extraction and nonlinear modeling—demonstrate superior prediction accuracy. Techniques such as gradient-boosted ensembles outperform conventional scoring systems in predicting perioperative TCMR and pneumonia occurrence by decoding complex clinical variable interactions. Compared to traditional scoring systems, ML models have shown promising performance in predicting outcomes across various solid organ transplantation (13, 14). Currently, ML is widely applied to predict outcomes after LT (15, 16). Chen et al. (17) developed an ML model to predict pneumonia occurrence after LT. Maryam et al. (18) developed and validated an ML model demonstrating good performance in predicting plasma cell-rich rejection after LT. To mitigate the incidence of rejection following LT, Yoon et al. (19) employed ML algorithms to predict the optimal therapeutic range of tacrolimus, thereby advancing the clinical implementation of personalized immunosuppressive regimens. However, ML models specifically predicting the co-occurrence of perioperative TCMR and pneumonia after LT are scarce.
This study aims to develop and validate an ML-based predictive model for the co-occurrence of perioperative TCMR and pneumonia after LT. Ensemble algorithms and SHapley Additive exPlanations interpretability (SHAP) will be employed to identify nonlinear interactions and latent risk patterns that conventional methods may overlook, thereby addressing critical gaps in current prognostic frameworks. The clinical significance of this study lies in its potential to transform perioperative management strategies. With precise risk stratification, the established model could guide personalized therapeutic interventions, optimize surveillance protocols, inform immunosuppression regimen adjustments, and optimize the rational use of antimicrobial agents. These advances hold promise for reducing serious complications arising from perioperative TCMR and pneumonia after LT, thereby providing a basis for clinical decision-making.
Methods
Study cohort
This retrospective study obtained clinical data from LT patients at the Institute of Transplantation Medicine, Second Affiliated Hospital of Guangxi Medical University, between November 1, 2019, and June 1, 2025. All allografts originated from deceased donors, with allocation governed by the China Organ Transplant Response System. The study was conducted in accordance with both the Declarations of Helsinki and Istanbul and the study protocol was ratified by the Institutional Review Board of the hospital (Approval No.: 2019-(KY-0113)), and all participants provided informed consent. Inclusion criteria encompassed: (1) age ≥18 years at the time of primary deceased-donor allogeneic LT; (2) absence of active infection at transplantation: negative blood cultures within 48 hours preoperatively and no radiological evidence of infection; (3) normal preoperative immune status: CD4+ T-cell count ≥200/μL; (4) TCMR meeting either criterion: histologically confirmed per Banff 2023 criteria (biopsy-proven); clinical diagnosis: ALT/AST elevation ≥3× baseline and FK506 <5 ng/mL; (5) pneumonia diagnosis requiring: radiological confirmation and/or microbiological evidence; (6) co-occurrence requirement: TCMR and pneumonia diagnoses within the perioperative period and interval between TCMR and pneumonia ≤7 days; (7) availability of standardized postoperative follow-up data. Exclusion criteria encompassed: (1) combined multi-organ transplantation; (2) pre-existing structural lung disease or chronic respiratory failure; (3) active systemic infection at transplantation; (4) mortality or retransplantation within perioperative period (excluding cases caused by TCMR and pneumonia); (5) ABO-incompatible LT. In this study, the perioperative period was defined as 30 days after LT.
Data collection
The following information was retrospectively collected: (1) demographic parameters: gender; age; body mass index (BMI); blood type; (2) preoperative laboratory parameters: white blood cell (WBC) count; hemoglobin (Hb); platelet (PLT) count; neutrophil (NEUT) count; lymphocyte (LYM) count; creatine kinase (CK); creatine kinase-MB isoenzyme (CK-MB); procalcitonin (PCT); C-reactive protein (CRP); total cholesterol (TC); triglyceride (TG); high-density lipoprotein (HDL); low-density lipoprotein (LDL); serum creatinine (SCr); blood urea nitrogen (BUN); uric acid (UA); cystatin C (Cys C); CD4+ T-lymphocyte (CD4+) count; CD8+ T-lymphocyte (CD8+) count; B cell (BC) count; natural killer cell (NK) count; K+; Na+; Cl+; Ca2+; Mg2+; PH; PO2; PCO2; A-aDO2; (3) preoperative concurrent symptoms: hepatic encephalopathy; ascites; (4) postoperative laboratory parameters (postoperative day 7): postoperative total bilirubin (TBIL); postoperative direct bilirubin (DBIL); postoperative albumin (ALB); postoperative gamma-glutamyl transpeptidase (GGT); postoperative aspartate aminotransferase (AST); postoperative alanine aminotransferase (ALT); postoperative alkaline phosphatase (ALP); postoperative prothrombin time (PT); postoperative international normalized ratio (INR); postoperative activated partial thromboplastin time (APTT); postoperative CD4+; postoperative CD8+; postoperative BC; postoperative NK; postoperative PH; postoperative PO2; postoperative PCO2; postoperative A-aDO2; (5) surgical metrics: operation time; anhepatic phase; blood loss; packed red blood cells (PRBC); fresh frozen plasma (FFP); apheresis platelets; mechanical ventilation (MV); ICU stay; (6) immunosuppressive management: human leukocyte antigen class I antibody (HLA-I Ab); human leukocyte antigen class II antibody (HLA-II Ab); induction therapy; immunotherapy regimen; tacrolimus (FK506); (7) donor gender; donor age; donor BMI; (8) gender matched.
Statistical analysis
All data were processed and visualized in the R statistical computing environment 4.4.0. The ggplot2 package was utilized for graphical representations. Two-tailed analyses were utilized for hypothesis testing, with P<0.05 implying statistical significance. The normality of continuous variables was determined via the Shapiro-Wilk test. Variables in normal distribution were depicted as mean ± standard deviation (SD), while non-normally distributed variables were depicted as median (interquartile range [IQR]) and compared with the Mann-Whitney U test. Categorical data were reported as frequencies (percentages), and pairwise comparisons were performed via Pearson’s χ² test or Fisher’s exact test, as appropriate. For variables exceeding the predetermined 20% missingness threshold, imputation was performed using the Random Forest algorithm within the Multivariate Imputation by Chained Equations (MICE) package (v3.16.2).
Feature variable screening
LASSO regression identified significant predictors between clinical characteristics of LT recipients and the perioperative co-occurrence of TCMR and pneumonia following LT. The iterative analysis was conducted via a 10-fold cross-validation method, λ-min (minimum lambda): 0.01906806. Variables with statistical significance (P < 0.05) in both LASSO regression and comparative analyses were selected for multivariate modeling. These variables were subsequently incorporated into predictive model development.
Development and evaluation of predictive models
Predictive models were constructed for perioperative co-occurrence of TCMR and pneumonia after LT (binary outcome: 1=co-occurrence, 0=no co-occurrence). Five classical ML algorithms were implemented: logistic regression (LR), support vector machine (SVM), random forest (RF), gradient boosting machine (GBM), and extreme gradient boosting (XGBoost). The cohort was randomly stratified into training (70%) and test (30%) sets.
Receiver operating characteristic (ROC) curves assessed model performance, with the AUC and 95% CI reckoned to quantify discrimination accuracy. The optimal diagnostic cutoff was identified by the Youden index (J=sensitivity + specificity – 1), from which corresponding sensitivity and specificity values were derived. The calibration curve was implemented to estimate high agreement between the predicted and observed risks. Model performance was additionally evaluated using specificity, sensitivity, F1-score, and recall rate. Comparative analysis of these metrics across all algorithms was made to identify the optimal model for subsequent clinical assessment.
Interpretability analysis
A swarm plot was created using the SHAP method to present the individual contribution of each feature to the prediction. SHAP evaluations revealed the degree to which each feature influenced specific samples, thereby elucidating the model’s decision-making procedures. Ultimately, feature recursive elimination was utilized to screen variables to simplify the model.
Results
Clinical characteristics
This study enrolled 717 patients who underwent LT, including 600 males (83.7%) and 117 females (16.3%). Based on perioperative co-occurrence of TCMR and pneumonia after LT, patients were allocated into a co-occurrence group (93 cases) and a no co-occurrence group (624 cases). Biopsy-proven TCMR: 56 cases (accounting for 60.2% of total TCMR cases); clinically diagnosed TCMR: 37 cases (accounting for 39.8% of total TCMR cases). Demographic and clinical traits are listed in Table 1. Most variables showed comparable distributions between training and test sets (P > 0.05). However, the following variables demonstrated statistically significant differences (p < 0.05) between the training and testing cohorts: blood type, WBC, PLT, NEUT, TG, UA, CysC, CD8+, and Mg2+.
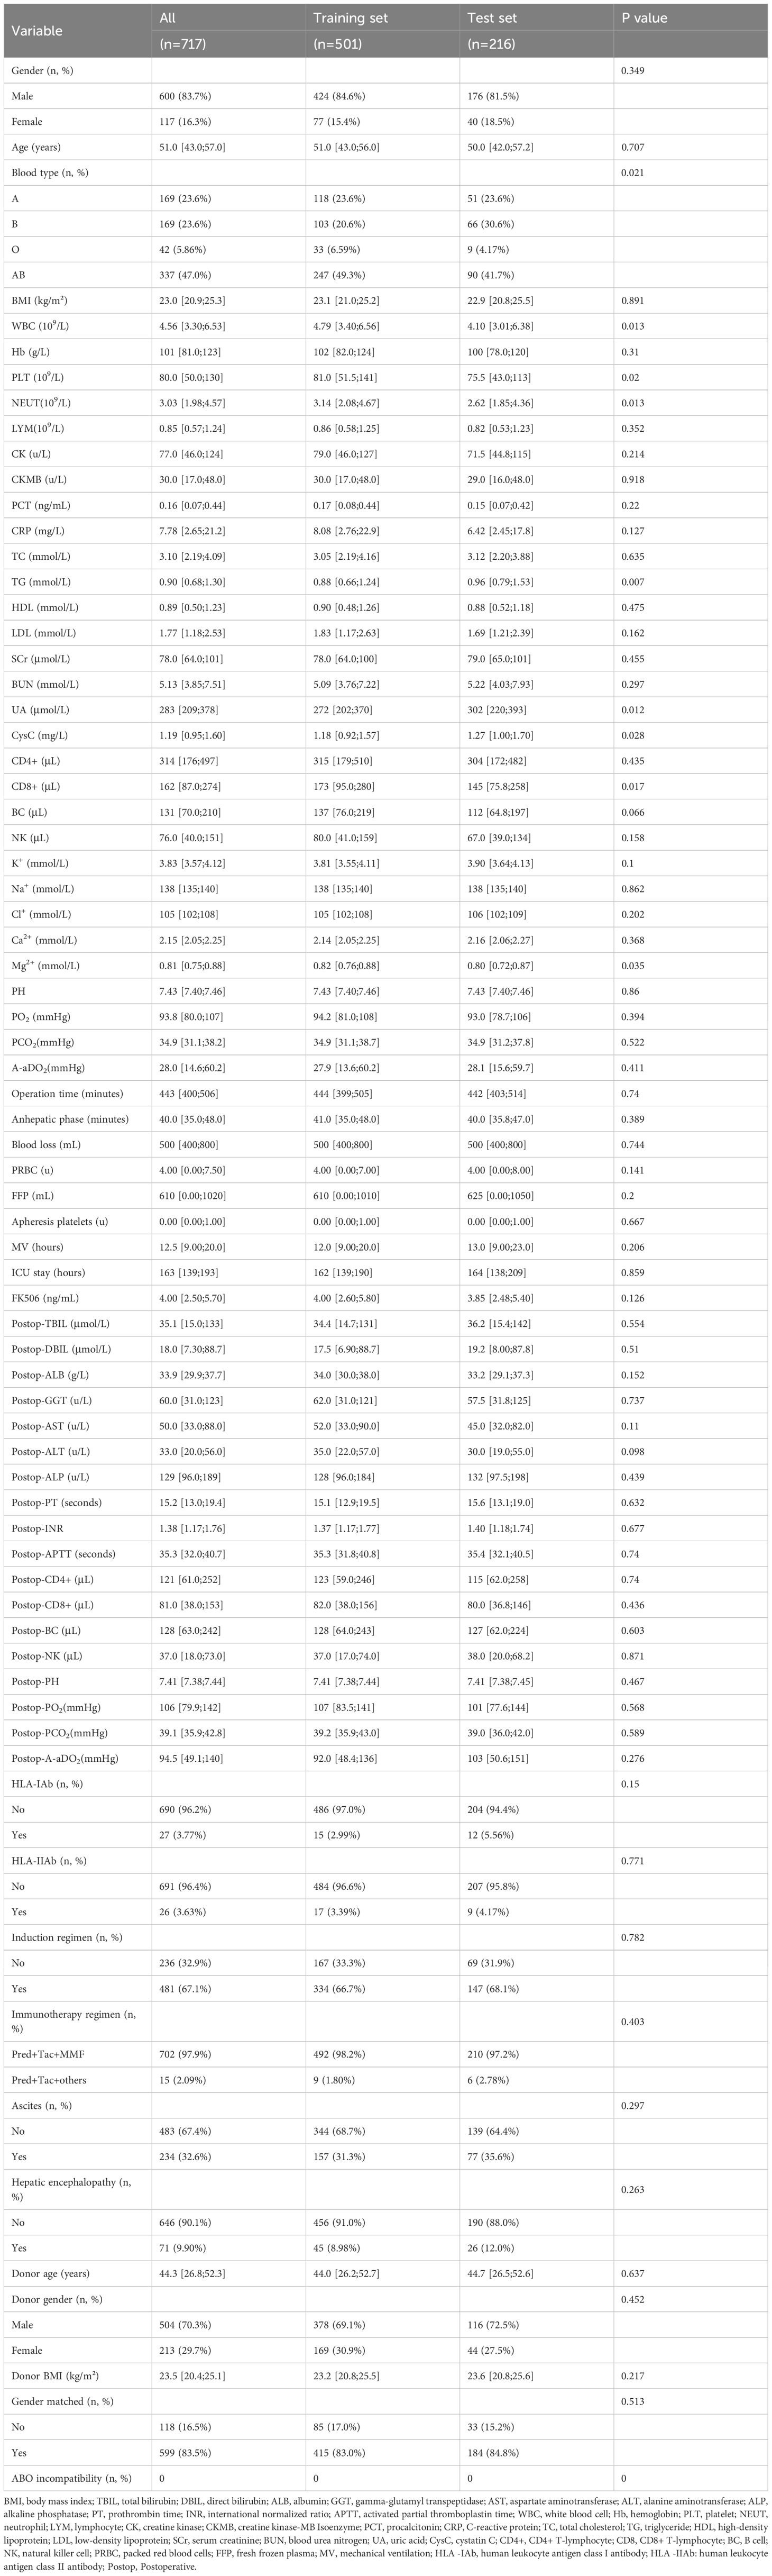
Table 1. Clinical characteristics of recipients.
Feature selection
LASSO regression analysis in the training cohort (70% of the total sample) identified postoperative DBIL, postoperative INR, HDL, postoperative ALT, NK, FK506, NA+, operative time, anhepatic phase, induction regimen, and ICU stay as significant predictors of perioperative co-occurrence TCMR and pneumonia (Figures 1A, B). These variables were subsequently integrated into ML algorithms to establish a robust prediction model.
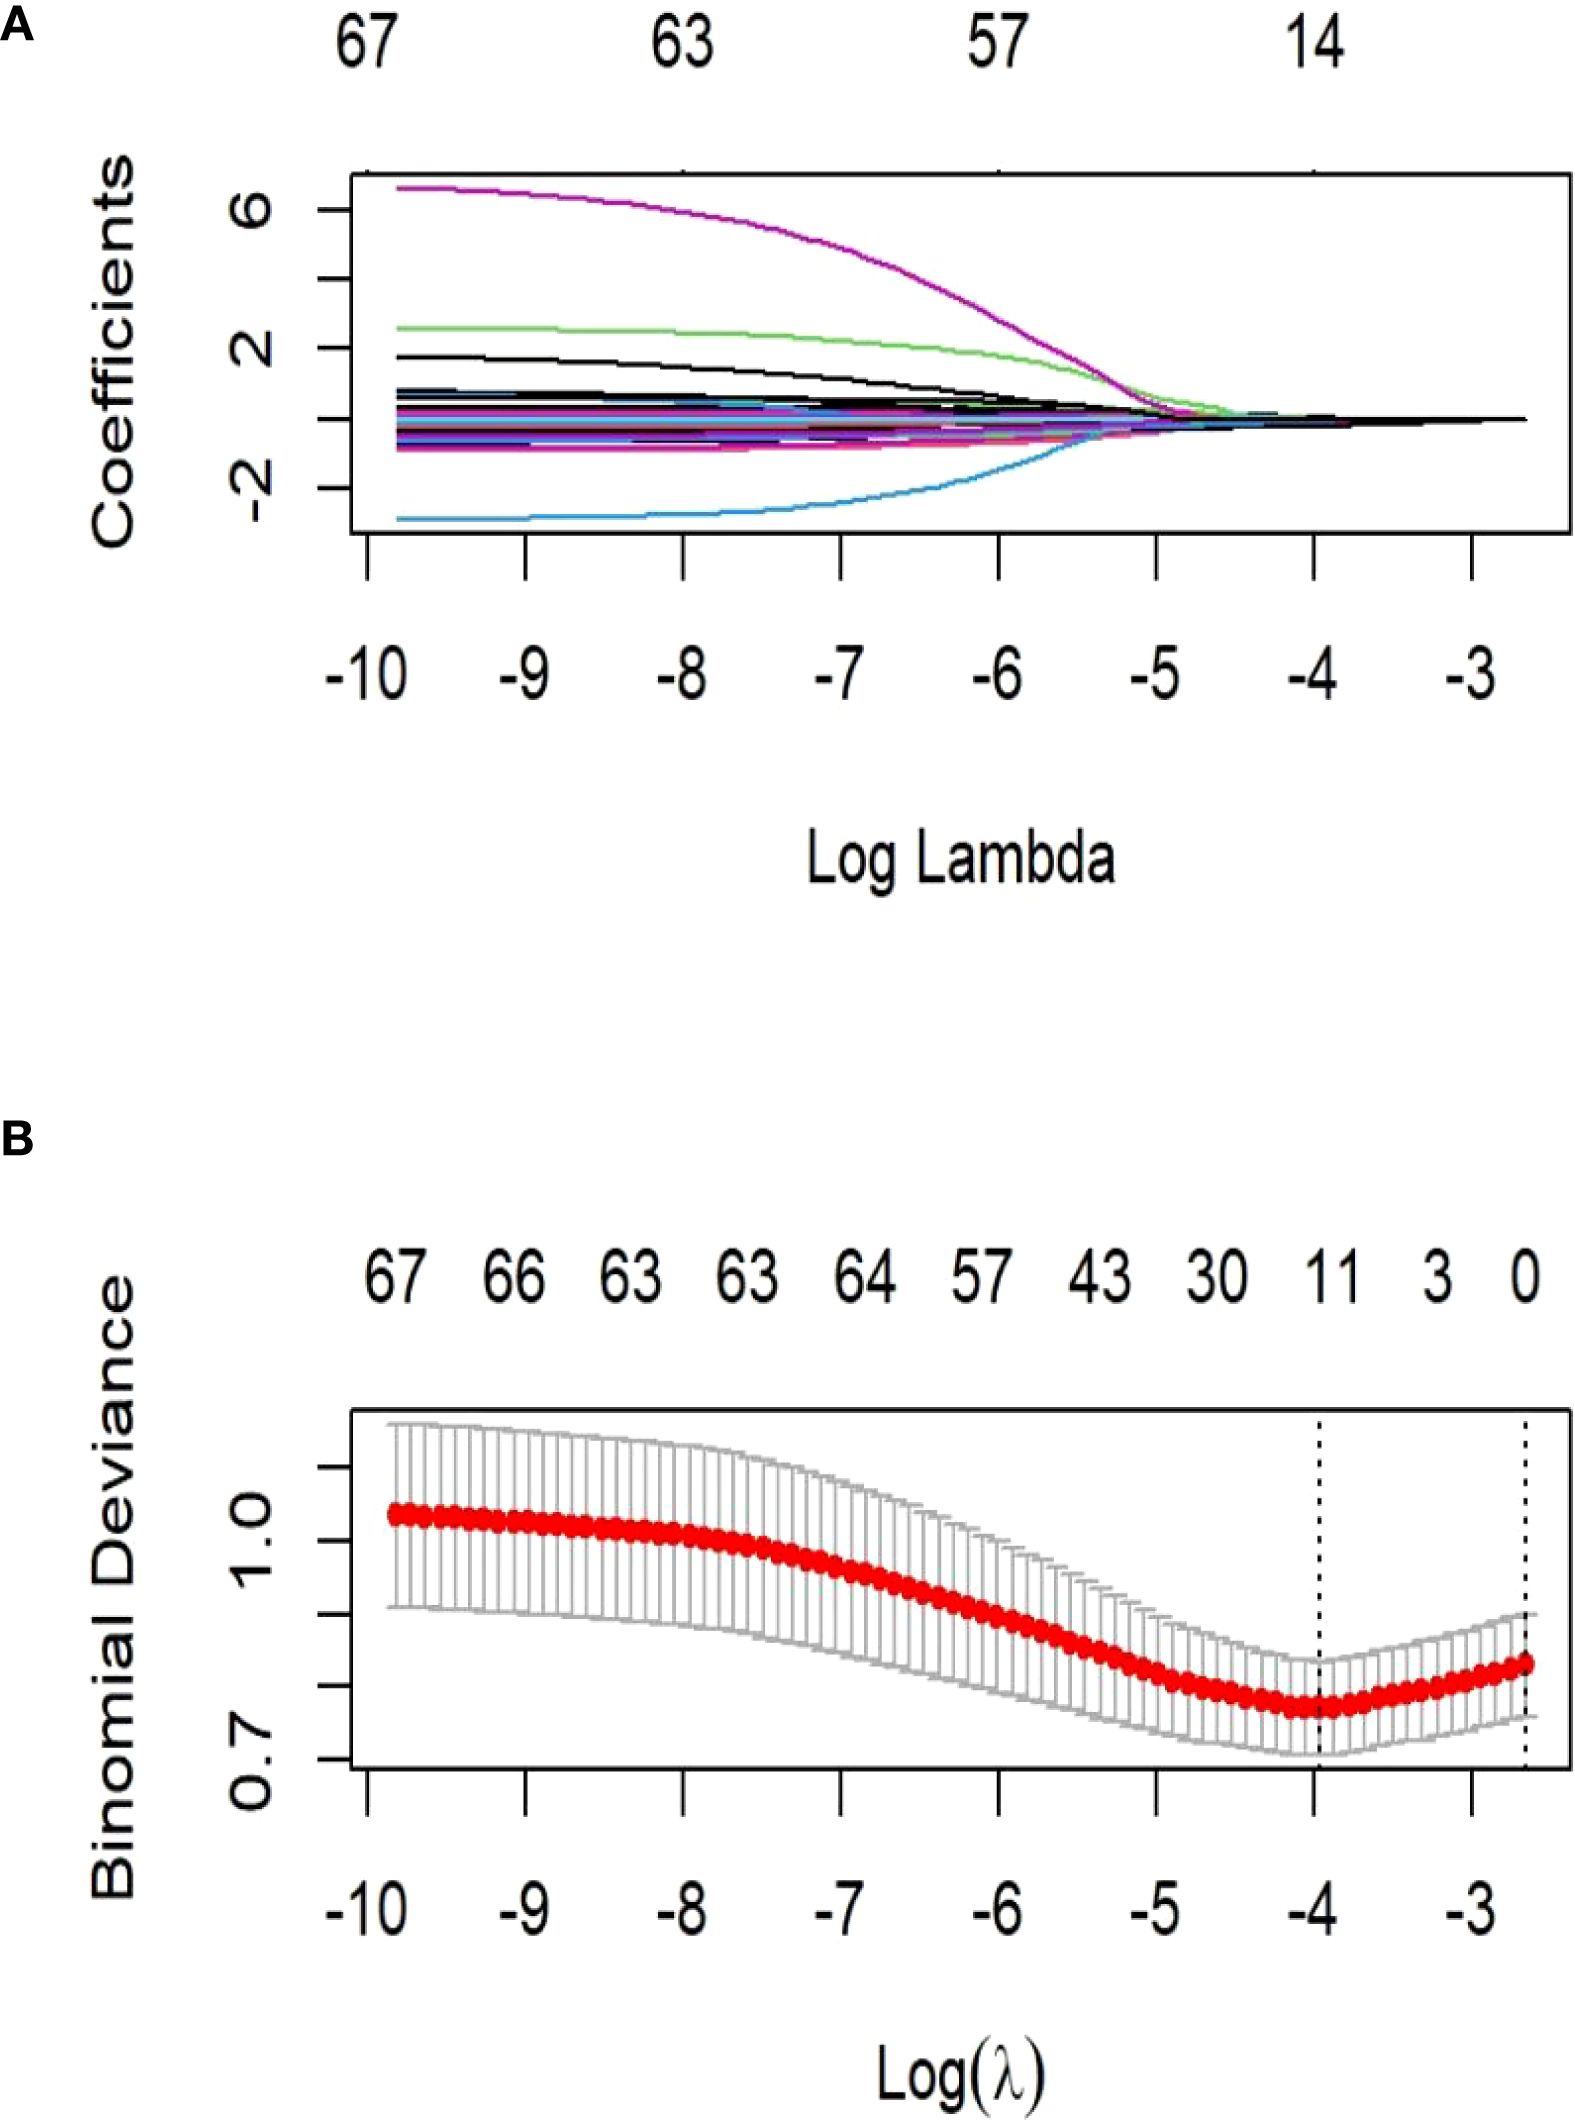
Figure 1. Demographic and clinical feature selection using the least absolute shrinkage and selection operator (LASSO) binary logistic regression model. (A) LASSO coefficient profiles of the 21 features. A coefficient profile plot was produced against the log (λ) sequence. The vertical line was drawn at the value selected using 10-fold cross-validation, where optimal resulted in 6 features with non-zero coefficients. (B) Tuning parameter (λ) selection in the LASSO model used 10-fold cross-validation via minimum criteria. The partial likelihood deviance (binomial deviance) curve was plotted versus log(λ).
Model performance assessment
To determine the optimal model for predicting perioperative co-occurrence TCMR and pneumonia, five distinct algorithms were compared. The predictive power of these models was comprehensively evaluated via ROC curves and AUC values. Results demonstrated that the SVM model consistently achieved superior AUC values of 0.881 (95% CI: 0.83–0.93) in the training dataset and 0.786 (95% CI: 0.69–0.88) in the test dataset, outperforming all other models (Figures 2A, B). Furthermore, additional binary classification metrics—including AUC, sensitivity, recall, specificity, accuracy, precision, and F1-score—were evaluated (Table 2). The SVM model exhibited statistically significant advantages across these metrics compared to alternative models (Figures 3A, B), further validating its predictive capability for co-occurrence TCMR and pneumonia.
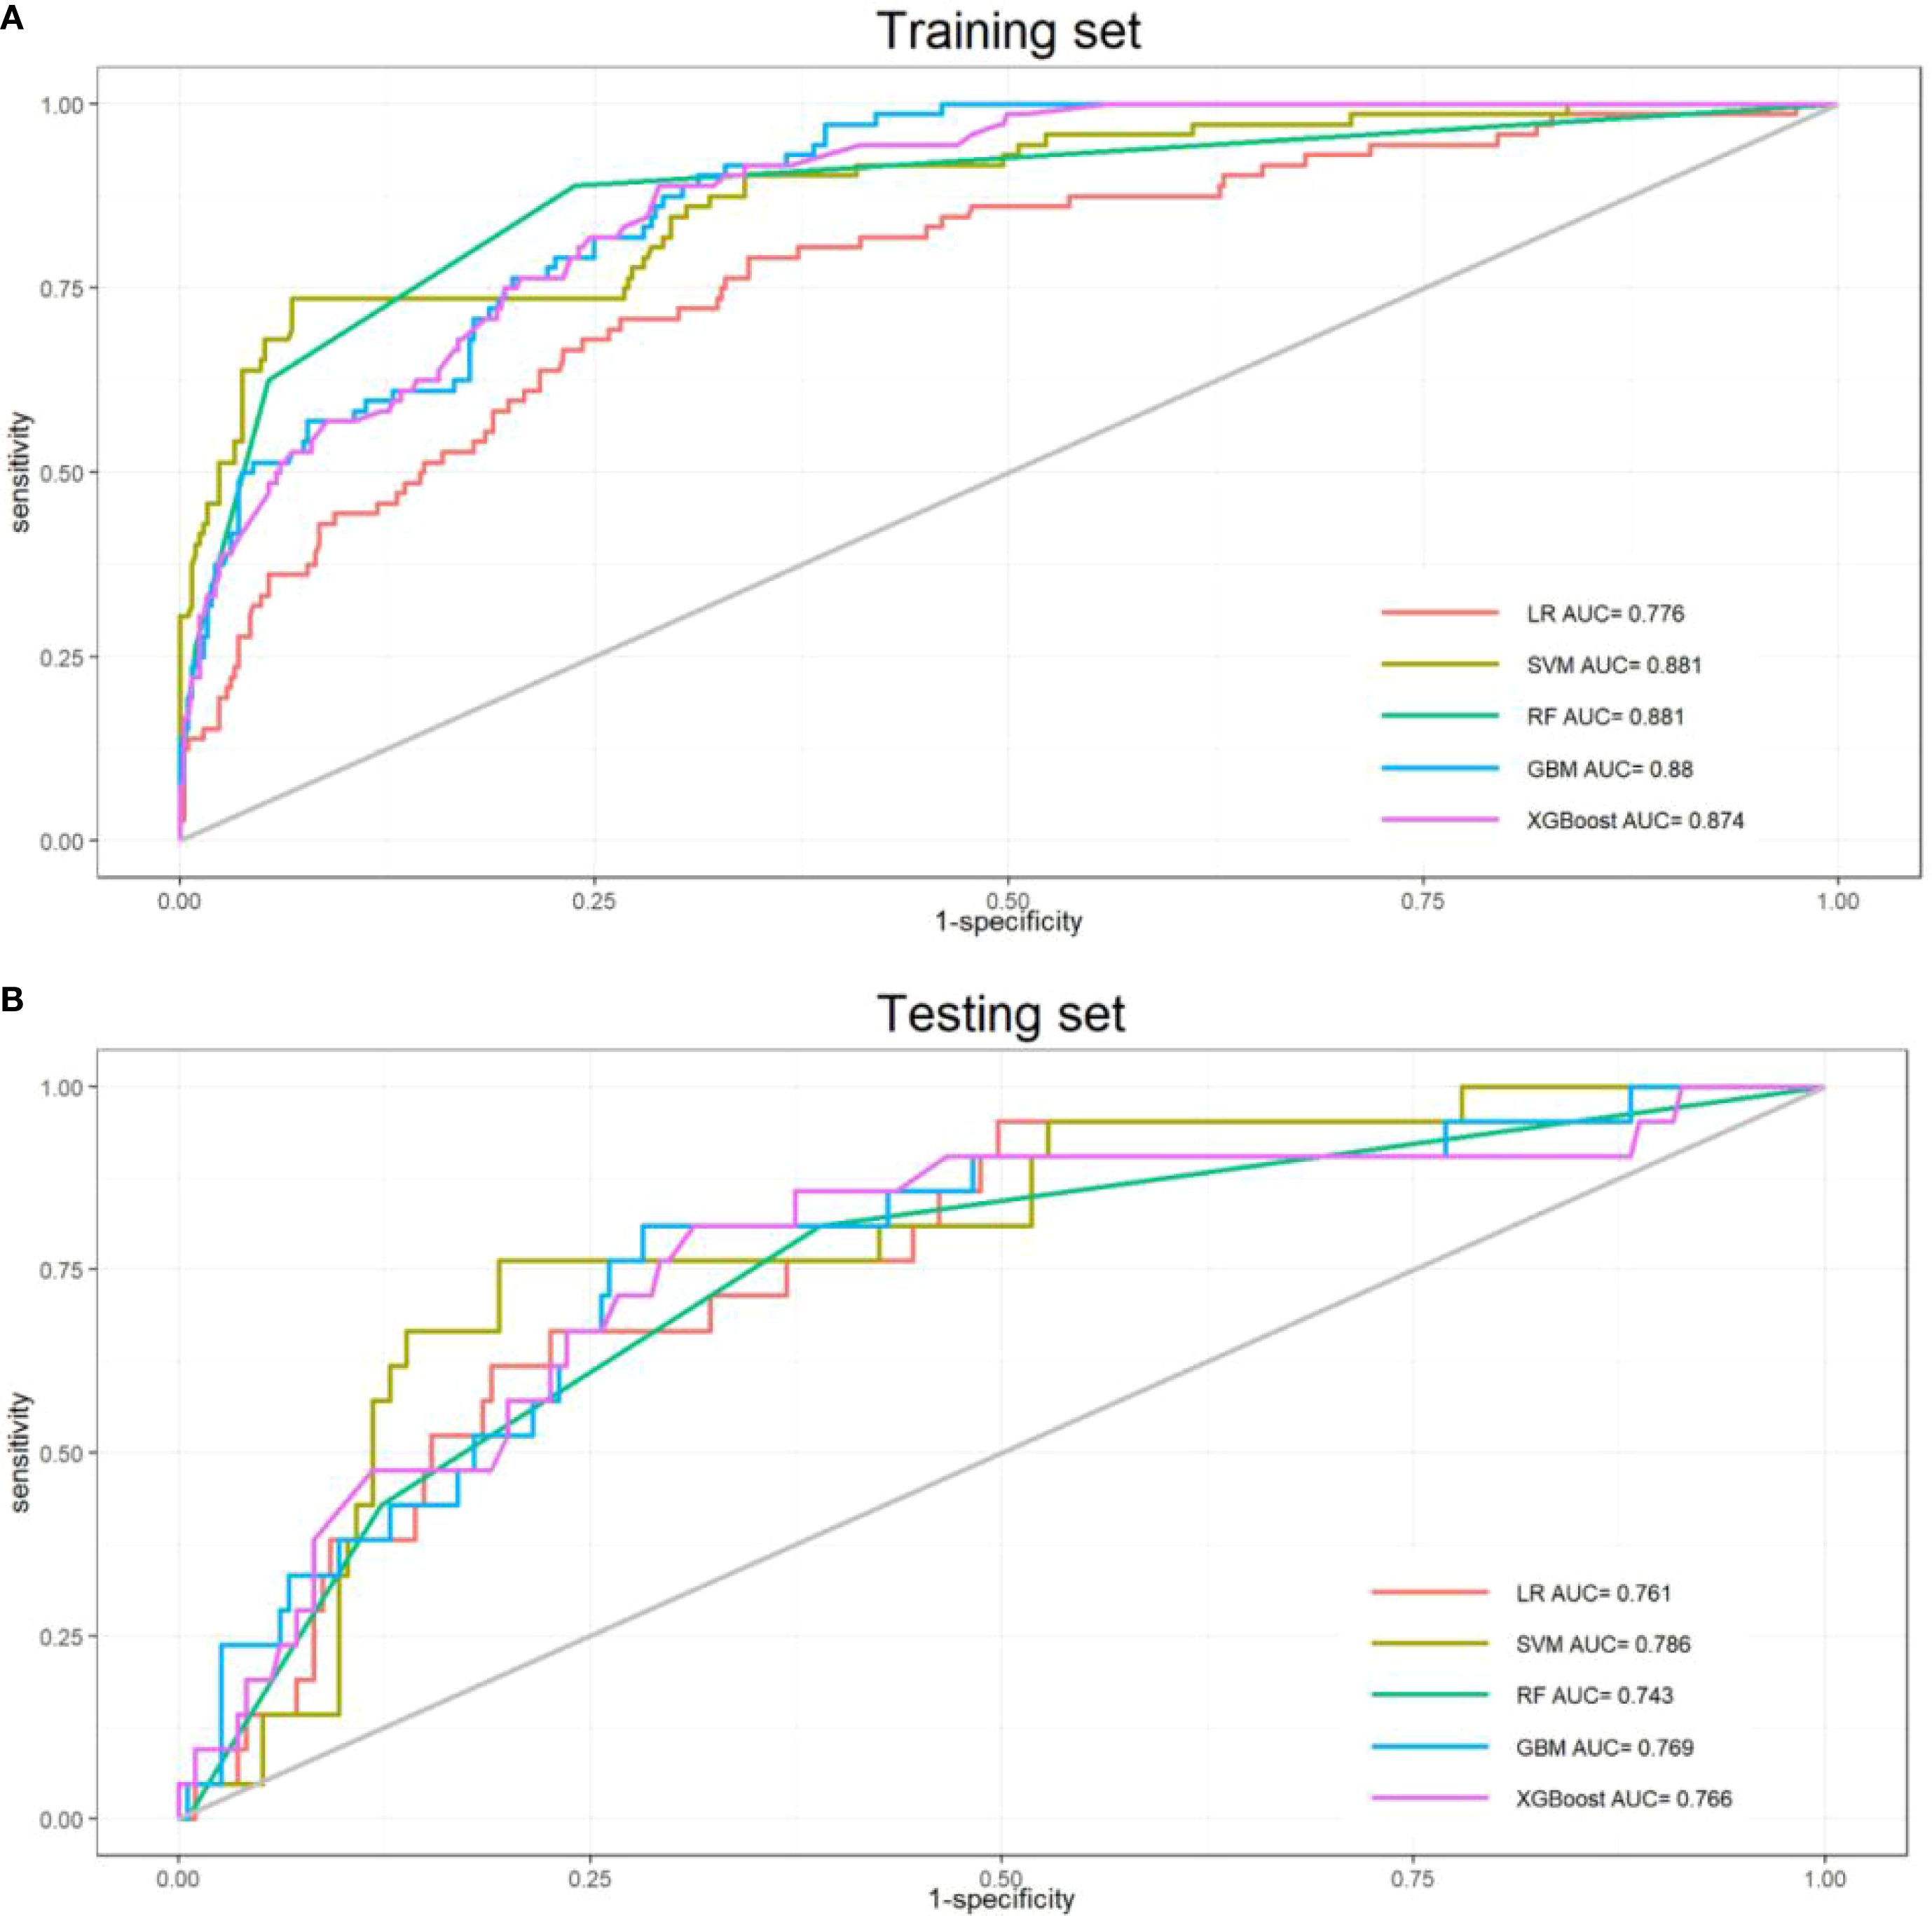
Figure 2. Receiver operating characteristic curves for the five models. (A)Training sets; (B) Test sets).
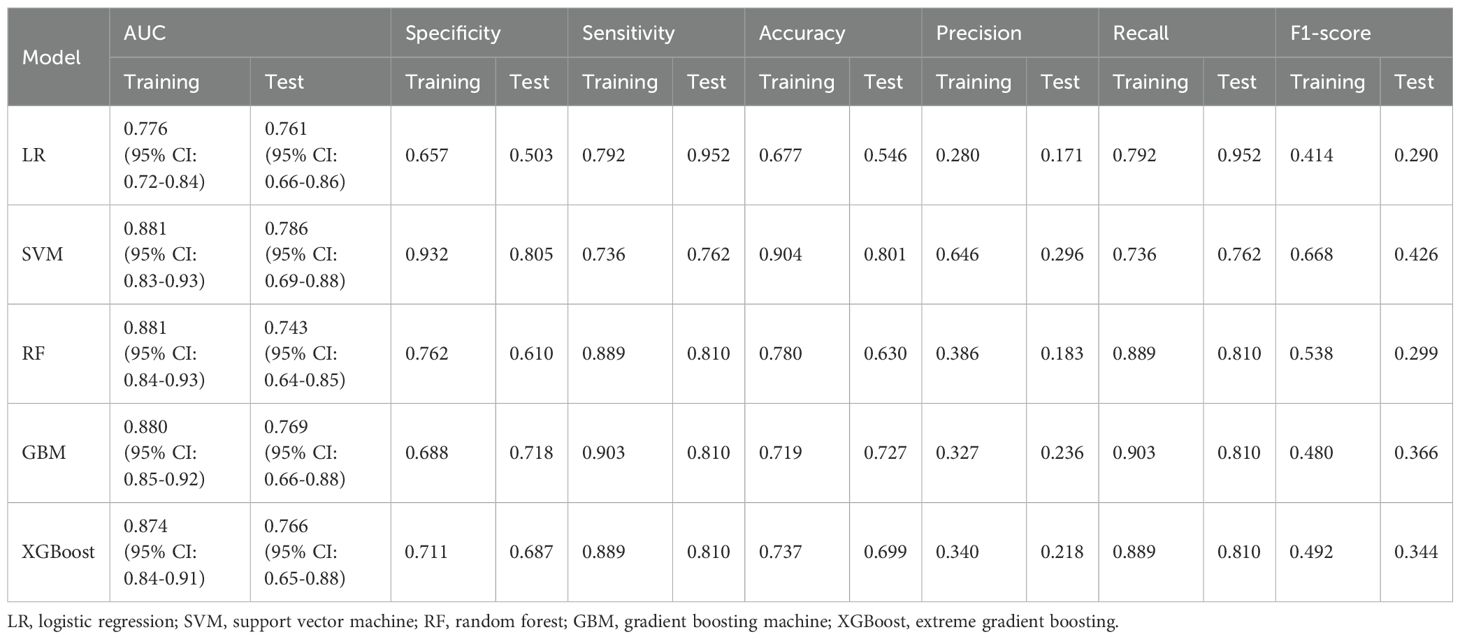
Table 2. Evaluating the predictive performance of each model.
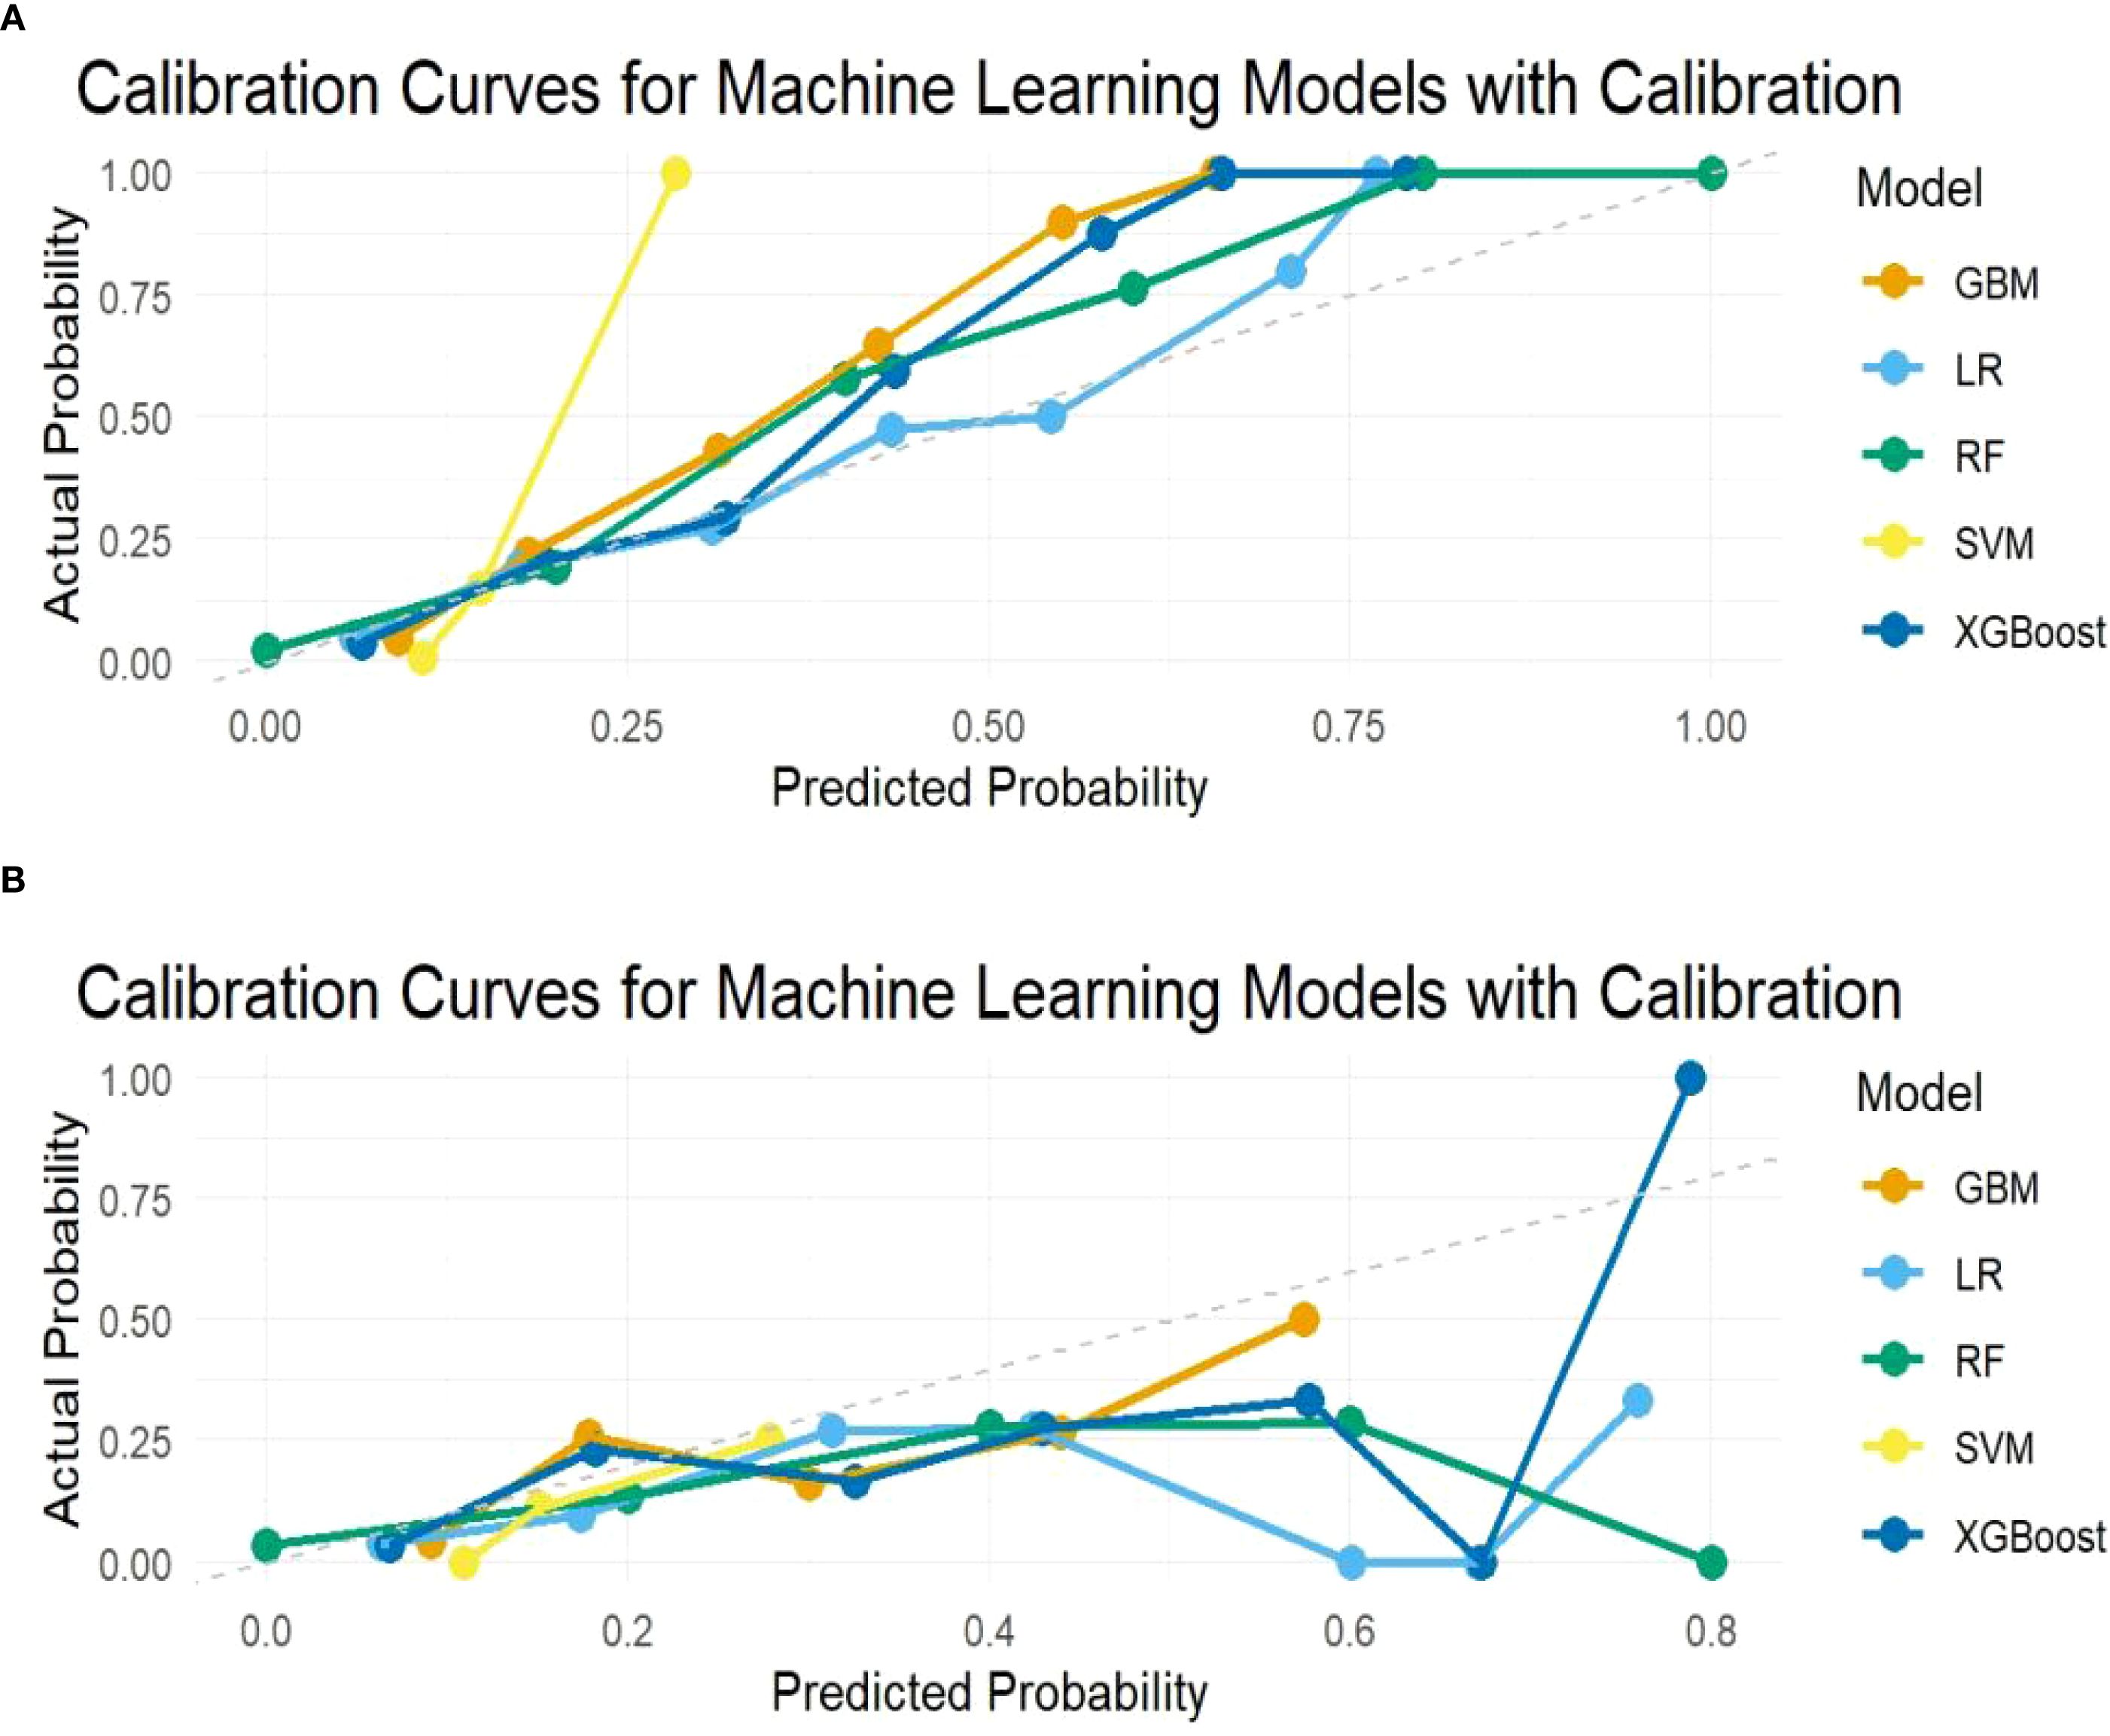
Figure 3. Calibration curves of the predicted probability. (A) Training sets; (B) Test sets.
Interpretability analysis
In the swarm diagram (Figure 4A), the horizontal axis was SHAP values, and the vertical axis demonstrated features. Each data point reflected a specific instance, with its position on the x-axis representing the SHAP value for a particular feature. The analysis identified FK506, ICU stay, operation time, and NK cell as the four most influential predictors (Figures 4A, B). Notably, NK cell exerted a negative effect on perioperative co-occurrence TCMR and pneumonia. To demonstrate the SHAP calculation process, representative samples were selected: one with a positive outcome prediction (Figure 5A) and one with a negative outcome prediction (Figure 5B). The SVM-derived SHAP plot illustrates feature contributions for two patients. Orange/purple bars denote positive/negative impacts, with actual values alongside SHAP values.
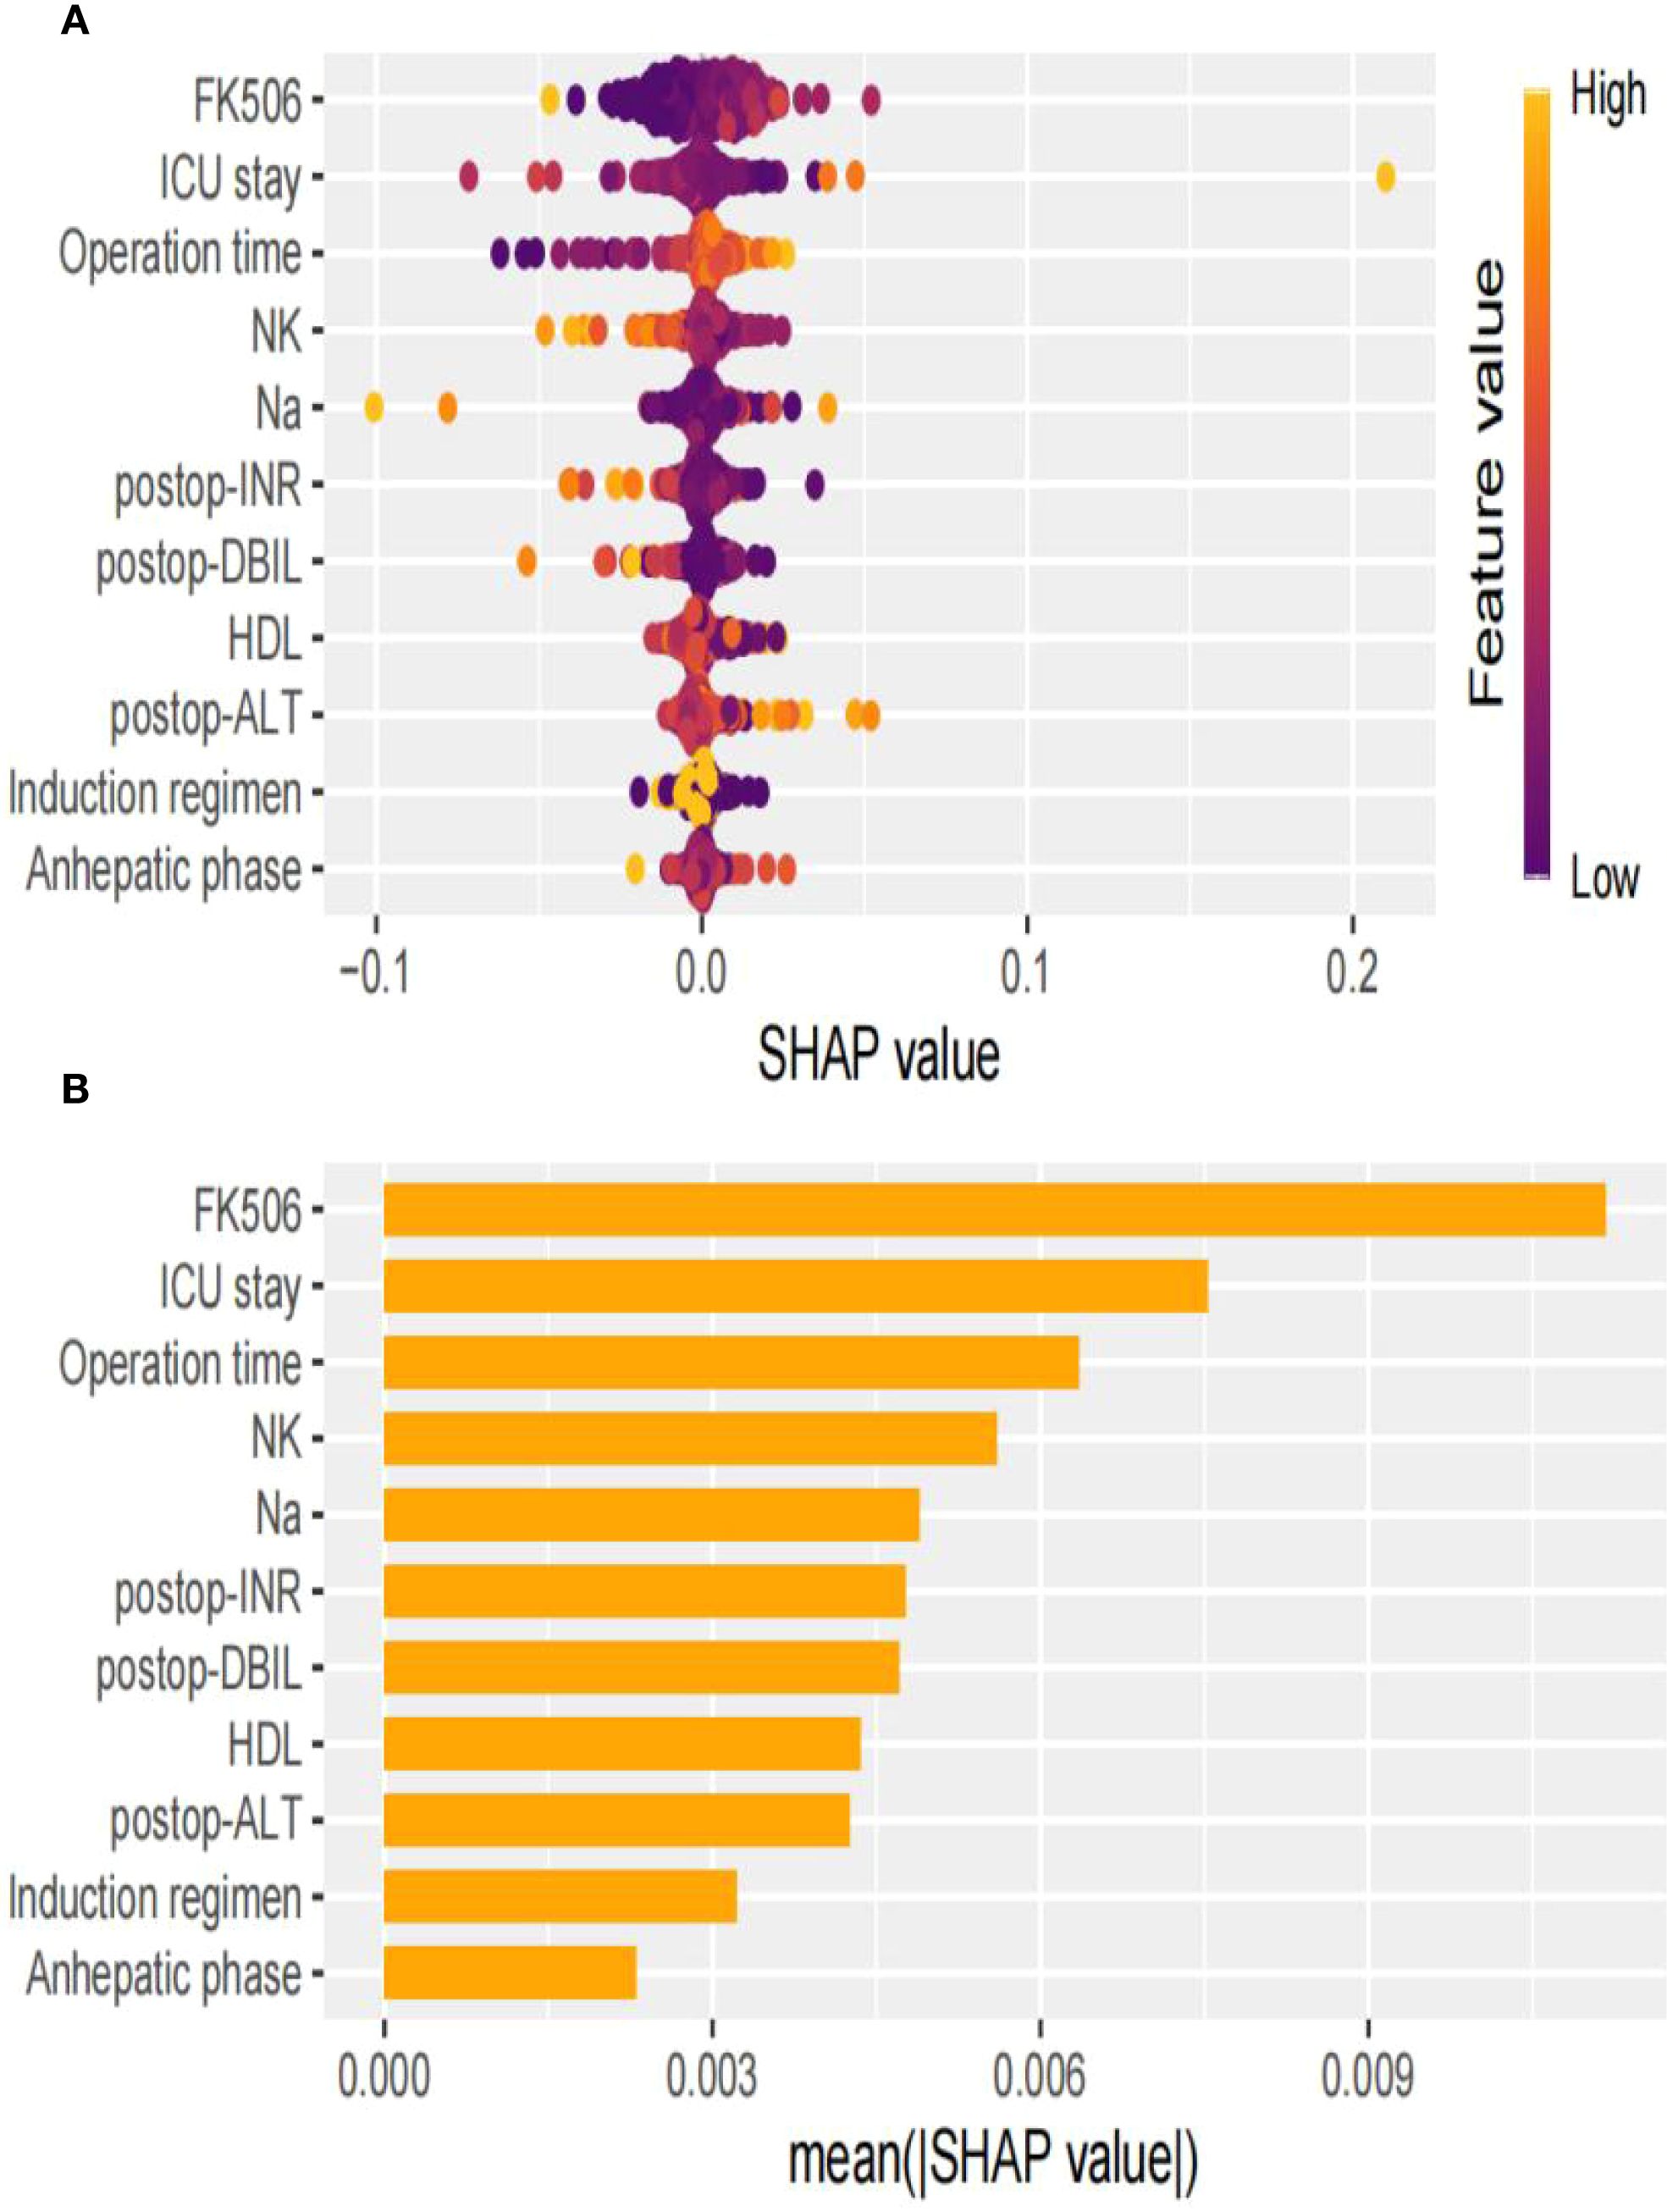
Figure 4. Visual explanation of perioperative co-occurrence of TCMR and pneumonia model based on SVM. (A) The SHapley Additive explanation; (B) Feature importance scores.
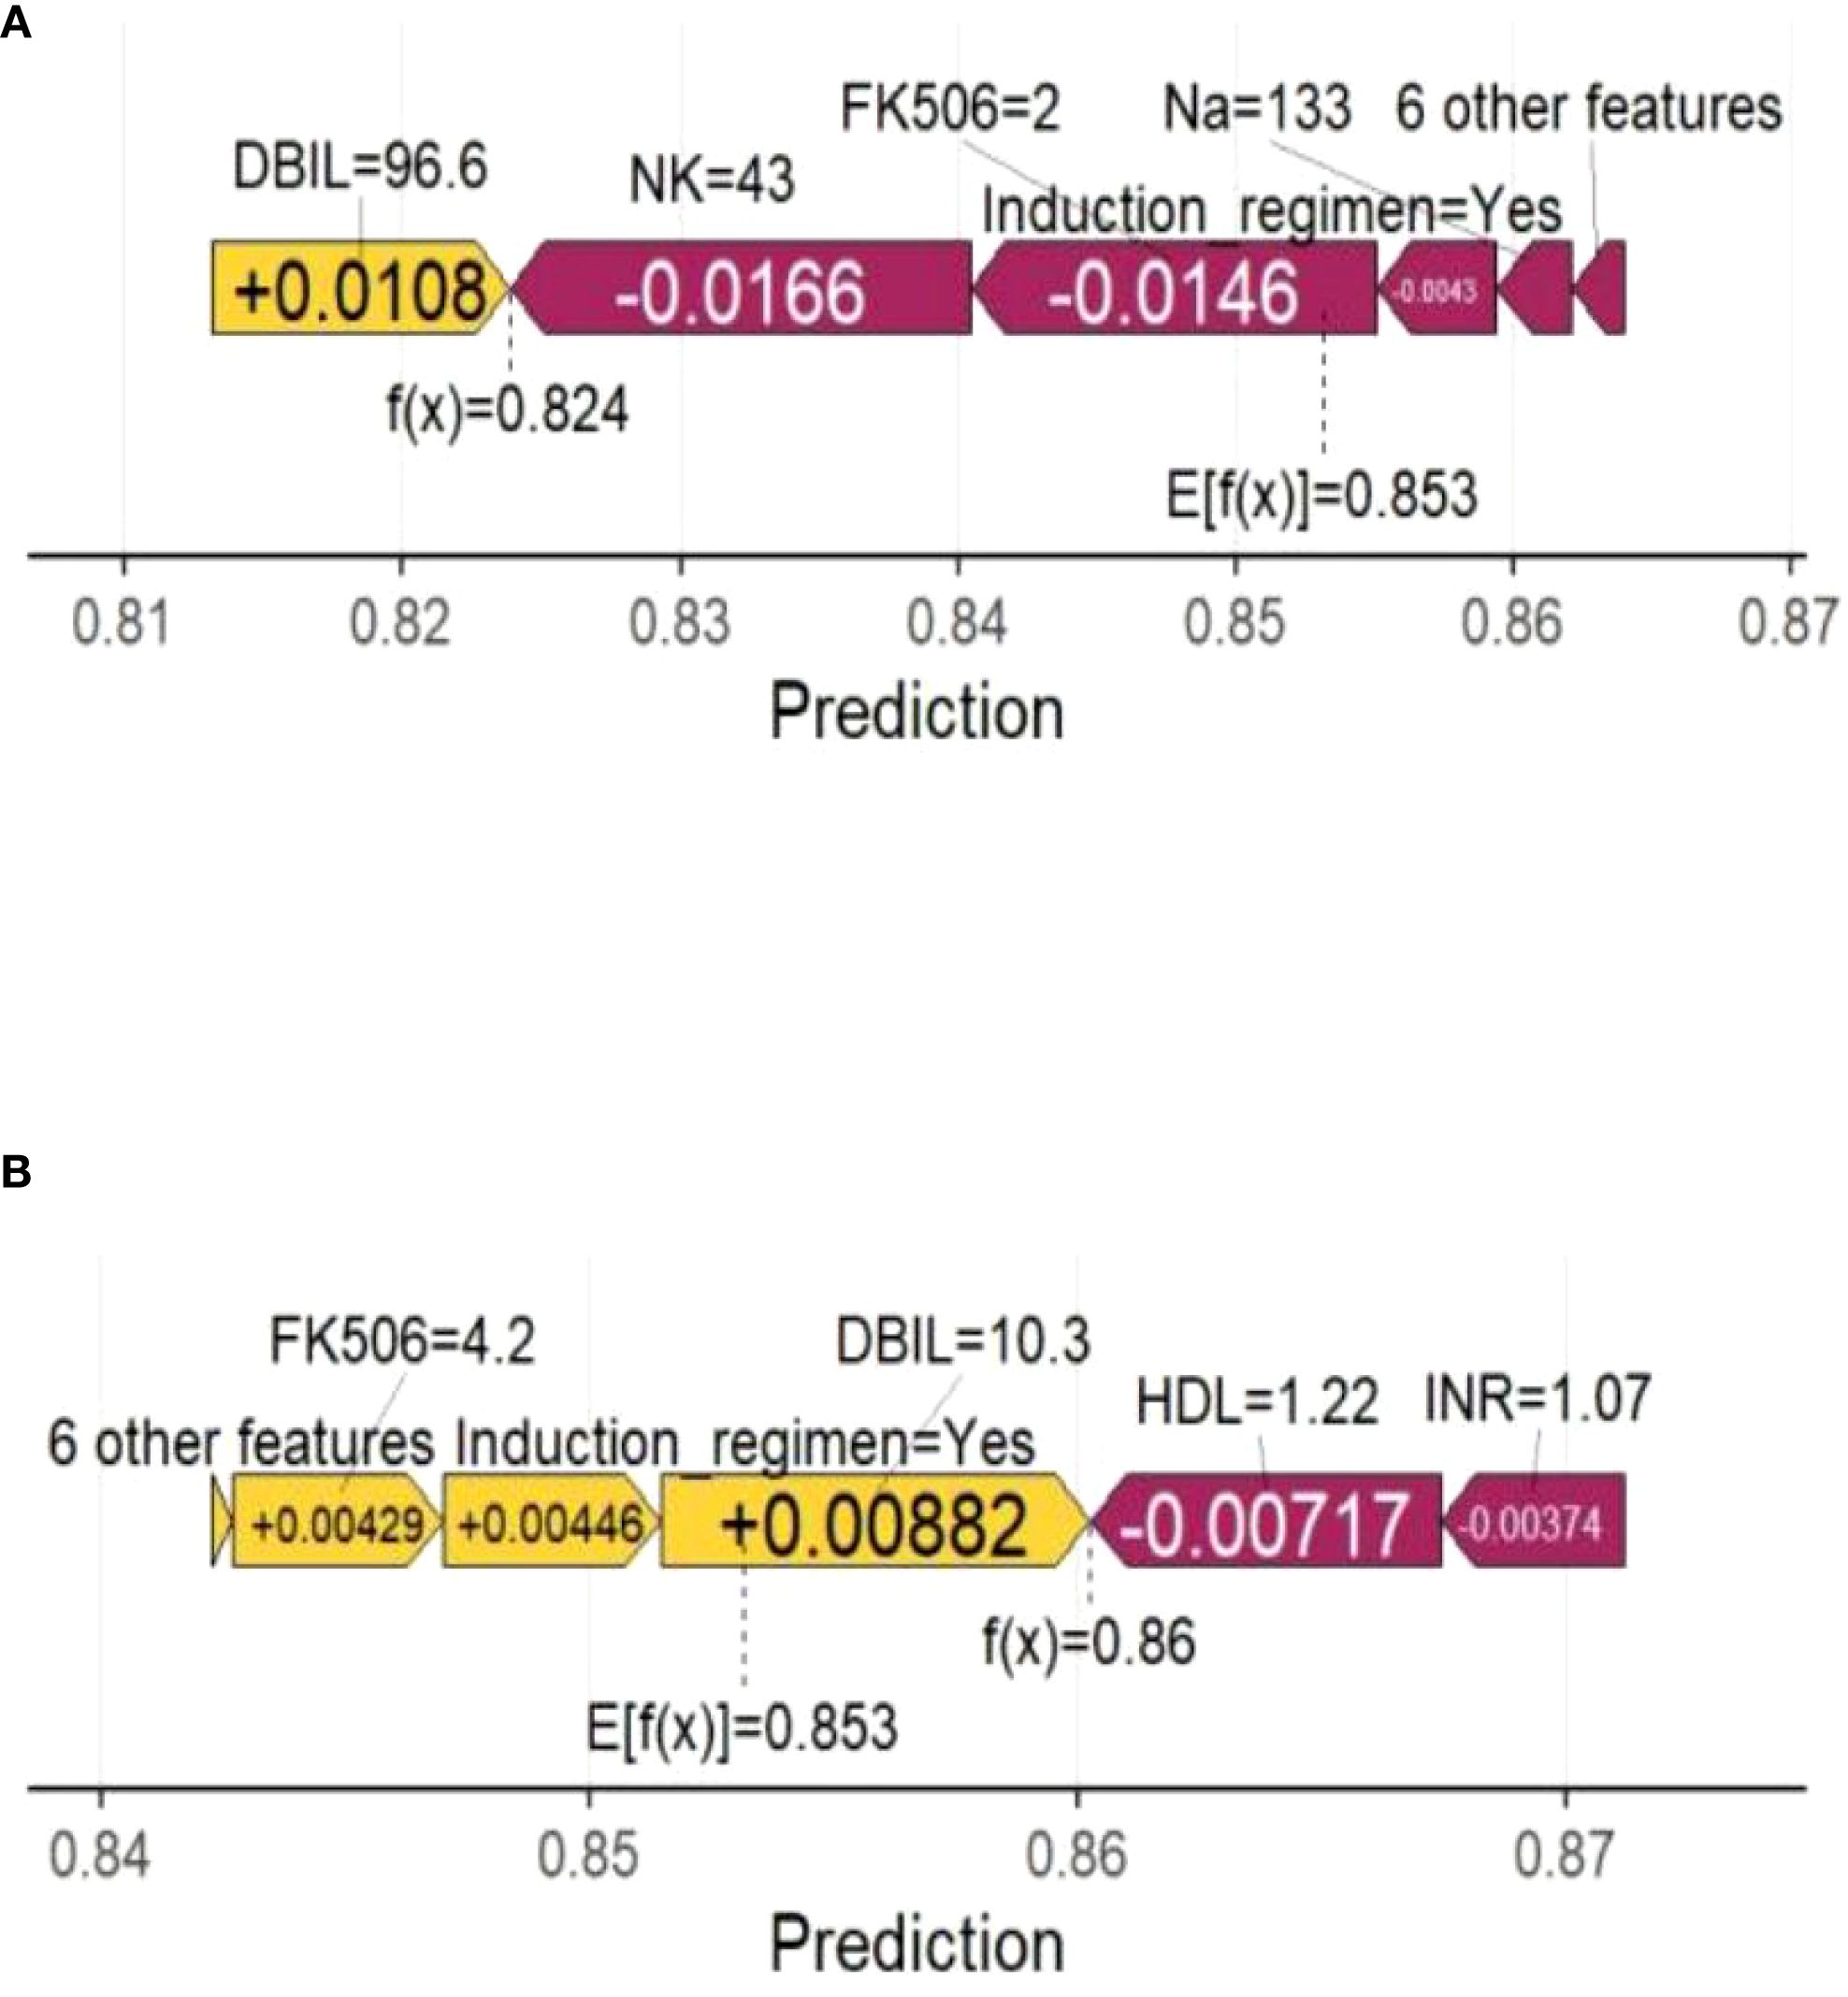
Figure 5. Force plot shows the contribution of each feature to the prediction result of using the SVM model. (A) One sample with a positive outcome prediction; (B) One sample with a negative outcome prediction. Orange bars indicate features that contribute positively to the prediction, while purple bars indicate negative contributions. Feature values are shown alongside their SHAP values.
Discussion
Accurate prediction of risk factors for perioperative co-occurrence TCMR and pneumonia following LT is critical for timely intervention and improved outcomes. This study focused on recipients undergoing LT and validated a predictive model for assessing the simultaneous occurrence of TCMR and pneumonia during the perioperative period. The model integrated preoperative clinical characteristics, immunological interventions, dynamic changes in surgical parameters, preoperative concurrent symptoms, postoperative clinical characteristics, and donor information utilizing multiple ML algorithms. Comparative analysis of ML models revealed that the SVM algorithm achieved the optimal predictive accuracy, with AUC values of 0.881 (95% CI: 0.83–0.93) in the training set and 0.786 (95% CI: 0.69–0.88) in the test set. Calibration demonstrated high predicted-observed risk concordance. Furthermore, the SVM model demonstrated a high specificity, sensitivity, and F1 score. These findings indicate that ML models incorporating recipient-specific multidimensional data can effectively stratify perioperative co-occurrence TCMR and pneumonia, offering actionable insights for optimizing clinical decision-making and postoperative management.
The comparative analysis demonstrated the substantial advantage of ML models in prediction tasks (15, 20, 21). Torres et al. developed a machine learning-based model (K-prototype clustering algorithm) to predict post-liver transplant complications including acute rejection and infection, demonstrating favorable performance (22). This advantage can be attributable to ML’s ability to cope with complex data through advanced regularization techniques and ensemble learning mechanisms (23). Particularly, ML exhibits higher accuracy in capturing non-linear relationships, suggesting that statistical models may simplify complex biomedical interactions. Previous studies predominantly rely on clinical experience for variable selection, have confirmed the utility of ML in predicting TCMR or pneumonia prediction (17, 18). In contrast, this study integrated preoperative and postoperative clinical characteristics, immunological interventions, preoperative concurrent symptoms, donor information, and dynamic changes in surgical procedures to objectively identify key predictors (postoperative DBIL, postoperative INR, postoperative ALT, HDL, NK, FK506, Na+, operative time, anhepatic phase, induction regimen, and ICU stay) through LASSO regression. These predictors originated from objective data. A ML-based predictive model for perioperative co-occurrence TCMR and pneumonia following LT was subsequently developed.
As the most critical predictor in this model, the blood concentration of FK506 is paramount for preventing graft rejection and reducing the risk of infection, particularly pneumonia (24). A delicate therapeutic balance exists between these competing outcomes. FK506 suppresses the cellular immune response against the hepatic allograft primarily by inhibiting T-lymphocyte activation and proliferation, achieved through blockade of key cytokine transcription, including interleukin-2 (25). Subtherapeutic concentrations result in insufficient immunosuppression, failing to adequately inhibit recipient T-cell recognition and attack of the donor liver. This predisposes patients to acute cellular rejection, manifested by abnormal liver function tests (elevated transaminases and bilirubin). Severe or recurrent rejection episodes can lead to graft dysfunction or loss (5). Conversely, supratherapeutic concentrations, while theoretically offering enhanced rejection prophylaxis, incur significant costs: a marked increase in drug toxicity (26) and the risk of severe infections (27). Consequently, indiscriminately maintaining excessively high concentrations solely to achieve “absolute rejection avoidance” is clinically contraindicated, as the associated risks substantially outweigh potential benefits. FK506 exhibits a narrow therapeutic index between effective immunosuppression (preventing rejection) and toxic concentrations (predisposing to infection/toxicity) (28). Furthermore, significant interindividual variability in blood concentrations arises due to factors influencing drug metabolism, including genetics (e.g., CYP3A5 polymorphisms), age, hepatic and renal function, diet, and concomitant medications (29). Regular monitoring of FK506 trough levels is therefore fundamental. Based on these results, alongside individual rejection risk, infection susceptibility, and manifestations of drug toxicity, transplant clinicians must dynamically titrate the dosage through an individualized approach. The therapeutic goal is to maintain concentrations within a target range that effectively prevents rejection while minimizing the risks of infection and drug-related toxicity (27). ICU stay is also a significant predictor variable in our study. The duration of ICU hospitalization following LT serves as a critical indicator reflecting surgical complexity, graft functional recovery, severity of early complications, and the patient’s overall clinical status. While prolonged ICU stay itself is not a direct cause of rejection or pneumonia, it is strongly associated with and significantly increases the risk of developing both severe complications, with complex interactions existing between them. Prolonged ICU hospitalization is a well-established, highly significant independent risk factor for hospital-acquired pneumonia (30, 31). It is generally not the initiating cause of rejection; rather, severe rejection is often one of the primary factors leading to extended ICU stay. Furthermore, the complexity of the ICU environment and the patient’s critical condition significantly increase the difficulty of maintaining effective and stable immunosuppression, thereby indirectly elevating the risk of TCMR both during the ICU stay and shortly after transfer out of the ICU. Immunosuppression management poses substantial challenges in patients requiring protracted ICU care. In summary, the interplay between ICU length of stay, rejection, and pneumonia frequently establishes a vicious cycle. Severe rejection episodes often necessitate ICU admission and prolong hospitalization. The ICU environment and associated risk factors markedly increase the susceptibility to pneumonia (32). Severe pneumonia, in turn, necessitates reduction or discontinuation of immunosuppressive therapy to control the infection. Inadequate immunosuppression subsequently triggers rejection episodes or exacerbates existing rejection, thus creating a self-perpetuating cycle of adverse events. Operative time is also recognized as a significant predictive factor. Prolonged surgical time typically correlates with an extended anhepatic phase and increased total ischemic time. Sustained ischemia-reperfusion injury (IRI) leads to hepatic sinusoidal endothelial cell damage and microcirculatory disturbances, triggering the substantial release of damage-associated molecular patterns (33, 34). These damage-associated molecular patterns robustly activate the innate immune system, characterized by macrophage and neutrophil infiltration, and complement activation, resulting in the release of large quantities of pro-inflammatory cytokines (35). Damaged hepatocytes and endothelial cells exhibit upregulated expression of MHC molecules and co-stimulatory molecules (36), rendering them more recognizable as “non-self” by the recipient’s immune system. This facilitates the accelerated presentation of donor antigens to recipient T cells (37). Although the liver possesses inherent immunotolerance properties, severe IRI disrupts this microenvironment (38), significantly increasing the incidence and severity of early acute cellular rejection (39). Furthermore, prolonged operative duration is often associated with greater blood loss and substantial transfusion requirements. Allogeneic blood transfusion can induce complex immunomodulatory effects. It may also increase the risk of alloimmunization, including rejection directed against the graft, potentially through the introduction of allogeneic leukocyte antigens or by activating the recipient’s immune system (40). Extended operative time is a strong independent risk factor for postoperative pneumonia. A direct and well-established mechanistic link involves its association with longer durations of mechanical ventilation and an increased risk of pulmonary atelectasis (41). NK cells emerged as the fourth most important predictive variable in this study, exhibiting a negative regulatory role in the co-occurrence of TCMR and pneumonia. NK cells possess the ability to recognize and lyse virus-infected cells without requiring presensitization. They induce target cell apoptosis either through the release of perforin and granzymes or via the Fas ligand (FasL)/Fas pathway (42). Activated NK cells robustly secrete interferon-gamma and tumor necrosis factor-alpha. These cytokines not only exert direct antiviral effects (43) but also recruit neutrophils, monocytes/macrophages, and T cells to the site of infection, thereby amplifying the anti-infection immune response. Furthermore, NK cells can mediate antibody-dependent cellular cytotoxicity via FcγRIIIa (CD16a), enabling more effective killing of infected cells (44). In summary, insufficient NK cell counts can directly contribute to the development of perioperative pneumonia following LT. Viral infections themselves, particularly cytomegalovirus infection, constitute a significant risk factor for rejection (45). This creates a complex interplay: on the one hand, viral infection activates NK cells to combat the virus; on the other hand, cytokines like IFN-γ secreted by activated NK cells may simultaneously promote rejection. Conversely, the inflammation and tissue damage caused by rejection reactions also heighten the risk of infection.
This paper demonstrated that ML models could predict perioperative co-occurrence TCMR and pneumonia following LT. ML models exhibit superior abilities to capture complex, non-linear relationships and intricate interactions among clinical variables compared to traditional methods, thus offering valuable insights into individual patient risk profiles. This information can potentially inform personalized treatment strategies, optimize post-LT surveillance protocols, and ultimately improve patient outcomes.
Clinical significance
The machine learning-based multidimensional prediction model (utilizing the SVM algorithm) developed and validated in this study holds paramount clinical value by providing a robust tool for the precise prevention and individualized management of TCMR-pneumonia comorbidity during the perioperative period following LT. Upon successful integration into the hospital’s electronic medical record (EMR) system as a clinical decision support system, this model empowers clinicians to implement preemptive alerts, accurate diagnosis, and early personalized interventions for high-risk patients. This effectively disrupts the vicious cycle of TCMR-pneumonia comorbidity, ultimately improving the prognosis of LT recipients and substantially alleviating familial and societal burdens. These outcomes demonstrate the transformative potential of AI-driven precision medicine in managing complex postoperative complications.
Real-time risk surveillance and early warning: the model’s core strength lies in its integration of critical, dynamically changing clinical indicators. Once deployed, the system automatically and continuously retrieves real-time data from the EMR, including: dynamic monitoring of FK506 blood concentration, dynamic assessment of immune cell function, dynamic evolution of liver function and coagulation parameters, surgical parameter retrospectives, and ICU length of stay. This dynamic data continuously updates risk assessments. Risk stratification based on predictive modeling: leveraging the integrated SVM algorithm, the system comprehensively analyzes the aforementioned real-time multidimensional data to compute an individualized risk score for current TCMR-pneumonia comorbidity occurrence. Patients are then automatically stratified into predefined risk tiers based on preset thresholds. Early identification and targeted intervention for high-risk patients: the explicit early-warning signals provided by the system offer clinicians precise diagnostic directionality. These alerts heighten clinical vigilance regarding potential comorbidity, prompting physicians to combine model outputs with specific patient presentations and necessary ancillary tests for accurate diagnosis at the disease’s earliest stage. Early diagnosis is prerequisite for effective intervention; for TCMR, warnings enable prompt judicious adjustment of immunosuppressive regimens.
Limitations
There are also limitations. The single-center retrospective design may introduce selection bias, despite efforts to adjust for known confounders through multivariate analysis. Additionally, the primary limitation of this study is the absence of external validation on an independent, multi-center, large-scale cohort. This constraint impedes comprehensive assessment of our model’s generalizability at this stage and its immediate clinical applicability.
Conclusions
This study developed a robust predictive model for perioperative co-occurrence TCMR and pneumonia in LT, and the SVM model achieved superior discriminative performance. Key predictors, including postoperative DBIL, postoperative INR, HDL, postoperative ALT, NK, FK506, Na+, operative time, anhepatic phase, induction regimen, and ICU stay, were identified as critical determinants of model. These results advance our understanding of the multifactorial pathogenesis of perioperative co-occurrence TCMR and pneumonia after LT, offering actionable insights for optimizing clinical decision-making and postoperative management.
Data availability statement
The original contributions presented in the study are included in the article/Supplementary Material. Further inquiries can be directed to the corresponding author.
Ethics statement
The studies involving humans were approved by Institutional Review Board of the hospital (Approval No.: 2019(KY-0113)). The studies were conducted in accordance with the local legislation and institutional requirements. The participants provided their written informed consent to participate in this study.
Ethical approval statement
The study was conducted in accordance with both the Declarations of Helsinki and Istanbul and the study protocol was ratified by the Institutional Review Board of the hospital (Approval No.: 2019(KY-0113)), and written informed consent was obtained from all participants.
Author contributions
XS: Formal analysis, Funding acquisition, Project administration, Resources, Supervision, Writing – review & editing. JS: Data curation, Formal analysis, Investigation, Methodology, Software, Validation, Writing – original draft, Writing – review & editing. GZ: Data curation, Formal analysis, Software, Validation, Visualization, Writing – review & editing. QL: Conceptualization, Data curation, Formal analysis, Methodology, Visualization, Writing – review & editing. NW: Conceptualization, Investigation, Methodology, Software, Supervision, Writing – review & editing. HL: Conceptualization, Data curation, Project administration, Resources, Supervision, Validation, Visualization, Writing – review & editing.
Funding
The author(s) declare financial support was received for the research and/or publication of this article. The study was supported by National Key Research and Development Program of China (2023YFC2505900), Guangxi Key Research and Development Program (AB24010059).
Conflict of interest
The authors declare that the research was conducted in the absence of any commercial or financial relationships that could be construed as a potential conflict of interest.
Generative AI statement
The author(s) declare that no Generative AI was used in the creation of this manuscript.
Any alternative text (alt text) provided alongside figures in this article has been generated by Frontiers with the support of artificial intelligence and reasonable efforts have been made to ensure accuracy, including review by the authors wherever possible. If you identify any issues, please contact us.
Publisher’s note
All claims expressed in this article are solely those of the authors and do not necessarily represent those of their affiliated organizations, or those of the publisher, the editors and the reviewers. Any product that may be evaluated in this article, or claim that may be made by its manufacturer, is not guaranteed or endorsed by the publisher.
Supplementary material
The Supplementary Material for this article can be found online at: https://www.frontiersin.org/articles/10.3389/fimmu.2025.1648993/full#supplementary-material
Abbreviations
BMI, body mass index; TBIL, total bilirubin; DBIL, direct bilirubin; ALB, albumin; GGT, gamma-glutamyl transpeptidase; AST, aspartate aminotransferase; ALT, alanine aminotransferase; ALP, alkaline phosphatase; PT, prothrombin time; INR, international normalized ratio; APTT, activated partial thromboplastin time; WBC, white blood cell; Hb, hemoglobin; PLT, platelet; NEUT, neutrophil; LYM, lymphocyte; CK, creatine kinase; CKMB, creatine kinase-MB Isoenzyme; PCT, procalcitonin; CRP, C-reactive protein; TC, total cholesterol; TG, triglyceride; HDL, high-density lipoprotein; LDL, low-density lipoprotein; SCr, serum creatinine; BUN, blood urea nitrogen; UA, uric acid; CysC, cystatin C; CD4+, CD4+ T-lymphocyte; CD8, CD8+ T-lymphocyte; BC, B cell; NK, natural killer cell; PRBC, packed red blood cells; FFP, fresh frozen plasma; MV, mechanical ventilation; HLA -I Ab, human leukocyte antigen class I antibody; HLA -II Ab, human leukocyte antigen class II antibody; Postop, Postoperative.
References
1. Russo FP, Murad SD, Pillai AA, Shingina A, Donahoe L, Mrzljak A, et al. Combined Liver with Other Solid Organ Transplants: Promises, Pitfalls and ethical dilemmas, An Expert Opinion. J Hepatol. (2025). doi: 10.1016/j.jhep.2025.04.027
2. Kwong AJ, Kim WR, Lake JR, Schladt DP, Schnellinger EM, Gauntt K, et al. OPTN/SRTR 2022 annual data report: liver. Am J Transplant. (2024) 24:S176–265. doi: 10.1016/j.ajt.2024.01.014
3. Lee BT, Fiel MI, and Schiano TD. Antibody-mediated rejection of the liver allograft: An update and a clinico-pathological perspective. J Hepatol. (2021) 75:1203–16. doi: 10.1016/j.jhep.2021.07.027
4. Choudhary NS, Saigal S, Bansal RK, Saraf N, Gautam D, and Soin AS. Acute and chronic rejection after liver transplantation: what A clinician needs to know. J Clin Exp Hepatol. (2017) 7:358–66. doi: 10.1016/j.jceh.2017.10.003
5. Levitsky J, Goldberg D, Smith AR, Mansfield SA, Gillespie BW, Merion RM, et al. Acute rejection increases risk of graft failure and death in recent liver transplant recipients. Clin Gastroenterol Hepatol. (2017) 15:584–593.e2. doi: 10.1016/j.cgh.2016.07.035
6. Wellekens K, Coemans M, Koshy P, Vaulet T, Cleenders E, Debyser T, et al. The impact of the Banff v-lesion on rejection classification and outcomes: Insights from a multicenter study. Am J Transplant. (2025). 25 doi: 10.1016/j.ajt.2025.04.023
7. Lu P, Shen R, Yang J, Wu L, and Wang R. Dynamic regulation and targeted interventions of macrophages in ischemia–reperfusion injury. J Advanced Res. (2025). doi: 10.1016/j.jare.2025.05.006
8. Magalhães CB de A, Nogueira IC, Marinho LS, Daher EF, Garcia JHP, Viana CFG, et al. Exercise capacity impairment can predict postoperative pulmonary complications after liver transplantation. Respiration. (2017) 94:272–8. doi: 10.1159/000479008
9. Smith CJ, Bray BD, Hoffman A, Meisel A, Heuschmann PU, Wolfe CDA, et al. Can a novel clinical risk score improve pneumonia prediction in acute stroke care? A UK multicenter cohort study. JAHA. (2015) 4:e001307. doi: 10.1161/JAHA.114.001307
10. Arozullah AM, Khuri SF, Henderson WG, and Daley J. Development and validation of a multifactorial risk index for predicting postoperative pneumonia after major noncardiac surgery. Ann Intern Med. (2001) 135:847–57. doi: 10.7326/0003-4819-135-10-200111200-00005
11. Shoka M, Kanda M, Ito S, Mochizuki Y, Teramoto H, Ishigure K, et al. Systemic inflammation score as a predictor of pneumonia after radical resection of gastric cancer: analysis of a multi-institutional dataset. Dig Surg. (2020) 37:401–10. doi: 10.1159/000506940
12. Ai C, Song J, Yuan C, Xu G, Yang J, Lv T, et al. Prediction model of the T cell-mediated rejection after liver transplantation in children and adults: A case-controlled study. Int J Surg. (2025) 111:2827–37. doi: 10.1097/JS9.0000000000002279
13. Ma W, Oh I, Luo Y, Kumar S, Gupta A, Lai AM, et al. Developing approaches to incorporate donor-lung computed tomography images into machine learning models to predict severe primary graft dysfunction after lung transplantation. Am J Transplant. (2025) 25:1339–49. doi: 10.1016/j.ajt.2025.01.039
14. Giorgakis E, Hardgrave H, Callais N, and Wells A. Machine learning-driven virtual biopsy system may increase organ discards at aggressive kidney transplant centers. Nat Commun. (2024) 15:10323. doi: 10.1038/s41467-024-53702-7
15. Spann A, Strauss AT, Davis SE, and Bhat M. The role of artificial intelligence in chronic liver diseases and liver transplantation. Gastroenterology. (2025). 169 doi: 10.1053/j.gastro.2025.05.012
16. Hu F, Li Y, Zeng H, Ju R, Jiang D, Zhang L, et al. Machine learning model for predicting biliary complications after liver transplantation. Clin Transl Gastroenterol. (2025). 16 doi: 10.14309/ctg.0000000000000843
17. Chen C, Yang D, Gao S, Zhang Y, Chen L, Wang B, et al. Development and performance assessment of novel machine learning models to predict pneumonia after liver transplantation. Respir Res. (2021) 22:94. doi: 10.1186/s12931-021-01690-3
18. Kooshesh M, Sanandaji BM, Fiel MI, and Schiano T. 1440 Application of machine learning to predict the development of plasma cell-Rich rejection in post liver transplantation. Lab Invest. (2025) 105:103679. doi: 10.1016/j.labinv.2024.103679
19. Yoon SB, Lee J-M, Jung C-W, Suh K-S, Lee K-W, Yi N-J, et al. Machine-learning model to predict the tacrolimus concentration and suggest optimal dose in liver transplantation recipients: a multicenter retrospective cohort study. Sci Rep. (2024) 14:19996. doi: 10.1038/s41598-024-71032-y
20. Gangadhar A, Hasjim BJ, Zhao X, Sun Y, Chon J, Sidhu A, et al. Personalized survival benefit estimation from living donor liver transplantation with a novel machine learning method for confounding adjustment. J Hepatol. (2025). doi: 10.1016/j.jhep.2025.04.040
21. Calleja R, Rivera M, Guijo-Rubio D, Hessheimer AJ, de la Rosa G, Gastaca M, et al. Machine learning algorithms in controlled donation after circulatory death under normothermic regional perfusion: A graft survival prediction model. Transplantation. (2025). 109 doi: 10.1097/TP.0000000000005312
22. Torres JD, Vera Torres A, Bejarano DF, and Escalona AV. Identifying risk profiles among patients with liver transplantation using machine learning: A clustering analysis. Am J Transplant. (2025) 25:S958–9. doi: 10.1016/j.ajt.2025.07.2283
23. Oettl FC, Oeding JF, Feldt R, Ley C, Hirschmann MT, and Samuelsson K. The artificial intelligence advantage: Supercharging exploratory data analysis. Knee Surg sports traumatol arthrosc. (2024) 32:3039–42. doi: 10.1002/ksa.12389
24. Deppermann C, Peiseler M, Zindel J, Zbytnuik L, Lee W, Pasini E, et al. Tacrolimus impairs kupffer cell capacity to control bacteremia: why transplant recipients are susceptible to infection. Hepatology. (2021) 73:1967–84. doi: 10.1002/hep.31499
25. Lim TY, Perpiñán E, Londoño M-C, Miquel R, Ruiz P, Kurt AS, et al. Low dose interleukin-2 selectively expands circulating regulatory T cells but fails to promote liver allograft tolerance in humans. J Hepatol. (2023) 78:153–64. doi: 10.1016/j.jhep.2022.08.035
26. Attachaipanich T, Chattipakorn SC, and Chattipakorn N. Cardiovascular toxicities by calcineurin inhibitors: Cellular mechanisms behind clinical manifestations. Acta Physiologica. (2024) 240:e14199. doi: 10.1111/apha.14199
27. Baghai Arassi M, Feißt M, Krupka K, Awan A, Benetti E, Düzova A, et al. Age-related differences in rejection rates, infections, and tacrolimus exposure in pediatric kidney transplant recipients in the CERTAIN registry. Kidney Int Rep. (2024) 9:3265–77. doi: 10.1016/j.ekir.2024.08.025
28. Degraeve AL, Haufroid V, Loriot A, Gatto L, Andries V, Vereecke L, et al. Gut microbiome modulates tacrolimus pharmacokinetics through the transcriptional regulation of ABCB1. Microbiome. (2023) 11:138. doi: 10.1186/s40168-023-01578-y
29. Khong J, Lee M, Warren C, Kim UB, Duarte S, Andreoni KA, et al. Tacrolimus dosing in liver transplant recipients using phenotypic personalized medicine: A phase 2 randomized clinical trial. Nat Commun. (2025) 16:4558. doi: 10.1038/s41467-025-59739-6
30. Martin-Loeches I, Reyes LF, Nseir S, Ranzani O, Povoa P, Diaz E, et al. European Network for ICU-Related Respiratory Infections (ENIRRIs): a multinational, prospective, cohort study of nosocomial LRTI. Intensive Care Med. (2023) 49:1212–22. doi: 10.1007/s00134-023-07210-9
31. Neyton LPA, Matthay MA, Dela Cruz CS, and Rizzo AN. Beyond immunosuppression: decoding systemic immune dysregulation in ICU-acquired pneumonia. Eur Respir J. (2025) 65:2500185. doi: 10.1183/13993003.00185-2025
32. Colaneri M, Montrucchio G, Scaglione G, Monti G, Tricella G, Genovese C, et al. Incidence, microbiology and mortality of ventilation-associated pneumonia in a large Italian cohort of critically ill patients. Results from the PROSAFE project. Clin Microbiol Infection. (2025). 31 doi: 10.1016/j.cmi.2025.05.026
33. Terry AQ, Kojima H, Sosa RA, Kaldas FM, Chin JL, Zheng Y, et al. Disulfide-HMGB1 signals through TLR4 and TLR9 to induce inflammatory macrophages capable of innate-adaptive crosstalk in human liver transplantation. Am J Transplant. (2023) 23:1858–71. doi: 10.1016/j.ajt.2023.08.002
34. Dwyer GK and Turnquist HR. Untangling local pro-inflammatory, reparative, and regulatory damage-associated molecular-patterns (DAMPs) pathways to improve transplant outcomes. Front Immunol. (2021) 12:611910. doi: 10.3389/fimmu.2021.611910
35. Wu Q, Xiao Q, Tang X, Li L, Song D, Zhou Y, et al. DAMPs prognostic signature predicts tumor immunotherapy, and identifies immunosuppressive mechanism of pannexin 1 channels in pancreatic ductal adenocarcinoma. Front Immunol. (2024) 15:1516457. doi: 10.3389/fimmu.2024.1516457
36. Shen S, Li Y, Jin M, Fan D, Pan R, Lin A, et al. CD4+ CTLs act as a key effector population for allograft rejection of MSCs in a donor MHC-II dependent manner in injured liver. Aging Dis. (2022) 13:1919. doi: 10.14336/AD.2022.0314
37. Xia X, Fan X, Jiang S, Liao Y, and Sun Y. Unveiling the intricate interplay: Exploring biological bridges between renal ischemia-reperfusion injury and T cell-mediated immune rejection in kidney transplantation. PloS One. (2024) 19:e0311661. doi: 10.1371/journal.pone.0311661
38. Hirao H, Kojima H, Dery KJ, Nakamura K, Kadono K, Zhai Y, et al. Neutrophil CEACAM1 determines susceptibility to NETosis by regulating the S1PR2/S1PR3 axis in liver transplantation. J Clin Invest. (2023) 133:e162940. doi: 10.1172/JCI162940
39. Qin X, Hu D, Li Q, Zhang S, Qin Z, Wang L, et al. LXRα agonists ameliorates acute rejection after liver transplantation via ABCA1/MAPK and PI3K/AKT/mTOR signaling axis in macrophages. Mol Med. (2025) 31:99. doi: 10.1186/s10020-025-01153-1
40. Spensley KJ, Hassan S, Roberts DJ, Przybysiak M, Regan F, Brown C, et al. Transfusion-specific alloimmune responses following blood transfusion pre–kidney transplantation. Am J Transplant. (2025) 25:1021–9. doi: 10.1016/j.ajt.2024.12.006
41. Pettenuzzo T, Boscolo A, Pistollato E, Pretto C, Giacon TA, Frasson S, et al. Effects of non-invasive respiratory support in post-operative patients: a systematic review and network meta-analysis. Crit Care. (2024) 28:152. doi: 10.1186/s13054-024-04924-0
42. Menegatti S, Lopez-Cobo S, Sutra Del Galy A, Fuentealba J, Silva L, Perrin L, et al. Ablation of FAS confers allogeneic CD3– CAR T cells with resistance to rejection by T cells and natural killer cells. Nat BioMed Eng. (2024) 8:1651–64. doi: 10.1038/s41551-024-01282-8
43. He D, Dai W, Cui Y, Gao R, Yang X, Li W, et al. Diamine oxidase acts as a novel risk factor in abnormal inflammation via mediating “cytosolic ROS-autophagy-IFN-γ” axis in NK cells. Life Sci. (2025), 123775. 377 doi: 10.1016/j.lfs.2025.123775
44. Bick MV, Puig E, Beauparlant D, Nedellec R, Burton I, Ardaghi K, et al. Molecular parameters governing antibody FcγR signaling and effector functions in the context of HIV envelope. Cell Rep. (2025) 44:115331. doi: 10.1016/j.celrep.2025.115331
Keywords: machine learning, liver transplantation, T-cell-mediated rejection, pneumonia, perioperative period, predictive model
Citation: Sun J, Zhu G, Liang Q, Wen N, Li H and Sun X (2025) Machine learning-based predictive model for the perioperative co-occurrence of T-cell-mediated rejection and pneumonia in liver transplantation. Front. Immunol. 16:1648993. doi: 10.3389/fimmu.2025.1648993
Received: 18 June 2025; Accepted: 03 September 2025;
Published: 17 September 2025.
Edited by:
Antonio Sarasa-Cabezuelo, Complutense University of Madrid, SpainCopyright © 2025 Sun, Zhu, Liang, Wen, Li and Sun. This is an open-access article distributed under the terms of the Creative Commons Attribution License (CC BY). The use, distribution or reproduction in other forums is permitted, provided the original author(s) and the copyright owner(s) are credited and that the original publication in this journal is cited, in accordance with accepted academic practice. No use, distribution or reproduction is permitted which does not comply with these terms.
*Correspondence: Xuyong Sun, c3VueHV5b25nQGd4bXUuZWR1LmNu
†These authors have contributed equally to this work and share first authorship