 Xin Ou1,2
 Junyu Yin1,2
 Feng Shi3
 Yanjie Zhao4
 Quan Zhou5Keyu Yuan6Shuzhen Lyu6Jiangping Wu1,2
 Yanping Li6
 Qingkun Song1,2*
- 1Department of Clinical Epidemiology, Beijing Youan Hospital, Capital Medical University, Beijing, China
- 2Center of Biobank, Beijing Youan Hospital, Capital Medical University, Beijing, China
- 3Department of Pathology, Beijing Shijitan Hospital, Capital Medical University, Beijing, China
- 4Department of Medical Oncology, Beijing Shijitan Hospital, Capital Medical University, Beijing, China
- 5Department of Pathology, Cancer Hospital, Chinese Academy of Medical Sciences, Peking Union Medical College, Beijing, China
- 6Department of Breast Surgery, Beijing Shijitan Hospital, Capital Medical University, Beijing, China
Background: CD155, an immune checkpoint molecule interacted with receptors of TIGIT/CD96/CD226 to exhibit co-inhibitory and co-stimulatory modulation on tumor immune microenvironment. Nevertheless, the exploration of collectively prognostic effect of these four molecules on breast cancer (BC) was limited. This study aimed to investigate the prognosis effect of CD155-TIGIT/CD96/CD226 complex in BC.
Methods: CD155-TIGIT/CD96/CD226 expression was evaluated by immunohistochemistry in tumor microenvironment (TME) by pathological professionals and the associations with clinical characteristics and prognosis were investigated under a cohort study design.
Results: CD155 was detected on TME tumor cells (TC) and TIGIT/CD96/CD226 were detected on both TC and stromal tumor-infiltrated lymphocytes (TILs). The four molecules showed significant correlation with clinicopathological characteristics and prognosis. High CD155 was associated with relapse (HR = 2.21, 95%CI:1.18-4.13) and death (HR = 2.57, 95%CI:1.29-5.10). High expression of CD226 (HR = 1.79, 95%CI:1.03-3.11) and CD96 (HR = 2.65, 95%CI:1.09-6.44) on TC was correlated with high risk of relapse. High expression of TIGIT on TILs was related to poor prognosis of relapse (HR = 2.06, 95%CI:1.02-4.14), while the expression on TC was a protective factor for relapse (HR = 0.45, 95%CI:0.24-0.83) and death (HR = 0.32, 95%CI:0.16-0.66). Additionally, tumoral and stromal expression of these biomarkers interacted with TME infiltration of stromal TILs to exhibit the diverse prognosis effect.
Conclusion: The CD155-CD226/TIGIT/CD96 immune checkpoint complex expressed on both TME TC and TILs, and interacted with TILs to exhibit diverse prognosis effect on BC. The immunotherapy against these checkpoint proteins should check the expression on both TC and TILs and further studies should explore the molecule complex collectively for comprehensive prediction of BC prognosis.
Introduction
In 2022, there were approximately 2.3 million Breast cancer (BC) cases and 666,000 deaths worldwide, ranking second in cancer burden in incidence and fourth in the leading cause of death (1). Immune checkpoint inhibitors (ICIs), representing a burgeoning immunotherapy strategy, have enhanced the clinical cure rate of BC patients (2). Nevertheless, some patients cannot obtain any clinical benefits from immunotherapy and suffer from disease progression or recurrence (3). 2.8%-15.8% of BC patients treated with ICIs experience cancer progression or developed new lesions (4–6). Exploration of new prognostic biomarkers and therapeutic targets was essential for immunotherapy.
CD155-TIGIT/CD96/CD226, members of the immunoglobulin superfamily, are potential immunotherapy targets. CD155 is an imperative cell adhesion protein and a key regulator of cell-mediated immune responses in the immunoglobulin superfamily, and is regularly upregulated in malignant tumor cells (TC) (7). TIGIT is a co-inhibitory receptor mainly expressed on T cells and NK cells and has been found to be highly upregulated in tumor-infiltrating lymphocytes (TILs) in melanoma and other cancers (7, 8). CD96 is also expressed mainly on immune cells and is increased in acute lymphoblastic leukemia and myelodysplastic syndrome (9). CD226 is a co-stimulant receptor that had been found to be down-regulated in non-small cell lung cancer and sensitive to clinical therapies (10). With CD155 binding, TIGIT/CD96/CD226 transmits inhibition and activation signals to the immune system, and the integrated signals regulate immune functions and affect the anti-tumor immune response (11). These interactive functions indicate that the complex of CD155 with TIGIT/CD96/CD226 should be evaluated collectively to contribute to the development of new immunotherapeutic targets. In addition, clinical and basic studies have reported the anti-tumor responses of immunotherapy against CD155 (12), TIGIT (13), CD96 (14) and CD226 (15), and elucidated the potential of modulating the CD155-TIGIT/CD96/CD226 immune pathway to enhance the anti-tumor immune response.
Currently, clinical studies of CD155-TIGIT/CD96/CD226 in BC have primarily focused on the expression of CD155 and TIGIT; however, research on CD226 and CD96 is limited. Thus, this study aimed to investigate the prognostic value of these four molecules on TC and stromal TILs and provide a reference for BC immunotherapy.
Materials and methods
Ethical approvement
All procedures performed in this study involving human participants were in accordance with the ethical standards of the Institutional Review Board of Beijing Shijitan Hospital, Capital Medical University (sjtkyll-1x-2021(108)), as well as the 1964 Helsinki Declaration and its later amendments or comparable ethical standards (16). Given the retrospective and de-identified nature of the study, the aforementioned Institutional Review Board waived the requirement for written informed consent (16).
Study setting and design
This study was a retrospective cohort study. 227 female patients with a pathological diagnosis of primary BC were recruited from the Department of Breast Surgery, Beijing Shijitan Hospital, Capital Medical University from 2010 to 2018. Inclusion criteria: ① Patients had no diagnosis of pregnancy, lactation, or other malignancies; ②Patients had no experience of neoadjuvant chemotherapy or target therapy; ③Patients under 75 years of age. Exclusion criteria: ①Patients previously received any form of immunotherapy; ②Patients had a diagnosis of autoimmune disease; ③Patients had an Eastern Cooperative Oncology Group (ECOG) score >2; ④Patients had dysfunction of the heart, brain, kidneys, and other vital organs.
Data collection and definition
The clinical factors included age, pathological diagnosis, estrogen receptor (ER), progesterone receptor (PR), human epidermal growth factor receptor 2 (HER-2) status, tumor histological grade, tumor stage, Ki-67 status, PD-1 and PD-L1 expression status.
The positive expression threshold of ER and PR in immunohistochemistry (IHC) detection was set to 1% TC staining. IHC tests with 3+ staining or positive results in fluorescence in situ hybridization (FISH) indicated positive HER-2 expression. By contrast, IHC tests with less than 2+ staining or negative FISH results showed negative expression. Patients with 2+ staining in IHC tests were required to undergo FISH testing. Ki-67 expression was defined as a brown nucleus in BC cells by IHC on 4 μm-thick formalin fixed paraffin-embedded sections. Meanwhile, the Ki-67 index was calculated as the proportion of BC cells expressing Ki-67 within the hot-spot area. The hot-spot area was determined under a low-power field, and an index≥14% was defined as a high expression of Ki-67. Molecular subtypes were defined as Luminal A (HER-2 negative, PR/ER positive, Ki-67 low expression), Luminal B (HER-2 negative, PR/ER positive, Ki-67 high expression), TNBC (HER-2 negative, ER negative, PR-negative, Ki-67 arbitrary), and HER-2 overexpression (HER-2 positive, Ki-67 arbitrary). Tumor histological grading was performed using the Nottingham grading system, integrating the proportion of gland formation, nuclear pleomorphism, and mitotic count to determine the overall grade of the tumor. The score ranges for grades I, II, and III were 3-5, 6-7, and 8-9, respectively. Tumor staging was performed using the tumor node metastasis (TNM) classification system following the guidelines of the 8th edition of the American Joint Committee on Cancer. TNM stage was classified as I (T1N0M0, T0~1N1miM0), II (T0~1N1M0, T2N0~1M0, T3N0M0), III (T0~2N2M0, T3N1~2M0, T4N0~2M0, T0~4N3M0), and IV(T0~4N0~3M1).
Outcome and follow-up
Cancer recurrence and death were study outcomes. The follow-up interval was set as six months and data was collected from clinic visits, telephonic interviews, as well as hospital records. The diagnosis of BC recurrence relied on biopsy, bone scanning, as well as CT/MRI. Information about all-cause deaths was gathered from both patients and their caregivers. Disease-free survival (DFS) was defined as the period from surgery to cancer recurrence or death. Overall survival (OS) was defined as the interval from surgery to death.
IHC detection and scoring
The expression of CD155, TIGIT, CD96, and CD226 on the membrane of TC and stromal TILs was detected by IHC using the EnVision two-step method. Stromal area was demarcated as the region falling within the boundaries of the invasive tumor. Areas featuring crush artifacts, necrosis, regressive hyalinization, and the biopsy site were excluded from this definition. Scored cells comprised mononuclear cells, specifically lymphocytes and plasma cells, while polymorphonuclear leukocytes were excluded. TILs were measured as the average counts in 10 random high-power fields (HPF, ×400) on IHC sections.
Monoclonal antibody against CD155 (rabbit anti-human, #81254S) were purchased from Cell Signaling Technology Co. Ltd. Monoclonal antibodies against CD226 (rabbit anti-human, #ab2120772) and TIGIT (rabbit anti-human, #ab243903) were purchased from Abcam Co. Ltd. A polyclonal antibody against CD96 (rabbit anti-human, #PA5-97568) was purchased from Invitrogen Co. Ltd. Monoclonal antibodies against PD-L1 (rabbit anti-human, #SP142) were purchased from Roche Shanghai Co. Ltd. Monoclonal antibody against PD-1 (mouse anti-human, # UMAB199) and secondary antibodies were purchased from Beijing Zhongshanjinqiao Biotechnology Co. Ltd.
Positive expression was recorded by brown staining of the cells. PD-L1 positive expression was denoted by the appearance of brown staining in the cytoplasm and/or cell membrane of both immune cells and TC. PD-1 positive expression was manifested as brown-stained cytoplasm within immune cells. Positive expression of CD155/TIGIT/CD96/CD226 on TC in the tumor microenvironment (TME) was defined as brown staining on the cytomembrane. Positive expression of TIGIT/CD96/CD226 in stromal TILs was defined as brown cytoplasmic staining. The expression of CD155, TIGIT, CD96, and CD226 on TC was evaluated by integrating staining intensity and the proportion of positive cells: the proportion of positive TC was categorized into 4 grade based on percentage (grade 0 = 0% positive cells, grade 1 = <1/3 positive cells, grade 2 = 1/3-2/3 positive cells, grade 3 = >2/3 positive cells), and staining intensity was scored as 0 (negative), 1 (weak and incomplete cytomembrane staining), 2 (weak and complete or strong and incomplete cytomembrane staining), or 3 (strong and complete cytomembrane staining); a composite score, with a total range of 0-9, was calculated by multiplying the proportion grade by the corresponding intensity score for all positive TC (i.e., composite score = proportion grade × intensity score).The percentage grade of positive TC indicated the proportion category of TC with molecular expression in the whole section, and the percentage of stromal TILs indicated the proportion of stromal TILs with positive molecule expression in the whole section. High expression of CD155, TIGIT, CD96, and CD226 was defined as a composite score of more than 3 for TC. Because the staining intensity on TILs could not be determined, high stromal expression was defined as more than 2/3 positive cells. Two pathologists estimated the IHC scoring, and a third, higher-level pathologist re-evaluated inconsistent estimations between the two pathologists.
Statistical analyses
R version 4.3.1 was used to conduct all statistical analyses. Differences between groups were analyzed using Pearson’s chi-square or Fisher’s exact test. The influence of missing data was eliminated during the analysis. Survival curves were plotted using the Kaplan-Meier method, and differences between groups were evaluated using the log-rank test. Cox proportional hazards regression models were established to control for confounding factors. The analysis steps were as follows: ①clinical factors related to prognosis and molecular expression were screened in univariate analysis; ②the selected relevant factors (p < 0.10) were adjusted in combination with CD155-TIGIT/CD96/CD226 molecular expression levels, and the relationship between each molecular expression and prognosis was estimated using the Cox multivariate model, with the estimation of hazard ratio (HR) and 95% Confidence interval (CI). All analyses were two-sided and the significance level was set at 0.05.
Results
Expression of CD155 and TIGIT/CD96/CD226 on TME TC and stromal TILs
Both stromal TILs and TC expressed CD226, CD96, and TIGIT (Figures 1A–C), but only TC expressed CD155 (Figure 1D). Among them, 37.2%, 25.6%, and 17.1% of the patients had more than 2/3 of stromal TILs expressing CD226, CD96, and TIGIT, respectively, and 24.9%,26.9%,84.8% and 56.7% of the patients had high expression levels of CD155, CD226, CD96, and TIGIT in TC, respectively (Table 1).
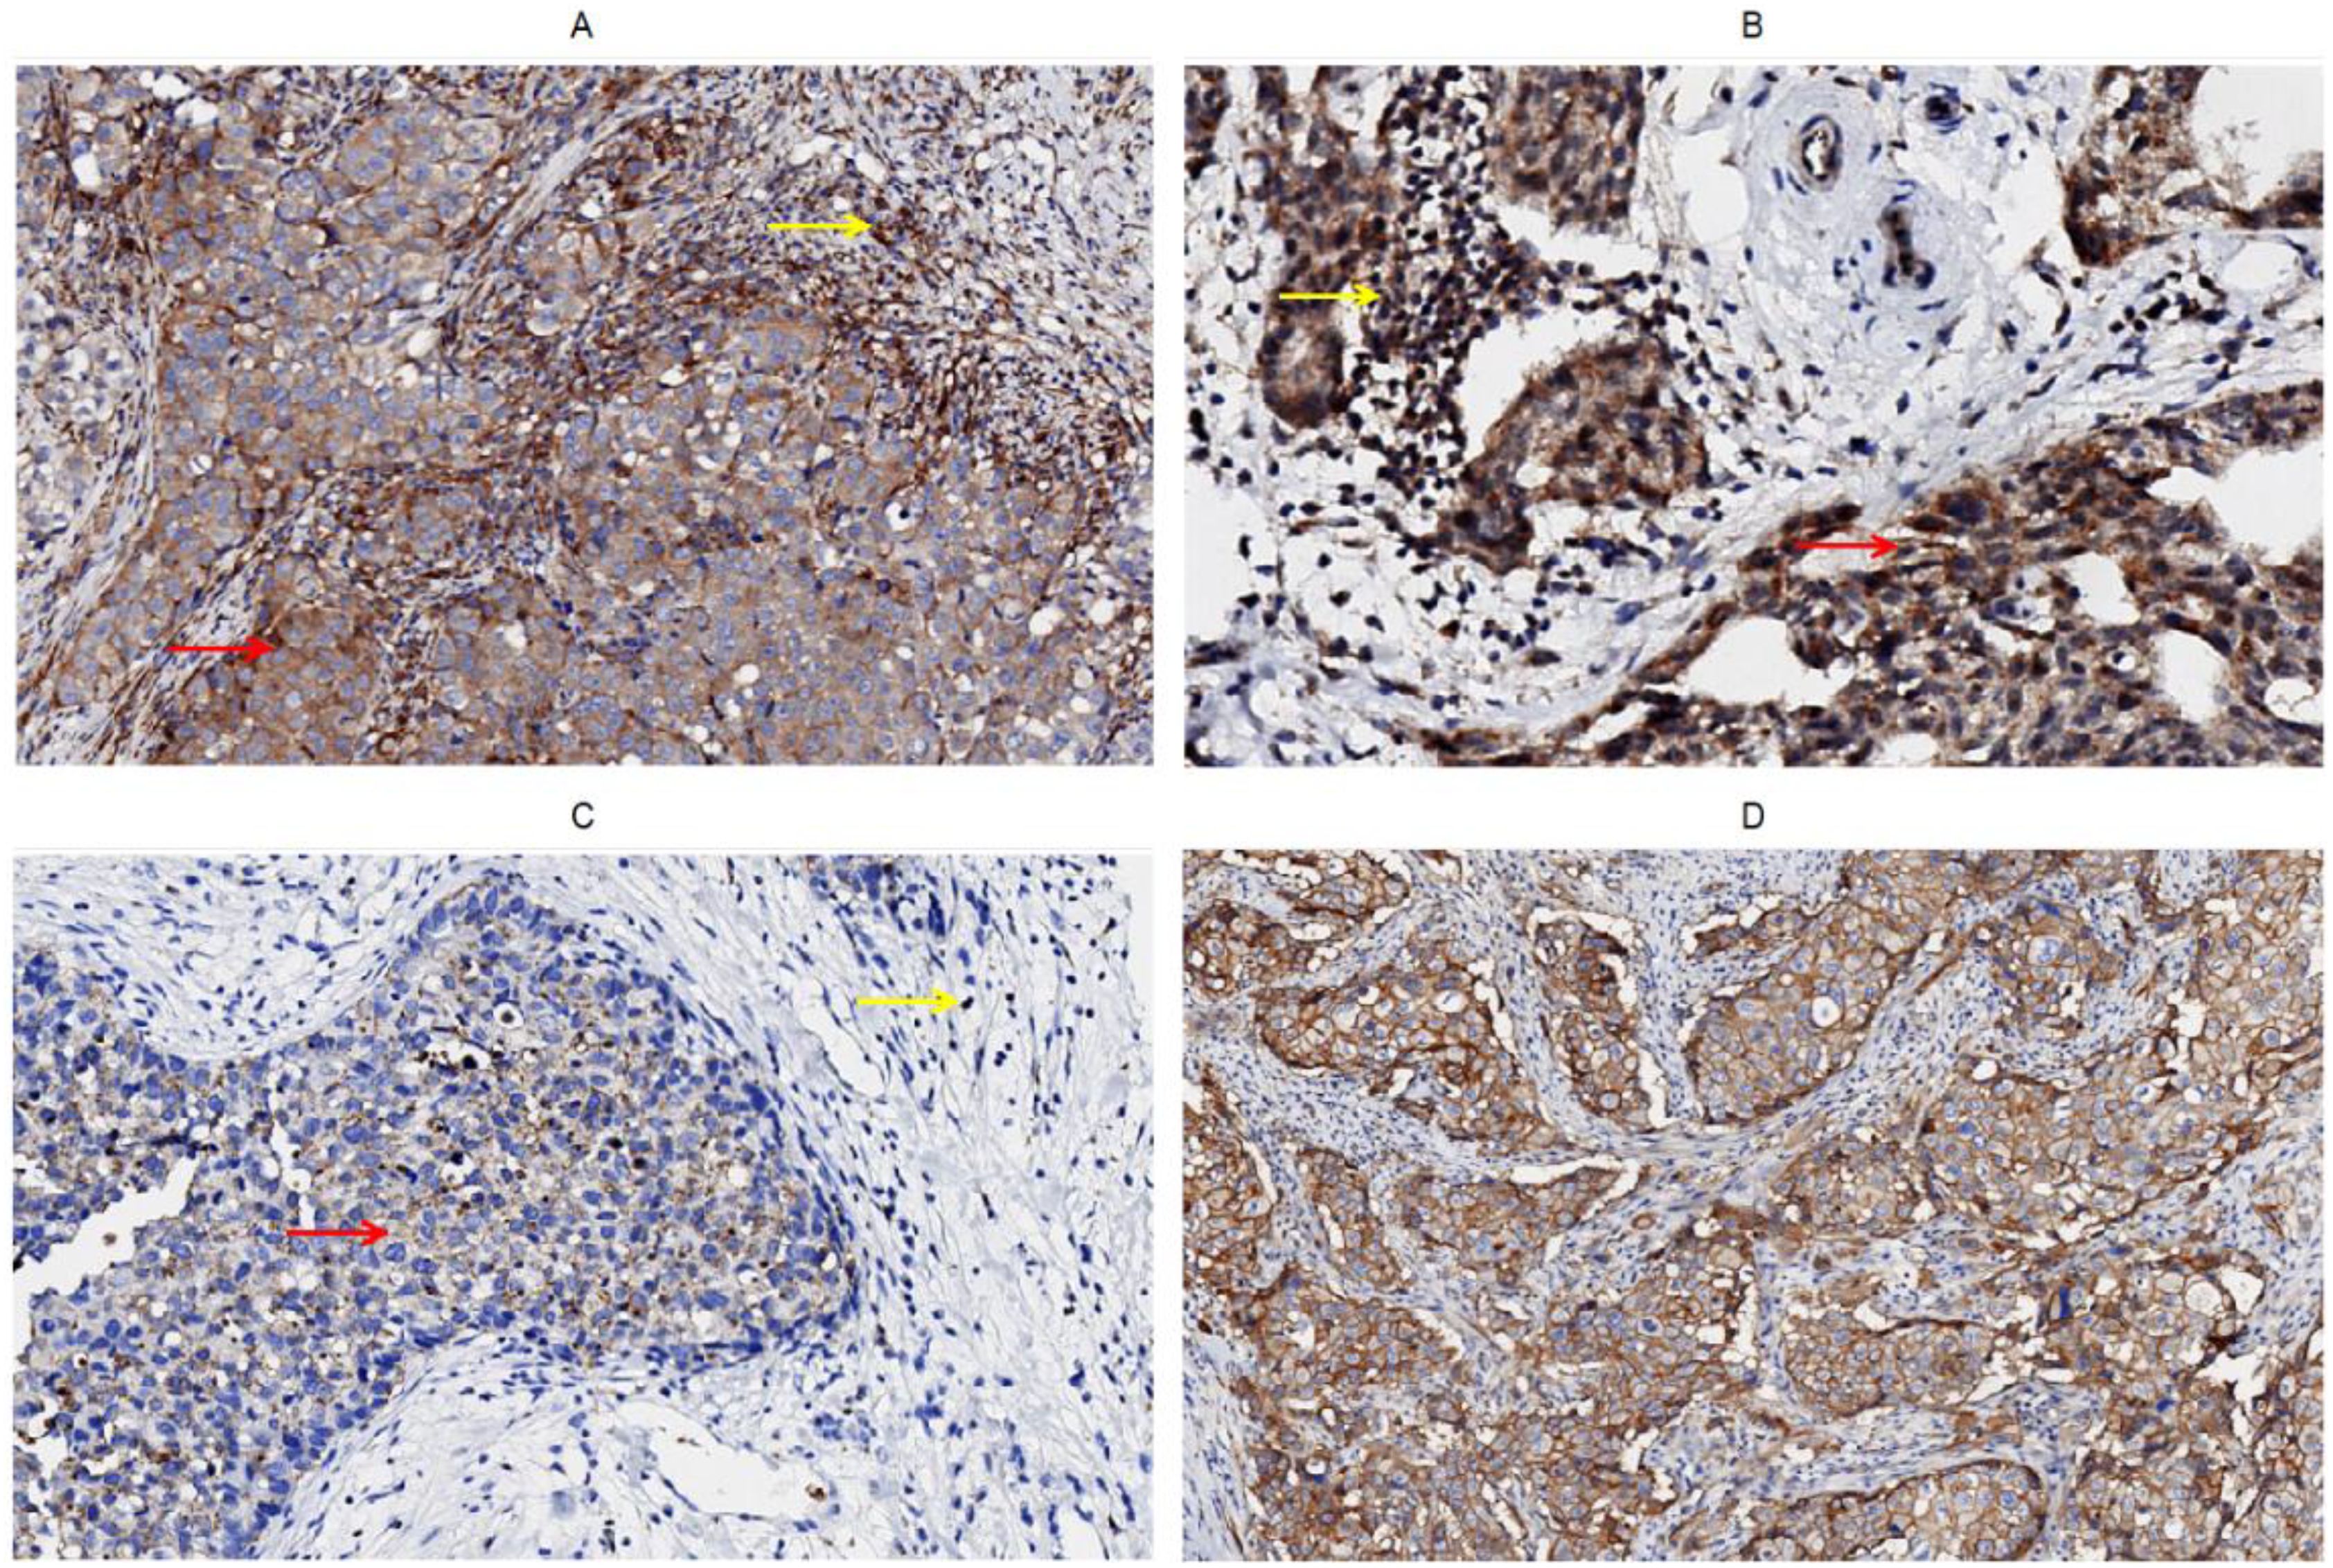
Figure 1. Immunohistochemical staining of CD226, CD96, TIGIT, CD155 on tumor cells and stromal TILs in tumor microenvironment of breast cancer, (A) CD226, (B) CD96, (C) TIGIT, (D) CD155.
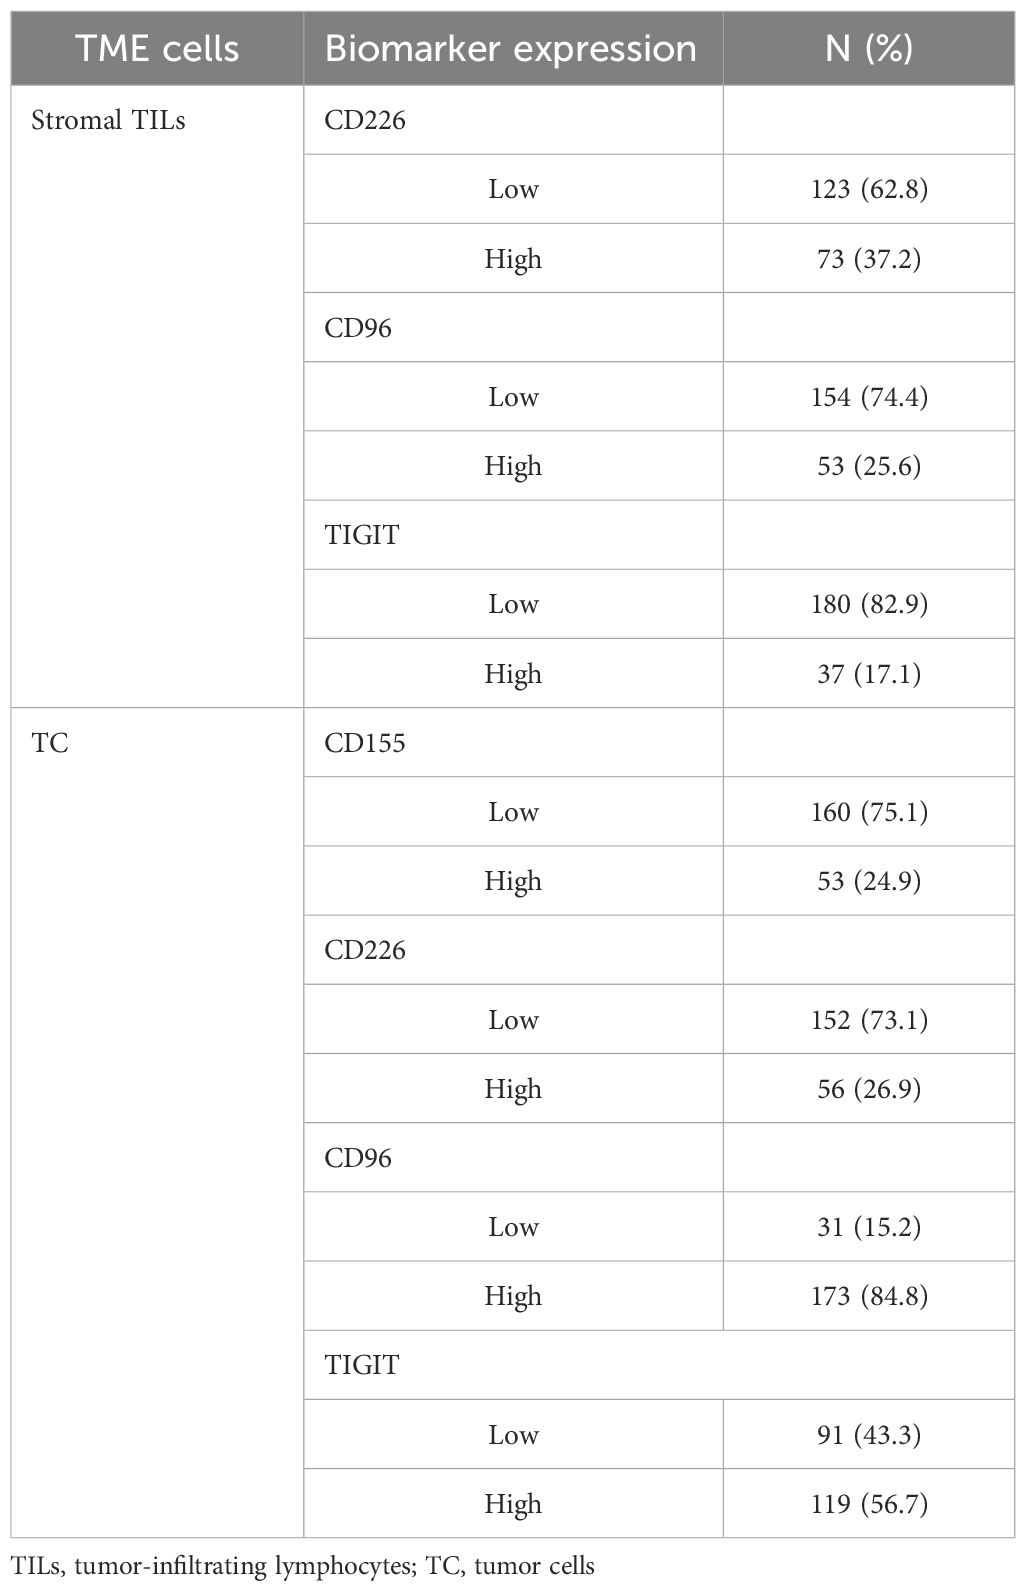
Table 1. CD155-CD226/CD96/TIGIT expression in breast cancer.
Correlation between clinicopathological characteristics and CD155-CD226/TIGIT/CD96
High CD226 expression in stromal TILs was associated with ER(p = 0.006), PR(p = 0.041), and PD-1(p = 0.012, Table 2). High CD226 expression in TC correlated with low HER-2 expression (p = 0.050, Table 2). More TNBC patients had high expression of CD96 in stromal TILs (p = 0.044, Table 2), which was significantly associated with PD-L1 expression in stromal TILs (p = 0.012, Table 2). High CD96 expression on TC correlated with increased TILs in the TME (p = 0.002, Table 2). High expression of TIGIT in stromal TILs was correlated with low PR (p = 0.025, Table 2) but high PD-L1 expression in stromal TILs (p = 0.014, Table 2). High TIGIT expression in TC was correlated with lower histological grade (p = 0.004, Table 2). High expression of CD155 was associated with higher TILs levels (p = 0.033, Table 2), higher proportion of histological grade (p = 0.023, Table 2), higher Ki-67 index (p < 0.001, Table 2), higher proportion of TNBC (p = 0.020, Table 2), and PD-L1 expression on stromal TILs (p = 0.040, Table 2).
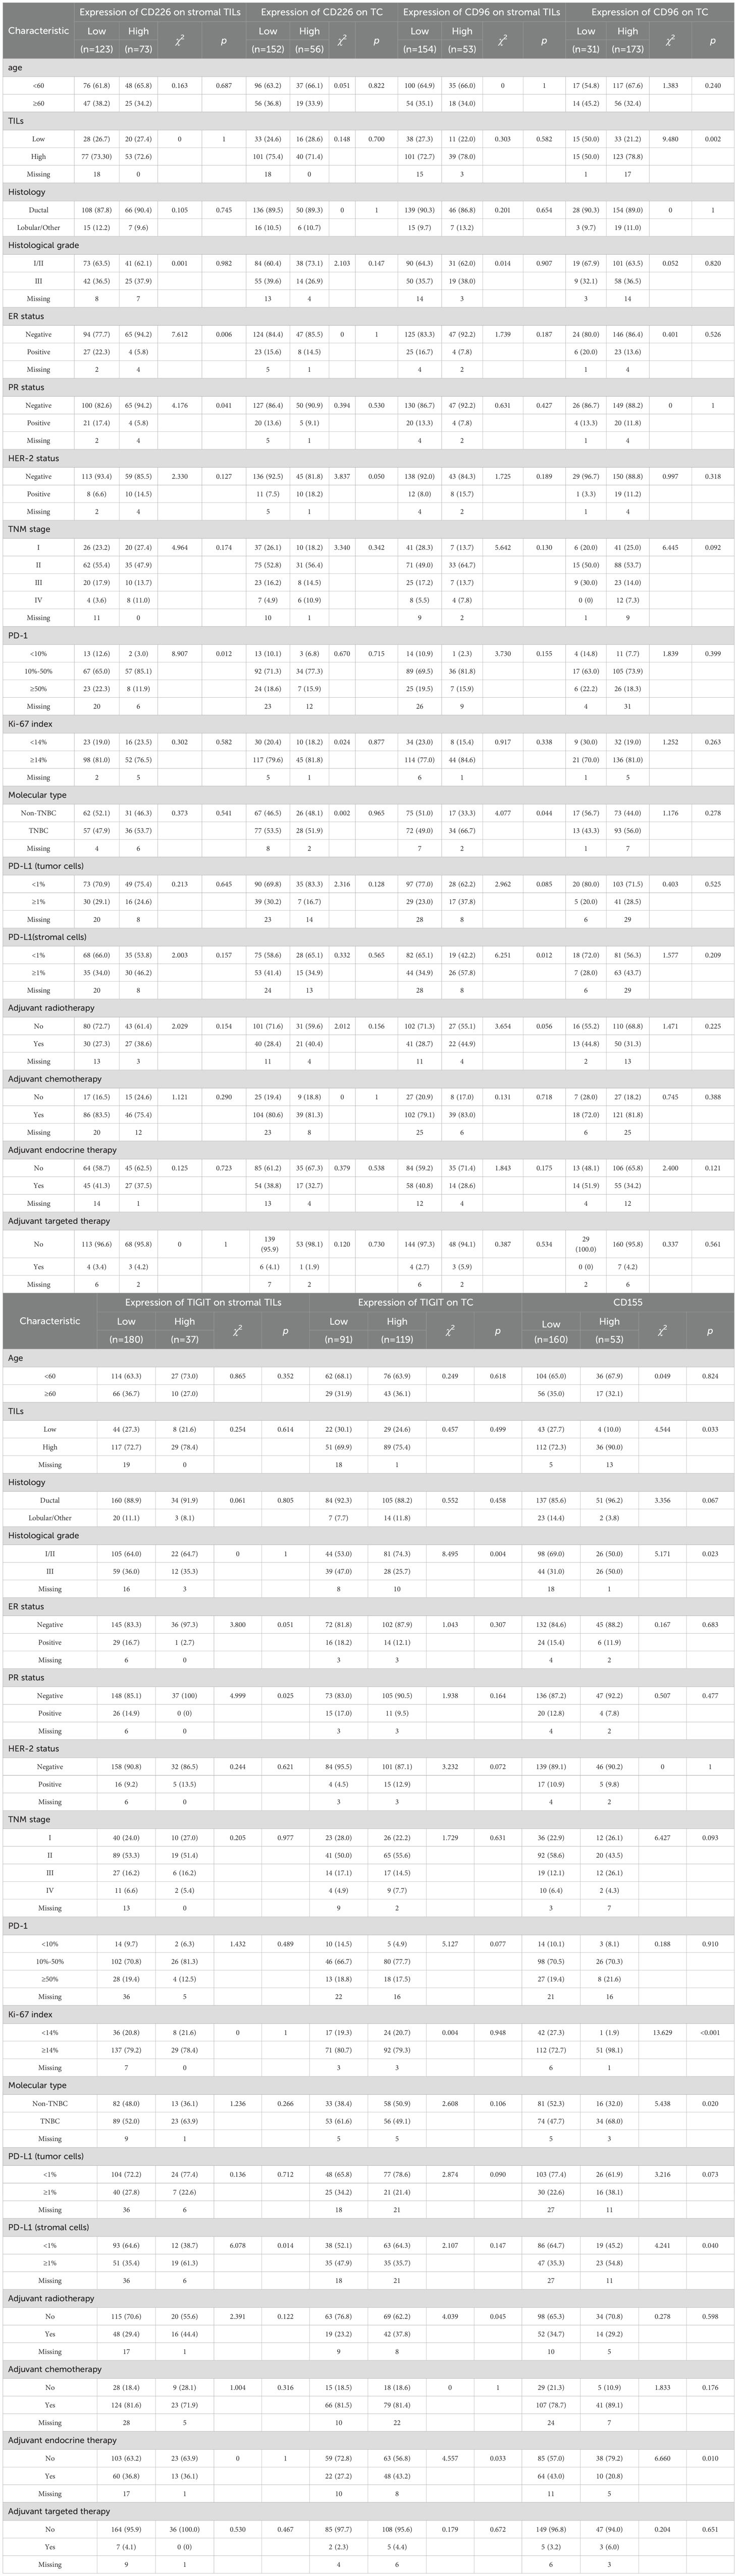
Table 2. Correlations between clinicopathological factors and CD155/CD226/TIGIT/CD96 expression.
Survival analyses
The median follow-up was 10 years (95%CI:8.8-11.0). BC patients with low expression of CD155 had 10-year DFS and OS rates of 70.37% and 80.64%, respectively, which were significantly higher than those with high expression of CD155 (58.81% for DFS, p = 0.033; 58.24% for OS, p = 0.002, Figure 2). Among patients with low TME infiltration of stromal TILs, the 10-year DFS and OS rates differed among different biomarker expression groups. For CD155, the rates were 56.49% and 62.70% in the low-expression group and 25.00% (p = 0.019) and 25.00% (p = 0.013) in the high-expression group, respectively (Figure 3). Regarding TC CD96, the low expression group of patients had rates of 78.57% and 78.57%, while the high expression group of patients had rates of 42.21% (p = 0.029) and 50.73% (p = 0.098), respectively (Figure 3). Patients with low TIGIT expression on TC had 10-year DFS and OS rates of 38.89% and 42.11%, respectively, and the high expression group had 62.75% (p = 0.042) and 69.96% (p = 0.020), respectively (Figure 3). In patients with high TME infiltration of stromal TILs, patients with low expression of CD155 had 10-year DFS and OS rates of 75.19% and 86.89%, respectively, compared with 61.12% (p = 0.091) and 62.26% (p = 0.008) among those with high expression of CD155, respectively (Figure 4). Additionally, patients with low expression of CD226 on stromal TILs had 10-year DFS and OS rates of 59.23% and 74.38%, respectively, whereas the 10-year rates of DFS and OS were 83.04% (p = 0.057) and 89.58% (p = 0.120) among patients with high expression, respectively (Figure 4).
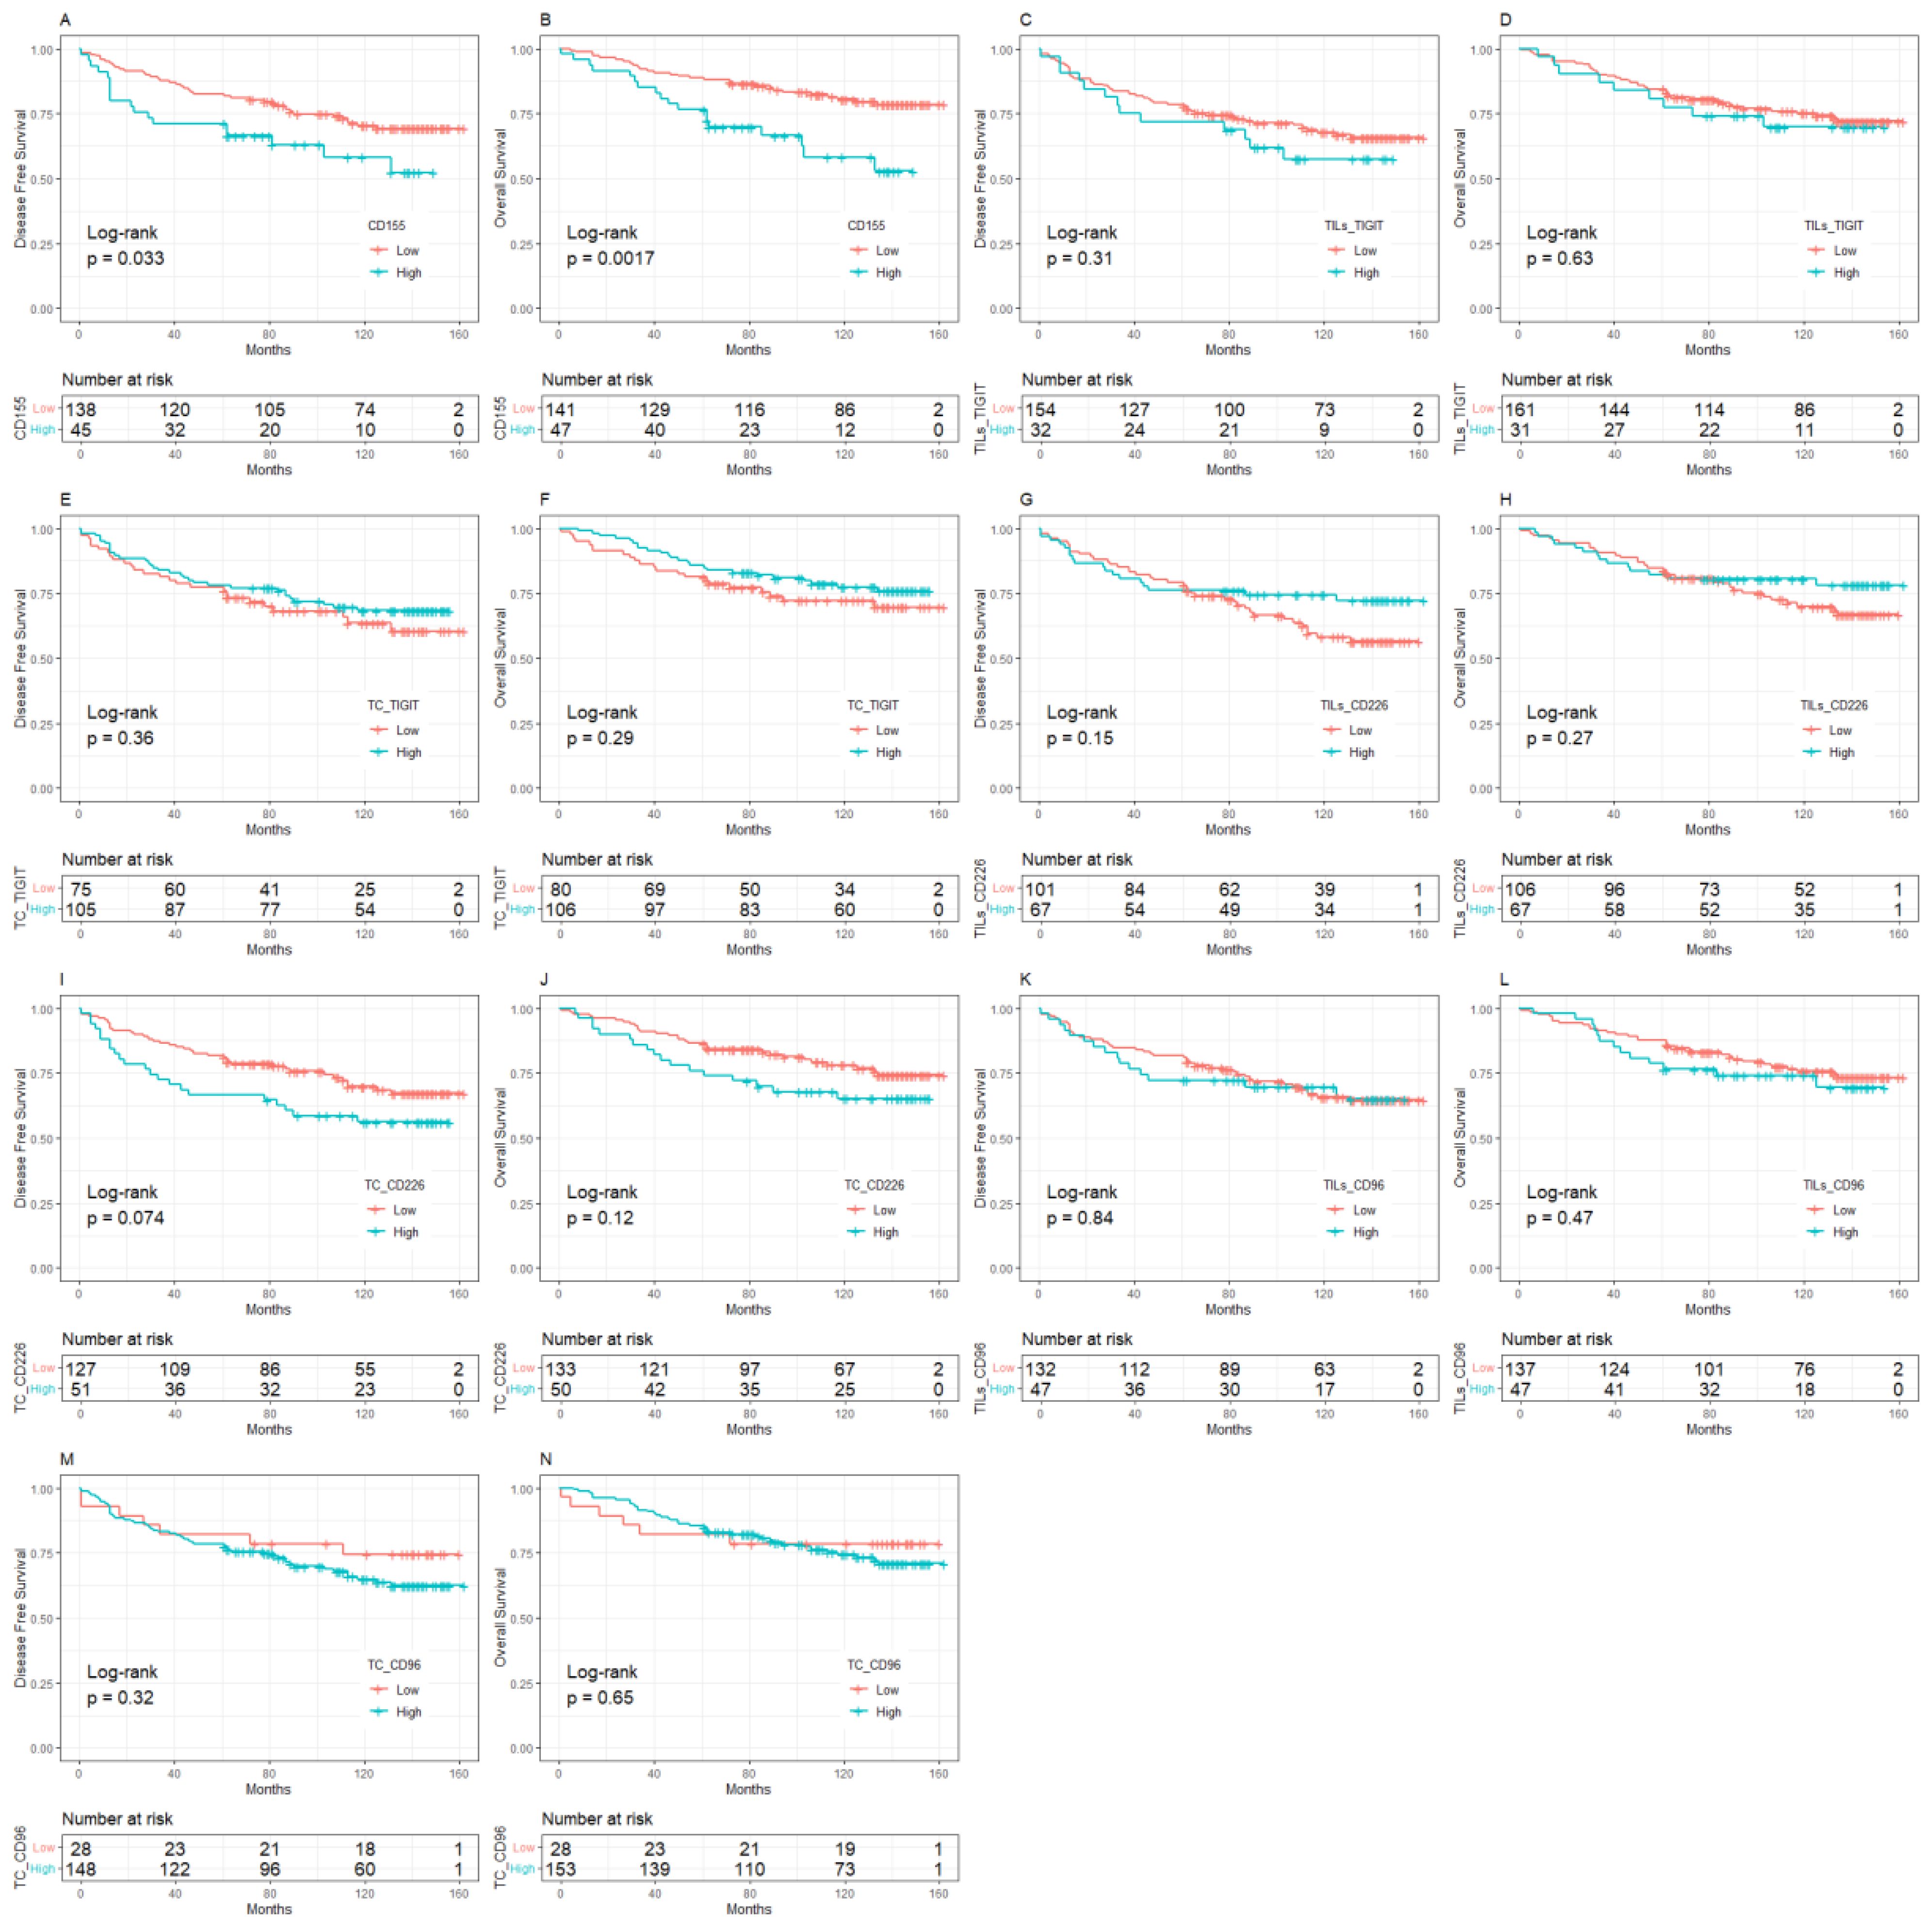
Figure 2. Kaplan-Meier curve of the relationship between molecular expression of CD155-TIGIT/CD226/CD96 and prognosis, (A) CD155 expression and DFS, (B) CD155 expression and OS, (C) TIGIT expression on stromal TILs and DFS, (D) TIGIT expression on stromal TILs and OS, (E) TIGIT expression on tumor cells and DFS, (F) TIGIT expression on tumor cells and OS, (G) CD226 expression on stromal TILs and DFS, (H) CD226 expression on stromal TILs and OS, (I) CD226 expression on tumor cells and DFS, (J) CD226 expression on tumor cells and OS, (K) CD96 expression on stromal TILs and DFS, (L). CD96 expression on stromal TILs and OS, (M). CD96 expression on tumor cells and DFS, (N). CD96 expression on tumor cells and OS. TILs, Tumor- infiltrating lymphocytes.
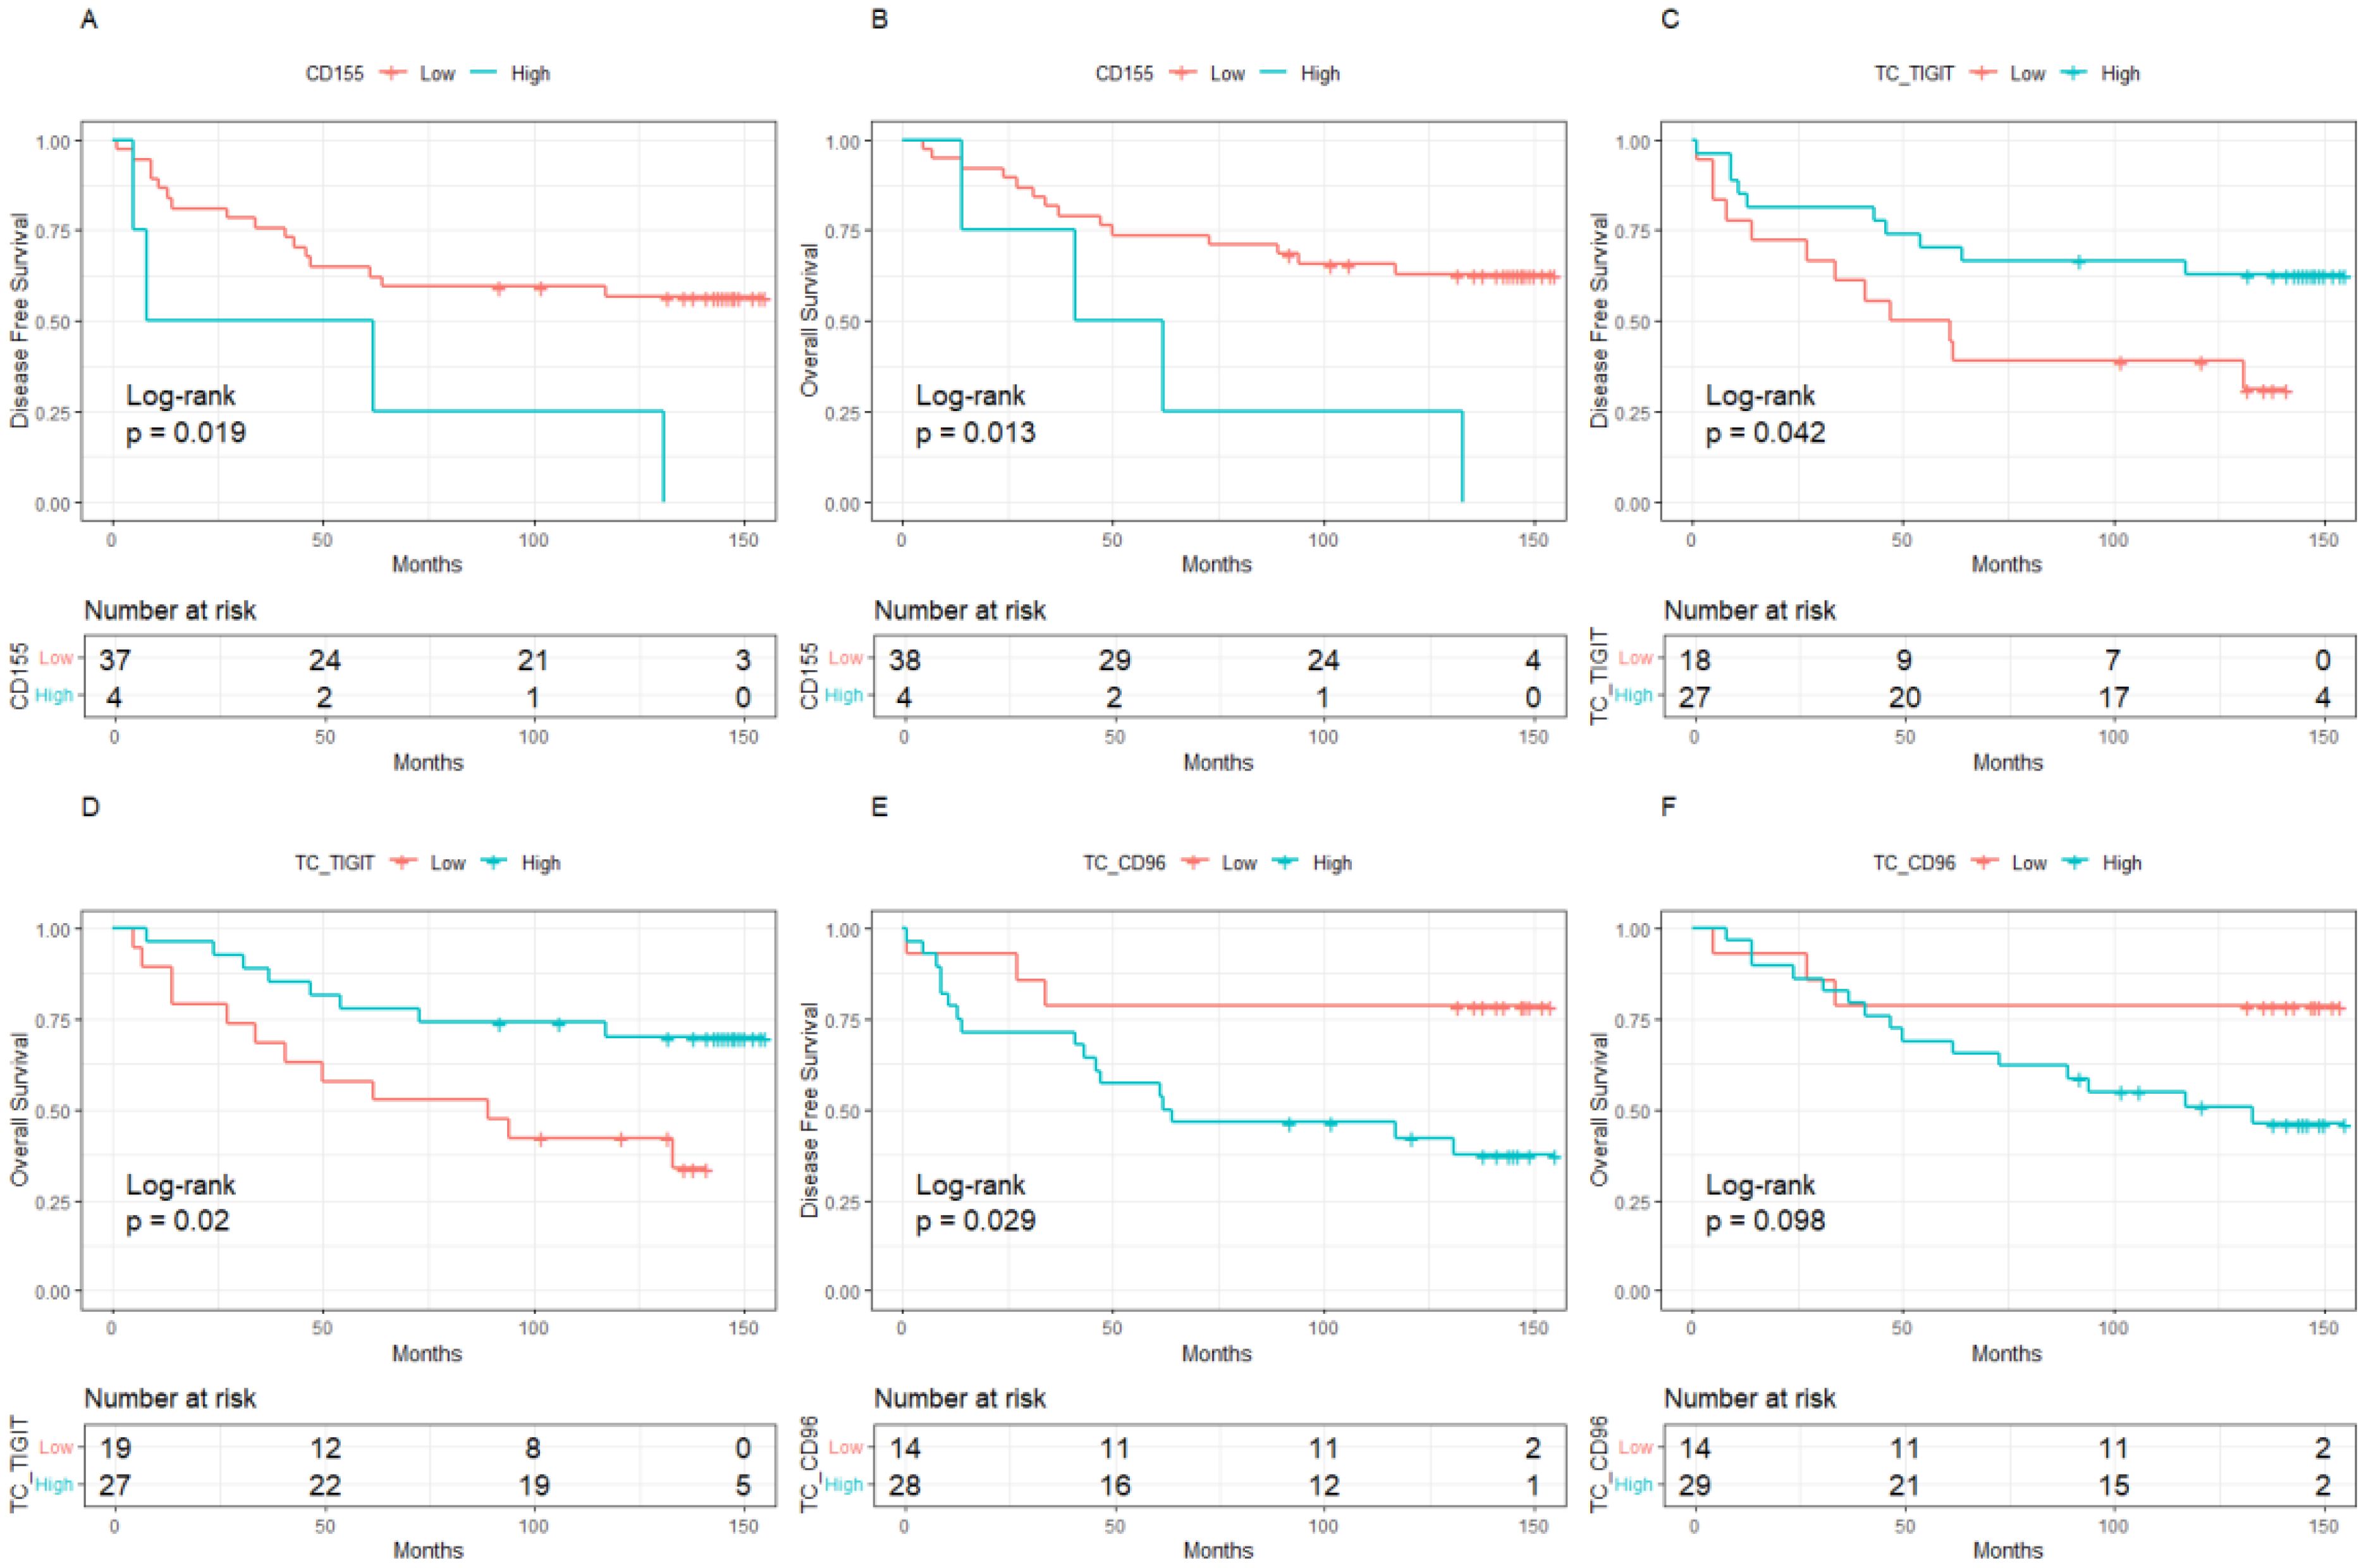
Figure 3. Kaplan-Meier curve of the relationship between molecular expression and prognosis in the population with low level of TILs, (A). CD155 expression and DFS, (B). CD155 expression and OS, (C). TIGIT expression on tumor cells and DFS, (D). TIGIT expression on tumor cells and OS, (E). CD96 expression on tumor cells and DFS, (F). CD96 expression on tumor cells and OS. TILs, Tumor- infiltrating lymphocytes.
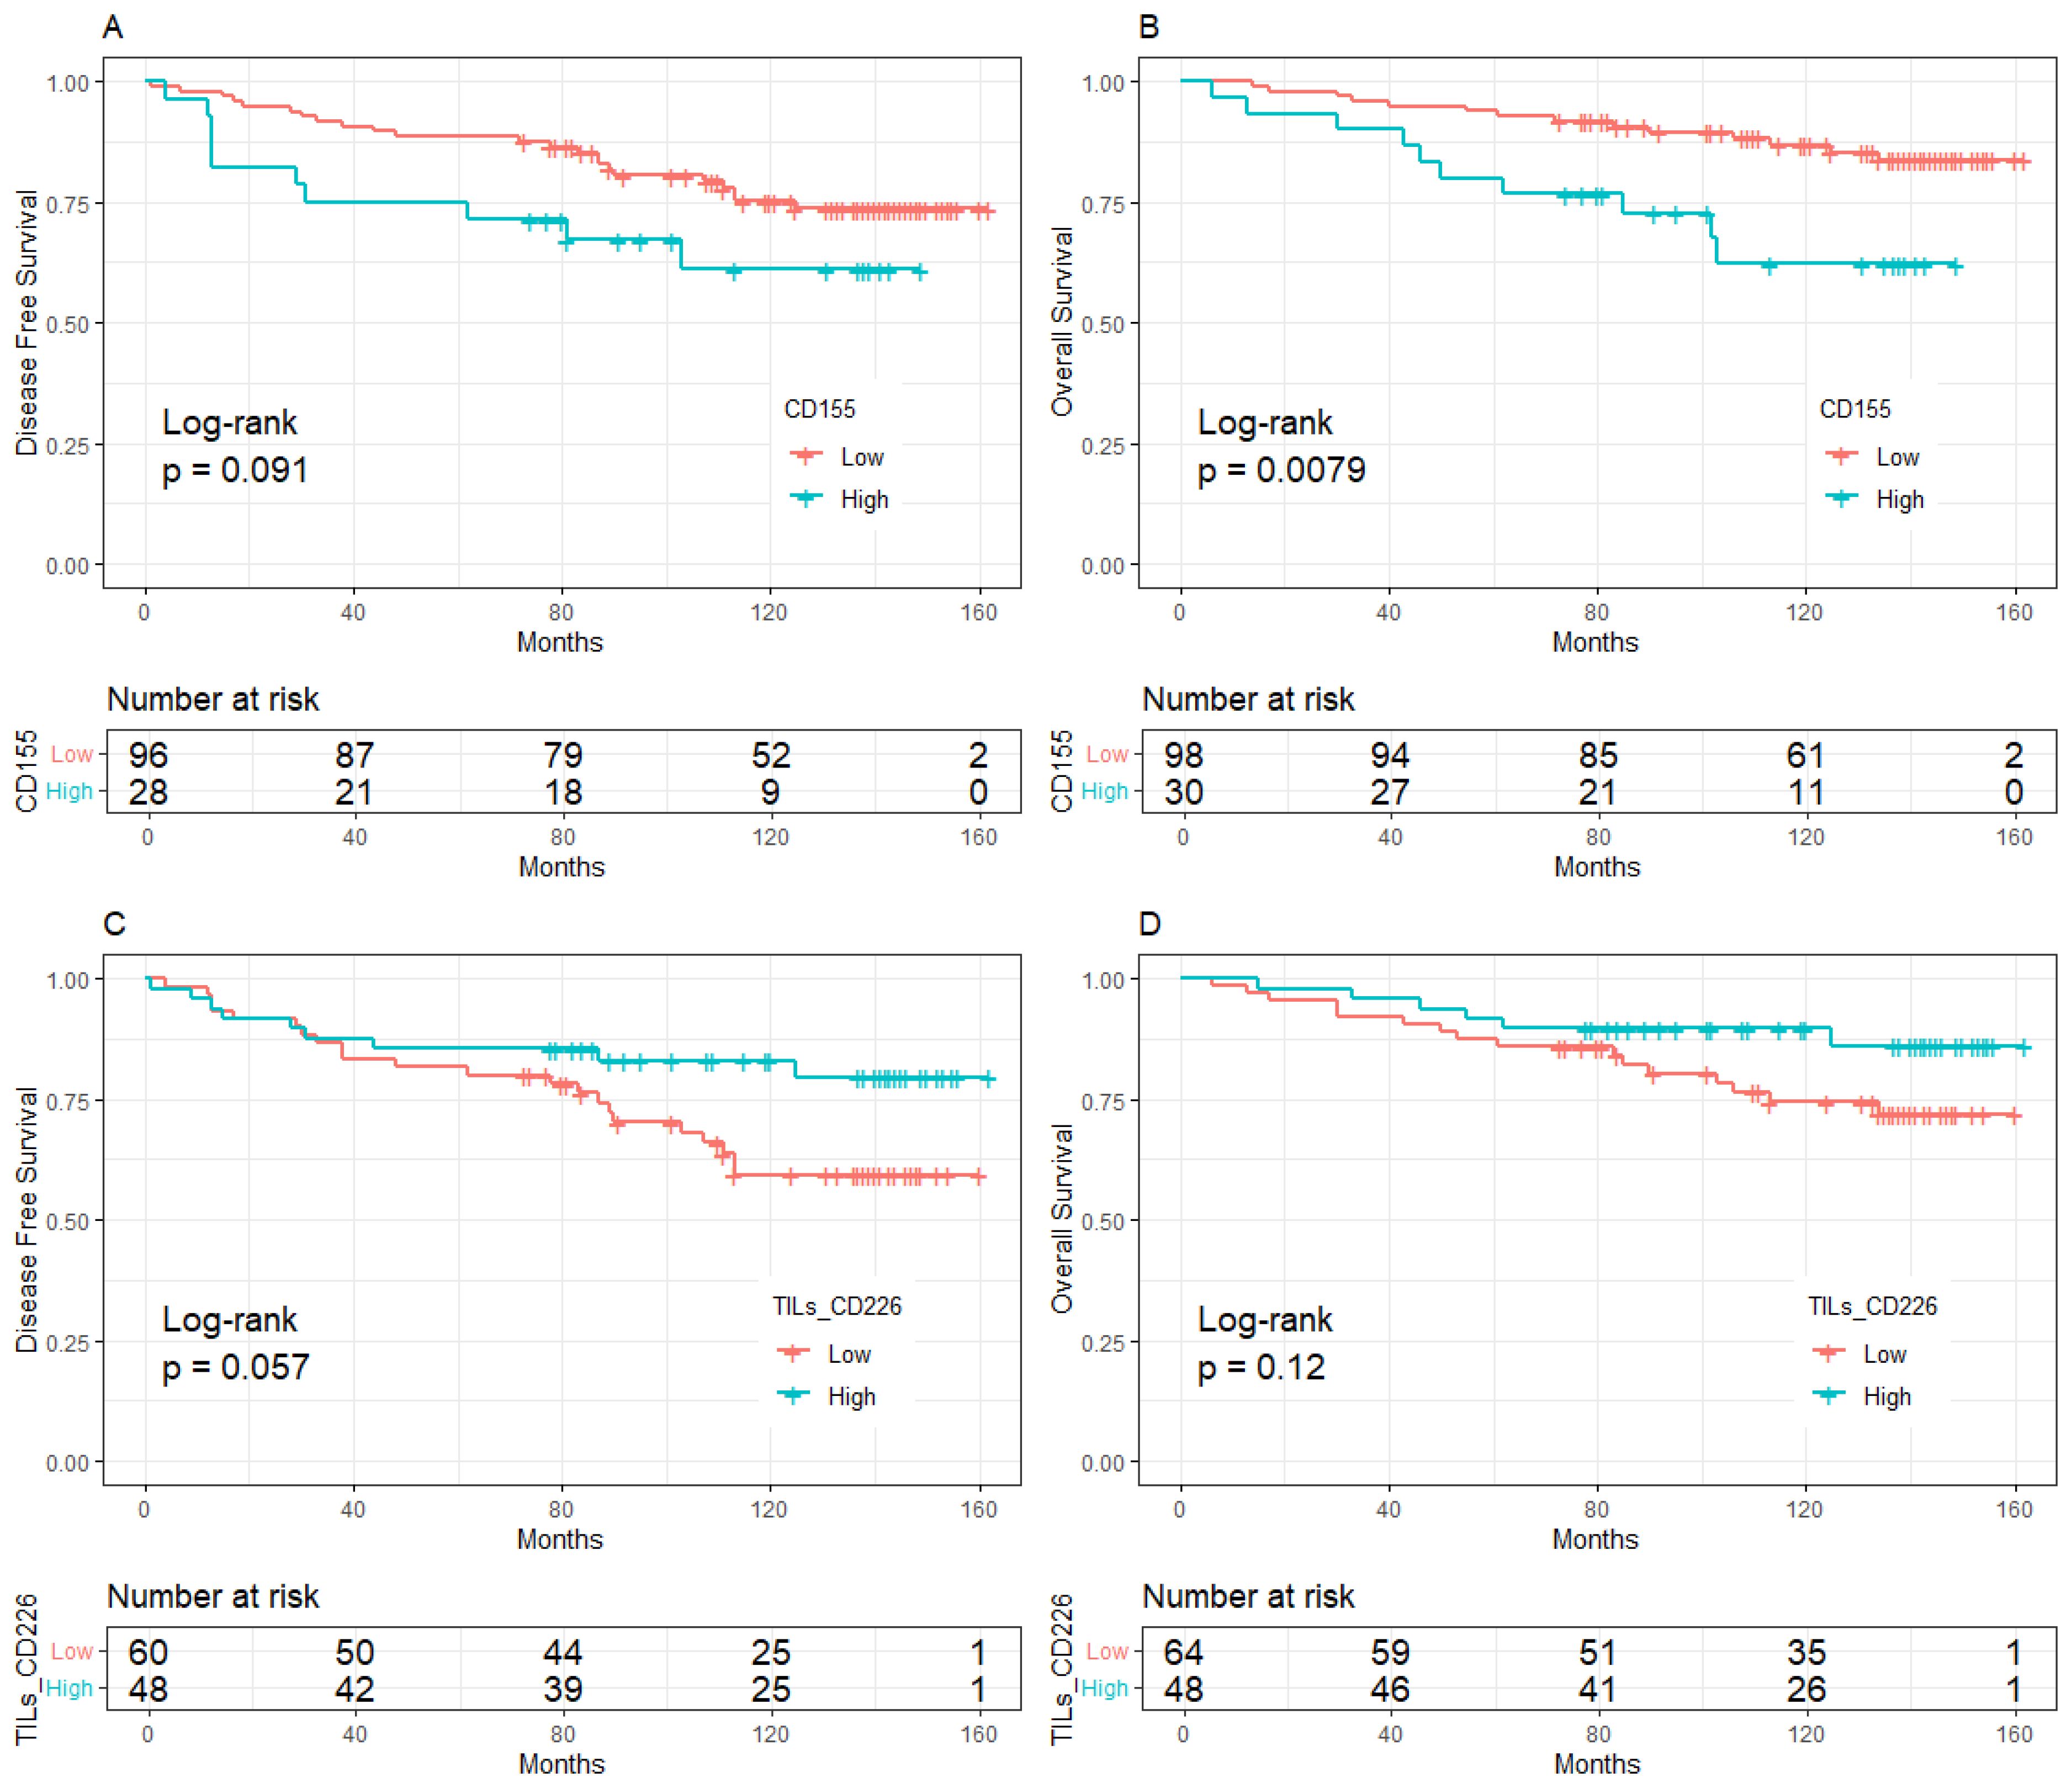
Figure 4. Kaplan-Meier curve of the relationship between molecular expression and prognosis in the population with high level of TILs, (A). CD155 expression and DFS, (B). CD155 expression and OS, (C). CD226 expression on stromal TILs and DFS, (D). CD226 expression on stromal TILs and OS. TILs, Tumor- infiltrating lymphocytes.
In all BC patients, high expression of CD155 increased 2.21-fold the risk of relapse (95%CI:1.18-4.13, Figure 5A) and a 2.57-fold higher risk of death (95%CI:1.29-5.10, Figure 6A). High expression of TC CD226 (HR = 1.79, 95%CI: 1.03-3.11), TC CD96 (HR = 2.65, 95%CI:1.09-6.44), and TIGIT on stromal TILs (HR = 2.06, 95%CI:1.02-4.14) were associated with an increased risk of relapse (Figure 5A). However, high expression of TC TIGIT was associated with a 55% reduction in relapse risk (HR = 0.45, 95%CI:0.24-0.83, Figure 5A) and a 68% reduction in death risk (HR = 0.32, 95%CI:0.16-0.66, Figure 6A). Among patients with low TME infiltration of stromal TILs, high expression of CD155 was associated with poor DFS (HR = 4.39, 95%CI:1.17-16.51, Figure 5B) and OS (HR = 5.18, 95%CI:1.32-20.28, Figure 6B). High TC CD96 expression (HR = 3.50, 95%CI: 1.01-12.21, Figure 5B) was associated with unfavorable DFS, while high TC TIGIT expression was associated with favorable DFS (HR = 0.31, 95%CI:0.12-0.80, Figure 5B) and OS (HR = 0.36, 95%CI: 0.14-0.94, Figure 6B). In patients with high TME infiltration of stromal TILs, high expression of CD155 was associated with a 2.86-fold higher risk of death (HR = 2.86, 95%CI:1.10-7.42, Figure 6C) and high expression of TC CD226 was associated with a 2.29-fold high risk of relapse (HR = 2.29, 95%CI:1.10-4.76, Figure 5C) and a 2.56-fold higher risk of death (HR = 2.56, 95%CI: 1.07-6.11, Figure 6C), while high expression of CD226 on stromal TILs was associated with a favorable DFS (HR = 0.38, 95%CI:0.16-0.89, Figure 5C) and OS (HR = 0.27, 95%CI:0.08-0.84, Figure 6C).
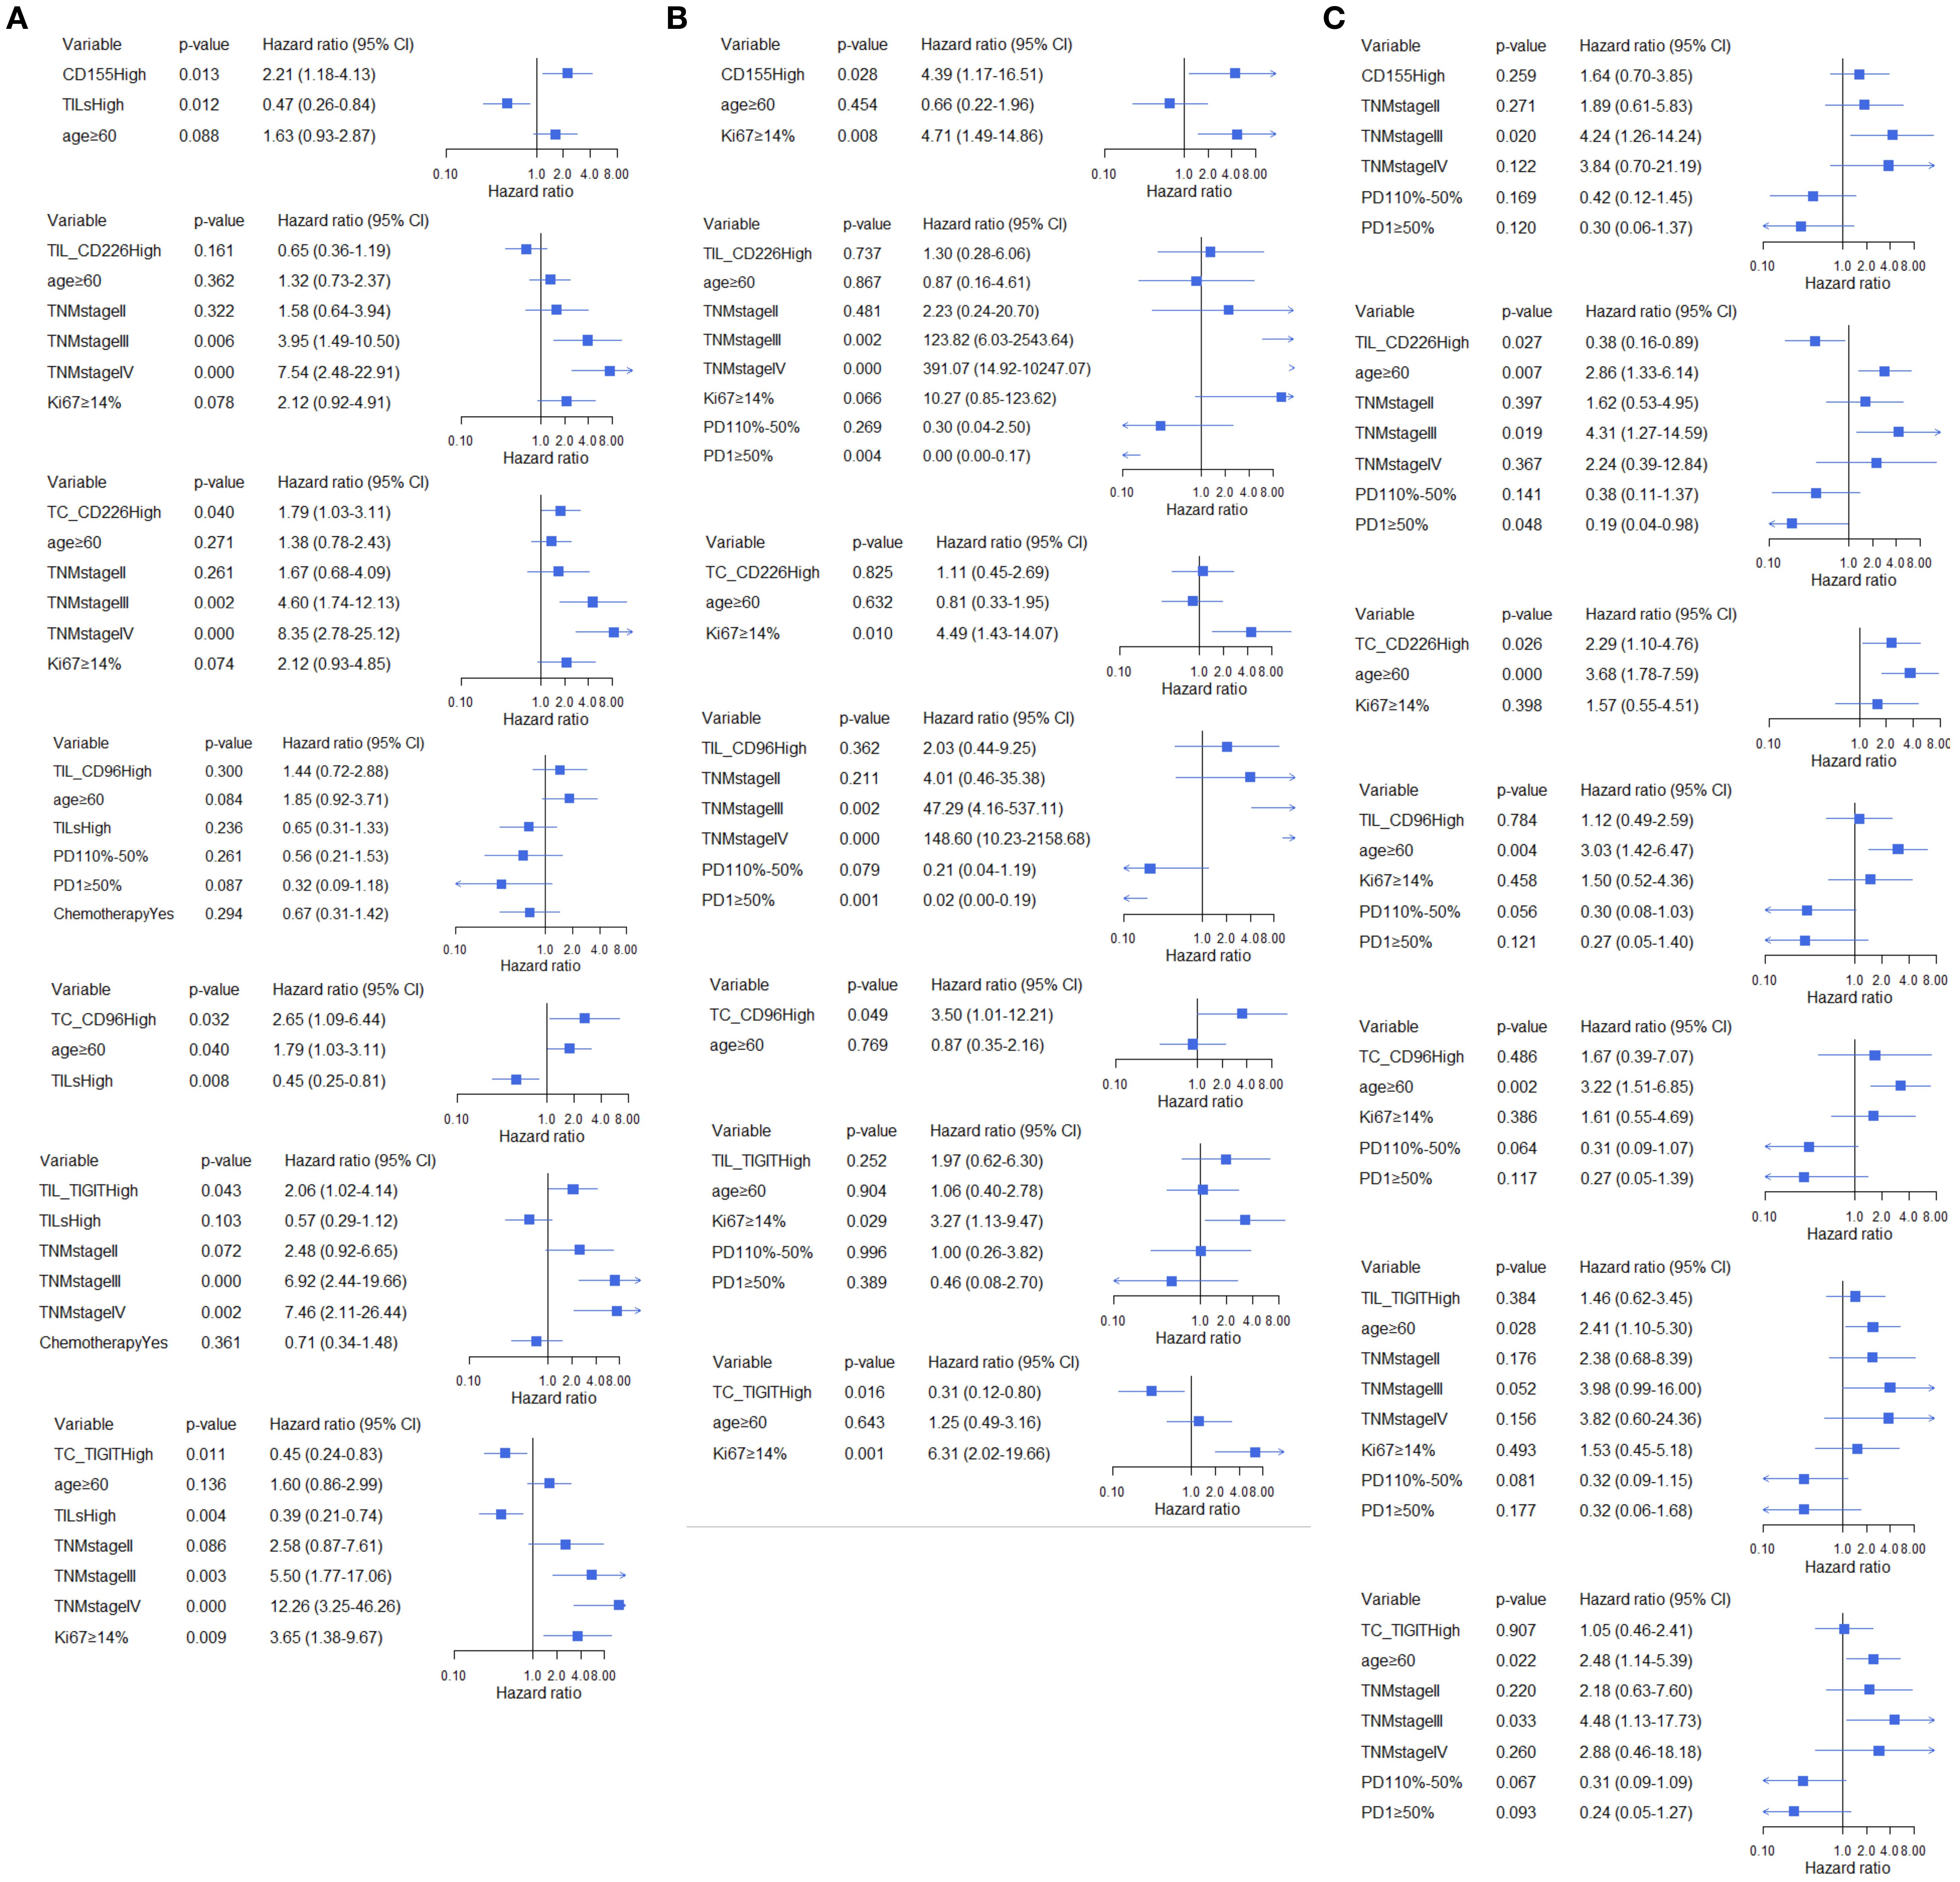
Figure 5. Multivariate analysis of the association between CD155, CD226, TIGIT, and CD96 and DFS across different TILs subgroups, (A) total participants, (B) subgroup with low TME infiltration of TILs, (C) subgroup with high TME infiltration of TILs.
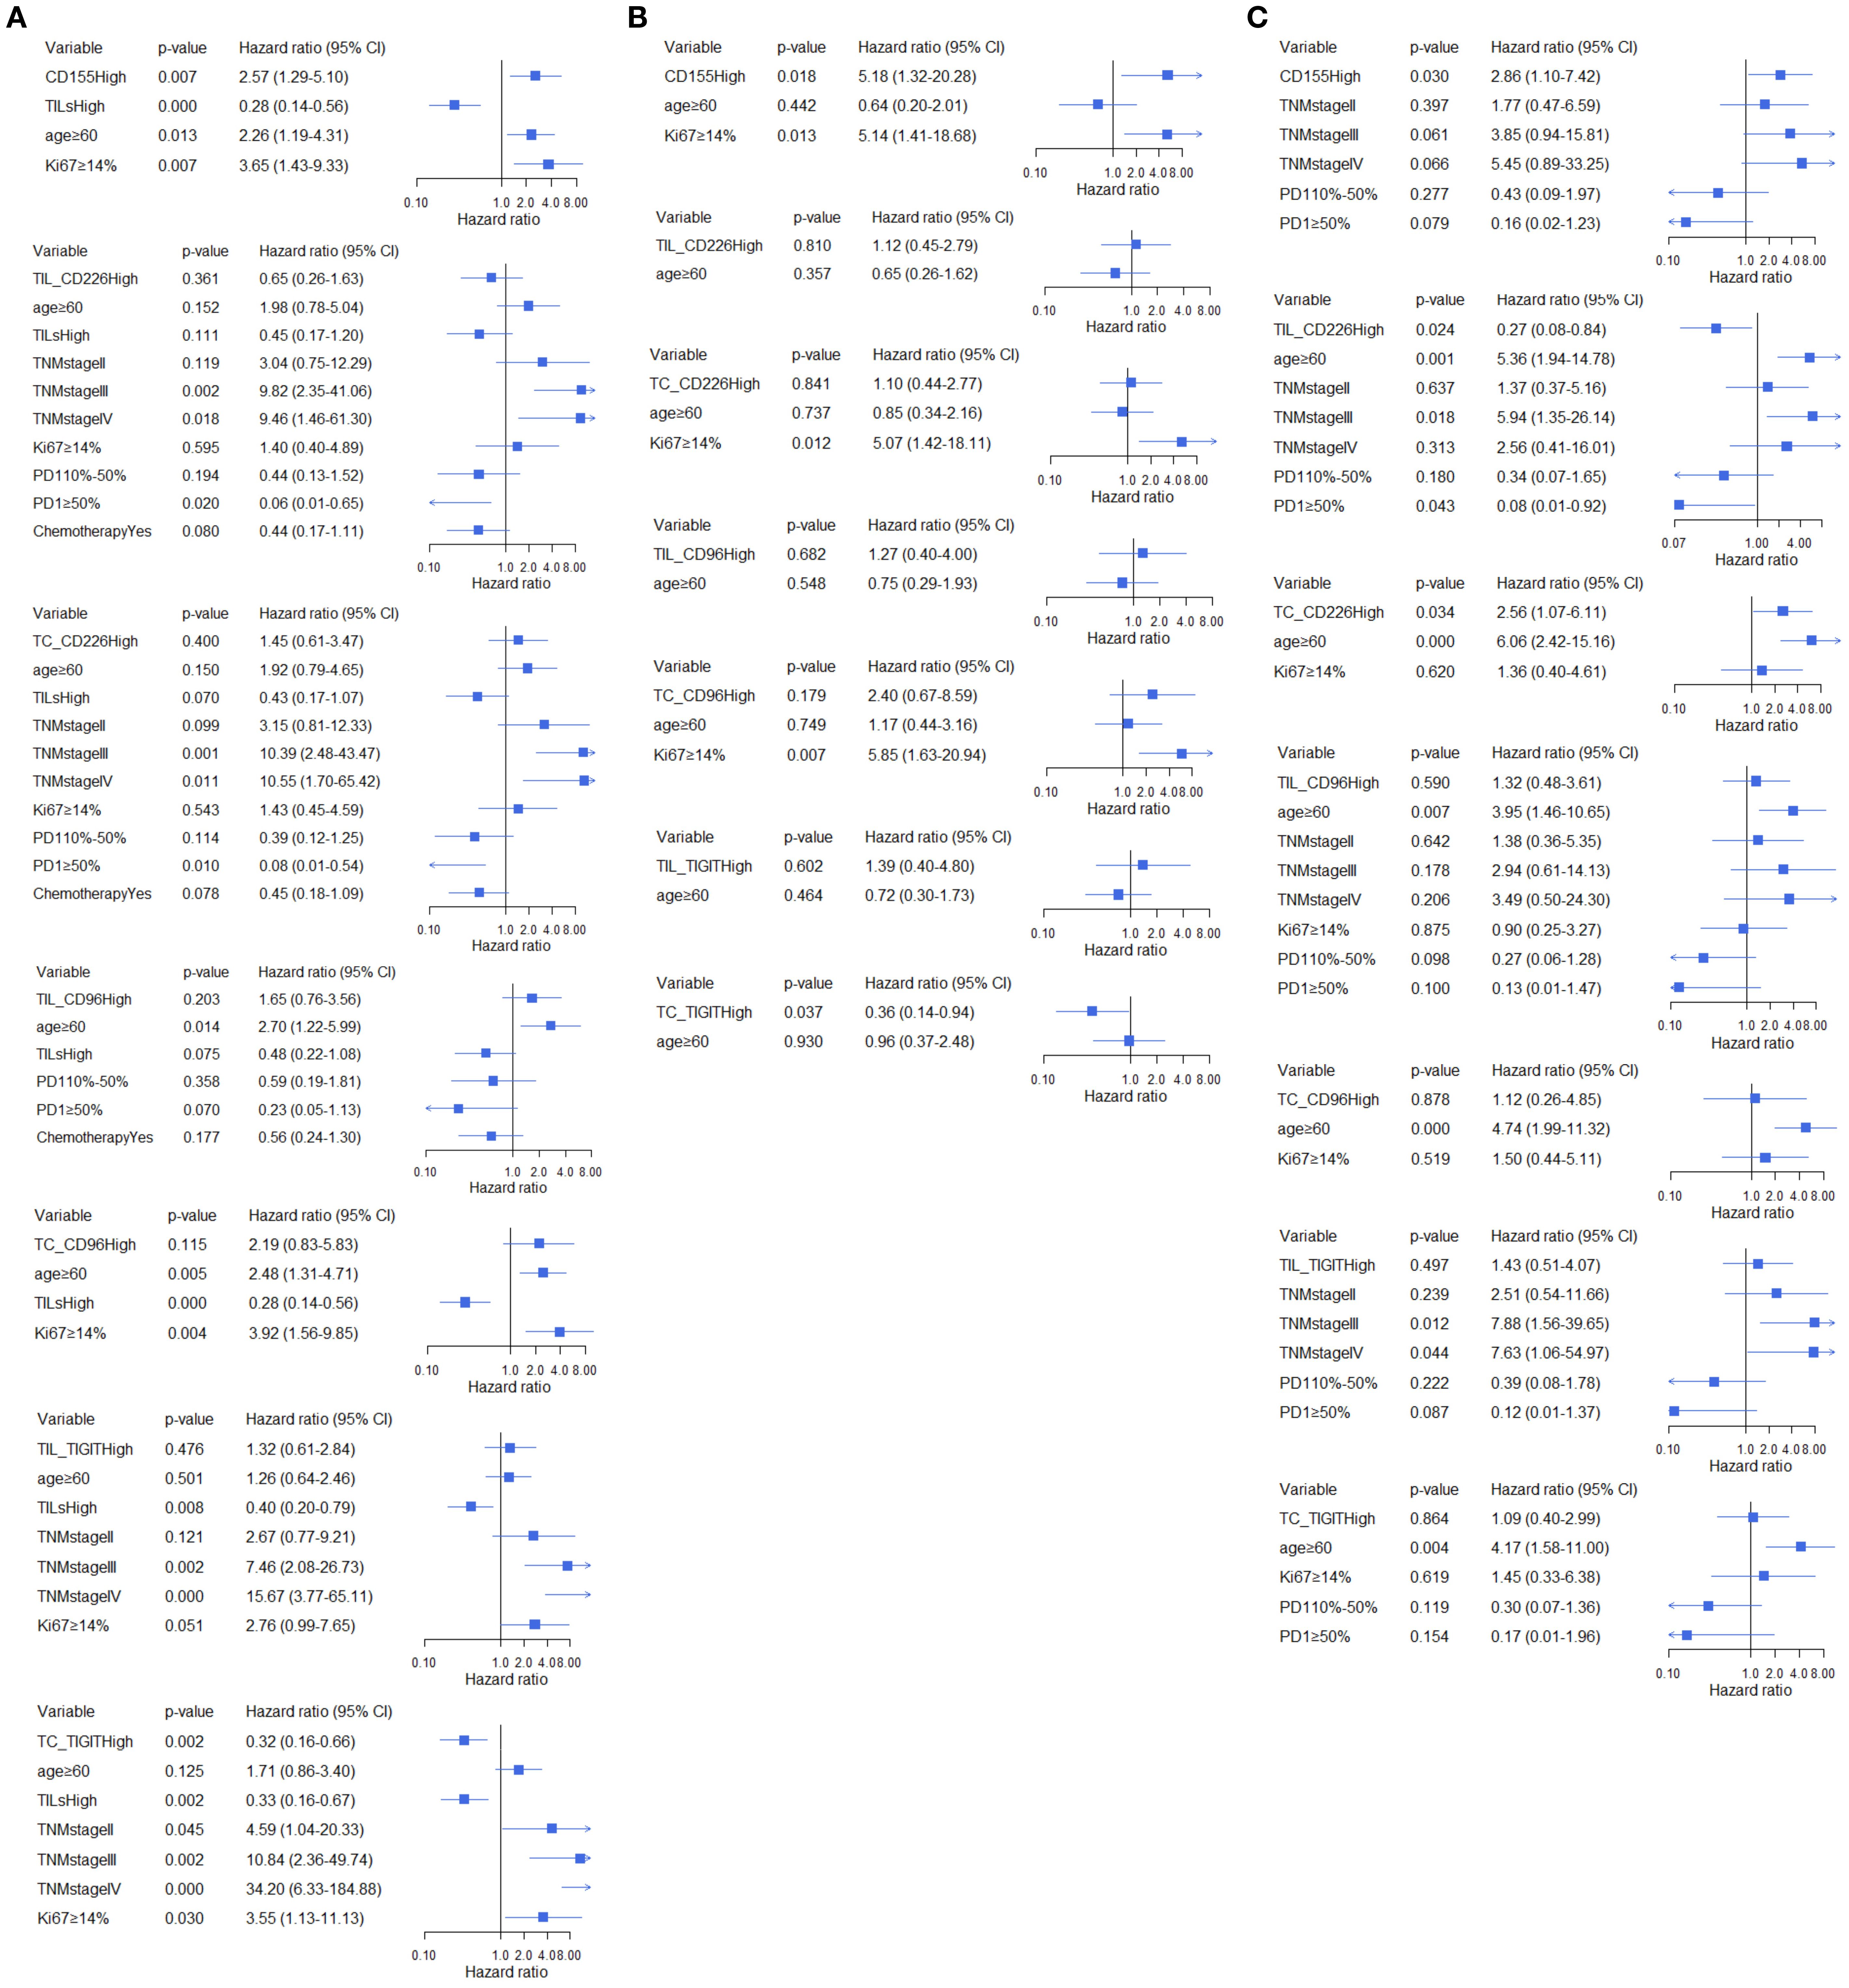
Figure 6. Multivariate analysis of the association between CD155, CD226, TIGIT, and CD96 and OS across different TILs subgroups, (A) total participants, (B) subgroup with low TME infiltration of TILs, (C) subgroup with high TME infiltration of TILs.
Discussion
In this study, CD155 was detected in BC TME TC, and CD226/TIGIT/CD96 was observed to be expressed on both BC stromal TILs and TME TC. The four immune checkpoint molecules were systematically evaluated for the first time to explore their association with the clinical characteristics and prognosis of patients with BC. Previous studies had confirmed the survival benefit of TILs and even the prediction of the response to neoadjuvant chemotherapy (17, 18). TILs had been reported to be capable of guide treatment decisions (19, 20), including ICI immunotherapy (21). The expression of CD155-TIGIT/CD226/CD96 on TC and TILs interacted with TME TILs to exhibit diverse prognostic effects on BC.
Similarly, many studies had reported the upregulation of CD155 and its correlation with age, disease stage, tumor size, molecular subtype, and other clinical characteristics of BC patients (22–24). The unfavorable prognostic effect of high CD155 expression was consistent with that reported by Yong et al. (25), Li et al. (16), Song (26)., Stamm H et al. (27), and Triki H et al. (28). Furthermore, a meta-analysis conducted by Zhang et al. (29) showed an unfavorable effect of CD155 on BC prognosis (pooled HR = 2.137, 95%CI:1.448-3.154). Additionally, CD155 had been confirmed to be linked to the invasion and migration of BC cells, and its downregulation could induce apoptosis of BC cells (30). A recent study demonstrated that fucosylated-CD155 secreted by brain metastasis-associated fibroblasts might regulate intercellular junctions and actin cytoskeleton signaling to enhance BC invasion (31). Asynchronous blocking of PD-L1 and CD155 with polymer nanoparticles had been found to inhibit the progression and metastasis of TNBC (32). CD155 had great potential as a novel immunotherapeutic target in BC.
TIGIT is mainly expressed on immune cells, directly inhibits the immune response by activating immune cells, and indirectly inhibits the anti-tumor response by binding to CD155 (8). This study indicated that TIGIT expression was upregulated in TME stromal TILs and TC in 17.1% and 56.7% of BC patients, respectively, which was consistent with the results found by Tang (33). This study discovered that BC patients with high TIGIT expression in TILs had shorter DFS than those with low TIGIT expression. However, Xie et al. (34) observed that the relationship between TIGIT expression in immune cells and OS was not statistically significant. The main reason for this disparity might be the small sample size of their study. In contrast, Boissiere-Michot et al. (35) considered that high TIGIT expression in stromal cells was associated with longer prognosis in non-molecular apocrine TNBC, possibly because TIGIT had different effects on prognosis in different molecular subtypes. It was necessary to further explore the prognostic value of TIGIT in BC from multiple perspectives to achieve personalized management in the future. In a study conducted by Luo (36). showed that the upregulation of TIGIT expression in cancer tissues among patients with invasive BC, had a trend of good prognosis, although the trend was not statistically significant. Although Song (26). confirmed that upregulated expression of TIGIT in BC tissues was related to poor prognosis (DFS: HR = 5.199, 95%CI:1.477-18.292), Zhang et al. (37) indicated no statistically significant (DFS: HR = 1.110, 95%CI:0.492-2.502) relationship between high TIGIT expression on TC and poor prognosis in TNBC. The inconsistent results observed between studies were related to the variable expression site of TILs or TC. TC-expressing TIGIT indicated a favorable prognosis, but TIL-expressing TIGIT indicated an unfavorable prognosis of BC. TIGIT is a co-inhibitory receptor of CD155 in malignant tumors. Synergistically blocking TIGIT and HIF-1α inhibited the growth and development of BC cells (38). Co-blocking of TIGIT and IL1β activated anti-tumor immunity, inhibited bone metastasis of BC, and improved the survival rate (39). Therefore, upregulation of TIGIT on TILs triggered an immune escape mechanism (40). Similarly, TIGIT might affect the proliferation or inhibit the growth of malignant TC. However, the underlying mechanism needed to be further confirmed.
CD96 was reported to be exclusively expressed on immune cells (9); however, this study verified that CD96 could be detected on both TILs and TC, and 84.8% of patients expressed high levels of CD96 on TC. High expression of CD96 on TC was related to shorter DFS than low expression, especially among patients with low TME infiltration of TILs, in line with the study performed by Li et.al (41). In another study conducted by Xu et.al (42). suggested that high tumoral CD96 expression was associated with a poor prognosis in gastric cancer. The cytoplasmic domain of CD96 contains a short alkaline/proline-rich motif and a single ITIM-like domain with a potential inhibitory function, as well as a YXXM motif with the potential to activate receptors (43). At the same time, bioinformatic analysis performed by Ye et al. (44). exhibited that CD96 played a vital but contradictory role in different cancers. These results indicated that the biological effects of CD96 were not limited to immune cells, and the signal transduction mechanism expressed on TC and immune cells of the BC TME still needed to be further explored.
CD226 is expressed in most tumors, and its high expression is associated with improved clinical outcomes (45). In BC, CD226 was significantly downregulated on the surface of CD56+CD16 +NK cells and CD56+CD16-NK cells (46), and high genetic expression was associated with good prognosis in BC patients with stage II and III, as well as Luminal B (47). However, these data revealed that high CD226 expression in TC and TILs was related to poor and better prognosis, respectively, in the population with more TILs. Nonetheless, two recently published studies showed a favorable prognosis for CD226 on immune cells of gastric cancer (48, 49). CD226 is an activating receptor (50), and its expression on TILs might enhance the anti-tumor ability of TILs (51), whereas its expression on TC contributes to the immune escape ability of TC. The inconsistent prognostic effect of CD226 on stromal TILs and TC required basic studies to explore the underlying mechanism.
This study was the first to evaluate the expression of the CD155-CD226/TIGIT/CD96 protein complex in BC patients and its association with relapse and death. CD155 was reported as an immune checkpoint protein, CD226 as a co-stimulatory receptor of the immune checkpoint axis, and TIGIT and CD96 as co-inhibitory receptors of the immune checkpoint axis. Therefore, CD226 expression on immune cells indicated an increase in immune function and a favorable prognosis, whereas TIGIT expression on immune cells suppressed immune function and was related to an unfavorable prognosis. In contrast, CD226 expression on TC increased immune escape function and an unfavorable prognosis, but TIGIT expression on TC increased cell apoptosis and was associated with a favorable prognosis. CD96 expression on TC seemed to correlate with BC relapse, but the expression on immune cells did not seem to correlate with prognosis. However, these basic mechanisms required further investigation.
Conclusion
CD155 expression was detected solely on TC, and the receptor expression of CD226/TIGIT/CD96 was detected in both TC and stromal TILs in the BC TME. High expression of CD155 indicates an unfavorable prognosis for BC. However, high expression of CD226/TIGIT/CD96 had diverse effects on BC prognosis, CD226 expression on TILs and TIGIT expression on TC correlated with favorable prognosis, and CD226 and CD96 expression on TC and TIGIT expression on TILs may be related to unfavorable prognosis. CD155-CD226/TIGIT/CD96 should be evaluated as a whole complex of immune checkpoint axis molecules to assess prognosis completely. For the diverse effect on prognosis, ICIs targeting the complex axis should check the tumoral and immune expression CD155-CD226/TIGIT/CD96 together.
Data availability statement
The raw data supporting the conclusions of this article will be made available by the authors, without undue reservation.
Ethics statement
The studies involving humans were approved by the Institutional Review Board of Beijing Shijitan Hospital, Capital Medical University. Given the retrospective and de-identified nature of the studies, the aforementioned Institutional Review Board waived the requirement for written informed consent. The studies were conducted in accordance with local legislation and institutional requirements.
Author contributions
XO: Software, Writing – original draft, Data curation, Formal Analysis. JY: Data curation, Writing – original draft. FS: Investigation, Writing – original draft. YZ: Investigation, Writing – original draft. QZ: Investigation, Writing – original draft. KY: Investigation, Writing – original draft. SL: Investigation, Writing – original draft. JW: Investigation, Writing – original draft. YL: Methodology, Writing – original draft. QS: Methodology, Writing – review & editing.
Funding
The author(s) declare financial support was received for the research and/or publication of this article. This research was funded by the Beijing Municipal Committee of Science and Technology (Z19110006619041), High Level Public Health Technical Talents Construction Project from the Beijing Municipal Health Commission (2022-2-025), and Beijing Hospital’s Authority (XMLX202114). The supporting organizations had no role in the study design, data collection, analysis, or interpretation.
Conflict of interest
The authors declare that the research was conducted in the absence of any commercial or financial relationships that could be construed as a potential conflict of interest.
Generative AI statement
The author(s) declare that no Generative AI was used in the creation of this manuscript.
Any alternative text (alt text) provided alongside figures in this article has been generated by Frontiers with the support of artificial intelligence and reasonable efforts have been made to ensure accuracy, including review by the authors wherever possible. If you identify any issues, please contact us.
Publisher’s note
All claims expressed in this article are solely those of the authors and do not necessarily represent those of their affiliated organizations, or those of the publisher, the editors and the reviewers. Any product that may be evaluated in this article, or claim that may be made by its manufacturer, is not guaranteed or endorsed by the publisher.
Supplementary material
The Supplementary Material for this article can be found online at: https://www.frontiersin.org/articles/10.3389/fimmu.2025.1649078/full#supplementary-material
References
1. Bray F, Laversanne M, Sung H, Ferlay J, Siegel RL, Soerjomataram I, et al. Global cancer statistics 2022: GLOBOCAN estimates of incidence and mortality worldwide for 36 cancers in 185 countries. CA Cancer J Clin. (2024) 74:229–63. doi: 10.3322/caac.21834
2. Qu F, Wang G, Wen P, Liu X, and Zeng X. Knowledge mapping of immunotherapy for breast cancer: A bibliometric analysis from 2013 to 2022. Hum Vaccin Immunother. (2024) 20:2335728. doi: 10.1080/21645515.2024.2335728
3. Leon-Ferre RA and Goetz MP. Advances in systemic therapies for triple negative breast cancer. Bmj. (2023) 381:e071674. doi: 10.1136/bmj-2022-071674
4. Zhu Y, Zhu X, Tang C, Guan X, and Zhang W. Progress and challenges of immunotherapy in triple-negative breast cancer. Biochim Biophys Acta Rev Cancer. (2021) 1876:188593. doi: 10.1016/j.bbcan.2021.188593
5. Cejuela M, Vethencourt A, and Pernas S. Immune checkpoint inhibitors and novel immunotherapy approaches for breast cancer. Curr Oncol Rep. (2022) 24:1801–19. doi: 10.1007/s11912-022-01339-4
6. Yu Y, Jin X, Zhu X, Xu Y, Si W, and Zhao J. PD-1/PD-L1 immune checkpoint inhibitors in metastatic triple-negative breast cancer: a systematic review and meta-analysis. Front Immunol. (2023) 14:1206689. doi: 10.3389/fimmu.2023.1206689
7. Yu X, Harden K, Gonzalez LC, Francesco M, Chiang E, Irving B, et al. The surface protein TIGIT suppresses T cell activation by promoting the generation of mature immunoregulatory dendritic cells. Nat Immunol. (2009) 10:48–57. doi: 10.1038/ni.1674
8. Andrews LP, Yano H, and Vignali D. Inhibitory receptors and ligands beyond PD-1, PD-L1 and CTLA-4: breakthroughs or backups. Nat Immunol. (2019) 20:1425–34. doi: 10.1038/s41590-019-0512-0
9. Dougall WC, Kurtulus S, Smyth MJ, and Anderson AC. TIGIT and CD96: new checkpoint receptor targets for cancer immunotherapy. Immunol Rev. (2017) 276:112–20. doi: 10.1111/imr.12518
10. Conner M, Hance KW, Yadavilli S, Smothers J, and Waight JD. Emergence of the CD226 axis in cancer immunotherapy. Front Immunol. (2022) 13:914406. doi: 10.3389/fimmu.2022.914406
11. Zhou R, Chen S, Wu Q, Liu L, Wang Y, Mo Y, et al. CD155 and its receptors in cancer immune escape and immunotherapy. Cancer Lett. (2023) 573:216381. doi: 10.1016/j.canlet.2023.216381
12. Paolini R and Molfetta R. CD155 and its receptors as targets for cancer therapy. Int J Mol Sci. (2023) 24(16):12958. doi: 10.3390/ijms241612958
13. Zhang P, Liu X, Gu Z, Jiang Z, Zhao S, Song Y, et al. Targeting TIGIT for cancer immunotherapy: recent advances and future directions. biomark Res. (2024) 12:7. doi: 10.1186/s40364-023-00543-z
14. Mittal D, Lepletier A, Madore J, Aguilera AR, Stannard K, Blake SJ, et al. CD96 is an immune checkpoint that regulates CD8(+) T-cell antitumor function. Cancer Immunol Res. (2019) 7:559–71. doi: 10.1158/2326-6066.CIR-18-0637
15. Dastouri M, Kilic N, and Yilmaz H. The apoptotic effects of NK-92 cells stimulated with an anti-CD226 antibody on MDA-MB-231 triple-negative breast cancer cells. Med Oncol. (2023) 40:228. doi: 10.1007/s12032-023-02080-z
16. Li YC, Zhou Q, Song QK, Wang RB, Lyu S, Guan X, et al. Overexpression of an immune checkpoint (CD155) in breast cancer associated with prognostic significance and exhausted tumor-infiltrating lymphocytes: A cohort study. J Immunol Res. (2020) 2020:3948928. doi: 10.1155/2020/3948928
17. Denkert C, von Minckwitz G, Darb-Esfahani S, Lederer B, Heppner BI, Weber KE, et al. Tumour-infiltrating lymphocytes and prognosis in different subtypes of breast cancer: a pooled analysis of 3771 patients treated with neoadjuvant therapy. Lancet Oncol. (2018) 19:40–50. doi: 10.1016/S1470-2045(17)30904-X
18. Baez-Navarro X, van den Ende NS, Nguyen AH, Sinke R, Westenend P, van Brakel JB, et al. HER2-low and tumor infiltrating lymphocytes in triple-negative breast cancer: Are they connected? Breast Cancer Res. (2024) 26:41. doi: 10.1186/s13058-024-01783-z
19. Stanton SE and Disis ML. Clinical significance of tumor-infiltrating lymphocytes in breast cancer. J Immunother Cancer. (2016) 4:59. doi: 10.1186/s40425-016-0165-6
20. de Melo GD, Cortes J, Curigliano G, Loi S, Denkert C, Perez-Garcia J, et al. Tumor-infiltrating lymphocytes in Breast Cancer and implications for clinical practice. Biochim Biophys Acta Rev Cancer. (2017) 1868:527–37. doi: 10.1016/j.bbcan.2017.10.003
21. Loi S, Michiels S, Adams S, Loibl S, Budczies J, Denkert C, et al. The journey of tumor-infiltrating lymphocytes as a biomarker in breast cancer: clinical utility in an era of checkpoint inhibition. Ann Oncol. (2021) 32:1236–44. doi: 10.1016/j.annonc.2021.07.007
22. Wang RB, Li YC, Zhou Q, Lv SZ, Yuan KY, Wu JP, et al. Overexpression of CD155 is associated with PD-1 and PD-L1 expression on immune cells, rather than tumor cells in the breast cancer microenvironment. World J Clin cases. (2020) 8:5935–43. doi: 10.12998/wjcc.v8.i23.5935
23. Shibel PEE and Abd Elmaogod EA. Immunohistochemical expression of CD155 in invasive female breast carcinoma and its correlation with tumor infiltrating natural killer cells. Beni Suef Univ J Basic Appl Sci. (2023) 12:32. doi: 10.1186/s43088-023-00370-z
24. Iguchi-Manaka A, Okumura G, Ichioka E, Kiyomatsu H, Ikeda T, Bando H, et al. High expression of soluble CD155 in estrogen receptor-negative breast cancer. Breast Cancer. (2020) 27:92–9. doi: 10.1007/s12282-019-00999-8
25. Yong H, Cheng R, Li X, Gao G, Jiang X, Cheng H, et al. CD155 expression and its prognostic value in postoperative patients with breast cancer. BioMed Pharmacother. (2019) 115:108884. doi: 10.1016/j.biopha.2019.108884
26. Song XN. Expression of TIGIT,CD155 in breast cancer tissues and its relationship with prognosis. Henan Med Res. (2023) 32:3302–05. doi: 10.3969/j.issn.1004-437X.2023.18.010
27. Stamm H, Oliveira-Ferrer L, Grossjohann EM, Muschhammer J, Thaden V, Brauneck F, et al. Targeting the TIGIT-PVR immune checkpoint axis as novel therapeutic option in breast cancer. Oncoimmunology. (2019) 8:e1674605. doi: 10.1080/2162402X.2019.1674605
28. Triki H, Declerck K, Charfi S, Ben KW, Chaabane K, Ben HS, et al. Immune checkpoint CD155 promoter methylation profiling reveals cancer-associated behaviors within breast neoplasia. Cancer Immunol Immunother. (2022) 71:1139–55. doi: 10.1007/s00262-021-03064-6
29. Zhang D, Liu J, Zheng M, Meng C, and Liao J. Prognostic and clinicopathological significance of CD155 expression in cancer patients: a meta-analysis. World J Surg Oncol. (2022) 20:351. doi: 10.1186/s12957-022-02813-w
30. Gao J, Zheng Q, Shao Y, Wang W, and Zhao C. CD155 downregulation synergizes with adriamycin to induce breast cancer cell apoptosis. Apoptosis. (2018) 23:512–20. doi: 10.1007/s10495-018-1473-8
31. Adhikari E, Liu Q, Johnson J, Stewart P, Marusyk V, Fang B, et al. Brain metastasis-associated fibroblasts secrete fucosylated PVR/CD155 that induces breast cancer invasion. Cell Rep. (2023) 42:113463. doi: 10.1016/j.celrep.2023.113463
32. Chen C, Guo Q, Fu H, Yu J, Wang L, Sun Y, et al. Asynchronous blockade of PD-L1 and CD155 by polymeric nanoparticles inhibits triple-negative breast cancer progression and metastasis. Biomaterials. (2021) 275:120988. doi: 10.1016/j.biomaterials.2021.120988
33. Tang L. TIGIT in Human Primary Breast Cancer Expression and Clinical Significance of the Preliminary Discussion. (Master's degree). Jiangsu: Jiangsu University (2023).
34. Xie X, Zhang J, Shi Z, Liu W, Hu X, Qie C, et al. The expression pattern and clinical significance of the immune checkpoint regulator VISTA in human breast cancer. Front Immunol. (2020) 11:563044. doi: 10.3389/fimmu.2020.563044
35. Boissière-Michot F, Chateau MC, Thézenas S, Guiu S, Bobrie A, and Jacot W. Correlation of the TIGIT-PVR immune checkpoint axis with clinicopathological features in triple-negative breast cancer. Front Immunol. (2022) 13:1058424. doi: 10.3389/fimmu.2022.1058424
36. Luo Z. Based on analysis of TCGA database TIGIT expression and clinical significance in invasive breast cancer. (Master's degree). Xinjiang: Xinjiang Medical University (2023).
37. Zhang Y, Zheng ZY, Chen W, Yang YB, and Huang ZX. The clinical significance of TIGIT/CD155 expression in triple negative breast cancer tissues. Chin J Tumor Biotherapy. (2022) 29:750–55. doi: 10.3872/j.issn.1007-385x.2022.08.007
38. Fathi M, Bahmanpour S, Barshidi A, Rasouli H, Karoon KF, Mahmoud SKA, et al. Simultaneous blockade of TIGIT and HIF-1α induces synergistic anti-tumor effect and decreases the growth and development of cancer cells. Int Immunopharmacol. (2021) 101:108288. doi: 10.1016/j.intimp.2021.108288
39. Monteran L, Ershaid N, Scharff Y, Zoabi Y, Sanalla T, Ding Y, et al. Combining TIGIT blockade with MDSC inhibition hinders breast cancer bone metastasis by activating antitumor immunity. Cancer Discov. (2024) 14:1252–75. doi: 10.1158/2159-8290.CD-23-0762
40. Mollavelioglu B, Cetin AE, Cabioglu N, Abbasov A, Onder S, Emiroglu S, et al. High co-expression of immune checkpoint receptors PD-1, CTLA-4, LAG-3, TIM-3, and TIGIT on tumor-infiltrating lymphocytes in early-stage breast cancer. World J Surg Oncol. (2022) 20:349. doi: 10.1186/s12957-022-02810-z
41. Li J, Xia Q, Di C, Li C, Si H, Zhou B, et al. Tumor cell-intrinsic CD96 mediates chemoresistance and cancer stemness by regulating mitochondrial fatty acid β-oxidation. Adv Sci (Weinh). (2023) 10:e2202956. doi: 10.1002/advs.202202956
42. Xu C, Fang H, Gu Y, Yu K, Wang J, Lin C, et al. Impact of intratumoural CD96 expression on clinical outcome and therapeutic benefit in gastric cancer. Cancer Sci. (2022) 113:4070–81. doi: 10.1111/cas.15537
43. Georgiev H, Ravens I, Papadogianni G, and Bernhardt G. Coming of age: CD96 emerges as modulator of immune responses. Front Immunol. (2018) 9:1072. doi: 10.3389/fimmu.2018.01072
44. Ye W, Luo C, Liu F, Liu Z, and Chen F. CD96 correlates with immune infiltration and impacts patient prognosis: A pan-cancer analysis. Front Oncol. (2021) 11:634617. doi: 10.3389/fonc.2021.634617
45. Ma P and Sun W. Integrated single-cell and bulk sequencing analyses with experimental validation identify the prognostic and immunological implications of CD226 in pan-cancer. J Cancer Res Clin Oncol. (2023) 149:14597–617. doi: 10.1007/s00432-023-05268-y
46. Huang MJ. The distribution characteristics of NK cells in patients with invasive breast cancer and the construction of NK cell activation system in vitro and its biological significance. (Master's degree). Jiangsu: Suzhou university (2021).
47. Tan W, Liu M, Wang L, Guo Y, Wei C, Zhang S, et al. Novel immune-related genes in the tumor microenvironment with prognostic value in breast cancer. BMC Cancer. (2021) 21:126. doi: 10.1186/s12885-021-07837-1
48. Zhang Y, Zhao ZX, Gao JP, Huang YK, and Huang H. Tumor-infiltrating CD226(+)CD8(+) T cells are associated with postoperative prognosis and adjuvant chemotherapeutic benefits in gastric cancer patients. J Cancer Res Clin Oncol. (2023) 149:4381–89. doi: 10.1007/s00432-022-04346-x
49. Huang H, Huang Z, Ge J, Yang J, Chen J, Xu B, et al. CD226 identifies functional CD8(+)T cells in the tumor microenvironment and predicts a better outcome for human gastric cancer. Front Immunol. (2023) 14:1150803. doi: 10.3389/fimmu.2023.1150803
50. Wang H, Qi J, Zhang S, Li Y, Tan S, and Gao GF. Binding mode of the side-by-side two-IgV molecule CD226/DNAM-1 to its ligand CD155/Necl-5. Proc Natl Acad Sci U.S.A. (2019) 116:988–96. doi: 10.1073/pnas.1815716116
Keywords: CD155-TIGIT/CD226/CD96 immune checkpoint molecules, prognosis, breast cancer, tumor cells, tumor-infiltrating lymphocytes, tumor microenvironment
Citation: Ou X, Yin J, Shi F, Zhao Y, Zhou Q, Yuan K, Lyu S, Wu J, Li Y and Song Q (2025) CD155-TIGIT/CD96/CD226 immune checkpoint axis interacting with tumor-infiltrating lymphocytes to exhibit diverse prognostic effects on breast cancer: a cohort study. Front. Immunol. 16:1649078. doi: 10.3389/fimmu.2025.1649078
Received: 18 June 2025; Accepted: 06 October 2025;
Published: 16 October 2025.
Edited by:
Jorge Morales-Montor, National Autonomous University of Mexico, MexicoReviewed by:
Anna Fialová, SOTIO a.s., CzechiaNoorwati Sutandyo, Dharmais Hospital National Cancer Center, Indonesia
Copyright © 2025 Ou, Yin, Shi, Zhao, Zhou, Yuan, Lyu, Wu, Li and Song. This is an open-access article distributed under the terms of the Creative Commons Attribution License (CC BY). The use, distribution or reproduction in other forums is permitted, provided the original author(s) and the copyright owner(s) are credited and that the original publication in this journal is cited, in accordance with accepted academic practice. No use, distribution or reproduction is permitted which does not comply with these terms.
*Correspondence: Qingkun Song, c29uZ3FpbmdrdW5AY2NtdS5lZHUuY24=