 Yao-Chi Zeng1*Cui-Yu Li1Xiao-Li Song1Shu-Fen Huang2Yi Xie3Juan Zeng4Rui Yuan5
- 1Department of Clinical Nutrition, Shenzhen Traditional Chinese Medicine Hospital, Shenzhen, China
- 2Department of Health Education, Shenzhen Traditional Chinese Medicine Hospital, Shenzhen, China
- 3Department of Infection Control, Shenzhen Traditional Chinese Medicine Hospital, Shenzhen, China
- 4Department of Central Sterile Supply, Shenzhen Traditional Chinese Medicine Hospital, Shenzhen, China
- 5Department of Clinical Laboratory, Shenzhen Traditional Chinese Medicine Hospital, Shenzhen, China
Background: This study investigates the relationship between food-specific IgG antibodies and nutritional status in underweight populations, addressing a critical gap in existing research focused predominantly on obesity. It aims to elucidate immune-mediated mechanisms linking food intolerance to abnormal body composition through multidimensional statistical modeling.
Methods: A retrospective analysis of 1,237 underweight patients (BMI <18.5 kg/m²) included IgG antibody profiling for 14 food antigens (ELISA) and clinical/demographic data. Statistical methods encompassed Spearman correlations, linear regression, factor analysis, and generalized linear models (adjusted for age, gender, comorbidities). Child (n=421) and adult (n=816) cohorts were analyzed separately using R 4.3.0 and GraphPad Prism 9.0.
Results: In children, wheat-specific IgG levels showed a robust inverse correlation with BMI-for-age Z-scores (BAZ) (β = -0.319 to -0.357, p ≤ 0.010), explaining 2.18% of BAZ variance. Factor analysis identified a food sensitivity component (wheat/soy IgG loadings: 0.643–0.654) correlating with BAZ (r = 0.349). Adults exhibited significant inverse associations between soybean IgG and BMI (β = -1.1085, p = 0.0003), explaining 1.67% of variance. Bilirubin metabolism (factor loadings: 0.899–0.991) and hepatic function markers (ALT/GGT: r = 0.372–0.425) showed strong BMI correlations. Cluster analysis revealed distinct IgG profiles, with underweight subgroups demonstrating elevated wheat (p = 0.001) and soybean (OR = 2.4, p < 0.001) sensitization.
Conclusion: Food-specific IgG profiles, particularly wheat and soybean antibodies, are independently associated with nutritional status in underweight populations. These findings suggest immune-mediated pathways may contribute to malabsorption and metabolic dysregulation, supporting IgG testing for personalized dietary interventions. Study limitations include small subgroup sizes, underscoring the need for mechanistic research integrating gut microbiota analysis.
1 Introduction
The role of immunoglobulin G (IgG) antibodies in mediating food-related immune responses has garnered increasing attention in nutritional science, particularly concerning metabolic dysregulation (1, 2). Food-specific IgG antibodies, distinct from IgE-mediated allergic reactions, are implicated in delayed immune responses to dietary antigens, potentially contributing to chronic inflammation and impaired nutrient absorption (3). While substantial evidence links elevated IgG levels to obesity-related metabolic disturbances—including insulin resistance and dyslipidemia (4)—research remains disproportionately focused on overweight populations, with clinical protocols often prioritizing IgG testing for weight management interventions (5). Recent investigations have revealed that IgG specifically accumulates in adipose tissue of obese individuals, not only inducing local inflammation but also directly interfering with insulin receptor binding via its Fc-CH3 domain, thereby impairing adipogenesis and metabolic function (6).
This obesity-centric paradigm overlooks the potential bidirectional relationships between IgG profiles and nutritional status across the body mass index (BMI) spectrum, particularly in underweight individuals where immune-mediated malabsorption may exacerbate energy deficits.
Underweight status (BMI <18.5 kg/m²) affects over 462 million adults globally, with disproportionate prevalence in low-income regions and populations with chronic comorbidities (7). It is important to note that the role of food-specific IgG, particularly the IgG4 subclass, remains controversial: it may represent a normal adaptive immune response to persistent dietary antigen exposure, promoting regulatory T-cell-mediated tolerance; conversely, elevated food-specific IgG levels have also been associated with increased intestinal permeability and inflammatory conditions, as observed in eosinophilic esophagitis, irritable bowel syndrome, and related disorders (8).
Despite established associations between IgG-mediated food intolerance and gastrointestinal dysfunction, mechanistic studies examining immune-nutrition interactions in undernutrition remain scarce (9). Emerging evidence suggests that persistent IgG reactivity to common dietary antigens, such as wheat and soy, may impair intestinal barrier integrity, potentially disrupting micronutrient absorption and hepatic metabolism (10). Studies have identified that humans naturally harbor circulating IgG antibodies reactive to peptide hormones (such as ghrelin), which may function as carrier molecules that protect hormones from degradation and modulate their receptor binding, suggesting complex regulatory roles for IgG across different nutritional states (11). However, critical gaps persist in understanding whether elevated IgG titers in underweight individuals represent adaptive responses to nutrient deprivation or pathogenic drivers of metabolic dysregulation, limiting the development of targeted nutritional therapies.
This study addresses the obesity-centric bias in IgG research by investigating immune-mediated pathways linking food-specific IgG profiles to abnormal body composition in underweight populations. Building on prior work demonstrating IgG-guided dietary efficacy in irritable bowel syndrome (12), we hypothesize that specific IgG patterns may serve as biomarkers for immune-mediated malabsorption. It is worth emphasizing that current diagnostic guidelines from major allergy and immunology societies do not recommend routine use of IgG testing for diagnosing food allergies and intolerances, as these antibodies may indicate exposure or underlying inflammation rather than causative mechanisms; however, this study aims to further clarify their clinical relevance through more refined design (8).Our analysis extends beyond univariate associations to model multifactorial interactions between IgG reactivity, hepatic function, and nutritional biomarkers—a novel approach bridging immunology and clinical nutrition.
Our investigation focuses on a cohort from Shenzhen, China (2022–2023), a characteristic immigrant city with a culturally diverse population and consequently highly integrated dietary habits, incorporating Cantonese, Hunanese, Sichuanese, and other regional culinary traditions (13).
Methodologically, we employ retrospective cohort analysis with pediatric-adult stratification to account for developmental variations in immune responses and nutritional requirements. Advanced statistical modeling integrates IgG profiling against 14 food antigens with clinical covariates, enabling detection of subtle immune-metabolic interactions often obscured in smaller studies. This approach builds upon methodologies validated in obesity research (14) while introducing age-specific adjustments for growth parameters and comorbidity profiles.
The identification of wheat and soybean IgG as independent predictors of nutritional status holds significant clinical implications. These findings align with proteomic studies identifying wheat-derived peptides as triggers of intestinal immune activation (4), suggesting IgG testing could personalize dietary interventions for underweight patients. Furthermore, observed correlations between IgG profiles and hepatic markers extend current models of the gut-liver axis, complementing emerging research on microbiota-immune interactions in malnutrition (15). By establishing IgG as a modifiable factor in undernutrition, this work advances precision nutrition strategies while highlighting the need for longitudinal studies integrating microbiome analysis and metabolomic profiling (16, 17).
2 Methods
2.1 Study population and data collection
This retrospective study analyzed data from 1,280 patients with recorded BMI measurements who received treatment between January 2022 and December 2023. Data collected from electronic medical records included patient demographics (age, sex, geographic region) and clinical history (documented comorbidities and duration of underweight status). The analysis included a wide range of clinical parameters: metabolic assessments of liver and renal function, blood biochemistry profiles, lipid and glucose metabolism indicators, complete blood count, immune system markers, vitamin levels, thyroid function tests, and muscle enzyme measurements. Food-specific IgG antibodies were tested for common dietary components including milk, eggs, wheat, rice, corn, soy, seafood (cod, crab, shrimp), and meats (beef, pork, chicken). All biochemical measurements were evaluated against established reference ranges and classified as low, normal, or high based on standardized thresholds.
2.2 Laboratory analyses
Food-specific IgG antibodies for milk, egg, wheat, rice, corn, soybean, tomato, cod, crab, mushroom, shrimp, beef, pork, and chicken were all determined using enzyme-linked immunosorbent assay (ELISA) kits (manufacturer details withheld for anonymization) following the standardized protocol described by Patil et al. (18). Serum samples underwent a four-step process: 1) antigen-coated plate incubation (2 hours, 37°C), 2) blocking with 5% bovine serum albumin (30 minutes, room temperature), 3) serum sample incubation (1:100 dilution, 1 hour, 37°C), and 4) horseradish peroxidase-conjugated secondary antibody detection (45 minutes, 37°C). Optical density values were measured at 450 nm using a microplate reader, with results expressed as kilounits per liter (kU/L). Positive thresholds followed manufacturer-defined cutoffs (>12 kU/L for all antigens). Except, the following indicators were systematically assessed in this study. Basic demographic information, including age group and gender, was collected through standardized questionnaires. BMI was calculated from objectively measured height and weight. Liver function parameters, including alanine aminotransferase (ALT), aspartate aminotransferase (AST), gamma-glutamyl transferase (GGT), total bilirubin (TB), direct bilirubin (DB), and indirect bilirubin (IB), were analyzed using an automated biochemical analyzer. Renal function was assessed by measuring urea, creatinine (CREA), and uric acid (UA) with the same automated biochemical analyzer, while cystatin C (CysC) was determined by immunoturbidimetric assay. The glomerular filtration rate (GFR) was estimated based on CREA levels. Protein nutritional status indicators, including total protein (TP), albumin (ALB), globulin (GLB), and prealbumin (PA), were measured using an automated biochemical analyzer, with PA quantified via immunoturbidimetry. Vitamin status was evaluated by measuring 25-hydroxyvitamin D using a chemiluminescence immunoassay, and vitamins K1 and K2 were assessed using enzyme-linked immunosorbent assay (ELISA).
2.3 Statistical analysis
2.3.1 Descriptive statistics
The IgG-positive rate was calculated as the percentage of patients exceeding the diagnostic threshold for each antigen. BMI distribution was characterized using median, interquartile range (IQR), and 95% confidence intervals (CIs). Continuous variables were tested for normality via Shapiro-Wilk tests (α = 0.05).
2.3.2 Correlation analysis
Spearman’s rank-order correlation coefficient (ρ) quantified associations between IgG antibody titers (log10-transformed to normalize skewness) and BMI values. Nonparametric methods were selected due to non-normal distributions of IgG titers (p < 0.001 for Kolmogorov-Smirnov tests). Significance thresholds were adjusted using Benjamini-Hochberg correction for multiple comparisons across 14 antigens.
2.3.3 Factor analysis
Principal component analysis (PCA) reduced dimensionality in the IgG antibody dataset (14 variables). Components with eigenvalues >1.0 were retained based on Kaiser’s criterion. Varimax rotation optimized interpretability of factor loadings. IgG titers were z-score standardized prior to PCA to eliminate scale-dependent biases.
2.4 Regression modeling
The analysis employed two multivariate models. A linear regression model used BMI as the dependent variable with log10-transformed IgG titers as primary predictors. Additionally, a generalized linear model was developed with adjustments for age (continuous), sex (categorical: male/female/other), and comorbidity burden (ordinal: 0, 1–2, ≥3 conditions). Variance inflation factors (VIFs) were used to assess multicollinearity with a threshold of VIF <5).
2.5 Computational tools and software
Analyses were conducted in R 4.3.0 (R Foundation for Statistical Computing) using the stats package for regression and PCA, and factoextra for cluster visualization.
3 Results
3.1 Cohort establishment and data quality control
Systematic data cleaning of 1,280 initial records yielded 1,237 analyzable cases after excluding 43 participants below age 5. The final cohort comprised 421 children (5–18 years) and 816 adults (>18 years), with complete age and BMI data retained per study protocol. Pediatric participants included 144 underweight cases (BAZ < −1 + clinical diagnosis) versus 277 non-underweight controls (Supplementary Table 1), while adults contained 218 underweight cases (BMI < 18.5 + diagnosis) versus 598 non-underweight controls (Supplementary Table 2). Gender distribution revealed a predominantly male pediatric cohort (54%) contrasting with a female-dominated adult population (74.6%) (Supplementary Table 1, 2).we next investigated whether nutritional biomarkers could better differentiate clinical subgroups.
3.2 Biomarker profiles and food sensitivity patterns in children
Vitamin K2 sufficiency differed significantly between groups (94.6% nutrition problem vs. 89.5% controls, p = 0.013), while vitamin D deficiency rates inversely varied (10.8% vs. 23.6%, p = 0.017, Table 1). Food-specific IgG analysis revealed marked wheat sensitization differences (p = 0.001), with the nutrition problem group showing higher grade 2 (22.9% vs. 15.3%) and grade 3 (10.4% vs. 2.9%) responses (Table 1). Mushroom IgG responses showed borderline significance (p = 0.049), while other antigens demonstrated no significant between-group variation (Table 1). To elucidate the interplay between these biomarkers and anthropometric measures, we conducted multivariate factor analysis. To establish baseline characteristics for subsequent analyses, we next analyzed population demographics and symptom profiles across age groups.
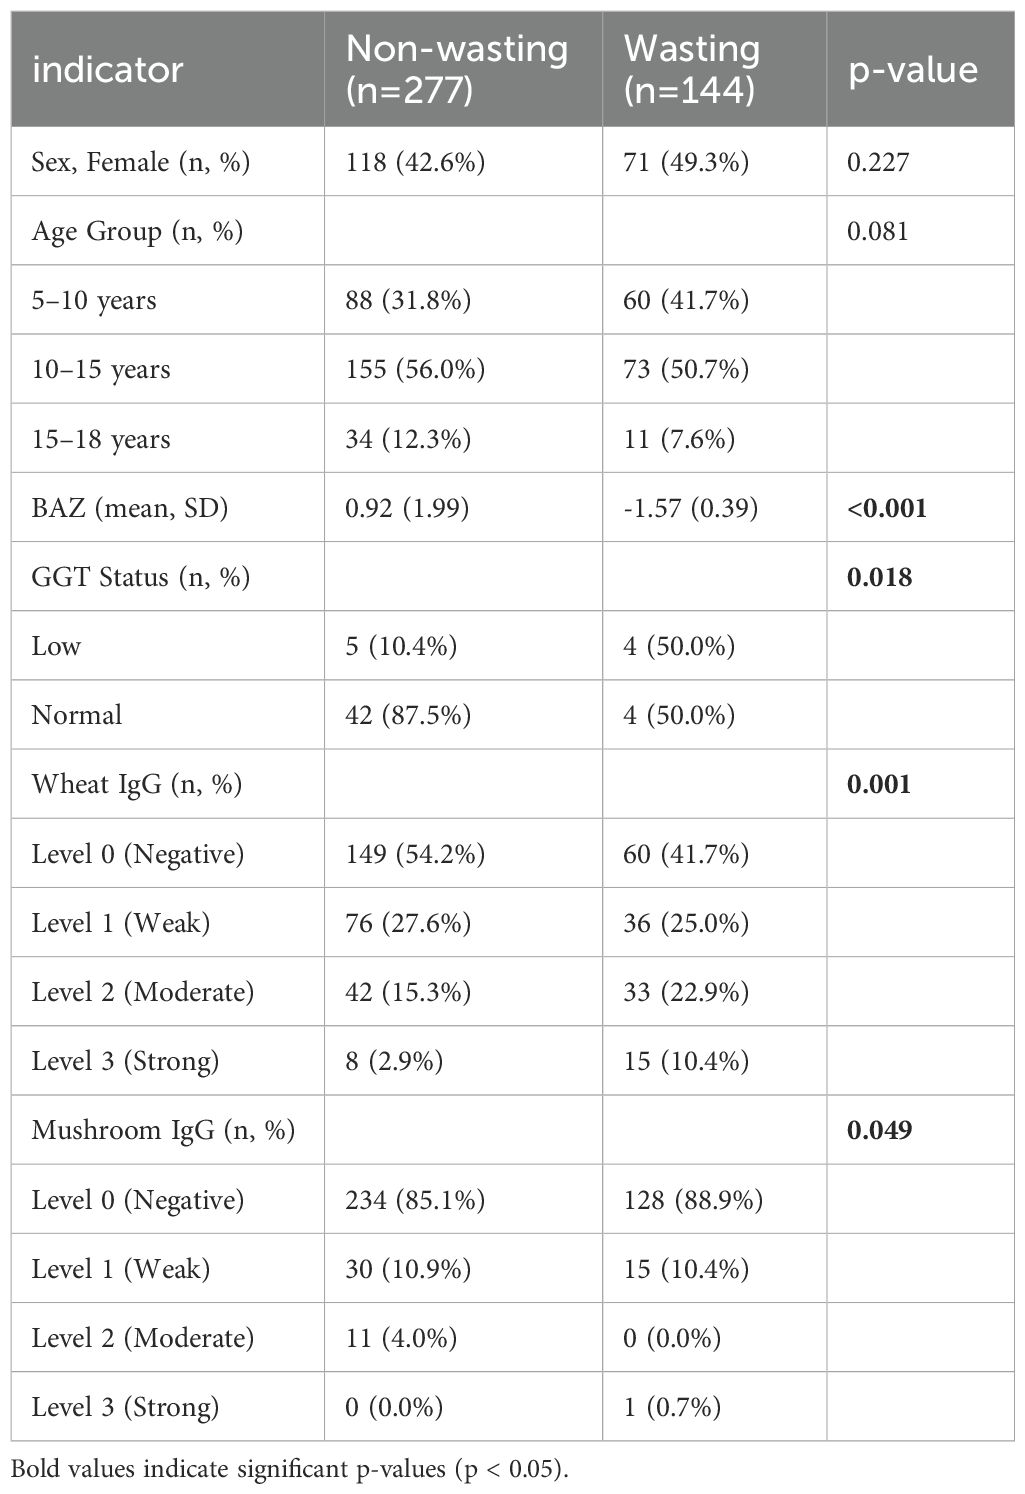
Table 1. Comparison of significant baseline characteristics between children with and without underweight status.
3.3 Pediatric population characteristics and symptom correlations
The pediatric cohort (median age 8.2 years, IQR 5.4–11.3) exhibited high malnutrition prevalence (49.0%, 201/410) alongside substantial obesity rates (22.7%, 93 patients). Malnutrition (ρ = −0.570, p < 0.001) and wasting (ρ = −0.562, p < 0.001) demonstrated strong inverse correlations with BAZ, while obesity showed the strongest positive association (ρ = 0.854, p < 0.001). Fatty liver disease displayed moderate positive correlation (ρ = 0.408, p < 0.001), whereas growth retardation showed weaker negative association (ρ = −0.180, p < 0.001). Common symptoms, including allergic rhinitis, constipation, and sleep disorders, showed no significant BAZ relationships after multiple testing correction (Table 2).
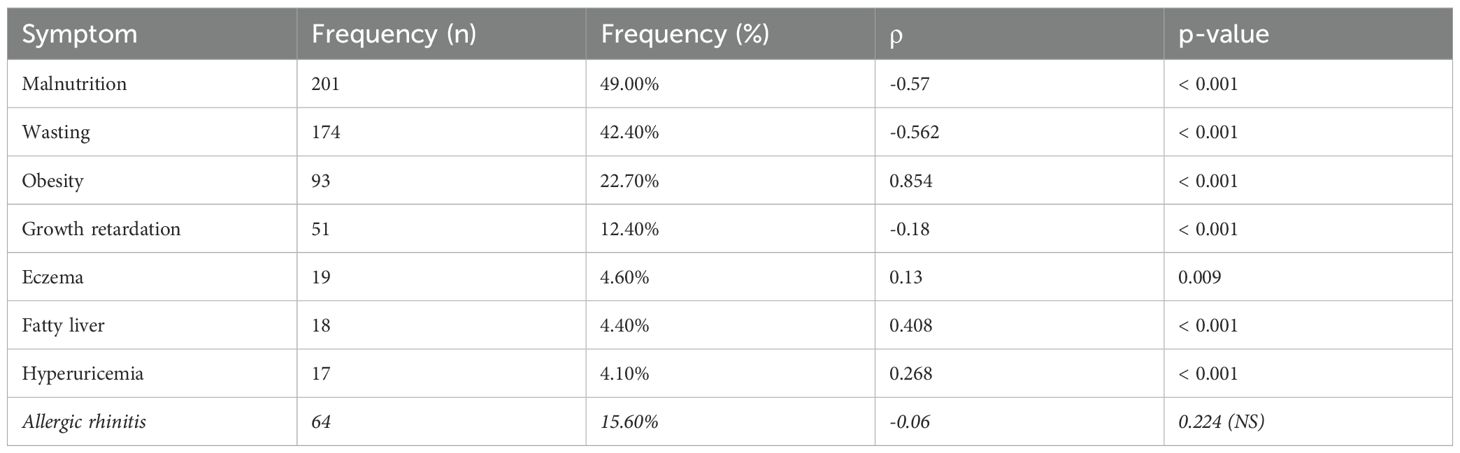
Table 2. Correlation analysis between symptoms and BAZ scores in pediatric population (significant results only).
3.4 Multivariate factor analysis of pediatric metabolic profiles
Pearson correlation analysis revealed significant associations (p < 0.05) between the core indicator (BAZ) and several indicators. A total of 10 indicators showed significant correlation. Detailed correlation coefficients (r) and p-values are presented in Table 3.
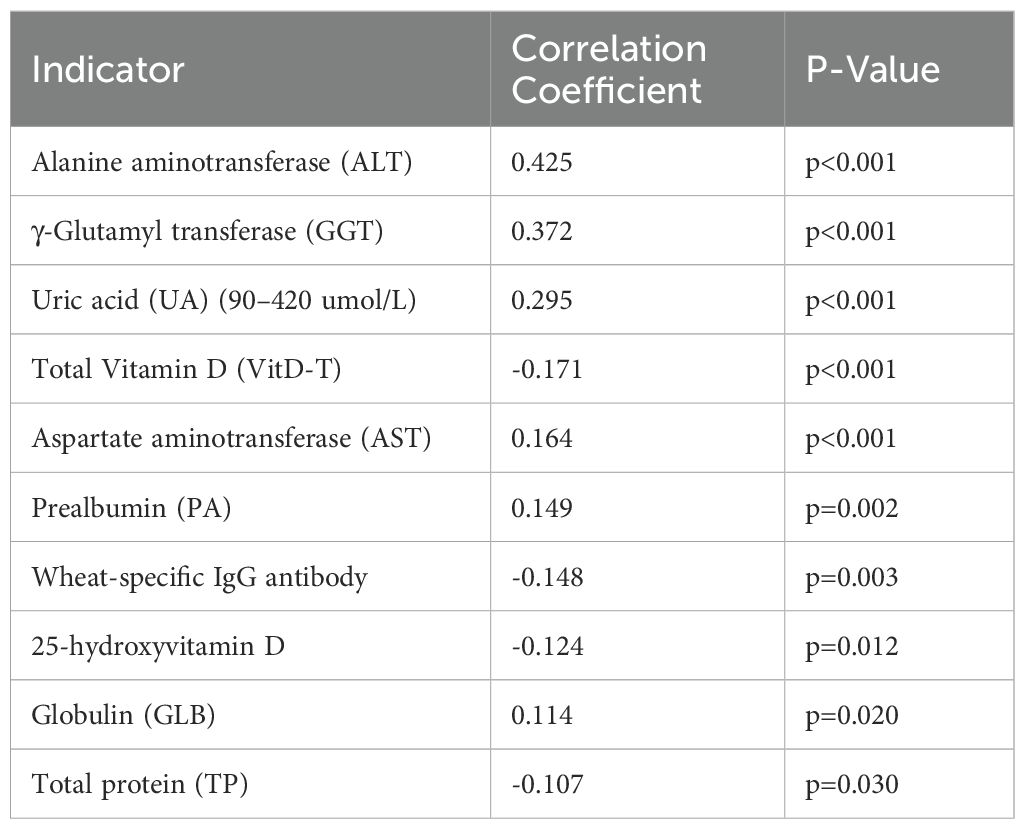
Table 3. Correlation analysis between BAZ and key indicators.
Exploratory Factor Analysis was performed to explore the underlying structure among the indicators significantly correlated with the core indicator (BAZ). Additionally, we conducted factor analysis on all valid indicators to explore broader underlying structures. Seven factors explained 42.4% of total variance (Figure 1A). Factor 3 (food sensitivity: wheat IgG loading = 0.643, soy = 0.654) showed the strongest BAZ correlation (r = 0.349). The hepatic enzyme factor (ALT = 0.900, AST = 0.827) correlated moderately with BAZ (r = 0.372–0.425), while the bilirubin metabolism factor (total bilirubin = 0.991, direct = 0.899) showed no significant association (Table 4). Noting the prominent role of food sensitivity in BAZ variation, we performed targeted analysis of antigen-specific IgG associations.
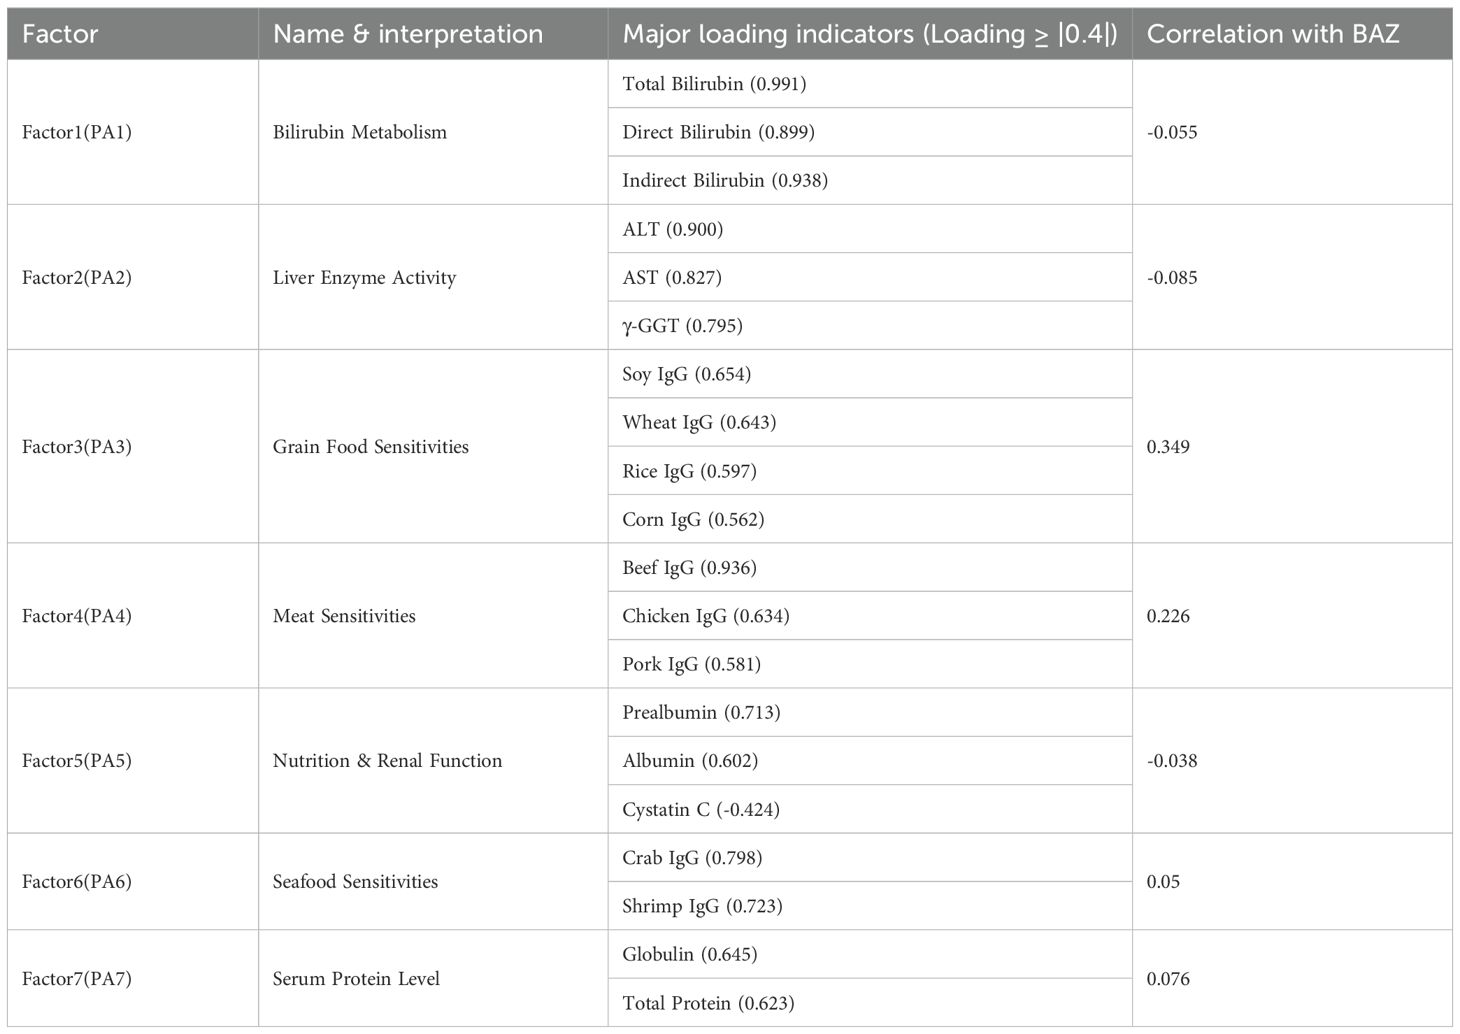
Table 4. Factor analysis results and their correlation with BAZ.
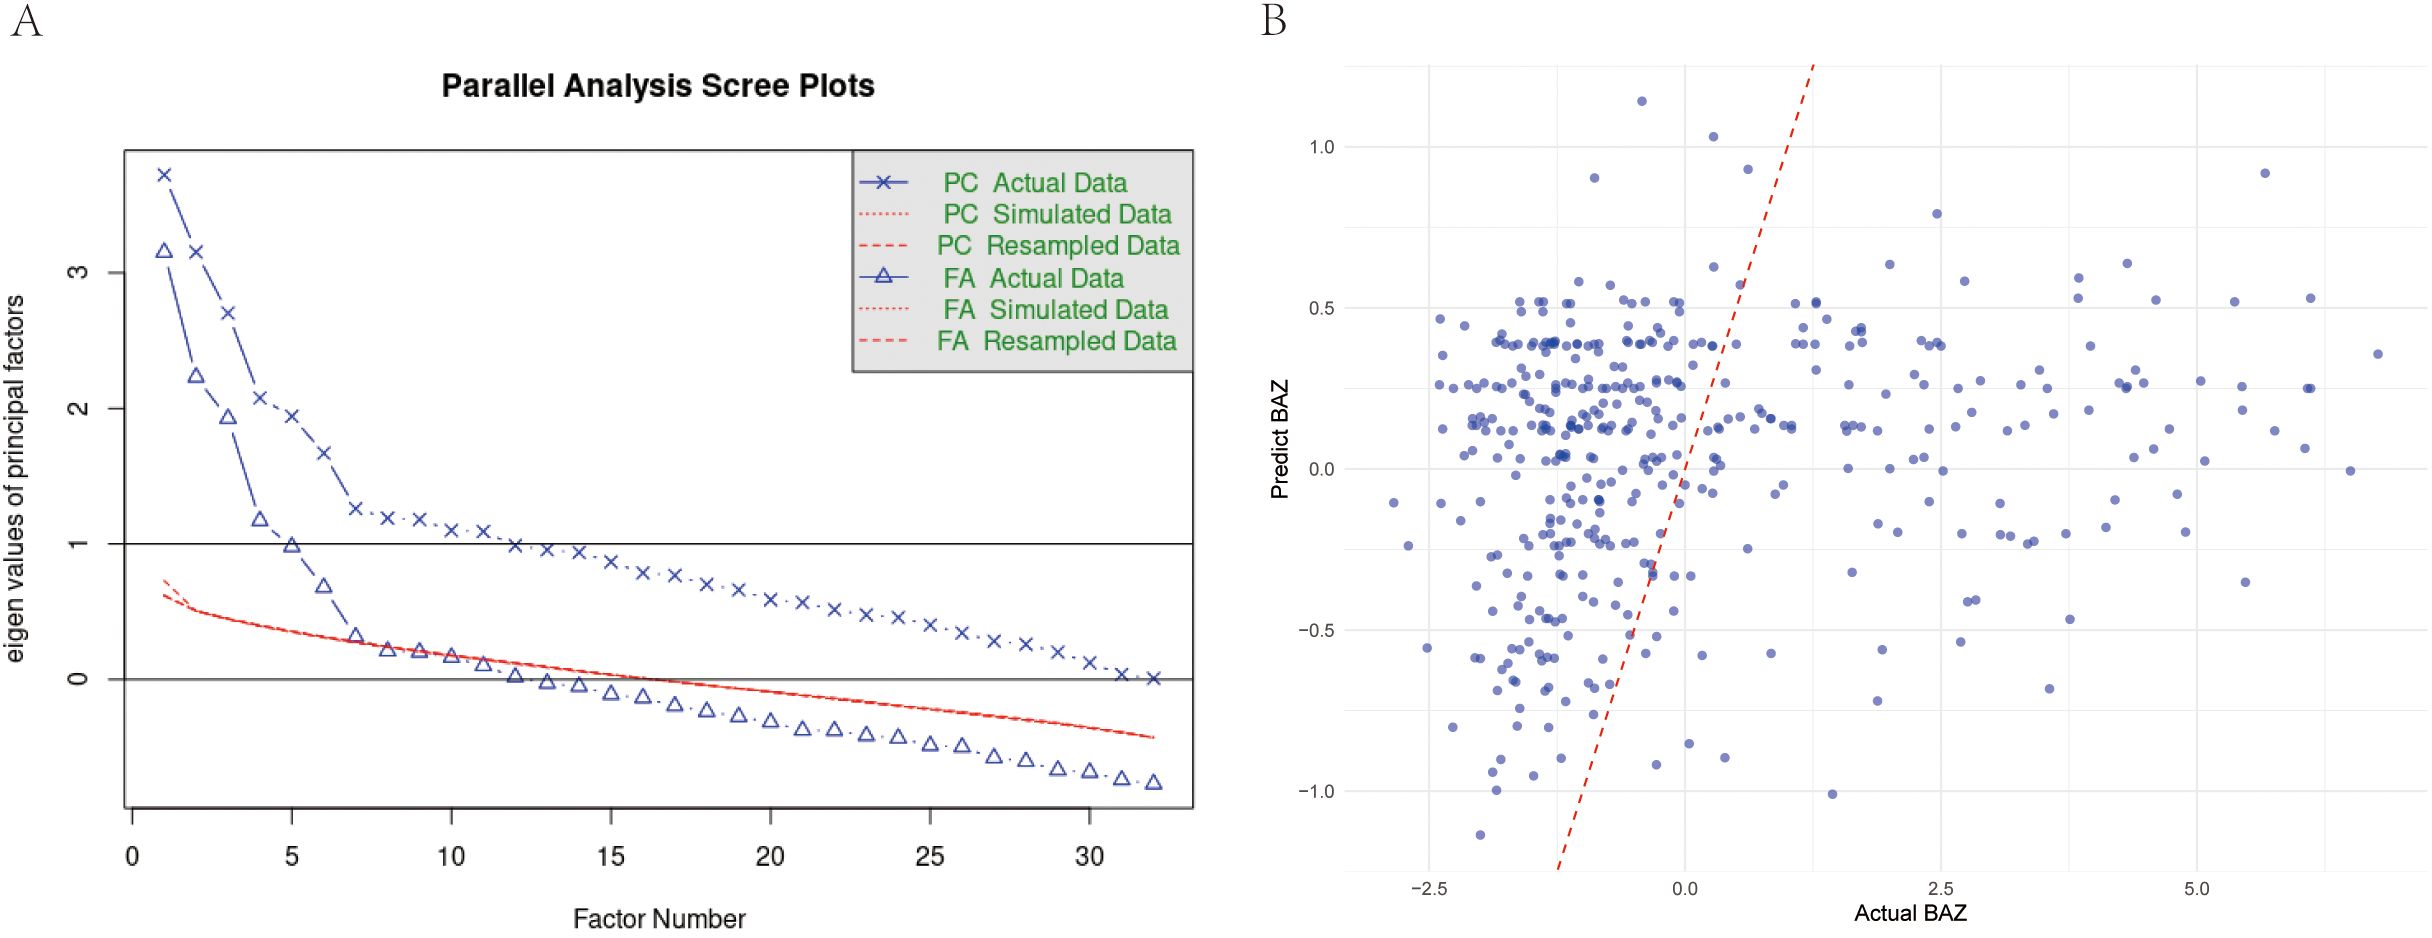
Figure 1. (A) Parallel analysis scree plot for all valid indicators. This plot compares eigenvalues from actual data (solid line, dots) with mean eigenvalues generated from random data (dashed line, crosses) to determine the number of factors. The red line represents the eigenvalue threshold of 1 (Kaiser criterion). (B) Comparison of predicted vs. actual BAZ values using multivariate GLM model in children group. Scatter plot showing the relationship between model-predicted BAZ values and actual BAZ values, with a red dashed line indicating perfect prediction.
3.5 Dose-dependent association between wheat IgG and pediatric BAZ
Wheat-specific IgG levels demonstrated robust inverse BAZ relationships in univariate (β = −0.319, p = 0.003) and multivariate models (β = −0.357, p = 0.010), explaining 2.18% of BAZ variance (Figure 1B). Each unit increase predicted a 0.32–0.36 SD BAZ decrease. No other food antigens showed significant associations (13 antigens p > 0.08) (Table 5). Generalized linear model diagnostics confirmed linear fit without plateau effects. To assess whether similar mechanisms operate in adults, we extended our analysis to the older cohort.
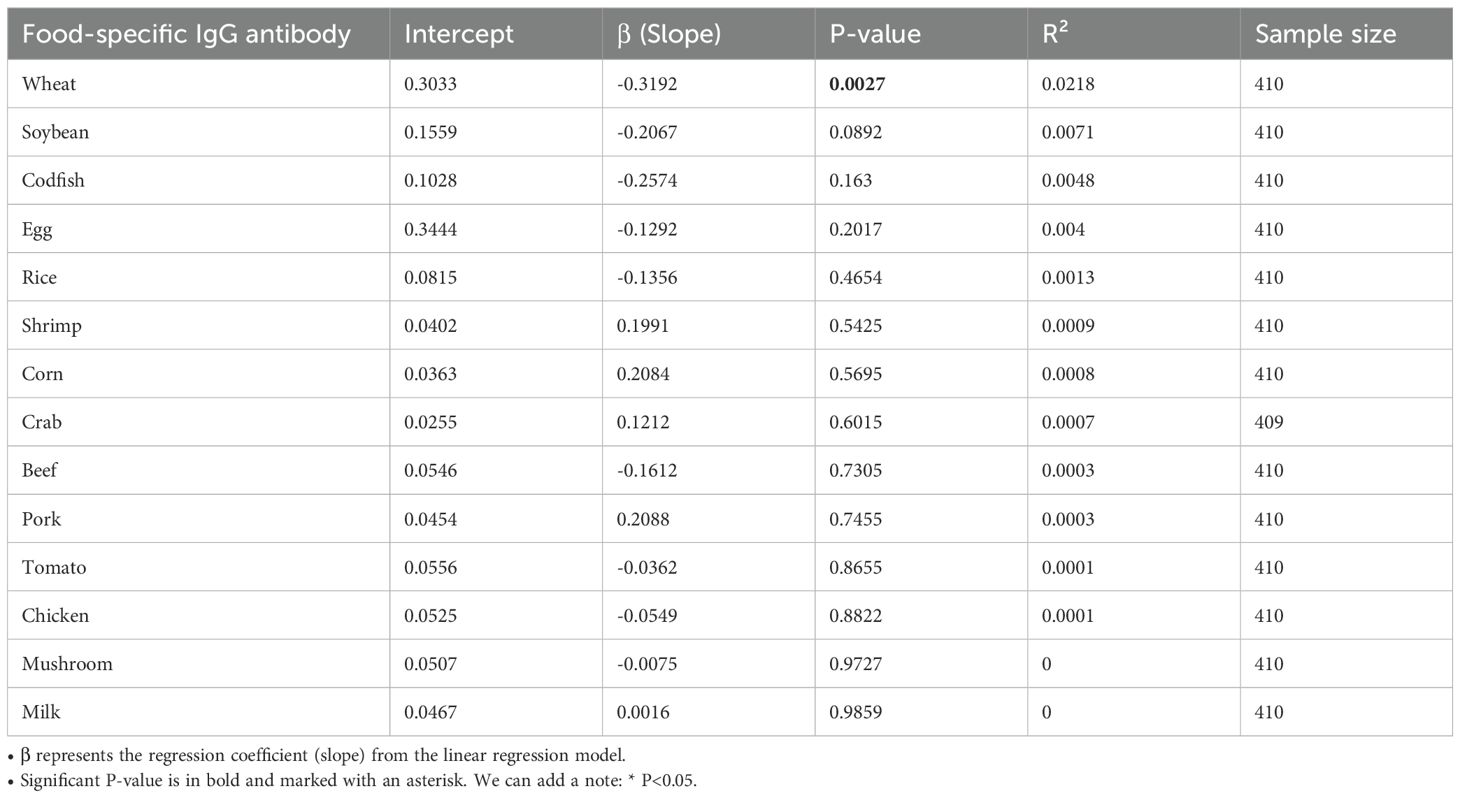
Table 5. Linear regression analysis of food-specific IgG antibodies and their association with BAZ in pediatric population.
3.6 Adult cohort characteristics and hepatic dysregulation
The underweight group skewed younger (63.3% aged 18–30 vs. 31.6% controls, p < 0.001) with lower mean BMI (16.53 ± 1.15 vs. 24.12 ± 4.46, p < 0.001). Hepatic profiling revealed elevated bilirubin abnormalities in the underweight group (total bilirubin: 10% vs. 0%, p = 0.007; direct bilirubin: 40% vs. 6.2%, p = 0.003) alongside globulin dysregulation (10% vs. 0%, p = 0.018) (Supplementary Table 2). To identify systemic drivers of these clinical patterns, we performed factor analysis on adult metabolic profiles.
3.7 Multifactorial drivers of adult nutritional status
Nine factors explained 44.3% of variance (Figure 2A). Hepatic function (Factor 3: r = 0.159, p < 0.001) and vitamin K status (Factor 9: r = 0.144, p < 0.001) independently predicted BMI (Table 6). The staple food IgG factor showed trending negative association (r = −0.117, p = 0.073), while globulin balance correlated positively (r = 0.125, p = 0.003). Prompted by the marginal association with food IgG, we specifically examined antigen-specific sensitization patterns.
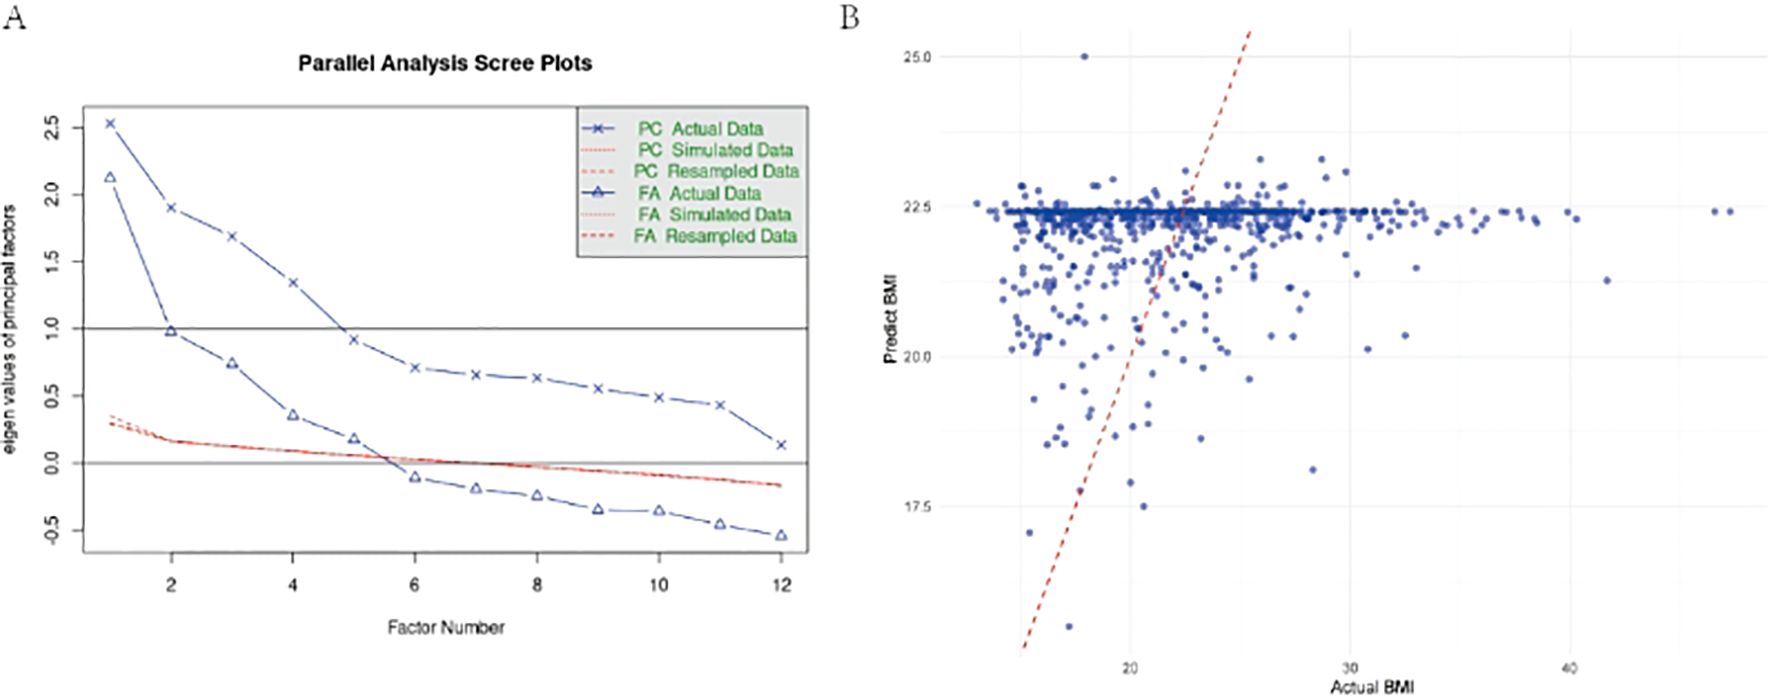
Figure 2. (A) Parallel Analysis Scree Plot for All Valid Indicators. This plot compares eigenvalues from actual data (solid line, dots) with mean eigenvalues generated from random data (dashed line, crosses) to determine the number of factors. The red line represents the eigenvalue threshold of 1 (Kaiser criterion). (B) Comparison of predicted vs. actual BAZ values using multivariate GLM model in adult group. Scatter plot showing the relationship between model-predicted BAZ values and actual BAZ values, with a red dashed line indicating perfect prediction.
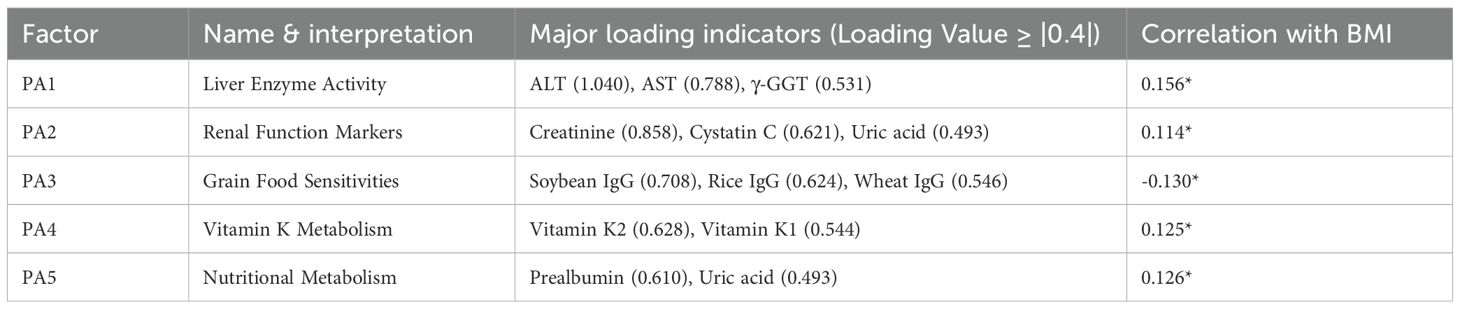
Table 6. Factor analysis results and their correlations with BMI in adult.
3.8 Food-specific IgG associations in adult underweight population
Soybean IgG demonstrated the strongest inverse BMI relationship (univariate β = −1.1085, p = 0.0003; R² = 1.67%), remaining significant in multivariate analysis (β = −0.9237, p = 0.0180) (Figure 2B). Nutrition problem cases showed doubled soybean sensitization rates (22.8% vs. 11.0%, OR = 2.4, p < 0.001). The multivariate model explained minimal BMI variance (adjusted R² = 0.00856, p = 0.114), indicating limited clinical predictive utility (Table 7).
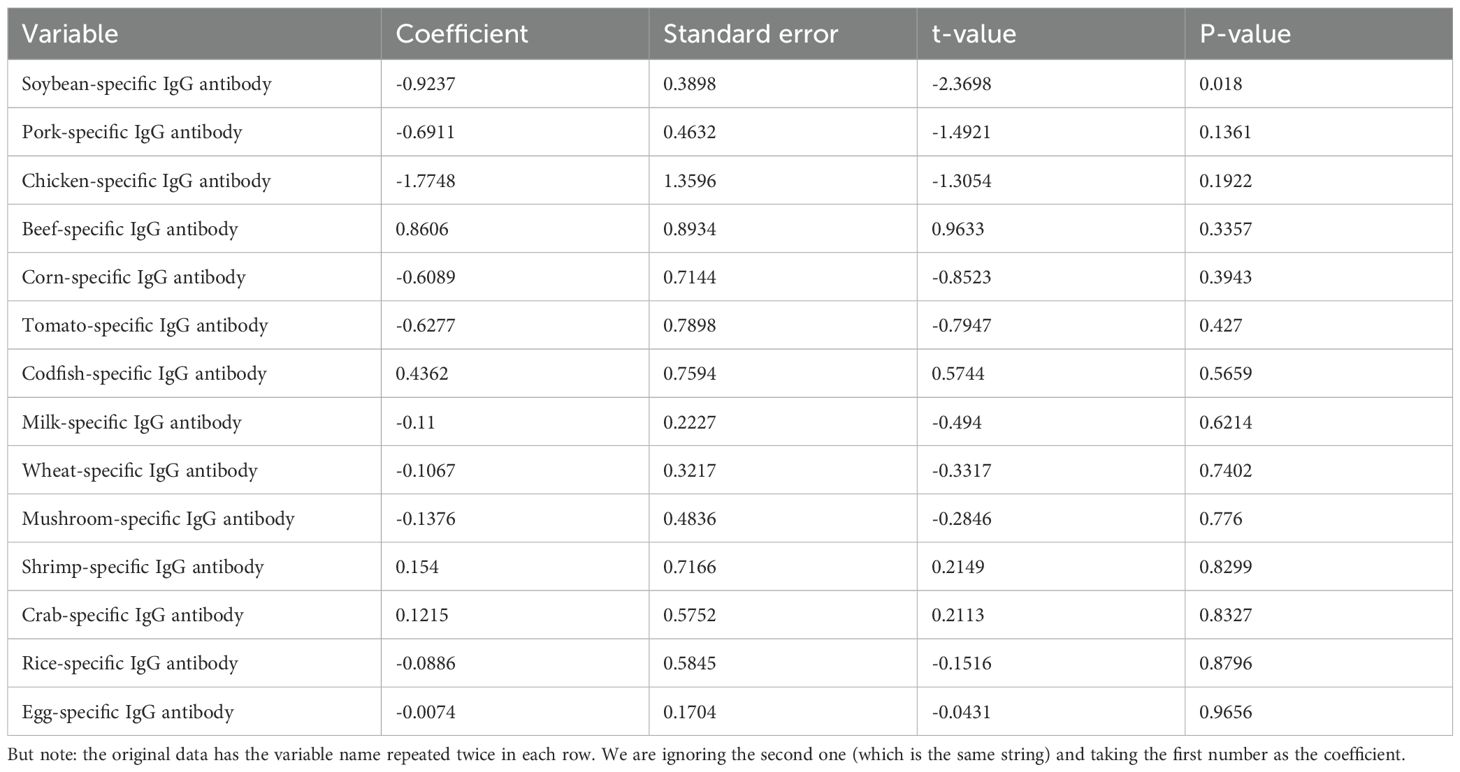
Table 7. Multivariate linear regression analysis of food-specific IgG antibodies and their association with BMI in adult population.
4 Discussion
The observed age-dependent divergence in immune-nutrition interactions reveals distinct immunological prioritization across developmental stages. The stronger inverse association between wheat-specific IgG and body mass index z-scores in children (β = −0.357, R² = 2.18%) contrasts with the prominent soybean IgG-BMI relationship in adults (β = −0.9237, R² = 1.67%), suggesting a fundamental reorganization of dietary antigen responses with age. This shift likely reflects developmental changes in gut barrier integrity and oral tolerance mechanisms, as gut barrier maturation during childhood critically shapes immune-diet interactions (19, 20). The pediatric immune system, still refining its tolerance to dietary antigens, may exhibit heightened sensitivity to ubiquitous staples like wheat, where transient barrier immaturity amplifies IgG-mediated nutrient absorption disruptions (21). Conversely, adults’ cumulative exposure to soy—a common component of urbanized diets (Shengzheng, China)—may drive chronic low-grade inflammation through persistent antigenic stimulation, aligning with evidence linking long-term dietary patterns to immune-metabolic dysregulation (22).
These age-related patterns are further contextualized by the gut-liver axis’s evolving role in metabolic homeostasis. Pediatric ALT/AST elevations, indicative of subclinical hepatic stress, likely reflect early gut-derived inflammatory signals interfering with growth-related anabolism, a phenomenon corroborated by proteomic studies of hepatic metabolic regulation (23). In adults, bilirubin abnormalities signal advanced gut-liver axis dysfunction, potentially arising from decades of antigenic translocation and hepatic detoxification overload (24, 25). The disparity in vitamin K2 sufficiency (94.6% vs. 89.5%) underscores its dual role as a biomarker of gut absorption efficiency and hepatic activation capacity, bridging intestinal health with systemic metabolic outcomes (26, 27). This integrative role positions vitamin K2 as a critical node in the IgG-nutrition interplay, particularly in undernutrition contexts where hepatic and intestinal functions are interdependent (28).
The bidirectional IgG-nutrition relationship challenges conventional causal paradigms, particularly in underweight populations. Elevated IgG levels may emerge as both drivers and consequences of malnutrition: nutrient deficiencies impair gut barrier function, facilitating antigenic translocation and subsequent IgG elevation—a mechanism mirroring kwashiorkor-associated enteropathy (29). This reciprocity is compounded by sex-specific disparities, with male-predominant pediatric cohorts (54%) and female-dominated adult groups (74.6%) suggesting hormonal modulation of mucosal immunity. Estrogen’s known influence on gut barrier integrity and immune cell trafficking may partially explain these demographic shifts, though further investigation is needed (30, 31).
Despite these insights, the modest predictive power of individual IgG biomarkers (R² <3%) limits their standalone clinical utility, echoing challenges in dietary intervention trials for immune-mediated gastrointestinal disorders (32). Our multifactorial model, integrating hepatic and nutritional markers, substantially improved variance explanation (42.4–44.3%), emphasizing the necessity of systems-level approaches. However, the retrospective design precludes causal inference, a limitation shared by prior IgG-diet studies (33). Longitudinal studies tracking IgG dynamics during nutritional rehabilitation are imperative to disentangle causation from correlation, particularly given the potential for nutritional recovery to reverse barrier dysfunction and attenuate IgG reactivity (34).
Future research must prioritize intervention trials evaluating IgG-guided dietary modifications in undernutrition, ensuring ethical prioritization of nutritional adequacy. Combining IgG profiling with multi-omics analyses—including microbiome sequencing and gut barrier integrity markers—will clarify mechanistic pathways and identify personalized therapeutic targets (22, 25). Standardizing underweight-specific IgG reference ranges remains critical, as population-specific thresholds may explain inconsistent outcomes of elimination diets across studies (35). By elucidating IgG’s role as both a biomarker and modifiable factor in undernutrition, this work advances a precision nutrition framework that harmonizes immune and metabolic health across the lifespan.
5 Conclusion
This comprehensive analysis establishes food-specific IgG evaluation as a valuable adjunct tool for personalizing dietary management in underweight populations, while highlighting critical knowledge gaps requiring interdisciplinary research approaches.
Data availability statement
The raw data supporting the conclusions of this article will be made available by the authors, without undue reservation.
Ethics statement
The studies involving humans were approved by Shenzhen Traditional Chinese Medicine Hospital Ethics Committee. The studies were conducted in accordance with the local legislation and institutional requirements. Written informed consent for participation in this study was provided by the participants’ legal guardians/next of kin.
Author contributions
Y-CZ: Software, Investigation, Writing – original draft, Writing – review & editing, Resources, Visualization, Funding acquisition, Data curation, Methodology, Validation, Formal analysis, Conceptualization, Project administration, Supervision. C-YL: Methodology, Writing – review & editing, Data curation, Writing – original draft. X-LS: Methodology, Writing – review & editing, Data curation. S-FH: Visualization, Validation, Formal analysis, Writing – review & editing. YX: Writing – review & editing, Visualization, Formal analysis. JZ: Visualization, Writing – review & editing, Formal analysis. RY: Writing – review & editing, Formal analysis, Visualization.
Funding
The author(s) declare that no financial support was received for the research and/or publication of this article.>
Conflict of interest
The authors declare that the research was conducted in the absence of any commercial or financial relationships that could be construed as a potential conflict of interest.>
Generative AI statement
The author(s) declare that no Generative AI was used in the creation of this manuscript.
Any alternative text (alt text) provided alongside figures in this article has been generated by Frontiers with the support of artificial intelligence and reasonable efforts have been made to ensure accuracy, including review by the authors wherever possible. If you identify any issues, please contact us.
Publisher’s note
All claims expressed in this article are solely those of the authors and do not necessarily represent those of their affiliated organizations, or those of the publisher, the editors and the reviewers. Any product that may be evaluated in this article, or claim that may be made by its manufacturer, is not guaranteed or endorsed by the publisher.
Supplementary material
The Supplementary Material for this article can be found online at: https://www.frontiersin.org/articles/10.3389/fimmu.2025.1650705/full#supplementary-material
Abbreviations
ALT, Alanine Aminotransferase; AST, Aspartate Aminotransferase; BAZ, Body Mass Index-for-Age Z-score; BMI, Body Mass Index; CI, Confidence Interval; ELISA, Enzyme-Linked Immunosorbent Assay; GGT (or γ-GGT), Gamma-Glutamyl Transferase; GLB – Globulin; GLM – Generali;zed Linear Model; Ig – Immunoglobulin; IgE, Immunoglobulin E; IgG, Immunoglobulin G; IQR, Interquartile Range; kU/L, Kilounits per Liter; NS, Not Significant; OR, Odds Ratio; PA – Prealbumin; PCA, Principal Component Analysis; R², Coefficient of Determination (R-Squared); SD, Standard Deviation; TP, Total Protein; UA, Uric Acid; VIF, Variance Inflation Factor; VitD, Vitamin D; β, Beta coefficient (Regression coefficient); ρ (rho), Spearman’s rank correlation coefficient.
References
1. Schmiechen ZC, Weissler KA, and Frischmeyer-Guerrerio PA. Recent developments in understanding the mechanisms of food allergy. Curr Opin Pediatr. (2019) 31:807–14. doi: 10.1097/MOP.0000000000000806
2. Shtaborov VA, Patrakeeva VP, and Samodova AV. IgG levels to food antigens depend on nutrition and levels of general inflammation in healthy persons and individuals with metabolic syndrome. Vopr Pitan. (2025) 94:86–96. doi: 10.33029/0042-8833-2025-94-4-86-96
3. Vojdani A, Afar D, and Vojdani E. Reaction of Lectin-Specific Antibody with Human Tissue: Possible Contributions to Autoimmunity. J Immunol Res. (2020) 2020:1438957. doi: 10.1155/2020/1438957
4. Zhang W, Sun L, Wang Y, Zhao M, Zhang Q, Li X, et al. Identification of significant potential signaling pathways and differentially expressed proteins in patients with wheat intolerance based on quantitative proteomics. J Proteomics. (2021). doi: 10.2139/ssrn.3787458
5. Valdez LA and Garcia DO. Hispanic male recruitment into obesity-related research: evaluating content messaging strategies, experimental findings, and practical implications. Int Q Community Health Educ. (2021). doi: 10.1177/0272684X20982598
6. Yu L, Yang YX, Gong Z, et al. FcRn-dependent IgG accumulation in adipose tissue unmasks obesity pathophysiology. Cell Metab. (2025) 37:656–672.e7. doi: 10.1016/j.cmet.2024.11.001
7. Fenta HM, Tesfaw LM, and Derebe MA. Trends and Determinants of Underweight among Under-Five Children in Ethiopia: Data from EDHS. Int J Pediatr. (2020) 2020:3291654. doi: 10.1155/2020/3291654
8. Garmendia JV, De Sanctis JB, and García AH. Food-Specific IgG Antibodies: Decoding Their Dual Role in Immune Tolerance and Food Intolerance. Immuno. (2025) 5:25. doi: 10.3390/immuno5030025
9. Aktas A, Couto MM, and Walsh D. We report performance status in oncology-but not nutritional status? Support Care Cancer. (2020). doi: 10.1007/s00520-020-05689-2
10. Contreras JL, Ladino MA, Vogel TP, Orange JS, Poli MC, Aranguiz K, et al. Immune Dysregulation Mimicking Systemic Lupus Erythematosus in a Patient With Lysinuric Protein Intolerance: Case Report and Review of the Literature. Front Pediatr. (2021) 9:673957. doi: 10.3389/fped.2021.673957
11. Fetissov SO. Un rôle de protéine porteuse pour les auto-anticorps dirigés contre les hormones peptidiques. Annales d’Endocrinol. (2024) 85:347–8. doi: 10.1016/j.ando.2024.08.014
12. Ostrowska L, Wasiluk D, Lieners CFJ, Galecka M, Bartnicka A, Tveiten D, et al. Igg Food Antibody Guided Elimination-Rotation Diet Was More Effective than FODMAP Diet and Control Diet in the Treatment of Women with Mixed IBS: Results from an Open Label Study. J Clin Med. (2021) 10:4317. doi: 10.3390/jcm10194317
13. Leviatan S, Vogl T, Klompus S, Kalka IN, Weinberger A, and Segal E. Allergenic food protein consumption is associated with systemic IgG antibody responses in non-allergic individuals. Immunity. (2022) 55:2454–2469.e6. doi: 10.1016/j.immuni.2022.11.004
14. Ievers-Landis CE. Eating-Related Versus Disordered Eating Cognitions in the Context of Pediatric Overweight and Obesity Research. J Dev Behav Pediatr. (2021). doi: 10.1097/DBP.0000000000000980
15. Kompaneets IY, Ermakov EA, Sedykh SE, Buneva VN, and Nevinsky GA. IgGs from Human Milk Hydrolyze microRNAs. Molecules. (2020) 25:2366.
16. Herberger K, Muller K, Protz K, Zyriax BC, Augustin M, and Hagenstrom K. Nutritional status and quality of nutrition in chronic wound patients. Int Wound J. (2020) 17:1246–54. doi: 10.1111/iwj.13378
17. Lee HY, Kang HW, Kim K, Ha YS, Kim WT, Kim YJ, et al. Nutritional status assessed by the Controlling Nutritional Status (CONUT) score as a predictor of recurrence of urolithiasis. Investig Clin Urol. (2021) 62:553–9. doi: 10.4111/icu.20210031
19. Beaumont M, Paes C, Gautier R, Lencina C, Eutamene H, Theodorou V, et al. Gut microbiota derived metabolites contribute to intestinal barrier maturation at the suckling-to-weaning transition. Gut Microbes. (2020) 11:1268–86. doi: 10.1080/19490976.2020.1747335
20. Kulkarni DH, Gustafsson JK, Knoop KA, McDonald KG, Bidani SS, Davis JE, et al. Goblet Cell Associated Antigen Passages Support the Induction and Maintenance of Oral Tolerance. Mucosal Immunol. (2020) 13:271–82. doi: 10.1038/s41385-019-0240-7
21. Ballouhey Q, Fourcade L, Richard L, Bellet C, El Hamel C, Vallat JM, et al. Epithelial changes of congenital intestinal obstruction in a rat model. PLoS One. (2020) 15:e0232023. doi: 10.1371/journal.pone.0232023
22. Bain CC and Cerovic V. Interactions of the microbiota with the mucosal immune system. Clin Exp Immunol. (2020).
23. Goodman RP, Markhard AL, Noh HL, Suk S, Goldberger O, Hirschhorn J, et al. Hepatic NADH reductive stress underlies common variation in metabolic traits. Nature. (2020) 583:122–6.
25. Beyaz Coşkun A and Sağdiçoğlu Celep AG. Therapeutic modulation methods of gut microbiota and gut-liver axis. Crit Rev Food Sci Nutr. (2022). doi: 10.1080/10408398.2021.1902263
26. Simes DC, Viegas CSB, Araujo N, and Marreiros C. Vitamin K as a Diet Supplement with Impact in Human Health: Current Evidence in Age-Related Diseases. Nutrients. (2020) 12:138. doi: 10.3390/nu12010138
27. Caluwé R, Verbeke F, and De Vriese AS. Evaluation of vitamin K status and rationale for vitamin K supplementation in dialysis patients. Nephrol Dial Transplant. (2020).
28. Akuru EA, Chukwuma CI, Oyeagu CE, Erukainure OL, Mashile B, Setlhodi R, et al. Nutritional and phytochemical profile of pomegranate (“Wonderful variety”) peel and its effects on hepatic oxidative stress and metabolic alterations. J Food Biochem. (2022). doi: 10.1111/jfbc.13913
29. Salameh E, Jarbeau M, Morel FB, Zeilani M, Aziz M, Dechelotte P, et al. Modeling undernutrition with enteropathy in mice. Sci Rep. (2020) 10:15581. doi: 10.1038/s41598-020-72705-0
30. Milito C, Cinetto F, Megna V, Spadaro G, Quinti I, and Liberatore M. The Usefulness of Scintigraphic Studies in the Assessment of Asymptomatic Bowel Disease in Patients with Primary Antibody Diseases. J Clin Med. (2020) 9:949. doi: 10.3390/jcm9040949
31. Sezin T, Ferreirós N, Jennrich M, Ochirbold K, Seutter M, Attah C, et al. 12/15-Lipoxygenase choreographs the resolution of IgG-mediated skin inflammation. J Autoimmun. (2020). doi: 10.1016/j.jaut.2020.102528
32. Stadlbauer V, Engertsberger L, Horvath A, Stadlbauer V, Komarova I, Feldbacher N, et al. Dysbiosis, gut barrier dysfunction and inflammation in dementia: a pilot study. BMC Geriatr. (2020) 20:248. doi: 10.1186/s12877-020-01644-2
33. Oynebraten I. Involvement of autophagy in MHC class I antigen presentation. Scand J Immunol. (2020) 92:e12978.
34. Reuveni D, Aricha R, Souroujon MC, and Fuchs S. MuSK EAMG: Immunological Characterization and Suppression by Induction of Oral Tolerance. Front Immunol. (2020) 11:403. doi: 10.3389/fimmu.2020.00403
Keywords: food intolerance, IgG antibodies, body mass index, underweight, chronic low-grade inflammation, nutritional biomarkers, cluster analysis, personalized dietary interventions
Citation: Zeng Y-C, Li C-Y, Song X-L, Huang S-F, Xie Y, Zeng J and Yuan R (2025) Food-specific IgG antibodies and body mass index: multivariate analysis of clinical correlations in underweight populations. Front. Immunol. 16:1650705. doi: 10.3389/fimmu.2025.1650705
Received: 20 June 2025; Accepted: 29 September 2025;
Published: 21 October 2025.
Edited by:
Omar Guzmán Quevedo, Higher Technological Institute of Tacambaro, MexicoReviewed by:
Dina Keumala Sari, Universitas Sumatera Utara, IndonesiaEulália Silva-Araújo, Federal University of Pernambuco, Brazil
Copyright © 2025 Zeng, Li, Song, Huang, Xie, Zeng and Yuan. This is an open-access article distributed under the terms of the Creative Commons Attribution License (CC BY). The use, distribution or reproduction in other forums is permitted, provided the original author(s) and the copyright owner(s) are credited and that the original publication in this journal is cited, in accordance with accepted academic practice. No use, distribution or reproduction is permitted which does not comply with these terms.
*Correspondence: Yao-Chi Zeng, NDk5MTA0NDMwQHFxLmNvbQ==