 Lifang Hu
 Sheng Wan†
- Department of Dermatology, Hangzhou Third People’s Hospital, Hangzhou, China
Background: Alopecia areata (AA) is an autoimmune disease typified by nonscarring hair loss. It manifests as a heterogeneous disorder with diverse clinical presentations and variable treatment responses, underscoring the significance of identifying novel biomarkers for precision management.
Objective: This study aims to explore the relationship between metabolic reprogramming-related genes (MRRGs) and the risk of developing AA.
Methods: MRRGs were identified through the GeneCards database and existing literature. Genetic instruments were obtained from the eQTLGen database, and AA-related data were retrieved from the OpenGWAS database. The TwoSampleMR R package was applied for statistical analysis. Additionally, RT-qPCR and immunofluorescence assays were performed to validate the expression of target genes in AA-affected hair follicles and healthy controls.
Results: Six MRRGs (DLD, NFE2L2, SDHB, SLC2A1, PSAT1, and SQSTM1) showed significant causal associations with AA. RT-qPCR analysis revealed markedly elevated SQSTM1 mRNA levels in AA-affected hair follicles compared with healthy controls. Immunofluorescence confirmed increased SQSTM1 protein accumulation alongside reduced LC3B-II expression in AA-affected hair follicles.
Conclusions: This study underscores the significant association between SQSTM1 and AA, advancing our understanding of AA pathophysiology.
1 Introduction
AA is a common chronic tissue-specific autoimmune disease, resulting in hair loss, that affects up to 2% of the general population and is thought to arise from a multifactorial interplay of genetic, environmental, and immunological factors (1). This condition not only affects the physical appearance of individuals but also has profound implications for their psychological well-being and overall quality of life (2). Current pharmacological treatments primarily include corticosteroids, Janus kinase inhibitors (JAKi), and other immunosuppressants. However, a significant subset of patients experiences suboptimal responses and frequent relapses, highlighting the pressing need for further research to elucidate the underlying mechanisms of AA and identify novel therapeutic targets (3).
Recent advancements in the field of metabolic reprogramming have begun to shed light on its significant role in various diseases, including cancers and metabolic disorders. Metabolic reprogramming refers to the shifts in cellular metabolism that occur in response to pathological conditions, enabling cells to adapt and thrive in their altered environments (4, 5). However, the specific relationship between metabolic reprogramming and AA remains largely unexplored, creating a significant research gap that warrants further investigation. Our study employs Mendelian randomization analysis (6) for identifying potential biomarkers and therapeutic targets that could enhance the management of AA.
2 Materials and methods
This study was conducted and reported in accordance with the STROBE-MR (Strengthening the Reporting of Observational Studies in Epidemiology - Mendelian Randomization) guidelines (7).
2.1 Genes involved in metabolic reprogramming
First of all, we used the GeneCards database (8) (https://www.genecards.org/) to collect MRRGs, which provides comprehensive information on human genes. Afterwards, by keeping only MRRGs with “Protein Coding” and “Relevance Score > 3”, 94 MRRGs were obtained. Subsequently, we collected the MRRGs from references (9) through the PubMed, and a total of 5 MRRGs were obtained. Finally, the MRRGs from the two sources were merged, and a total of 96 MRRGs were obtained.
2.2 cis-eQTL dataset
We downloaded the cis-eQTL dataset related to metabolic reprogramming from eQTLGen (https://www.eqtlgen.org). The eQTLGen dataset is based on 31,684 peripheral blood and peripheral blood mononuclear cell (PBMC) samples, which were derived from multiple large European population cohorts (predominantly individuals of European ancestry). The primary objective of this dataset is to identify associations between genetic variations and gene expression in blood tissue.
The eQTL analysis was performed following a standardized and unified pipeline, with covariates such as age, sex, principal components, and technical batches adjusted for in the model. We downloaded the complete set of statistically significant cis-eQTL results after multiple-testing correction (FDR < 0.05), and selected single nucleotide polymorphisms (SNPs) significantly associated with gene expression (P value < 5×10⁻⁸) as genetic instrumental variables (IVs). Additionally, we obtained allele frequencies from eQTLGen, which were calculated using allele counts reported by all participating cohorts.
2.3 Outcome data set
We obtained the genome-wide association study (GWAS) data for the outcome variable alopecia areata (AA) (GWAS ID: finn-b-L12_ALOPECAREATA) from the MRC IEU OpenGWAS database (10). This dataset is derived from the 12th release of the FinnGen study, and standardized association summary statistics were retrieved as the outcome using the R package TwoSampleMR (11).
The GWAS data for alopecia areata (AA) comprises 289 AA cases and 211,139 control samples, all of which were sourced from European populations. The GWAS analysis was based on genome-wide genotyping data, and a linear mixed model was employed to control for potential confounding factors including sex, age, and genetic principal components. The results provide effect estimates, standard errors, and P value with reference to the effect allele.
Since both this outcome data and the exposure data (from eQTLGen) are based on European populations, with independent samples and consistent population background, this can effectively reduce population stratification bias and satisfy the assumptions of Mendelian randomization analysis.
2.4 Selection of instrumental variables
A valid genetic variation IVs must satisfy three core assumptions: firstly, the hypothesis of association, that is, the selected IVs must be significantly related to the exposure factor. Secondly, independence assumption, that is, the IVs must not be significantly related to potential confounders that might affect the exposure or outcome. Thirdly, exclusivity limitation, that is, the IVs could only affect the outcome through the path of “instrumental variable → exposure → outcome”. must not exert an indirect effect on the outcome through other pathways.
The screening criteria for SNPS of IVs in this study were as follows: P<5×10⁻⁸ of SNPS in the exposure GWAS was used as the screening criteria. Linkage Disequilibrium (LD) screening was performed to ensure the independence of the selected SNPs; Only SNPS that were not in linkage disequilibrium (SNPS with r<0.001 2and a physical distance of >10000 kb between every two genes) were included. Subsequently, the corresponding genetic effect values were extracted from the outcome GWAS based on the screened SNPs. F-statistics were calculated to assess weak instrumental variable bias. We selected the IVs with F>10 for subsequent analyses, because F<10 indicates that the genetic variant used is a weak instrumental variable, which might bias the results to some extent (12). The formula for calculating the F-statistic is as follows:
Where n is the sample size, k is the number of instrumental variables used, and R2 reflects the extent to which the instrumental variables explain the exposure. R2 = 2× (1-MAF) ×MAF×2β, where MAF is the minimum allele frequency and β is the allele effect size. In addition, SNPS with MAF>0.01 were selected to exclude bias caused by rare variants.
2.5 Univariate MR analysis
We performed a two-sample MR analysis using the TwoSampleMR package with MRRGs obtained in eQTLGen as the exposure factor and AA as the outcome. We used the Wald ratio method to evaluate the results of MR for exposures containing only one SNP, and IVW method to evaluate the results of MR for exposures containing two or more SNPS. In the absence of pleiotropy and with or without heterogeneity, the IVW and Wald ratio methods were used as the main MR Methods, supplemented by the other four methods (causal combinations with heterogeneity were excluded). When pleiotropy was present, then MR-Egger method was used to calculate the results. Finally, Steiger’s directivity test was used to determine whether the direction of causality was correct.
2.6 Sensitivity analysis
Sensitivity analysis was carried out to ensure the reliability of the results the results in the following ways by using various methods such as heterogeneity test, pleiotropy test and one-by-one exclusion test, as follows:
Firstly, heterogeneity test: The Cochran Q test was used to evaluate the heterogeneity among the SNP estimates. If the Cochran Q test was statistically significant, the analysis results were proved to be significantly heterogeneous. The random effects model of IVW was used to estimate the causal effect size for highly heterogeneous results. Because the Cochran Q test could only test the presence or absence of heterogeneity, it could not test the distribution of heterogeneity. Therefore, the I2 statistic was used to reflect the proportion of heterogeneous part of IVs in the total variation: when I2 ≤ 0, it was set to 0, indicating that no heterogeneity was observed. I2 = 0-25%, indicating mild heterogeneity; I2 = 25%-50%, indicating moderate heterogeneity; I2>50% indicated high heterogeneity. The specific calculation formula is as follows:
Secondly, pleiotropy test: MR-Egger method was used to test the pleiotropy of IVs. If the P value of MR-Egger’s intercept is less than 0.05, it indicates that there is significant horizontal pleiotropy of genetic variation.
Thirdly, leave-one-out test: The MR results of the remaining IVs were calculated by excluding individual SNPS one by one to assess whether the SNP affected the association between AA and metabolic reprogramming. If there was a large difference between the MR Effect estimates and the total effect estimates after excluding an instrumental variable, it indicated that the MR Effect estimates were sensitive to that SNP. This analysis helps identify potential outlier SNPs, thereby enhancing the robustness of the conclusions.
Fourthly, directionality test (Steiger Test): The Steiger directionality test was used to calculate the explanatory power of exposure for the outcome (R²_exposure) and the explanatory power of the outcome for exposure (R²_outcome). If R²_exposure > R²_outcome, it indicates that the causal direction is “exposure → outcome,” verifying that the direction of the MR assumption is correct.
2.7 SMR analysis
SMR (Summary-Data-Based Mendelian Randomization) (13), using GWAS summary data from GWAS and expression quantitative trait locus (QTL) studies to test for pleiotropic associations between base protein expression levels and complex traits of interest. We download SMR Linux version (1.3.1) from SMR website (https://yanglab.westlake.edu.cn/software/smr), in accordance with the default parameters for performing SMR analysis.
2.8 Colocalization analysis
For genes with significant Mendelian randomization associations in eQTLGen, we used the coloc package for colocalization analysis (14). Bayesian approach was used to determine whether the association between gene expression and AA was driven by shared causal variants at specific loci rather than linkage disequilibrium. The colocalization analysis has five assumptions, namely: H0, SNPS within the colocalization region are not associated with either trait. H1, SNPS within the colocalization region are associated with the first trait but not with the second trait. H2, SNPS within the colocalizing region are associated with the second trait but not with the first. H3, SNPS within the colocalizing region were associated with both traits but not with the same locus. H4, SNPS within the co-localized region were associated with both traits and located at the same locus. We considered H4 ≥ 0.8 as a high level of colocalization, and 0.5≤H4≤ 0.8 as a moderate level of colocalization (15).
2.9 Full phenomenon association analysis
To evaluate the pleiotropic effects and possible adverse effects of potential therapeutic targets. We analyzed genes related to metabolic reprogramming based on AstraZeneca PheWAS Portal (https://azphewas.com/) and PheWeb Database (https://pheweb.org/). The original study included approximately 15,500 binary and 1500 continuous phenotypes, with individuals in exome-sequencing subgroups obtained from the UK Biobank. These data provide us with a broad perspective, allowing us to comprehensively analyze the associations between different phenotypes.
2.10 Immunofluorescence staining
Skin sections were fixed with 4% paraformaldehyde in PBS, permeabilized with 0.01% T Triton X-100 in PBS for 1 h. Blocked tissue was incubated with primary antibody anti-SQSTM1 (abcam, UK, 1:1200) or anti-LC3B (Cell Signaling Technology, USA, 1:2000) overnight at 4°C. After washing, sections were incubated with secondary antibody for 1 hour at room temperature, and nuclei were stained with DAPI (1:10,000). Images were processed on an inverted fluorescent microscope (ZEISS Axio Observer. A1).
2.11 Quantitative real-time PCR
Fresh human scalp tissue samples were flash-frozen in liquid nitrogen, thoroughly pulverized into a fine powder, and total RNA was extracted using Trizol reagent (Invitrogen, USA) according to the instructions of the manufacturer. RNA purity and concentrations were determined using the Nanodrop. Reverse transcription of the RNA into cDNA was performed using the TetrocDNA Synthesis Kit (Bioline‐Meridian Bioscience). Real-time quantitative PCR (RT-qPCR) analyses were performed by using the CFX96 Real Time System (Bio-Rad Laboratories). The mRNA level of GAPDH was used as an internal control. All expressions were calculated using the 2−ΔΔCt method. The primers for RT-qPCR are as follows: SQSTM1 forward: 5’- AGGGAACACAGCAAGCT-3’, SQSTM1 reverse: 5’-GCCAAAGTGTCCATGTTTCA-3’; DLD forward: 5’- TTCCCATTTGCTGCTAACA-3’, DLD reverse: 5’-CTGATAAGGTCGGATGTGC-3’; PSAT1 forward: 5’-ACTTCCTGTCCAAGCCAGTGGA-3’, PSAT1 reverse: 5’-CTGCACCTTGTATTCCAGGACC-3’. GAPDH forward:5’-TGCACCACCAACTGCTTAGC-3’, GAPDH reverse: 5’-GGCATGGACTGTGGTCATGAG-3’.
2.12 Statistical methods
All data processing and analysis in this article were based on R software (Version 4.3.0). For comparisons of continuous variables between two groups, statistical significance of normally distributed variables was estimated by independent Student’s T-Test, unless otherwise specified. The Mann-Whitney U Test method (Wilcoxon Rank Sum Test) was used to analyze the differences between the variables that were not normally distributed. Kruskal-Wallis test was used for comparison of three or more groups. Spearman correlation analysis was used to calculate the correlation coefficient between different molecules. All statistical P values were two-sided if not specified, and a P value of less than 0.05 was considered to indicate statistical significance.
3 Results
3.1 Analysis framework and flow chart
The study’s flowchart is illustrated in Figure 1.
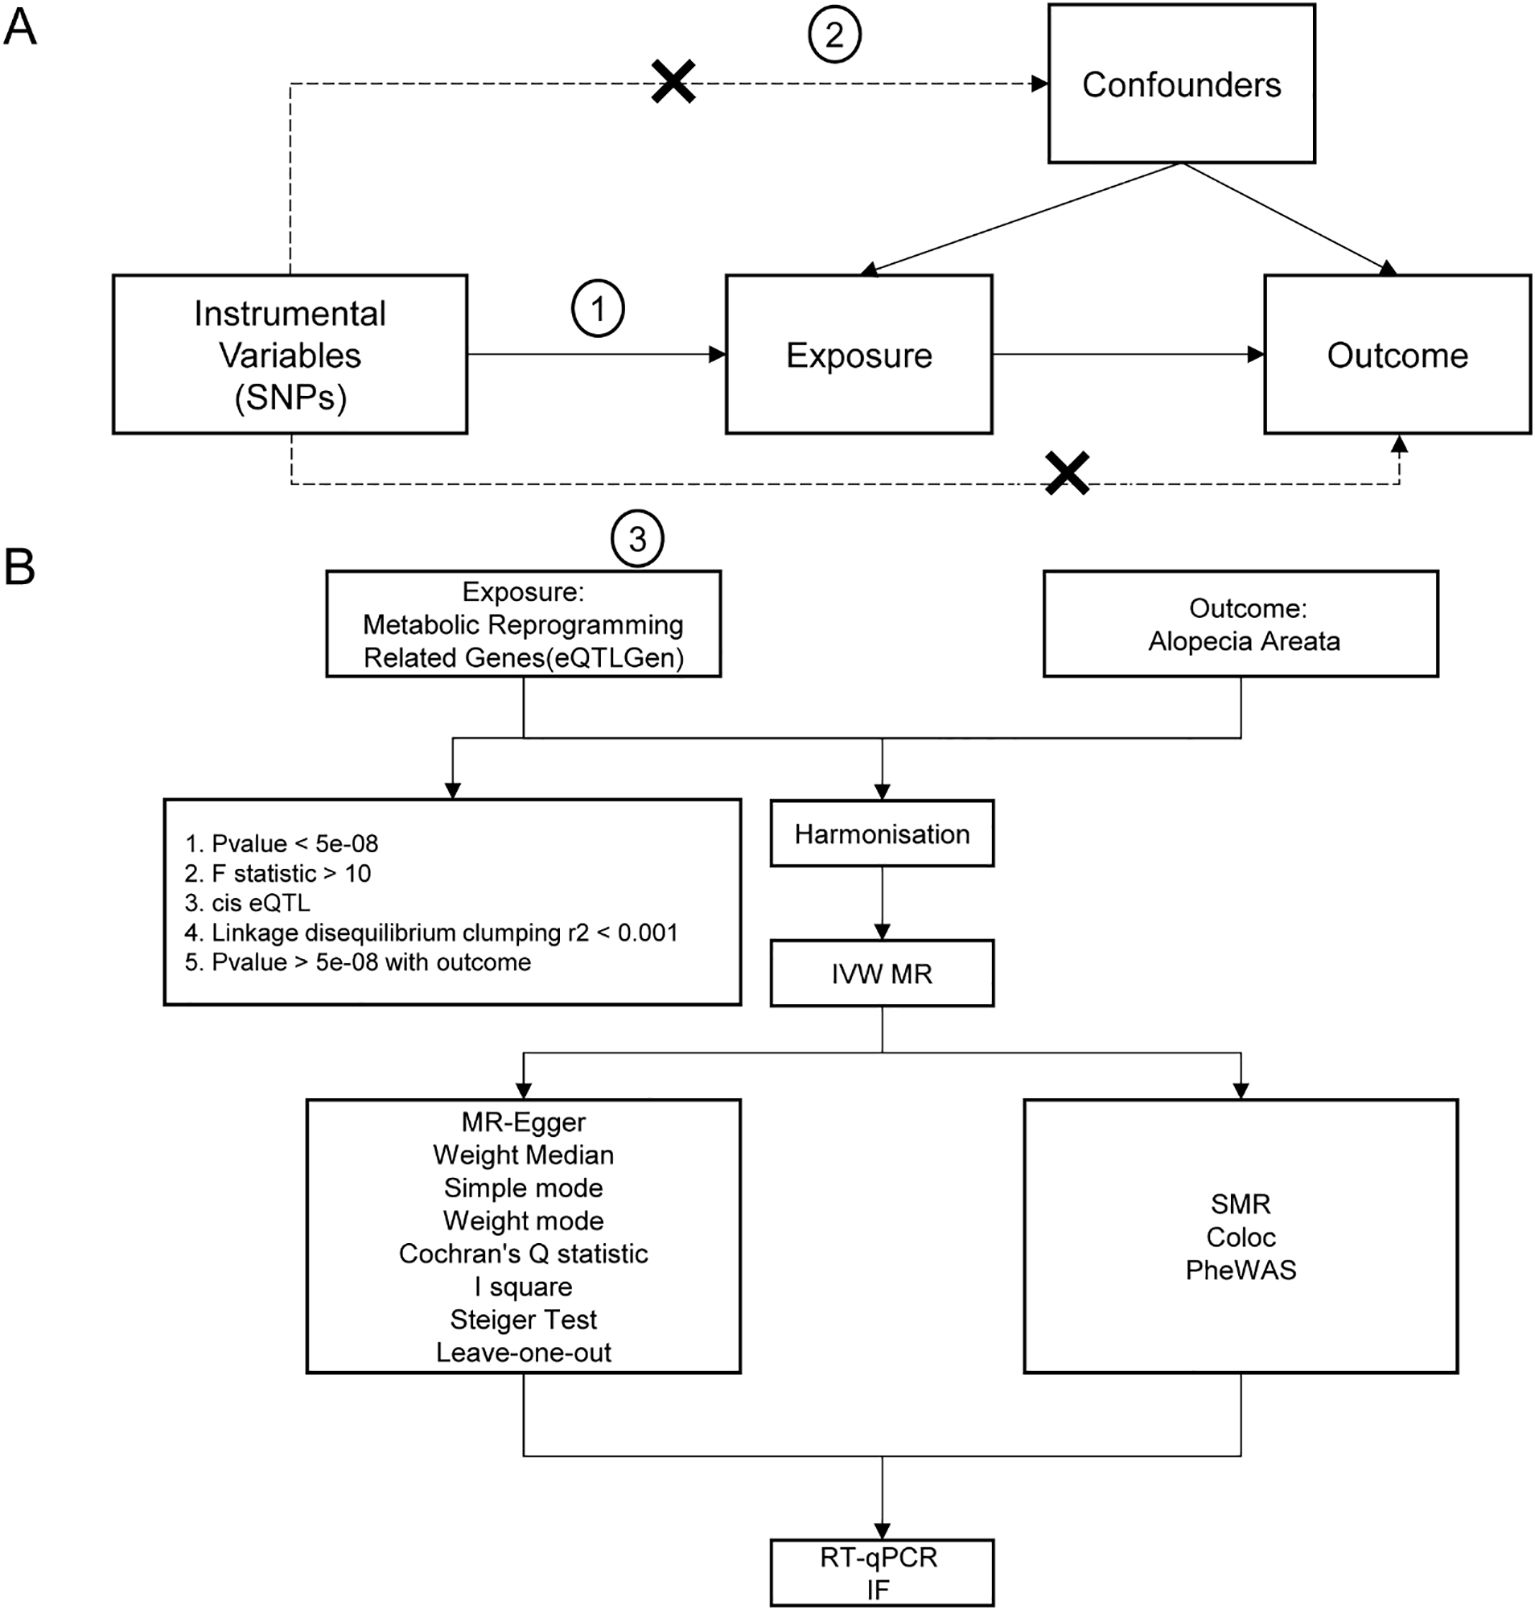
Figure 1. Flow chart of Mendelian randomization analysis. (A) The basic assumptions of Mendelian randomization analysis, including, firstly, the association assumption, that is, the selected instrumental variables must be significantly related to the exposure factor; secondly, exclusivity limitation, that is, the instrumental variables could only affect the outcome through the path of “instrumental variable → exposure → outcome”; And thirdly, independence assumption, that is, the instrumental variable must not be significantly related to potential confounders that might affect the exposure or outcome. (B) Flow chart of analysis methods in this study. SNP, single nucleotide polymorphism; IVW, inverse variance weighted; MR-Egger, Mendelian randomization-Egger; GWAS, genome-wide association study; SMR, Summary-data-based Mendelian Randomization.
3.2 MR Analysis of metabolic reprogramming related genes
We first intersected 96 MRRGs with 19127 genes in eQTLGen to obtain 88 genes (see Supplementary Table S1 in the appendix). Then we performed two-sample Mendelian randomization (MS) analysis on the cis-eQTL data of these 88 genes and AA by TwoSampleMR. We used P value < 0.05 as the screening condition for significant causality to further identify the genes with strong causal association with AA. From the results in Table 1, it could be seen that a total of 6 genes (DLD, NFE2L2, SDHB, SLC2A1, PSAT1, SQSTM1) have a causal relationship with AA, and the genes DLD, NFE2L2, SLC2A1, PSAT1, SQSTM1 is positively correlated with the risk of AA. SDHB is negatively correlated with the risk of AA. Finally, we plotted the scatter plots of the Mendelian randomization effect estimates of genes PSAT1 (Figure 2A), SQSTM1 (Figure 2B) and AA (plotting genes with Number of SNPs > 1), which showed that the intercept of each model line on the vertical axis was close to 0.
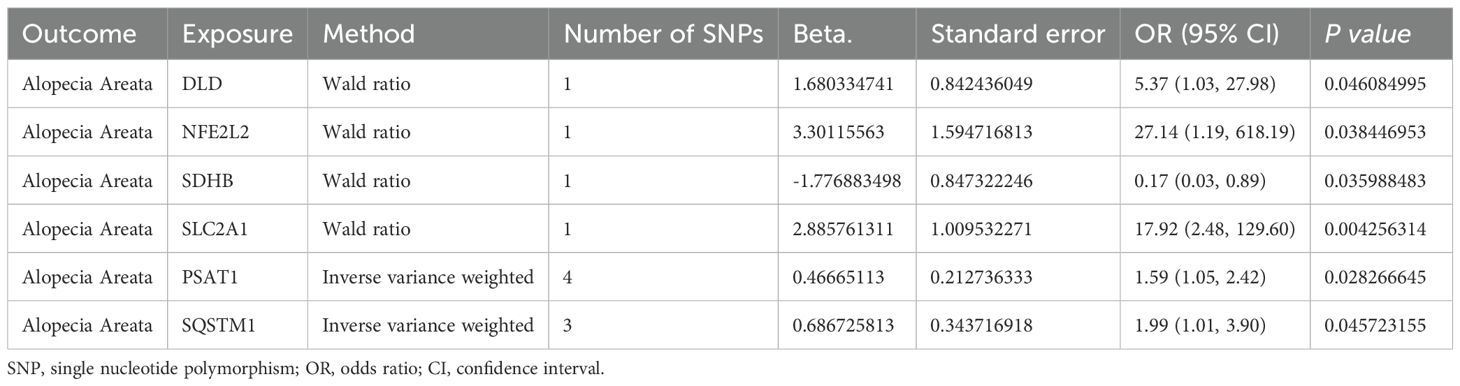
Table 1. Mendelian randomization causal effect estimates of genes from eQTLGen for the onset of alopecia areata.
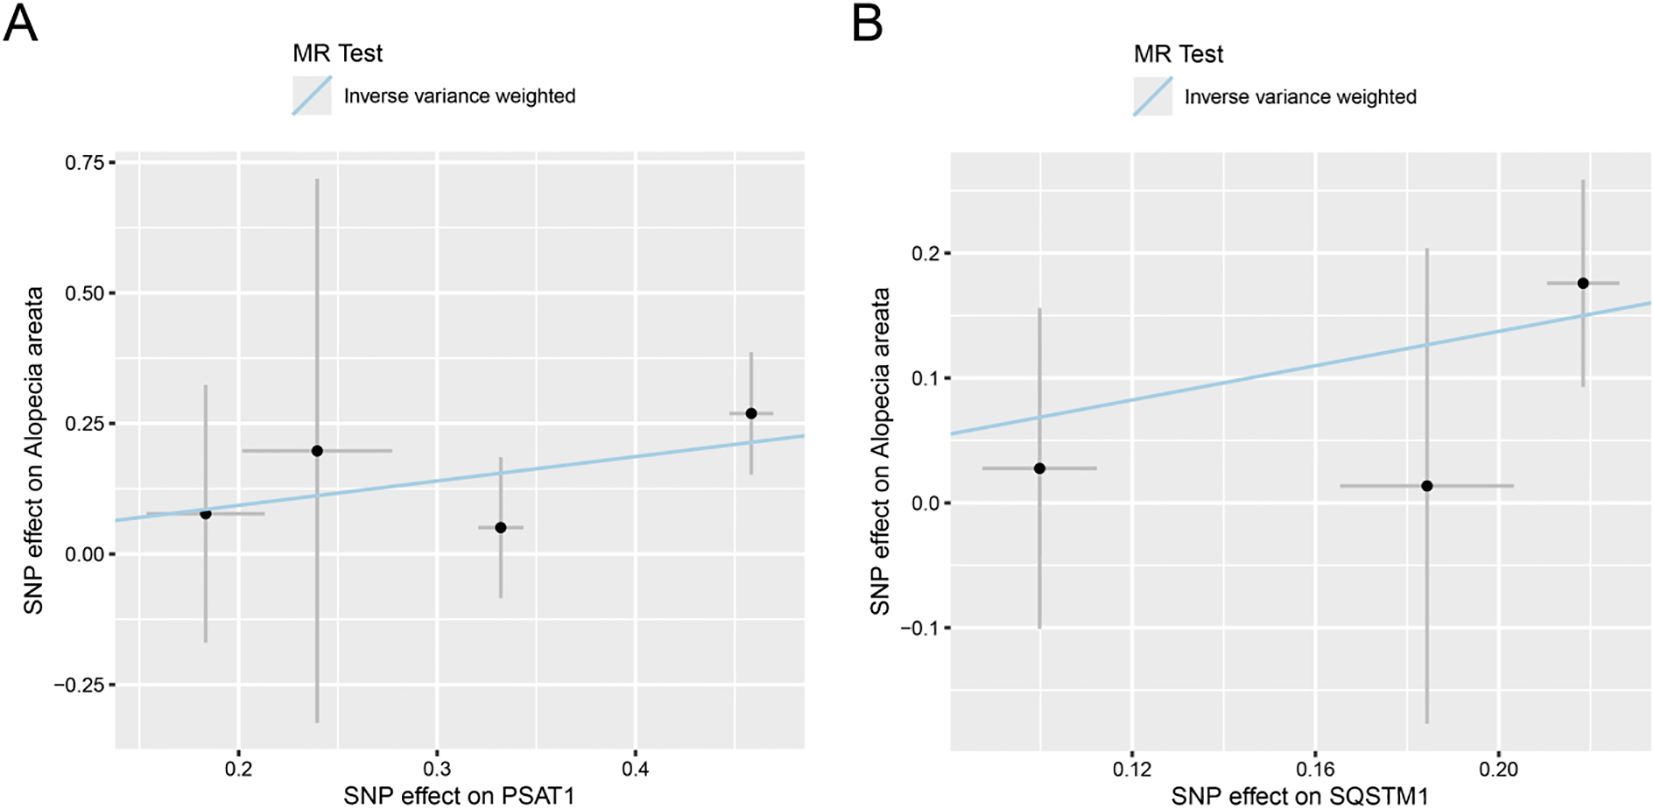
Figure 2. Scatter plot of estimated Mendelian randomization effect of genes on AA. (A, B) Scatter plots of Mendelian randomization effect estimate of genes PSAT1 (A), SQSTM1 (B) on AA, and the slopes of the lines indicate the magnitude of the predicted causal relationship. MRRGs, Metabolic Reprogramming Related Genes.
3.3 Sensitivity analysis of genes and AA
First, we performed heterogeneity test for significant results (PSAT1, SQSTM1) using Cochran Q test and I2 statistic, as shown in Table 2. The results showed that there was no heterogeneity in the MR Results of genes (PSAT1, SQSTM1) for AA (Cochran Q P value >0.05), and the heterogeneity ratio was low (I2<50%). The funnel plot of the indicator IVs is shown in Figure 3, which only shows the results when the number of SNPS is greater than 2, showing that the scatter of the causal association effect is basically symmetrically distributed on both sides of the IVW model line, indicating that there is no potential bias in the results. Indicators with less than 3 SNPS could not be subjected to horizontal pleiotropy test and one-by-one elimination test.
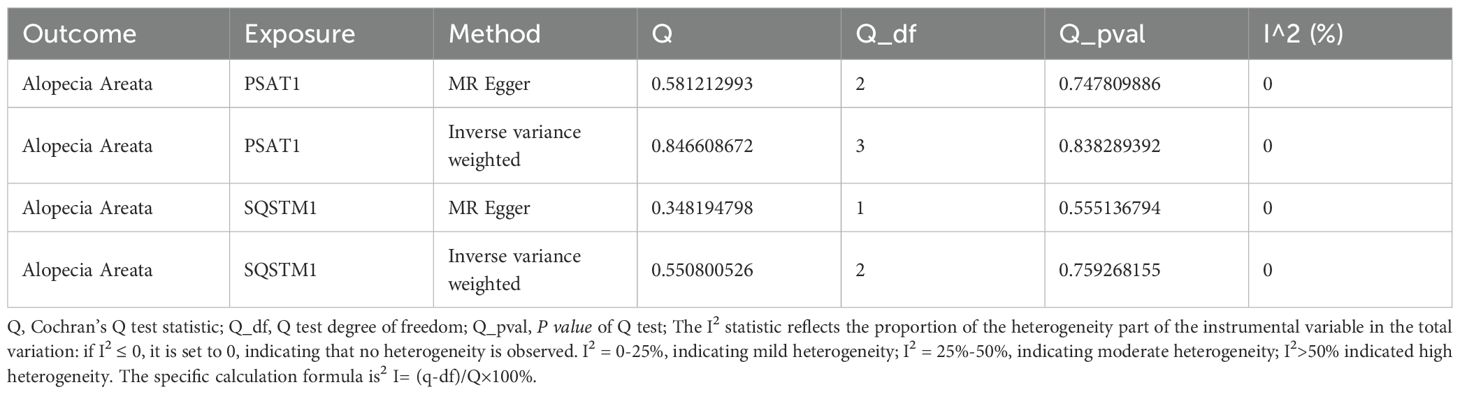
Table 2. Heterogeneity test of Mendelian randomization analysis of genes for alopecia areata.
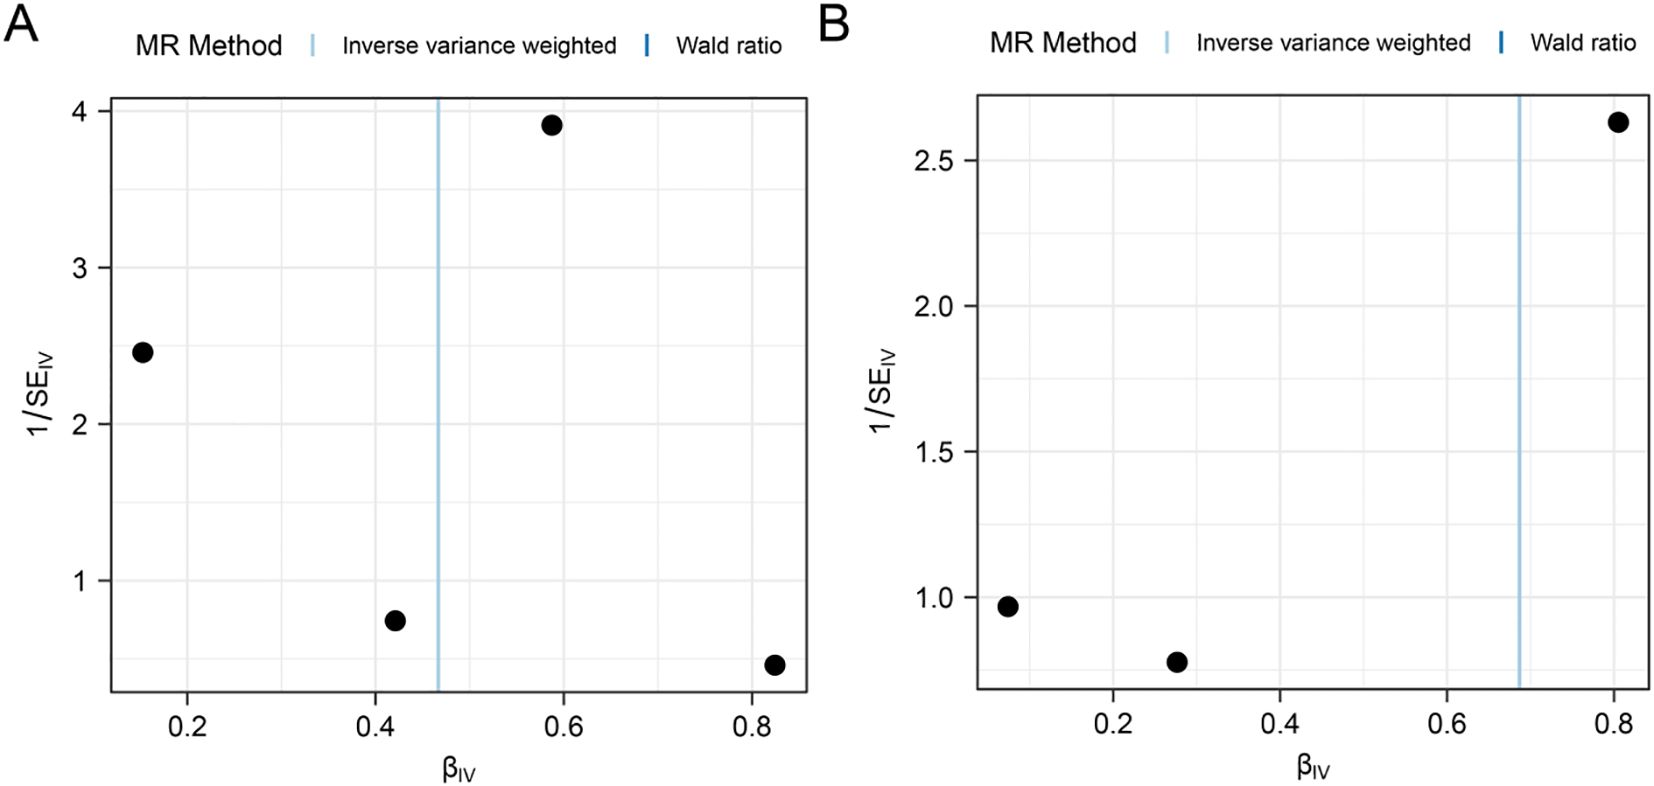
Figure 3. Funnel plot of heterogeneity test for Mendelian randomization analysis of genes for alopecia areata. (A, B) Funnel plot of Mendelian randomization heterogeneity test for genes PSAT1 (A), SQSTM1 (B) versus alopecia areata (AA).
Then, the MR-Egger regression was used to test the horizontal pleiotropy of IVs. We tested the pleiotropy of genes (PSAT1, SQSTM1) and AA (Table 3), which showed that genes (PSAT1, SQSTM1) were not affected by the horizontal pleiotropy (P vale>0.05).

Table 3. Genes for alopecia areata Mendelian randomization analysis level pleiotropy test.
Each line in the Figure represents the effect size and 95% confidence interval range of the index after the corresponding SNP is removed, and the red line represents the reference effect interval. It could be seen that each line has a high degree of overlap with the red line interval, indicating that the effect estimate will not change significantly with the removal of a single SNP, and the results are stable (Figure 4).
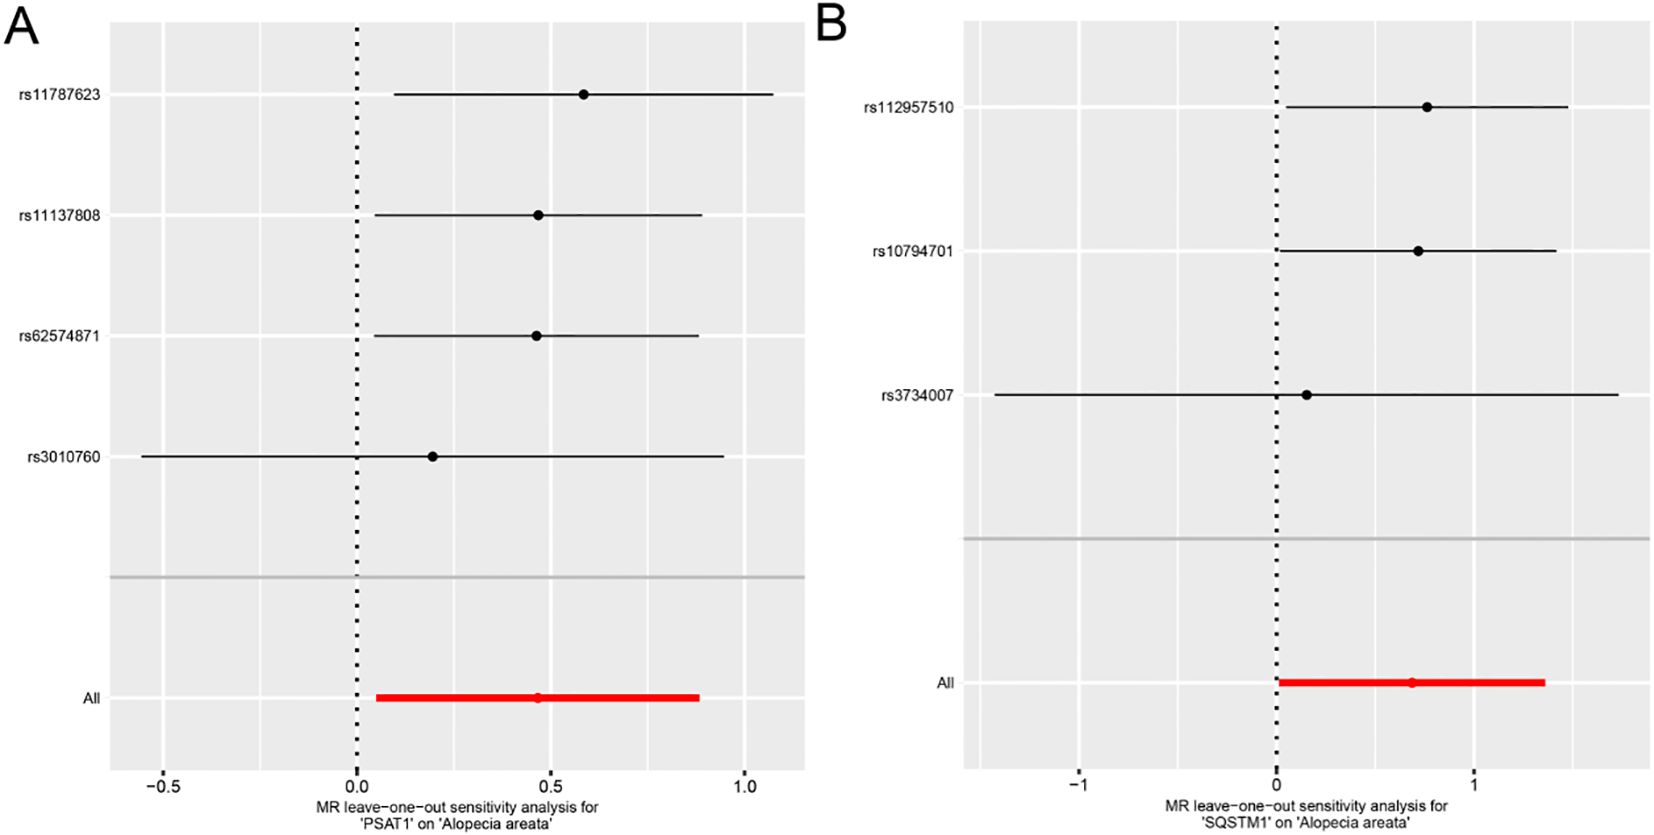
Figure 4. Forest plot of Leave-one-out analysis for Mendelian randomization analysis of genes and alopecia areata. A-B. Forest plots of individual effect estimation results using single SNP locus analysis for genes PSAT1 (A), SQSTM1 (B) and alopecia areata (AA).
To ensure that the causal role of genes in the pathogenesis of AA was in the right direction, we further performed the analysis using steiger’s direction test and found that genes (DLD, NFE2L2, SDHB, SLC2A1, PSAT1, SQSTM1) and AA, the p value of steiger direction test was much less than 0.05, indicating the correct direction (Table 4).
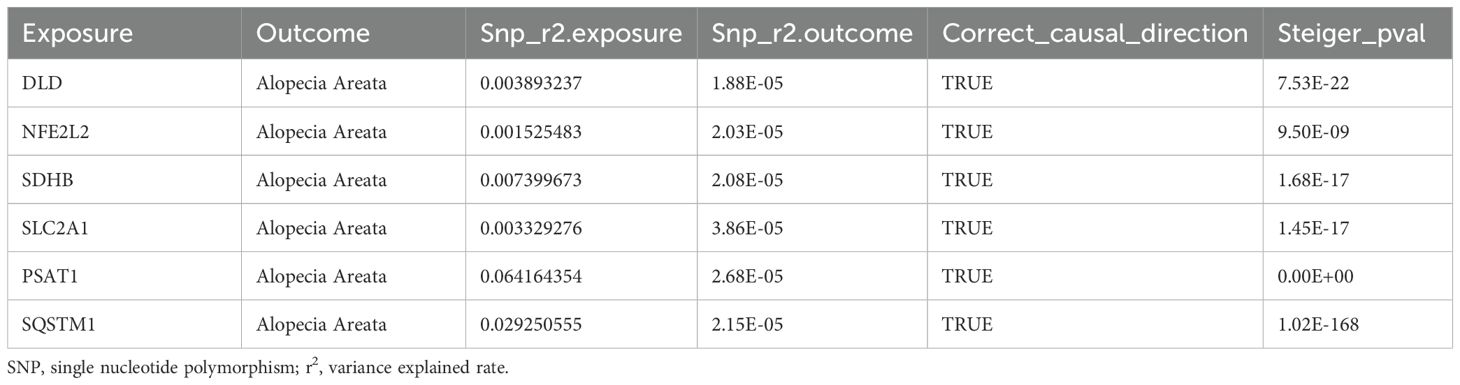
Table 4. Mendelian randomization analysis of genes for alopecia areata steiger directionality test.
3.4 SMR analysis and colocalization analysis
We found six genes (DLD, NFE2L2, SDHB, SLC2A1, PSAT1, SQSTM1) with p_SMR < 0.05 (Table 5), which further proved that causal relationship existed between the genes (DLD, NFE2L2, SDHB, SLC2A1, PSAT1, SQSTM1) and AA. We further performed colocalization analysis at the SNP level to assess evidence for common causal variants between six genes (DLD, NFE2L2, SDHB, SLC2A1, PSAT1, SQSTM1) and AA. We ranked SNPS located ±50 kb between genes (DLD, NFE2L2, SDHB, SLC2A1, PSAT1, SQSTM1) and AA risk using Bayesian colocalization analysis. Colocalization analysis showed no direct shared causal variants (PP.H4.abf < 0.5) between genes (DLD, NFE2L2, SDHB, PSAT1, SQSTM1) expression and AA risk, suggesting that other traits might mediate the causal relationship. A direct shared causal variant (PP.H4.abf > 0.5) was found between gene (SLC2A1) expression and AA risk. Finally, we used the R package locus compare to display the genes DLD (SNP: rs17154615, Figure 5A), NFE2L2 (SNP: rs1806649, Figure 5B), SDHB (SNP: rs116216662, Figure 5C), SLC2A1 (SNP: rs841572, Figure 5D), PSAT1 (SNP: rs3010760, Figure 5E), SQSTM1 (SNP: rs3734007, Figure 5F) and distribution of major SNPS in AA (Figures 5A–F, Table 6).
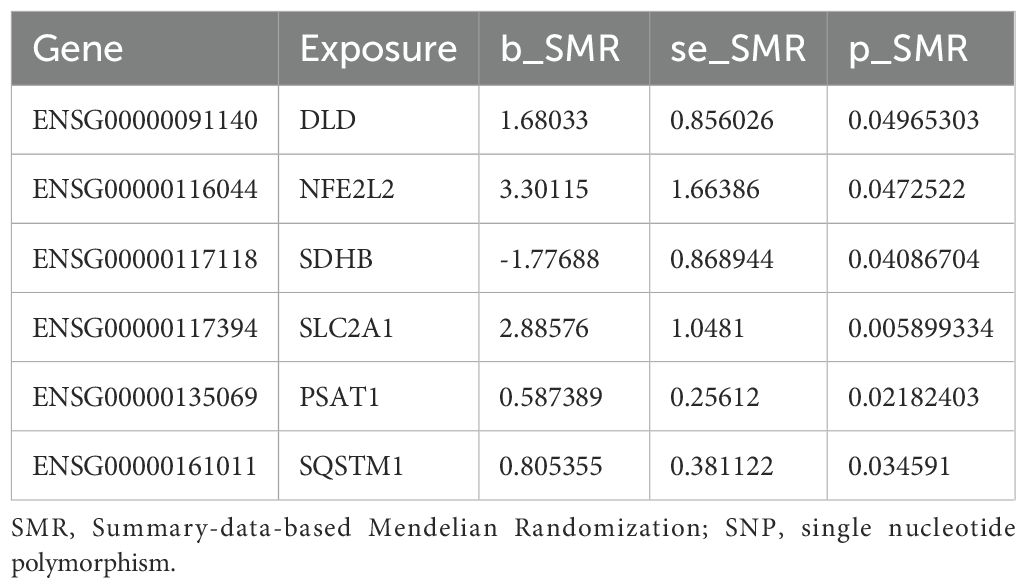
Table 5. Results of SMR analysis of genes for alopecia areata.
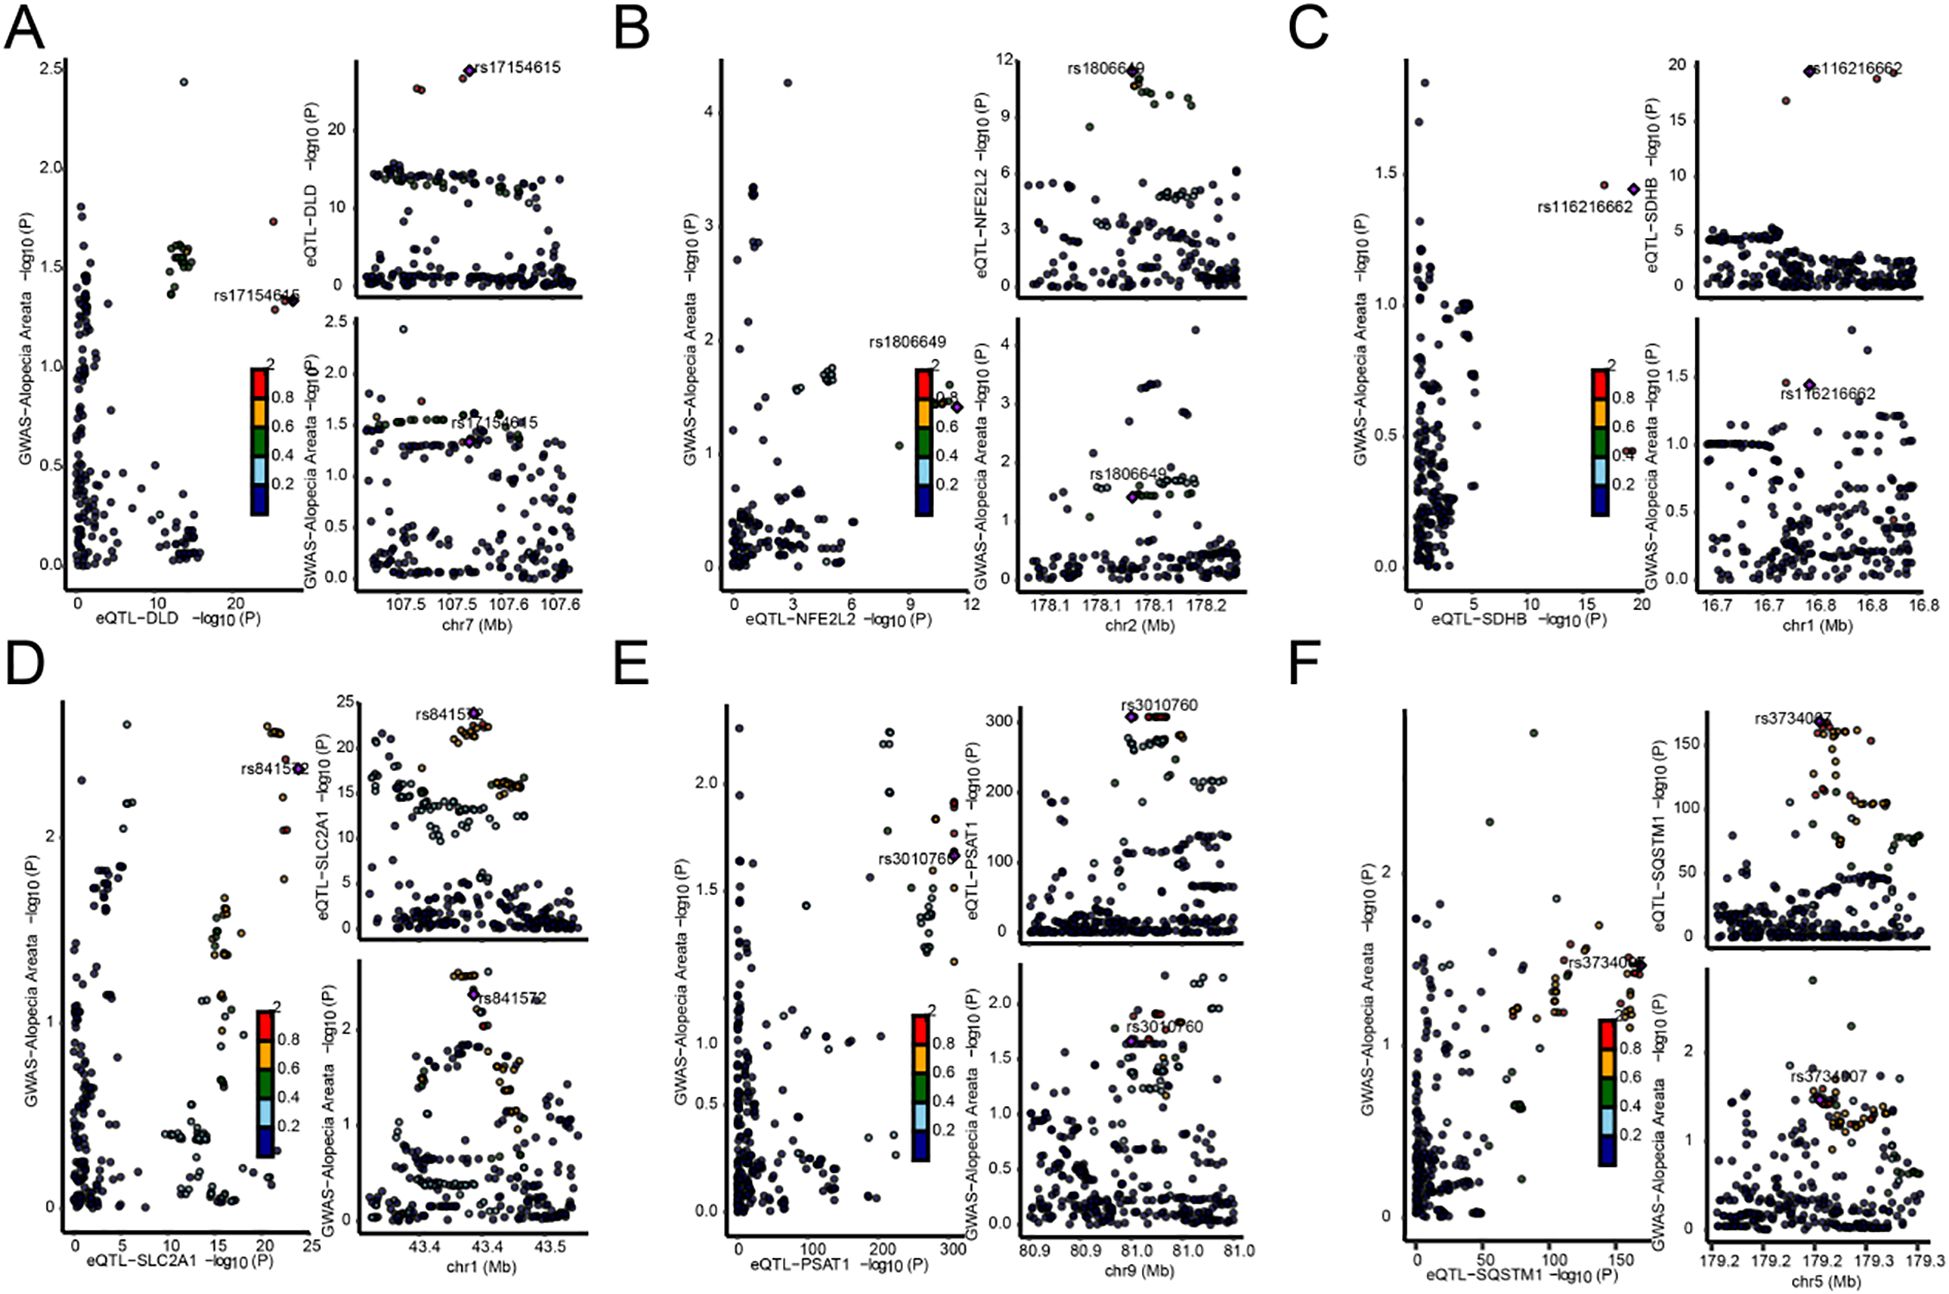
Figure 5. Map of the co-localization region between genes and AA. (A–F). Map of co-localized regions of genes with AA, DLD (A), NFE2L2 (B), SDHB (C), SLC2A1 (D), PSAT1 (E), SQSTM1 (F). The left panel of each plot represents the distribution of single nucleotide polymorphisms (SNPS) in genome-wide association studies (GWAS) and expression quantitative Trait loci (eQTL) −log10 (p), with smaller p values above the Y-axis. The two plots on the right show the distribution of EQTls and GWAS by sublist, respectively (abscissions are loci for SNPS, and ordinate represent −log10 (p) values for SNPS in that GWAS/eQTL data).
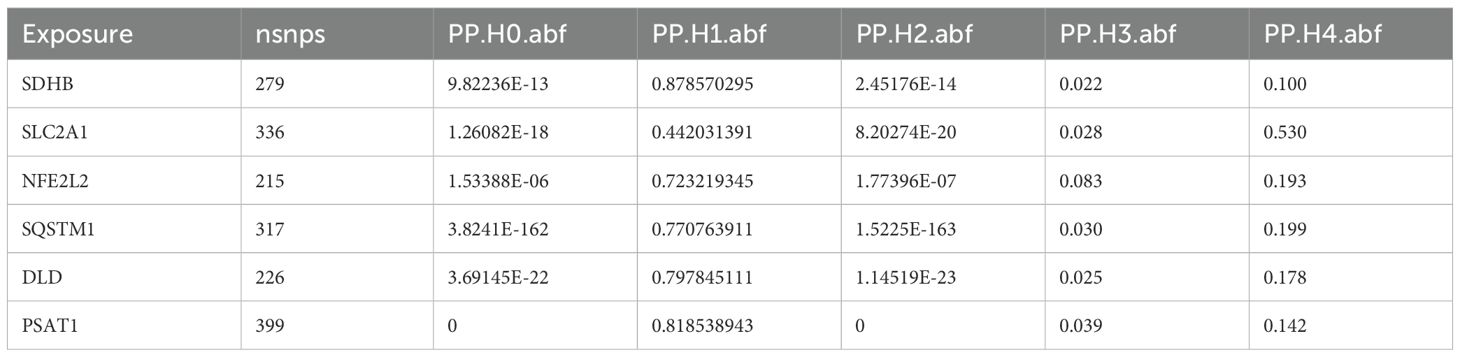
Table 6. Results of colocalization analysis of genes and alopecia areata coloc.
3.5 Gene whole-phenomenon association analysis
Using PheWAS Portal and PheWeb databases, we performed full phenomenon Mendelian randomization to determine possible side effects of targeting DLD, NFE2L2, SDHB, SLC2A1, PSAT1, SQSTM1. It was found that, as shown in the PheWeb database (Table 7), The gene DLD is associated with Cholelithiasis and cholecystitis, Cholelithiasis, Inflammatory bowel disease and gastroenteritis and colitis other gastroenteritis and colitis), Ulcerative colitis, and the NFE2L2 gene with Abnormal sputum p value < 5 × 10⁻⁸), Hemoptysis (p value < 5 × 10⁻⁸) at the genome-wide significance level. The PheWAS Portal (Table 8) showed that except for the significant relationship between the gene SDHB and Chapter II Neoplasms at the genome-wide significance level (p value < 5 × 10⁻⁸), All other genes showed no significant relationship at the genome-wide significance level (p value >5 × 10⁻⁸). Meanwhile, no association was reported between Abnormal sputum, Hemoptysis and AA.
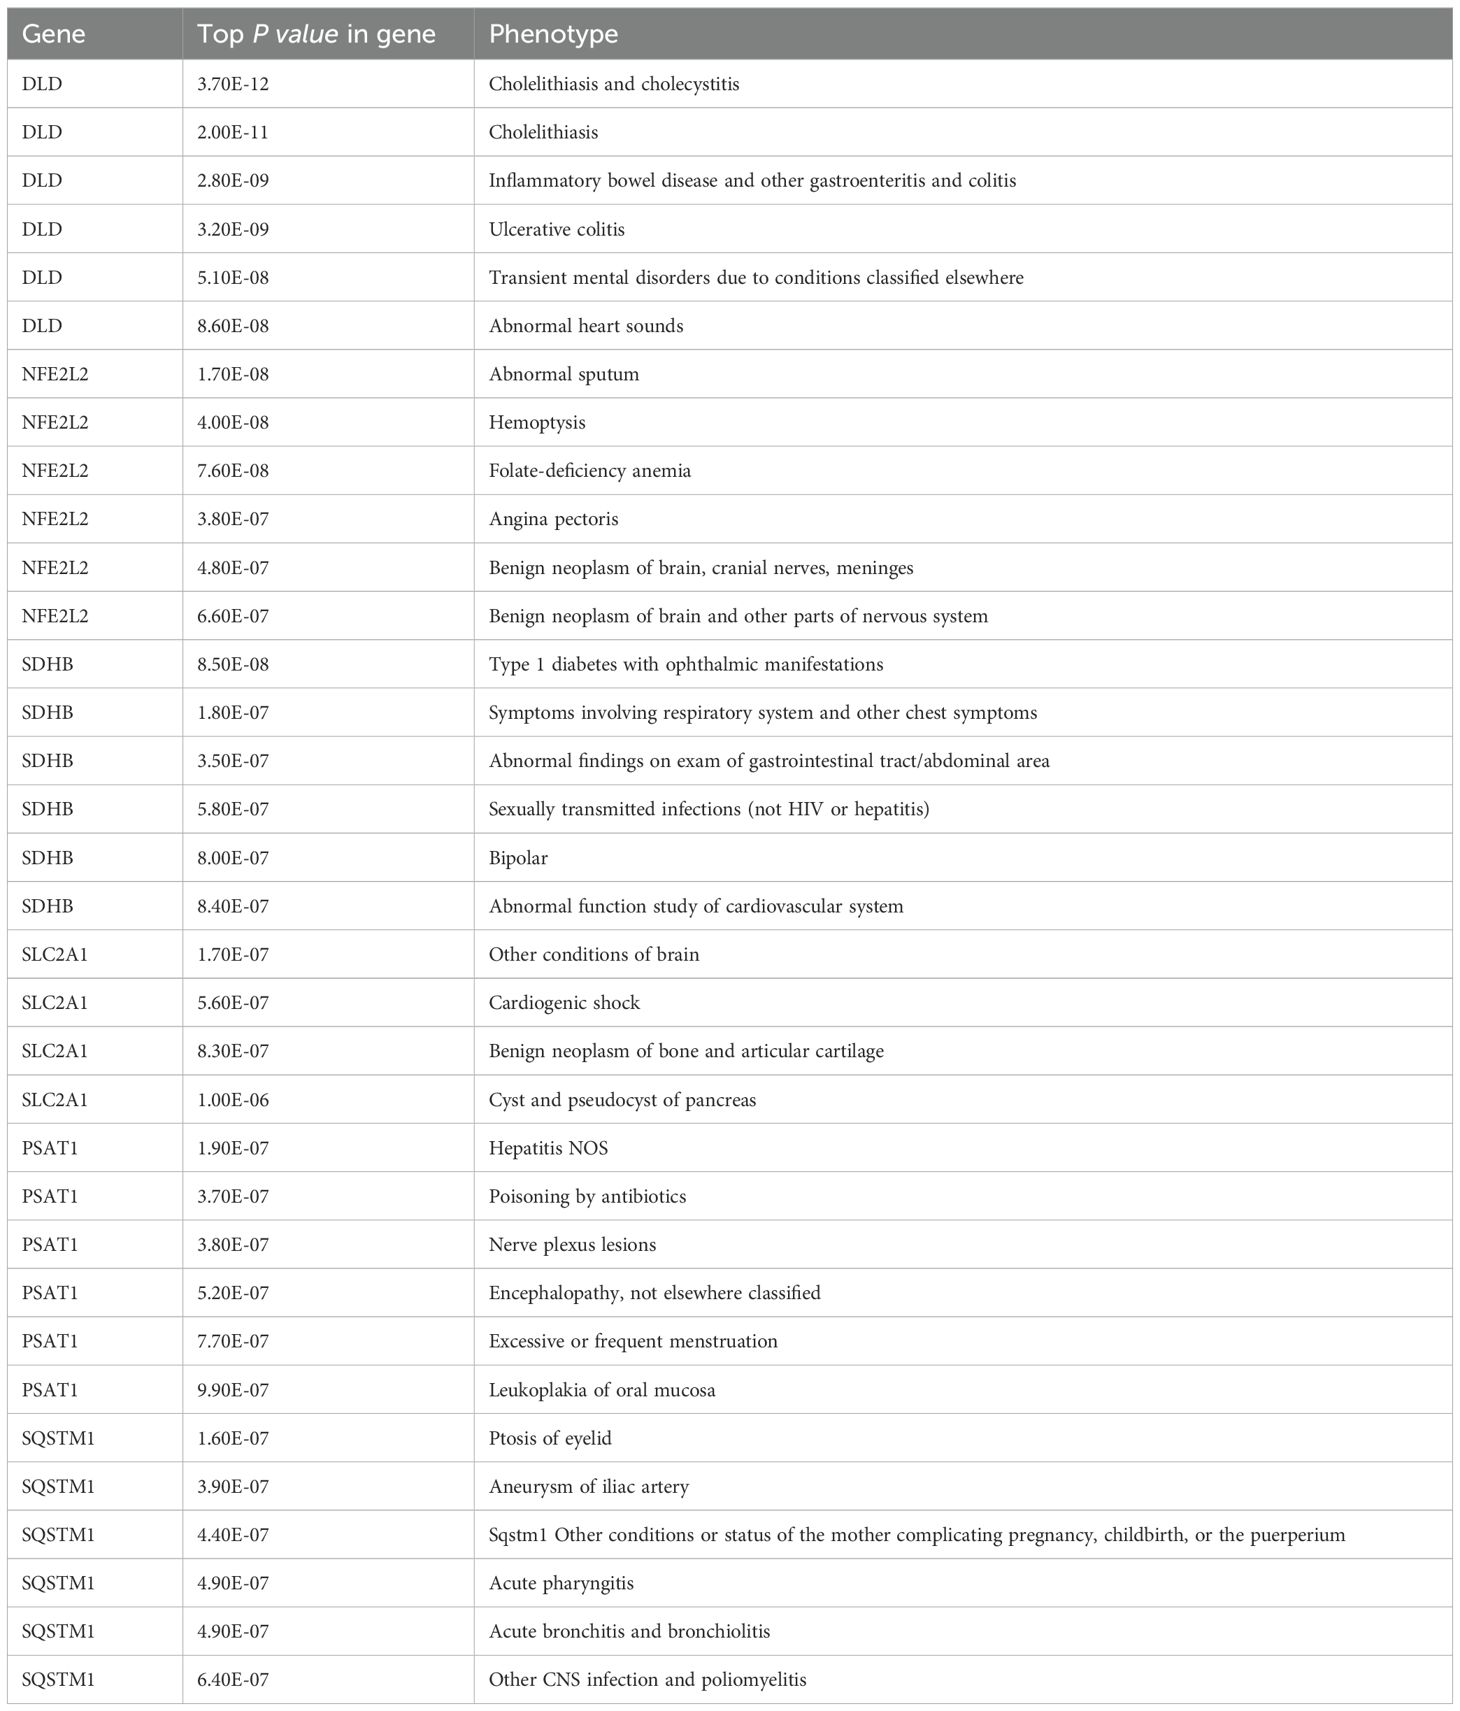
Table 7. Results of gene-wide phenomenon association analysis (PheWeb).
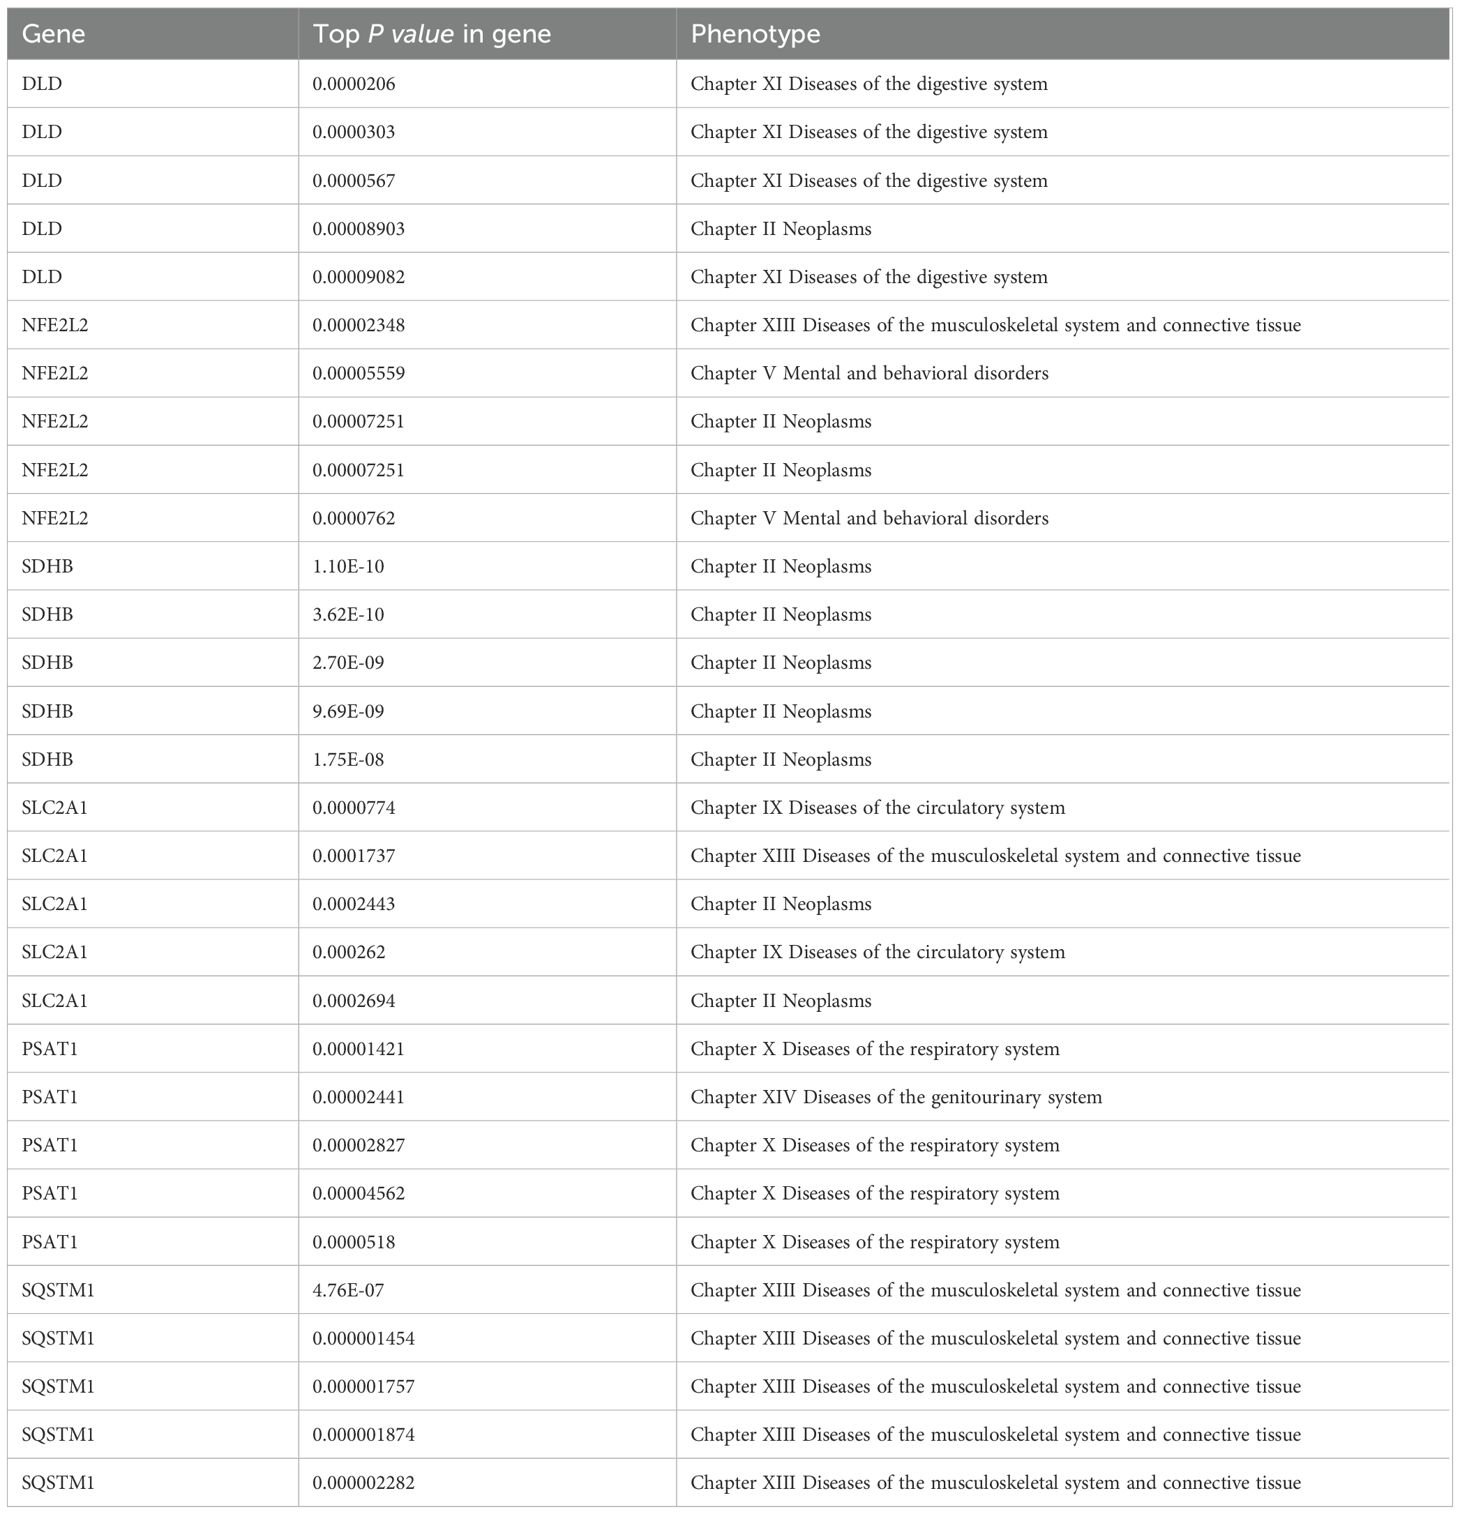
Table 8. Results of gene whole-phenomenon association analysis (PheWAS Portal).
3.6 Dysregulated expression of SQSTM1 and blocked autophagy activity in AA
Furthermore, we sought to investigate whether the potential risk genes significantly associated with AA exhibit altered expression during disease progression. Scalp biopsies from AA patients (confirmed by histopathology) were obtained, and we quantitatively measured the mRNA expression levels of DLD, PSAT1, and SQSTM1 by RT-qPCR. The results demonstrated that while DLD and PSAT1 mRNA levels in lesional areas showed no significant difference compared to healthy controls, SQSTM1 mRNA level was markedly elevated in AA patients (Figure 6A). Given that SQSTM1 serves as a crucial indicator of autophagic activity, we subsequently evaluated autophagy levels in hair follicles through immunofluorescence staining (Figure 6B). Quantitative analysis revealed that compared to healthy controls, AA-affected hair follicles exhibited higher SQSTM1 expression but lower LC3B-II expression, consistent with a state of autophagy suppression. It should be noted that the LC3B (D11) XP Rabbit mAb (Cell Signaling Technology, #3638) used for LC3B immunostaining exhibits stronger reactivity with endogenous LC3B-II (16). These results indicate that while the synthesis of SQSTM1, one of key autophagy-related protein is increased in lesional areas of AA patients, autophagic flux is significantly blocked.
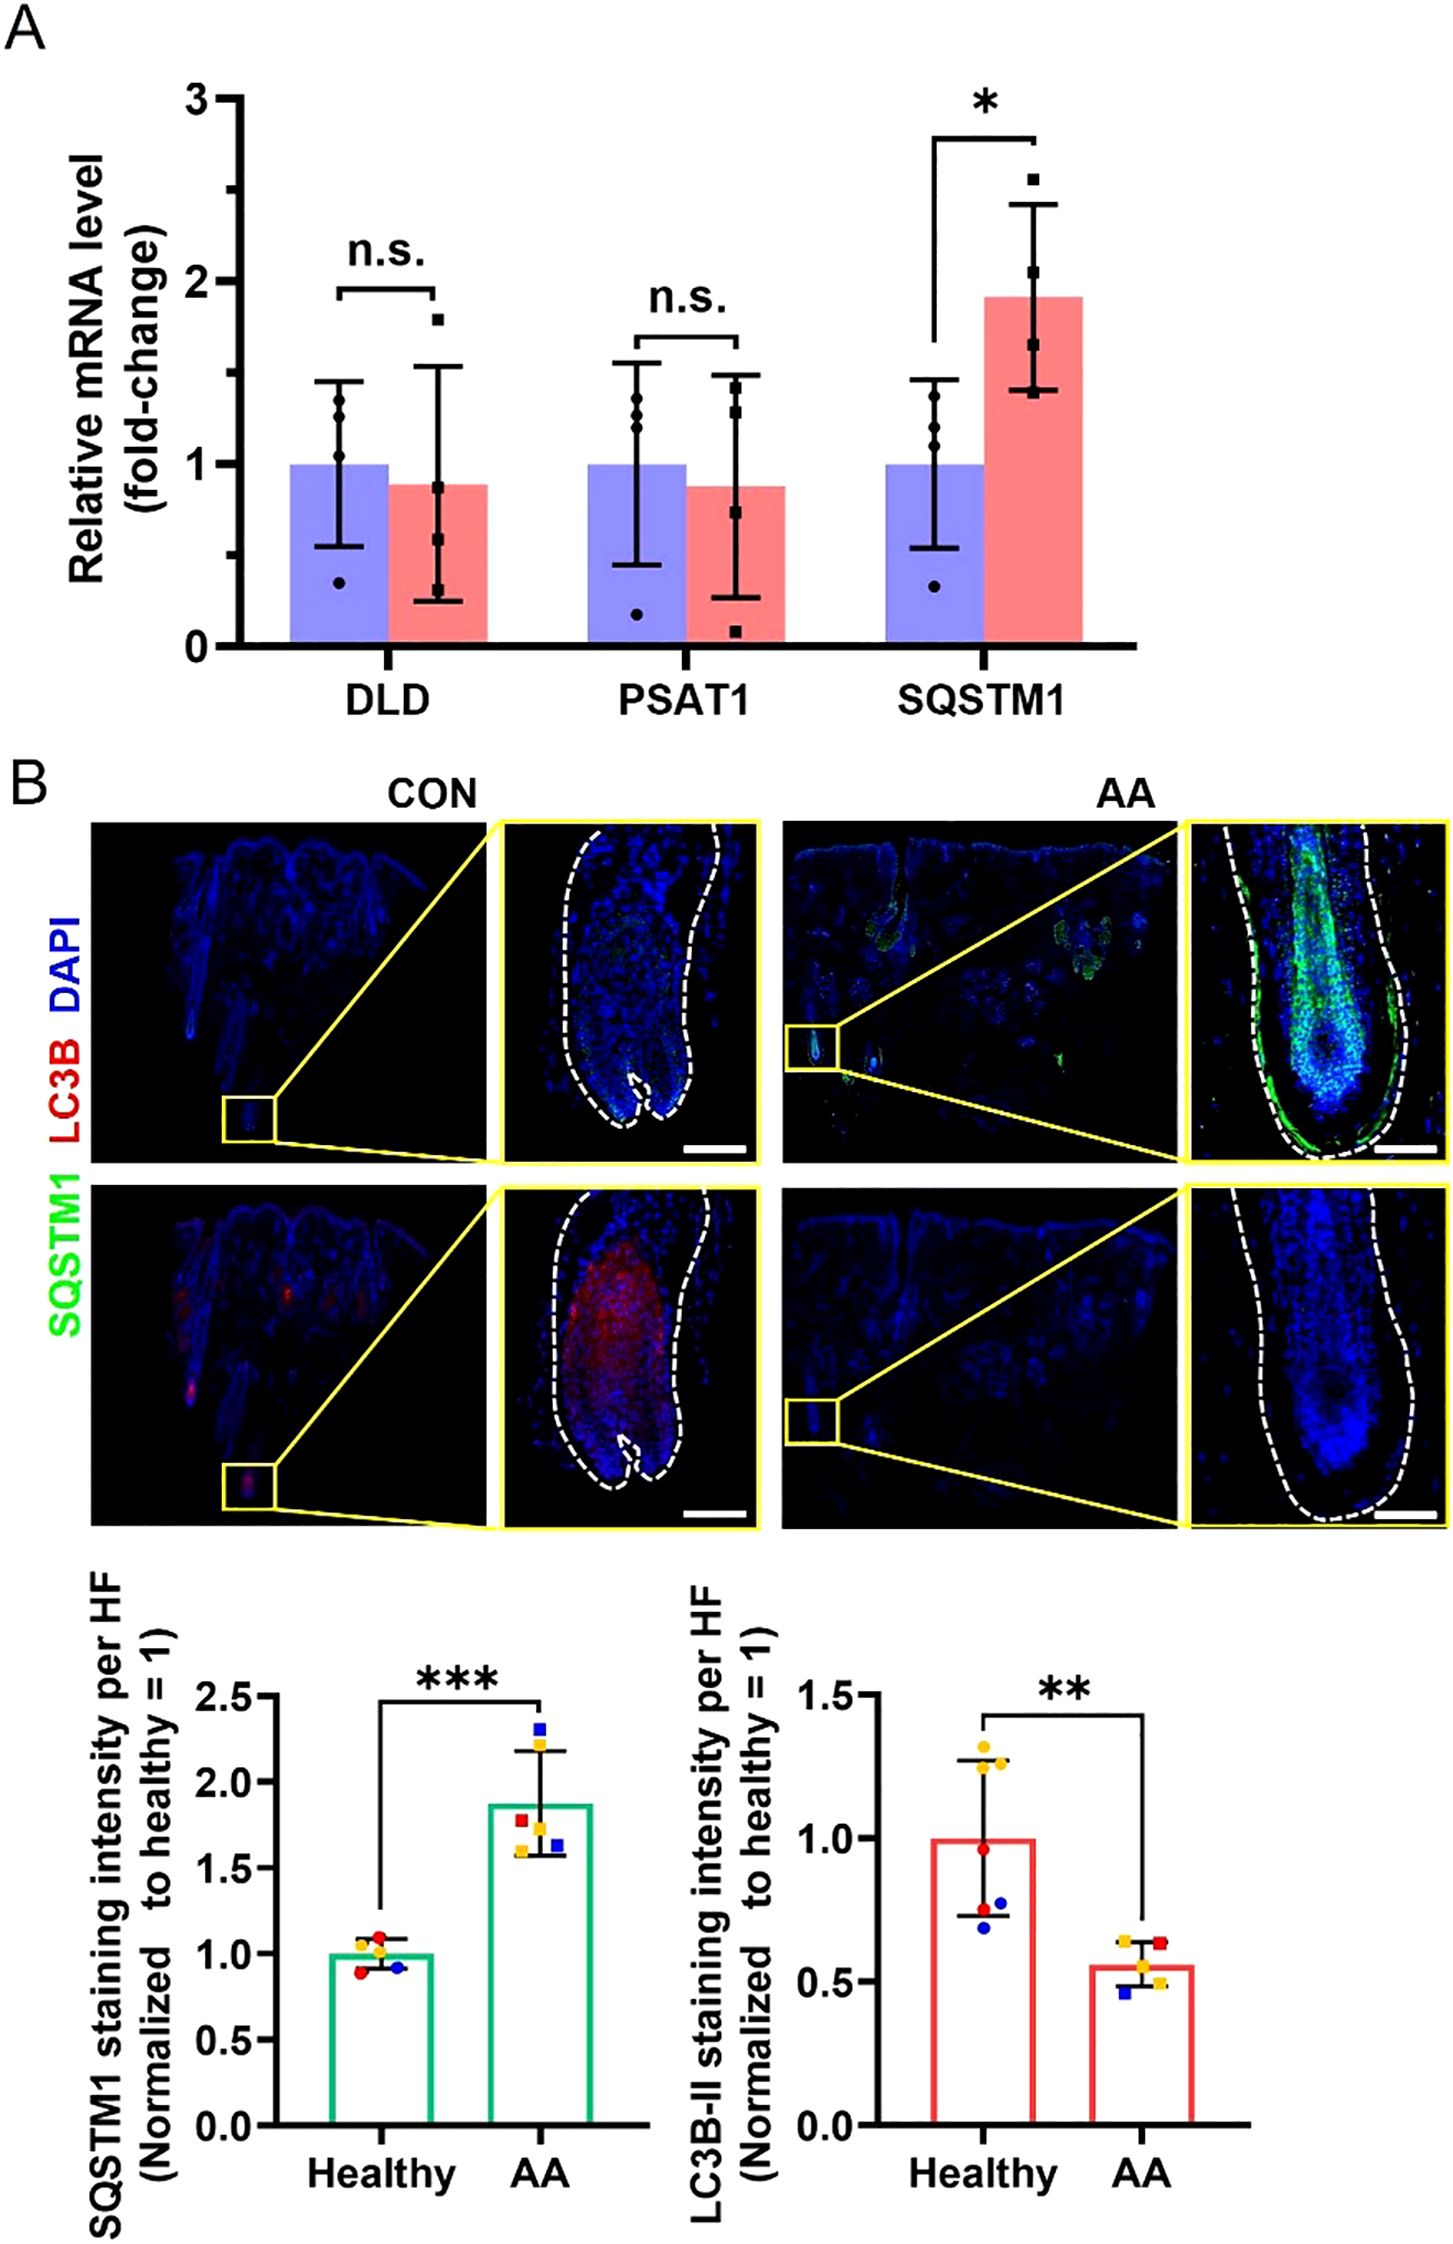
Figure 6. Differences in related mRNA and protein levels in scalp biopsies between healthy controls and AA patients. (A) RT-qPCR analyses for relative mRNA level of DLD, PSAT1 and SQSTM1. N = 4 independent samples. (B) Representative immunofluorescent images of SQSTM1 and LC3B in healthy controls and AA patients. Scale bars, 50 μm. Bottom, quantification of these two proteins’ expression in the hair follicle region. Multiple hair follicle fields included in the statistical analysis were derived from 3 independent samples. All data are mean ± s.d. *p < 0.05, **p < 0.01, *** p < 0.001, ns: non-significant.
4 Discussion
AA is currently recognized as an autoimmune and inflammatory disease, affecting approximately 2% of the population, with potential antigens including melanocytes and their products, as well as keratinocytes. The disease is predominantly mediated by CD8+ T cells. Clinically, AA is often accompanied with type II inflammatory diseases and other autoimmune diseases. Psychological stress and Infection induction are known triggers for AA, however, some severe AA usually has no obvious predisposing factors (3). Despite significant progress in the field, there remains a notable gap in our knowledge regarding the precise genetic mechanisms underlying AA. While numerous studies have identified candidate genes associated with the disease, the complexity of gene interactions and their effects on metabolic pathways require further elucidation. Emerging evidence may suggest a potential link between AA and metabolic reprogramming. Firstly, immune dysregulation in AA might influence cellular metabolic pathways, including energy and lipid metabolism, which in turn could affect immune cell function. Secondly, psychological stress, a known trigger for AA, could induce metabolic reprogramming. Thirdly, metabolic reprogramming is often accompanied by inflammatory responses (4, 5), and the accumulation of inflammatory cells around hair follicles in AA might be related to altered metabolic states. Lastly, metabolic reprogramming might lead to nutrient deficiencies, adversely affecting hair growth and health. This study aims to elucidate the genetic factors contributing to AA by employing a comprehensive MR analysis. The analytical framework of this study is built upon the MR-Base platform proposed by Hemani et al. (11), and the SMR method developed by Zhu et al. (13) and Wu et al. (17) Our findings reveal six MRRGs—DLD, NFE2L2, SDHB, SLC2A1, PSAT1, and SQSTM1—that demonstrate significant causal associations with AA. Among these, DLD, NFE2L2, SLC2A1, PSAT1, and SQSTM1 were positively correlated with the disease, while SDHB exhibited a negative correlation.
Notably, we found that AA-affected hair follicles exhibited higher SQSTM1 expression but lower LC3B-II expression, consistent with a state of autophagy suppression. SQSTM1 functions as a critical signaling node that coordinates both mTORC1 activation on lysosomes and Keap1-Nrf2 pathway regulation on autophagic cargoes, while simultaneously serving as an essential adaptor protein for selective autophagy processes (18–20). Abnormalities in autophagy are frequently associated with various diseases, such as Crohn disease, celiac disease, multiple sclerosis, systemic lupus erythematosus, and type 1 diabetes (22, 23). Recent studies have elucidated the link between autophagic dysregulation and mitochondrial dysfunction in driving neurodegeneration (24).
Autophagy plays a direct regulatory role in hair regeneration, where its activation promotes hair growth in telogen hair follicles (25). Studies have indicated that an imbalance between mitophagy and oxidative stress—leading to hair follicle damage—plays a significant role in androgenetic alopecia (26, 34). Previous GWAS analysis has linked two autophagy-related pathways involving PARK2 and PFKFB3 with increased susceptibility to AA (27), also revealed that variations in genes such as STX17, CLEC16A, and BCL2L11/BIM, which play a role in regulating autophagy, are predisposing genetic loci for AA (28, 29). In addition, identified multiple AA patients with copy number variations (CNV) in the genomic region spanning ATG4B, which is a cysteine protease involved in posttranslational modification of the autophagy protein LC3 (22, 30–32). In fact, impairment in autophagy has been implicated in the loss of immune tolerance in human AA (21). Recent studies have elucidated that Centella asiatica (CAW) can induce changes in the DNA methylation pattern of peripheral blood in aged mice associated with increased lifespan and processes associated with healthy aging, thereby regulating immune-related metabolic pathways (33). In AA, the relationship between changes in autophagy and epigenetic modifications merits investigation.
In our research, autophagic activity in hair follicles of AA is suppressed, while SQSTM1 mRNA levels are significantly increased compared to healthy controls. This observation suggests that the elevated SQSTM1 levels result not only from impaired autophagy-mediated degradation (leading to SQSTM1 accumulation), but also potentially from active upregulation of SQSTM1 synthesis. Generally, autophagy plays a protective role in cells, but disruption of autophagy mechanisms or excessive autophagic flux usually leads to cell death which propagates aberrant immune responses (34) and may trigger metabolic reprogramming. From the perspective of metabolic reprogramming, we propose a hypothesis that abnormal SQSTM1 gene expression in AA patients may lead to dysfunctional SQSTM1 protein biology, thereby impairing autophagy. In response, the system attempts to compensate by increasing SQSTM1 synthesis, yet this fails to restore autophagic flux. SQSTM1 transcriptional activation may result from Nrf2-mediated transcription activation, and subsequently triggers NF-κB activation and inflammatory response (35). We postulate that increased SQSTM1 transcription and protein accumulation in lesional follicles predict increased susceptibility to inflammation response, and autophagic impairment, driving AA pathogenesis.
However, this study still has limitations and requires further improvement. First, the Mendelian randomization analysis conducted relies on data from public databases, with study samples predominantly sourced from European populations, which may introduce biases related to population applicability. Second, the Alopecia Areata GWAS dataset utilized in this study contains a relatively small number of case samples (289 cases), which could compromise statistical power. Third, the eQTLGen database is primarily based on peripheral blood samples, and its gene expression profiles may differ from those of local hair follicle tissues, thereby restricting the tissue-specific interpretation of the results to some extent. Furthermore, while Mendelian randomization can mitigate confounding biases, it may still be susceptible to the effects of horizontal pleiotropy and the accuracy of instrumental variables. Finally, the sample sizes for RT-qPCR and immunofluorescence validation are limited; future studies should expand the sample sizes and integrate functional experiments to further validate the mechanisms of action of these key genes. Moreover, we will further validate the functional role of SQSTM1 in the pathogenesis of AA through cellular and animal model experiments (e.g., mechanisms of autophagic flux and immune regulation), and enhance prospects for clinical translation.
In conclusion, this research elucidates association between metabolic reprogramming and AA, particularly highlighting the role of SQSTM1, advancing our understanding of AA pathophysiology and is a promising therapeutic target.
Data availability statement
The original contributions presented in the study are included in the article/Supplementary Material. Further inquiries can be directed to the corresponding author.
Ethics statement
The studies involving humans were approved by Medical Ethics Review Committee of Hangzhou Third People’s Hospital. The studies were conducted in accordance with the local legislation and institutional requirements. The participants provided their written informed consent to participate in this study.
Author contributions
LH: Data curation, Methodology, Software, Writing – original draft, Writing – review & editing. SW: Data curation, Methodology, Writing – original draft, Writing – review & editing. XS: Conceptualization, Project administration, Supervision, Writing – review & editing.
Funding
The author(s) declare financial support was received for the research and/or publication of this article. Project supported by the National Natural Science Foundation of China (82473549) and Science and Technology Major Project of Zhejiang Province and the State Administration of Traditional Chinese Medicine (GZY-ZJ-KJ-23035).
Conflict of interest
The authors declare that the research was conducted in the absence of any commercial or financial relationships that could be construed as a potential conflict of interest.
Generative AI statement
The author(s) declare that no Generative AI was used in the creation of this manuscript.
Any alternative text (alt text) provided alongside figures in this article has been generated by Frontiers with the support of artificial intelligence and reasonable efforts have been made to ensure accuracy, including review by the authors wherever possible. If you identify any issues, please contact us.
Publisher’s note
All claims expressed in this article are solely those of the authors and do not necessarily represent those of their affiliated organizations, or those of the publisher, the editors and the reviewers. Any product that may be evaluated in this article, or claim that may be made by its manufacturer, is not guaranteed or endorsed by the publisher.
Supplementary material
The Supplementary Material for this article can be found online at: https://www.frontiersin.org/articles/10.3389/fimmu.2025.1652444/full#supplementary-material
Glossary
AA: Alopecia areata
ATG4B: Autophagy Related 4B Cysteine Peptidase
BIM: BCL2 Interacting Mediator of Cell Death
CAW: Centella asiatica Water extract
cDNA: Complementary deoxyribonucleic acid
CFX96: CFX96 Real Time System
CLEC16A: C-Type Lectin Domain Family 16 Member A
CNV: Copy Number Variation
DAPI: 4’,6-Diamidino-2-phenylindole
FDR: False Discovery Rate
GWAS: Genome-Wide Association Study
IVs: Instrumental Variables
IVW: Inverse Variance Weighted
JAKi: Janus Kinase Inhibitors
Keap1: Kelch-Like ECH-Associated Protein 1
LD: Linkage Disequilibrium
LC3B: Microtubule-Associated Protein 1 Light Chain 3 Beta
MAF: Minor Allele Frequency
mTORC1: Mechanistic Target of Rapamycin Complex 1
MR: Mendelian Randomization
MR-Egger: Mendelian Randomization-Egger
MRRGs: Metabolic Reprogramming-Related Genes
NF-κB: Nuclear Factor Kappa-Light-Chain-Enhancer of Activated B Cells
Nrf2: Nuclear Factor Erythroid 2-Related Factor 2
PARK2: Parkin RBR E3 Ubiquitin Protein Ligase
PBMCs: Peripheral Blood Mononuclear Cells
PBS: Phosphate-Buffered Saline
PFKFB3: 6-Phosphofructo-2-Kinase/Fructose-2,6-Bisphosphatase 3
PheWAS: Phenome-Wide Association Study
PP.H4.abf: Posterior Probability of Hypothesis 4 (colocalization) using Approximate Bayes Factor
PSAT1: Phosphoserine Aminotransferase 1
qPCR: Quantitative Polymerase Chain Reaction
RT-qPCR: Quantitative Real-Time Polymerase Chain Reaction
SNP: Single Nucleotide Polymorphism
SMR: Summary-Data-Based Mendelian Randomization
SQSTM1: Sequestosome 1
STX17: Syntaxin 17
T-Test: Student’s T-Test
U Test: Mann-Whitney U Test.
References
1. Madani S and Shapiro J. Alopecia areata update. J Am Acad Der-matol. (2000) 42:549–66. doi: 10.1067/mjd.2000.103909
2. Gilhar A, Etzioni A, and Paus RAA. Alopecia areata. N Engl J Med. (2012) 366:1515–25. doi: 10.1056/NEJMra1103442
3. Zhou C, Li X, Wang C, and Zhang J. Alopecia areata: an update on etiopathogenesis, diagnosis, and management. Clin Rev Allergy Immunol. (2021) 61:403–23. doi: 10.1007/s12016-021-08883-0
4. Xia L, Oyang L, Lin J, Tan S, Han Y, Wu N, et al. The cancer metabolic reprogramming and immune response. Mol Cancer. (2021) 20:28. doi: 10.1186/s12943-021-01316-8
5. Kelly B and O'Neill LAJ. Metabolic reprogramming in macrophages and dendritic cells in innate immunity. Cell Res. (2015) 25:771–84. doi: 10.1038/cr.2015.68
6. Sanderson E, Glymour MM, Holmes MV, Kang H, Morrison J, Munafò MR, et al. Mendelian randomization Nature reviews. Methods Primers. (2022) 2. doi: 10.1038/s43586-021-00092-5
7. Skrivankova VW, Richmond RC, Woolf BAR, Yarmolinsky J, Davies NM, Swanson SA, et al. Strengthening the reporting of observational studies in epidemiology using mendelian randomization: the STROBE-MR statement. JAMA. (2021) 326:1614–21. doi: 10.1001/jama.2021.18236
8. Stelzer G, Rosen N, Plaschkes I, Zimmerman S, Twik M, Fishilevich S, et al. The geneCards suite: from gene data mining to disease genome sequence analyses[J. Curr Protoc Bioinf. (2016) 54:1.30.1–1.30.33. doi: 10.1002/cpbi.5
9. Honkoop H, de Bakker DE, Aharonov A, Kruse F, Shakked A, Nguyen PD, et al. Single-cell analysis uncovers that metabolic reprogramming by ErbB2 signaling is essential for cardiomyocyte proliferation in the regenerating heart[J. Elife. (2019) 8. doi: 10.7554/eLife.50163
10. Elsworth B, Lyon M, Alexander T, Liu Y, Matthews P, Hallett J, et al. The MRC IEU OpenGWAS data infrastructure[J. bioRxiv. (2020). doi: 10.1101/2020.08.10.244293
11. Hemani G, Zheng J, Elsworth B, Wade KH, Haberland V, Baird D, et al. The MR-Base platform supports systematic causal inference across the human phenome[J. Elife. (2018) 7. doi: 10.7554/eLife.34408
12. Pierce BL, Ahsan H, and Vanderweele TJ. Power and instrument strength requirements for Mendelian randomization studies using multiple genetic variants[J. Int J Epidemiol. (2011) 40:740–52. doi: 10.1093/ije/dyq151
13. Zhu Z, Zhang F, Hu H, Bakshi A, Robinson MR, Powell JE, et al. Integration of summary data from GWAS and eQTL studies predicts complex trait gene targets[J. Nat Genet. (2016) 48:481–7. doi: 10.1038/ng.3538
14. Giambartolomei C, Vukcevic D, Schadt EE, Franke L, Hingorani AD, Wallace C, et al. Bayesian test for colocalisation between pairs of genetic association studies using summary statistics[J. PloS Genet. (2014) 10:e1004383. doi: 10.1371/journal.pgen.1004383
15. Zhou S, Butler-Laporte G, Nakanishi T, Morrison DR, Afilalo J, Afilalo M, et al. A Neanderthal OAS1 isoform protects individuals of European ancestry against COVID-19 susceptibility and severity[J. Nat Med. (2021) 27:659–67. doi: 10.1038/s41591-021-01281-1
16. Gund R and Christiano AM. Impaired autophagy promotes hair loss in the C3H/HeJ mouse model of alopecia areata. Autophagy. (2023) 19:296–305. doi: 10.1080/15548627.2022.2074104
17. Wu Y, Zeng J, Zhang F, Zhu Z, Qi T, Zheng Z, et al. Integrative analysis of omics summary data reveals putative mechanisms underlying complex traits. Nat Commun. (2018) 9:918. doi: 10.1038/s41467-018-03371-0
18. Moscat J and Diaz-Meco MT. Feedback on fat: p62-mTORC1-autophagy connections. Cell. (2011) 147:724–7. doi: 10.1016/j.cell.2011.10.021
19. Rogov V, Dötsch V, Johansen T, and Kirkin V. Interactions between autophagy receptors and ubiquitin-like proteins form the molecular basis for selective autophagy. Mol Cell. (2014) 53:167–78. doi: 10.1016/j.molcel.2013.12.014
20. Filomeni G, De Zio D, and Cecconi F. Oxidative stress and autophagy: the clash between damage and metabolic needs. Cell Death differentiation. (2015) 22:377–88. doi: 10.1038/cdd.2014.150
21. Hardman JA, Nicu C, Tai C, Harries M, Mironov A, Purba TS, et al. Does dysfunctional autophagy contribute to immune privilege collapse and alopecia areata pathogenesis? J Dermatol Sci. (2020) 100:75–8. doi: 10.1016/j.jdermsci.2020.08.006
22. Bhattacharya A, Parillon X, Zeng S, Han S, and Eissa NT. Deficiency of autophagy in dendritic cells protects against experimental autoimmune encephalomyelitis. J Biol Chem. (2014) 289:26525–32. doi: 10.1074/jbc.M114.575860
23. Yang Z, Goronzy JJ, and Weyand CM. Autophagy in autoimmune disease. (Berlin Germany) J Mol Med. (2015) 93:707–17. doi: 10.1007/s00109-015-1297-8
24. Singh B, Mahajan S, Abdella S, Khan R, and Garg S. Exploring autophagy inducing molecules: targeting diverse pathways in alzheimer's disease management. Medicinal Res Rev. (2025). doi: 10.1002/med.70013
25. Chai M, Jiang M, Vergnes L, Fu X, de Barros SC, Doan NB, et al. Stimulation of hair growth by small molecules that activate autophagy. Cell Rep. (2019) 27:3413–3421.e3. doi: 10.1016/j.celrep.2019.05.070
26. Bi D, Hu Y, Hua S, Liu J, and Guo S. The regulatory mechanisms of mitophagy and oxidative stress in androgenetic alopecia. Cell signalling. (2025) 132:111862. doi: 10.1016/j.cellsig.2025.111862
27. Petukhova L, Duvic M, Hordinsky M, Norris D, Price V, Shimomura Y, et al. Genome-wide association study in alopecia areata implicates both innate and adaptive immunity. Nature. (2010) 466:113–7. doi: 10.1038/nature09114
28. Petukhova L, Duvic M, Hordinsky M, Norris D, Price V, Shimomura Y, et al. Genome-wide association study in alopecia areata implicates both innate and adaptive immunity. Nature. (2010) 466:113–7. doi: 10.1038/nature09114
29. Betz RC, Petukhova L, Ripke S, Huang H, Menelaou A, Redler S, et al. Genome-wide meta-analysis in alopecia areata resolves HLA associations and reveals two new susceptibility loci. Nat Commun. (2015 Jan 22) 6:5966. doi: 10.1038/ncomms6966
30. Fujita N, Hayashi-Nishino M, Fukumoto H, Omori H, Yamamoto A, Noda T, et al. An Atg4B mutant hampers the lipidation of LC3 paralogues and causes defects in autophagosome closure. Mol Biol Cell. (2008) 19:4651–9. doi: 10.1091/mbc.e08-03-0312
31. Kauffman KJ, Yu S, Jin J, Mugo B, Nguyen N, O'Brien A, et al. Delipidation of mammalian Atg8-family proteins by each of the four ATG4 proteases. Autophagy. (2018) 14:992–1010. doi: 10.1080/15548627.2018.1437341
32. Petukhova L, Patel AV, Rigo RK, Bian L, Verbitsky M, Sanna-Cherchi S, et al. Integrative analysis of rare copy number variants and gene expression data in alopecia areata implicates an aetiological role for autophagy. Exp Dermatol. (2020) 29:243–53. doi: 10.1111/exd.13986
33. Monestime O, Davis BA, Layman C, Wheeler KJ, Hack W, Zweig JA, et al. Peripheral blood DNA methylation changes in response to centella asiatica treatment in aged mice. Biology. (2025) 14. doi: 10.3390/biology14010052
34. Ploumi C, Papandreou ME, and Tavernarakis N. The complex interplay between autophagy and cell death pathways. Biochem J. (2022) 479:75–90. doi: 10.1042/BCJ20210450
Keywords: alopecia areata, autoimmunity, autophagy, inflammation, metabolic reprogramming, SQSTM1
Citation: Hu L, Wan S and Song X (2025) Association between SQSTM1 dysregulation and risk in alopecia areata: a Mendelian randomization study. Front. Immunol. 16:1652444. doi: 10.3389/fimmu.2025.1652444
Received: 23 June 2025; Accepted: 07 November 2025; Revised: 06 November 2025;
Published: 25 November 2025.
Edited by:
Georgia Damoraki, National and Kapodistrian University of Athens, GreeceReviewed by:
Gawel Solowski, Bingöl University, TürkiyeTianyou Ma, Shanghai Skin Diseases Hospital, China
Copyright © 2025 Hu, Wan and Song. This is an open-access article distributed under the terms of the Creative Commons Attribution License (CC BY). The use, distribution or reproduction in other forums is permitted, provided the original author(s) and the copyright owner(s) are credited and that the original publication in this journal is cited, in accordance with accepted academic practice. No use, distribution or reproduction is permitted which does not comply with these terms.
*Correspondence: Xiuzu Song, c29uZ3hpdXp1QHNpbmEuY29t
†These authors have contributed equally to this work and share first authorship