 Xiaojing Lin1,2,3,4†
 Shu Zhao1,3,5†
 Licheng Li6
 Yuying Huang2
 Qiang Zhong7
 Huali Luo2
 Qizhu Zhang1,3,4
 Shuxiong Xu8
 Qinshan Li1,2,3*
 Mengxing Li6*
- 1Department of Obstetrics and Gynecology, Institute of Precision Medicine of Guizhou Province, Affiliated Hospital of Guizhou Medical University, Guiyang, Guizhou, China
- 2Department of Clinical Biochemistry, School of Medical Laboratory Science, Guizhou Medical University, Guiyang, Guizhou, China
- 3Department of Gynecology and Obstetrics, School of Clinical Medicine, Guizhou Medical University, Guiyang, China
- 4Department of Obstetrics and Gynecology, Affiliated Hospital of Guizhou Medical University, Guiyang, Guizhou, China
- 5Department of Obstetrics, Guizhou Provincial People’s Hospital, Guiyang, Guizhou, China
- 6Department of Hematology, Guizhou Province Institute of Hematology, Guizhou Province Laboratory of Hematopoietic Stem Cell Transplantation Centre, Affiliated Hospital of Guizhou Medical University, Guiyang, Guizhou, China
- 7Department of Gynecology, Guizhou Hospital of The First Affiliated Hospital, Sun Yat-sen University, Guiyang, Guizhou, China
- 8Department of Urology, Guizhou Provincial People’s Hospital, Guiyang, Guizhou, China
Objective: Ubiquitination plays a crucial role in the malignant progression of ovarian cancer. With the advent of proteolysis-targeting chimeras (PROTACs) targeting ubiquitin enzymes, precision therapies are now possible. Therefore, it is imperative to ascertain the prognostic significance of ubiquitination-related genes in ovarian cancer.
Methods: A prognostic model based on ubiquitination-related genes was developed using data from TCGA and GTEx databases. Performance was assessed via Kaplan-Meier, ROC curves, and Cox regression; a nomogram was created. The model’s stability was checked using training and test sets. FBXO45 was also experimentally validated in ovarian cancer.
Results: The model, based on 17 genes related to ubiquitination, showed high performance (1-year AUC = 0.703, 3-year AUC = 0.704, 5-year AUC = 0.705). The high-risk group had significantly lower overall survival (P < 0.05). Immune analysis showed higher levels of CD8+ T (P < 0.05), M1 (P < 0.01) and follicular (P < 0.05) cells in the low-risk group. High-risk patients had more mutations in MUC17 and LRRK2, while low-risk patients had more RYR2 mutations. FBXO45 is a key E3 ubiquitin ligase in ovarian cancer, promoting growth, spread and migration via the Wnt/β-catenin pathway.
Conclusion: Ubiquitination-related markers provide reliable prognostic insights and reflect the immune microenvironment in ovarian cancer, offering a basis for clinical targeting strategies.
1 Introduction
Ovarian cancer is the leading cause of gynecological cancer-related mortality. In 2018, it accounted for 4.4% of all cancer-related deaths, rising to 4.7% in 2020 (1, 2). 70% of cases are already advanced at diagnosis, with a 5-year survival rate of just 29% (3, 4). The high mortality is compounded by the tumor’s resistance to both chemotherapy and targeted therapies, driven by genetic and epigenetic alterations as well as a complex Tumor Microenvironment (TME). This resistance extends to alternative treatment options (5), making OV a persistent challenge in oncology. As a result, identifying prognostic factors and novel biomarkers for targeted therapeutic strategies has become an urgent clinical priority.
Ubiquitination is the process by which ubiquitin is covalently linked to a substrate, thereby modifying the substrate for either degradation or stabilization. This modification is ordinarily brought about by the interplay of E1 ubiquitin-activating enzymes, E2 ubiquitin-conjugating enzymes, and E3 ubiquitin ligases (6). These enzymes are critical in regulating cellular processes, including tumor proliferation, invasion, apoptosis, DNA damage response, repair mechanisms, metabolism, immune responses, and drug resistance (7–9).
Studies have established a link between ubiquitination-related factors and diverse facets of cancer biology, encompassing tumor initiation, invasion, metastasis, drug resistance, and immune microenvironment modulation. Notable factors include RNF168, UBR5, and WWP2 (10–12). Among these, pathogenic mutations in the ubiquitin ligase BRCA1 (OR, 75.6; 95% CI, 31.6-180.6) elevate the risk of OV by 75-fold (13). To date, 50 ubiquitination-related genes have been targeted by Proteolysis Targeting Chimeras (PROTACs), with several emerging as promising clinical drug targets for cancer treatment (14, 15). Li et al. emphasized that PROTACs offered significant advantages, such as reducing drug dosage and administration frequency, enhancing therapeutic duration, minimizing toxicity, and overcoming drug resistance—making them a promising avenue for future drug development (16). Despite these advancements, the precise role of various ubiquitination-related factors in OV remains poorly understood. Further systematic investigations are required to unravel the molecular mechanisms underpinning their involvement in OV.
This study examined the differential expression between OV and normal ovarian tissues from TCGA and GTEX databases. The analysis was further refined by intersecting these datasets with a set of ubiquitination-related genes, resulting in the identification of 162 co-expressed genes. A risk model for prognosis based on 17 ubiquitination-related genes was constructed through COX univariate analysis, LASSO regression, and the DEVIANCE test. The model’s predictive performance was assessed using Kaplan-Meier curves, ROC curves, and nomograms. External validation was performed by applying the model to the GSE165808 and GSE26712 datasets. Furthermore, the study investigated the immune infiltration characteristics and high-frequency mutation gene distribution patterns of patients in different risk groups. In order to further evaluate the prognostic value of the OV risk model, the biological function of its key component, the ubiquitin ligase FBXO45, was analyzed in the context of OV, and its role in the Wnt/β-catenin pathway was explored. Collectively, these results imply that ubiquitination-related risk models provide useful predictive information about OV patients and could lead to the creation of innovative target-based treatments.
2 Materials and methods
2.1 Reagents list
The main laboratory reagents and sources are detailed in Table 1.
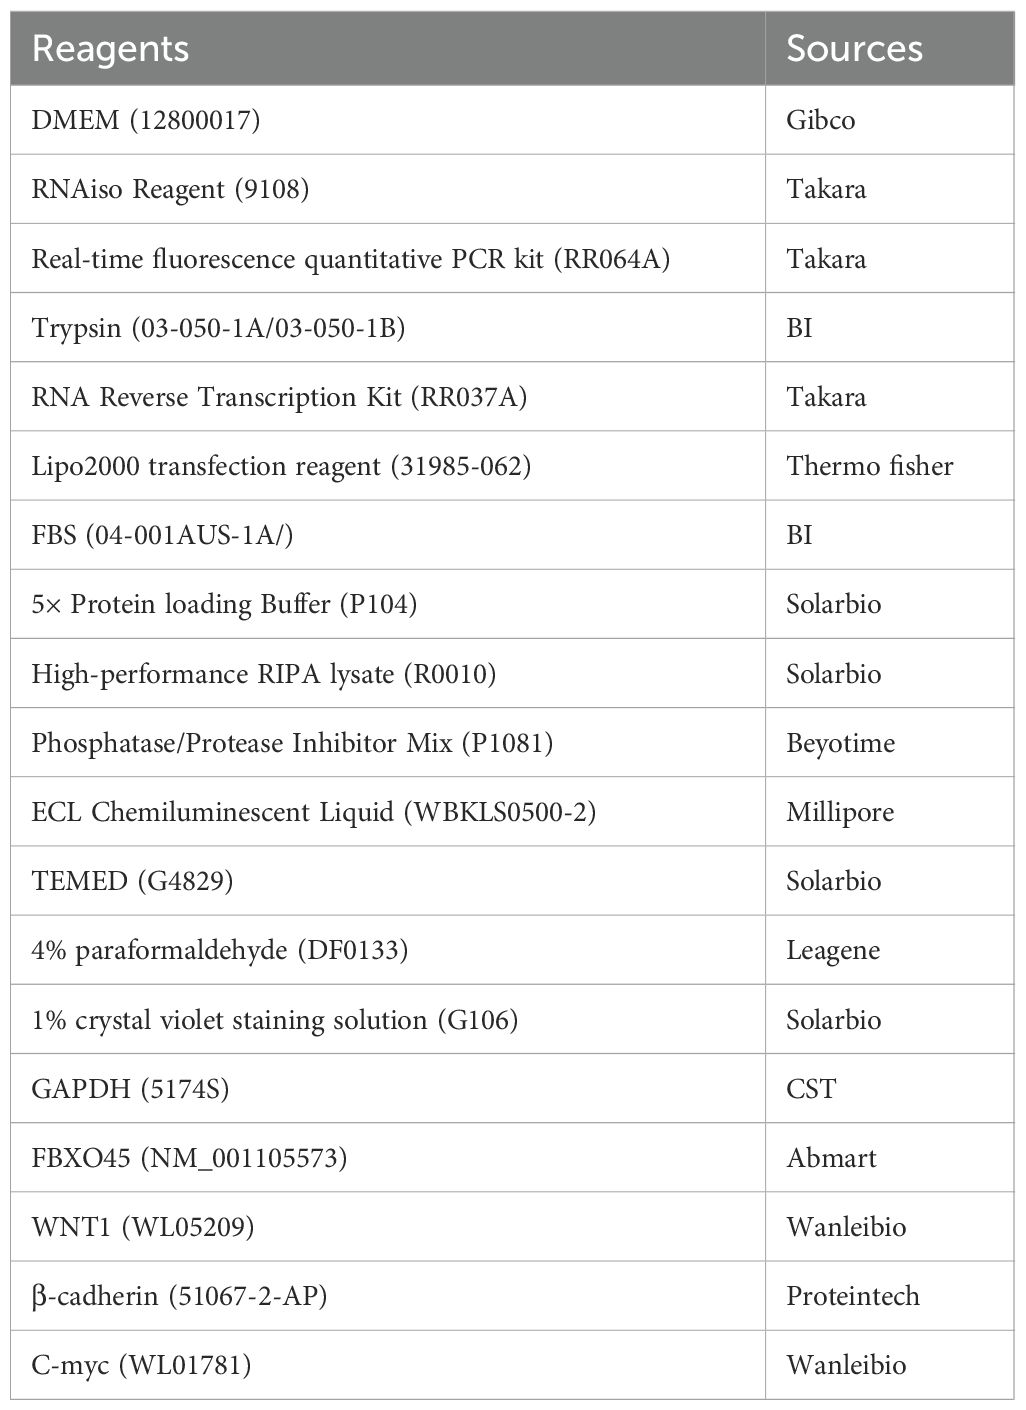
Table 1. Main laboratory reagents and sources.
2.2 Data collection and processing
376 tumor and 88 normal ovarian tissue samples’ transcriptomes and clinical profiles were accessed via the TCGA-OV (https://www.cancer.gov/) and GTEx databases (UCSC Xena, https://xenabrowser.net). These datasets were subsequently used for evaluation as part of the training set. Using the ‘edgeR’ package (17). The differential gene expression between OV and normal tissues was examined. For OV, differentially expressed genes (DEGs) were identified by applying a |logFC| ≥ 1 and a corrected p-value threshold of < 0.01. GSE165808 and GSE26712 datasets were used to validate the prognostic model. These datasets include 49 and 153 OV samples with survival data.
2.3 Candidate gene screening
The list of ubiquitinating enzyme UBQ genes was derived from the UUCD (http://uucd.biocuckoo.org/) (downloaded March 2017) and then modified by removing non-UBQ genes. The final UBQ genome included 929 genes, grouped into the established UUCD categories: E1 (8 genes), E2 (39 genes) and E3 (882 genes). A Venn diagram was used to intersect these genes with DEGs, identify 162 co-expressed genes. COX analysis selected ubiquitination-related genes with a P value < 0.05, identifying the top 20 genes associated with OV survival prognosis.
2.4 Predictive model construction
LASSO regression analysis and the DEVIANCE (18) test were applied to the candidate genes, with a selection criterion of |logFC| ≥ 1 and adjusted p-values < 0.05. The prognostic model was constructed using 17 genes. The risk score was calculated by
Coef_i = regression coefficient; A_i = gene expression level (19). Patients were grouped by risk (high/low) using the median risk score. Performance of the model was evaluated using survival analysis and ROC curve analysis.
2.5 Immune landscape and gene mutation analyses
The risk model uses expression profiles of 17 genes to assess 22 immune cell levels with R package e1071. First, stromal and immune scores were calculated and visualized using ESTIMATE (20). The Wilcoxon rank sum test was employed to analyze the differences between the two groups. Furthermore, the TCGA database was searched for single nucleotide variation (SNV) data for OV, and gene mutation analysis was performed using the “maftools” software package (21) based on somatic mutation data, focusing on genes with higher mutation frequencies in the two patient groups and using a waterfall diagram to show.
2.6 Single-cell RNAseq analysis
Single-cell RNA sequencing data of ovarian cancer were obtained from the E-MTAB-8381 dataset in ArrayExpress. Cells exhibiting a gene count of fewer than 200, or a mitochondrial gene count that exceeds 15%, are to be considered as having undergone a significant deviation from the standard. The process of gene expression was eliminated. Genes that exhibited expression in fewer than three cells were excluded from further analysis. The data underwent a process of normalization, employing the LogNormalize method. This was followed by the identification of 2,000 genes that exhibited high variability, along with scaling and principal component analysis (PCA). The top 20 components were used for graph-based clustering and UMAP reduction. Cell type annotation was conducted using canonical marker genes and automated classification via the “SingleR” package, referencing the Human Primary Cell Atlas (https://www.proteinatlas.org/ENSG00000174013-FBXO45/single+cell/ovary).
2.7 Cell culture and transfection
Human OV cell lines A2780 and HEY were obtained from the Cell Center, Institute of Basic Medical Sciences, Chinese Academy of Medical Sciences. Cell validation was performed via short tandem repeat (STR) analysis, and mycoplasma testing yielded negative results. DMEM and RPMI 1640 media, along with fetal bovine serum, were sourced from Gibco (USA). Penicillin-streptomycin solution (1%) was procured from Wuhan Boster Biological Technology Co., Ltd. Primary and secondary antibodies for Western blot analysis, as well as the corresponding diluents, were obtained from Wuhan Boster Biological Technology Co., Ltd. The transfection reagent Lipo8000™ was purchased from Shanghai Beyotime Co., Ltd. FBXO45-specific small interfering RNAs (si-FBXO45) and control siRNA (NC) were synthesized by Shanghai Sangon. Horseradish peroxidase-labelled goat anti-rabbit IgG was supplied by Wuhan Sanying Biotechnology Co., Ltd. The CCK-8 cell proliferation assay kit was purchased from MedChemExpress (USA). Matrigel matrix was sourced from Corning (USA), and Trizol reagent (T9424, 200 ml) was obtained from Sigma (USA). qPCR reagents, including SYBR® Premix Ex-Taq™ II (Tli RNaseH Plus, RR820Q), were provided by Takara (Japan). The target sequences for FBXO45 siRNA were listed in Table 2.
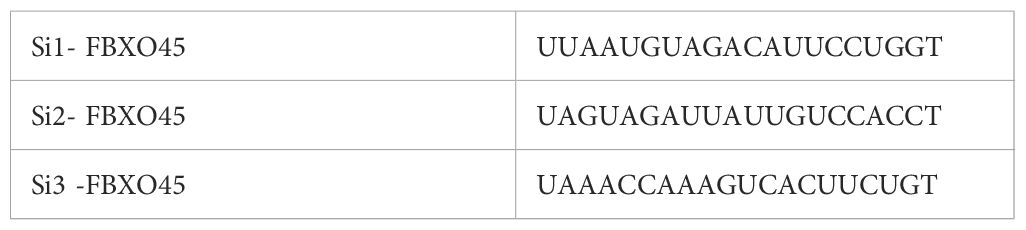
Table 2. Three target sequences of FBXO45 small interfering RNA (siRNA).
2.8 Western blotting
The same RIPA lysis buffer was used for all samples of the WB experiment and quantified using BCA method after extraction, and each sample was repeated three times, and based on the quantification results, all samples were adjusted to the same concentration of 10 μg/μL with the lysis buffer, and the upper volume of about 5 μL corresponded to 50 μg of total protein. Western Blot quantification was performed by ImageJ (NIH version 1.53) analysis. After all images were converted to 8-bit, the bands were delineated with the rectangle tool, the background was subtracted, and the integrated density was recorded. Target protein expression was normalized by an internal reference protein (GAPDH), and cross-gel experiments were corrected by internal control samples. Data are from 3 independent experiments and are expressed as mean ± SD. Exposure time was controlled within 30 s to avoid signal saturation. The membranes were incubated with primary antibodies (FBXO45, 1:1000; WNT1 1:1000; β-cadherin, 1:1000; C-myc, 1:1000; GAPDH, 1:50,000) then HRP-conjugated anti-rabbit secondary antibody (1:5000) was added. Protein bands were visualized using ECL reagent (Bioworld, Nanjing, China).
2.9 Enrichment analyses
We followed the methods of Chen et al. (22). Enrichment analyses were performed using the “ClusterProfiler” R package. Gene Set Enrichment Analysis (GSEA) and OverRepresentation Analysis (ORA) were both conducted in order to investigate the biological pathways and processes associated with the gene expression profiles. It is important to note that all enrichment analyses gave rise to adjusted p-values (Benjamini-Hochberg corrected) of <0.05, which have been considered to be statistically significant. Pathway visualization and interpretation were aided by enrichment maps, dot plots, and ridge plots generated via ClusterProfiler or associated visualization functions.
2.10 Statistical analysis
R software (version 4.2.0; New York, USA) was used for data analysis and visualization. The Student’s t-test compares normally distributed quantitative data, the Wilcoxon test for non-normally distributed data between groups. Significant levels: * P < 0.05, ** P < 0.01, *** P < 0.001. For detailed methods, in Supplementary Material 1.
3 Results
3.1 Development of a prognostic model for ubiquitination-related genes and internal validation
The identification of prognostic factors for OV was facilitated by data obtained from the TCGA-OV and GTEx databases. Clinical and transcriptomic (HTSeq-FPKM) data from 376 OV tissues and 88 normal ovarian tissues were downloaded. A total of 8,035 genes were identified that exhibited differential expression (DEGs) between ovarian and normal tissues, including 3,516 upregulated and 4,519 downregulated genes (p < 0.01, |log2FC| > 1) (Figure 1A). GSEA analysis was performed based on the differential expression results between tumor and normal tissues. In tumor tissues, pathways such as “cell division,” “epithelial cell differentiation,” “regulation of cell adhesion,” “regulation of cell -cell adhesion,”and “cytokine response” were found to be suppressed (Figure 1B). The NES values of the five pathways are respectively: -1.76,-1.59,-1.63,-1.77,-1.46. Venn analysis was used to identify the intersection between differentially expressed genes and 929 ubiquitination-related genes reported in the literature (23). These ubiquitination genes contained validated and predicted E1, E2 and E3 enzymes and adapters. Ultimately, 162 ubiquitination-related genes significantly co-expressed in ovarian cancer tissues were obtained (Figure 1C). These 162 genes were further analyzed through COX univariate analysis, leading to the identification of the top 20 ubiquitination-related genes (p < 0.05) as candidates associated with OV survival prognosis (Figure 1D). The candidate genes underwent LASSO regression analysis and the DEVIANCE test, identifying 17 genes for the establishment of the OV prognostic model (Figures 1E, F). The model was implemented in the TCGA database, and the median risk score was utilized to stratify patients in the OV training set into high- and low-risk groups. (Figures 1G, H). The model’s predictive accuracy was assessed through the generation of a time-dependent ROC curve. The AUC for OV at 1, 3, and 5 years was 0.703, 0.704, and 0.705, respectively, demonstrating strong predictive performance (Figure 1I). The Kaplan-Meier analysis revealed a statistically significant disparity in survival outcomes between the groups, with high-risk patients showing notably worse OS (Figure 1J). To further evaluate the model’s clinical applicability, a nomogram was built using the ubiquitination-related score and five clinical features (age, gender and stage) to predict 1-, 3-, and 5-year survival rates. Calibration plots indicated that the model predicted survival rates closely mirrored the actual rates, validating the model’s potential (Supplementary Figure S2).
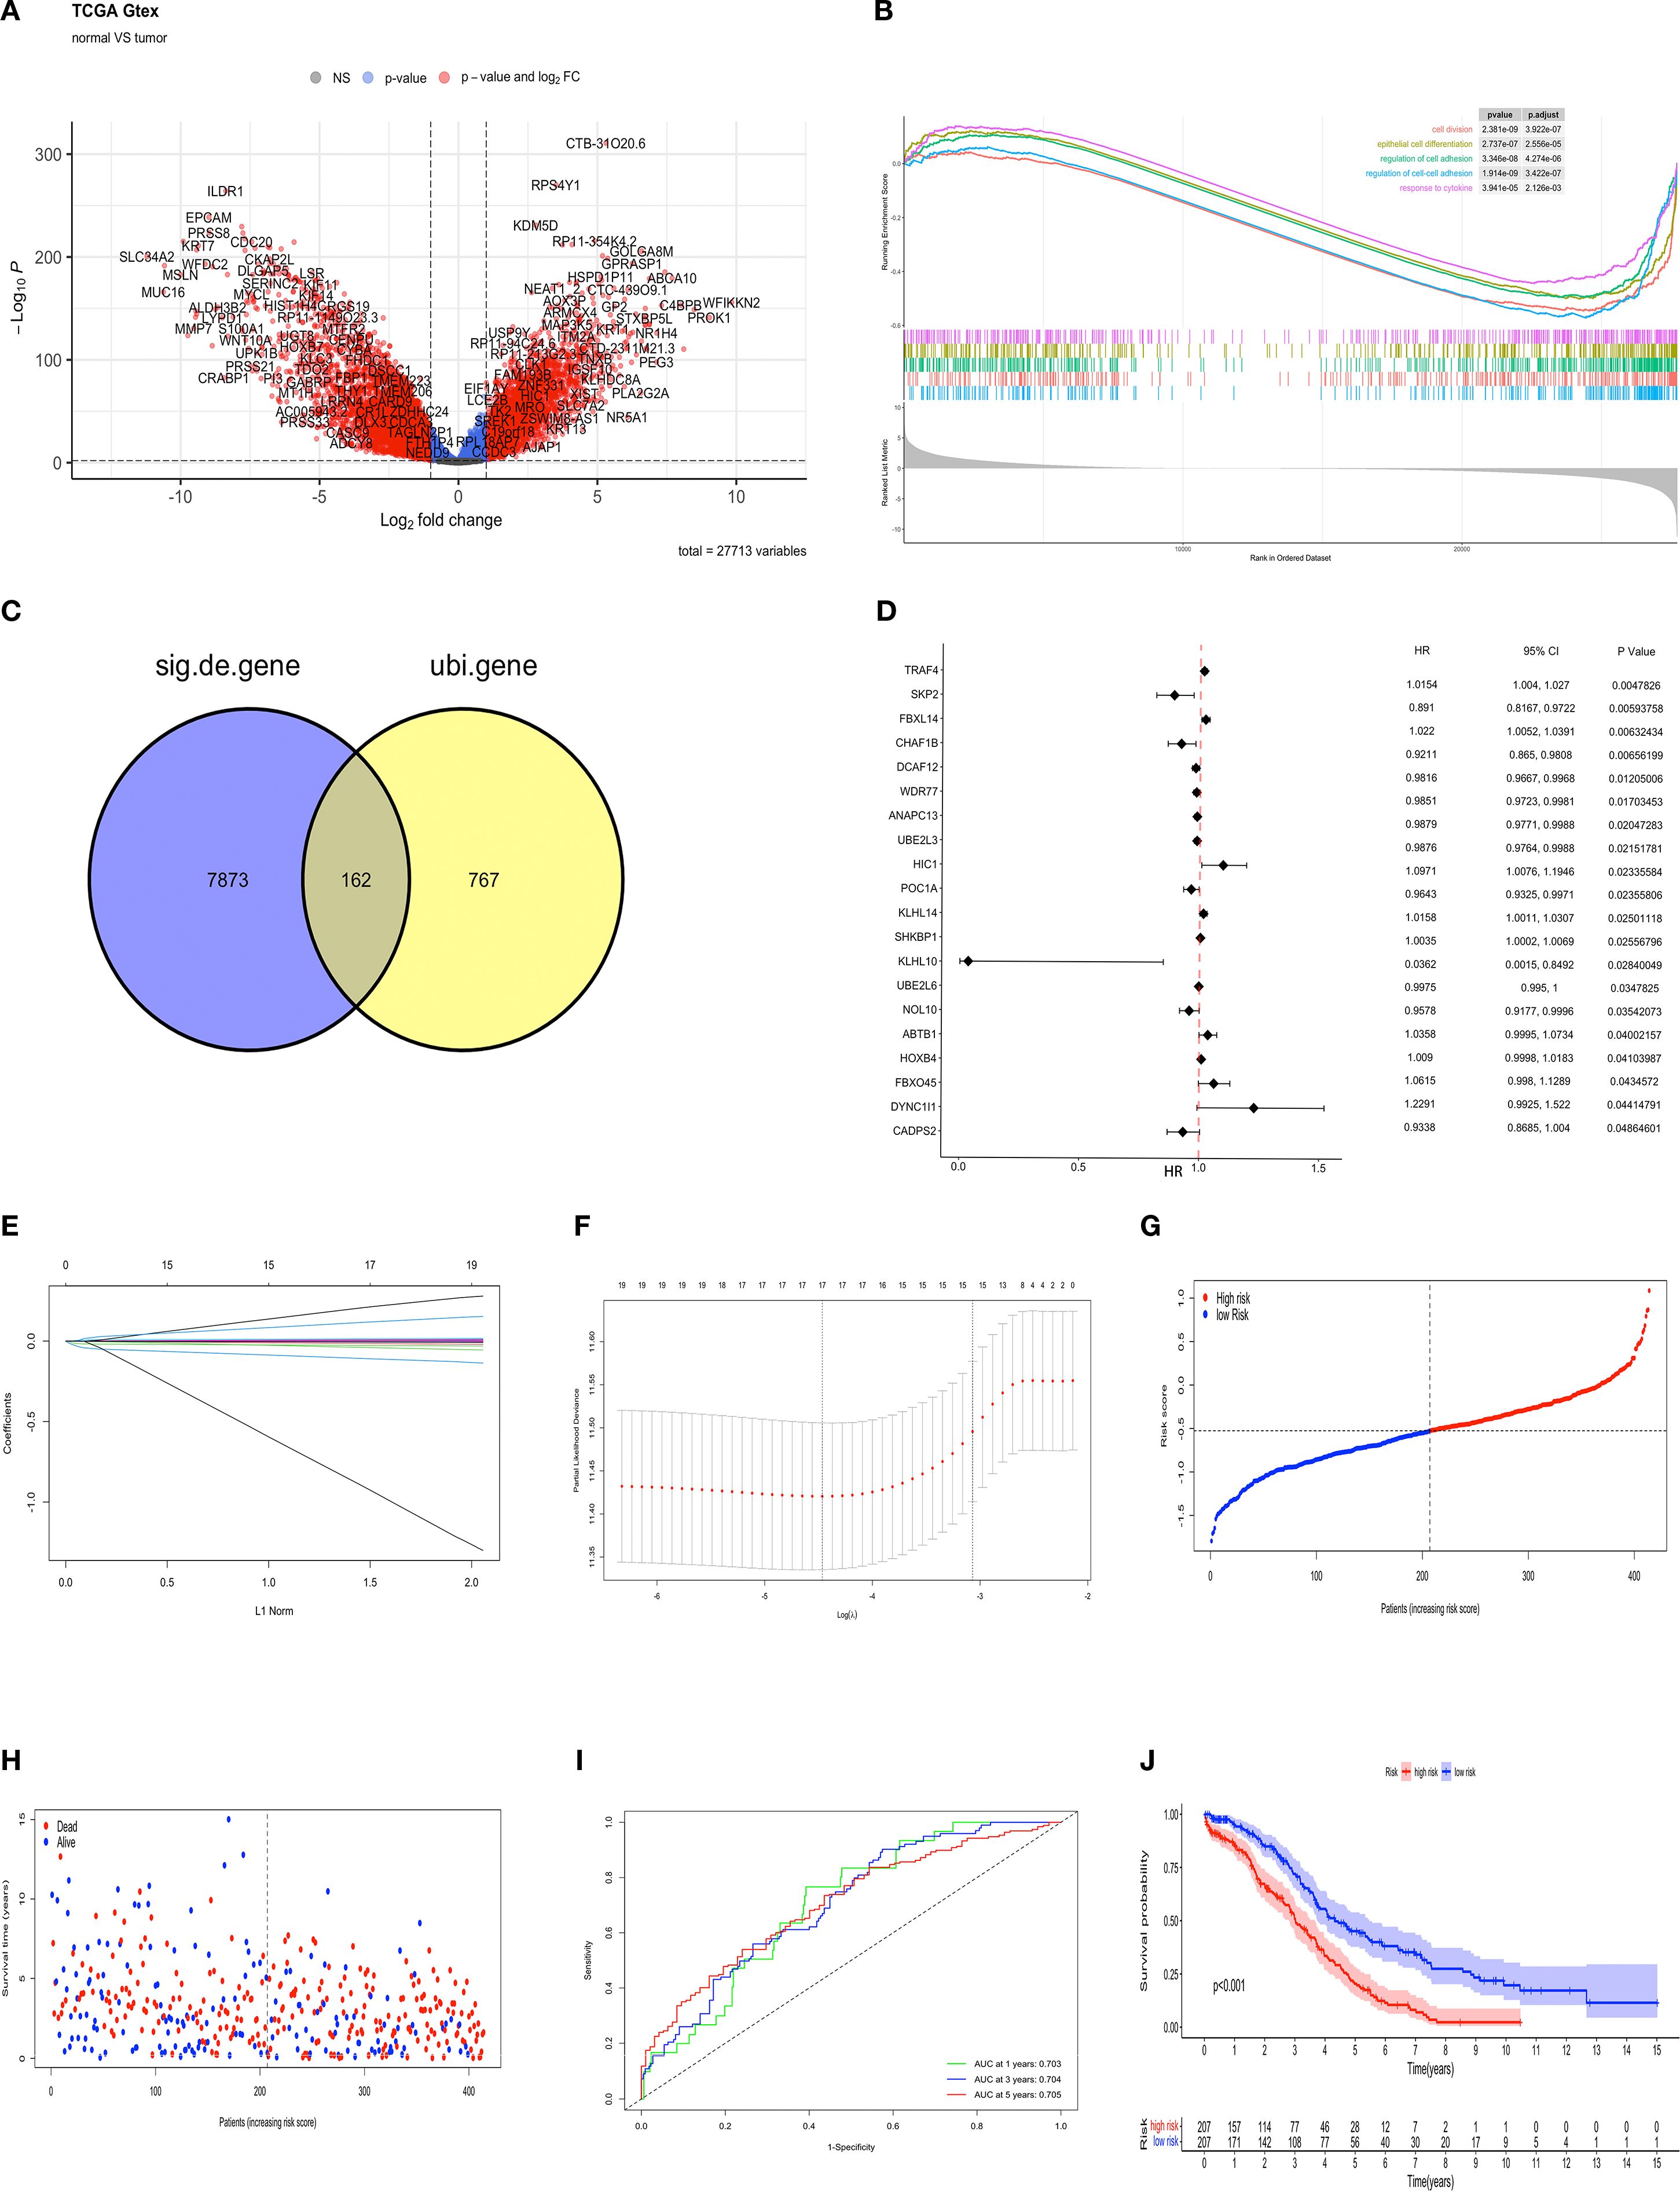
Figure 1. Development of a prognostic model for ubiquitination-related genes and internal validation. (A) Volcano plot of up-regulated (n = 3516) and down-regulated (n = 4519) genes (FDR < 0.01, |LogFC| > 1) between OV and normal tissues. (B) GSEA of KEGG pathways for DEGs in high/low expression OV groups. (C) The Venn diagram illustrating the common features of DEGs and ubiquitination-related genes (n=162). (D) Forest plot from univariate Cox analysis. (E) LASSO regression coefficients for ubiquitination-related genes, with each curve representing a gene associated with ubiquitin. (F) Parameter selection process in the LASSO model. (G) The training set contains risk scores. (H) Training set survival status. (I) ROC curves for predicting 1- to 5-year OS in the training set. (J) K-M survival curves for high- and low-risk groups in the training set.
3.2 External datasets validate the model’s generalizability
The model was validated using external datasets GSE165808 and GSE26712. Patient risk scores were calculated and classified (Figures 2A, E). The dataset revealed a clear difference between groups (Figures 2B, F). ROC curve analysis of the model’s performance in OV across both datasets revealed the following AUCs for one-year, three-year, and five-year predictions: (0.704, 0.701, and 0.704) and (0.604, 0.603, and 0.605) (Figures 2C, G). Kaplan-Meier analysis showed obvious prognostic differences between groups, with high-risk patients exhibiting notably lower overall survival (OS) compared to their low-risk counterparts (p < 0.01, and p < 0.05) (Figures 2D, H).
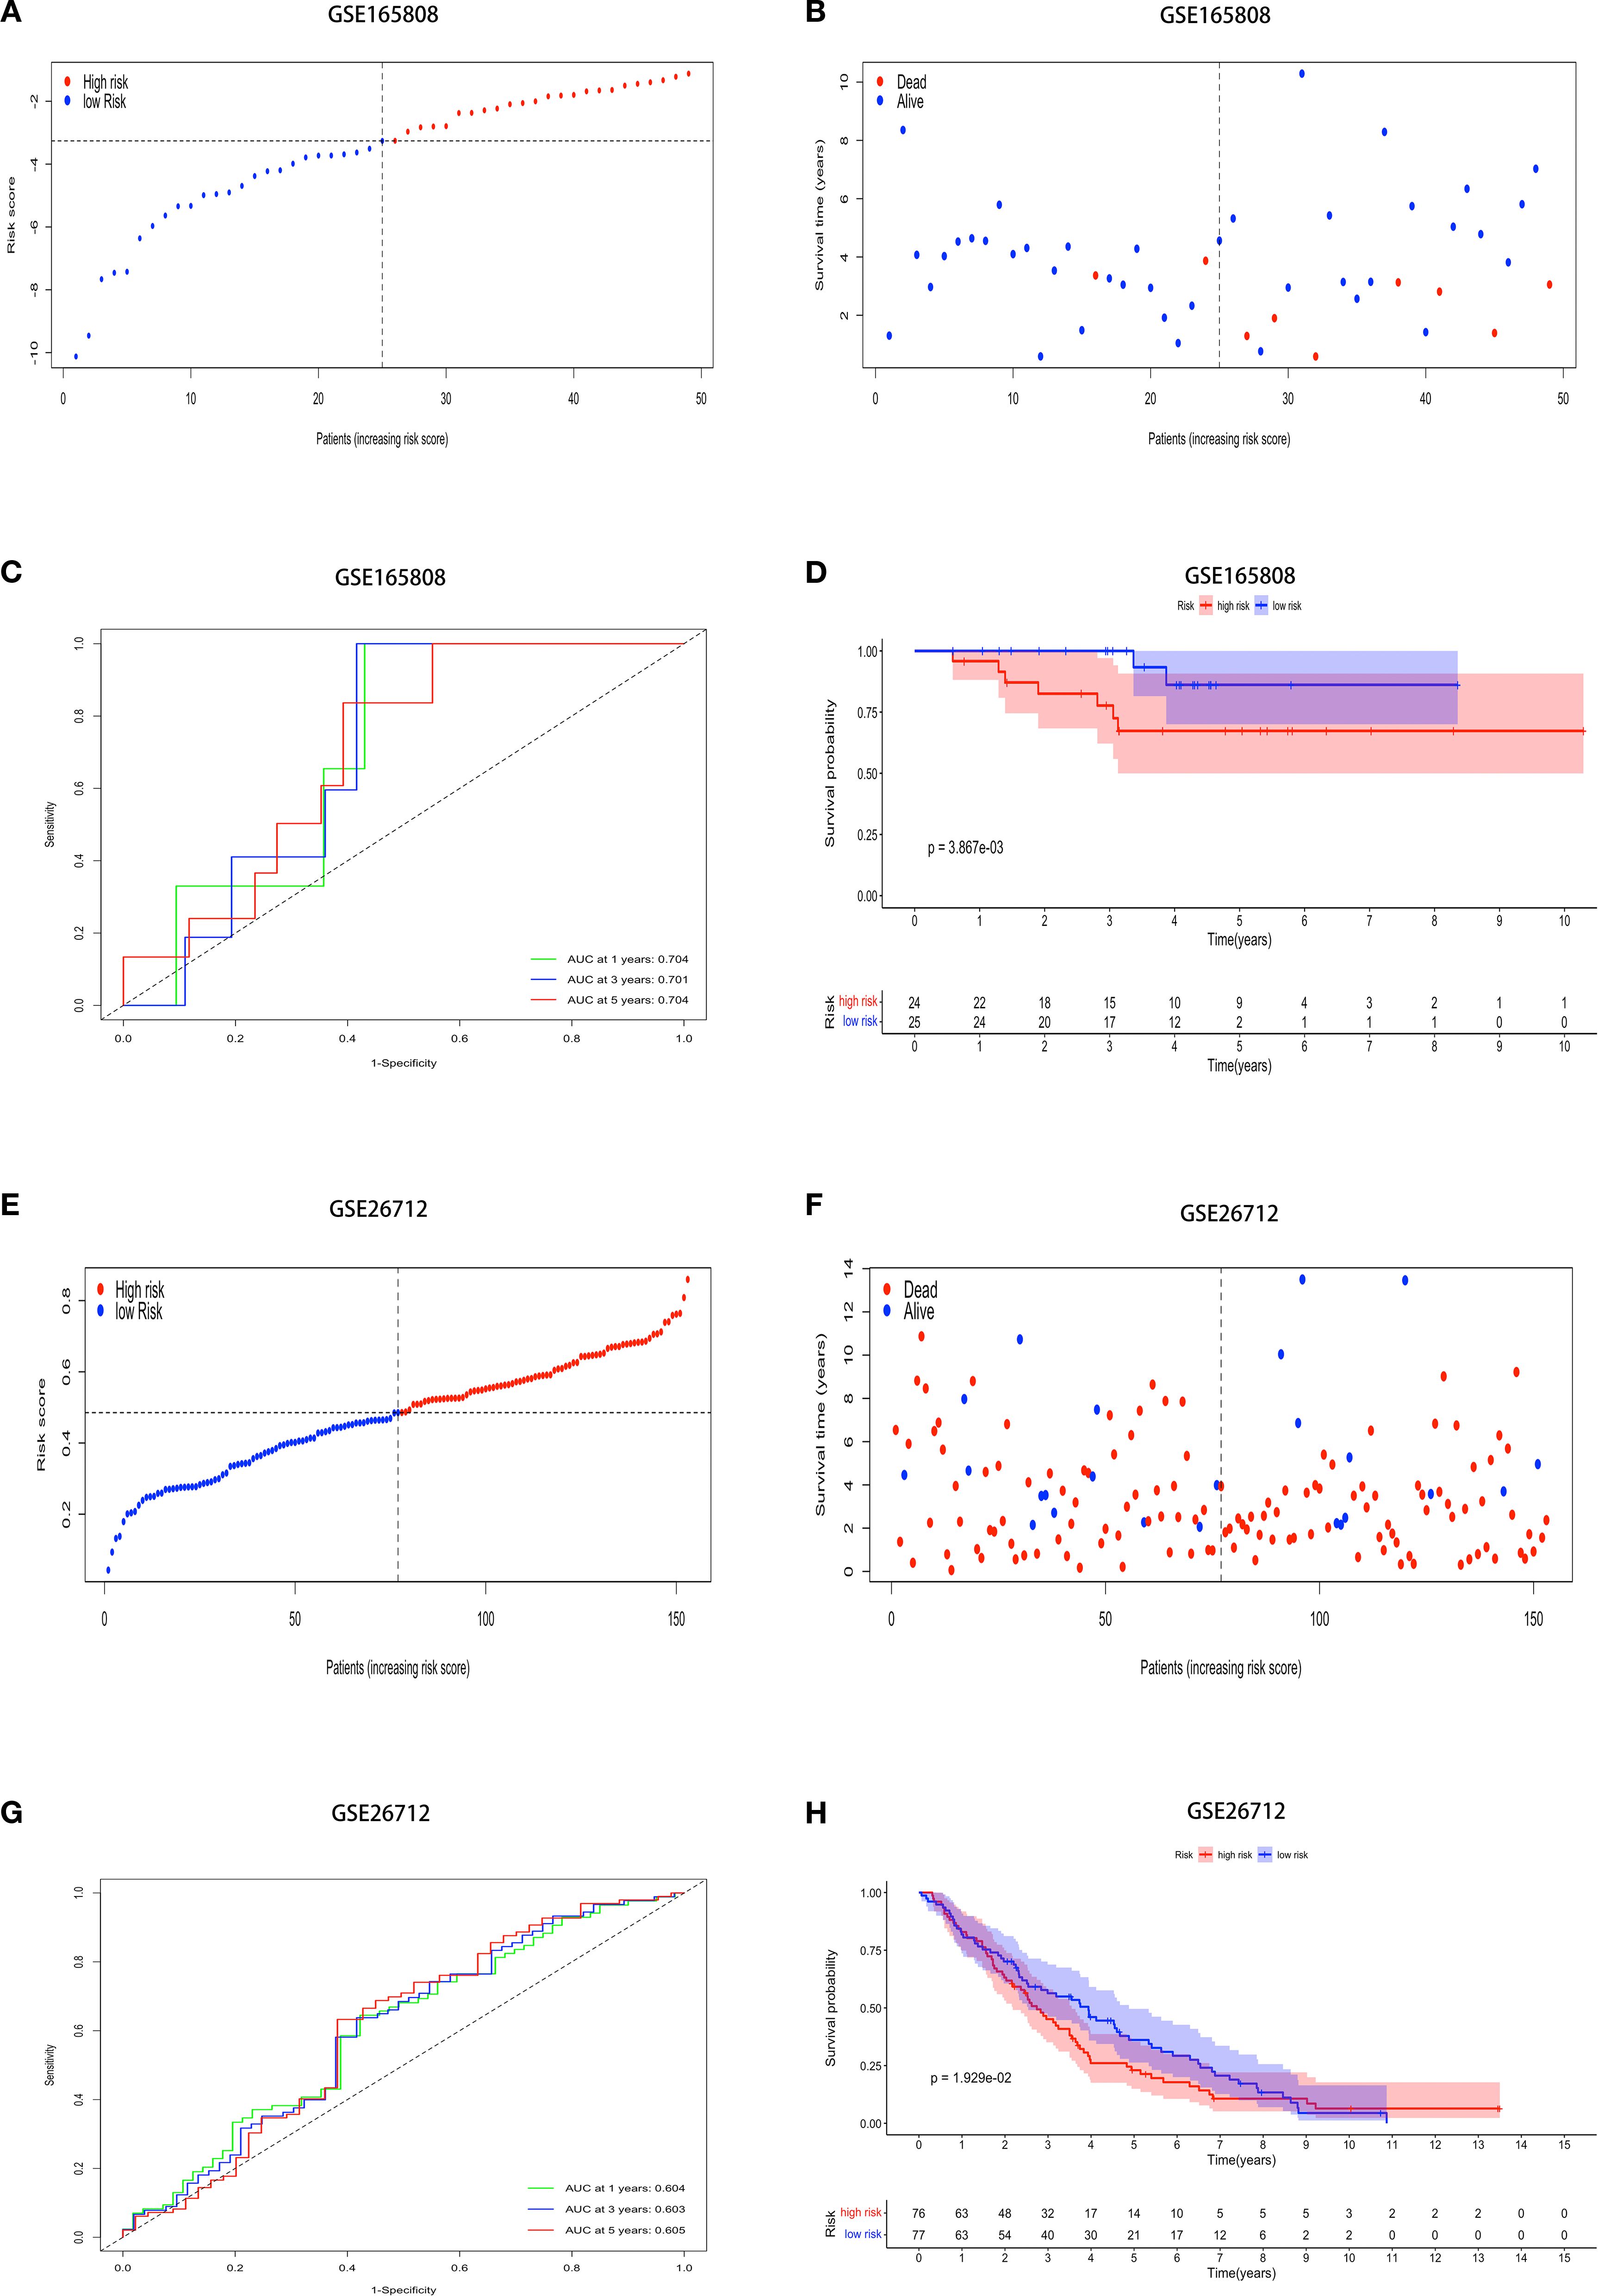
Figure 2. External datasets evaluate the model’s generalizability. Demonstrating stable prediction performance across diverse datasets. The risk score, survival status, ROC curves, and K-M survival curves in the (A-D) GSE165808, and (E-H) GSE26712.
3.3 Immune characteristics of the prognostic model in the OV microenvironment
To explore the immune landscape associated with the prognostic model, first, we used ESTIMATE to obtain stromal and immune scores for each sample, with the immune scores in the high-risk group being observed to be lower than those in the low-risk group (Figure 3A) and higher stromal S score was observed in patients classified as low-risk (Figure 3B), and the ORT algorithm to assess immune cell infiltration in both groups (Figure 3C). The analysis demonstrated a negative correlation between immune infiltration, encompassing both naïve B cells and γδT cells, and the score within the low-risk group (p < 0.05) (Figures 3D, E). Conversely, patients in the low-risk group exhibited elevated levels of CD8+ T cells (p < 0.05), M1 macrophages (p < 0.01), and Tfh cells (p < 0.05) (Figures 3F-H). The results indicate a correlation between ubiquitination-associated scores and the extent of tumor cell infiltration and activity in the OV microenvironment.
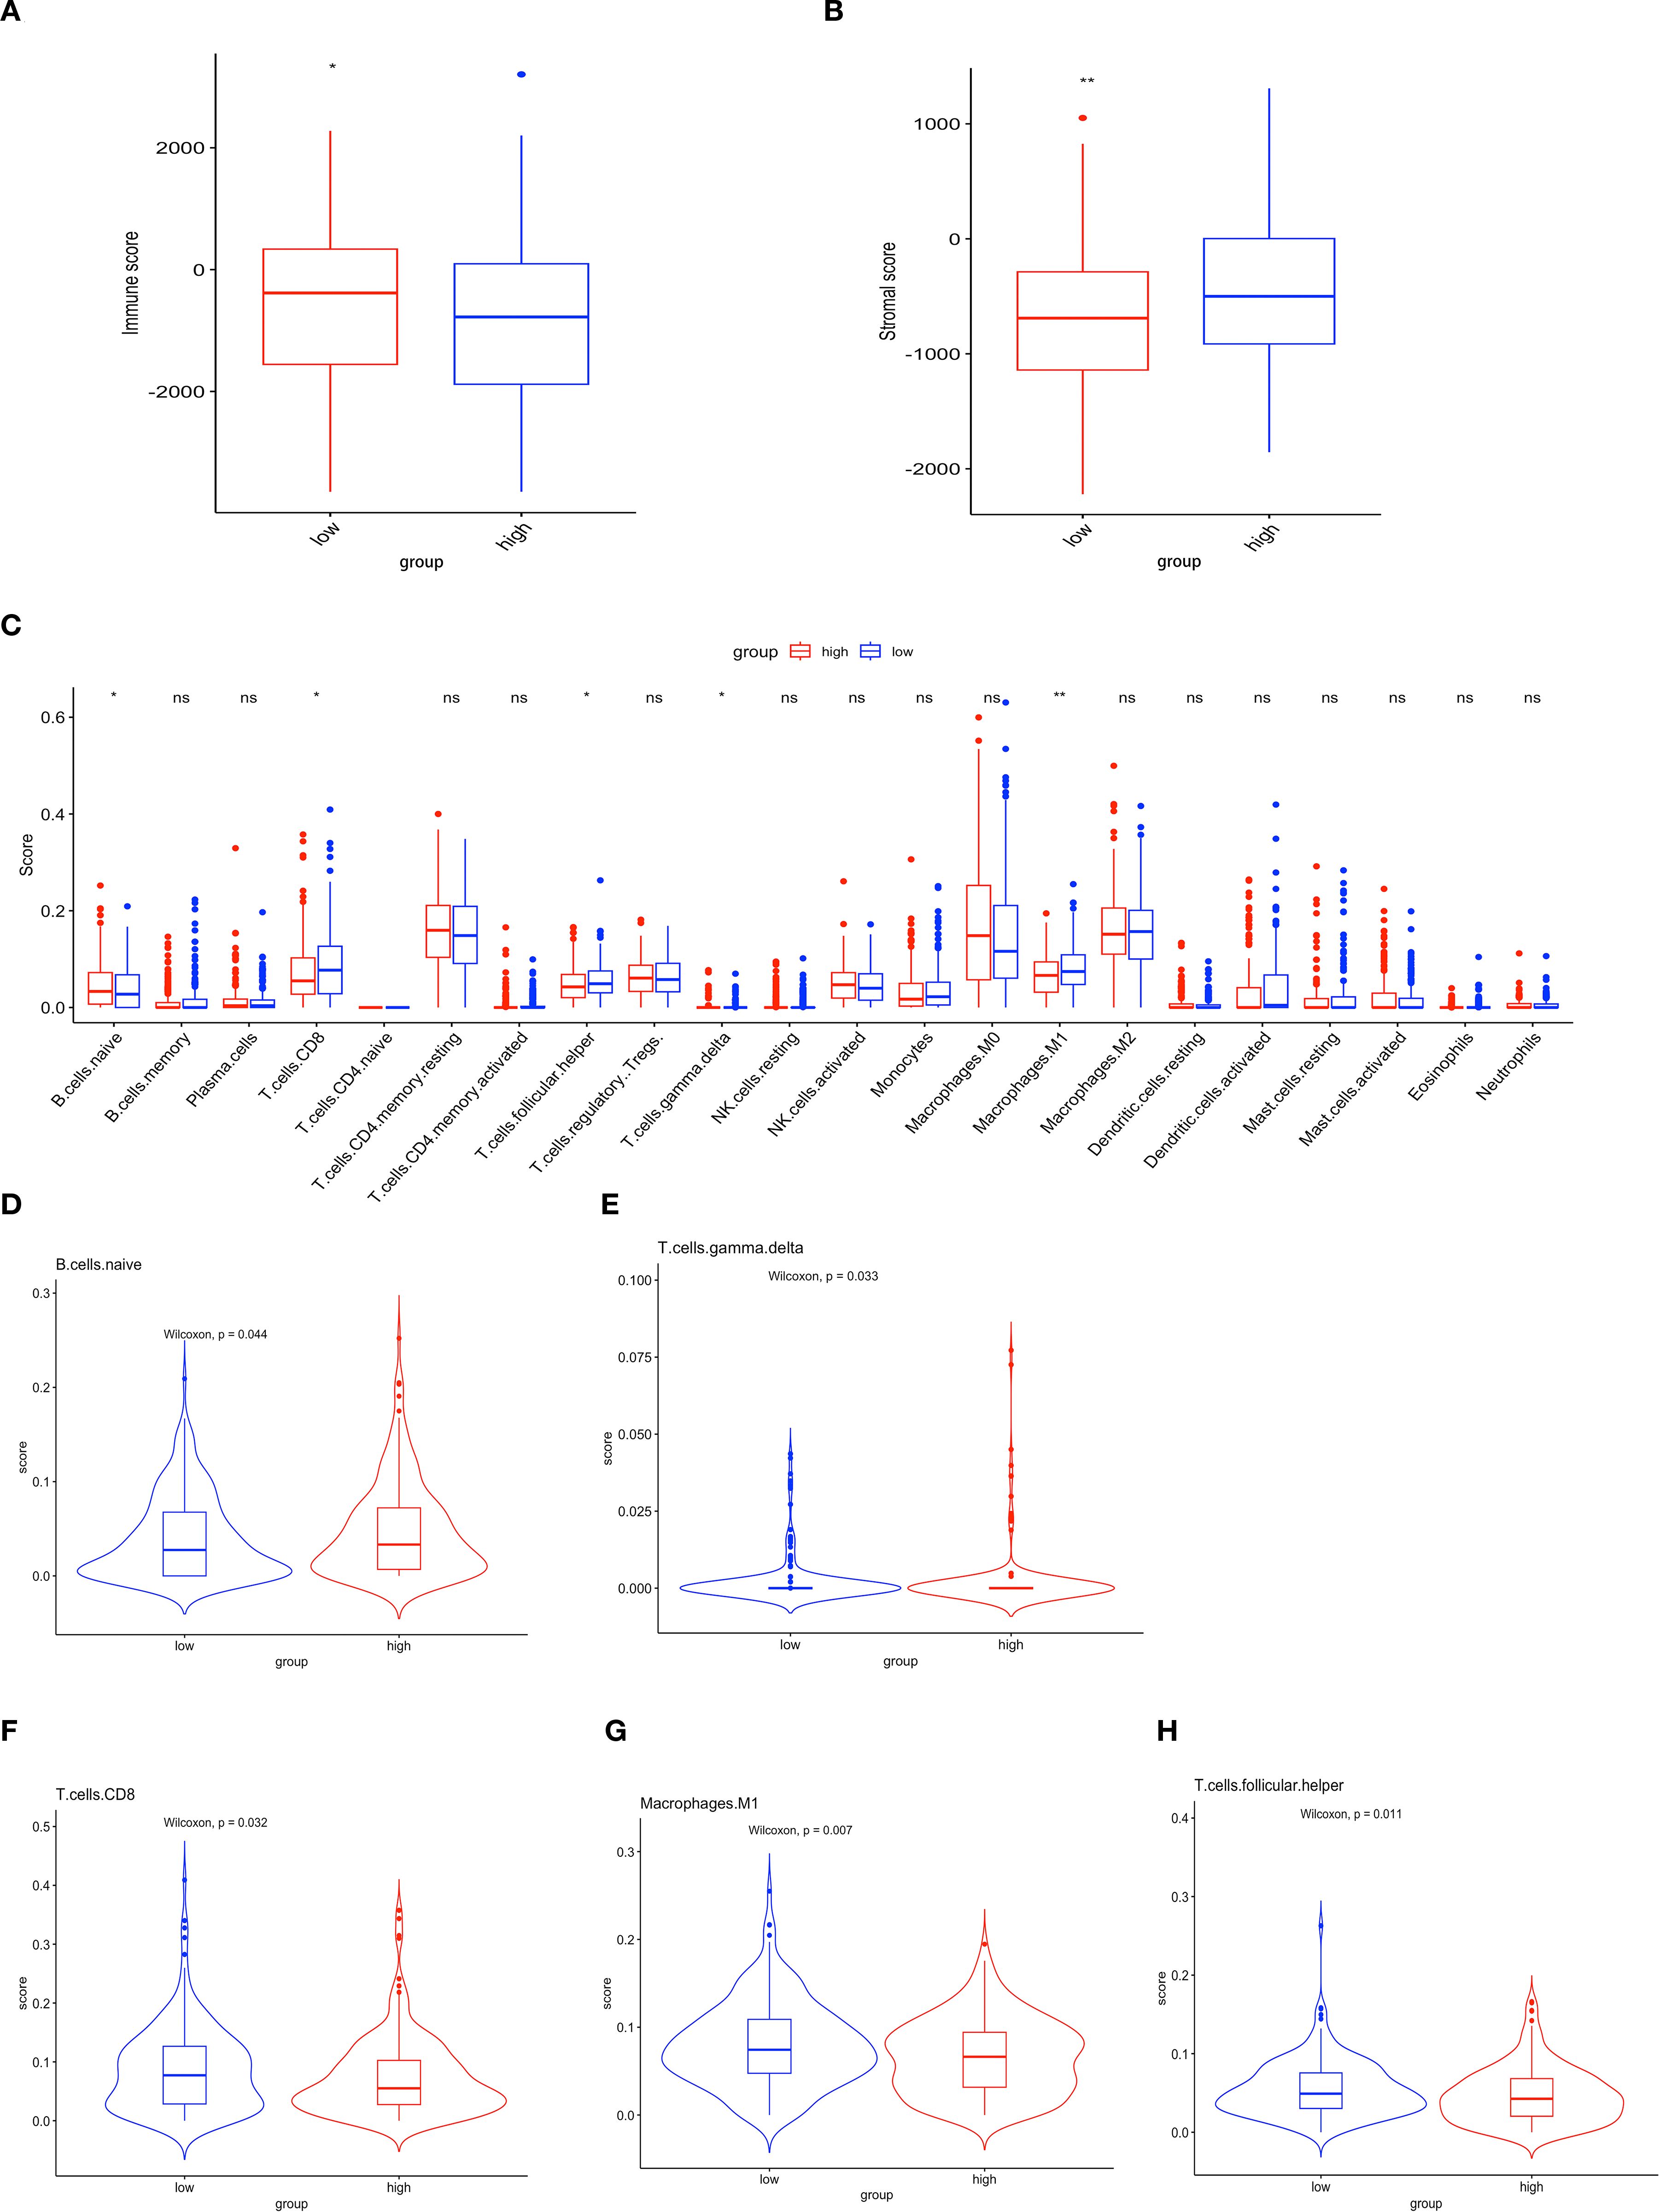
Figure 3. Immune characteristics of the prognostic model in the OV microenvironment. (A) Immune scores. (B) Stromal scores. (C) Histogram illustrating the differential expression of tumor-infiltrating immune cells between the high-risk and low-risk groups. Red and blue represent high- and low-risk groups, respectively (ns p>0.05; *p<0.05; **p<0.01). (D-H) Comparative analysis of the TME between the two groups.
3.4 Identification of mutational features of the genome
In order to provide further clarification regarding the mechanisms underlying the prognostic risk score’s effectiveness in predicting patient outcomes, the mutation frequency associated with the prognostic model was examined. SNV data for OV were retrieved from the TCGA database. Using the Maftools R package, the mutation profiles of the relevant genes were thoroughly analyzed. The waterfall plots displayed the top 10 most frequently mutated genes in both groups. TP53, TIN, CSMD3, and MUC16 mutations were observed in both groups (Supplementary Figures S3A, B), suggesting their potential involvement in OV pathology. Notably, the high-risk group exhibited mutations in MUC17 and LRRK2, while the low-risk group had more RYR2 mutations.
3.5 FBXO45 is overexpressed in OV and correlates with poor prognosis
In order to further elucidate the pivotal function of ubiquitination-related genes in ovarian cancer, significant interactions between the eight core proteins included in the ubiquitination-associated prognostic model were identified by protein interaction network PPI analysis (Figure 4A), namely TRAF4, UBE2L3, FBXO45, UBE2L6, FBXL14, SKP2, CHAF1B, WDR77 The protein with the highest impact (HR 1.0615) in univariate regression based on the above proteins was selected for further validation. IHC data from the Human Protein Atlas (https://www.proteinatlas.org/search/FBXO45) confirmed that FBXO45 expression was elevated in ovarian endometroid carcinoma, mucinous carcinoma, and serous carcinoma samples compared to normal ovarian tissues (Figure 4B). FBXO45 was highly expressed in plasmacytoid ovarian cancer in the GSE36668 dataset of the GEO database by analyzing data from four normal ovaries and four patients with serous ovarian cancer (Figure 4C). Furthermore, analysis using the Kaplan-Meierdatabase (https://kmplot.com/analysis/index.php?P=service&cancer=ovar) demonstrated that higher FBXO45 expression linked to lower PFS and OS in ovarian cancer patients, in contrast to those with low FBXO45 expression (Figures 4D, E). UMAP projection was used to visualize the clustering and annotation results. Each point on the graph represents a single cell, colored according to its assigned cell type as determined by marker gene expression. The annotation included stromal cells (expressing MPZ, ACTA2, SERPINE2), immune cells (marked by CD45), oocytes (FIGLA, ZP2), and endothelial cells (CD34, PECAM1), all of which displayed distinct clustering patterns on the UMAP plot (Figures 4F, G). Subsequently, the STAR-Counts data and the corresponding clinical information of OV tumors were downloaded from the TCGA database (https://portal.gdc.cancer.gov) and analyzed the immune cell infiltration using CIBERSORT after standardizing the data (Figure 4H). The analysis demonstrated a positive correlation between FBXO45 expression and both naïve B cells and M0 macrophages and negatively correlated with monocyte and myeloid dendritic cell dormancy. Immune checkpoint-associated transcripts extracted from OV patients showed that FBXO45 expression was found to correlate positively with PD-L1 (CD274) (Figure 4I).
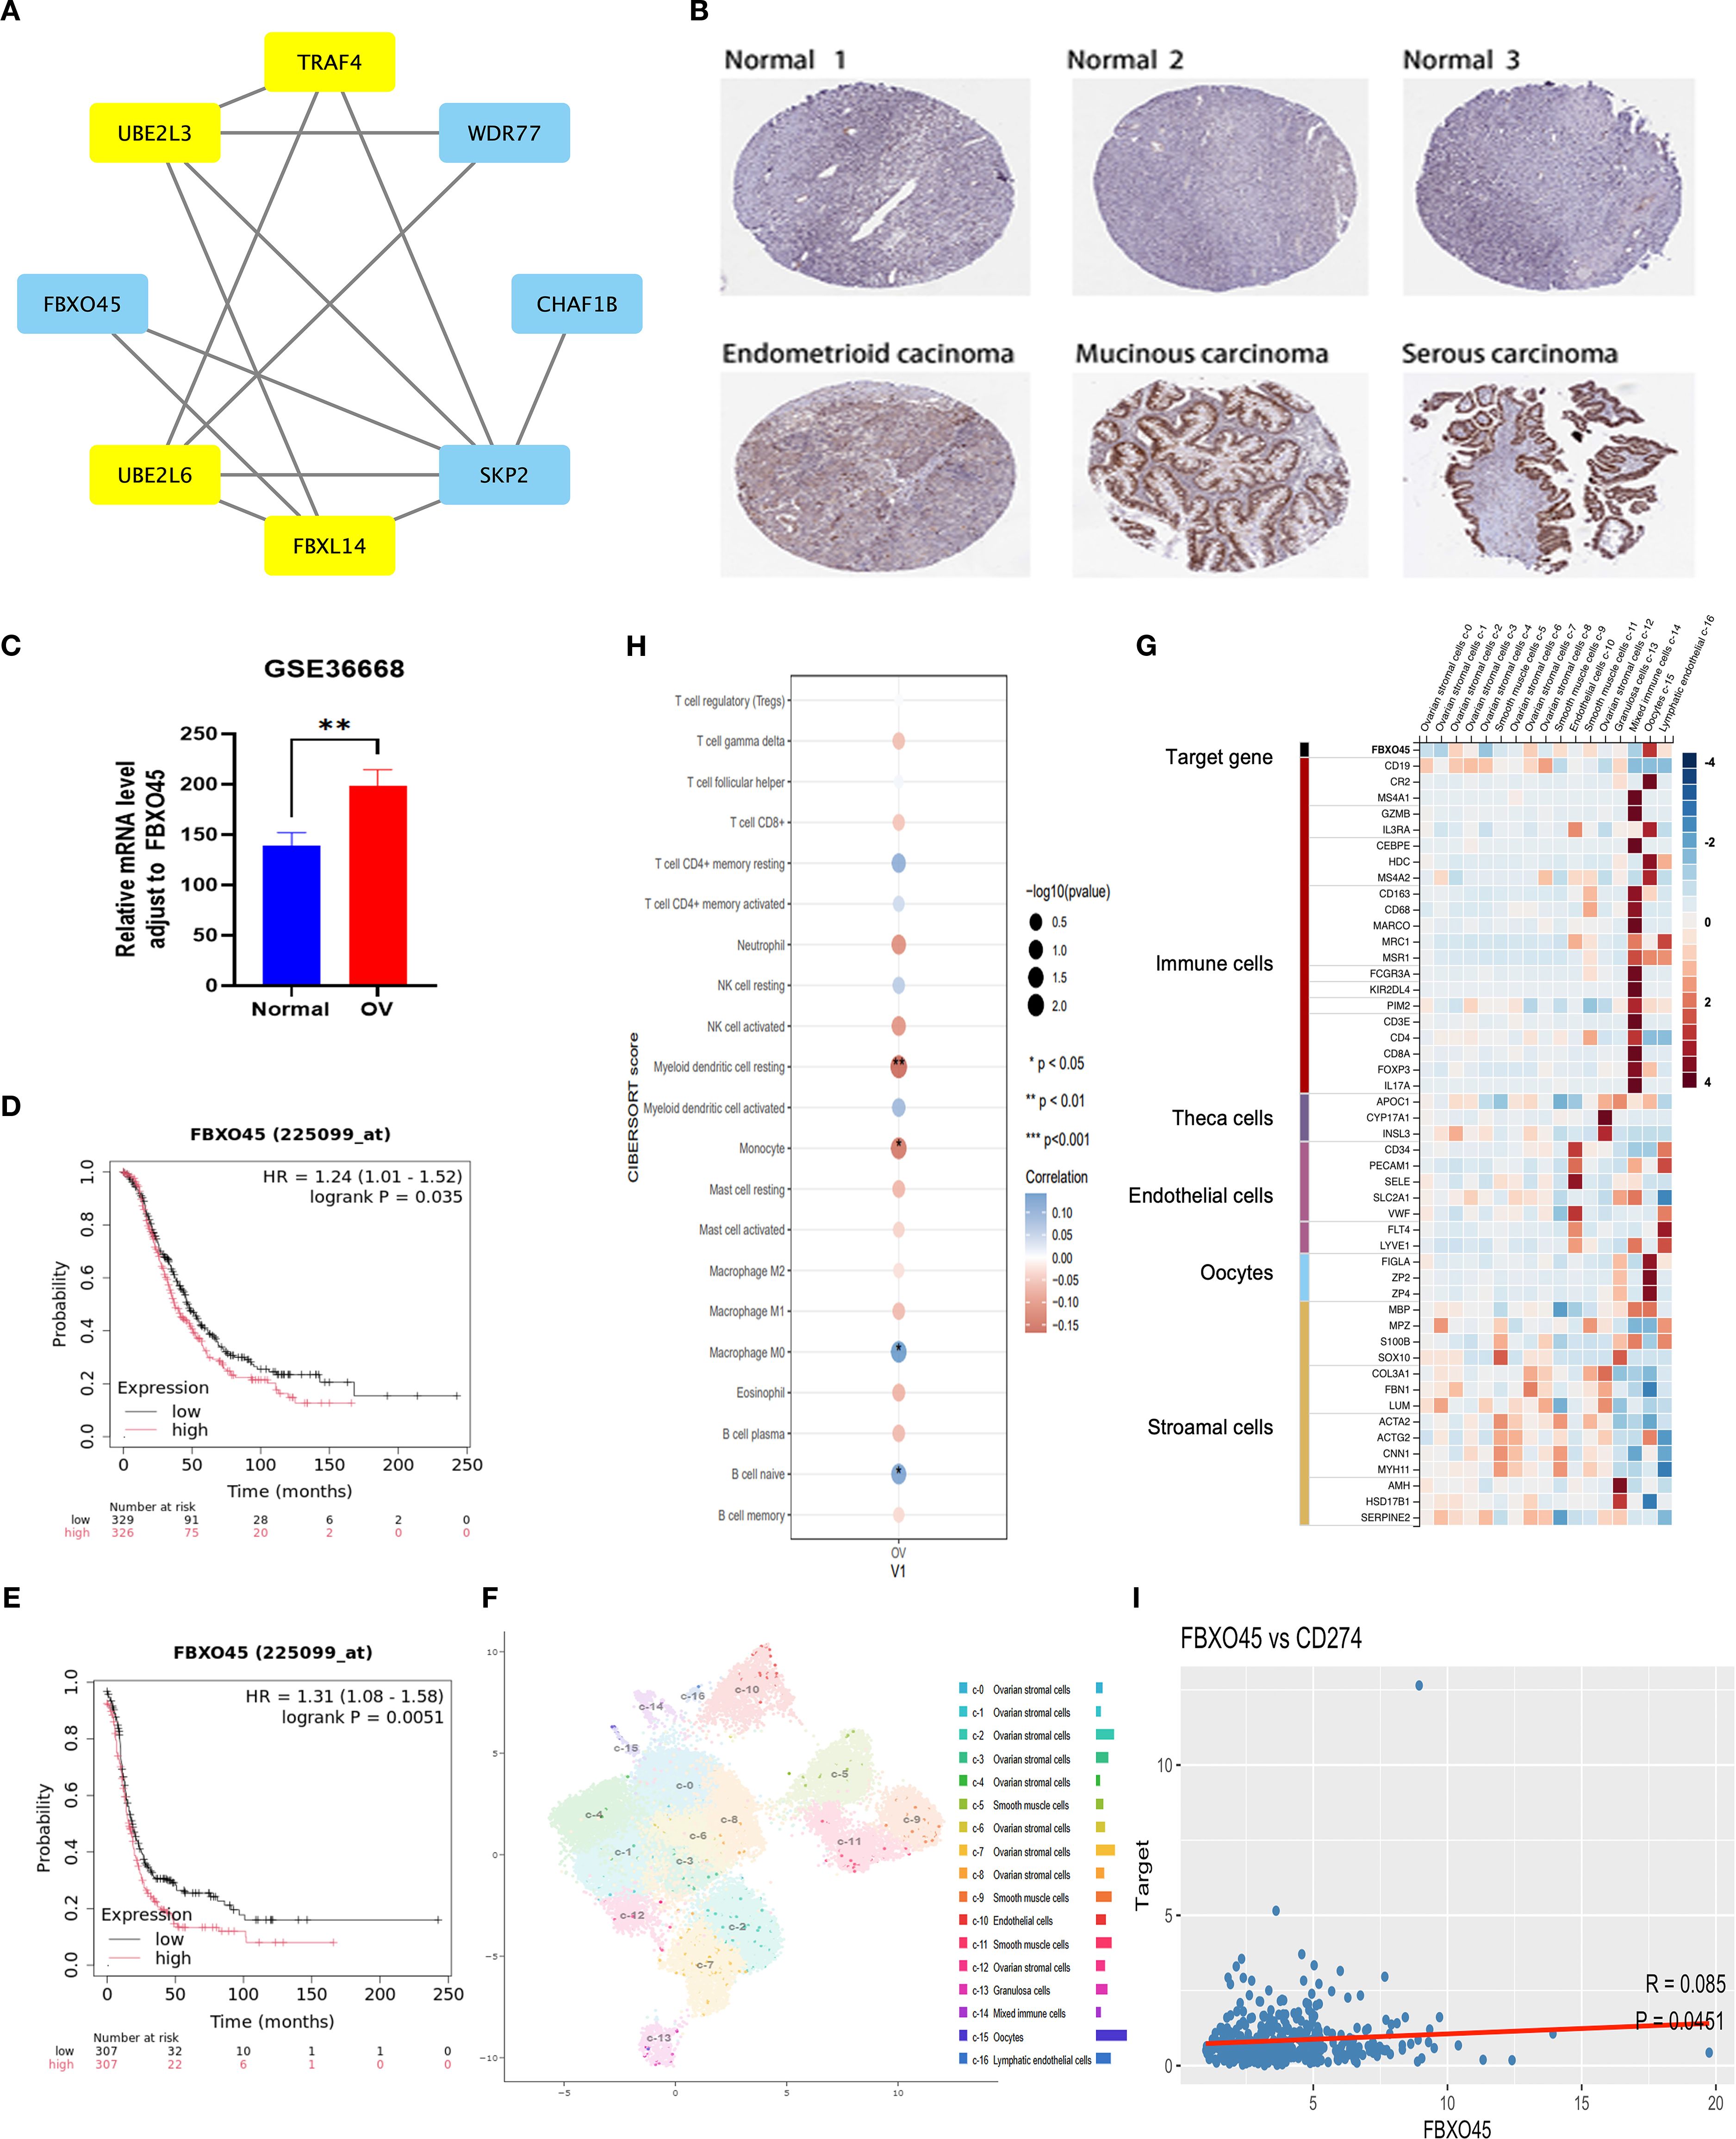
Figure 4. FBXO45 is overexpressed in OV and correlates with poor prognosis. (A) PPI network illustrating the interactions among candidate genes. (B) FBXO45 expression comparison between normal ovarian tissues and various OV types, based on IHC data from the HPA database. (C) FBXO45 is expressed in normal ovarian tissues and plasmacytoid ovarian cancer in the GSE36668 dataset. (D, E) PFS and OS analysis for OV patients with FBXO45 involvement, sourced from the R2 genomic analysis platform. (F) UMAP plots (left) and histograms (right) depicting RNA expression of the identified single-cell clusters in OV tissues. (G) The top 20 markers heat map. (H) Immune cell abundance estimation using CIBERSORT. (I) Spearman correlation analysis of FBXO45 and CD274 in TCGA.
3.6 FBXO45 modulates proliferation, invasion, and migration of OV cells
The impact of FBXO45 expression on the malignant behavior of OV was assessed by transfecting A2780 and HEY cells with FBXO45-targeting siRNA. Successful knockdown of FBXO45 was confirmed (Figures 5A, F), after which the proliferative, invasive, and migratory capacities of OV cells were evaluated. CCK8 and cell cycle assays demonstrated that FBXO45 silencing suppressed OV cell proliferation (Figures 5B, C, G, H). Furthermore, transwell and invasion assays revealed a significant reduction in invasion following FBXO45 knockdown (Figures 5D, I). Additionally, Wound healing assays also showed a marked decrease in migration ability when FBXO45 was depleted (Figures 5E, J). The obtained results indicate that FBXO45 knockdown suppresses the proliferation, migration, and invasion of OV cells.
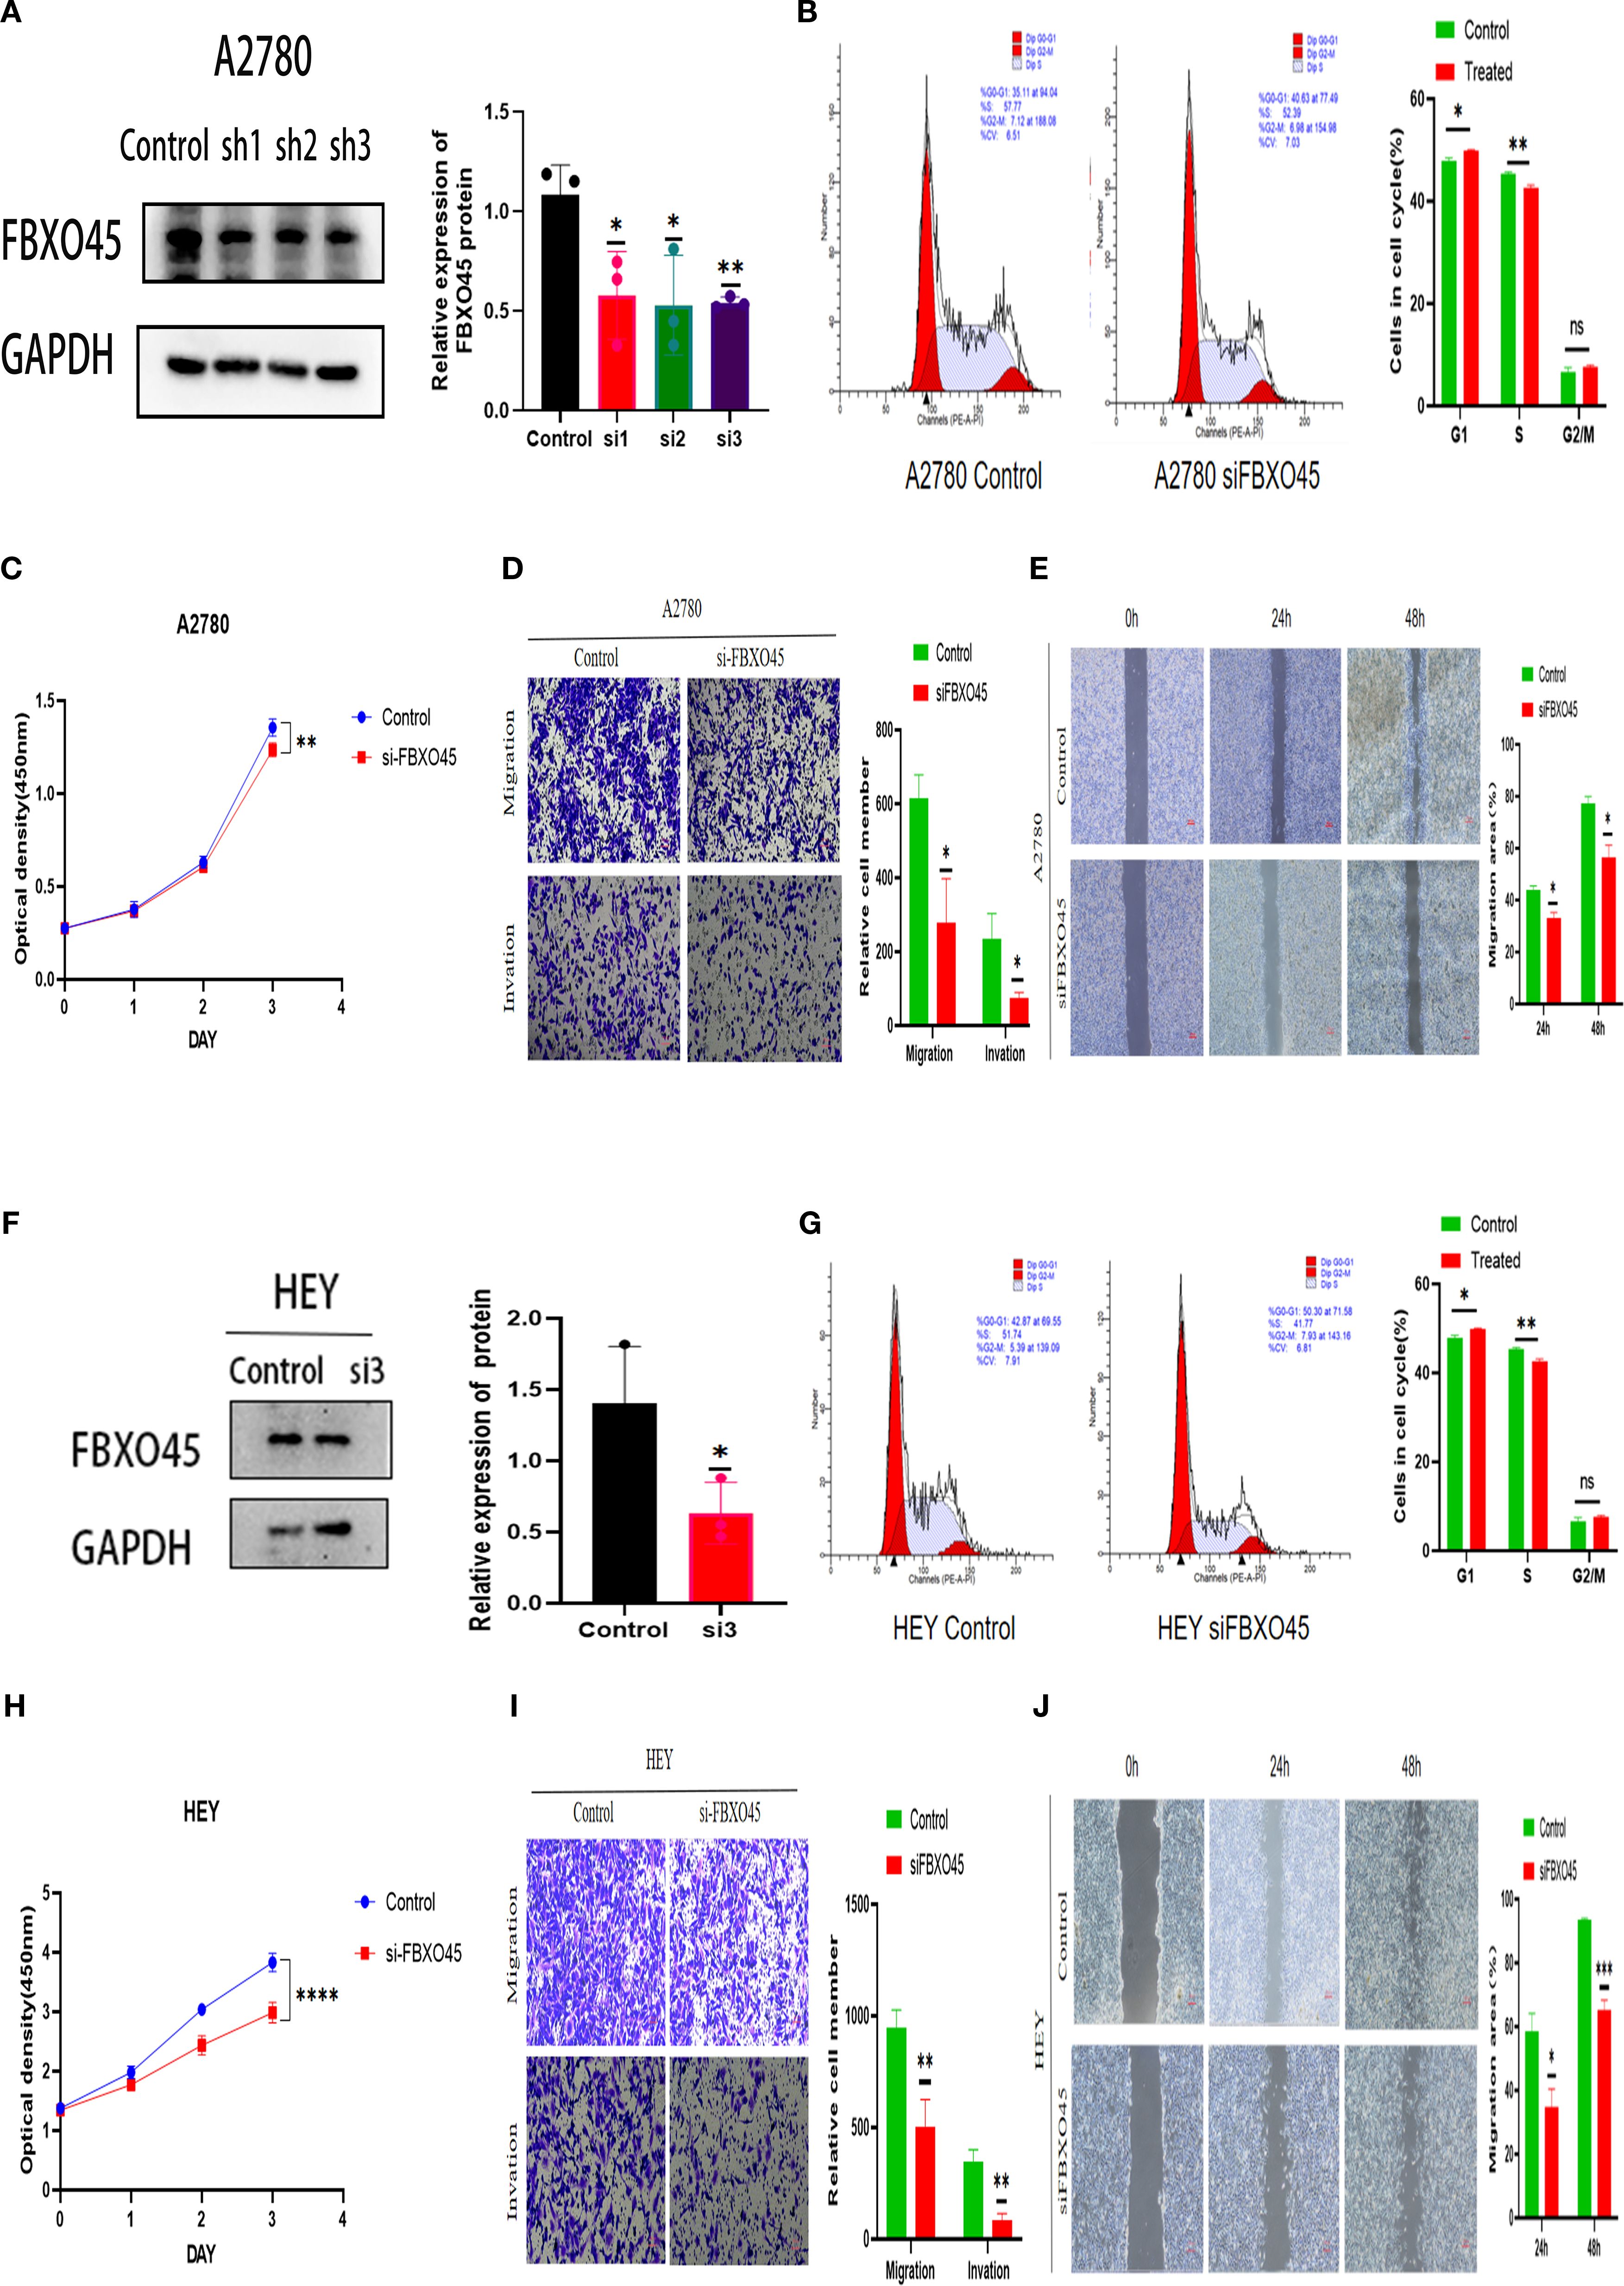
Figure 5. FBXO45 modulates the proliferation, invasion, and migration of OV cells. (A, F) Western blotting assessing the efficiency of FBXO45 knockdown in A2780 and HEY cells. (B, G) Cell cycle analysis evaluating the proliferative capacity of OV cells following FBXO45 knockdown. (C, H) The CCK-8 assay measuring cell proliferation in OV cells post-FBXO45 knockdown (OD450). (D, I) Transwell assays evaluating the invasive and migratory potential of OV cells after FBXO45 gene silencing. (E, J) Assessing the migration ability of OV cells following FBXO45 knockdown for wound healing assays. (*p <0.05; **p <0.01; ***p <0.001; ****p <0.0001).
3.7 FBXO45 activates the Wnt/β-catenin pathway
In order to provide further elucidation on the biological role and mechanism of FBXO45 in OV progression, the samples contained within the TCGA database were categorized into groups of high and low expression, based on the median expression of FBXO45. KEGG enrichment analysis of the high-expression group revealed a significant association of FBXO45 with cancer-related pathways, the cell cycle, RNA transport, and WNT signaling pathways (Figure 6A). Further analysis of TCGA RNAseq data using the GEPIA online tool revealed a positive correlation between FBXO45 expression and β-catenin levels in the WNT/β-catenin pathway (Figure 6B). Further analysis using GSEA revealed that FBXO45 upregulated this pathway, The NES values of the pathways is 2.196. (Figure 6C); Western blotting confirmed that silencing of FBXO45 in A2780 and HEY cells inhibited signaling while suppressing c-Myc expression. (Figures 6D, E). Meanwhile, we found that the high expression of FBXO45 in ovarian cancer tissues was accompanied by a corresponding elevation of WNT1 protein in clinical samples of 3 ovarian cancer tissues and normal ovarian tissues (Figure 6F). These results lend support to the hypothesis that FBXO45 activates the Wnt/β-catenin signaling pathway, contributing to the malignant development of ovarian cancer.
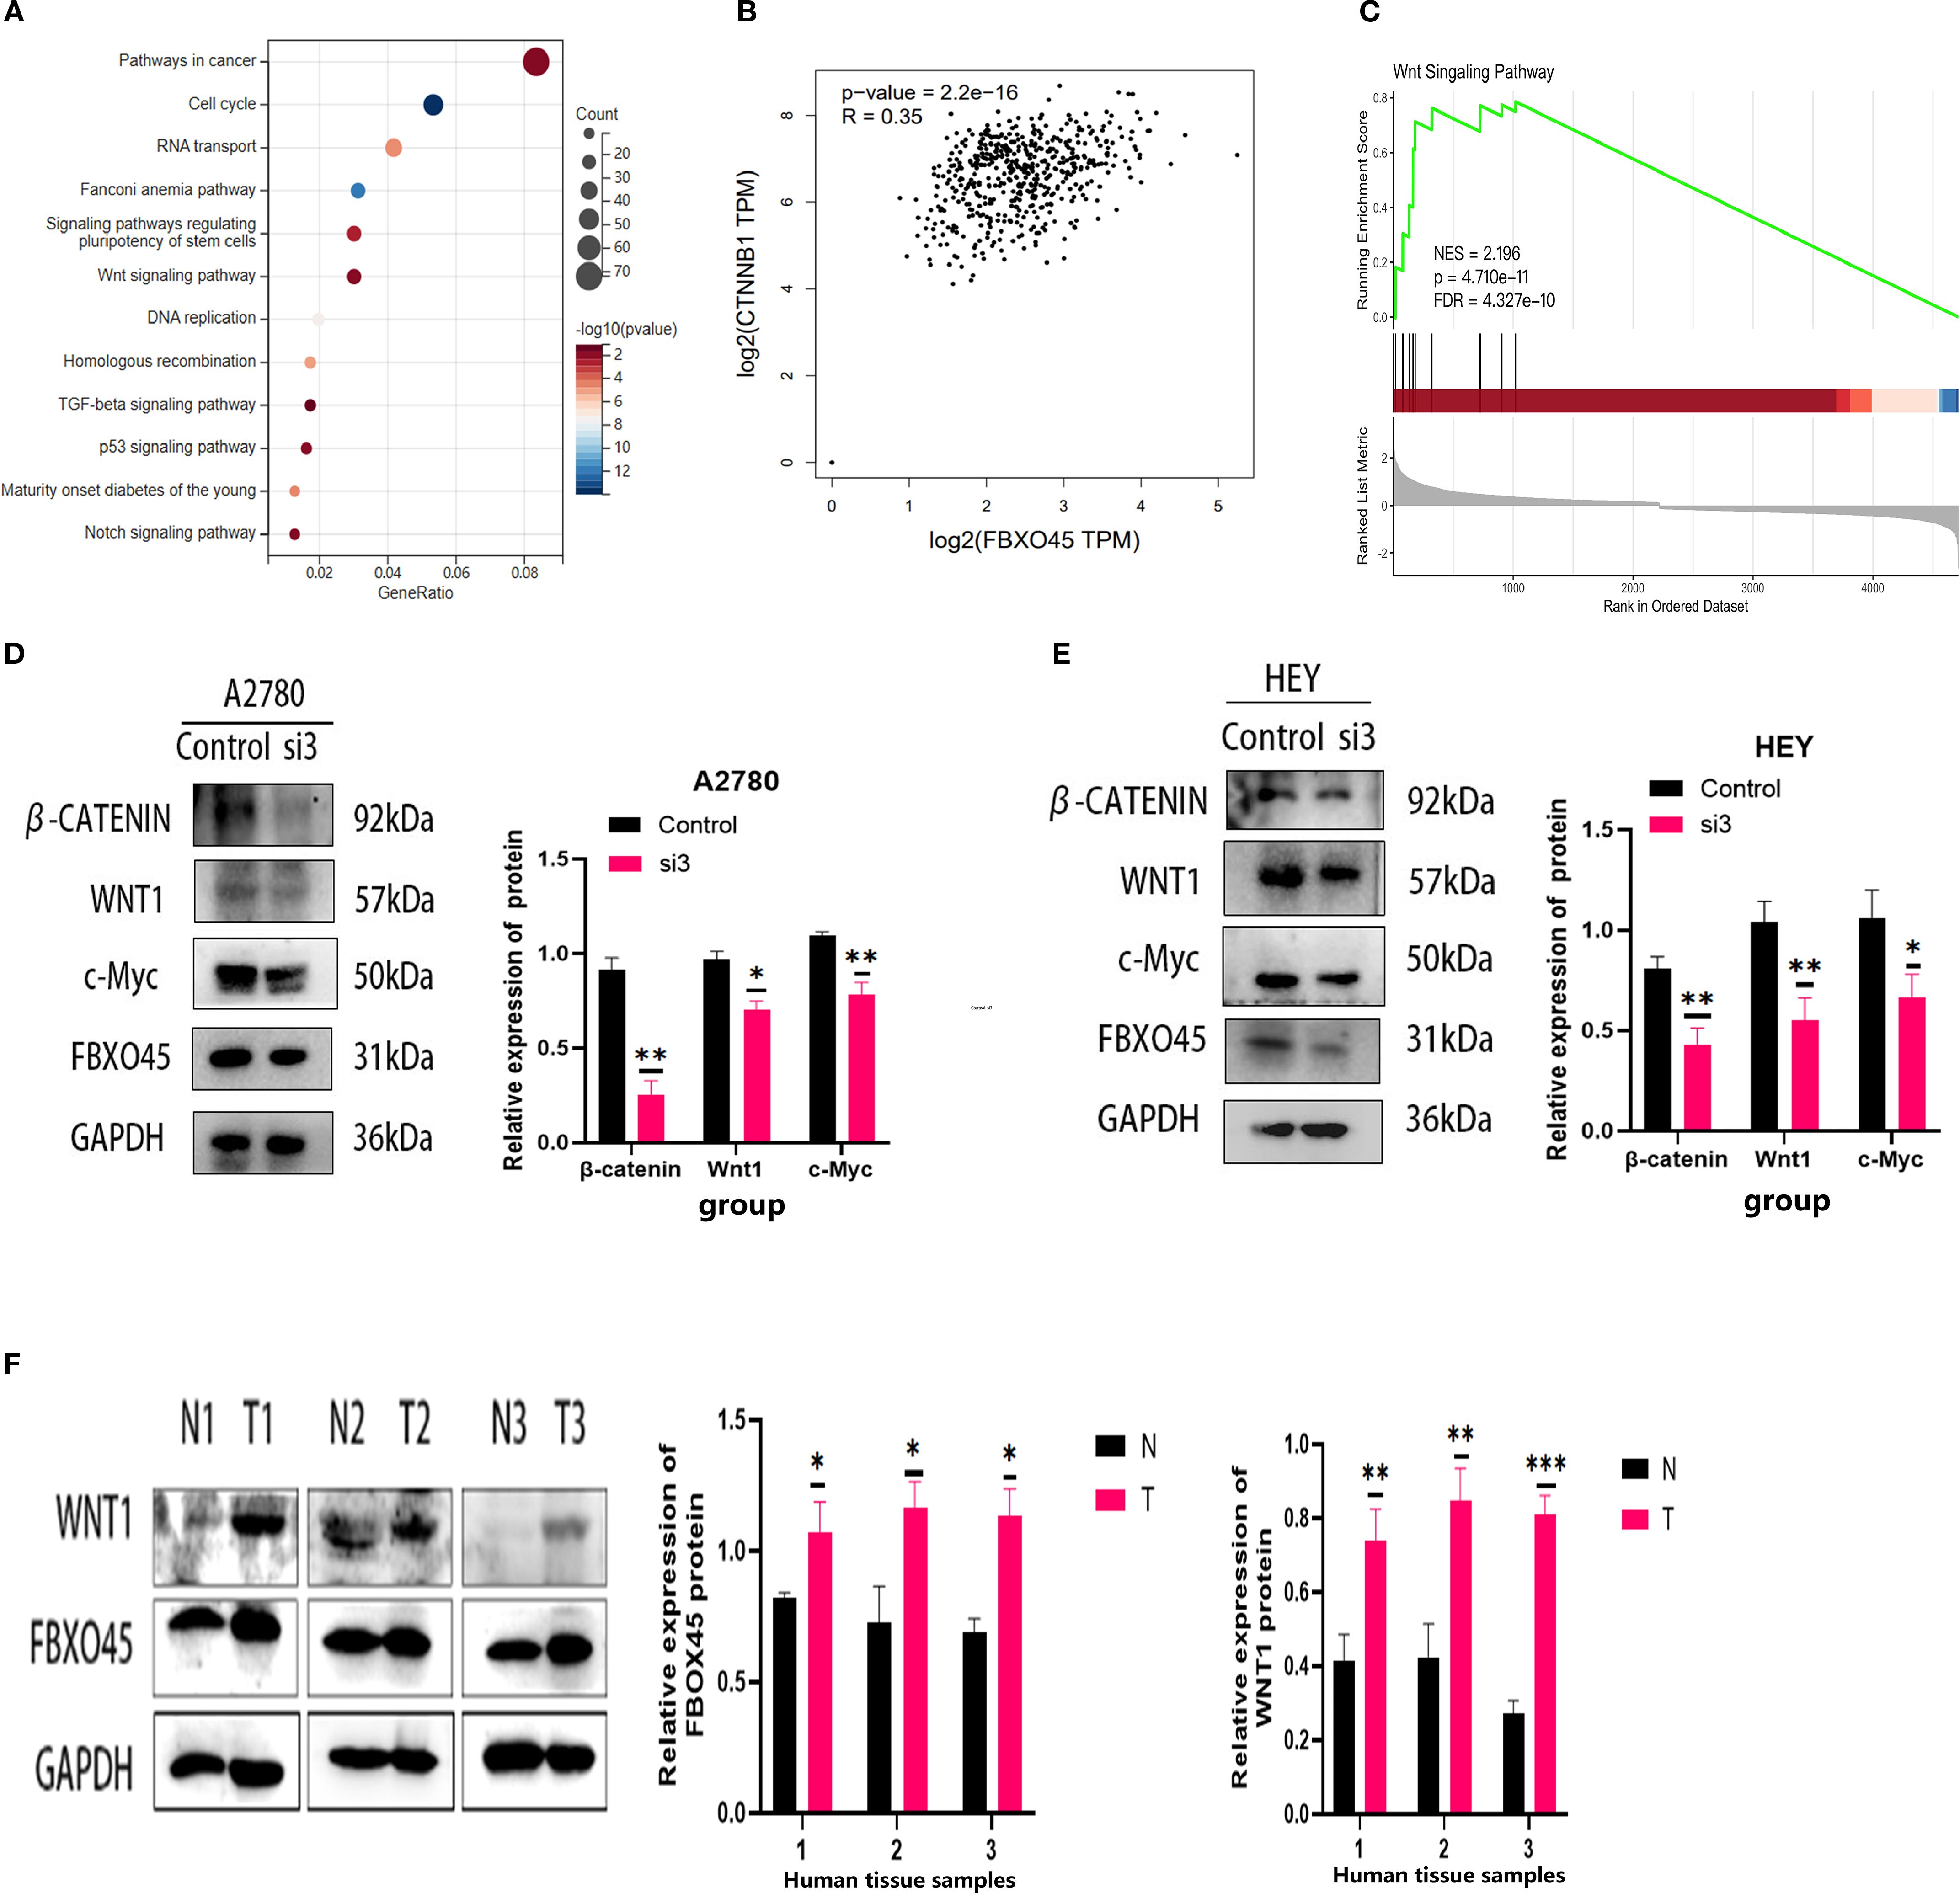
Figure 6. FBXO45 activates the Wnt/β-catenin signaling pathway. (A) KEGG enrichment analysis. (B) Pearson correlation analysis revealing the relationship between FBXO45 and β-catenin. (C) GSEA of the FBXO45 and Wnt/β-catenin signaling pathway. (D, E) Western blot analysis assessing the impact of FBXO45 knockdown on key proteins in the Wnt/β-Catenin pathway in A2780 and HEY cells. (F) Western blot analysis of FBXO45 and WNT1 expression in three normal ovarian tissues and three OV tissues, accompanied by statistical analysis (*p < 0.05; **p < 0.01; ***p < 0.001).
4 Discussion
Despite recent advancements in medicine, the clinical prognosis of OV remains a significant challenge in oncology (24, 25). Ubiquitination modification has been demonstrated to play a critical role in the processes of OV, including tumor progression, treatment resistance, and the TME (26, 27). As research into the role of ubiquitination-related genes in OV has deepened, it has become clear these genes may help with diagnosis and offer new ways to treat the disease.
With the increasing research on the function of ubiquitin-related genes, their clinical value as potential prognostic markers and therapeutic targets has gradually emerged. The present study developed a survival prognostic model for OV patients by means of the identification of differentially expressed ubiquitin-related genes through RNA sequencing. Validation with the training set and two independent cohorts confirmed that the model effectively stratified patients into high- and low-risk groups. The above experimental results demonstrate the stability of prognostic models based on ubiquitination-associated genes have stable predictive effects and good generalization ability in external datasets.
Additionally, Ubiquitination plays a key role in immunomodulation and influences tumor progression by modulating the host immune response. For example, inhibition of USP18 enhances UBCH5- and Nedd4-mediated CSF1R proteasomal degradation, thereby increasing the number of antitumor macrophages within the TME (28). Similarly, PD-L1 is a unique target for UFMylation. Decreased expression of UFL1 has been demonstrated to reduce the UFMylation of PD-L1, thereby stabilizing PD-L1 and imparting immune evasion (29). The study established a correlation between elevated risk scores and a poorer prognosis, as well as immunosuppression. Patients in the low-risk group exhibited higher levels of activated CD8+ T cells, M1-macrophages, and follicular helper T cells within the TME. This may result in a prolonged survival period for patients by enhancing anti-tumor immune responses. Conversely, patients in the high-risk group demonstrated low immunity scores, and stromal low scores exhibited a more pronounced immunosuppressive profile, which may have a deleterious effect on the outlook for high-risk patients. These findings suggest that patients with low risk may demonstrate a heightened sensitivity to immune checkpoint inhibitor therapy.
Among the identified mutations, TP53, TIN, CSMD3, and MUC16 were commonly mutated in both risk groups. MUC17 and LRRK2 mutations were more prevalent in the high-risk group, while RYR2 mutations were more prevalent in the low-risk group. Low MUC17 expression in biliary cancer correlates with poorer survival and vascular invasion (30). LRRK2 inhibits rapid vesicle circulation, thereby promoting a novel signaling axis through the PI3K-Akt immune response to enhance chemokine receptor signal transduction (31). Additionally, a correlation has been demonstrated between low RYR2 expression and unfavorable prognoses in patients diagnosed with thyroid and breast cancer patients (32, 33); however, mutations at these loci remain underexplored in OV. Zibi Marchocki and colleagues identified four gene mutations associated with platinum resistance in OV cases following neoadjuvant treatment, including MUC17 (34). Research on OV has demonstrated that elevated LRRK2 expression can suppress cell proliferation, invasion, and migration (35). Whole exome sequencing of 87 patients with ovarian yolk sac tumors revealed that cancer driver mutations in eight patients with persistent or recurrent disease included ANKRD36, ANKRD62, DNAH8, MUC5B, NUP205, and RYR2 (36). Differences in the distribution of these mutations suggest potential differences in genomic instability between high- and low-risk patients, and mutations in high-risk groups may influence prognosis and treatment outcomes in OV by promoting tumor malignancy and impairing immune function.
The study created a prognostic model using 17 ubiquitin-associated genes and found that eight proteins interacted to form the model’s core. These core genes—TRAF4, UBE2L3, FBXO45, UBE2L6, FBXL14, SKP2, CHAF1B, and WDR77—have been implicated in tumor progression in previous studies.
TRAF4 has been determined to be a prognostic biomarker in OV, with elevated expression levels observed in OV cell lines. TRAF4 silencing has been shown to inhibit cell proliferation, migration and invasion, and stem cell factor expression. Moreover, sh-TRAF4 suppresses Akt and PI3K phosphorylation, effectively blocking the PI3K/Akt signaling pathway activation in OV cell lines (37). Additionally, TRAF4 overexpression has been implicated in prostate cancer, where it mediates K27-linked ubiquitination of the AR C-terminus, elevates intracellular cAMP levels, enhances E2F transcription factor activity, and promotes cell proliferation (38).
UBE2L3, an E2 ubiquitin-conjugating enzyme, has been shown to reduce HPV16 E7 protein levels and inhibit tumor growth in HPV+ HNC cells through its overexpression (39). Similarly, UBE2L6 (aka UbcH8) is an essential ubiquitin-conjugating enzyme that controls the degradation of c-Myc through E3 ubiquitin ligases, thus regulating cell growth (40). UBE2L6 enhances the binding of ISG15 to cellular proteins and promotes apoptosis in cervical cancer cells (41). It has been identified as both a tumor suppressor and a prognostic marker for melanoma (42). Additionally, studies have demonstrated reduced expression of UBE2L6 in primary acute myeloid leukemia (AML) cells, where silencing UBE2L6 inhibits ATRA-induced ISG15 conjugation, thus impairing isgylation and hindering AML cell differentiation (43). In a study of 92 clinical samples from patients diagnosed with serous OV, immunohistochemical analysis showed marked correlation among UBE2L6 expression and platinum sensitivity. Given that UBE2L6 is implicated in platinum resistance (44), further in vitro and in vivo validation is warranted. The role of UBE2L6 in OV remains to be more thoroughly investigated in future studies. Moreover, the gene functions of the core genes FBXO45, UBE2L3, FBXL14, CHAF1B, and WDR77 in OV have yet to be explored, and this represents a promising avenue for further research.
FBXO45 is a constituent of the F-box family of proteins, which are a subfamily of the E3 ligase substrate recognition family (45). It has been reported that FBXO45 regulates malignant behaviors such as cell proliferation, metastasis, and drug resistance by ubiquitinating and degrading FBXW7 (46), and ZEB1 (47), but its function in ovarian cancer has not been reported. This study identifies FBXO45 as a potentially significant prognostic factor in OV, based on its highest single-factor regression coefficient among the core proteins (HR 1.0615). Single-cell sequencing results indicate that FBXO45 is most significantly associated with oocytes in ovarian fine. Recent studies have highlighted that oocyte depletion accelerates ovarian aging, which, in turn, contributes to cancer progression (48). It was also found that FBXO45 was highly expressed in ovarian plasmacytoid, mucinous and endometrioid cancer samples, and elevated levels of the protein expression were associated with poor prognosis. To validate the model’s predictive value, FBXO45 was silenced in A2780 and HEY cells, resulting in reduced cell proliferation, migration, and invasion. It is well known that the WNT signaling pathway regulates several key biological processes (cell proliferation, epithelial-mesenchymal transition, DNA damage response and chemotherapy tolerance) (49–51). Analysis of RNAseq data from OV patients in the TCGA database, coupled with GEPIA database and clinical patient sample analysis, further suggested that FBXO45 may enhance WNT/β-catenin signaling, thereby promoting the malignant phenotype of OV cells.FBXO45 frequently forms SCF complexes with Skp1 and Cul1 to perform its E3 ligase function (52), while FBXW7 is a substrate for ubiquitination degradation of FBXO45 (46). It has been found that FBXW7 inhibits TNBC cell stemness by ubiquitination degradation of the CHD4 protein. It has been established that the aforementioned mechanism functions by obstructing the activation of the Wnt/β-catenin pathway (53), Furthermore, research has demonstrated that the knockdown of SKP1 results in the inhibition of the Wnt signaling pathway, whilst concurrently inducing ROS production (54). The above literature further supports our conclusion.
OV is an immunogenic inflammatory disease closely associated with immune cell activity (55). Clinical trials have reported response rates to PD-1 and PD-L1 inhibitors in OV patients ranging from 4% to 15% (56). In our study, FBXO45 expression was positively correlated with naive B cells and M0 macrophages, while negatively correlating with the dormancy of monocytes and bone marrow dendritic cells. Additionally, FBXO45 expression was positive associated with the immune checkpoints CD274 (PD-L1). These suggests that it may promote the formation of an immunosuppressive microenvironment by inhibiting the antitumor activity of the host immune system. Meanwhile, tumor cells highly express PD-L1 and evade immune attack, thus promoting tumor growth and metastasis. These findings suggest that patients with higher FBXO45 expression may be more likely to respond positively to therapy involving PD-1 or PD-L1 inhibitors.
Our ubiquitination-related marker offers greater predictive value than other prognostic markers identified in previous studies, owing to the strong potential of ubiquitination-related factors for drug development. As an example, the UBE2L3 in prognostic model, whose small molecule inhibitor BAY 11–7082 has been shown to inhibit the inflammatory response, has been widely used (57). The pharmacological inhibition of TRAF4 by risperidone has been demonstrated to be an effective means of inhibiting tumor self-renewal in glioblastoma, with a concomitant reversal of temozolomide (TMZ) resistance (58).
As reported in previous articles, FBXO45 has been demonstrated to have pro-tumorigenic effects in cases of pancreatic, esophageal and lung cancers. Moreover, treatment of FBXO45-silenced lung cancer patients with afatinib has been shown to greatly increase patient sensitivity (45, 52, 59). In this study, FBXO45 was confirmed as a significant oncogene in OV, with its mechanism of action elucidated in vitro. This finding indicates that FBXO45 may represent a promising therapeutic target and that its clinical translation could prove advantageous for patients with diverse tumor types.
However, it should be noted that the study has limitations. Despite the study’s emphasis on the tumorigenic role of FBXO45 in OV, it is noteworthy that it lacked in vivo experiments and large-sample clinical trials. In order to understand the molecular mechanism more comprehensively, further 3D protein structure modeling (https://www.genecards.org/cgi-bin/carddisp.pl?gene=FBXO45#domains_families) (Supplementary Figures S4), structural domain identification, and proteomic screening of interacting proteins are needed to further analyze the pro-cancer mechanism of FBXO45 in depth. In addition, further research is required in the form of in vivo animal experiments, broader prospective clinical trials and larger sample studies in order to further explore the accuracy of prognostic models and the prognostic value of the key factor FBOX45 in ovarian cancer. Ultimately, this research will lead to clinical translation through the study of small molecule inhibitors and PROTACs.
5 Conclusion
Ubiquitination-related genes serve as reliable prognostic markers for OV and may inform clinical decision-making in patient management. As a core gene in the prognostic model, FBXO45 has the potential to function as a therapeutic target for ovarian cancer. Moreover, it can be argued that the results of this study provide a new concept for future targeted therapy against the Wnt signaling pathway.
Data availability statement
The original contributions presented in the study are included in the article/Supplementary Material. Further inquiries can be directed to the corresponding authors.
Author contributions
XL: Writing – review & editing, Writing – original draft. SZ: Writing – review & editing, Writing – original draft. LL: Writing – review & editing. YH: Writing – review & editing. QaZ: Writing – review & editing. HL: Writing – review & editing. QzZ: Writing – review & editing. SX: Formal analysis, Methodology, Writing – review & editing. QL: Writing – review & editing. ML: Writing – review & editing.
Ethics statement
Ethical approval for participant sample collection was obtained from the Medical Science Ethics Committee of the Affiliated Hospital of Guizhou Medical University, approval number 2024 No. 246, and informed consent was obtained from all participants. The study adhered to the principles set out in the Declaration of Helsinki.
Funding
The author(s) declare financial support was received for the research and/or publication of this article. 1 National Natural Science Foundation of China (81960476, 81460365), project leader: Qinshan Li; 2 National Natural Science Foundation of China (81760039), project leader: Mengxing Li; 3 Department of Science and Technology of Guizhou Province Project ((2019)1270), project leader: Qinshan Li; 4 Department of Science and Technology of Guizhou Province Project ((2020)4Y160), project leader: Mengxing Li; 5 Guizhou Provincial Health Commission Fund (gzwkj2021-160), project leader: Mengxing Li 6 Guizhou Provincial Health Commission Fund (gzwkj2025-096), project leader: Xiaojing Lin.
Conflict of interest
The authors declare that the research was conducted in the absence of any commercial or financial relationships that could be construed as a potential conflict of interest.
Generative AI statement
The author(s) declare that no Generative AI was used in the creation of this manuscript.
Any alternative text (alt text) provided alongside figures in this article has been generated by Frontiers with the support of artificial intelligence and reasonable efforts have been made to ensure accuracy, including review by the authors wherever possible. If you identify any issues, please contact us.
Publisher’s note
All claims expressed in this article are solely those of the authors and do not necessarily represent those of their affiliated organizations, or those of the publisher, the editors and the reviewers. Any product that may be evaluated in this article, or claim that may be made by its manufacturer, is not guaranteed or endorsed by the publisher.
Supplementary material
The Supplementary Material for this article can be found online at: https://www.frontiersin.org/articles/10.3389/fimmu.2025.1654180/full#supplementary-material
Supplementary Table 1 | Enrichment analysis statistics.
Supplementary Figure 1 | study scheme.
Supplementary Figure 2 | Calibration plot illustrating the nomogram for predicting 1-, 3-, and 5-year OS.
Supplementary Figure 3 | Identification of mutational features of the genome. (A) Waterfall plots of SNV data for the high-risk group. (B) Waterfall plots of SNV data for the low-risk group.
Supplementary Figure 4 | 3D structure of FBXO45 protein.
Abbreviations
OV, Ovarian cancer; TME, Tumor Microenvironment; PROTACs, Proteolysis Targeting Chimeras; IHC, Immunohistochemical; ECL, Enhanced chemiluminescence; DEGs, Differentially expressed genes; AML, Acute myeloid leukemia.
References
1. Bray F, Ferlay J, Soerjomataram I, Siegel RL, Torre LA, and Jemal A. Global cancer statistics 2018: GLOBOCAN estimates of incidence and mortality worldwide for 36 cancers in 185 countries. CA Cancer J Clin. (2018) 68:394–424. doi: 10.3322/caac.21492
2. Sung H, Ferlay J, Siegel RL, Laversanne M, Soerjomataram I, Jemal A, et al. Global cancer statistics 2020: GLOBOCAN estimates of incidence and mortality worldwide for 36 cancers in 185 countries. CA Cancer J Clin. (2021) 71:209–49. doi: 10.3322/caac.21660
3. Reid BM, Permuth JB, and Sellers TA. Epidemiology of ovarian cancer: a review. Cancer Biol Med. (2017) 14:9–32. doi: 10.20892/j.issn.2095-3941.2016.0084
4. Hong S, Fu N, Sang S, Ma X, Sun F, and Zhang X. Identification and validation of IRF6 related to ovarian cancer and biological function and prognostic value. J Ovarian Res. (2024) 17:64. doi: 10.1186/s13048-024-01386-4
5. Wang L, Wang X, Zhu X, Zhong L, Jiang Q, Wang Y, et al. Drug resistance in ovarian cancer: from mechanism to clinical trial. Mol Cancer. (2024) 23:66. doi: 10.1186/s12943-024-01967-3
6. Dikic I and Schulman BA. An expanded lexicon for the ubiquitin code. Nat Rev Mol Cell Biol. (2023) 24:273–87. doi: 10.1038/s41580-022-00543-1
7. Cruz Walma DA, Chen Z, Bullock AN, and Yamada KM. Ubiquitin ligases: guardians of mammalian development. Nat Rev Mol Cell Biol. (2022) 23:350–67. doi: 10.1038/s41580-021-00448-5
8. Yang Q, Zhao J, Chen D, and Wang Y. E3 ubiquitin ligases: styles, structures and functions. Mol Biomed. (2021) 2:23. doi: 10.1186/s43556-021-00043-2
9. Sicari D, Weber J, Maspero E, and Polo S. The NEDD4 ubiquitin E3 ligase: a snapshot view of its functional activity and regulation. Biochem Soc Trans. (2022) 50:473–85. doi: 10.1042/BST20210731
10. Song M, Yeku OO, Rafiq S, Purdon T, Dong X, Zhu L, et al. Tumor derived UBR5 promotes ovarian cancer growth and metastasis through inducing immunosuppressive macrophages. Nat Commun. (2020) 11:6298. doi: 10.1038/s41467-020-20140-0
11. Patel PS, Abraham KJ, Guturi KKN, Halaby MJ, Khan Z, Palomero L, et al. RNF168 regulates R-loop resolution and genomic stability in BRCA1/2-deficient tumors. J Clin Invest. (2021) 131:e140105. doi: 10.1172/JCI140105
12. Chen X, Lu Q, Zhou H, Liu J, Nadorp B, Lasry A, et al. A membrane-associated MHC-I inhibitory axis for cancer immune evasion. Cell. (2023) 186:3903–20.e21. doi: 10.1016/j.cell.2023.07.016
13. Momozawa Y, Sasai R, Usui Y, Shiraishi K, Iwasaki Y, Taniyama Y, et al. Expansion of cancer risk profile for BRCA1 and BRCA2 pathogenic variants. JAMA Oncol. (2022) 8:871–8. doi: 10.1001/jamaoncol.2022.0476
14. Dale B, Cheng M, Park KS, Kaniskan H, Xiong Y, and Jin J. Advancing targeted protein degradation for cancer therapy. Nat Rev Cancer. (2021) 21:638–54. doi: 10.1038/s41568-021-00365-x
15. Li X, Pu W, Zheng Q, Ai M, Chen S, and Peng Y. Proteolysis-targeting chimeras (PROTACs) in cancer therapy. Mol Cancer. (2022) 21:99. doi: 10.1186/s12943-021-01434-3
16. Li K and Crews CM. PROTACs: past, present and future. Chem Soc Rev. (2022) 51:5214–36. doi: 10.1039/D2CS00193D
17. Liu S, Wang Z, Zhu R, Wang F, Cheng Y, and Liu Y. Three differential expression analysis methods for RNA sequencing: limma, edgeR, DESeq2. J Vis Exp. (2021) 175:e62528. doi: 10.3791/62528
18. Wang Q, Qiao W, Zhang H, Liu B, Li J, Zang C, et al. Nomogram established on account of Lasso-Cox regression for predicting recurrence in patients with early-stage hepatocellular carcinoma. Front Immunol. (2022) 13:1019638. doi: 10.3389/fimmu.2022.1019638
19. Vrieze SI. Model selection and psychological theory: a discussion of the differences between the Akaike information criterion (AIC) and the Bayesian information criterion (BIC). Psychol Methods. (2012) 17:228–43. doi: 10.1037/a0027127
20. Yoshihara K, Shahmoradgoli M, Martinez E, Vegesna R, Kim H, Torres-Garcia W, et al. Inferring tumour purity and stromal and immune cell admixture from expression data. Nat Commun. (2013) 4:2612. doi: 10.1038/ncomms3612
21. Mayakonda A, Lin DC, Assenov Y, Plass C, and Koeffler HP. Maftools: efficient and comprehensive analysis of somatic variants in cancer. Genome Res. (2018) 28:1747–56. doi: 10.1101/gr.239244.118
22. JIn C, Li R, Deng T, Li J, Yang H, Li H, et al. Identification and Validation of a Prognostic Prediction Model of m6A Regulator-Related LncRNAs in Hepatocellular Carcinoma. Front Mol Biosci. (2021) 8:784553. doi: 10.3389/fmolb.2021.784553
23. Ge Z, Leighton JS, Wang Y, Peng X, Chen Z, Chen H, et al. Integrated genomic analysis of the ubiquitin pathway across cancer types. Cell Rep. (2018) 23:213–26.e3. doi: 10.1016/j.celrep.2018.03.047
24. Yang WH, Huang Z, Wu J, Ding CC, Murphy SK, and Chi JT. A TAZ-ANGPTL4-NOX2 axis regulates ferroptotic cell death and chemoresistance in epithelial ovarian cancer. Mol Cancer Res. (2020) 18:79–90. doi: 10.1158/1541-7786.MCR-19-0691
25. Zhu Y, Chen X, Tang R, Li G, Yang J, and Hong S. Comprehensive analysis of hub genes associated with cisplatin-resistance in ovarian cancer and screening of therapeutic drugs through bioinformatics and experimental validation. J Ovarian Res. (2024) 17:142. doi: 10.1186/s13048-024-01461-w
26. Cai C, Tang YD, Zhai J, and Zheng C. The RING finger protein family in health and disease. Signal Transduct Target Ther. (2022) 7:300. doi: 10.1038/s41392-022-01152-2
27. Deng T, Hu B, Wang X, Ding S, Lin L, Yan Y, et al. TRAF6 autophagic degradation by avibirnavirus VP3 inhibits antiviral innate immunity via blocking NFKB/NF-κB activation. Autophagy. (2022) 18:2781–98. doi: 10.1080/15548627.2022.2047384
28. Miyauchi S, Arimoto KI, Liu M, Zhang Y, and Zhang DE. Reprogramming of tumor-associated macrophages via NEDD4-mediated CSF1R degradation by targeting USP18. Cell Rep. (2023) 42:113560. doi: 10.1016/j.celrep.2023.113560
29. Zhou J, Ma X, He X, Chen B, Yuan J, Jin Z, et al. Dysregulation of PD-L1 by UFMylation imparts tumor immune evasion and identified as a potential therapeutic target. Proc Natl Acad Sci U S A. (2023) 120:e2215732120. doi: 10.1073/pnas.2215732120
30. Wardell CP, Fujita M, Yamada T, Simbolo M, Fassan M, Karlic R, et al. Genomic characterization of biliary tract cancers identifies driver genes and predisposing mutations. J Hepatol. (2018) 68:959–69. doi: 10.1016/j.jhep.2018.01.009
31. Liu Z, Xu E, Zhao HT, Cole T, and West AB. LRRK2 and Rab10 coordinate macropinocytosis to mediate immunological responses in phagocytes. EMBO J. (2020) 39:e104862. doi: 10.15252/embj.2020104862
32. Xu N, Zhang D, Chen J, He G, and Gao L. Low expression of ryanodine receptor 2 is associated with poor prognosis in thyroid carcinoma. Oncol Lett. (2019) 18:3605–12. doi: 10.3892/ol.2019.10732
33. Zhai D, Zhang M, Li Y, Bi J, Kuang X, Shan Z, et al. LINC01194 recruits NUMA1 to promote ubiquitination of RYR2 to enhance Malignant progression in triple-negative breast cancer. Cancer Lett. (2022) 544:215797. doi: 10.1016/j.canlet.2022.215797
34. Marchocki Z, Tone A, Virtanen C, de Borja R, Clarke B, Brown T, et al. Impact of neoadjuvant chemotherapy on somatic mutation status in high-grade serous ovarian carcinoma. J Ovarian Res. (2022) 15:50. doi: 10.1186/s13048-022-00983-5
35. Liu M, Shen C, and Wang C. Long noncoding RNA LINC01133 confers tumor-suppressive functions in ovarian cancer by regulating leucine-rich repeat kinase 2 as an miR-205 sponge. Am J Pathol. (2019) 189:2323–39. doi: 10.1016/j.ajpath.2019.07.020
36. Liang S, Ge H, Zhou S, Tang J, Gu Y, Wu X, et al. Prognostic factors of 87 ovarian yolk sac tumor (OYST) patients and molecular characteristics of persistent and recurrent OYST. Gynecol Oncol. (2024) 187:64–73. doi: 10.1016/j.ygyno.2024.05.001
37. Wang Y, Luo X, Wu N, Liao Q, and Wang J. SRC-3/TRAF4 facilitates ovarian cancer development by activating the PI3K/AKT signaling pathway. Med Oncol. (2023) 40:76. doi: 10.1007/s12032-022-01944-0
38. Singh R, Meng H, Shen T, Lumahan LEV, Nguyen S, Shen H, et al. TRAF4-mediated nonproteolytic ubiquitination of androgen receptor promotes castration-resistant prostate cancer. Proc Natl Acad Sci U S A. (2023) 120:e2218229120. doi: 10.1073/pnas.2218229120
39. Khalil MI, Yang C, Vu L, Chadha S, Nabors H, James CD, et al. The membrane-associated ubiquitin ligase MARCHF8 stabilizes the human papillomavirus oncoprotein E7 by degrading CUL1 and UBE2L3 in head and neck cancer. J Virol. (2024) 98:e0172623. doi: 10.1128/jvi.01726-23
40. Chen Y, Zhou C, Ji W, Mei Z, Hu B, Zhang W, et al. ELL targets c-Myc for proteasomal degradation and suppresses tumour growth. Nat Commun. (2016) 7:11057. doi: 10.1038/ncomms11057
41. Zhang Q, Qiao L, Wang X, Ding C, and Chen JJ. UHRF1 epigenetically down-regulates UbcH8 to inhibit apoptosis in cervical cancer cells. Cell Cycle. (2018) 17:300–8. doi: 10.1080/15384101.2017.1403686
42. Kuser-Abali G, Zhang Y, Szeto P, Zhao P, Masoumi-Moghaddam S, Fedele CG, et al. UHRF1/UBE2L6/UBR4-mediated ubiquitination regulates EZH2 abundance and thereby melanocytic differentiation phenotypes in melanoma. Oncogene. (2023) 42:1360–73. doi: 10.1038/s41388-023-02631-8
43. Orfali N, Shan-Krauer D, O’Donovan TR, Mongan NP, Gudas LJ, Cahill MR, et al. Inhibition of UBE2L6 attenuates ISGylation and impedes ATRA-induced differentiation of leukemic cells. Mol Oncol. (2020) 14:1297–309. doi: 10.1002/1878-0261.12614
44. Shibahara M, Kurita T, Murakami M, Harada H, Koi C, Izumi H, et al. Association of UBE2L6 and ABCB6 expression with platinum resistance in serous ovarian carcinoma. Anticancer Res. (2023) 43:3787–92. doi: 10.21873/anticanres.16564
45. Wang Q, Wu L, Cao R, Gao J, Chai D, Qin Y, et al. Fbxo45 promotes the Malignant development of esophageal squamous cell carcinoma by targeting GGNBP2 for ubiquitination and degradation. Oncogene. (2022) 41:4795–807. doi: 10.1038/s41388-022-02468-7
46. Richter KT, Kschonsak YT, Vodicska B, and Hoffmann I. FBXO45-MYCBP2 regulates mitotic cell fate by targeting FBXW7 for degradation. Cell Death Differ. (2020) 27:758–72. doi: 10.1038/s41418-019-0385-7
47. Abshire CF, Carroll JL, and Dragoi AM. FLASH protects ZEB1 from degradation and supports cancer cells’ epithelial-to-mesenchymal transition. Oncogenesis. (2016) 5:e254. doi: 10.1038/oncsis.2016.55
48. Stankovic S, Shekari S, Huang QQ, Gardner EJ, Ivarsdottir EV, Owens NDL, et al. Genetic links between ovarian ageing, cancer risk and de novo mutation rates. Nature. (2024) 633:608–14. doi: 10.1038/s41586-024-07931-x
49. Robertson FL, O’Duibhir E, Gangoso E, Bressan RB, Bulstrode H, Marques-Torrejon MA, et al. Elevated FOXG1 in glioblastoma stem cells cooperates with Wnt/beta-catenin to induce exit from quiescence. Cell Rep. (2023) 42:112561. doi: 10.1016/j.celrep.2023.112561
50. Tang Q, Chen J, Di Z, Yuan W, Zhou Z, Liu Z, et al. TM4SF1 promotes EMT and cancer stemness via the Wnt/beta-catenin/SOX2 pathway in colorectal cancer. J Exp Clin Cancer Res. (2020) 39:232. doi: 10.1186/s13046-020-01690-z
51. Du X, Luo W, Li H, Gu Q, Huang P, Wang C, et al. Hsa_circ_0125356 promotes gemcitabine resistance by modulating WNT canonical and non-canonical pathways via miR-582-5p/FGF9 axis in non-small cell lung cancer. Mol Cancer. (2025) 24:59. doi: 10.1186/s12943-025-02259-0
52. Wu L, Yu K, Chen K, Zhu X, Yang Z, Wang Q, et al. Fbxo45 facilitates pancreatic carcinoma progression by targeting USP49 for ubiquitination and degradation. Cell Death Dis. (2022) 13:231. doi: 10.1038/s41419-022-04675-2
53. Xiao G, Lu W, Yuan J, Liu Z, Wang P, and Fan H. Fbxw7 suppresses carcinogenesis and stemness in triple-negative breast cancer through CHD4 degradation and Wnt/beta-catenin pathway inhibition. J Transl Med. (2024) 22:99. doi: 10.1186/s12967-024-04897-2
54. Zhang Y, Li X, Ding Y, Tao T, and Quan T. IBSP mediates fibroblast Malignant behaviors in hypertrophic scars via interacting with SKP1. Burns. (2025) 51:107617. doi: 10.1016/j.burns.2025.107617
55. Anadon CM, Yu X, Hänggi K, Biswas S, Chaurio RA, Martin A, et al. Ovarian cancer immunogenicity is governed by a narrow subset of progenitor tissue-resident memory T cells. Cancer Cell. (2022) 40:545–57.e13. doi: 10.1016/j.ccell.2022.03.008
56. Chardin L and Leary A. Immunotherapy in ovarian cancer: thinking beyond PD-1/PD-L1. Front Oncol. (2021) 11:795547. doi: 10.3389/fonc.2021.795547
57. Koszela J, Pham NT, Evans D, Mann S, Perez-Pi I, Shave S, et al. Real-time tracking of complex ubiquitination cascades using a fluorescent confocal on-bead assay. BMC Biol. (2018) 16:88. doi: 10.1186/s12915-018-0554-z
58. Li Y, Wang T, Wan Q, Wang Q, Chen Z, Gao Y, et al. TRAF4 maintains deubiquitination of caveolin-1 to drive glioblastoma stemness and temozolomide resistance. Cancer Res. (2022) 82:3573–87. doi: 10.1158/0008-5472.CAN-21-3882
Keywords: ovarian cancer, ubiquitination, prognostic model, immunotherapy, FBXO45, Wnt/β-catenin signaling pathway
Citation: Lin X, Zhao S, Li L, Huang Y, Zhong Q, Luo H, Zhang Q, Xu S, Li Q and Li M (2025) Prognostic model of ubiquitination-related genes in ovarian cancer based on transcriptomic analysis and experimental validation. Front. Immunol. 16:1654180. doi: 10.3389/fimmu.2025.1654180
Received: 26 June 2025; Accepted: 13 August 2025;
Published: 08 September 2025.
Edited by:
Yavuz Nuri Ertas, Erciyes University, TürkiyeReviewed by:
Aruna Pal, West Bengal University of Animal and Fishery Sciences, IndiaYanchuan Li, Nanjing Medical University, China
Yasir Hameed, Islamia University of Bahawalpur, Pakistan
Mohammed Alissa, Prince Sattam bin Abdulaziz University, Saudi Arabia
Copyright © 2025 Lin, Zhao, Li, Huang, Zhong, Luo, Zhang, Xu, Li and Li. This is an open-access article distributed under the terms of the Creative Commons Attribution License (CC BY). The use, distribution or reproduction in other forums is permitted, provided the original author(s) and the copyright owner(s) are credited and that the original publication in this journal is cited, in accordance with accepted academic practice. No use, distribution or reproduction is permitted which does not comply with these terms.
*Correspondence: Qinshan Li, bGlxaW5zaGFuQGdtYy5lZHUuY24=; Mengxing Li, bG14MTIzNEBnbWMuZWR1LmNu
†These authors have contributed equally to this work