 Patrycja Ogonowska
 Adrian Kobiela
 Anna Hulacka3
 Danuta Gutowska-Owsiak
 Joanna Nakonieczna
- 1Laboratory of Photobiology and Molecular Diagnostics, University of Gdańsk and Medical University of Gdańsk, Intercollegiate Faculty of Biotechnology, Gdańsk, Poland
- 2Laboratory of Experimental and Translational Immunology, University of Gdańsk and Medical University of Gdańsk, Intercollegiate Faculty of Biotechnology, Gdańsk, Poland
- 3Department of Pathomorphology, The University Hospital, Kraków, Poland
Atopic dermatitis (AD) is a chronic inflammatory skin disorder marked by barrier dysfunction and immune dysregulation. Colonization of lesional skin by Staphylococcus aureus, present in up to 80–100% of cases, exacerbates inflammation, in part through production of superantigenic toxins. While standard treatments such as topical corticosteroids, antibiotics, and antiseptic baths are widely used, their outcomes remain variable and often inadequate, highlighting the need for alternative strategies that minimize adverse effects and resistance development. In this study, we evaluated antimicrobial photodynamic inactivation (aPDI) using rose bengal (RB), a photosensitizer activated by visible light, as a potential approach to reduce S. aureus colonization and virulence. Across in vitro, ex vivo, and murine in vivo models, RB-mediated aPDI significantly decreased S. aureus viability and markedly attenuated the expression and activity of staphylococcal enterotoxins. Transcript and protein analyses confirmed substantial reductions in superantigenic activity post-aPDI. These effects were dependent on the combination of both RB and light, with no significant impact observed with either component alone. Our findings indicate that RB-based aPDI may represent a promising non-antibiotic approach to limit S. aureus viability and toxin activity in the context of AD. Our data contribute to the understanding of how photodynamic inactivation affects S. aureus virulence and highlight a model for studying the impact of microbial factors on skin immune responses in AD.
1 Introduction
Staphylococcus aureus is a versatile opportunistic pathogen associated with a wide spectrum of skin and soft tissue infections (SSTIs), including abscesses, furuncles, impetigo, and staphylococcal scalded skin syndrome (SSSS). In addition to these superficial infections, S. aureus is capable of causing severe invasive diseases such as osteomyelitis, infective endocarditis, septic arthritis, and pneumonia. In many cases, the skin is the primary site where infection begins, typically after the epidermal barrier is breached, allowing bacteria to invade deeper tissues (1). The predominance of S. aureus in skin infections is largely attributed to its diverse arsenal of virulence factors with immunomodulatory properties (2). Pathogenesis involves multiple strategies, including disruption of epithelial integrity, inactivation of antimicrobial peptides (AMPs) - such as dermicidin, human β-defensins (hBDs), and cathelicidin (LL-37) - enhanced adhesion to keratinocytes, and cytotoxicity toward neutrophils (3, 4). These innate immune evasion mechanisms collectively facilitate persistent colonization. In addition, S. aureus employs strategies to circumvent adaptive immunity, particularly through interference with T-cell responses (5–8).
Among its numerous virulence determinants, S. aureus secretes exoenzymes (lipases, nucleases, proteases) and a wide range of exotoxins, which collectively degrade host tissues and liberate nutrients that sustain bacterial growth. These exotoxins include cytolysins, exfoliative toxins (ETA, ETB), and a group of potent immunomodulators known as superantigens (SAgs) (9, 10). SAgs encompass classic enterotoxins, including staphylococcal enterotoxin A (SEA), staphylococcal enterotoxin B (SEB), staphylococcal enterotoxin C (SEC), staphylococcal enterotoxin D (SED), staphylococcal enterotoxin E (SEE), and staphylococcal enterotoxin I (SEI); enterotoxin-like proteins (SEl-G, through SEl-U); and toxic shock syndrome toxin-1 (TSST-1) (11). Unlike conventional antigens, SAgs activate T-cells by bridging major histocompatibility complex class II (MHC II) molecules and T-cell receptors (TCRs) outside the antigen-specific site, leading to massive polyclonal T-cell activation (12). This interaction results in excessive T-cell proliferation and vast cytokine release from CD4+ T-cells, including IL-2, TNF-β, and IFN-γ, as well as IL-1β and TNF-α from macrophages (13, 14). Clinically, SAgs have been implicated in T-cell resistance to corticosteroids in atopic dermatitis, posing therapeutic challenges (15). Furthermore, their role in exacerbating inflammatory skin conditions complicates disease management (16).
Methicillin-resistant S. aureus (MRSA) is a major cause of recurrent SSTIs and is resistant to most β-lactam antibiotics, including cephalosporins, carbapenems, monobactams (17, 18). MRSA colonization is more prevalent in individuals with atopic dermatitis compared to healthy carriers (19, 20). Notably, MRSA isolates from atopic dermatitis produce higher levels of SAgs than the methicillin-sensitive strains (MSSA) (13).The increasing incidence of antibiotic resistance in S. aureus underscores the urgent need for alternative therapeutic strategies. One such approach is antimicrobial photodynamic inactivation (aPDI), which combines a non-toxic photosensitizer (PS), specific wavelength light and molecular oxygen to generate reactive oxygen species (ROS) (21). These ROS, including hydroxyl radicals (•OH), superoxide anions (•O2-) and singlet oxygen (¹O2), damage proteins, lipids, nucleic acids, and the bacterial cell membranes, ultimately resulting in bacterial death. Importantly, aPDI does not induce conventional resistance; although bacterial tolerance has been reported (22). In vitro and in vivo studies validated the efficacy of aPDI against S. aureus, prompting the exploration of novel photosensitizer derivatives to enhance therapeutic outcomes (23).
In addition to direct bactericidal effect, aPDI inactivates bacterial virulence factors (24). For example, photodynamic treatment with methylene blue (MB) and red light (λmax = 665 nm) has been shown to inhibit S. aureus V8 protease, α-hemolysin, and sphingomyelinase activity (25). Likewise, enterotoxigenic S. aureus strains virulence factors have been effectively photoinactivated using the Tetra-Py+-Me in combination with white light (380–700 nm) (26).
Two PSs of particular interest are rose bengal (RB) and new methylene blue (NMB), which predominantly induce type II photochemical reaction, converting molecular oxygen (3O2) into cytotoxic 1O2 (27, 28). RB exhibits high biocompatibility, a key criterion for therapeutic application (29). It is routinely used in brucellosis diagnostics (30) and ophthalmology for detecting corneal epithelial damage (31).
RB is activated by green light, which penetrates only the superficial skin layers, making it well suited for cutaneous applications with minimal discomfort (32). RB-mediated aPDI has demonstrated efficacy against both planktonic and biofilm forms of Gram-negative and Gram-positive bacteria, including S. aureus, Enterococcus hirae, Listeria innocua, and Streptococcus agalactiae, and Escherichia coli (33–35). NMB, a phenothiazinium dye activated by red light, offers deeper tissue penetration, making it suitable for subcutaneous infections (36). Photodynamic treatment with NMB has been effective in reducing Candida albicans infections in skin abrasive wounds and significantly lowered the burden of multidrug-resistant Acinetobacter baumannii in both in vitro (>6 log10 CFU reduction), and in vivo (mouse burn model, >3 log10 CFU reduction) (37, 38). Additionally, Misba et al. demonstrated that NMB-mediated aPDI is effective against both Gram-positive (Enterococcus faecalis) and Gram-negative (Klebsiella pneumoniae) bacteria in planktonic and biofilm cultures (39). However, the impact of aPDI on S. aureus superantigens remains poorly characterized.
In this study, we investigated the effect of aPDI using RB (green light) and NMB (red light) on five clinically relevant S. aureus superantigens - SEA, SEB, SEC, SED, and TSST-1. We assessed both their expression and biological activity post-treatment. Furthermore, we evaluated the efficacy of aPDI and its modulatory effect on virulence factors activity in both an ex vivo porcine skin model and an in vivo murine model of S. aureus skin colonization.
2 Materials and methods
2.1 Bacterial strains and growth conditions
Staphylococcus aureus reference strains were generously provided by Dr Joanna Empel from the National Medicines Institute (NMI), Warsaw, Poland. These strains were analyzed for toxin genes and genetic background (Table 1). S. aureus was cultured in 5 mL tryptic soy broth (TSB, bioMérieux, France) under aerobic conditions at 37°C with shaking (150 rpm, Innova 40, New Brunswick Scientific, Sweden) for 16–20 h.
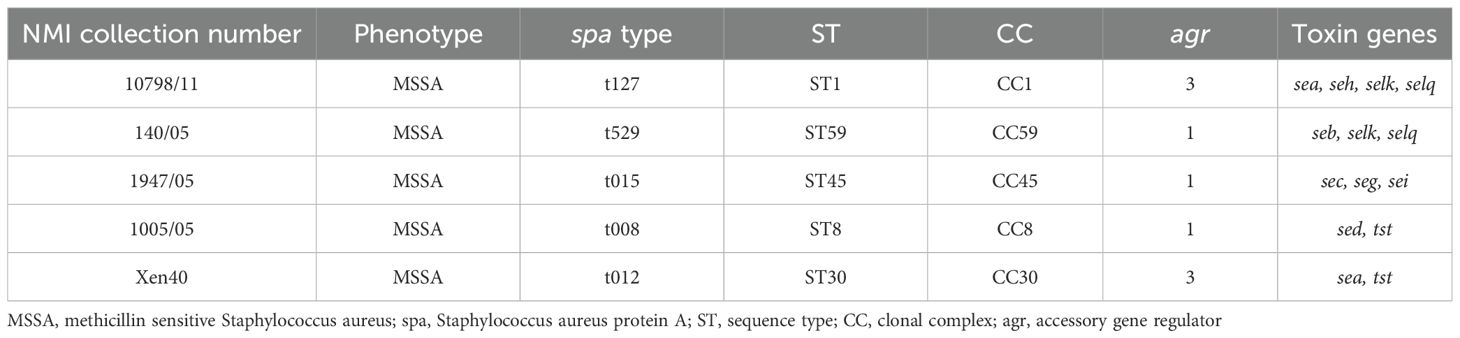
Table 1. Genetic characterization of the S. aureus strains used in the study.
2.2 Eukaryotic cell lines
The eukaryotic cell lines used in the study were (1): shFLG HaCaT, cells with reduced expression of the filaggrin gene (a line transduced with lentiviral particles containing short RNA with a “hairpin” structure (sc-43364-V, Santa Cruz) and (2), shC HaCaT, cell line with an empty vector introduced by transfection, served as control (sc-108080, Santa Cruz) (40).
2.3 Antimicrobial photodynamic inactivation
2.3.1 Light source
Illumination was performed using three custom-built LED-based lamps emitting (1) green light (λmax = 515 nm, 35 mW/cm2 irradiance; in vitro) (2), green light (λmax = 530–535 nm, 10.6 mW/cm2 irradiance; ex vivo and in vivo) and (3) red light (λmax = 632 nm, 20 mW/cm2 irradiance) (EMD Technology, Warsaw, Poland; Cezos LED modules, Gdynia, Poland). Light source characteristics were previously published (41).
2.3.2 Chemicals
Rose bengal (RB, 4,5,6,7-tetrachloro-2′,4′,5′,7′-tetraiodofluorescein disodium salt) and new methylene blue (NMB, 3,7-bis(ethylamino)-2,8-dimethylphenothiazin-5-ium chloride) (Sigma-Aldrich (Germany) were dissolved in sterile Milli-Q water, and stored in the dark at -20°C. Before use, stock solutions were thawed and diluted in sterile Milli-Q water; working solutions were stored in the dark at 4°C for up to one month.
2.3.3 Sublethal aPDI treatment for gene expression analysis
The method was previously described (42). Overnight S. aureus cultures were diluted 1:100 in fresh TSB and grown to OD600 = 0.5. Cultures (510 µL) were added to 24-well plates under four conditions (1): control (dark) (2), light only (3), photosensitizer only, and (4) aPDI (photosensitizer + light). Photosensitizers (RB: 0.2 - 0.5 µM; NMB: 5 µM) were incubated at 37°C for 10–15 min, then exposed to green (2–10 J/cm²) or red light (17.5–30 J/cm²). RNA samples were collected at 20 and 40 min post-irradiation, mixed with RNAlater, and stored at 37°C for no longer than 24 hours before isolation. Serial dilutions (10-¹ - 10-5) were plated on TSA for colony counts after 24 h. Experiments were done in triplicate.
2.3.4 RNA isolation and reverse transcription.
Total RNA was extracted using the Blood/Cell RNA Mini Kit (Syngen, Poland) with minor modifications. Bacterial pellets (from 500 µL cultures suspended in 1 mL of the RNAlater, Invitrogen, USA) after centrifugation, were lysed in a buffer (120 mM Tris-HCl (pH 8.0), 2 mM EDTA, 1.2% Triton X-100) containing lysostaphin (2U, 5µL, A&A Biotechnology, Poland). The mixture was vortexed at maximum speed for 20 seconds and incubated in a thermoblock (JWE Electronic, Poland) at 37°C for 30 minutes, with brief vortexing (15–20 seconds) every 10 minutes. Subsequent steps were carried out according to the manufacturer’s protocol. On-column DNase digestion was performed using RNase-Free DNase Set (Qiagen, Germany). RNA was eluted using 50 µL of RNase-free water. The isolated RNA was aliquoted into RNase-free Eppendorf tubes and stored at -80°C until further use.
RNA quality was checked on a 1.5% agarose gel and quantified with a NanoDrop 1000 (ThermoFisher Scientific, USA). cDNA was synthesized using the TranScriba Kit (A&A Biotechnology, Poland). In an RNase-free sterile tube, 100 ng of total bacterial RNA was mixed with 1 µL of random hexamer primers and RNase-free water to a final volume of 9.5 µL. The mixture was briefly centrifuged and incubated at 65°C for 5 minutes to denature the RNA template. Subsequently, the following reagents were added: 4 µL 5× reaction buffer, 0.5 µL RNase inhibitor, 2 µL dNTP mix, and 4 µL TranScriba enzyme. Reverse transcription was performed in a GeneAmp PCR System 9600 (Perkin-Elmer, USA) under the following conditions: 25°C for 5 min (primer annealing), 42°C for 60 min (extension), 70°C for 5 min (termination), then held at 4°C. The resulting cDNA was stored at -20°C until further analysis.
2.3.5 qPCR
Toxin gene expression was quantified via qPCR (LightCycler® 480 II) using specific primers (Table 2) and Fast SG qPCR Master Mix (EURx, Poland). Expression was normalized to stable reference genes (gmk, ftsZ for RB/green light; fabD, proC for NMB/red light) and calculated using the Pfaffl method (43), reported in log2 units. All reactions were run in triplicate, and qPCR efficiency was validated (Supplementary Table S3).
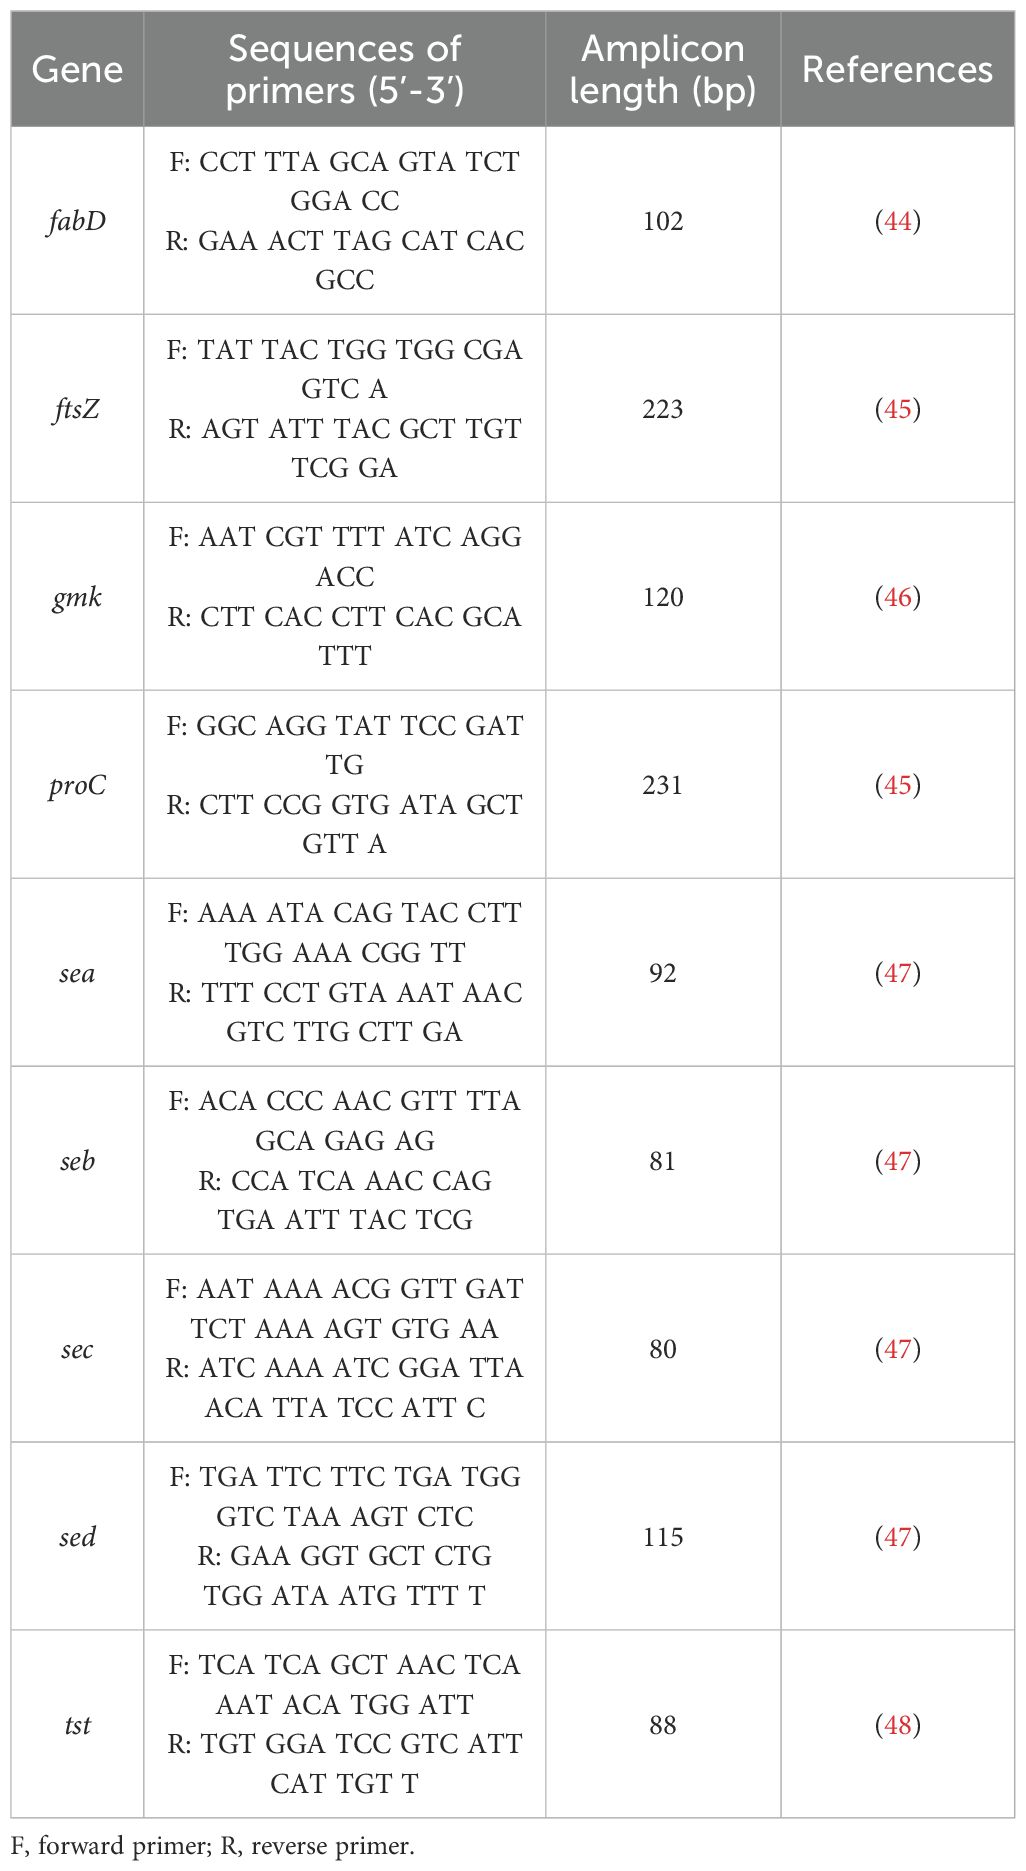
Table 2. Reference genes and target genes used in the study.
2.4 Western blot analysis of protein expression
2.4.1 Sublethal aPDI treatment and protein lysate preparation
S. aureus cultures (1:100 in TSB, grown to OD600 = 1.7–1.9) were treated under four conditions (1): untreated (2), light only (3), photosensitizer only, and (4) aPDI (photosensitizer + light). RB (0.5 µM) and NMB (200 µM) were added to groups 3 and 4, incubated (37°C, 10–15 min), then irradiated (green: 2–12 J/cm²; red: 27.5 - 32.5 J/cm²). Samples were heated (95°C, 5 min), centrifuged, and supernatants were stored at -20°C, while bacterial cell pellets were discarded.
2.4.2 Total protein concentration measurement
Total protein was measured using the RC DC™ Protein Assay (Bio-Rad) per manufacturer’s instructions. Absorbance was read at 750 nm with a SPECORD 2000 PLUS spectrophotometer.
2.4.3 SDS-PAGE and Western blot
Proteins (10 µg of total supernatant proteins) were separated on 12% SDS-PAGE alongside molecular weight markers and toxin standards. Electrophoresis was performed at 180 V for 60 min. Gels were Coomassie-stained if needed. Proteins were then transferred onto PVDF membranes (100 V, 60 min, on ice). Membranes were blocked for 30 minutes at room temperature in 30 mL TBS-Tween (TBST) containing 1% skim milk with gentle shaking. Following two washes with 30 mL of TBST, membranes were incubated overnight at 4°C with primary antibodies (anti-SEA LAI101, LOT#101314AI; anti-SEB LBI202, LOT #92514BI, anti-SEC LCI111, LOT#101012CI, anti-SED LDI303, LOT#70918DI, anti-TSST-1 LTI101, LOT#72617TI; Toxin Technology, Inc., USA) diluted 1:10,000 in TBST with 1% skim milk. After washing, membranes were incubated with HRP-conjugated AffiPure Alpaca Anti-Rabbit IgG secondary antibody (Jackson ImmunoResearch Laboratories Inc., USA) diluted 1:10,000 in the same buffer. Chemiluminescent signals were developed using Clarity Max ECL (Bio-Rad, USA) and imaged with a ChemiDoc XRS+ system (Bio-Rad, USA).
2.5 Proliferation assay
Ethical approval was granted by the Medical University of Gdańsk (NKBBN/621-574/2020). PBMCs were isolated from buffy coats of healthy donors via Lymphoprep gradient centrifugation. Cells from three donors were stained with CellTrace™ Far Red and seeded in 96-well plates (2 × 10⁵ cells/well) in RPMI-1640 with 10% FBS and antibiotics.
A mix of PBS, photosensitizer (RB: 0.5 or 5 µM; NMB: 5 µM), and staphylococcal toxin (3.2 µg/mL) was prepared. Toxins were irradiated with green (515 nm, 10–40 J/cm²) or red light (632 nm, 25 J/cm²). Controls included toxin + light, toxin + photosensitizer (dark), untreated toxin, and heat-inactivated toxin. Treated toxins (5 µL, final 80 ng/mL) were added to PBMCs; unstimulated cells served as negative controls.
After six days, cells were stained with CD3-PE, fixed, and analyzed by flow cytometry (InCyte) to assess T-cell proliferation.
2.6 ROS detection
ROS generation was assessed using HPF fluorescence in response to hydroxyl radicals. Toxins (SEA, SEB, SEC, SED, TSST-1; 3.2 µg/mL) were combined with PBS, HPF (5 µM), and photosensitizer (RB or NMB, 5 µM) in black 96-well plates. After dark incubation (RB: 10 min; NMB: 15 min), samples were irradiated (green: 515 nm, 40 J/cm²; red: 632 nm, 32.5 J/cm²). Fluorescence was recorded at 490/515 nm using an EnVision Plate Reader.
2.7 MTT assay for photo- and cytotoxicity
shFLG HaCaT and shC HaCaT cells (40) were seeded at 1 × 10⁴ cells/well in two 96-well plates (light and dark conditions) and incubated for 24 h in standard conditions. Cells were treated with RB/NMB (10–15 min, dark), washed and irradiated with:
● green light (530–535 nm, 10.6 mW/cm², 6.36 J/cm², 10 min)
● red light (632 nm, 20 mW/cm², 32.5 J/cm², 45 min)
After 24 h, cell viability was assessed using the MTT assay. Formazan absorbance (550 nm) was measured using a Victor Multilabel Plate Reader (PerkinElmer, USA). Viability (%) was expressed as a ratio of treated to untreated samples. Experiments were performed in triplicate, with four technical replicates per condition.
2.8 Ex vivo porcine skin colonization model
2.8.1 Bacterial colonization of porcine skin
Porcine skin (2 × 2 cm), prepared following Maisch et al. (49), was cleaned, disinfected, and placed on Hepes agar. Porcine skin samples were inoculated with S. aureus Xen40 (107 CFU/mL; Perkin Elmer, USA) and incubated at 37°C for 24 h, resulting in visible discoloration (Supplementary Figure S5). Four experimental conditions were tested:
1. L (–) PS (–) – untreated, dark
2. L(+) – light only
3. PS(+) – photosensitizer (PS) only
4. aPDI – PS + light
RB (35 µM, 10 µL) was applied to PS(+) and aPDI groups, followed by 30 min dark incubation. Light-treated groups were irradiated with green light (530–535 nm, 6.36 J/cm², 10 min), then incubated 40 min at 37°C.
2.8.2 RNA, protein, and bacterial viability analysis from porcine skin
Forty minutes post-aPDI, skin samples were swabbed for RNA extraction using RNAlater-moistened swabs. Swabs were incubated in a lysis buffer (20 mM Tris-HCl pH 8.0; 2mM EDTA pH 8.0; 1.2% Triton X-100) with lysostaphin (37°C, 40 min), followed by RNA isolation, cDNA synthesis, and qPCR (per Sections 2.4 & 2.5).
For protein analysis, PBS-moistened swabs were collected at 40 min and 24 h, vortexed in PBS, centrifuged (14,000; 5 min), and supernatants were transferred to sterile Eppendorf tubes and mixed with 2x Laemmli buffer, heated, and stored at -20°C. Pellets were discarded. Protein analysis followed Section 3.2 and 3.3.
Bacterial viability was assessed by plating 10-¹–10-8 serial dilutions from resuspended pellets on TSA. Colonies were counted after 24 h at 37°C.
2.9 In vivo mouse model of Staphylococcus aureus skin colonization
2.9.1 Animal model and experimental groups
The study used 8-week-old female BALB/c mice (n=36, Charles River Laboratories, Germany), under controlled conditions (22°C ± 2°C, 55% ± 5% humidity, 12-h light/dark cycle). Procedures were approved by the II Local Ethical Committee for Animal Experiments in Kraków, Poland (No. 101/2021, April 8, 2021). Mice were divided into six groups:
1. Tape-stripping only (skin repair, n=6)
2. Tape-stripping + S. aureus (n=6)
3. Tape-stripping + S. aureus + rose bengal (RB, 50 µM) (n=6)
4. Tape-stripping + S. aureus + aPDI (single treatment) (n=6)
5. Tape-stripping + S. aureus + aPDI (double treatment) (n=6)
6. Tape-stripping + S. aureus + green light (λmax=530–535 nm) (n=6)
2.9.2 Tape-stripping procedure and skin colonization
On the first day, a 2 cm² dorsal area was shaved, depilated, and subjected to 10–12 tape applications (Omnifix® Elastic, Hartmann, Germany), fresh tape each time until redness appeared, avoiding bleeding. A bioluminescent S. aureus Xen40 strain (107 CFU/mL) was applied (groups 2 - 6) under a Tegaderm™ dressing (3M™, USA) to prevent drying. Colonization was monitored via IVIS bioluminescence imaging (Perkin-Elmer, USA).
2.9.3 In vivo experimental design
For Group 1, daily observations and photographic documentation of the tape-stripped skin were performed. Daily imaging (IVIS, Perkin-Elmer, USA) was performed under isoflurane anesthesia (3 - 4% induction, 1.5 - 3% maintenance).
Treatments on day 2, included:
Group 3: RB (10 µl, 50 µM) applied for 30 min. under a foil dressing (Tegaderm™, 3M™, USA).
Groups 4 & 5: aPDI - RB (10 µl, 50 µM) applied for 30 min., followed by 10 min irradiation (Group 5 received a second treatment on day 3).
Group 6: green light (λmax=530–535 nm) exposure for 10 min.
On day 5, skin swabs (groups 2, 5, and 6) were collected for bacterial protein analysis following the ex vivo porcine skin colonization model protocol (section 7.2). Mice were euthanized, and samples were formalin-fixed, H&E stained, and examined (Olympus OlyVIA ver.3.3, Olympus Soft Imaging Solutions GmbH) for inflammation, neutrophil infiltration, and bacterial presence.
2.9.4 Bioluminescence imaging
Bioluminescence was imaged using the IVIS® Lumina III photon-counting system (PerkinElmer, Waltham, MA). Mice were anesthetized with an isoflurane/oxygen mixture and placed on an adjustable stage. Images were acquired in photon-counting mode with an exposure time of 30 s. Bioluminescence signals were quantified within defined regions of interest (ROIs) using the IVIS software and expressed in absolute units (photons·s-¹·cm-²·sr-¹).
2.10 Statistical analysis
Statistical analyzes were performed using GraphPad Prism 8 (GraphPad Software, Inc., USA, 2019). One-way analysis of variance (AVOVA) followed by Dunnett’s test for multiple comparisons was used. For all statistical tests, a p-value of < 0.05 was considered statistically significant.
3 Results
3.1 Sublethal aPDI changes the expression of staphylococcal toxin genes
The impact of antimicrobial photodynamic inactivation (aPDI) on the expression of toxin genes was assessed in four S. aureus reference strains, each carrying genes for common staphylococcal toxins: 10798/11 (sea), 140/05 (seb), 1947/05 (sec), and 1005/05 (sed and tst). Two aPDI protocols were employed: (i) rose bengal (RB) with 515 nm light and (ii) new methylene blue (NMB) with 632 nm light. The study aimed to determine whether the observed effects depend on the photosensitizer, light wavelength, or photodynamically induced oxidative stress. Bacteria were exposed to sublethal aPDI conditions, corresponding to a reduction in viable counts of approximately 0.5 log10 CFU/mL (please see Supplementary data for the details), and gene expression was quantified via qPCR.
We first determined the sublethal doses of the compound and light combination (Supplementary Figure S1, Supplementary Table S1). A significant decrease in the expression of sea, seb, sec and sed genes was observed as early as 20 minutes after the treatment, persisting for at least 40 minutes, regardless of the aPDI approach (Figure 1). For RB + green light, sea, seb, and sec expression decreased due to both aPDI and the individual impact of either RB or light, with statistical significance observed only for sea. In contrast, NMB + red light significantly downregulated sea, seb, and sec expression, though red light alone produced variable effects, including both increases (sec) and decreases (seb, sed).

Figure 1. Changes in the expression of staphylococcal toxin genes after sublethal aPDI treatment: relative expression level of sea, seb, sec, sed and tsst-1 toxin genes after sublethal aPDI treatment. The experiment was performed with either rose bengal (RB) with green light or new methylene blue (NMB) with red light. Significance at respective p-values is marked with asterisks [*p < 0.05; **p < 0.01; ***p < 0.001; ****p < 0.0001] with respect to untreated cells (0 J/cm2, 0 µM RB/NMB). Error bars represent the standard error of the mean. L(+), bacterial cell treated with light alone (green λmax=515 nm/red λmax=632 nm); PS(+), cells treated with RB or NMB alone in the dark; aPDI, bacterial cells treated with RB and green light or NMB and red light; t20 and t40, the time points after the irradiation process at which samples were collected.
A distinct expression pattern was observed for tst. Unlike the other toxin genes, tst expression increased following aPDI, independent of the photosensitizer or light source. Notably, neither RB nor green light alone altered the tst expression, while both red light and NMB alone significantly reduced its expression (Figure 1). This suggests that tst upregulation is directly linked to the photodynamic action rather than to the individual treatment components.
The results demonstrate that aPDI significantly influences toxin gene expression, with effects varying by gene and, to a lesser extent, by the aPDI conditions. This suggests that photogenerated oxidative stress differentially affects gene expression. However, the underlying mechanisms driving these gene-specific responses to photooxidative stress under different aPDI conditions require further investigation.
3.2 aPDI inactivates staphylococcal toxin superantigenic function
We then analyzed the effect of aPDI on SEs at the protein level (Supplementary Figure S2, Supplementary Table S2). Within the limits of our semi-quantitative Western blot analysis, aPDI treatment did not reveal consistent changes in SE protein levels at any time point (Supplementary Figure S2). Therefore, we shifted our focus to evaluating its impact on the biological activity of the staphylococcal toxins, particularly their superantigen (SAg) function, which induces T-cell proliferation and cytokine release. The activity of the toxin was assessed using the T-cell proliferation assay. The optimal concentration of the toxin for effective T-cell stimulation was determined to be 80 ng/mL, inducing proliferation in 77% of T-cells (Figure 2A). Toxins were treated with: RB and green light or NMB and red light under sublethal (0.5 - 5 µM, 12–32 J/cm²) or lethal (5 µM, 40 J/cm²) conditions. aPDI-treated toxins were then incubated with PBMCs, and T-cell proliferation was measured with light or photosensitizers alone serving as controls.
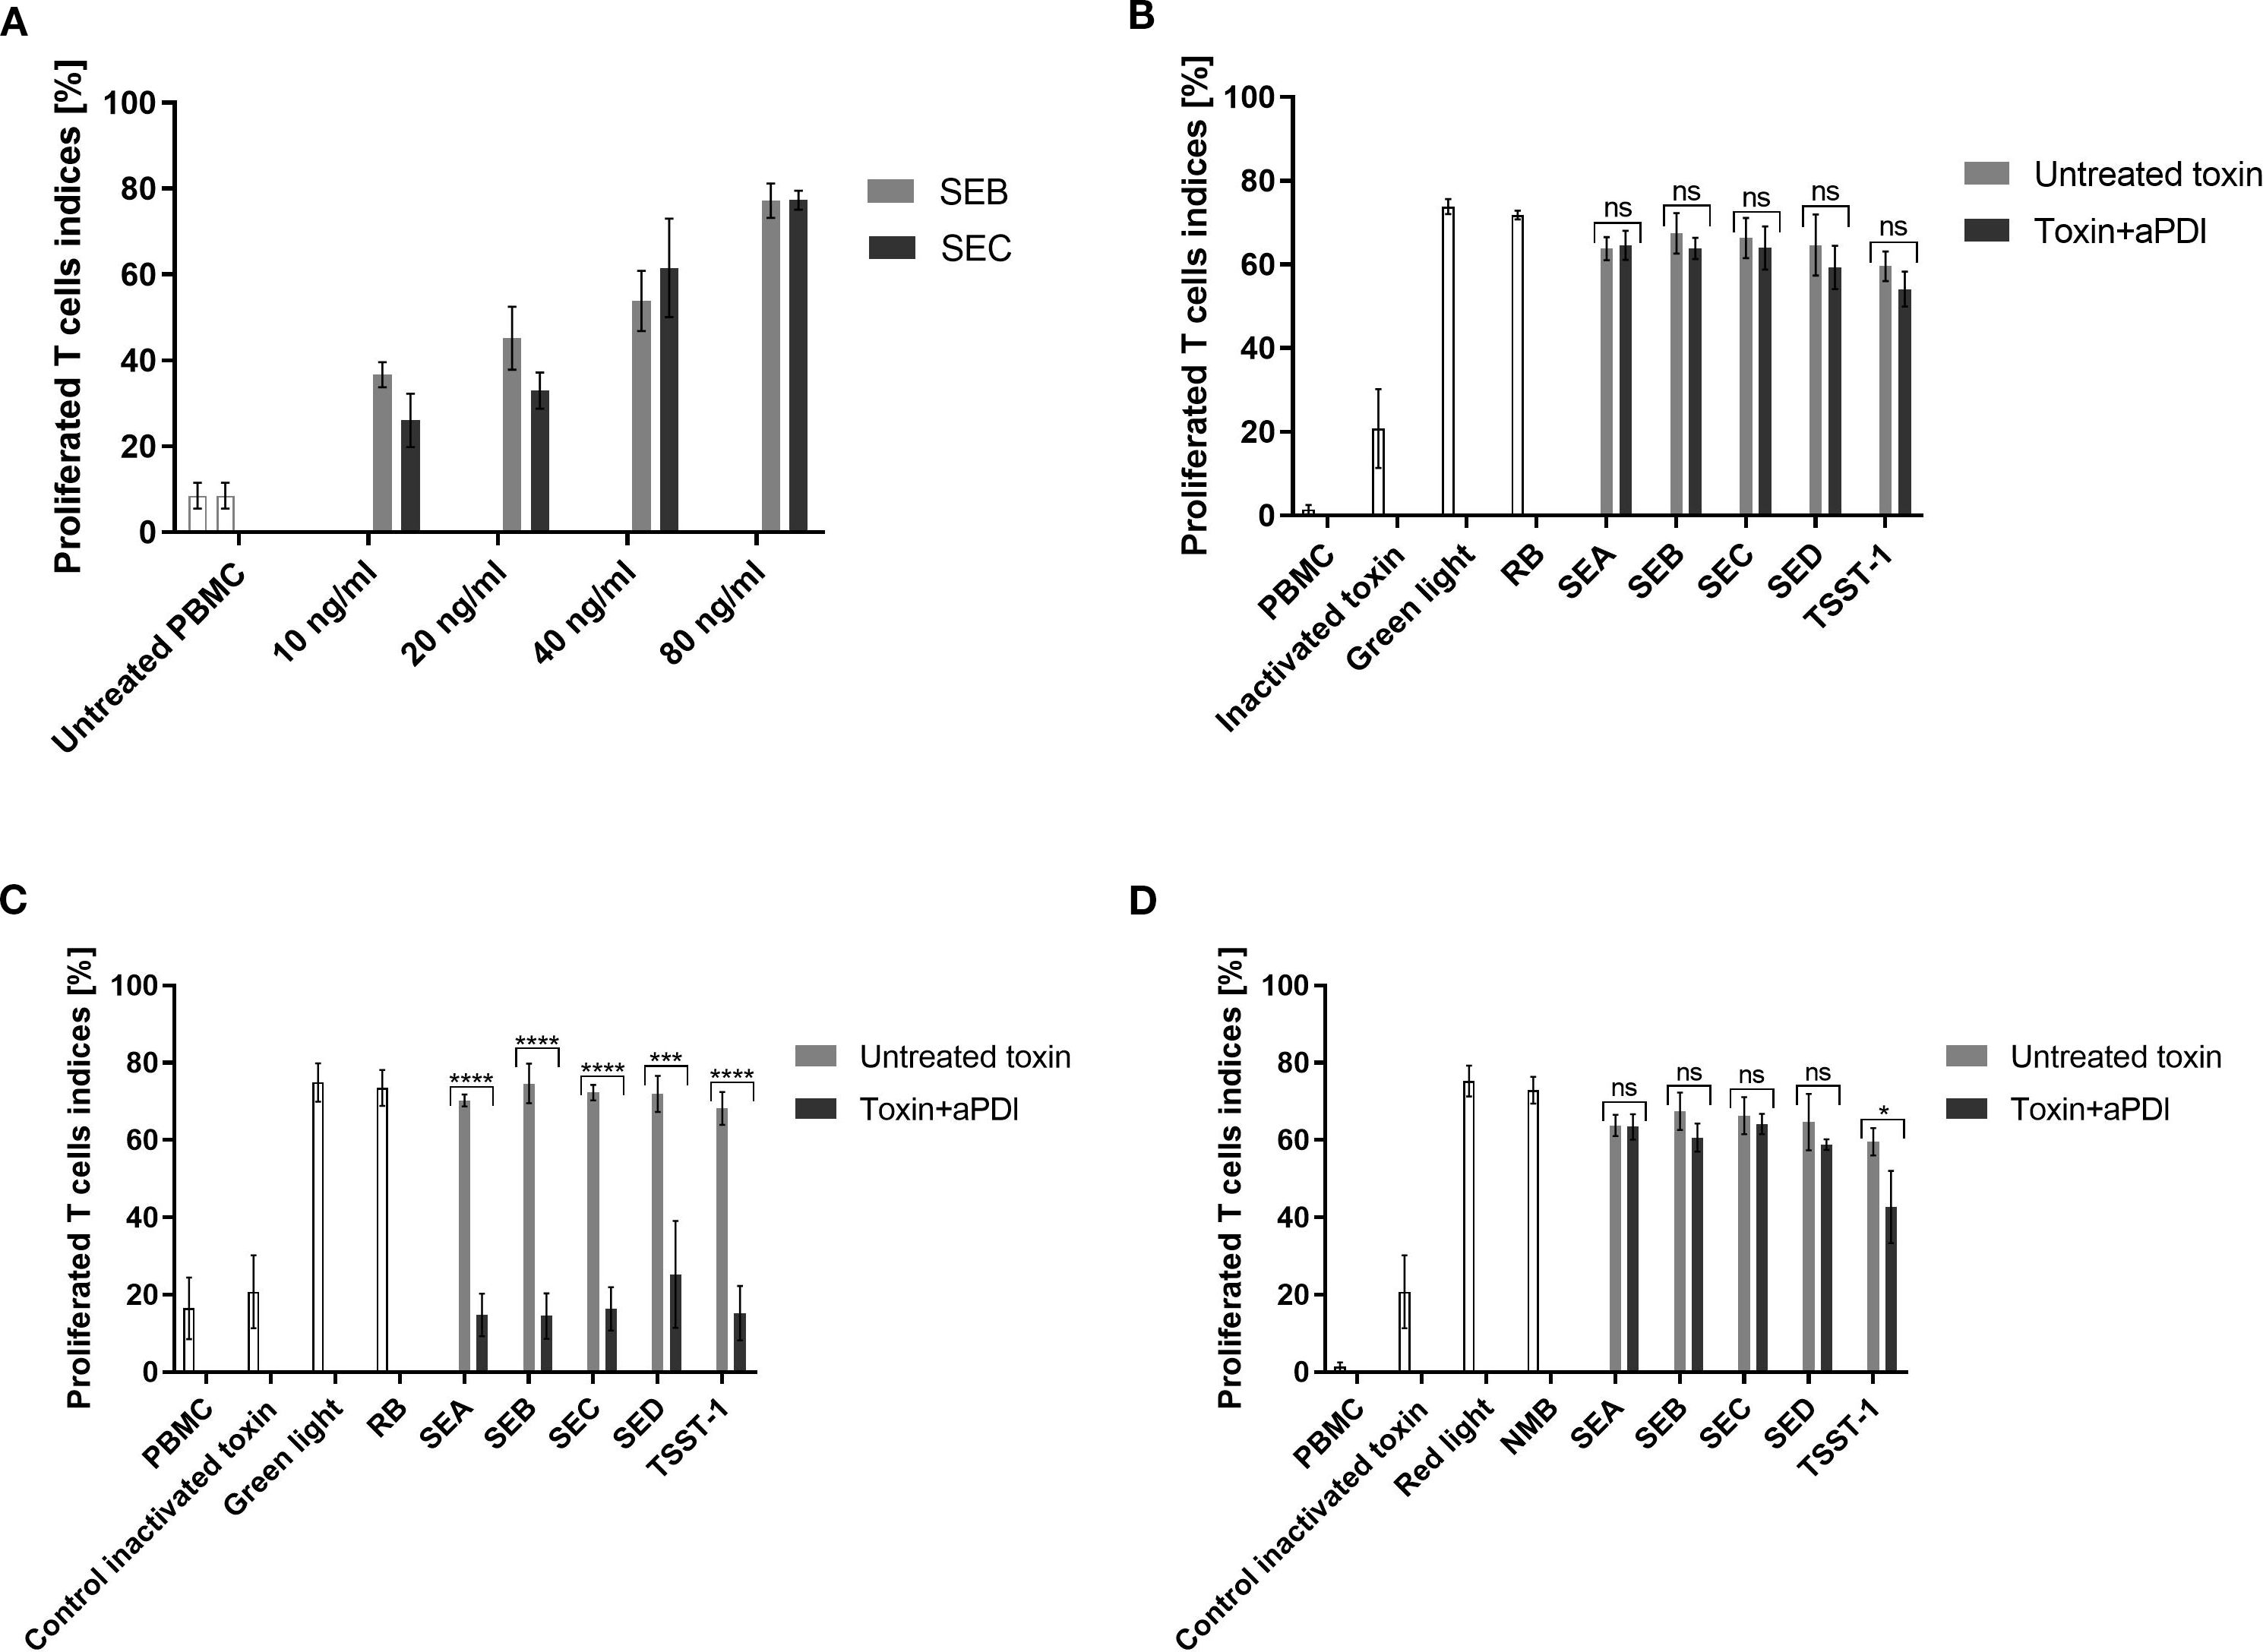
Figure 2. T-cell proliferation assay evaluating toxin activity following aPDI treatment. (A) Dose-response curve showing T-cell proliferation induced by staphylococcal toxins. Bars represent mean proliferation indices from three independent donors; error bars indicate standard deviation (SD). Prior to incubation with peripheral blood mononuclear cells (PBMC), toxins were treated as follows: (B) sublethal aPDI using rose bengal (RB, 0.5 µM) and green light (515 nm, 35 mW/cm², 12 J/cm²); (C) lethal aPDI using RB (5 µM) and green light (515 nm, 35 mW/cm², 40 J/cm²); (D) sublethal aPDI using new methylene blue (NMB, 5 µM) and red light (632 nm, 20 mW/cm², 32.5 J/cm²). Bars represent means ± SD from three donors. Significance at respective p-values is marked with asterisks: *p < 0.05; ***p < 0.001; ****p < 0.0001. Toxin controls include heat-inactivated samples (heated at 95°C for 5 min), samples treated with light only (Green light/Red light), samples treated with photosensitizer only (RB/NMB). Toxin designations (SEA, SEB, SEC, SED, TSST-1) refer to proteins treated with antimicrobial photodynamic inactivation (aPDI). ns, non significant.
The impact of aPDI on toxin activity varied depending on the photosensitizer and treatment conditions. RB + green light demonstrated potent toxin inactivation under lethal conditions, reducing T-cell proliferation to near-background levels (SEA: 14.8%, SEB: 14.5%, SEC: 16.4%, SED: 25.3%, TSST-1: 15.2%) (Figure 2C). In contrast, sublethal RB treatment had no discernible effect, and neither RB nor green light alone altered toxin activity (Figure 2B).
NMB + red light under sublethal conditions, in contrast, was less effective:. Only TSST-1 showed partial reduction (42.7%) while other toxins remained active (Figure 2D). Stronger NMB-aPDI conditions were not tested due to phototoxicity toward eukaryotic cells.
3.3 aPDI treatment results in ROS generation
To test ROS generation in our experimental conditions following aPDI treatment, specific probes were employed to detect hydroxyl radicals (•OH). As anticipated, both aPDI treatments; RB + green light and NMB + red light resulted in significant ROS production (Figures 3A, B). The fluorescence signal intensity was higher for the NMB + red treatment (~80,000 relative units, RU) compared to RB + green (~50,000 RU) combination. Notably, we did not detect any ROS generation with purified enterotoxins alone (Figures 3A, B). Similarly, the results obtained from the dark incubation for both conditions confirmed no ROS production (Supplementary Figure S3, Supplementary Figure S4).
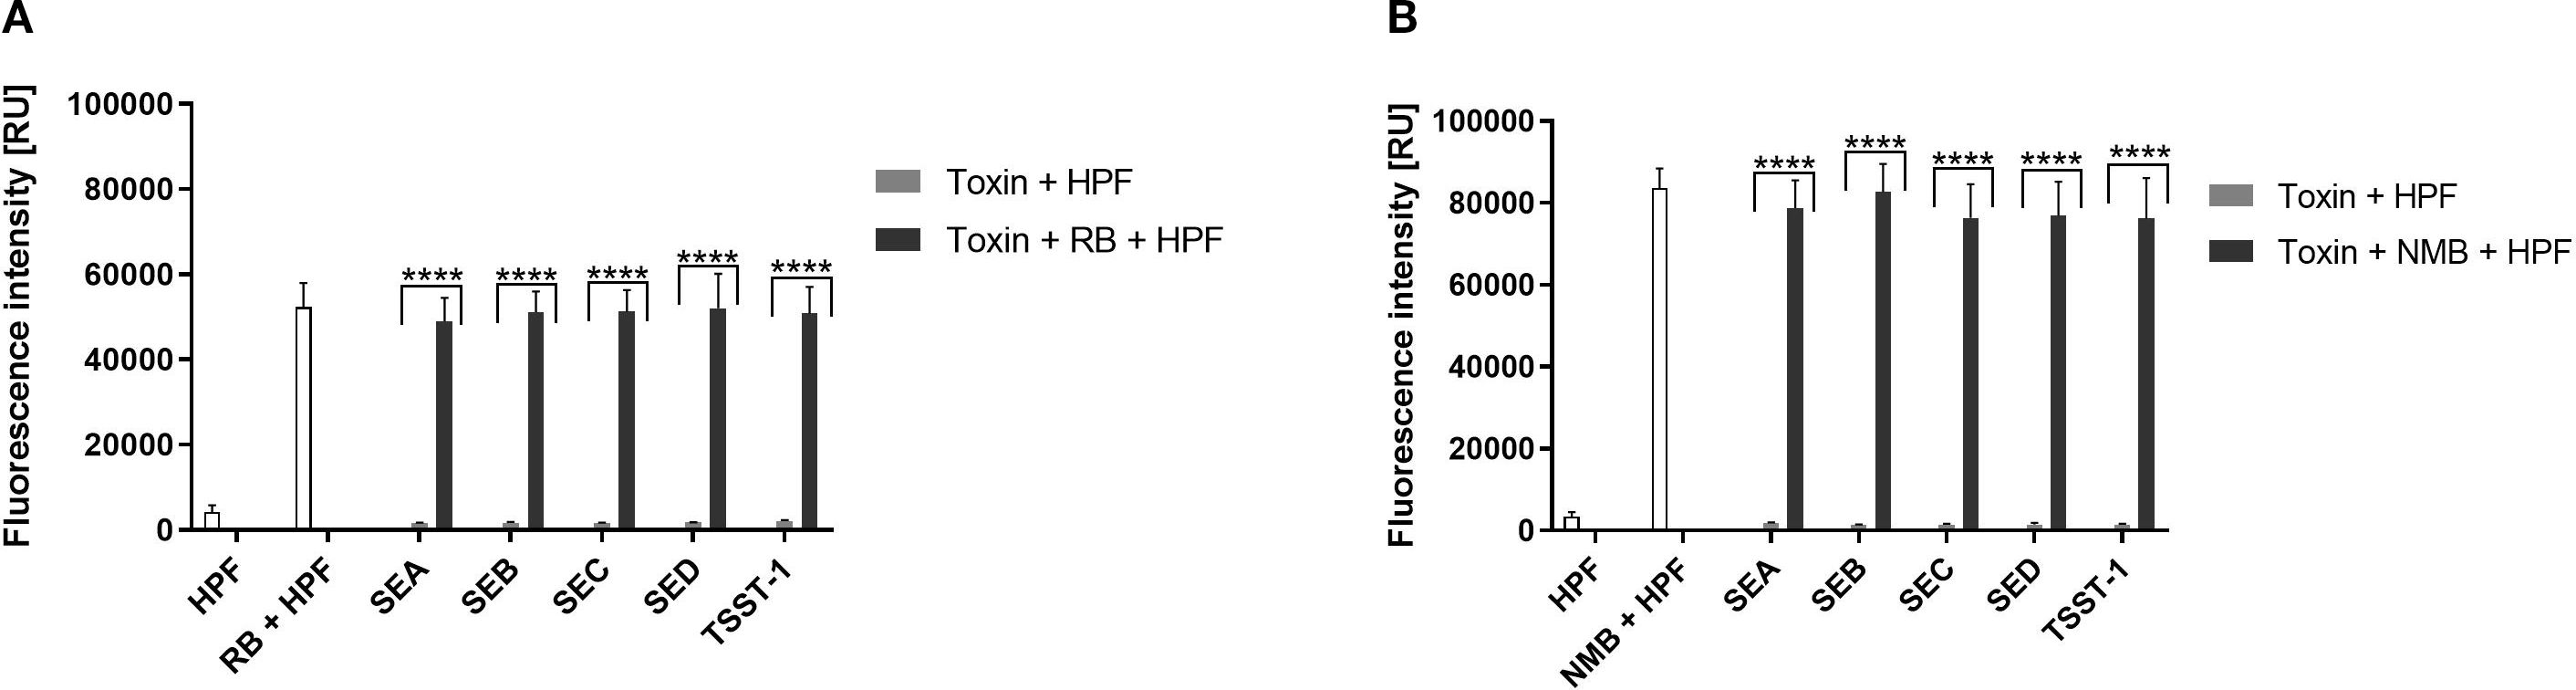
Figure 3. Detection of Reactive Oxygen Species (ROS). (A) RB + green light: Cell-free suspensions containing purified staphylococcal enterotoxins (SEA, SEB, SEC SED, TSST-1) and/or rose bengal (RB, 5 µM) were incubated with ROS-sensitive fluorescent probe hydroxyphenyl fluorescein (HPF, 5 µM) to detect hydroxyl radicals (·OH) upon irradiation with green light (λmax = 515 nm, 35 mW/cm², 40 J/cm²). Data are presented as the mean ± standard deviation (SD) from three independent experiments. (B) NMB + red light: Cell-free suspensions containing purified enterotoxins and/or new methylene blue (NMB, 5 µM) were incubated with HPF (5 µM) for detection of hydroxyl radicals (·OH) following irradiation with red light (λmax = 632 nm, 20 mW/cm², 32.5 J/cm²). Data are presented as the mean ± SD from three independent experiments. Fluorescence intensity is reported in relative units (RU).
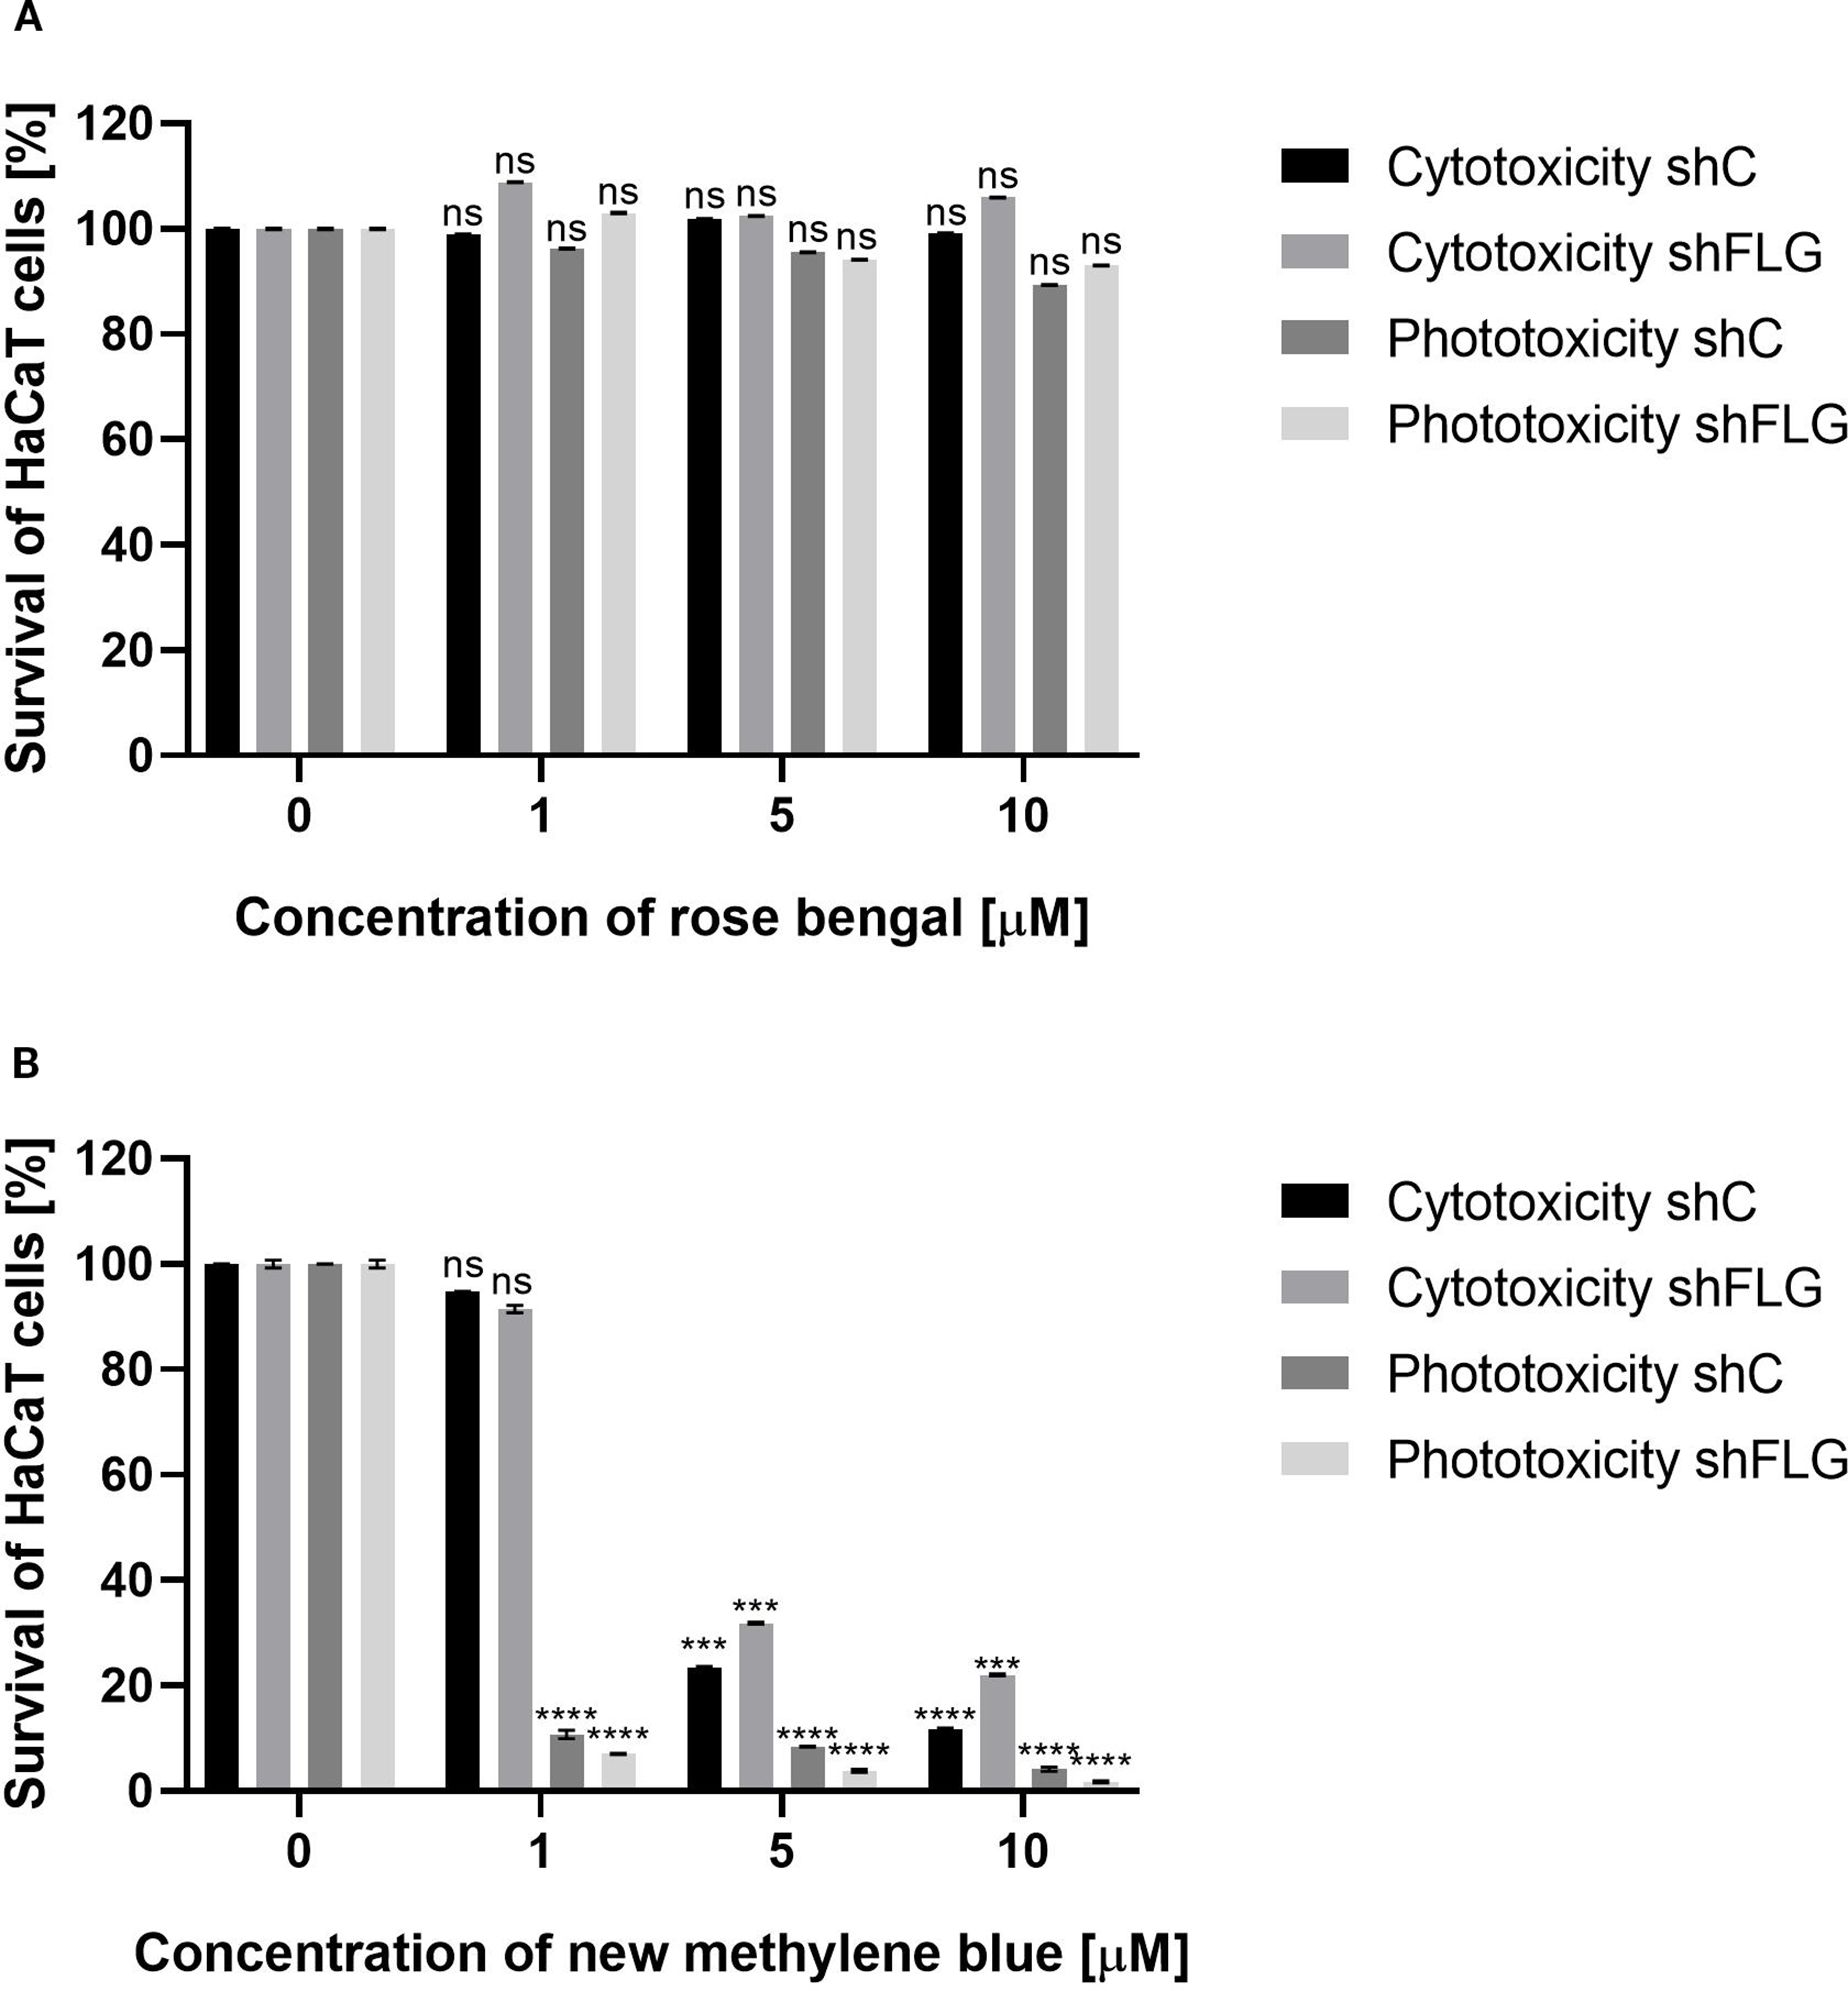
Figure 4. HaCaT cell viability assay. (A) Two cell lines – shC HaCaT and shFLG HaCaT keratinocytes were treated with rose bengal (RB) and exposed to green light (λmax=515 nm, irradiance 35 mW/cm2, light dose 40 J/cm2) to test phototoxicity, or kept in the dark to test cytotoxicity. (B) The same cell lines were treated with new methylene blue (NMB) and red light (λmax=632 nm, irradiance 20 mW/cm2, light dose 32.5 J/cm2), or kept in the dark. In both experiments, cells (1×10⁴/well) were incubated with increasing photosensitizer concentrations. Untreated cells (0 µM) served as controls. Bars show mean ± SD from three independent experiments. Significant differences vs. control are marked (***p < 0.0001; ****p < 0.0001; ns, non significant).
3.4 aPDI treatment is safe to human epidermal keratinocytes
Next, we evaluated the impact of aPDI on human epidermal keratinocytes (HaCaT). The analysis included HaCaT cells with a knockdown of the FLG gene, which encodes profilaggrin, a crucial protein involved in the maintenance of the epidermal barrier (shFLG HaCaTs). The filaggrin insufficient keratinocytes used in this study served as an in vitro model of AD, since filaggrin insufficiency (either on genetic background or acquired, including a vicious loop between filaggrin reduction and S. aureus colonization) leads to the impairment in epidermal barrier quality is one of the disease hallmarks (50). As a control cell line transduced with an empty vector was used (shC HaCaT). The primary objective of this experiment was to determine whether the FLG knockdown significantly affects the survival of aPDI-treated eukaryotic cells.
MTT assay results demonstrated that the combination of RB with green light (λmax = 515 nm) exhibited no cytotoxic effects on any of the tested cell lines. Cell viability remained high even at the highest RB concentration (10 μM) in the combination with light treatment: 89.3% for shC HaCaT and 93% for shFLG HaCaT cells. Furthermore, treatment with RB alone did not affect cell survival, with the viability values of 99.1% for shC HaCaTs and 106% for shFLG HaCaTs at 10 μM RB (Figure 4A).
A very different picture was observed for the combination of NMB with red light (λmax = 632 nm). Exposure to red light with 1 μM NMB resulted in significant cell death, with survival rates of only 10.7% (shC HaCaT) and 7.1% (shFLG HaCaT). In contrast, cells incubated with NMB in the dark showed no cytotoxicity (shC HaCaT – 94.8%, shFLG HaCaT – 91.4%). A strong photo- and cytotoxic effect was observed for both tested HaCaT cell lines at 5 μM NMB (Figure 4B). The observed cytotoxic and/or phototoxic effect or lack thereof depends on the PS used in the photodynamic reaction.
3.5 aPDI decreases transcript and protein levels of SEA in an ex vivo porcine skin model
We next verified the results obtained in vitro in an ex vivo model, using porcine skin, The primary objectives of this experiment were to assess SEA toxin production at the transcript and protein levels under aPDI. Porcine skin was chosen due to its structural and physiological similarity to human skin and its availability (Supplementary Figure S5) (51). A higher RB concentration (35 µM) was used compared to in vitro studies due to the limited photosensitizer penetration into the skin and bacterial aggregates hindering binding (49). To evaluate the safety of this approach, we analyzed the cyto- and phototoxicity of RB at higher concentrations and observed some cytotoxic effects (Supplementary Figure S6). Nevertheless, higher concentrations were employed because, in ex vivo and in vivo settings, bacteria are expected to form more resistant biofilm structures that are typically less susceptible to aPDI. The experiment involved colonizing porcine skin with S. aureus Xen40 strain, followed by RB application (35 µM) for 30 min, and subsequent green light irradiation (λmax = 530–535 nm, 6.36 J/cm², 10 min). S. aureus Xen40 has the sea gene and produces active SEA protein.
Survival of the Staphylococcus aureus Xen40 strain was evaluated at 40 minutes and 24 hours following aPDI. Quantification of bacterial viability revealed a time-dependent reduction in colony-forming units, with decreases of 0.56 log10 CFU/mL and 1.22 log10 CFU/mL, respectively (Figure 5B), indicating a sustained bactericidal effect. The presence of staphylococcal enterotoxin A was confirmed in skin swabs by both PCR and Western blot analysis. Transcriptomic analysis showed a significant downregulation of sea gene expression following aPDI treatment, with a reduction of 2.92 log2 units (Figure 5C). Interestingly, exposure to green light alone also resulted in a notable decrease in sea expression (2.14 log2 units), suggesting a potential sub-lethal stress response. In contrast, treatment with RB alone led to a significant upregulation of sea gene expression, indicating that RB in the absence of light may act as a stressor that induces virulence factor expression. Interestingly, a different effect of gene expression was observed after treatment with RB in an in vitro planktonic culture and in an ex vivo porcine skin colonization model. In the in vitro environment, RB treatment resulted in decreased expression of sea, suggesting a possible antimicrobial or stress suppressive effect in a simplified, nutrient-controlled environment. However, in a more complex ex vivo model, RB treatment resulted in increased sea expression, suggesting that the interaction between bacterial cells and the host-like environment can modulate the expression of virulence genes in different ways.
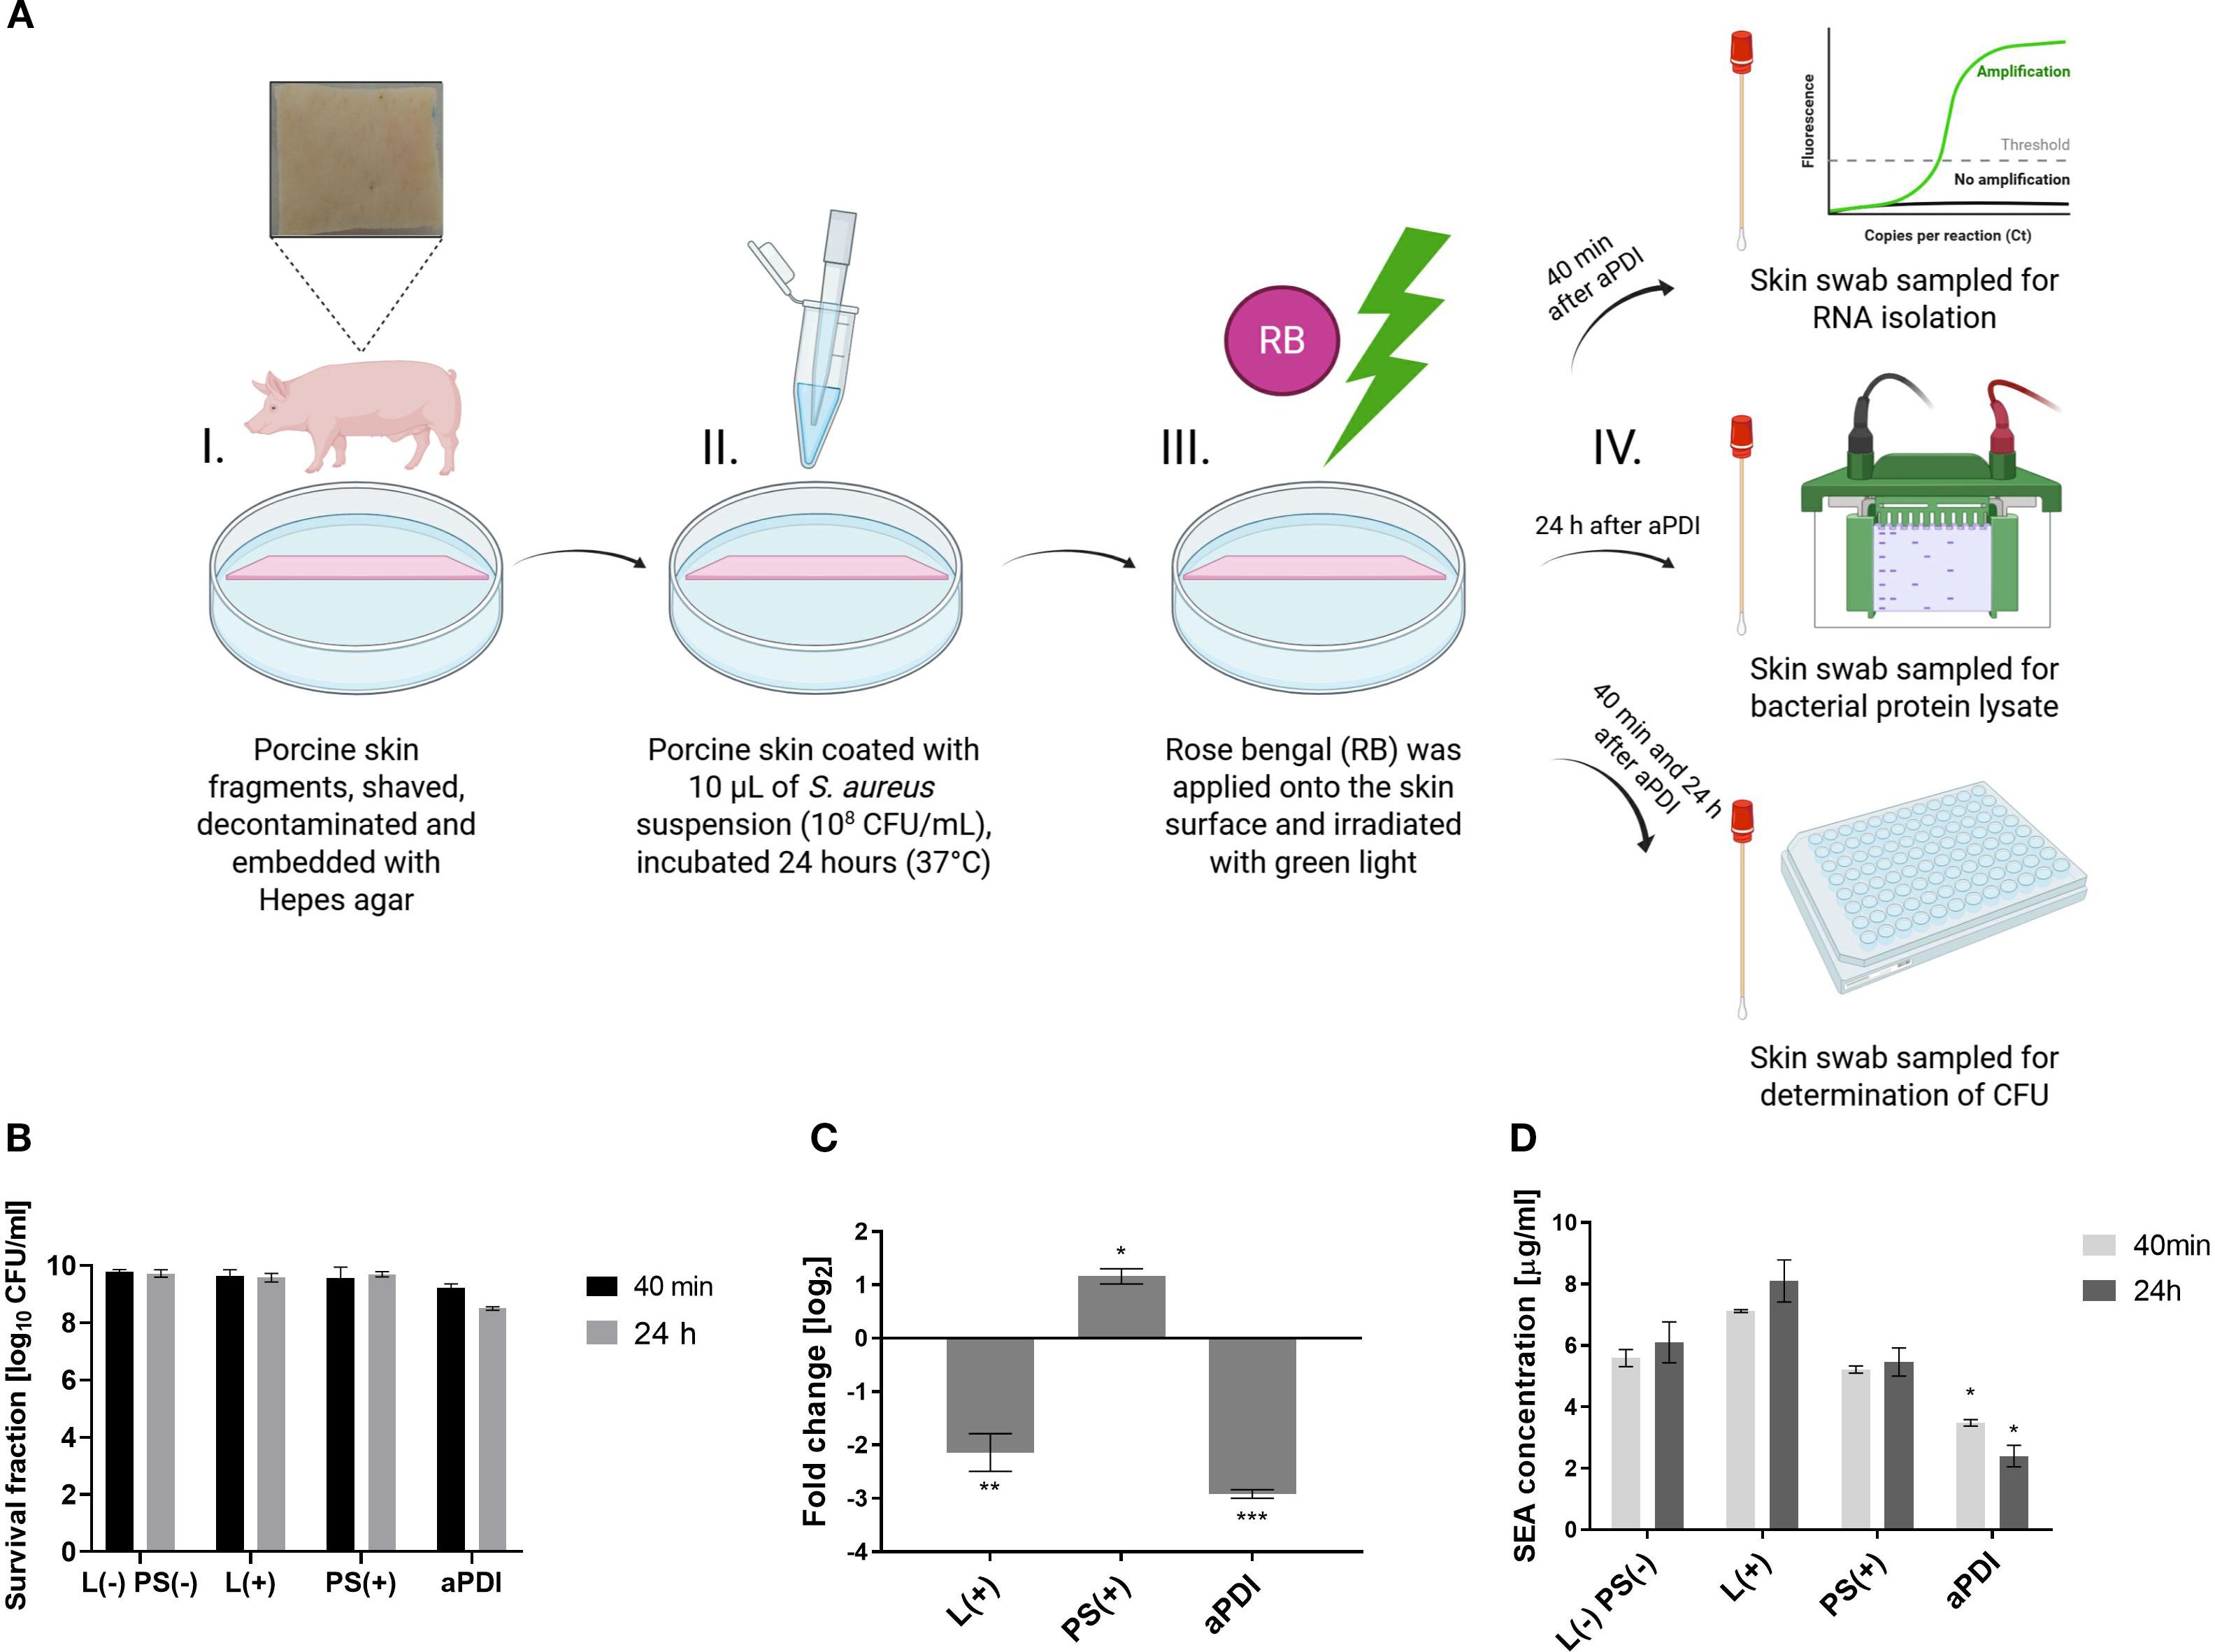
Figure 5. Changes in the SEA toxin levels following aPDI treatment in an ex vivo porcine skin colonization model. (A) Experimental design - antimicrobial photodynamic inactivation (aPDI) was applied to an ex vivo porcine skin model. Illustration created with BioRender. (B) Bacterial survival following sublethal aPDI. Values represent the mean log10CFU/mL ± SD from three independent biological experiments. (C) Relative expression of the sea enterotoxin gene after aPDI treatment: Statistical significance compared to untreated cells (0 J/cm2, 0 µM photosensitizer [PS]) is indicated by asterisks: *p < 0.05; **p < 0.01; ***p < 0.001. Error bars represent the standard error of the mean (SEM). (D) SEA protein concentrations after aPDI: Each bar represents the mean ± SEM from three independent biological replicates. Statistical significance compared to untreated cells is indicated by *p < 0.05. Samples were collected at two time points: 40 min, 24 hours post-aPDI. Treatment groups included: L (–) PS (–), untreated bacterial cells kept in the dark (0 J/cm2, 0 µM rose bengal [RB]); L(+),cells exposed to green light only (λmax=530–535 nm, 10.6 mW/cm2, 6.36 J/cm2, 10 min); PS(+),cells treated with RB (35 µM) and kept in the dark; aPDI, cells treated with both RB and green light.
To further assess the impact of aPDI on enterotoxin production, SEA protein levels were quantified at 40 minutes and 24 hours post-treatment using Western blot analysis. aPDI significantly reduced SEA concentrations compared to untreated controls, with levels decreasing from 5.59 µg/mL to 3.48 µg/mL at 40 minutes, and from 6.10 µg/mL to 2.41 µg/mL at 24 hours (Figure 5D). In contrast, treatment with either AD or green light alone did not result in a significant reduction in SEA protein levels, suggesting that the photodynamic activation of RB is essential for the observed effect. Importantly, results from the porcine skin colonization model corroborated the in vitro findings, demonstrating consistent reductions in SEA expression at both the transcript and protein levels following aPDI treatment. These data reinforce the potential of aPDI as an effective approach not only for bacterial inactivation but also for mitigating toxin-mediated virulence.
3.6 aPDI reduces S. aureus survival and SEA toxin level in a mouse model of bacterial skin colonization
In this study, a tape-stripping model was used, this model effectively induces local inflammation by disrupting skin barrier, mimicking atopic skin conditions (52, 53). Previously published in vivo studies on aPDI efficacy involved skin wounding and bacterial application to the deeper layers, which does not accurately reflect natural colonization (54). Here, we colonized mechanically damaged mouse skin with bioluminescent S. aureus Xen40 to follow its fate after aPDI and identify the presence of staphylococcal enterotoxin A during colonization.
Schematic representation of in vivo experimental setup is shown in Supplementary Figure S7 (Supplementary data). In group 1 (tape-stripping only), skin redness and irritation were observed on day 1, followed by visible healing by day 3 and complete recovery by day 5 (Figure 6A). However, in S. aureus-colonized skin (group 2), no such healing occurred, indicating that bacterial colonization negatively affects skin condition and delays the healing process (Supplementary Figure S8). Both single (group 4) and repeated (group 5) aPDI treatments resulted in a statistically significant reduction in S. aureus presence on the skin, as evidenced by decreased bioluminescence signals (Figure 6A, B). Although RB alone (without light activation) produced a transient reduction in S. aureus signal at day 3, this effect was not sustained over time. Such acute, short-term decreases in bacterial load are occasionally observed in aPDI studies, but durable clearance or inhibition of regrowth typically requires both the photosensitizer and light.
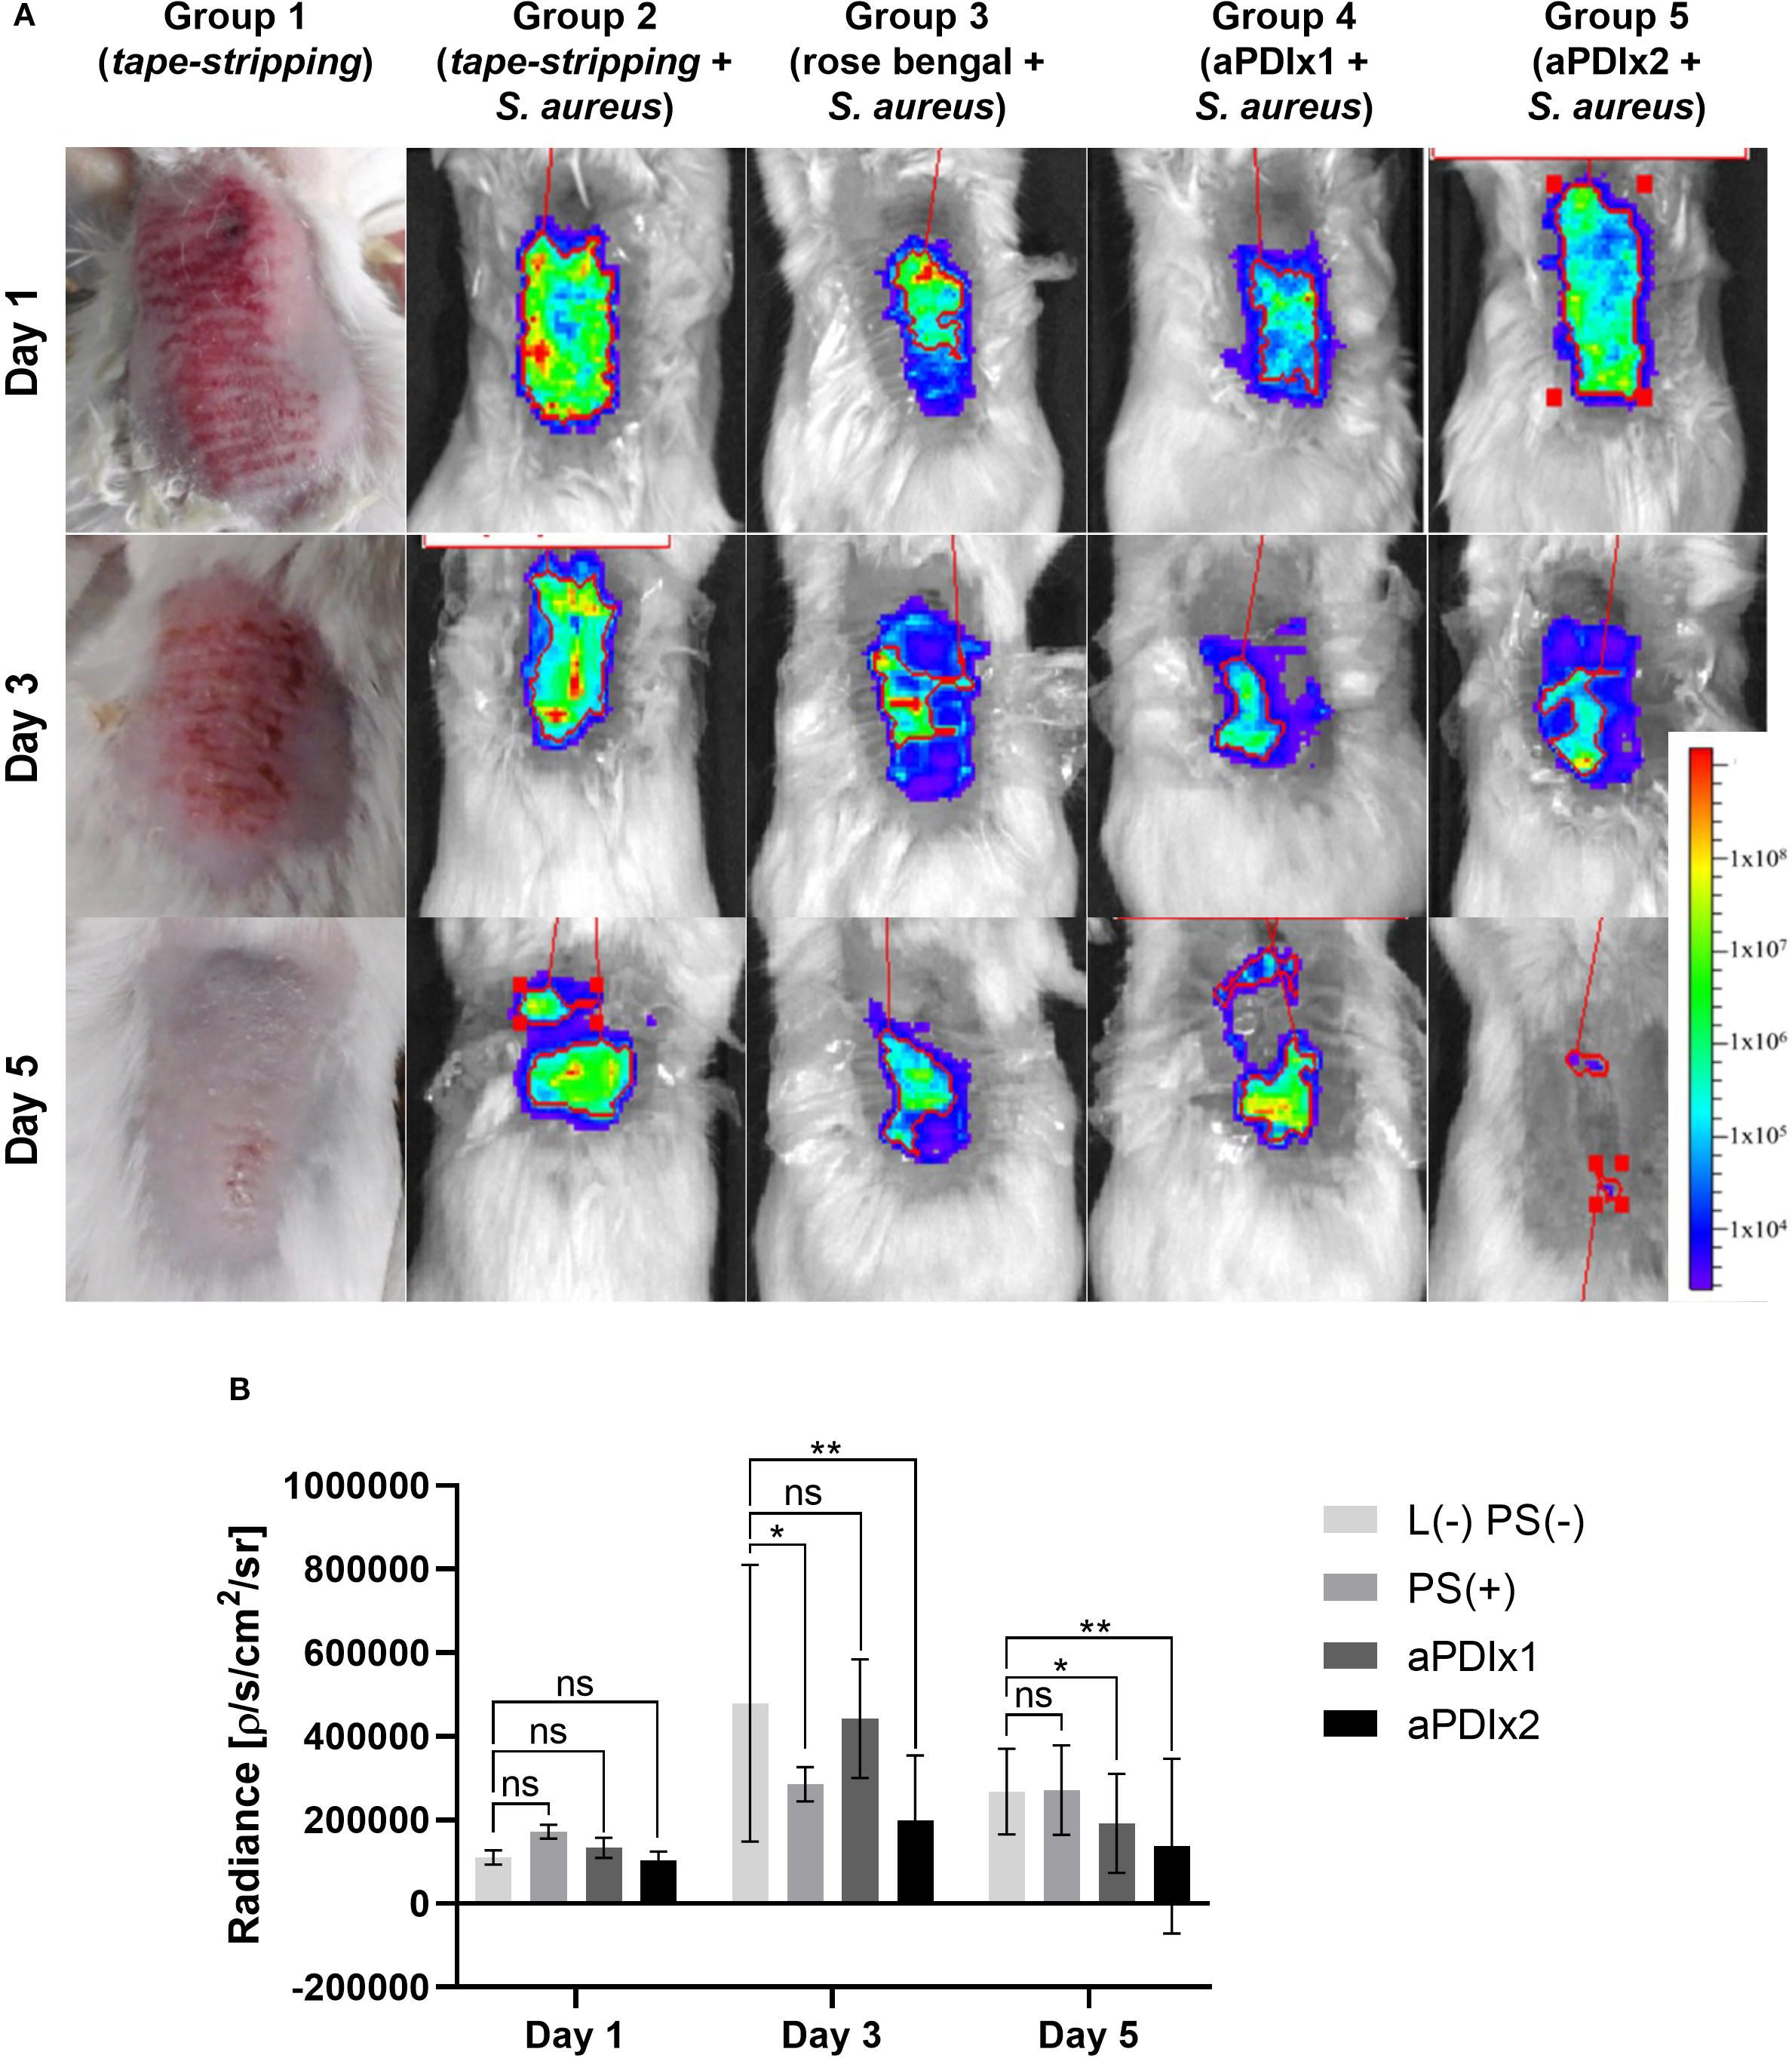
Figure 6. Bioluminescence monitoring of S. aureus colonization in a mouse model. (A) Representative bioluminescence images of S. aureus colonization in mouse skin are shown for one mouse per experimental group. The bioluminescent signal, expressed as photon/second/cm2/steradian (p/s/cm2/sr), reflects presence of metabolically active bacterial cells. Group 1 illustrates the visual appearance of tape-stripped mouse skin. Group 2 represents tape-stripped mice colonized S. aureus. Group 3 includes tape-stripped, S. aureus-colonized mice treated with rose bengal (50 µM) applied to the skin. Group 4 consists of S. aureus-colonized mice subjected to a single aPDI session (λmax=530–535 nm, 10.6 mW/cm2, 6.36 J/cm2, 50 µM RB). Group 5 represents S. aureus-colonized mice receiving two aPDI treatments under the same conditions (λmax=530–535 nm, 10.6 mW/cm2, 6.36 J/cm2, 50 µM RB). (B) Quantification of total bioluminescence from the ROI (Region Of Interest) on S. aureus-colonized skin. The signal is expressed as a photon/second/cm2/steradian (p/s/cm2/sr). Each bar represents the mean bioluminescence value from six mice per group, with error bars indicating the standard error of the mean (SEM). Statistical significance compared to the control group (tape-stripped, S. aureus-colonized mice) is indicated as p < 0.05 (*); p < 0.01 (**). L (–) PS (–), tape-stripped, S. aureus-colonized; PS(+), tape-stripped, S. aureus-colonized mice treated with rose bengal (50 µM); aPDIx1, tape-stripped, S. aureus-colonized mice treated with a single aPDI session (50 µM RB, 10.6 mW/cm2, 6.36 J/cm2); aPDIx2, tape-stripped, S. aureus-colonized mice treated with two aPDI sessions (50 µM RB, 10.6 mW/cm2, 6.36 J/cm2). ns, non significant.
Histopathological evaluation of mouse skin revealed distinct tissue responses across experimental groups. In the tape-stripping group (Figure 7A), inflammation was evident in the form of exudate with abundant neutrophilic infiltration confined to the epidermis, accompanied by clear evidence of epidermal regeneration, confirming ongoing re-epithelialization. In contrast, mice subjected to tape-stripping followed by colonization with S. aureus (Figure 7B), exhibited severe pathological alterations. The epidermis was absent, and dense bacterial aggregates were observed on the skin surface. A pronounced neutrophilic infiltrate extended beyond the dermis into subcutaneous adipose tissue and underlying musculature, indicating a robust and deep-seated inflammatory response. Exposure to green light alone (Figure 7C) or topical application of RB at a high concentration (50 µM, Figure 7D) did not induce additional pathological changes or exacerbate inflammation. No blistering was observed in the group exposed only to light. However, the loss of Tegaderm dressings during the experiment led to increased mechanical irritation and drying of the wounds, which explains the different appearance of the skin in this group. Notably, skin samples from mice treated with a single (Figure 7E) or double (Figure 7F) aPDI showed no separation of the epidermis from the dermis. In both aPDI-treated groups, neutrophilic infiltration was present in the dermis, with no consistent reduction in neutrophil numbers between single and double treatments. Nevertheless, the inflammatory response remained adequate to control bacterial colonization. These findings suggest that both single and double aPDI treatments are histologically safe and do not aggravate preexisting tissue damage.
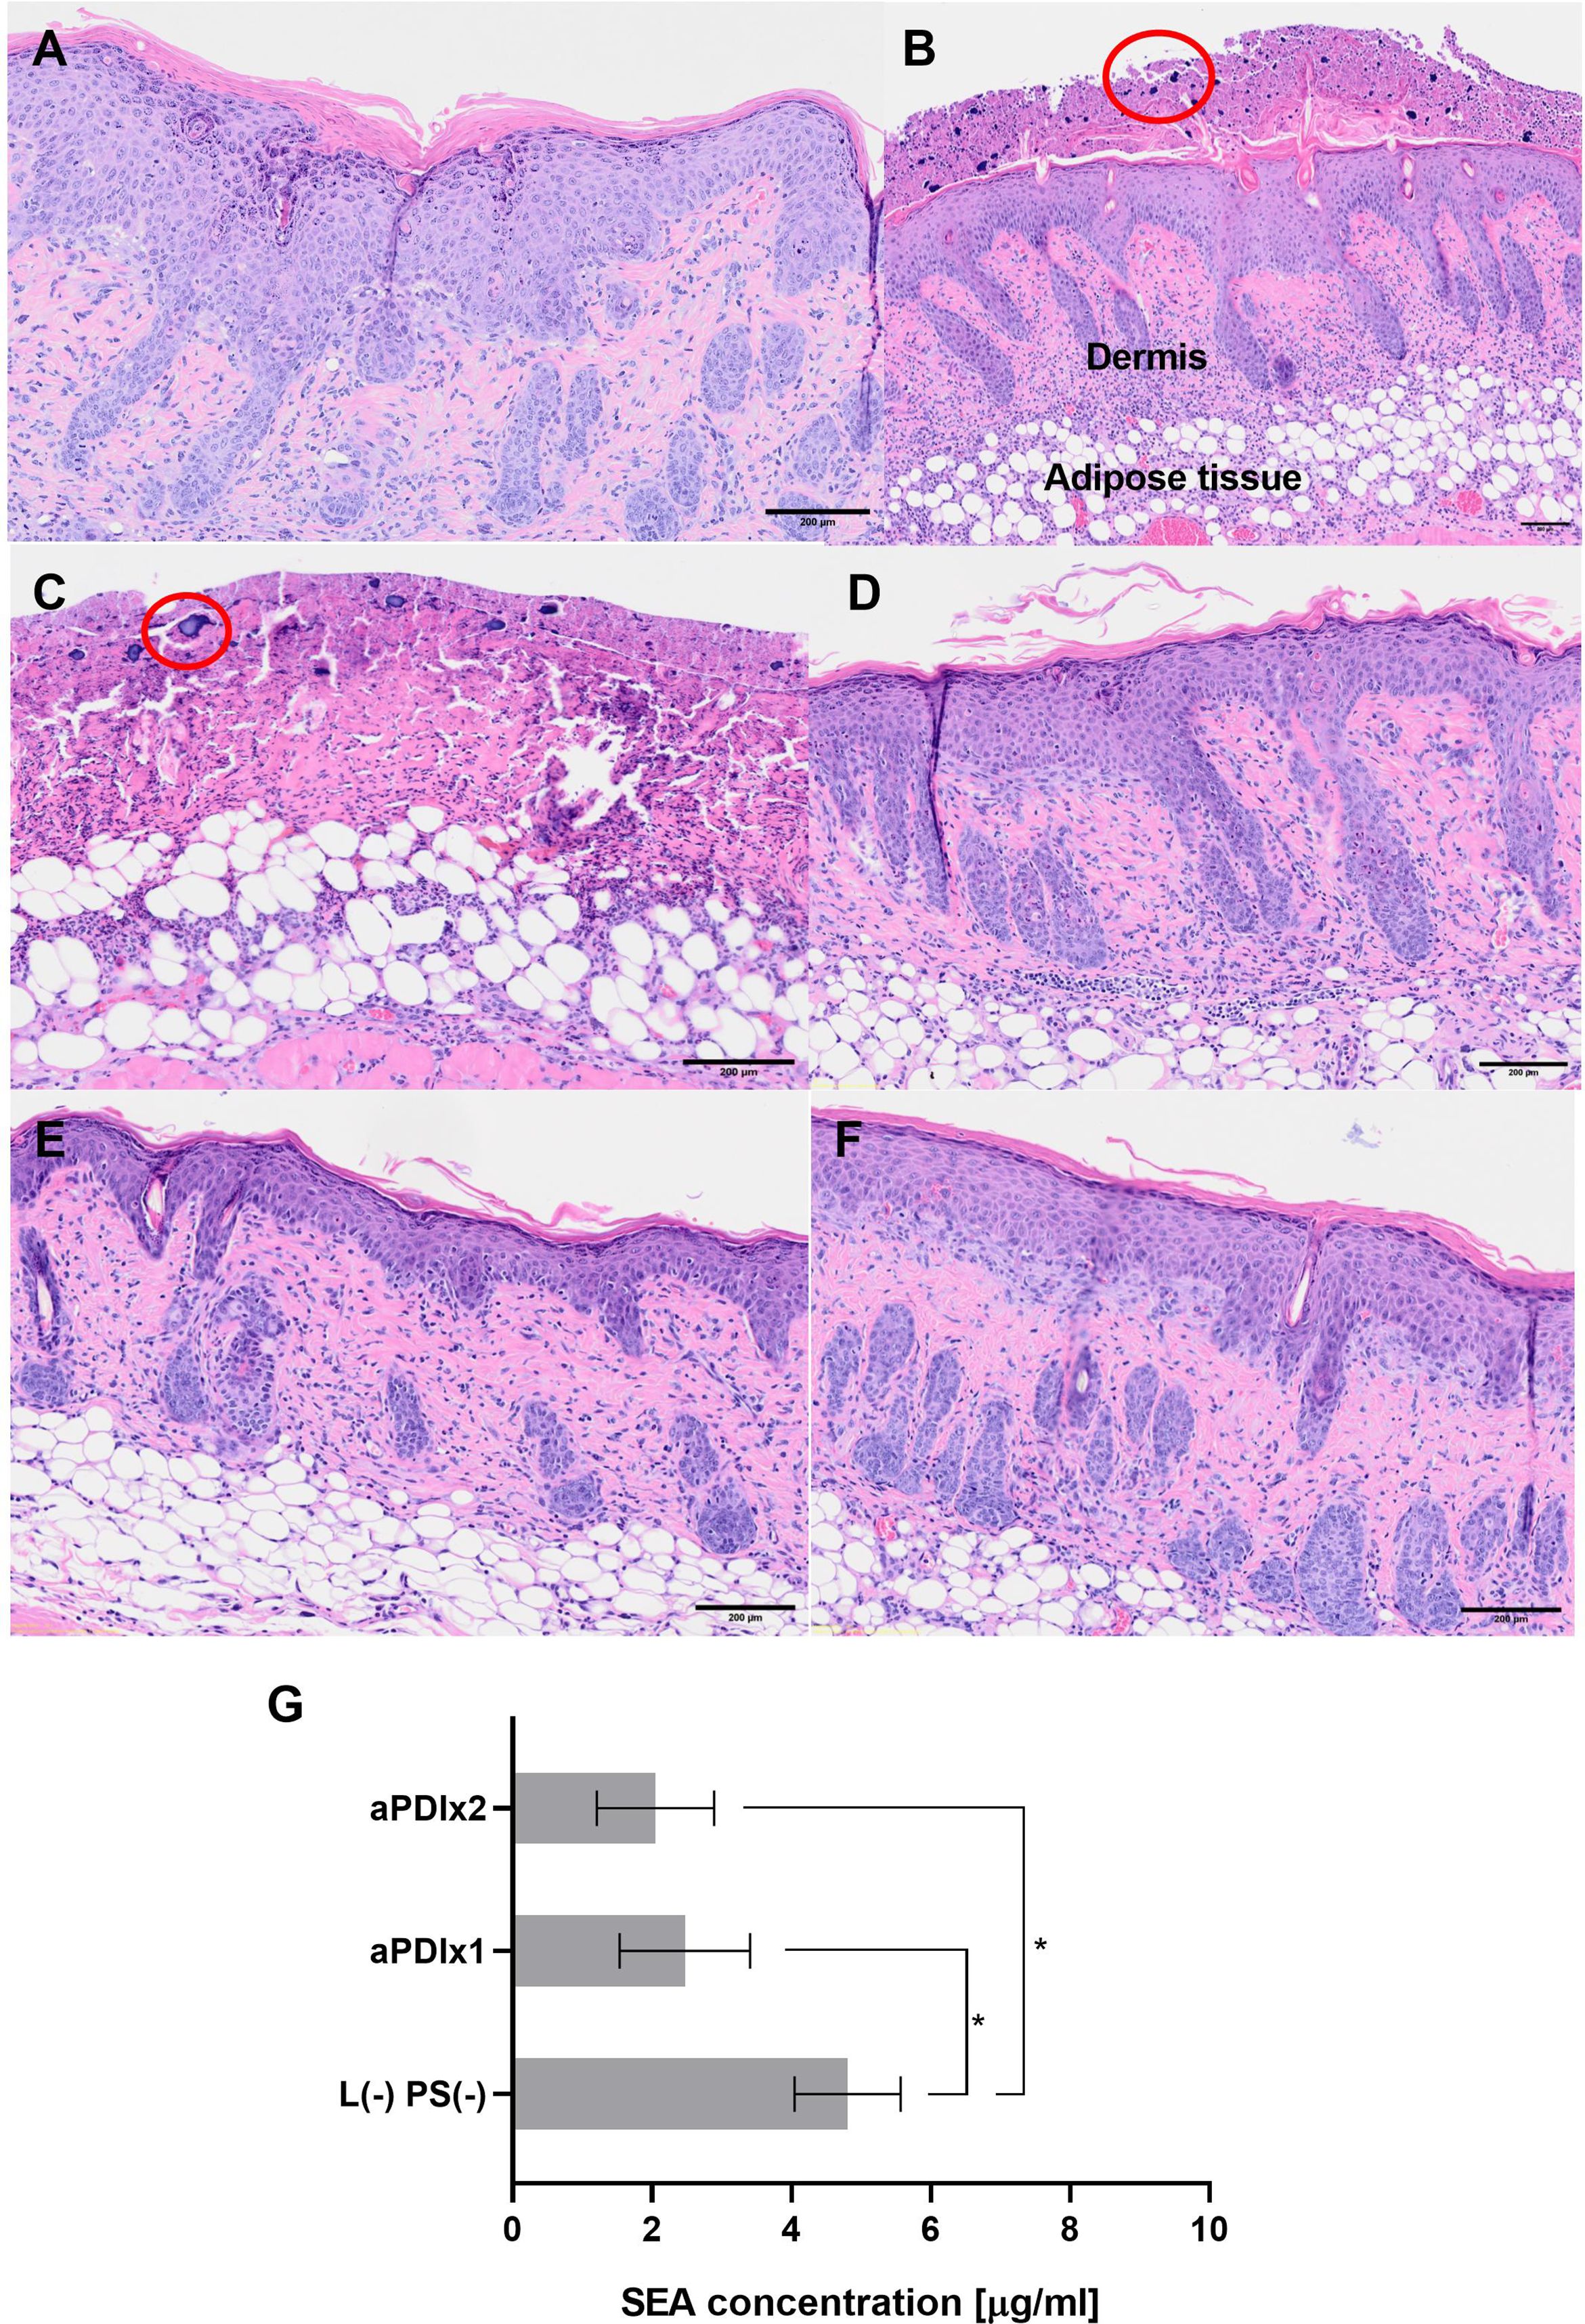
Figure 7. Histological analysis of mouse skin subjected to tape-stripping and S. aureus colonization. Histological images of mouse skin samples collected on the 5th day of the experiment. The samples were fixed in formalin, embedded in paraffin, and stained with hematoxylin and eosin (H&E) to assess tissue structure. Bacterial presence was visualized using a crystal violet solution. (A) Skin subjected to the tape-stripping procedure (magnification 4×). The red ellipse highlights neutrophil infiltration, indicating an inflammatory response. (B) Tape-stripped skin colonized with S. aureus (magnification 4×). Clusters of S. aureus bacteria are circled in red. (C) Tape-stripped, S. aureus-colonized skin irradiated with green light (magnification 4×). (D) Tape-stripped, S. aureus-colonized skin treated with rose bengal (50 μM) applied directly to the skin surface (magnification 4×). (E) and (F) Tape-stripped, S. aureus-colonized skin treated with a single (E) or double (F) aPDI session (magnification 4×). (G) SEA protein concentrations after aPDI. Each bar represents the mean SEA concentration from swab samples collected from six mice, with error bars indicating the standard error of the mean (SEM). Statistical significance is determined in comparison to the control group (tape-stripped, S. aureus-colonized mice) with p < 0.05 denoted by (*); aPDIx1 – tape-stripped, S. aureus-colonized mice subjected to a single aPDI treatment (50 μM RB, 10.6 mW/cm2, 6.36 J/cm2); aPDIx2 – tape-stripped, S. aureus-colonized mice subjected to a double aPDI treatment (50 μM RB, 10.6 mW/cm2, 6.36 J/cm2).
Histological images of mouse skin samples collected on the 5th day of the experiment. The samples were fixed in formalin, embedded in paraffin, and stained with hematoxylin and eosin (H&E) to assess tissue structure. Bacterial presence was visualized using a crystal violet solution. A) Skin subjected to the tape-stripping procedure (magnification 4×). The red ellipse highlights neutrophil infiltration, indicating an inflammatory response. B) Tape-stripped skin colonized with S. aureus (magnification 4×). Clusters of S. aureus bacteria are circled in red. C) Tape-stripped, S. aureus-colonized skin irradiated with green light (magnification 4×). D) Tape-stripped, S. aureus-colonized skin treated with rose bengal (50 µM) applied directly to the skin surface (magnification 4×). E) and F) Tape-stripped, S. aureus-colonized skin treated with a single (E) or double (F) aPDI session (magnification 4×). G) SEA protein concentrations after aPDI. Each bar represents the mean SEA concentration from swab samples collected from six mice, with error bars indicating the standard error of the mean (SEM). Statistical significance is determined in comparison to the control group (tape-stripped, S. aureus-colonized mice) with p < 0.05 denoted by (*); aPDIx1 – tape-stripped, S. aureus-colonized mice subjected to a single aPDI treatment (50 µM RB, 10.6 mW/cm², 6.36 J/cm²); aPDIx2 – tape-stripped, S. aureus-colonized mice subjected to a double aPDI treatment (50 µM RB, 10.6 mW/cm², 6.36 J/cm²).
The final step of the study involved quantifying the levels of the SEA protein from mouse skin swabs. Three experimental groups were analyzed: (i) a control group consisting of tape-stripped, S. aureus-colonized mice, (ii) tape-stripped, S. aureus-colonized mice subjected to a single aPDI treatment, and (iii) tape-stripped, S. aureus-colonized mice subjected to a double aPDI treatment. In the control group, SEA protein levels were comparable to those observed in both in vitro and ex vivo studies, confirming consistent toxin production. However, aPDI treatment resulted in a statistically significant reduction in SEA levels, with a progressive trend of decrease following subsequent treatments [L (–) PS (–): 4.8 µg/mL; aPDIx1: 2.47 µg/mL; aPDIx2: 2.05 µg/mL] (Figure 7G). These findings demonstrate that aPDI effectively reduces bacterial virulence factors, highlighting its potential as an antimicrobial strategy against S. aureus.
4 Discussion
Staphylococcus aureus is a major contributor to the pathogenesis of atopic dermatitis (AD), where persistent skin colonization and toxin production exacerbate disease severity. Despite the significant impact of S. aureus in AD, current treatment options are limited, with few strategies effectively eradicating or controlling its colonization and toxin activity. Our study demonstrates that aPDI effectively reduces Staphylococcus aureus colonization in both in vitro, ex vivo in a porcine skin model, as well as in an in vivo murine model, supporting its potential as a non-invasive approach for treating bacterial infections in compromised skin barriers. Our findings align with the previous work by Hamblin’s group, which reported bacterial reduction following RB-mediated aPDI with green light, particularly in the presence of potassium iodide (26). Here, we expanded upon these observations by using multiple models to not only confirm the reduction of the bacterial abundance by aPDI, but also to investigate its modulatory effect on virulence factors, since those play a crucial role in disease severity. A key focus for our study was the impact of aPDI on staphylococcal enterotoxins, i.e., known superantigens that disrupt immune responses and exacerbate skin conditions, such as atopic dermatitis. These findings highlight the aPDI’s potential beyond the antimicrobial strategy but also as a tool for mitigating toxin-associated inflammation in skin infections. While FLG mutations represent a strong risk factor for AD, it is important to note that not all mutation carriers develop the disease. The onset of the disease requires the interaction of multiple factors, including genetic background, environmental exposures, and immune regulation, which are required for its manifestation. Our model, therefore, captures only one aspect of this complex interplay, and should be interpreted with these limitations in mind.
Although aPDI has been widely studied for its bactericidal effects, its impact on bacterial virulence factors remains less explored. Previous studies demonstrated that aPDI using methylene blue (MB) and red light (λmax = 660 nm) significantly reduces quorum sensing (QS)-mediated virulence factors in Serratia marcescens through downregulation of the bsmA, bsmB, flhD, and swrR genes (55). Similarly, aPDI with the use of MB and a diode laser (λmax = 650 nm) suppressed the QS-related genes lasI, lasR, rhlI, and rhlR in Pseudomonas aeruginosa (56). Comparable gene expression downregulation was observed in Acinetobacter baumannii and S. aureus when treated with toluidine blue O (TBO) or indocyanine green (ICG) activated by appropriate light sources (57, 58). Additionally, curcumin-mediated aPDI significantly inhibited the expression of key virulence genes (inlA, hlyA, and plcA) in Listeria monocytogenes (59). At the protein level, aPDI has been shown to inhibit S. aureus V8 protease and α-hemolysin activity in a photosensitizer concentration-dependent manner. Laser-based MB-aPDI (λmax = 665 nm) completely suppressed α-hemolysin activity and reduced sphingomyelinase activity (25). These findings highlight the broad-spectrum potential of aPDI in attenuating bacterial virulence by targeting both gene expression and protein function.
This study provides the first comprehensive assessment of the effect of aPDI strategy on the presence of S. aureus enterotoxins in both in vitro and ex vivo models. Bartolomeu et al. previously demonstrated that enterotoxin-producing S. aureus strains were more susceptible to aPDI with Tetra-Py+-Me and white light (380–700 nm) than non-enterotoxigenic strains (26). However, their study was performed exclusively in vitro and did not assess the biological activity of enterotoxins post-aPDI.
Our findings reveal that sublethal aPDI with RB and green light, as well as NMB with red light, significantly downregulated the transcript levels of sea, seb, sec, and sed toxins implicated in S. aureus-mediated skin inflammation, particularly in the compromised skin. Interestingly, both the photosensitizers and the light sources independently modulated the expression of certain toxin-encoding genes, aligning with previous reports that blue light (λmax = 462 nm) regulates S. aureus motility, iron metabolism, and hemolytic activity (60).
Contrary to previous studies reporting reduced toxin protein levels following aPDI (61, 62), our sublethal treatment conditions did not significantly alter enterotoxin protein levels. This may be attributed to the intrinsic stability of the staphylococcal enterotoxins, which are resistant to heat, desiccation, proteases, and acidic environments. Additionally, factors such as the light dose, photosensitizer concentration, and photobleaching could contribute to the observed resistance. Notably, Tubby et al. reported that aPDI inhibition of S. aureus protease activity was highly dependent on the treatment parameters (25). Excessively high photosensitizer concentrations (e.g., 200 µM NMB) may also hinder aPDI effectiveness by absorbing light and reducing ROS generation (37). Prolonged red light exposure (~45 min) can further decrease efficacy due to photobleaching (63). To mitigate this, researchers have proposed administering the photosensitizer in two doses of red light (λmax = 635 ± 15 nm) at 180 J/cm² and 300 J/cm² in in vivo studies, achieving a therapeutic effect characterized by the absence of bioluminescence from Acinetobacter baumannii (38).
Staphylococcal enterotoxins primarily induce T-cell proliferation and cytokine release (13, 14). Functional assays revealed that while sublethal aPDI slightly impaired toxin activity, lethal aPDI (RB + green light) abolished T-cell proliferation, indicating a significant reduction in toxin-induced immune activation (Figure 2). This aligns with the findings by Kömerik et al., who demonstrated that aPDI’s impact on lipopolysaccharide (LPS)-induced cytokine release depended on both photosensitizer concentration and light dose (24). Our results suggest that optimized aPDI parameters could be leveraged as a therapeutic strategy to mitigate S. aureus colonization and toxin-mediated inflammation in conditions such as AD.
Ex vivo porcine skin models are increasingly used to evaluate aPDI under physiologically relevant conditions. In most previous studies, aPDI was applied immediately after bacterial inoculation, representing short-term protocols that does not allow for bacterial adaptation or colonization comparable to natural S. aureus persistence on human skin (49, 64–66). To address this, we developed an ex vivo model that allows overnight bacterial colonization, providing a more realistic environment for assessing aPDI’s effects on both transcript and protein levels. Using this model, we demonstrated that RB-mediated aPDI significantly reduced enterotoxin A levels, underscoring its potential for topical applications targeting S. aureus virulence (Figure 5).
Our study demonstrates that aPDI significantly reduces S. aureus colonization and virulence factor production in a murine model that mimics atopic dermatitis. Unlike previous in vivo studies that involved deep-tissue infections, our tape-stripping model allowed for the assessment of aPDI’s effects on bacterial colonization in a physiologically relevant setting. Both single and double aPDI treatments resulted in a significant reduction in the bacterial load and/or metabolic activity, as indicated by decreased bioluminescence signals. Histological analysis further confirmed that aPDI did not exacerbate tissue damage; instead, it supported epidermal repair. Importantly, neutrophil numbers were not reduced following aPDI treatment, indicating that the host immune response was preserved (Figure 7).
Crucially, aPDI also reduced staphylococcal enterotoxin A levels in a dose-dependent manner, addressing not only the bacterial survival but also toxin-mediated inflammation, an essential factor in skin conditions such as atopic dermatitis (67). This dual effect of aPDI distinguishes it from conventional antimicrobial therapies, which primarily focus on bacterial eradication but may not directly impact the expression or activity of virulence factors. Additionally, aPDI presents a promising alternative to antibiotics, reducing the risk of resistance development. A potential limitation of the system is that aPDI can induce bacterial tolerance under certain conditions. However, this phenomenon appears to be less common and less persistent than the development of antibiotic resistance. Given its non-invasive nature and excellent safety profile, aPDI holds potential for clinical translation in dermatology, particularly for treating S. aureus-associated skin diseases. Future research should explore its long-term efficacy, optimal treatment parameters, and its potential synergies with the existing therapies to further enhance its efficacy as an antimicrobial and immunomodulatory intervention.
Our study highlights the ability of aPDI’s to suppress enterotoxin gene expression and, under lethal conditions, significantly reduce the biological activity of the toxin. However, protein-level resistance under sublethal conditions underscores the need for optimized treatment parameters. Future research should explore the impact of different light sources, photosensitizer formulations, and combinatory approaches (e.g., aPDI with antimicrobial peptides) to enhance the efficacy. Additionally, in vivo validation in AD models could pave the way for clinical translation of aPDI as a novel strategy against S. aureus.
Data availability statement
The original contributions presented in the study are included in the article/Supplementary Material. Further inquiries can be directed to the corresponding author.
Ethics statement
The studies involving humans were approved by Ethical approval was granted by the Medical University of Gdańsk (NKBBN/621-574/2020). The studies were conducted in accordance with the local legislation and institutional requirements. The participants provided their written informed consent to participate in this study. The animal study was approved by II Local Ethical Committee for Animal Experiments in Kraków, Poland (no. 101/2021, April 8, 2021). The study was conducted in accordance with the local legislation and institutional requirements.
Author contributions
PO: Methodology, Validation, Writing – original draft, Visualization, Investigation. AK: Methodology, Investigation, Validation, Writing – review & editing. AH: Data curation, Writing – review & editing, Visualization, Investigation, Methodology. DG-O: Methodology, Writing – review & editing, Resources. JN: Data curation, Writing – review & editing, Conceptualization, Methodology, Resources, Funding acquisition, Project administration, Supervision, Formal Analysis.
Funding
The author(s) declare financial support was received for the research and/or publication of this article. This work was supported by grant OPUS (no.2023/49/B/NZ7/03213) funded by the National Science Center, Poland (JN).
Conflict of interest
The authors declare that the research was conducted in the absence of any commercial or financial relationships that could be construed as a potential conflict of interest.
Generative AI statement
The author(s) declare that no Generative AI was used in the creation of this manuscript.
Any alternative text (alt text) provided alongside figures in this article has been generated by Frontiers with the support of artificial intelligence and reasonable efforts have been made to ensure accuracy, including review by the authors wherever possible. If you identify any issues, please contact us.
Publisher’s note
All claims expressed in this article are solely those of the authors and do not necessarily represent those of their affiliated organizations, or those of the publisher, the editors and the reviewers. Any product that may be evaluated in this article, or claim that may be made by its manufacturer, is not guaranteed or endorsed by the publisher.
Supplementary material
The Supplementary Material for this article can be found online at: https://www.frontiersin.org/articles/10.3389/fimmu.2025.1655244/full#supplementary-material
References
1. Tong SYC, Davis JS, Eichenberger E, Holland TL, and Fowler VG. Staphylococcus aureus infections: Epidemiology, pathophysiology, clinical manifestations, and management. Clin Microbiol Rev. (2015) 28:603–61. doi: 10.1128/CMR.00134-14
2. Peacock SJ, Moore CE, Justice A, Kantzanou M, Story L, Mackie K, et al. Virulent combinations of adhesin and toxin genes in natural populations of. Society. (2002) 70:4987–96. doi: 10.1128/IAI.70.9.4987
3. Ong PY, Ohtake T, Brandt C, Strickland I, Boguniewicz M, Ganz T, et al. Endogenous antimicrobial peptides and skin infections in atopic dermatitis. New Engl J Med. (2002) 347:1151–60. doi: 10.1056/NEJMoa021481
4. Feuillie C, Geoghegan JA, Kezic S, Irvine AD, Vitry P, Dufrêne YF, et al. Adhesion of staphylococcus aureus to corneocytes from atopic dermatitis patients is controlled by natural moisturizing factor levels. mBio. (2018) 9:1–11. doi: 10.1128/mbio.01184-18
5. Ardern-Jones MR, Black AP, Bateman EA, and Ogg GS. Bacterial superantigen facilitates epithelial presentation of allergen to T helper 2 cells. Proc Natl Acad Sci. (2007) 104:5557–62. doi: 10.1073/pnas.0700733104
6. Lee B, Olaniyi R, Kwiecinski JM, and Wardenburg JB. Staphylococcus aureus toxin suppresses antigen-specific T cell responses. J Clin Invest. (2020) 130:1122–7. doi: 10.1172/JCI130728
7. Mellergaard M, Skovbakke SL, Jepsen SD, Panagiotopoulou N, Hansen ABR, Tian W, et al. Clinical Staphylococcus aureus inhibits human T-cell activity through interaction with the PD-1 receptor. mBio. (2023) 14:e1349-23. doi: 10.1128/mbio.01349-23
8. Kobiela A, Hovhannisyan L, Jurkowska P, de la Serna JB, Bogucka A, Deptuła M, et al. Excess filaggrin in keratinocytes is removed by extracellular vesicles to prevent premature death and this mechanism can be hijacked by Staphylococcus aureus in a TLR2-dependent fashion. J Extracell Vesicles. (2023) 12:e12335. doi: 10.1002/jev2.12335
9. Dinges MM, Orwin PM, and Schlievert PM. Exotoxins of staphylococcus aureus. Clin Microbiol Rev. (2000) 13:16–34. doi: 10.1128/CMR.13.1.16
10. Tam K and Torres VJ. Staphylococcus aureus secreted toxins and extracellular enzymes. Microbiol Spectr. (2019) 7:0039-2018. doi: 10.1128/microbiolspec.GPP3-0039-2018
11. Yarwood JM, McCormick JK, and Schlievert PM. Identification of a novel two-component regulatory system that acts in global regulation of virulence factors of Staphylococcus aureus. J Bacteriol. (2001) 183:1113–23. doi: 10.1128/JB.183.4.1113-1123.2001
12. Dellabona P, Peccoud J, Kappler J, Marrack P, Benoist C, and Mathis D. Superantigens interact with MHC class II molecules outside of the antigen groove. Cell. (1990) 62:1115–21. doi: 10.1016/0092-8674(90)90388-U
13. Schlievert PM, Strandberg KL, Lin Y-C, Peterson ML, and Leung DYM. Secreted virulence factor comparison between methicillin-resistant and methicillin-sensitive Staphylococcus aureus, and its relevance to atopic dermatitis. J Allergy Clin Immunol. (2010) 125:39–49. doi: 10.1016/j.jaci.2009.10.039
14. Harris TO, Grossman D, Kappler JW, Marrack P, Rich RR, and Betley MJ. Lack of complete correlation between emetic and T-cell-stimulatory activities of staphylococcal enterotoxins. Infect Immun. (1993) 61:3175–83. doi: 10.1128/IAI.61.8.3175-3183.1993
15. Hauk PJ, Hamid QA, Chrousos GP, and Leung DYM. Induction of corticosteroid insensitivity in human PBMCs by microbial superantigens. J Allergy Clin Immunol. (2000) 105:782–7. doi: 10.1067/mai.2000.105807
16. Bunikowski R, Mielke ME, Skarabis H, Worm M, Anagnostopoulos I, Kolde G, et al. Evidence for a disease-promoting effect of Staphylococcus aureus-derived exotoxins in atopic dermatitis. J Allergy Clin Immunol. (2000) 105:814–9. doi: 10.1067/mai.2000.105528
17. Ong PY. Recurrent MRSA skin infections in atopic dermatitis. J Allergy Clin Immunology: In Pract. (2014) 2:396–9. doi: 10.1016/j.jaip.2014.04.007
18. Rangel SM and Paller AS. Bacterial colonization, overgrowth, and superinfection in atopic dermatitis. Clin Dermatol. (2018) 36:641–7. doi: 10.1016/j.clindermatol.2018.05.005
19. Lo WT, Wang SR, Tseng MH, Huang CF, Chen SJ, and Wang CC. Comparative molecular analysis of meticillin-resistant Staphylococcus aureus isolates from children with atopic dermatitis and healthy subjects in Taiwan. Br J Dermatol. (2010) 162:1110–6. doi: 10.1111/j.1365-2133.2010.09679.x
20. Ogonowska P, Gilaberte Y, Barańska-Rybak W, and Nakonieczna J. Colonization with staphylococcus aureus in atopic dermatitis patients: attempts to reveal the unknown. Front Microbiol. (2021) 11:567090. doi: 10.3389/fmicb.2020.567090
21. Hamblin MR. Antimicrobial photodynamic inactivation: a bright new technique to kill resistant microbes. Curr Opin Microbiol. (2016) 33:67–73. doi: 10.1016/j.mib.2016.06.008
22. Rapacka-Zdończyk A, Woźniak A, Michalska K, Pierański M, Ogonowska P, Grinholc M, et al. Factors determining the susceptibility of bacteria to antibacterial photodynamic inactivation. Front Med (Lausanne). (2021) 8:642609. doi: 10.3389/fmed.2021.642609
23. Nakonieczna J, Wozniak A, Pieranski M, Rapacka-Zdonczyk A, Ogonowska P, and Grinholc M. Photoinactivation of ESKAPE pathogens: overview of novel therapeutic strategy. Future Med Chem. (2019) 11:443–61. doi: 10.4155/fmc-2018-0329
24. Kömerik N, Wilson M, and Poole S. The effect of photodynamic action on two virulence factors of gram-negative bacteria. Photochem Photobiol. (2000) 72:676. doi: 10.1562/0031-8655(2000)072<0676:TEOPAO>2.0.CO;2
25. Tubby S, Wilson M, and Nair SP. Inactivation of staphylococcal virulence factors using a light-activated antimicrobial agent. BMC Microbiol. (2009) 9:211. doi: 10.1186/1471-2180-9-211
26. Bartolomeu M, Rocha S, Cunha Â, Neves MGPMS, Faustino MAF, and Almeida A. Effect of photodynamic therapy on the virulence factors of staphylococcus aureus. Front Microbiol. (2016) 7:267. doi: 10.3389/fmicb.2016.00267
27. Phoenix DA, Sayed Z, Hussain S, Harris F, and Wainwright M. The phototoxicity of phenothiazinium derivatives against Escherichia coli and Staphylococcus aureus. FEMS Immunol Med Microbiol. (2003) 39:17–22. doi: 10.1016/S0928-8244(03)00173-1
28. Wainwright M, Phoenix DA, Laycock SL, Wareing DRA, and Wright PA. Photobactericidal activity of phenothiazinium dyes against methicillin- resistant strains of Staphylococcus aureus. FEMS Microbiol Lett. (1998) 160:177–81. doi: 10.1016/S0378-1097(97)00545-4
29. Dubey T, Gorantla NV, Chandrashekara KT, and Chinnathambi S. Photodynamic exposure of Rose-Bengal inhibits Tau aggregation and modulates cytoskeletal network in neuronal cells. Sci Rep. (2020) 10:12380. doi: 10.1038/s41598-020-69403-2
30. Ducrotoy MJ and Bardosh KL. How do you get the Rose Bengal Test at the point-of-care to diagnose brucellosis in Africa? The importance of a systems approach. Acta Trop. (2017) 165:33–9. doi: 10.1016/j.actatropica.2016.10.004
31. Doughty MJ. Rose bengal staining as an assessment of ocular surface damage and recovery in dry eye disease—A review. Contact Lens Anterior Eye. (2013) 36:272–80. doi: 10.1016/j.clae.2013.07.008
32. Fritsch C, Stege H, Saalmann G, Goerz G, Ruzicka T, and Krutmann J. Green light is effective and less painful than red light in photodynamic therapy of facial solar keratoses. Photodermatol Photoimmunol Photomed. (1997) 13:181–5. doi: 10.1111/j.1600-0781.1997.tb00226.x
33. Silva A, Borges A, Freitas C, Hioka N, Mikcha J, and Simões M. Antimicrobial photodynamic inactivation mediated by rose bengal and erythrosine is effective in the control of food-related bacteria in planktonic and biofilm states. Molecules. (2018) 23:2288. doi: 10.3390/molecules23092288
34. Pieranski MK, Rychlowski M, and Grinholc M. Optimization of streptococcus agalactiae biofilm culture in a continuous flow system for photoinactivation studies. Pathogens. (2021) 10:1212. doi: 10.3390/pathogens10091212
35. Pérez-Laguna V, García-Luque I, Ballesta S, Pérez-Artiaga L, Lampaya-Pérez V, Samper S, et al. Antimicrobial photodynamic activity of Rose Bengal, alone or in combination with Gentamicin, against planktonic and biofilm Staphylococcus aureus. Photodiagnosis Photodyn Ther. (2018) 21:211–6. doi: 10.1016/j.pdpdt.2017.11.012
36. Pottier RH, Chow YFA, LaPlante J -P, Truscott TG, Kennedy JC, and Beiner LA. Non-invasive technique for obtaining fluorescence excitation and emission spectra in vivo. Photochem Photobiol. (1986) 44:679–87. doi: 10.1111/j.1751-1097.1986.tb04726.x
37. Dai T, Bil de Arce VJ, Tegos GP, and Hamblin MR. Blue dye and red light, a dynamic combination for prophylaxis and treatment of cutaneous candida albicans infections in mice. Antimicrob Agents Chemother. (2011) 55:5710–7. doi: 10.1128/AAC.05404-11
38. Ragàs X, Dai T, Tegos GP, Agut M, Nonell S, and Hamblin MR. Photodynamic inactivation of Acinetobacter baumannii using phenothiazinium dyes: In vitro and in vivo studies. Lasers Surg Med. (2010) 42:384–90. doi: 10.1002/lsm.20922
39. Misba L, Zaidi S, and Khan AU. A comparison of antibacterial and antibiofilm efficacy of phenothiazinium dyes between Gram positive and Gram negative bacterial biofilm. Photodiagnosis Photodyn Ther. (2017) 18:24–33. doi: 10.1016/j.pdpdt.2017.01.177
40. Wang XW, Wang JJ, Gutowska-Owsiak D, Salimi M, Selvakumar TA, Gwela A, et al. Deficiency of filaggrin regulates endogenous cysteine protease activity, leading to impaired skin barrier function. Clin Exp Dermatol. (2017) 42:622–31. doi: 10.1111/ced.13113
41. Ogonowska P, Woźniak A, Pierański M, Wasylew T, Kwiek P, Brasel M, et al. Application and characterization of light-emitting diodes for photodynamic inactivation of bacteria. Lighting Res Technol. (2019) 51:612–24. doi: 10.1177/1477153518781478
42. Ogonowska P and Nakonieczna J. Validation of stable reference genes in Staphylococcus aureus to study gene expression under photodynamic treatment: a case study of SEB virulence factor analysis. Sci Rep. (2020) 10:16354. doi: 10.1038/s41598-020-73409-1
43. Pfaffl MW. A new mathematical model for relative quantification in real-time RT-PCR. Nucleic Acids Res. (2001) 29:45e–45. doi: 10.1093/nar/29.9.e45
44. Theis T, Skurray RA, and Brown MH. Identification of suitable internal controls to study expression of a Staphylococcus aureus multidrug resistance system by quantitative real-time PCR. J Microbiol Methods. (2007) 70:355–62. doi: 10.1016/j.mimet.2007.05.011
45. Sihto HM, Tasara T, Stephan R, and Johler S. Validation of reference genes for normalization of qPCR mRNA expression levels in Staphylococcus aureus exposed to osmotic and lactic acid stress conditions encountered during food production and preservation. FEMS Microbiol Lett. (2014) 356:134–40. doi: 10.1111/1574-6968.12491
46. Schroder W, Goerke C, and Wolz C. Opposing effects of aminocoumarins and fluoroquinolones on the SOS response and adaptability in Staphylococcus aureus. J Antimicrobial Chemotherapy. (2013) 68:529–38. doi: 10.1093/jac/dks456
47. Klotz M, Opper S, Heeg K, and Zimmermann S. Detection of staphylococcus aureus enterotoxins A to D by real-time fluorescence PCR assay. J Clin Microbiol. (2003) 41:4683–7. doi: 10.1128/JCM.41.10.4683-4687.2003
48. Babić M. Expression of toxic shock syndrome toxin-1 gene of Staphylococcus aureus in milk: Proof of concept. Mljekarstvo. (2018) 68:12–20. doi: 10.15567/mljekarstvo.2018.0102
49. Maisch T, Bosl C, Szeimies RM, Love B, and Abels C. Determination of the antibacterial efficacy of a new porphyrin-based photosensitizer against MRSA ex vivo. Photochemical Photobiological Sci. (2007) 6:545–51. doi: 10.1039/b614770d
50. Clausen ML, Edslev SM, Andersen PS, Clemmensen K, Krogfelt KA, and Agner T. Staphylococcus aureus colonization in atopic eczema and its association with filaggrin gene mutations. Br J Dermatol. (2017) 177:1394–400. doi: 10.1111/bjd.15470
51. Simon GA and Maibach HI. The pig as an experimental animal model of percutaneous permeation in man: qualitative and quantitative observations – an overview. Skin Pharmacol Physiol. (2000) 13:229–34. doi: 10.1159/000029928
52. Bitschar K, Staudenmaier L, Klink L, Focken J, Sauer B, Fehrenbacher B, et al. Staphylococcus aureus skin colonization is enhanced by the interaction of neutrophil extracellular traps with keratinocytes. J Invest Dermatol. (2020) 140:1054–1065.e4. doi: 10.1016/j.jid.2019.10.017
53. Wanke I, Skabytska Y, Kraft B, Peschel A, Biedermann T, and Schittek B. Staphylococcus aureus skin colonization is promoted by barrier disruption and leads to local inflammation. Exp Dermatol. (2013) 22:153–5. doi: 10.1111/exd.12083
54. Pérez M, Robres P, Moreno B, Bolea R, Verde MT, Pérez-Laguna V, et al. Comparison of antibacterial activity and wound healing in a superficial abrasion mouse model of staphylococcus aureus skin infection using photodynamic therapy based on methylene blue or mupirocin or both. Front Med (Lausanne). (2021) 8:673408. doi: 10.3389/fmed.2021.673408
55. Fekrirad Z, Kashef N, and Arefian E. Photodynamic inactivation diminishes quorum sensing-mediated virulence factor production and biofilm formation of Serratia marcescens. World J Microbiol Biotechnol. (2019) 35:191. doi: 10.1007/s11274-019-2768-9
56. Hendiani S, Pornour M, and Kashef N. Quorum-sensing-regulated virulence factors in Pseudomonas aeruginosa are affected by sub-lethal photodynamic inactivation. Photodiagnosis Photodyn Ther. (2019) 26:8–12. doi: 10.1016/j.pdpdt.2019.02.010
57. Pourhajibagher M, Mahmoudi H, Rezaei-soufi L, Alikhani MY, and Bahador A. Potentiation effects of antimicrobial photodynamic therapy on quorum sensing genes expression: A promising treatment for multi-species bacterial biofilms in burn wound infections. Photodiagnosis Photodyn Ther. (2020) 30:101717. doi: 10.1016/j.pdpdt.2020.101717
58. Pourhajibagher M, Boluki E, Chiniforush N, Pourakbari B, Farshadzadeh Z, Ghorbanzadeh R, et al. Modulation of virulence in Acinetobacter baumannii cells surviving photodynamic treatment with toluidine blue. Photodiagnosis Photodyn Ther. (2016) 15:202–12. doi: 10.1016/j.pdpdt.2016.07.007
59. Huang J, Chen B, Li H, Zeng Q-H, Wang JJ, Liu H, et al. Enhanced antibacterial and antibiofilm functions of the curcumin-mediated photodynamic inactivation against Listeria monocytogenes. Food Control. (2020) 108:106886. doi: 10.1016/j.foodcont.2019.106886
60. Tuttobene MR, Pérez JF, Pavesi ES, Perez Mora B, Biancotti D, Cribb P, et al. Light Modulates Important Pathogenic Determinants and Virulence in ESKAPE Pathogens Acinetobacter baumannii, Pseudomonas aeruginosa, and Staphylococcus aureus. J Bacteriol. (2021) 203:00566-20. doi: 10.1128/JB.00566-20
61. Tseng S-P, Hung W-C, Chen H-J, Lin Y-T, Jiang H-S, Chiu H-C, et al. Effects of toluidine blue O (TBO)-photodynamic inactivation on community-associated methicillin-resistant Staphylococcus aureus isolates. J Microbiology Immunol Infection. (2017) 50:46–54. doi: 10.1016/j.jmii.2014.12.007
62. Wong T-W, Wu E-C, Ko W-C, Lee C-C, Hor L-I, and Huang I-H. Photodynamic inactivation of methicillin-resistant Staphylococcus aureus by indocyanine green and near infrared light. Dermatologica Sin. (2018) 36:8–15. doi: 10.1016/j.dsi.2017.08.003
63. Stratonnikov AA, Meerovich GA, and Loschenov VB. Photobleaching of photosensitizers applied for photodynamic therapy. Dougherty TJ, editor. Bellingham, Washington, USA: SPIE - The International Society for Optics and Photonics (2000), pp. 81–91. doi: 10.1117/12.379885.
64. Braz M, Salvador D, Gomes ATPC, Mesquita MQ, Faustino MAF, Neves MGPMS, et al. Photodynamic inactivation of methicillin-resistant Staphylococcus aureus on skin using a porphyrinic formulation. Photodiagnosis Photodyn Ther. (2020) 30:101754. doi: 10.1016/j.pdpdt.2020.101754
65. Schreiner M, Bäumler W, Eckl DB, Späth A, König B, and Eichner A. Photodynamic inactivation of bacteria to decolonize meticillin-resistant Staphylococcus aureus from human skin. Br J Dermatol. (2018) 179:1358–67. doi: 10.1111/bjd.17152
66. Tortik N, Steinbacher P, Maisch T, Spaeth A, and Plaetzer K. A comparative study on the antibacterial photodynamic efficiency of a curcumin derivative and a formulation on a porcine skin model. Photochemical Photobiological Sci. (2016) 15:187–95. doi: 10.1039/C5PP00393H
Keywords: bacterial enterotoxins, MRSA, antimicrobial photodynamic therapy, bacterial colonization, atopic dermatitis, rose bengal
Citation: Ogonowska P, Kobiela A, Hulacka A, Gutowska-Owsiak D and Nakonieczna J (2025) Photodynamic inactivation of Staphylococcus aureus with rose bengal reduces superantigen activity. Front. Immunol. 16:1655244. doi: 10.3389/fimmu.2025.1655244
Received: 27 June 2025; Accepted: 17 September 2025;
Published: 02 October 2025.
Edited by:
Daniel P. Potaczek, University of Marburg, GermanyReviewed by:
Matthew G. Brewer, University of Rochester Medical Center, United StatesKatharina Siems, German Aerospace Center (DLR), Germany
Copyright © 2025 Ogonowska, Kobiela, Hulacka, Gutowska-Owsiak and Nakonieczna. This is an open-access article distributed under the terms of the Creative Commons Attribution License (CC BY). The use, distribution or reproduction in other forums is permitted, provided the original author(s) and the copyright owner(s) are credited and that the original publication in this journal is cited, in accordance with accepted academic practice. No use, distribution or reproduction is permitted which does not comply with these terms.
*Correspondence: Joanna Nakonieczna, am9hbm5hLm5ha29uaWVjem5hQGJpb3RlY2gudWcuZWR1LnBs
†ORCID: Joanna Nakonieczna, orcid.org/0000-0002-2420-664X