 Jingjing Wen
 Xingyu Nie†
 Fang Xu
- Department of Hematology, Mianyang Central Hospital, School of Medicine, University of Electronic Science and Technology of China, National Health Commission Key Laboratory of Nuclear Technology Medical Transformation, Mianyang, Sichuan, China
Introduction: Diffuse large B-cell lymphoma (DLBCL) is the most common subtype of non-Hodgkin lymphoma and carries a poor prognosis when it involves the central nervous system (CNS), a condition known as secondary CNS lymphoma (SCNSL). Although the CNS International Prognostic Index (CNS-IPI) is used to estimate SCNSL risk, its limited sensitivity highlights the need for more reliable biomarkers to improve risk stratification and enable earlier intervention.
Methods: We evaluated pretreatment levels of interleukin-10 (IL-10) and interleukin-6 (IL-6) in both peripheral blood (PB) and cerebrospinal fluid (CSF), and compared clinical characteristics between DLBCL patients with and without SCNSL.
Results: Fifty-six newly diagnosed DLBCL patients who received at least two treatment cycles were included. Compared to patients without CNS relapse, those with SCNSL exhibited distinct clinical features: more frequent B symptoms, increased bone marrow involvement, and lower B-cell lymphoma 6 (BCL6) immunohistochemical positivity. Biochemically, SCNSL patients showed elevated serum IL-10 levels, higher serum IL-10/IL-6 ratios, increased CSF IL-10 concentrations, and markedly elevated CSF IL-10/IL-6 ratios. On multivariate analysis, a serum IL-10/IL-6 ratio ≥2.30 independently predicted both progression-free survival (PFS) (HR = 7.300, p = 0.010) and SCNSL development (OR = 43.200, p = 0.001). Notably, time to CNS relapse did not significantly differ between high- and non-high-risk groups defined by CNS-IPI (χ² = 1.654, p = 0.198). However, incorporating the serum IL-10/IL-6 ratio into the CNS-IPI yielded a refined scoring model—CNS-IPI-ratio—where the high-risk group had a significantly shorter median time to CNS relapse compared to the non-high-risk group (22.32 vs. 40.35 months; χ² = 5.680, p = 0.017). Although survival outcomes were similar between high- and non-high-risk groups based on the NCCN-IPI alone (p > 0.05), adding the serum IL-10/IL-6 ratio identified significantly poorer outcomes in high-risk patients (PFS: p = 0.046; OS: p = 0.023). Furthermore, SCNSL patients demonstrated significantly higher CSF IL-10/IL-6 ratios compared to non-SCNSL patients and controls (67.88 vs. 0.74–0.79, p < 0.05), with this ratio strongly correlating with CSF lactate dehydrogenase (LDH) levels (r = 0.625, p = 0.006).
Conclusion: In DLBCL, an elevated serum IL-10/IL-6 ratio at diagnosis independently predicts disease progression and SCNSL risk. Incorporating this biomarker enhances the prognostic utility of both CNS-IPI and NCCN-IPI models. Additionally, the markedly elevated CSF IL-10/IL-6 ratio in SCNSL patients suggests potential diagnostic value for CNS involvement, warranting further investigation.
1 Introduction
Diffuse large B-cell lymphoma (DLBCL) is the most common aggressive subtype of non-Hodgkin lymphoma (NHL) in adults, accounting for 30–40% of cases worldwide (1). Although frontline regimens such as R-CHOP have improved clinical outcomes, approximately 2–5% of patients still develop secondary central nervous system lymphoma (SCNSL) (2), with rates increasing to 10–12% in high-risk subgroups (3). SCNSL is a rare but often fatal complication, typically occurring within 7–8 months of initial diagnosis (4–6). Patients with central nervous system (CNS) involvement exhibit dismal prognoses, with a median overall survival (OS) of only 3.4 months (7). Given the poor outcomes associated with CNS relapse, early identification of high-risk DLBCL patients is crucial for guiding preventive CNS-directed interventions and improving survival.
In 2016, Schmitz et al. (8) developed the Central Nervous System International Prognostic Index (CNS-IPI) as a tool for stratifying CNS relapse risk in DLBCL patients. The CNS-IPI has since been incorporated into National Comprehensive Cancer Network (NCCN) guidelines to assess the likelihood of CNS involvement (9). The reported 2-year CNS relapse rates were 0.6%, 3.4%, and 10.2% for patients in low-, intermediate-, and high-risk groups, respectively (8). However, follow-up data revealed that 55% of patients who developed CNS relapse belonged to the high-risk group, 40% to the intermediate-risk group, and 5% to the low-risk group (8). Moreover, real-world data over a 3-year follow-up period reported a higher-than-expected CNS relapse rate of 10.1% in the intermediate-risk category (5). These findings underscore the limited sensitivity of CNS-IPI in accurately identifying DLBCL patients at elevated risk of SCNSL. To improve predictive accuracy, incorporation of biologically relevant biomarkers has been proposed.
Recent studies have highlighted the role of cytokines within the tumor microenvironment. Interleukin-10 (IL-10), an anti-inflammatory cytokine produced by monocytes, macrophages, and tumor cells, contributes to the regulation of the blood–brain barrier and promotes lymphoma progression, thereby facilitating CNS infiltration (1, 10). Interleukin-6 (IL-6), a key growth factor for B cells, supports tumor growth and metastasis through its secretion by DLBCL cells and the surrounding stroma (11). While the diagnostic value of cerebrospinal fluid (CSF) IL-10 and IL-10/IL-6 ratios has been established in primary CNS lymphoma (PCNSL) (12–15), their utility in predicting CNS relapse in SCNSL remains underexplored. Unlike PCNSL, which presents with isolated CNS involvement, SCNSL requires early risk stratification before CNS dissemination occurs, highlighting the need for minimally invasive predictive biomarkers. Prior studies have shown significantly elevated serum IL-6 and IL-10 levels in DLBCL patients compared to healthy individuals (10, 16), with elevated cytokine levels correlating with shorter progression-free survival (PFS) and OS (10). However, the prognostic and predictive value of serum IL-6 and IL-10—alone or in combination with CNS-IPI—remains insufficiently characterized in the context of SCNSL.
In this study, we analyzed serum and CSF levels of IL-10 and IL-6 at diagnosis to assess their clinical significance in predicting disease progression and CNS relapse in DLBCL. We also examined correlations between serum and CSF cytokine levels and evaluated whether incorporating these biomarkers into the CNS-IPI model could enhance its predictive performance for SCNSL.
2 Patients and methods
2.1 Patients
We prospectively enrolled 56 newly diagnosed DLBCL patients aged ≥18 years, who were diagnosed and treated at the Department of Hematology, Mianyang Central Hospital between January 2020 and January 2024. Diagnosis and treatment adhered to the 2016 WHO Classification of Tumors of Haematopoietic and Lymphoid Tissues (17) and the NCCN Clinical Practice Guidelines in Oncology: B-Cell Lymphomas (9). All patients received at least three cycles of chemotherapy. Exclusion criteria included: (a) primary CNS lymphoma (PCNSL); (b) active non-lymphoma malignancies; (c) secondary CNS lymphoma (SCNSL) at diagnosis; or (d) pregnancy or lactation. SCNSL was defined as CNS involvement secondary to systemic lymphoma (18). CNS involvement was diagnosed through imaging, detection of lymphoma cells in the CSF, and/or characteristic clinical symptoms (18, 19). All patients underwent standardized imaging evaluations, including whole-body fluorodeoxyglucose positron emission tomography-computed tomography (PET-CT) or contrast-enhanced CT of the chest, abdomen, and pelvis. Additional imaging (e.g., contrast-enhanced magnetic resonance imaging [MRI] or ultrasound) was performed as clinically indicated (9). Baseline brain imaging and CSF analysis were routinely performed in patients with symptoms suggestive of CNS involvement or classified as high risk based on established criteria (20, 21).
Comprehensive medical record review captured clinical characteristics, laboratory data, treatment details, recurrence, and survival outcomes. Laboratory parameters included complete blood count (CBC), C-reactive protein (CRP), lymphocyte-to-monocyte ratio (LMR), platelet-to-lymphocyte ratio (PLR), albumin (ALB), β2-microglobulin (β2-MG), and lactate dehydrogenase (LDH) at diagnosis. Risk stratification followed NCCN-IPI criteria, classifying patients into low (0-1), low-intermediate (2–3), high-intermediate (4–5), and high-risk (≥6) categories (22). Additionally, patients were grouped into low, intermediate (22), and high CNS relapse risk categories according to CNS-IPI scores (8).
2.2 Cytokine measurements
Peripheral blood serum samples were collected from all patients at initial presentation. CSF was obtained via lumbar puncture when imaging confirmed safety, and was performed in CNS-symptomatic patients or those with high-risk features (e.g., intermediate/high CNS-IPI scores, testicular or breast involvement), following informed consent. Age-matched control patients hospitalized with non-neoplastic intracranial lesions during the same period were enrolled for comparative analysis; lumbar puncture eligibility was determined by neurologists.
Serum and CSF concentrations of IL-10 and IL-6 were measured using the IMMULITE/IMMULITE 1000 chemiluminescent immunoassay system (Siemens Healthineers). IL-6 was quantified using the Siemens LK6P1 assay kit and IL-10 using the LKXP1 assay kit. All assays were conducted by Sichuan West China Kang Shengda Medical Testing Co., Ltd.
2.3 Treatment regimen and evaluation
All patients received CD20 monoclonal antibody-based chemotherapy regimens, including R-CHOP or R-CHOP-like (rituximab, cyclophosphamide, doxorubicin/liposomal doxorubicin/etoposide, vincristine, prednisone), R plus dose-adjusted EPOCH (rituximab, etoposide, prednisone, vincristine, cyclophosphamide, doxorubicin), or BR (rituximab and bendamustine). Follow-up imaging was performed every 6 months for the first 2 years post-treatment and thereafter only as clinically indicated.
2.4 Definitions and endpoints
Cell of origin classification was determined using the Hans algorithm, categorizing tumors into germinal center B-cell (GCB) or non-GCB subtypes (23). Immunohistochemistry for MYC, BCL2, and BCL6 was performed. Dual-expressor lymphoma (DEL) was defined by MYC expression ≥40% and BCL2 expression ≥50% of tumor cells on immunohistochemistry (24). Progression-free survival (PFS) was calculated from diagnosis to progression, last follow-up, or death. Overall survival (OS) was measured from diagnosis to last follow-up or death from any cause.
2.5 Bioinformatics analysis of IL-10 and IL-6 in DLBCL
Publicly available gene expression datasets (GSE10846 and GSE87371) were obtained from the NCBI Gene Expression Omnibus (GEO) database. These datasets included RNA-sequencing data from tumor biopsy specimens of 414 and 223 treatment-naïve DLBCL patients, respectively, each with complete clinical follow-up data.
2.6 Statistical analysis
All statistical analyses were performed using SPSS version 26.0. GraphPad Prism 8.0 was used for data visualization. Continuous variables were presented as mean ± standard deviation (SD) for normally distributed data, or as median (range) for non-normally distributed data. Categorical variables were analyzed using the Chi-square or Fisher’s exact test; continuous variables were compared using the t-test or nonparametric equivalents. Receiver operating characteristic (ROC) curves were used to determine optimal cutoff values. Multivariate analyses were conducted using logistic regression. Kaplan-Meier curves and log-rank tests were employed to analyze PFS and OS. Cox regression was used for multivariate survival analysis. Correlation analyses were performed using Spearman’s rank correlation. A two-tailed p-value < 0.05 was considered statistically significant.
3 Results
3.1 Patients’ characteristics
This study included 56 newly diagnosed DLBCL patients without evidence of CNS involvement at baseline. Of these, 33 patients (58.9%) underwent PET/CT for systemic staging, while 23 (41.1%) received contrast-enhanced CT, with six patients in the CT group subsequently requiring brain or neck MRI. During follow-up, seven patients developed SCNSL. The median age was 65 years, and 41% (23/56) were female. Compared to those without SCNSL, patients who developed SCNSL exhibited significantly higher rates of B symptoms (57.1% vs. 12.2%, p=0.015), bone marrow involvement (71.4% vs. 14.3%, p=0.003), and lower BCL6 immunohistochemical (IHC) positivity rates (57.1% vs. 93.5%, p=0.025; Table 1). First-line treatment included R-CHOP or R-CHOP-like regimens in 49 patients, R-DA-EPOCH in 3 patients, and BR in 4 patients.
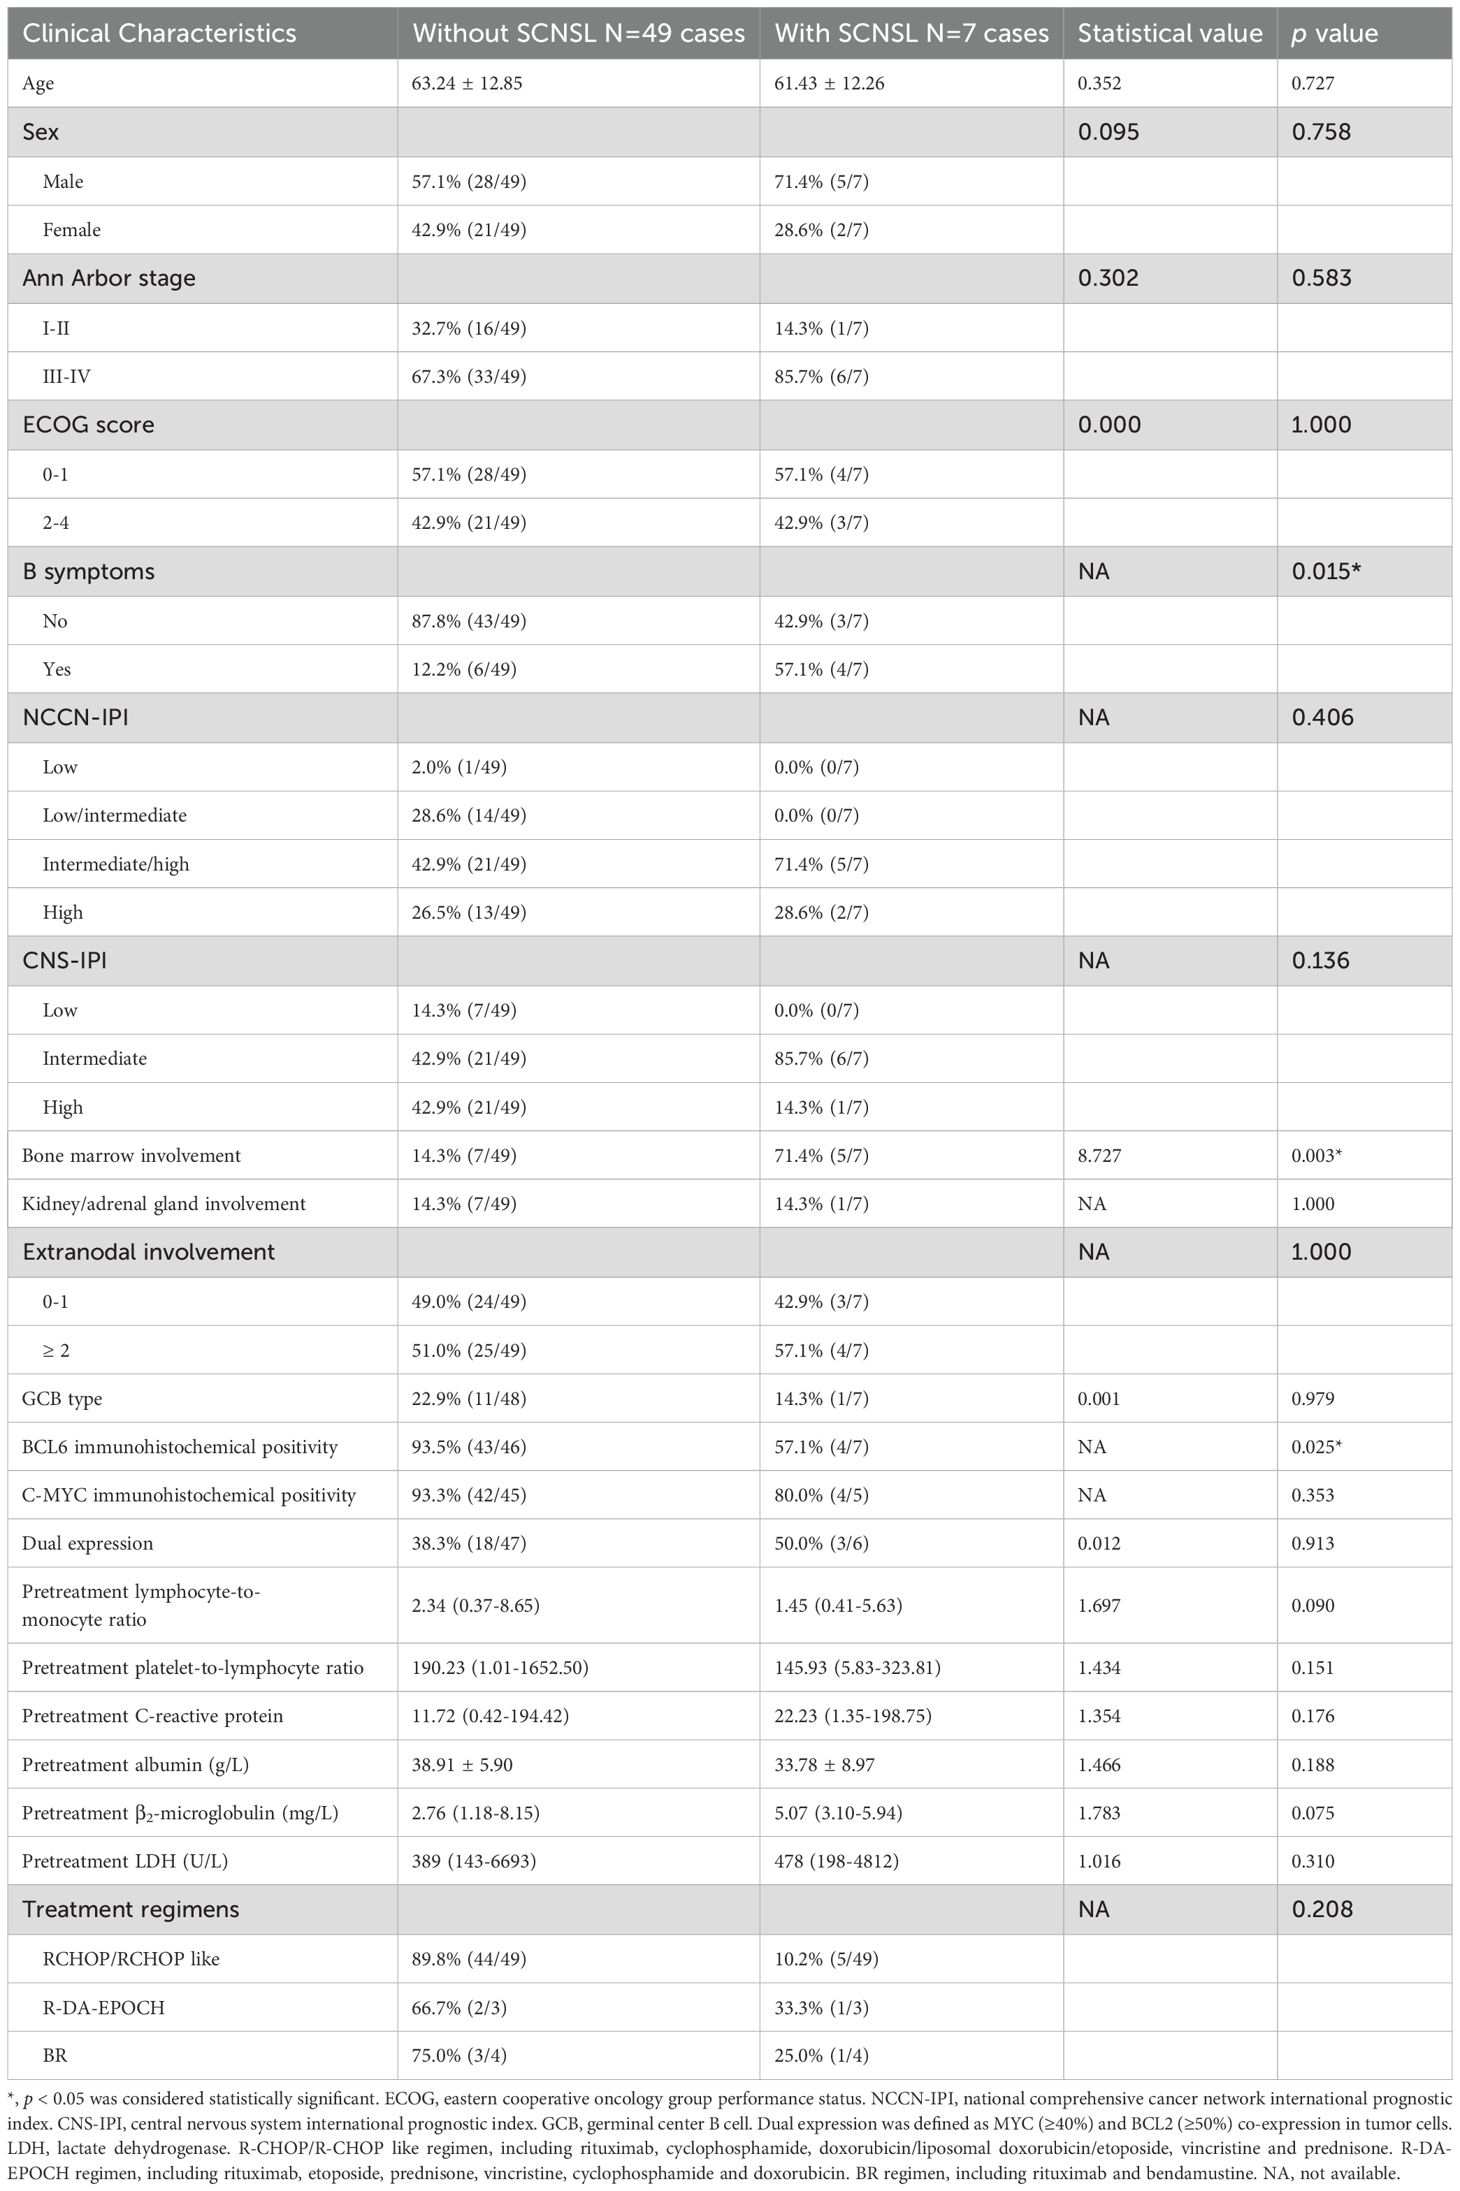
Table 1. General clinical characteristics of those with and without SCNSL.
There were no statistically significant differences between patients with and without SCNSL in terms of age, sex, Ann Arbor stage, NCCN-IPI, CNS-IPI, cell of origin, or treatment regimen (p > 0.05). Similarly, baseline biochemical parameters—including CRP, LMR, PLR, ALB, β2-microglobulin, and LDH—did not differ significantly between the two groups (Table 1).
3.2 Risk factors for SCNSL
Serum IL-10 and IL-6 levels were available for 50 patients. At diagnosis, patients who developed SCNSL had significantly higher median serum IL-10 levels (30.80 pg/mL; range: 3.60–1000.00) compared to those who did not (3.00 pg/mL; range: 1.50–728.00) (Z = 3.396, p = 0.001; Table 2). Receiver operating characteristic (ROC) curve analysis identified 15.0 pg/mL as the optimal cutoff for serum IL-10; 71% of SCNSL cases had IL-10 levels ≥15.0 pg/mL. In contrast, serum IL-6 levels did not differ significantly between groups (6.43 vs. 5.38 pg/mL; Z = 0.253, p = 0.801). Analysis of serum IL-10/IL-6 ratios revealed significantly elevated values in SCNSL patients (median: 7.80; range: 0.81–69.67) versus non-SCNSL patients (median: 0.91; range: 0.01–22.69) (Z = 3.180, p = 0.001). ROC analysis determined 2.30 as the optimal cutoff for the IL-10/IL-6 ratio. Elevated ratios (≥2.30) were observed in 85.7% of SCNSL cases compared to 11.6% of those without SCNSL (p = 0.000; Table 2).
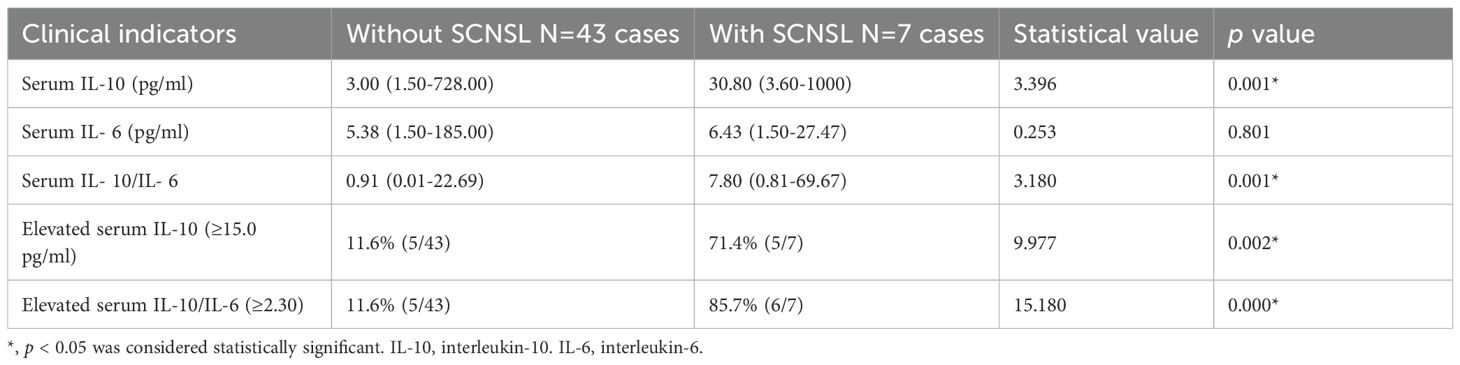
Table 2. Comparison of serum IL-10 and serum IL-6 in patients with and without SCNSL.
Univariate analysis identified five variables significantly associated with SCNSL: B symptoms, bone marrow involvement, BCL6 IHC positivity, elevated serum IL-10, and elevated IL-10/IL-6 ratio (p < 0.05; Tables 1, 2). These were included in a multivariate model, which identified the IL-10/IL-6 ratio as the sole independent predictor of SCNSL development (OR = 43.200; 95% CI: 4.269–437.158; p = 0.001).
Patients were stratified into CNS-IPI risk groups (low, intermediate, high), but the incidence of SCNSL did not differ significantly among these groups (p = 0.136). To enhance risk stratification, we integrated CNS-IPI scores with IL-10/IL-6 ratio status to construct a composite index (CNS-IPI-ratio). CNS-IPI scores of low, intermediate, and high were assigned 1, 2, and 3 points, respectively, with 1 additional point for IL-10/IL-6 ≥2.30. Patients were then classified as non–high risk (score 1–2) or high risk (score 3–4). Using this system, 85.7% (6/7) of SCNSL patients were categorized as high risk, significantly greater than the proportion among non-SCNSL patients (41.9%, 18/43; p = 0.045). Temporal analysis showed no significant difference in time to CNS relapse across original CNS-IPI risk groups (χ² = 1.654, p = 0.198; Figure 1A). In contrast, the CNS-IPI-ratio scoring system demonstrated improved prognostic discrimination, with the high-risk group exhibiting a significantly shorter median time to CNS relapse (22.32 vs. 40.35 months; χ² = 5.680, p = 0.017; Figure 1B).
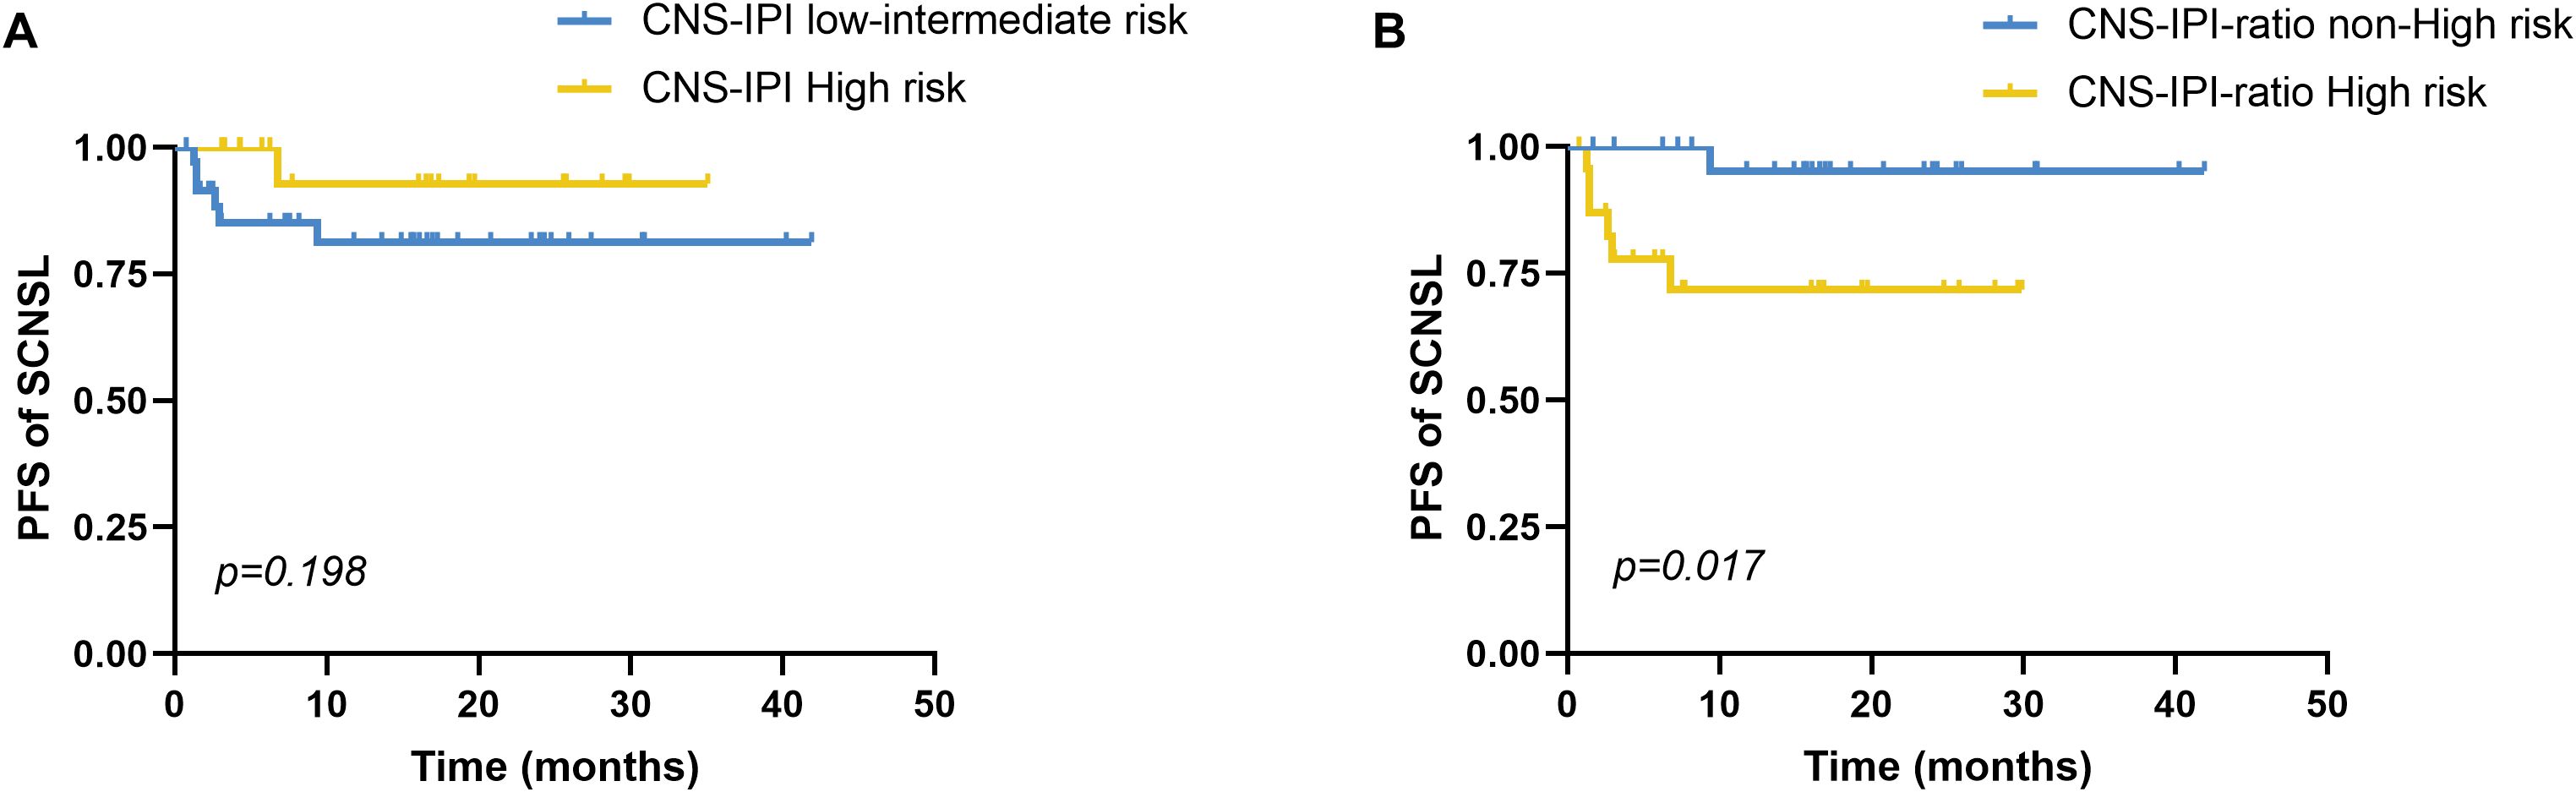
Figure 1. Progression-free survival to CNS relapse by CNS-IPI risk stratification. (A) Comparison of PFS until CNS relapse between the CNS-IPI low-intermediate risk (n=20) and high-risk (n=36) groups stratified by CNS-IPI, p=0.198. (B) The CNS-IPI-ratio scoring model integrates the CNS-IPI and elevated serum IL-10/IL-6 ratio. CNS-IPI low-, intermediate-, and high-risk levels scored 1, 2, and 3 points, respectively. An elevated serum IL-10/IL-6 ratio was assigned with 1 point. Based on the CNS-IPI-ratio, we divided all patients into the non-high-risk (scored 1-2) and high-risk (scored 3-4) groups. Comparison of PFS until CNS relapse between the CNS-IPI-ratio non-high-risk (n=24) and high-risk (n=26) groups stratified by the CNS-IPI-ratio, p=0.017. PFS, Progression-free survival. CNS, central nervous system, CNS-IPI, central nervous system international prognostic index. PFS was analyzed by the Kaplan-Meier method, and the difference between the groups was determined using the log-rank test.
3.3 Prognostic value of the serum IL-10/IL-6 ratio
PFS was significantly shorter in patients with elevated IL-10/IL-6 ratios (median: 15.42 months; 95% CI: 7.82–23.01) compared to those with lower ratios (median: 37.94 months; 95% CI: 33.75–42.14; χ² = 9.678, p = 0.002; Figure 2A). However, overall survival (OS) did not differ significantly between the two groups (16.10 vs. 27.93 months; χ² = 2.042, p = 0.153; Figure 2B). Elevated IL-10 alone was not significantly associated with either PFS (p = 0.062) or OS (p = 0.921; Figures 2C, D).
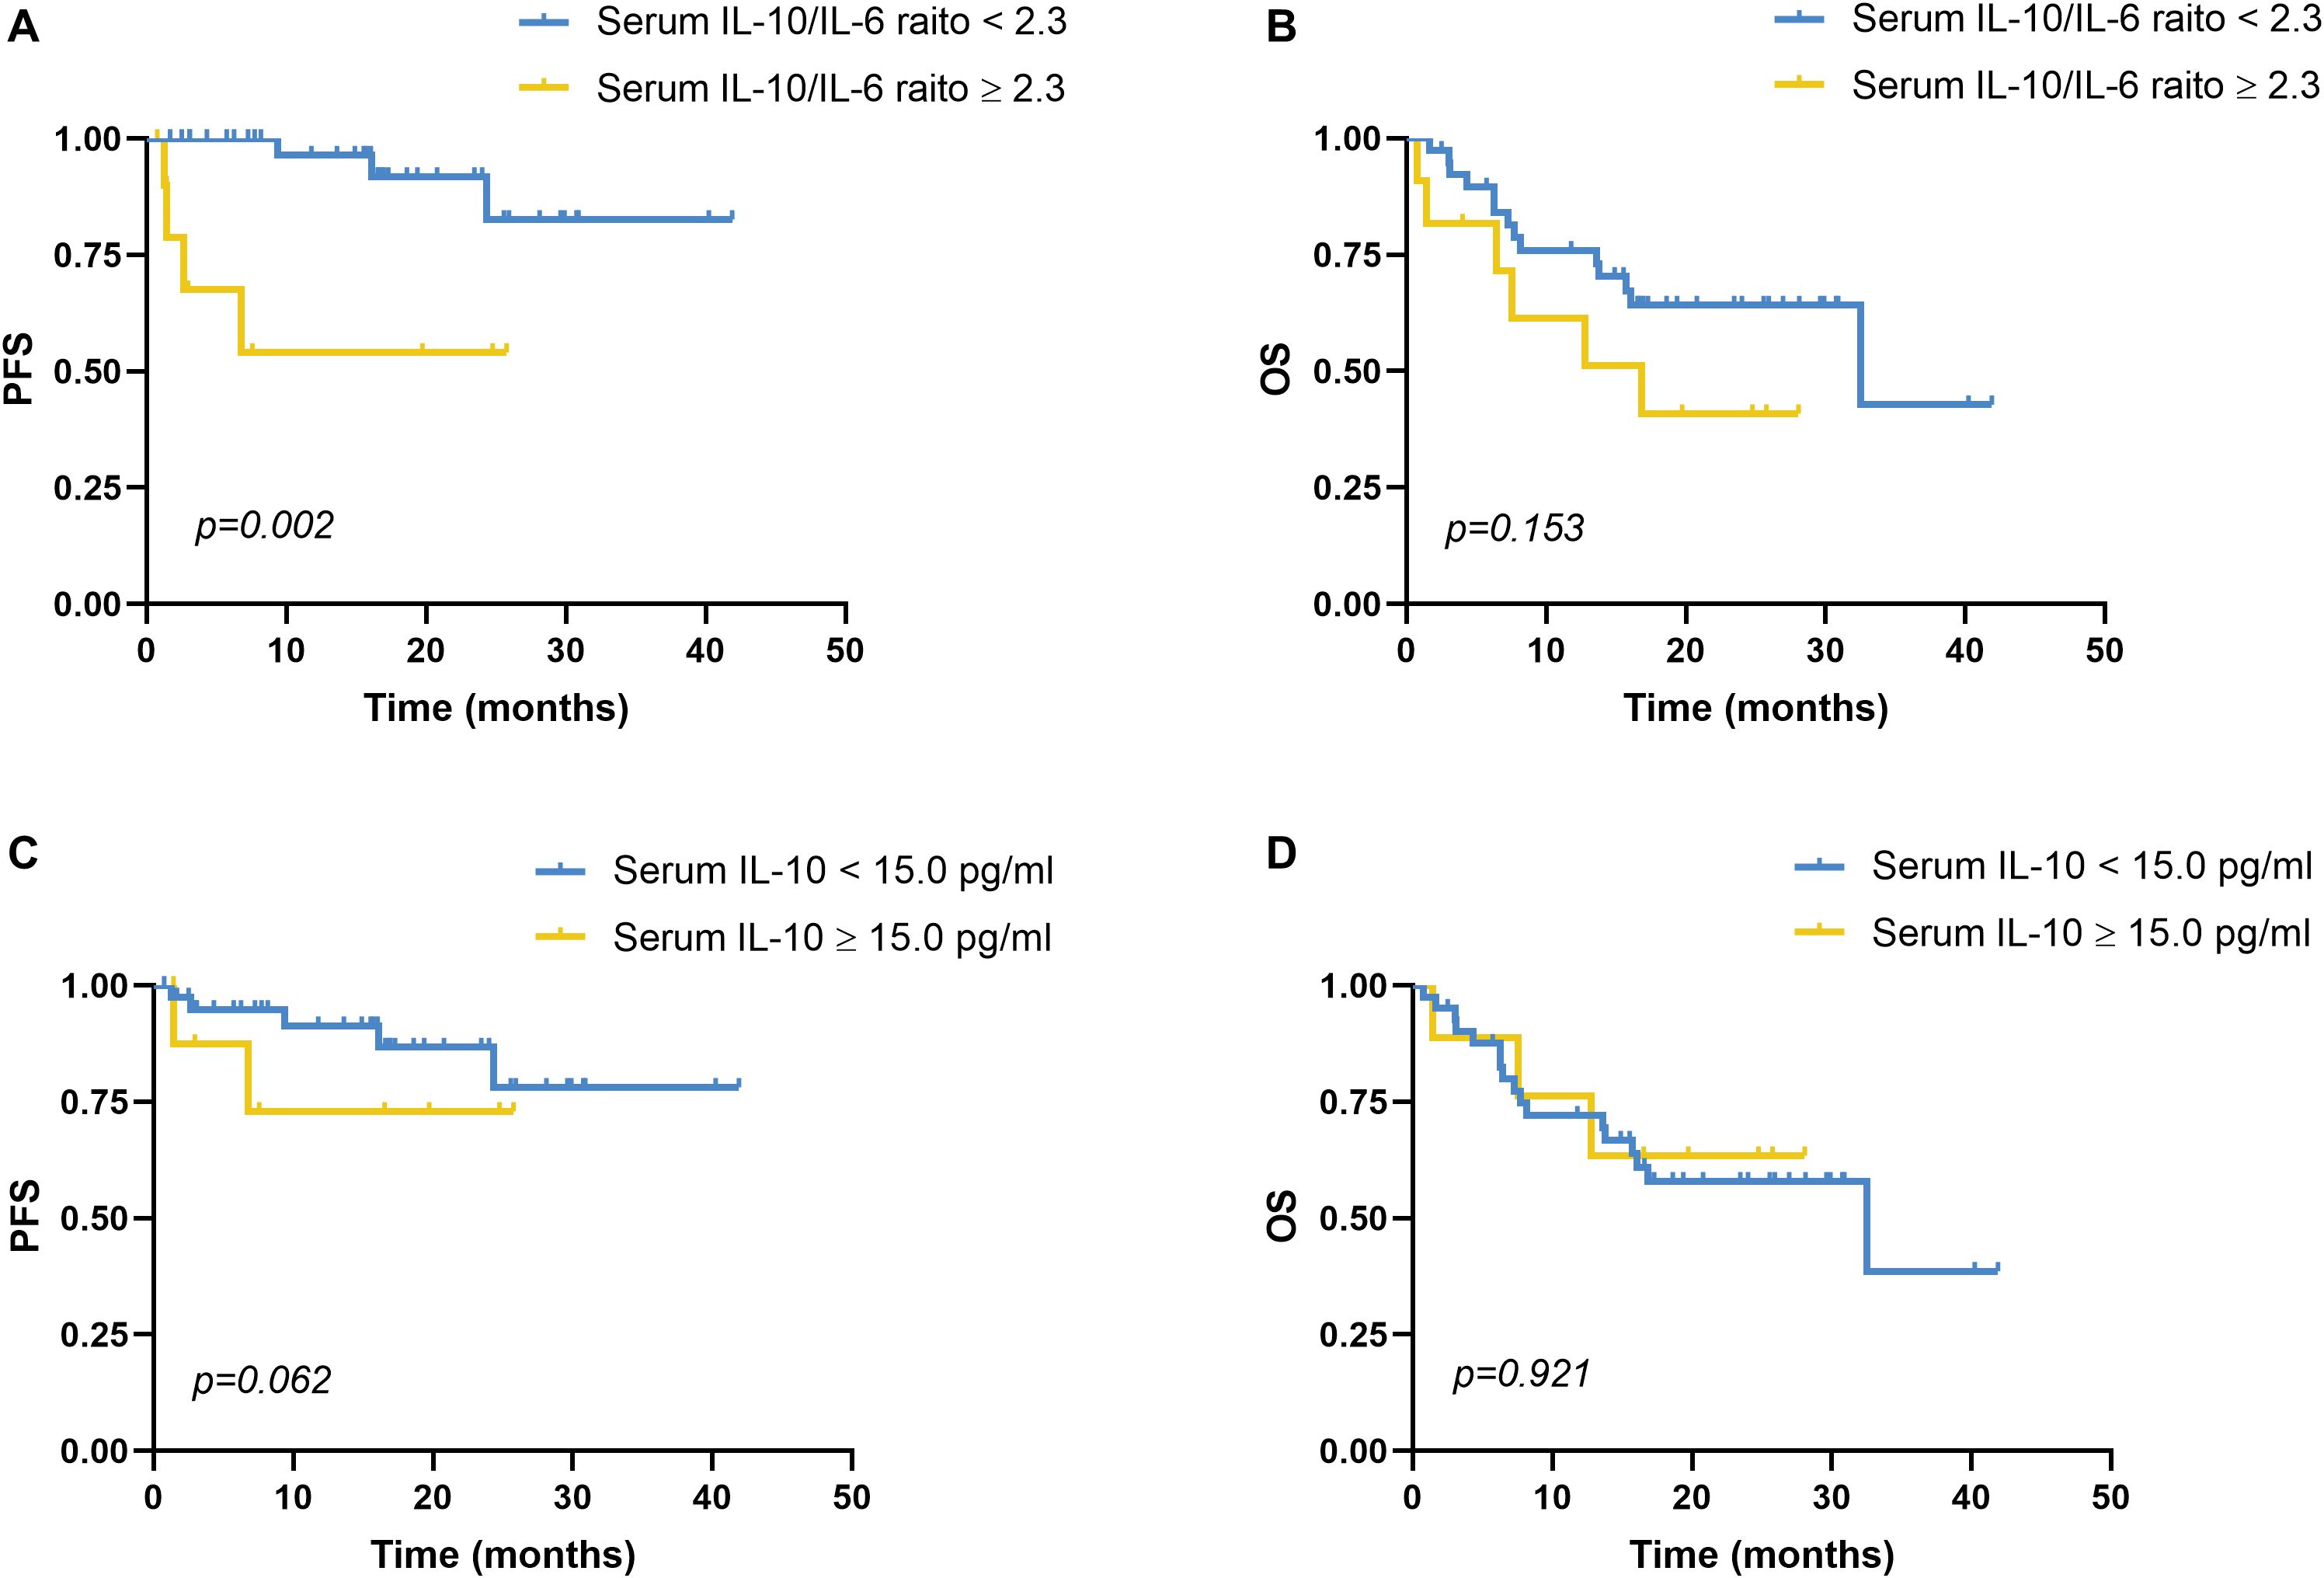
Figure 2. Progression-free survival and overall survival analyses of serum IL-10 and serum IL-10/IL-6. (A) PFS analysis in patients with a reduced serum IL-10/IL-6 ratio (<2.30, n=39) and an elevated serum IL-10/IL-6 ratio (≥2.30, n=11), p=0.002. Using disease recurrence as the endpoint, ROC curve analysis revealed that the optimal cutoff value of the serum IL-10/IL-6 ratio was 2.3. (B) OS analysis in patients with a reduced serum IL-10/IL-6 ratio (<2.30, n=39) and an elevated serum IL-10/IL-6 ratio (≥2.30, n=11), p=0.153. (C) PFS analysis in patients with a reduced serum IL-10 level (<15.0 pg/mL, n=41) and an elevated serum IL-10 level (≥15.0 pg/mL, n=9), p=0.062. With disease recurrence as the endpoint, ROC curve analysis identified the optimal cutoff value of the serum IL-10 level was 15.0 pg/mL. (D) OS analysis in patients with a reduced serum IL-10 level (<15.0 pg/mL, n=41) and an elevated serum IL-10 level (≥15.0 pg/mL, n=9), p=0.921. PFS, progression-free survival; OS, overall survival; IL-10, interleukin-10; IL-6, interleukin-6. PFS and OS were analyzed by the Kaplan-Meier method, and the difference between the groups was determined using the log-rank test.
Univariate analysis showed that PFS was significantly associated with B symptoms and BCL6 IHC positivity (Figures 3A, B). Other variables—including bone marrow involvement, C-MYC expression, GCB subtype, MYC/BCL2 co-expression, and six-course treatment—did not significantly affect PFS (Figures 3C, D; p > 0.05). Multivariate analysis incorporating B symptoms, BCL6 positivity, and IL-10/IL-6 ratio ≥2.30 identified the IL-10/IL-6 ratio as the only independent predictor of shorter PFS (HR = 7.300; 95% CI: 1.615–33.006; p = 0.010).
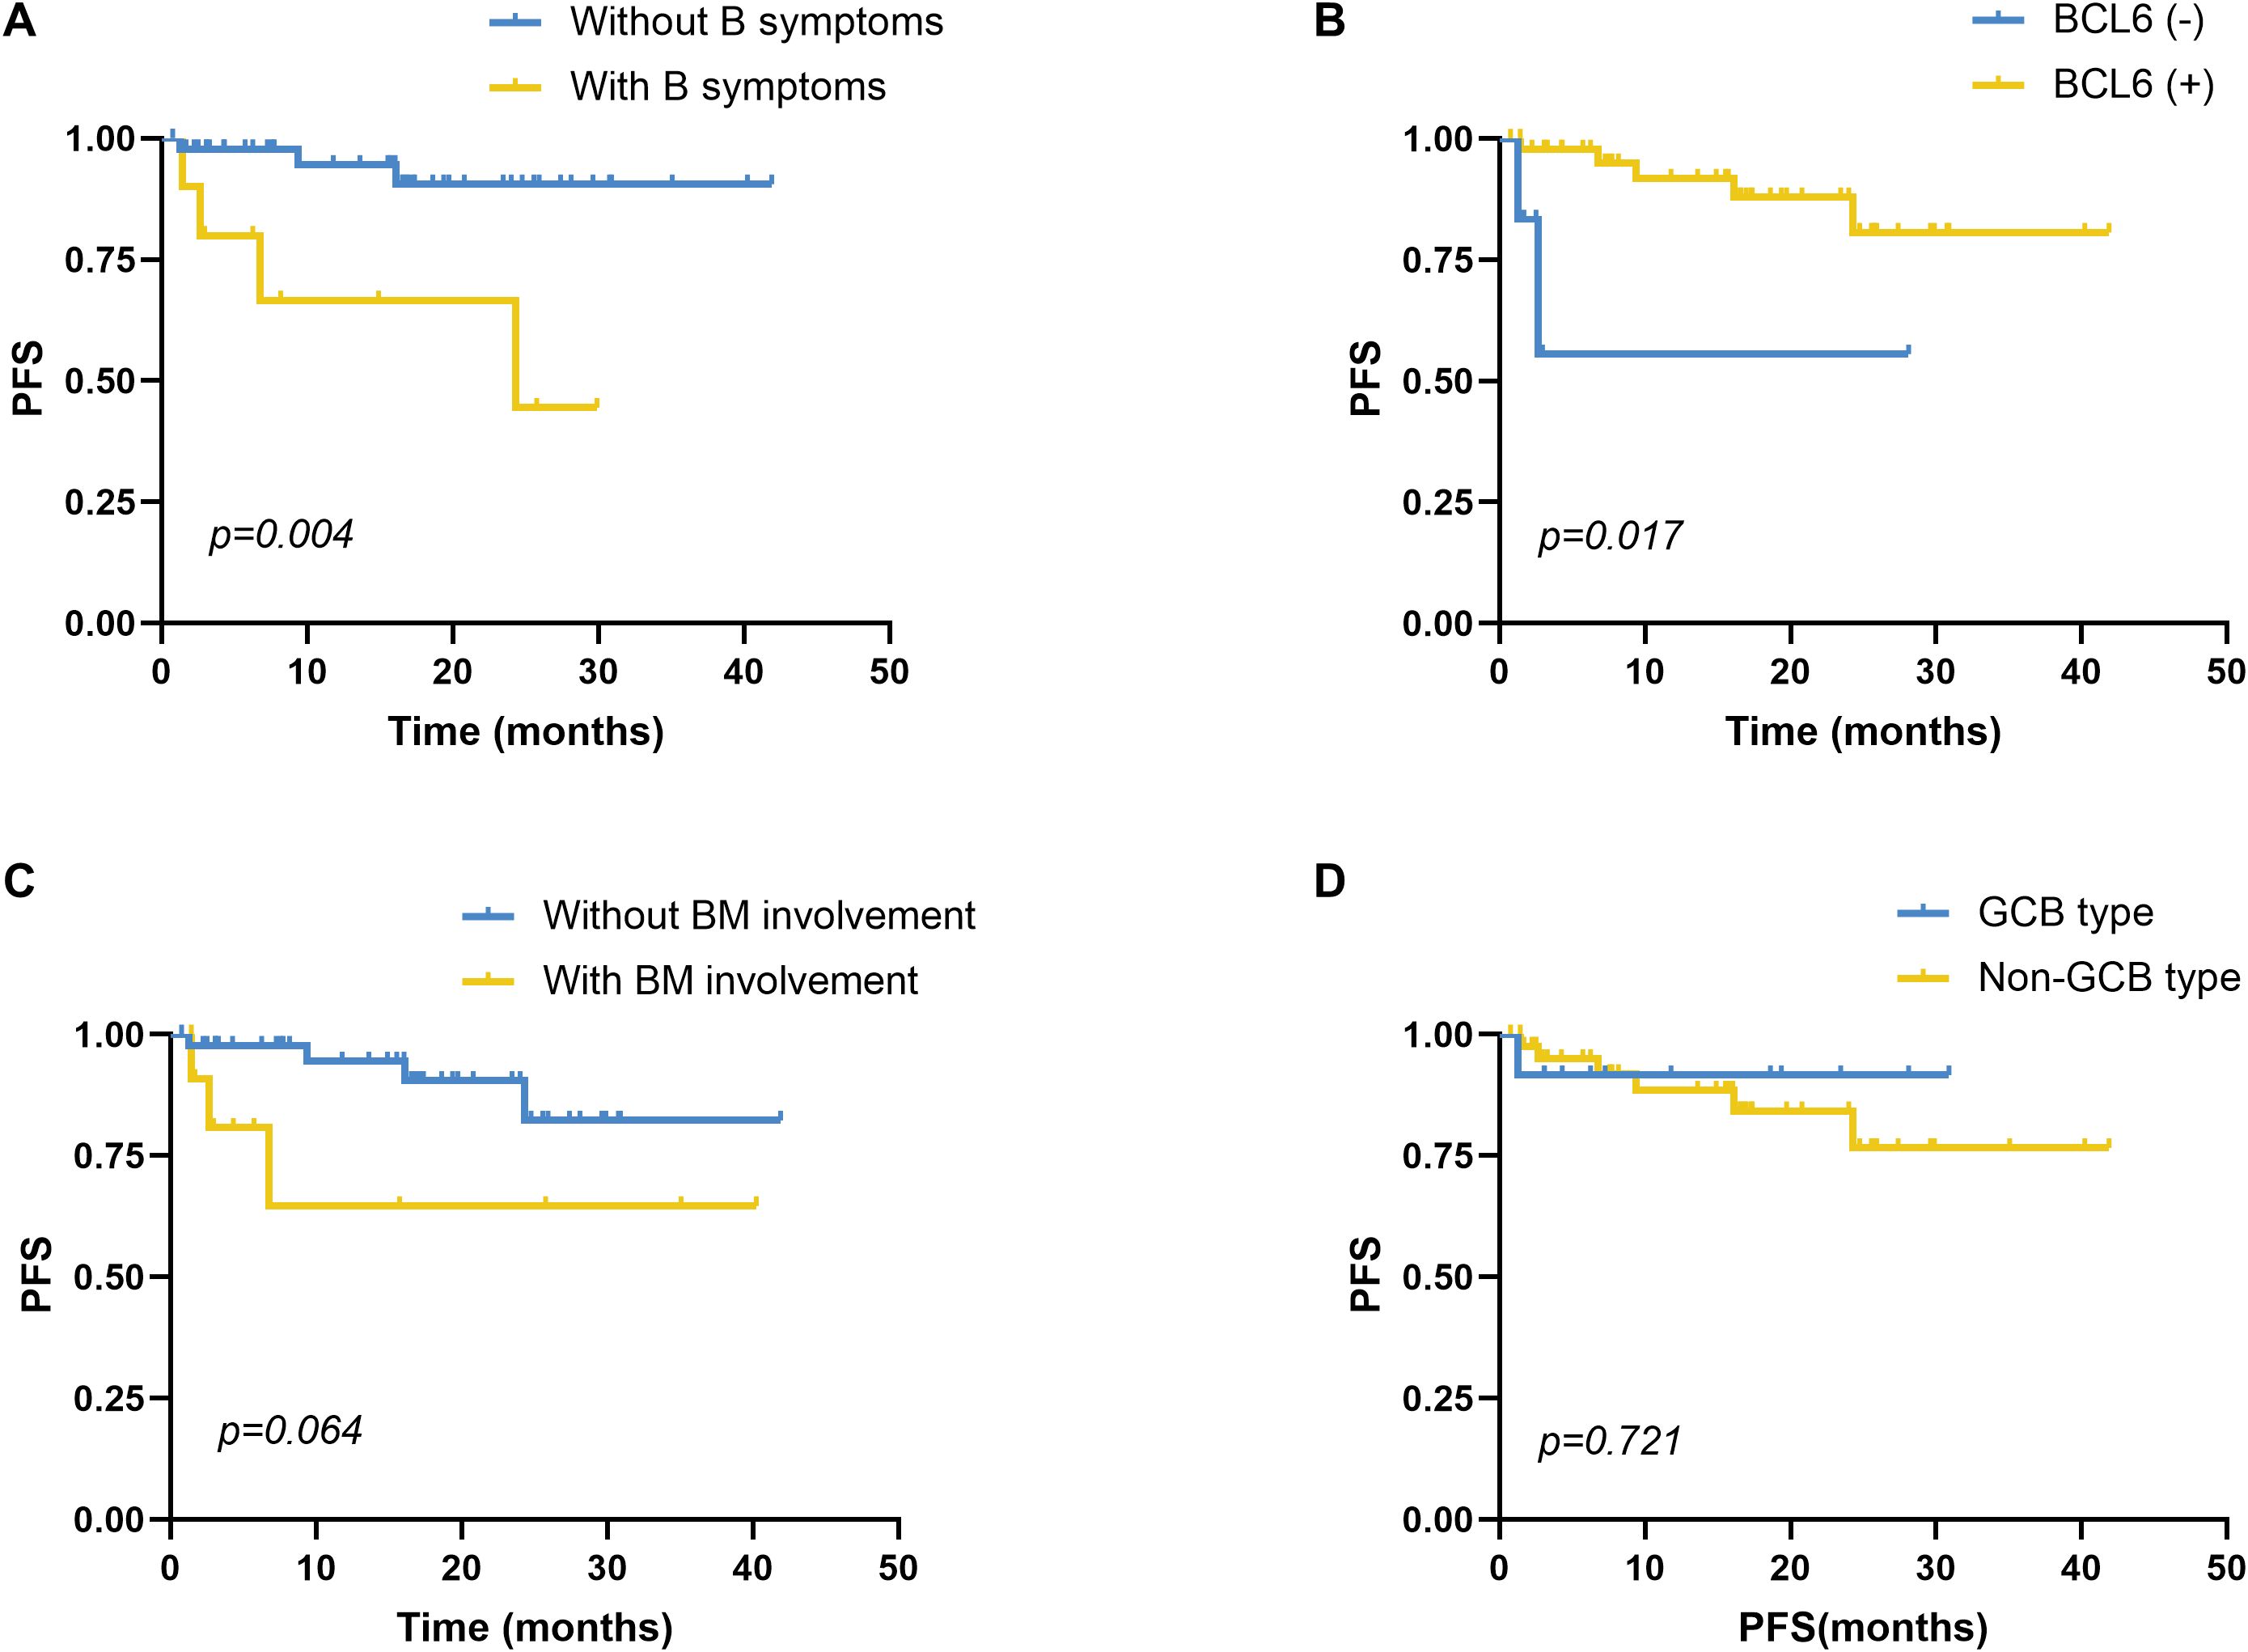
Figure 3. Survival analysis of PFS in DLBCL patients. (A) Comparison of PFS between patients with (n=10) and without (n=46) symptoms, p=0.004. (B) Comparison of PFS between patients with BCL6 IHC positivity (n=47) and negativity (n=6), p=0.017. (C) Comparison of PFS between patients with (n=12) and without BM involvement (n=44), p=0.064. (D) Comparison of PFS between patients with the GCB type (n=12) and non-GCB type (n=43), p=0.721. GCB and non-GCB subtypes based on the Hans algorithm. PFS, progression-free survival; DLBCL, diffuse large B-cell lymphoma; BM, bone marrow, GCB, germinal center B cell; non-GCB, non-germinal center B cell. PFS was analyzed using the Kaplan-Meier method, and the difference between the groups was determined using the log-rank test.
Patients with NCCN-IPI scores of 0–5 were classified as the non–high-risk group, whereas those with scores ≥6 comprised the high-risk group. The high-risk group had a median PFS of 27.81 months (95% CI: 23.86–31.75), compared to 35.50 months (95% CI: 30.85–40.14) in the non–high-risk group; however, this difference was not statistically significant (χ²=0.196, p=0.658; Figure 4A). Similarly, the median OS was 16.92 months (95% CI: 10.29–23.55) in the high-risk group versus 29.69 months (95% CI: 24.30–35.08) in the non–high-risk group, with no significant difference (χ²=2.848, p=0.091; Figure 4B).
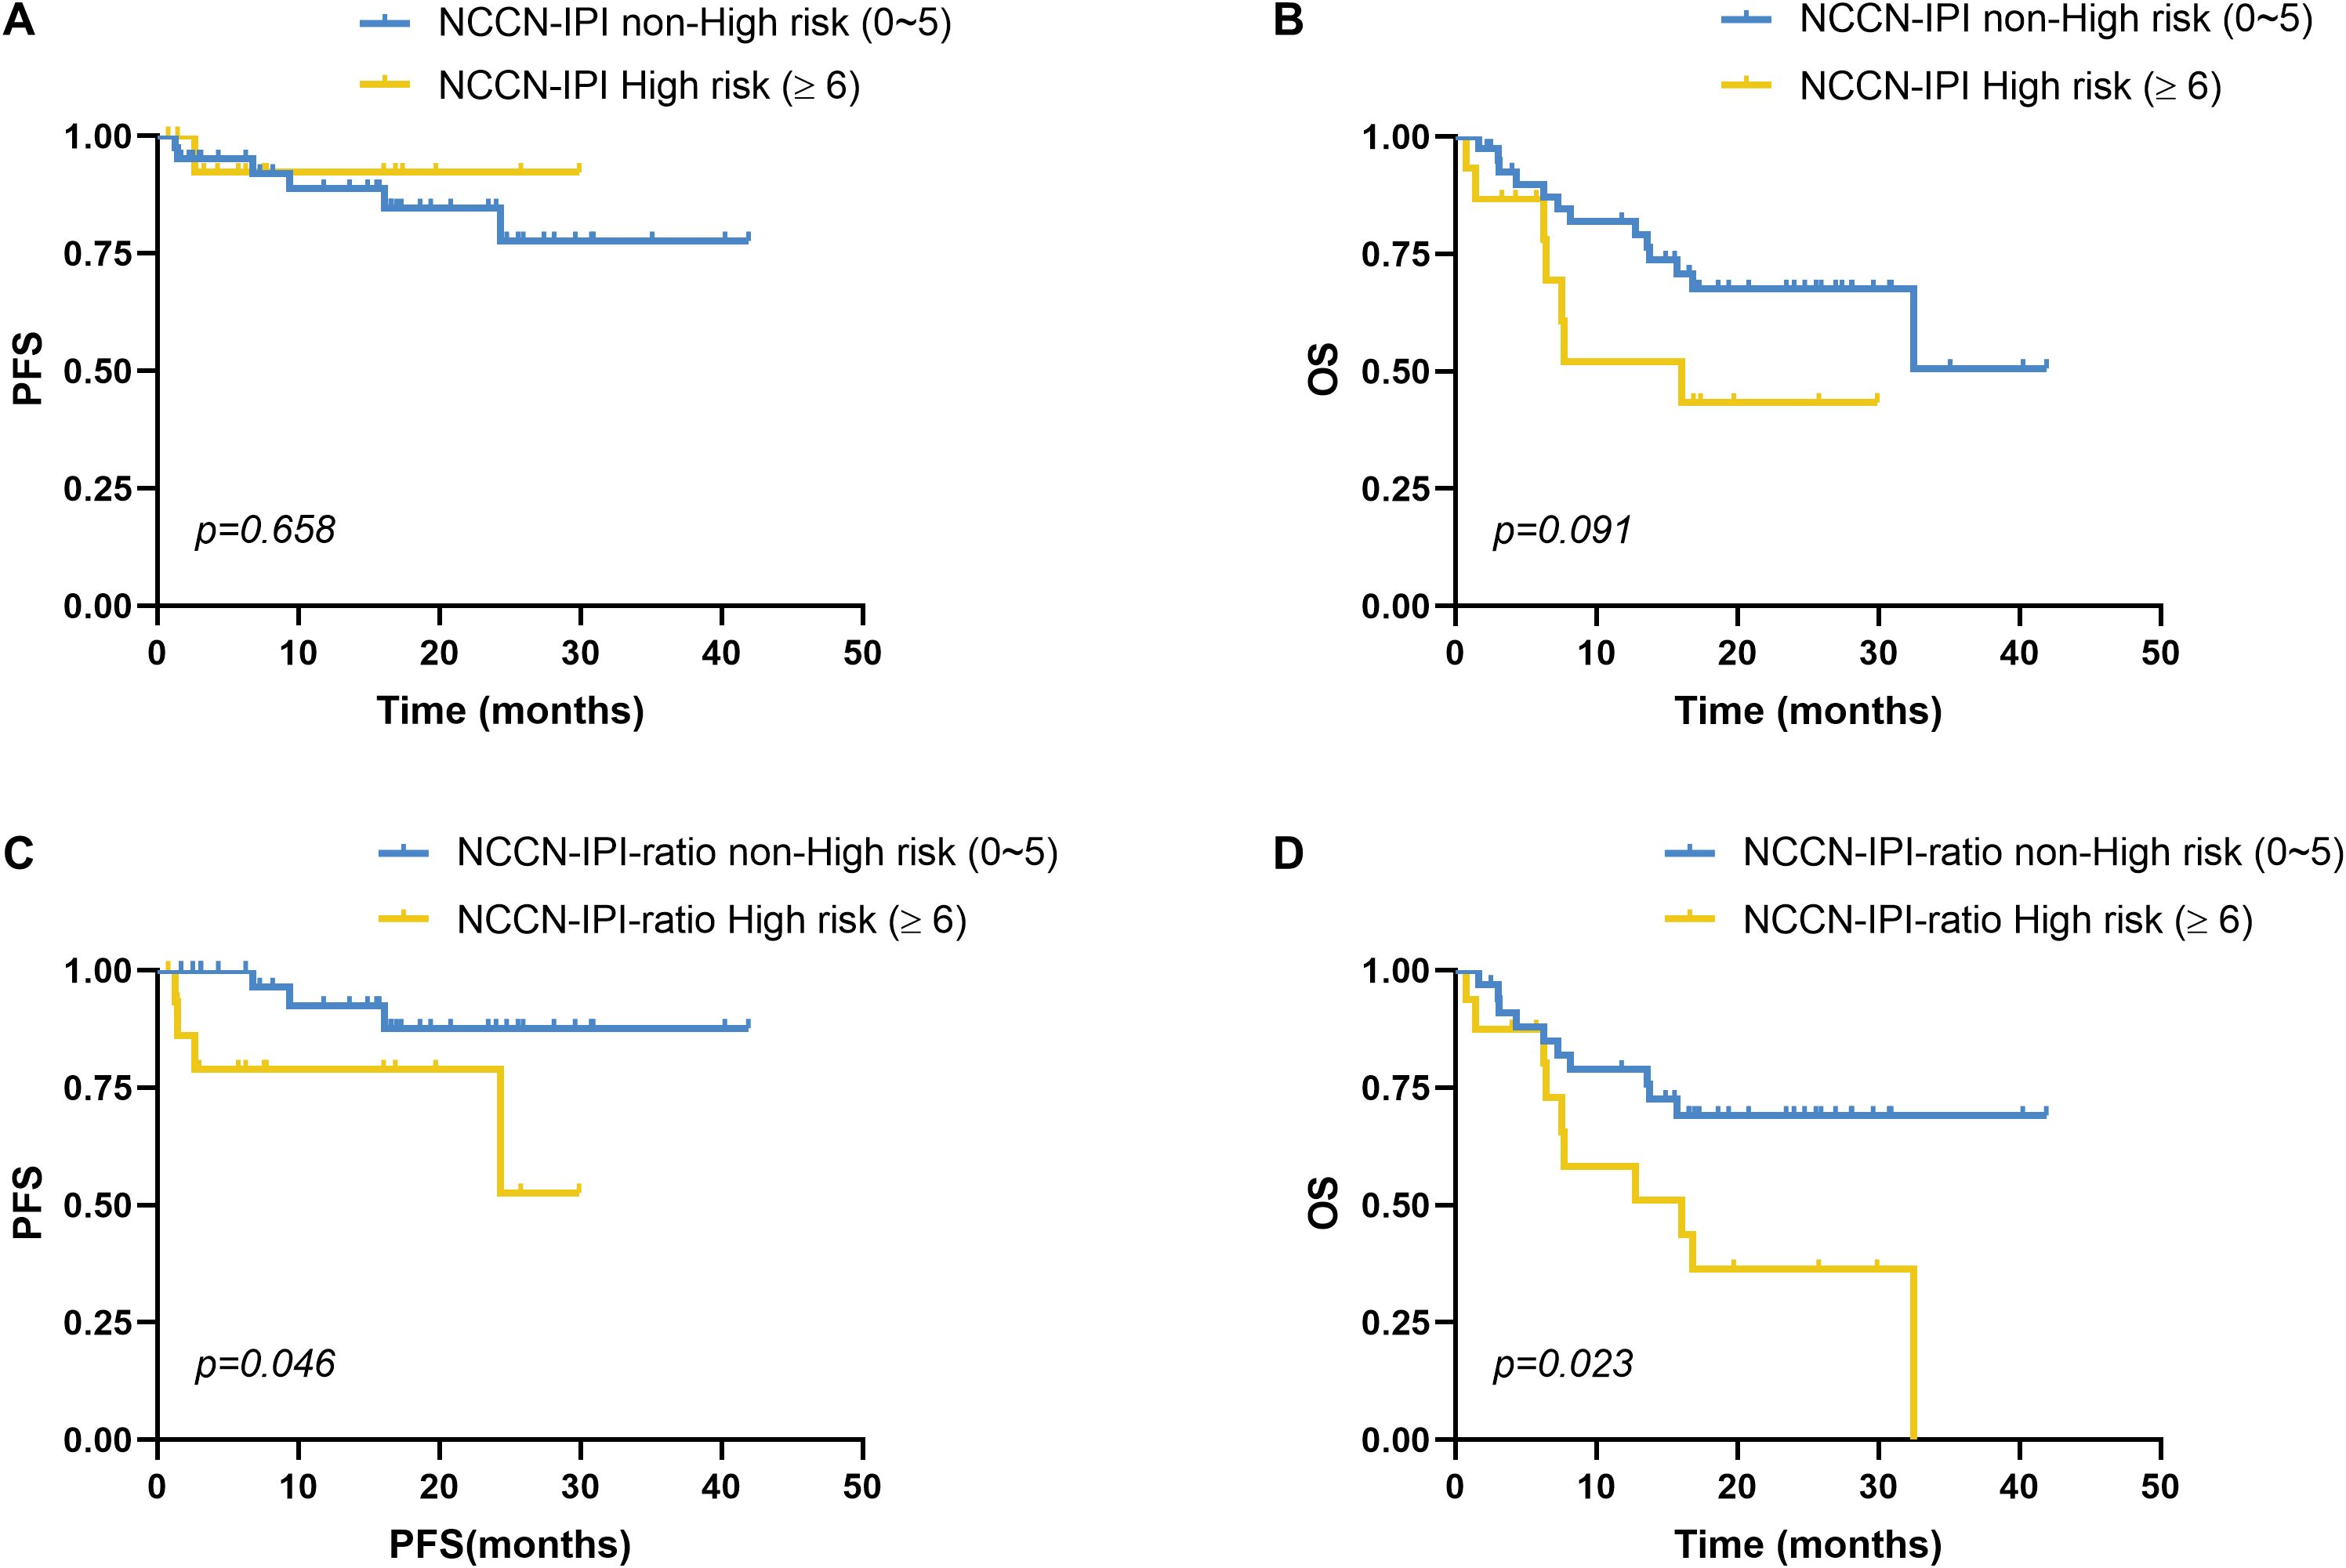
Figure 4. Impact of NCCN-IPI risk stratification on survival in DLBCL. (A) PFS and (B) OS comparisons between the NCCN-IPI high-risk (n=15) and non-high-risk (n=41) groups showed no statistically significant differences (PFS: p=0.658; OS: p=0.091). (C-D) Novel NCCN-IPI-ratio scoring system was created by adding 1 point to standard NCCN-IPI scores for patients with elevated serum IL-10/IL-6 ratios (≥2.30 pg/mL). (C) PFS and (D) OS comparisons between the NCCN-IPI-ratio high-risk (n=16) and non-high-risk (n=34) groups showed statistically significant differences (PFS: p=0.046; OS: p=0.023). Stratification thresholds followed standard NCCN-IPI criteria (high risk: ≥6) and were equivalently applied to the NCCN-IPI-ratio. PFS and OS were analyzed using the Kaplan-Meier method, and the difference between the groups was determined using the log-rank test.
We next developed a novel prognostic model, termed the NCCN-IPI-ratio, by integrating the serum IL-10/IL-6 ratio into the traditional NCCN-IPI framework. Specifically, patients with elevated IL-10/IL-6 ratios (≥2.30 pg/mL) received an additional 1 point on the NCCN-IPI. This modified score preserved the original risk stratification scheme, defining non–high-risk (0–5 points) and high-risk (≥6 points) categories. The NCCN-IPI-ratio yielded clinically meaningful prognostic discrimination. High-risk patients (≥6 points) had a significantly shorter median PFS (22.53 months, 95% CI: 16.50–28.56) compared to non–high-risk patients (38.14 months, 95% CI: 34.13–42.14), with the difference reaching statistical significance (χ²=3.989, p=0.046; Figure 4C). Similarly, median OS was significantly shorter in the high-risk group (17.36 months, 95% CI: 10.66–24.06) versus the non–high-risk group (31.39 months, 95% CI: 25.90–36.87; χ²=5.135, p=0.023; Figure 4D).
3.4 IL-10 and IL-6 mRNA expression in GEO datasets
Given the limited sample size in our primary cohort, we further validated these findings using publicly available GEO datasets (GSE87371 and GSE10846) to analyze IL-10 and IL-6 mRNA expression profiles from RNA-seq data.
In the prospective multicenter LYSA cohort (GSE87371, n=223), IL-10/IL-6 mRNA expression ratios were significantly associated with clinical outcomes. ROC analysis identified an optimal cutoff of 1.27 for predicting disease progression (AUC=0.572). Patients with ratios <1.27 had significantly longer mean PFS (56.52 months, 95% CI: 50.66–62.38) than those with ratios ≥1.27 (52.48 months, 95% CI: 45.71–59.26; log-rank χ²=5.001, p=0.025; Supplementary Figure 1A). For OS, the optimal cutoff was 1.65 (AUC=0.560). Patients with ratios <1.65 had superior mean OS (64.01 months, 95% CI: 58.46–69.56) compared to those with ratios ≥1.65 (50.53 months, 95% CI: 43.78–57.28; χ²=4.678, p=0.031; Supplementary Figure 1B). High-risk IPI scores (≥4) were associated with significantly worse PFS (χ²=19.442, p<0.001). Incorporating the IL-10/IL-6 ratio (≥1.27 scored as 1 point) into the IPI model, patients with IPI-ratio scores ≥5 had significantly poorer PFS than those with scores <5 (χ²=22.240, p<0.001; Supplementary Figure 1C), with improved prognostic discrimination (χ² increase from 19.442 to 22.240). Similarly, for OS, patients with high IPI scores (≥4) had significantly worse outcomes (χ²=33.378, p<0.001). The integrated IPI-ratio model (ratio ≥1.65 scored as 1 point) further enhanced OS stratification, with high-risk patients (score ≥5) showing significantly shorter survival (χ²=52.641, p<0.001; Supplementary Figure 1D), and improved discriminatory power (χ² increase from 33.378 to 52.641).
In the retrospective cohort (GSE10846, n=414), including 181 CHOP-treated and 233 R-CHOP–treated patients, ROC analysis yielded an optimal IL-10/IL-6 cutoff of 1.0 for OS prediction (AUC=0.483). Although the survival difference did not reach statistical significance (χ²=1.124, p=0.289), patients with ratios <1.0 demonstrated a numerically longer mean OS (11.42 years, 95% CI: 9.66–13.19) than those with ratios ≥1.0 (5.78 years, 95% CI: 4.94–6.63), suggesting a potential prognostic trend.
3.5 CSF IL-10 and CSF IL-6
Among the enrolled DLBCL patients, CSF IL-10 and IL-6 levels were measured in 18 cases, including 3 who later developed SCNSL. For comparative purposes, we also evaluated 9 age-matched controls hospitalized with non-neoplastic intracranial conditions. CSF cytokine concentrations are detailed in Table 3. Patients with SCNSL exhibited significantly elevated CSF IL-10 levels compared to both non-SCNSL patients (median: 224.0 vs 3.0 pg/mL; Z=2.963, p=0.003) and controls (224.0 vs 3.0 pg/mL; Z=2.608, p=0.009; Figure 5A). Similarly, the CSF IL-10/IL-6 ratio was markedly higher in SCNSL patients relative to both non-SCNSL patients (median: 67.88 vs 0.74; Z=2.074, p=0.038) and controls (67.88 vs 0.79; Z=2.126, p=0.033; Figure 5B). However, these findings should be interpreted cautiously given the limited number of SCNSL cases (n=3), which constrains cutoff reliability and underscores the need for validation in larger cohorts. Notably, no significant difference in CSF IL-6 levels was observed between SCNSL and non-SCNSL patients (3.30 vs 3.09 pg/mL; Z=0.889, p=0.374; Figure 5C).
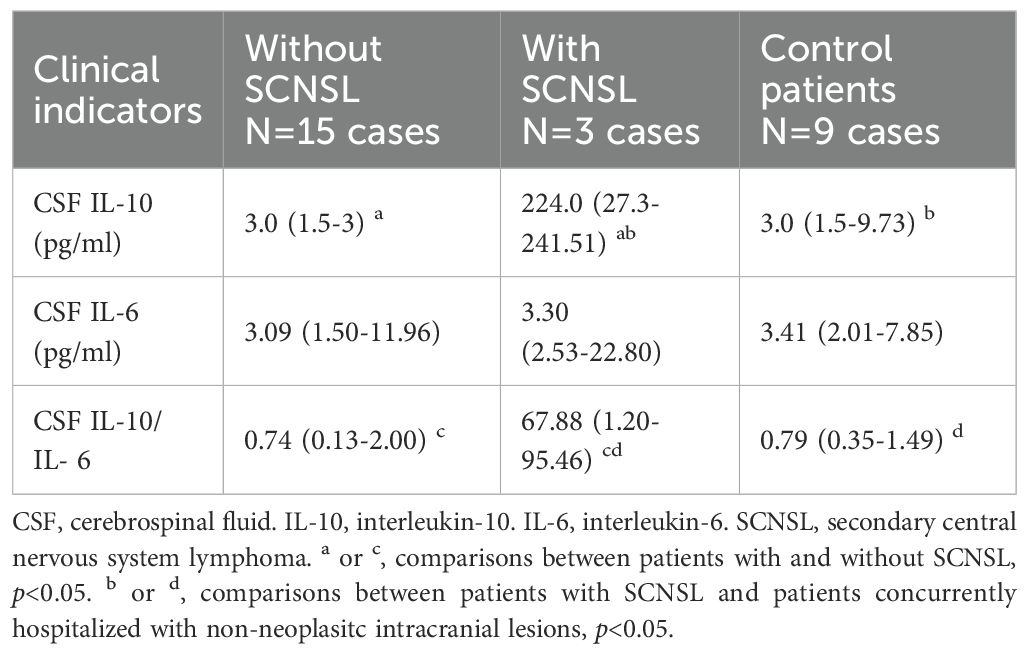
Table 3. Comparison of CSF IL-10 and CSF IL-6 in those with and without SCNSL and concurrent hospitalized control patients.
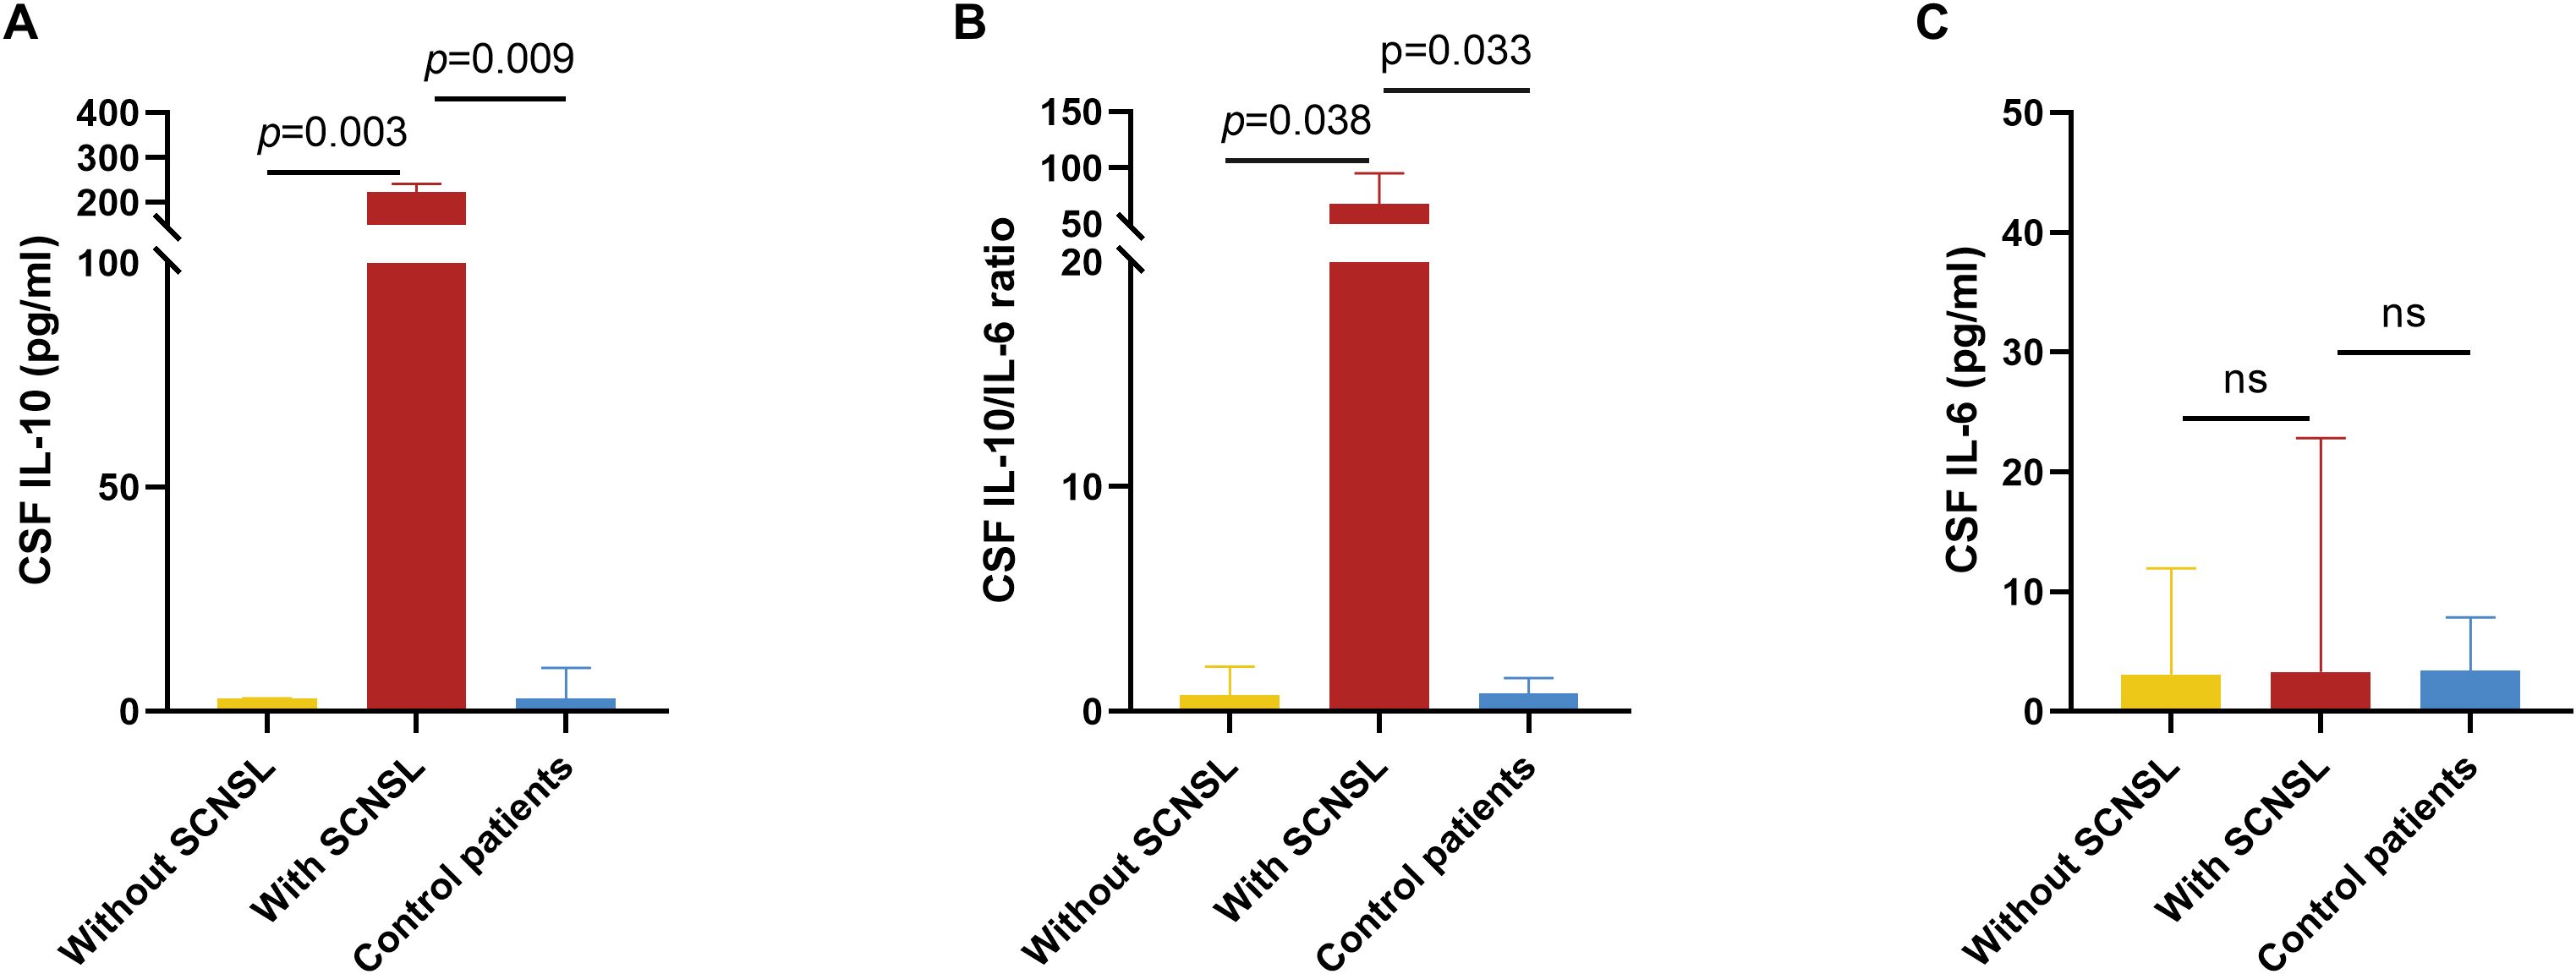
Figure 5. CSF IL-10 and CSF IL-6 levels in patients with and without SCNSL. For a comparative analysis, we concurrently evaluated 9 age-matched control patients hospitalized with non-neoplastic intracranial lesions during the same study period. (A) Concentrations of CSF IL-10 in patients with SCNSL, patients without SCNSL and control patients. n=3, 15, and 9, respectively. (B) Ratio of CSF IL-10/IL-6 in patients with SCNSL, patients without SCNSL, and control patients. n=3, 15, and 9, respectively. (C) Concentrations of CSF IL-6 in patients with SCNSL, patients without SCNSL and control patients. n=3, 15, and 9, respectively. ns, not significant values are indicated. SCNSL, secondary central nervous system lymphoma; CSF, cerebrospinal fluid; IL-10, interleukin-10; IL-6, interleukin-6.
3.6 Correlation of serum IL-6 and IL-10 with CSF IL-6 and IL-10
Paired serum and CSF IL-10 measurements were available for 15 patients. A significant positive correlation was observed between serum and CSF IL-10 levels (r = 0.641, p = 0.014; Figure 6A). Similarly, the serum IL-10/IL-6 ratio was significantly correlated with CSF IL-10 concentrations (r = 0.657, p = 0.011; Figure 6B). In a separate cohort of 18 patients with matched CSF IL-10, IL-6, and LDH data, the CSF IL-10/IL-6 ratio was significantly correlated with CSF LDH levels (r = 0.625, p = 0.006; Figure 6C). However, neither CSF IL-10 (p = 0.106) nor CSF IL-6 alone (p = 0.193) showed a significant association with CSF LDH.
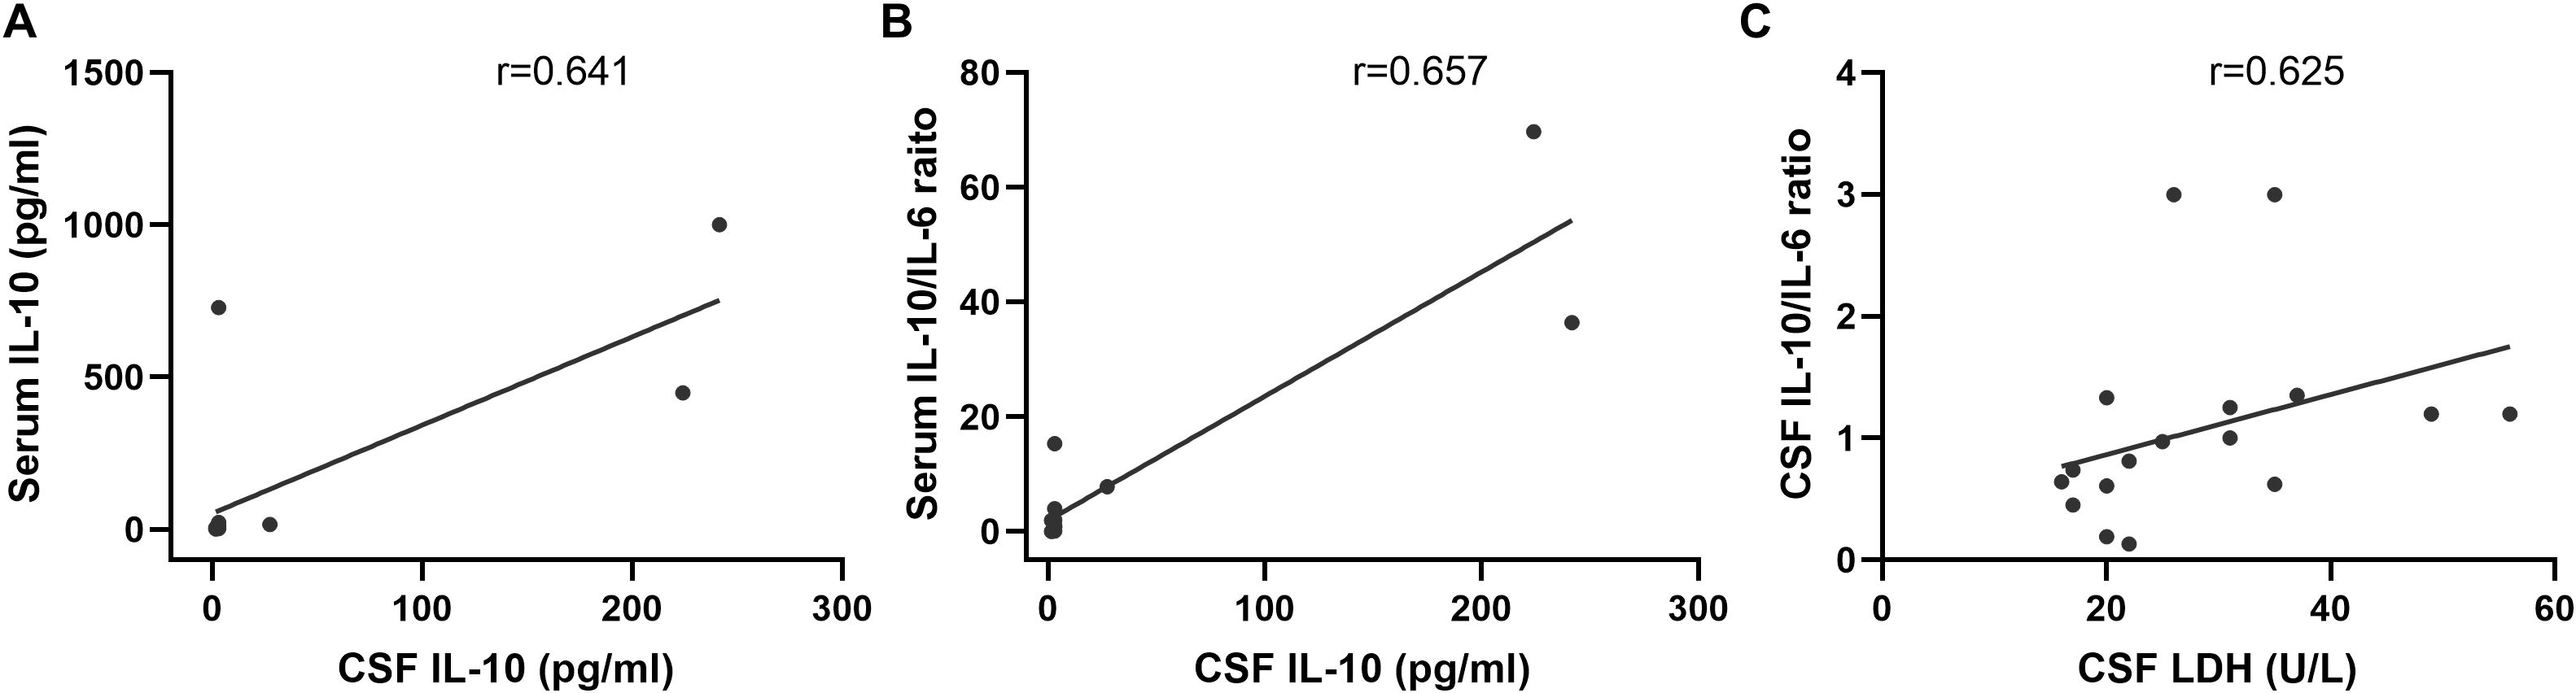
Figure 6. Correlation of serum IL-6 and IL-10 with CSF IL-6 and IL-10 levels. (A) Significant correlation between serum IL-10 and CSF IL-10 (r=0.641, n=14, p=0.014). (B) Serum IL-10/IL-6 ratio showing a significant correlation with CSF IL-10 concentrations (r=0.657, n=14, p=0.011). (C) CSF IL-10/IL-6 ratio exhibiting a notable correlation with LDH levels (r=0.625, n=18, p=0.006).
4 Discussion
SCNSL represents a devastating complication in DLBCL with uniformly poor outcomes. The CNS-IPI does not account for the biological heterogeneity of DLBCL (2), limiting its ability to effectively stratify patients at risk of CNS involvement. Previous reports have linked elevated serum levels of IL-6 and IL-10 to adverse prognosis in DLBCL (25, 26). In the present study, we investigated the clinical utility of serum IL-6, IL-10, and the IL-10/IL-6 ratio, analyzing their associations with disease progression and SCNSL development. Our findings demonstrate that the serum IL-10/IL-6 ratio functions as an independent risk factor for both disease progression and CNS relapse. Moreover, incorporating this biomarker into CNS-IPI and NCCN-IPI models significantly improved their ability to identify high-risk patients.
Chronic inflammation creates a microenvironment conducive to tumor initiation, promotion, progression, metastasis, and resistance to chemotherapy, primarily through the activity of inflammatory cells, cytokines, chemokines, and other mediators. Key cytokines within this milieu include IL-6, IL-10, among others (27). Elevated serum IL-6 levels have been consistently reported in patients with DLBCL compared to healthy controls (28, 29). Dlouhy et al. (30) demonstrated that higher serum IL-6 levels were significantly associated with shorter PFS in DLBCL. More recently, Bao et al. (10) showed that increased IL-6 not only correlates with adverse clinical features and PFS but also functions as an independent prognostic marker for relapse and OS. Compared with patients exhibiting normal serum IL-6 levels, those with elevated IL-6 were more likely to exhibit partial or no response to therapy.
Similarly, several studies have reported that elevated serum IL-10 at diagnosis is associated with unfavorable disease features and poor clinical outcomes (31–33). In comparison with healthy controls, DLBCL patients demonstrated significantly higher serum IL-10 levels (p < 0.001). Patients with IL-10 concentrations ≥5.0 pg/mL experienced significantly shorter PFS and OS (p < 0.001) (10). Yi et al. (1) investigated the association between pretreatment serum cytokines and the occurrence of SCNSL in DLBCL. Their findings revealed that patients with elevated serum IL-10 levels were more likely to develop SCNSL and experienced earlier CNS involvement. Moreover, CNS infections or inflammatory conditions can elevate IL-10 levels in CSF, often accompanied by a reduced IL-10/IL-6 ratio (34, 35). This may reflect a compensatory anti-inflammatory response by immune cells in reaction to pro-inflammatory cytokines such as IL-6 (12, 36). Therefore, in this study, we also evaluated the IL-10/IL-6 ratio in both CSF and serum to determine its utility in identifying patients at high risk for SCNSL.
Our study explored the prognostic significance of serum IL-10 and IL-6 in the development of SCNSL and uncovered several clinically relevant insights. Although both cytokines were assessed, only serum IL-10 levels were significantly elevated in SCNSL patients (30.80 vs. 3.00 pg/mL, p = 0.001), suggesting a predominant role in CNS tropism. Importantly, the serum IL-10/IL-6 ratio emerged as a particularly powerful biomarker, demonstrating an 8.6-fold increase in SCNSL patients (7.80 vs. 0.91 pg/mL, p = 0.001). This ratio may better reflect the immunosuppressive tumor microenvironment than absolute cytokine levels alone, as the anti-inflammatory effects of IL-10 may dominate when disproportionately elevated relative to IL-6. Multivariate analysis confirmed that a serum IL-10/IL-6 ratio ≥2.3 was the only independent predictor of both poor PFS (HR = 7.30, p = 0.010) and SCNSL development (odds ratio [OR] = 43.20, p = 0.001). The strength of these associations highlights the ratio’s potential clinical relevance. Supporting this, patients with elevated ratios had significantly shorter median PFS (15.42 vs. 37.94 months, p = 0.002), representing a clinically meaningful 22.5-month difference. These findings support a novel paradigm in which the prognostic impact of IL-10 in DLBCL is modulated not solely by its absolute level, but by its balance relative to IL-6.
The Central Nervous System International Prognostic Index (CNS-IPI) is currently the most widely used tool for predicting CNS involvement in DLBCL. In our cohort of 56 patients, CNS-IPI stratification—though limited by a median follow-up of 23.5 months (range: 0.7–41.9 months) and sample size—did not demonstrate statistically significant differences in SCNSL incidence among the low-, intermediate-, and high-risk groups (p = 0.136). Similarly, no significant difference in time to CNS relapse was observed between high-risk and non–high-risk groups. To improve risk prediction, we developed a modified scoring system, termed CNS-IPI-ratio, which integrates the serum IL-10/IL-6 ratio with the CNS-IPI score. Risk levels in the original CNS-IPI were assigned 1, 2, and 3 points for low, intermediate, and high risk, respectively; an additional point was assigned for a serum IL-10/IL-6 ratio ≥2.30. Patients scoring 1–2 points were classified as non–high-risk, while those scoring 3–4 points were categorized as high-risk. Our stratification approach yielded two key clinical findings. First, the CNS-IPI-ratio high-risk group identified significantly more SCNSL cases than the non–high-risk group (85.7% vs. 41.9%, p = 0.045), outperforming conventional models in discriminative capacity. Second, high-risk patients developed CNS relapse nearly 18 months earlier than non–high-risk patients (median 22.32 vs. 40.35 months, p = 0.017), indicating that CNS-IPI-ratio may predict both the likelihood and timing of CNS progression. The National Comprehensive Cancer Network International Prognostic Index (NCCN-IPI) remains the standard prognostic model for DLBCL in the rituximab era (22). However, this model relies solely on clinical parameters and excludes biological markers. In our analysis, the NCCN-IPI alone showed a non-significant trend toward PFS and OS differences between high-risk and non–high-risk groups. After incorporating the serum IL-10/IL-6 ratio into the NCCN-IPI, the modified scoring system yielded statistically significant differences in both PFS and OS. These findings suggest that integrating the serum IL-10/IL-6 ratio significantly enhances the prognostic accuracy of the NCCN-IPI.
Tumor RNA-seq analyses across multiple DLBCL cohorts consistently demonstrated that elevated IL-10/IL-6 expression ratios were associated with poorer clinical outcomes. Notably, an integrated IPI-ratio model provided superior prognostic discrimination compared to the conventional IPI alone. Although tumor mRNA expression data from GEO cohorts support the biological relevance of our serum biomarker findings, they serve a complementary rather than substitutive role. These transcriptomic analyses reinforce the mechanistic basis and cross-cohort consistency of IL-10/IL-6 dysregulation, yet the clinical utility of the serum IL-10/IL-6 ratio must be directly validated in our ongoing prospective study, as serum protein levels in an independent cohort remain the gold standard for biomarker evaluation. The consistent demonstration of IL-10/IL-6 imbalance in both the peripheral circulation (serum) and tumor microenvironment (RNA-seq) underscores the biological significance of this cytokine axis in DLBCL pathogenesis. While incorporating the IL-10/IL-6 ratio into existing clinical models enhances risk stratification, these preliminary findings warrant prospective validation in multicenter cohorts before clinical implementation.
The diagnostic value of elevated CSF IL-10 remains debated. Ikeguchi et al. (37) reported that although median CSF IL-10 concentrations were significantly higher in patients with CNS lymphoma (including PCNSL and SCNSL) compared to those with inflammatory demyelinating CNS diseases (p < 0.01), multivariate analysis indicated that CSF IL-10 lacked independent predictive value. In contrast, numerous studies have supported the utility of elevated CSF IL-10 in distinguishing PCNSL from other brain tumors, neuroinflammatory conditions, and systemic DLBCL (38–41). Notably, increased CSF IL-10 has been proposed as a potential biomarker for CNS lymphoma, including SCNSL (14, 15). On the other hand, IL-6 is frequently detectable in CSF during viral, bacterial, and fungal infections, as well as CNS inflammatory diseases—especially bacterial meningitis (42, 43). Patients with CNS inflammatory disorders had significantly higher CSF IL-6 concentrations than those with PCNSL (p = 0.032) (41). Most studies evaluating the CSF IL-10/IL-6 ratio have focused on PCNSL, with this ratio frequently serving as a diagnostic marker. For example, a CSF IL-10/IL-6 ratio >1 was detected in 75% (58/77) of PCNSL cases (44), and a similar threshold in vitreous or atrial fluid strongly suggested primary vitreoretinal lymphoma (PVRL) (45). Additionally, studies by Song (12) and Li et al. (46) reported that the CSF IL-10/IL-6 ratio could aid in distinguishing PCNSL from systemic non-Hodgkin lymphoma. When comparing the CSF IL-6/IL-10 ratio between CNS inflammatory disease and PCNSL, the ratio was significantly higher in the former (p < 0.001) (41). In our study, CSF IL-10/IL-6 ratios were significantly elevated in SCNSL patients relative to both non-SCNSL DLBCL patients and healthy controls. However, given the small number of SCNSL patients with available CSF samples (n = 3), these findings should be interpreted as preliminary and hypothesis-generating rather than definitive. While these observations are biologically plausible and consistent with prior PCNSL research, larger, multicenter prospective studies are needed to establish their diagnostic validity.
Regarding the serum IL-10/IL-6 ratio, our findings identified it as an independent risk factor for both progression-free survival (PFS) and SCNSL development in DLBCL. Serum IL-10 levels have previously been shown to reflect systemic tumor burden (1). Additionally, IL-10 plays a pivotal role in the JAK/STAT signaling pathway and can induce PD-L1 expression, facilitating immune evasion by tumor cells (1, 47). IL-10 is also implicated in blood-brain barrier dysfunction, promoting CNS infiltration by malignant cells (1, 16, 48). In contrast, IL-6—being a pleiotropic cytokine—is elevated in nearly all infectious or inflammatory conditions (42). Therefore, an elevated IL-10/IL-6 serum ratio may help exclude patients with underlying systemic infection or inflammation, thereby improving specificity for tumor-associated cytokine imbalances. A higher IL-10/IL-6 ratio at initial diagnosis may thus serve as a potential biomarker for identifying DLBCL patients at high risk for SCNSL. However, some studies have reported contradictory findings. Zou (49) observed no significant difference in serum IL-10/IL-6 ratios between DLBCL patients with and without SCNSL. Similarly, Geng et al. (38) found no statistically significant difference in this ratio between PCNSL patients and controls (patients with intracranial metastatic tumors or gliomas). These discrepancies may be attributable to differences in sample size, disease stage, or clinical characteristics across cohorts. Given the collective evidence on serum and CSF IL-10/IL-6 dynamics in DLBCL, SCNSL, and PCNSL, we systematically summarized current literature findings in Table 4. Distinct from prior PCNSL-focused studies (12–15), our data suggest that serum IL-10/IL-6 ratios can predict CNS relapse risk in asymptomatic DLBCL patients, potentially enabling preemptive therapeutic strategies. Importantly, unlike CSF-based diagnostics, our serum-based approach is minimally invasive and requires no additional sampling. The strong correlation observed between serum and CSF ratios further suggests that systemic immune dysregulation may precede CNS involvement, offering a critical window for early detection.
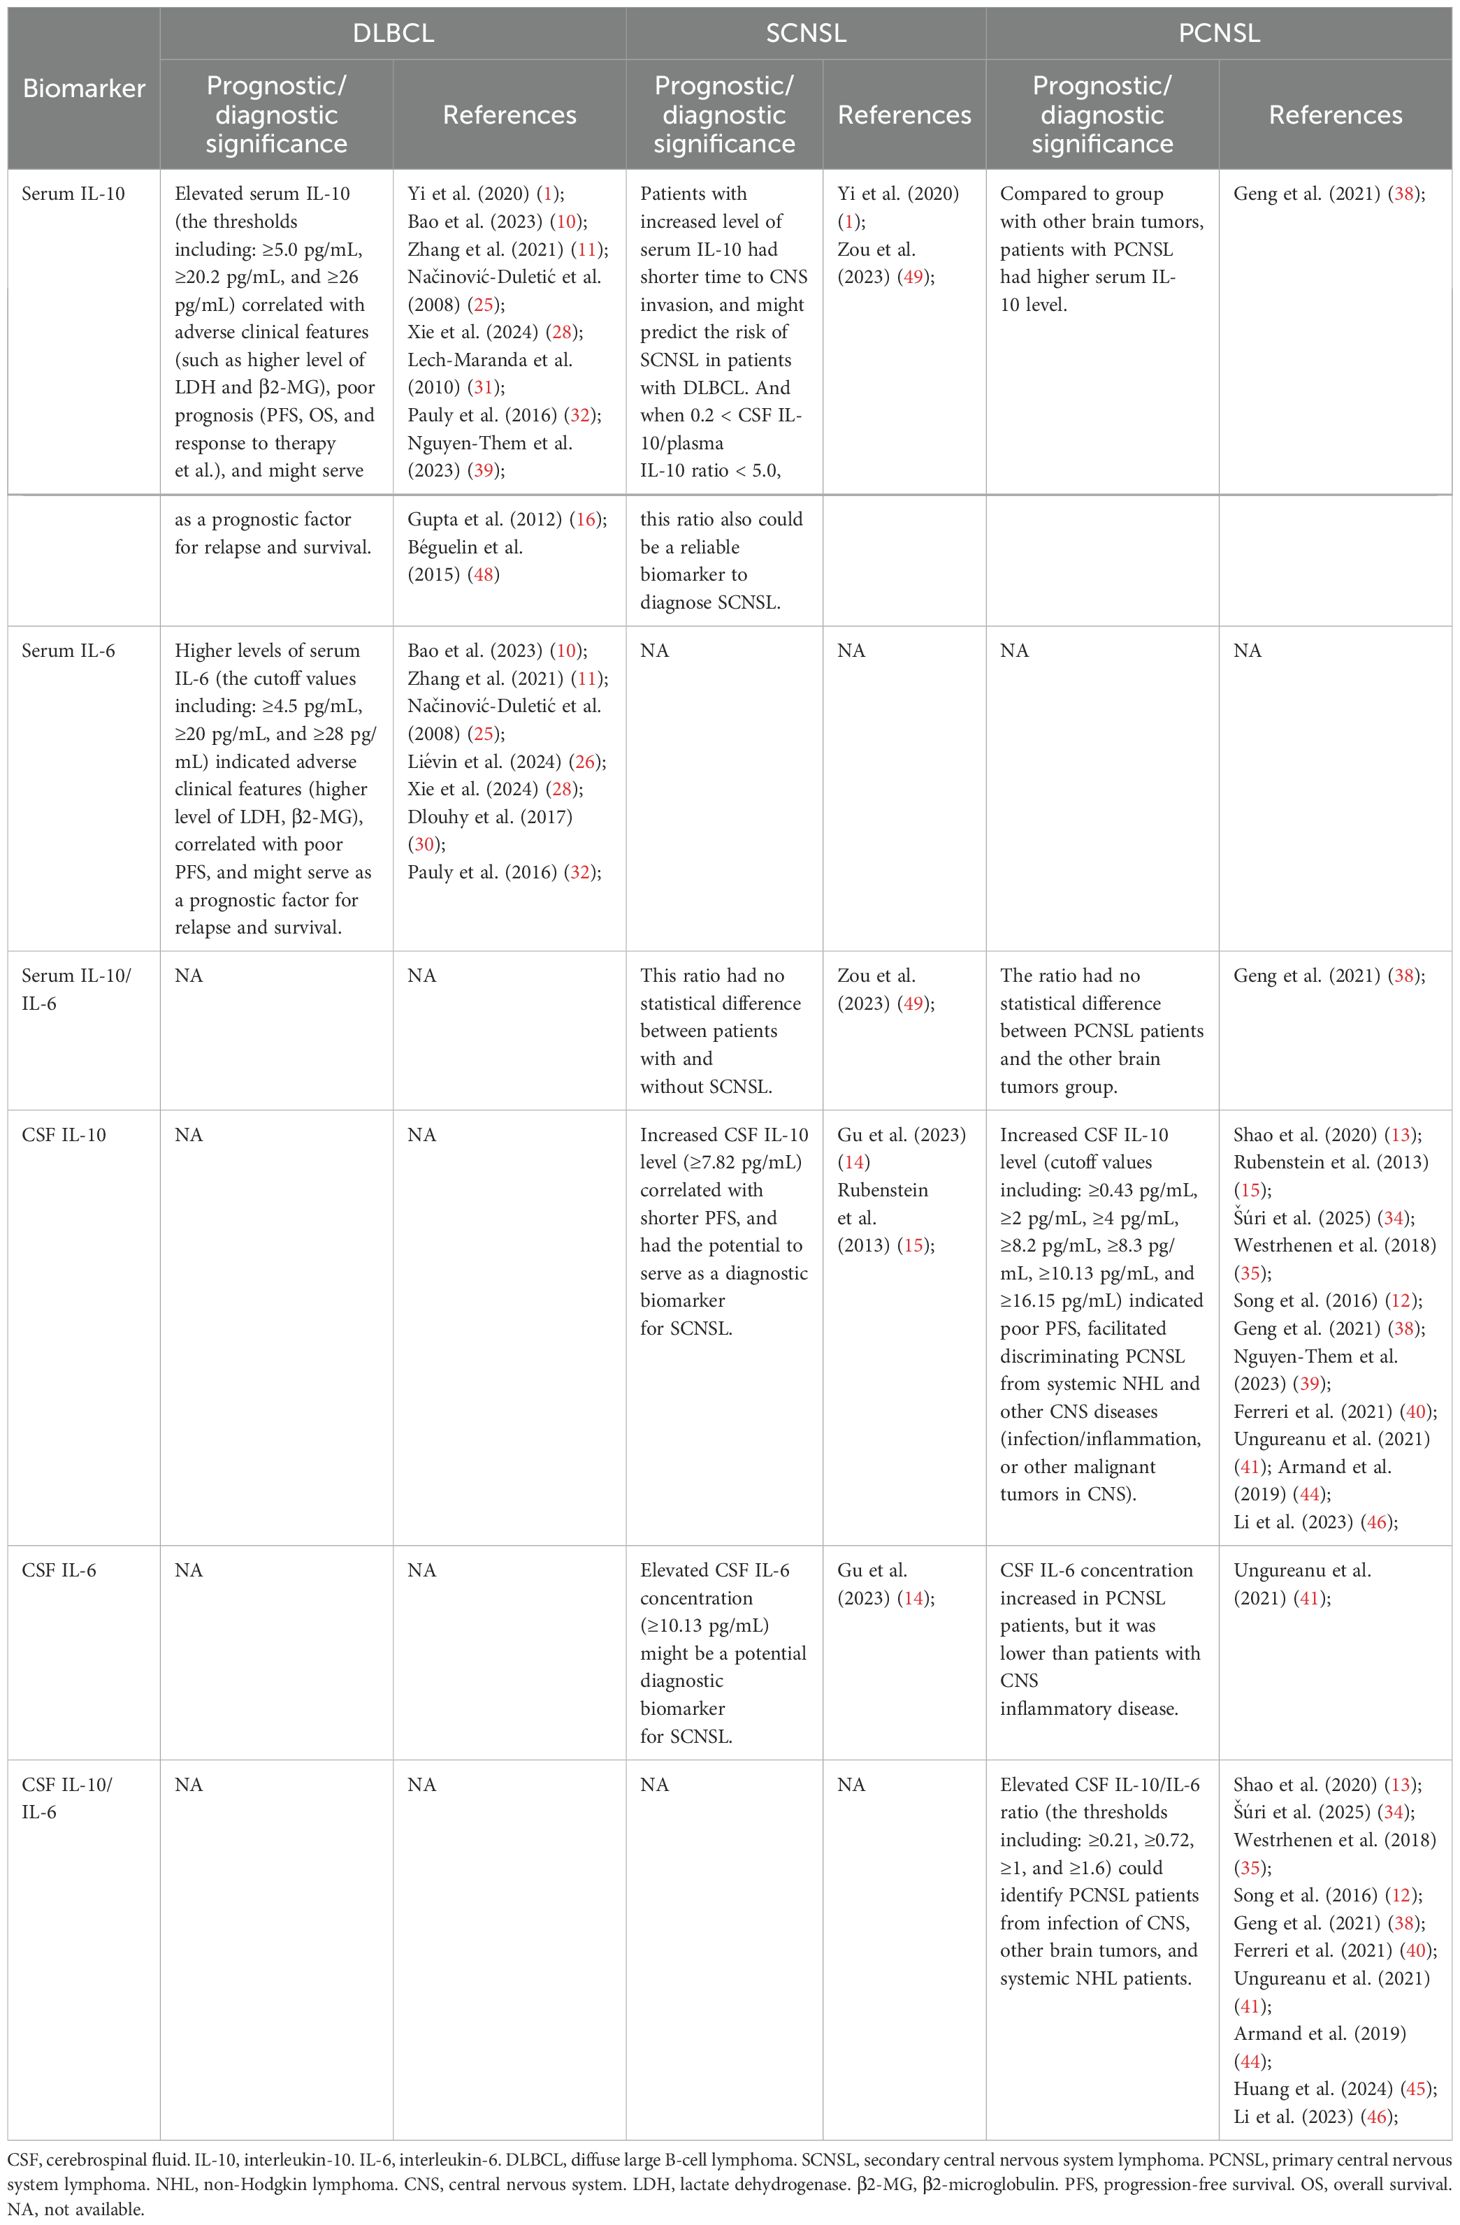
Table 4. Clinical Significance of Serum and CSF IL-10 and IL-6 in DLBCL, SCNSL, and PCNSL.
5 Conclusion
Our findings demonstrate that an elevated serum IL-10/IL-6 ratio (≥2.30) at initial diagnosis serves as an independent predictor of SCNSL development and disease progression in DLBCL. Incorporating this ratio significantly enhances the prognostic accuracy of both CNS-IPI and NCCN-IPI scoring systems. These results underscore the potential of integrating inflammatory cytokine biomarkers with established clinical indices to refine risk stratification. Nonetheless, clinical translation of these biomarkers will require standardized cutoff definitions, multicenter validation, and longitudinal studies to monitor dynamic changes throughout disease progression and treatment. Further research is essential to address these gaps and realize their full clinical utility.
Data availability statement
The original contributions presented in the study are included in the article/Supplementary Material. Further inquiries can be directed to the corresponding author.
Ethics statement
The studies involving humans were approved by Ethics Committee of Mianyang Central Hospital (Mianyang, China; approval numbers: 2021078(02) and S20230208-02). The studies were conducted in accordance with the local legislation and institutional requirements. The participants provided their written informed consent to participate in this study.
Author contributions
JW: Funding acquisition, Formal analysis, Writing – review & editing, Investigation, Writing – original draft, Data curation. XN: Data curation, Writing – review & editing, Writing – original draft, Formal analysis. QZ: Investigation, Writing – review & editing, Data curation. YL: Writing – review & editing, Investigation, Data curation. JY: Investigation, Writing – review & editing. YZ: Writing – review & editing, Investigation. JS: Investigation, Writing – review & editing. XL: Writing – review & editing, Supervision. FX: Conceptualization, Funding acquisition, Writing – review & editing, Supervision.
Funding
The author(s) declare financial support was received for the research and/or publication of this article. This work was supported by Incubation Project of Mianyang Central Hospital (Project No. 2021FH008), Scientific Research Project of Sichuan Medical Association (Project No. S22040), Health Commission of Mianyang City (Project No. 2024016) and Project of the Clinical Medicine Discipline Development Fund of school of Medicine, University of Electronic Science and Technology of China (Project No. 19).
Acknowledgments
The authors would like to express their gratitude to Charlesworth Author Services (https://www.cwauthors.com.cn/) for the expert linguistic services provided.
Conflict of interest
The authors declare that the research was conducted in the absence of any commercial or financial relationships that could be construed as a potential conflict of interest.
Generative AI statement
The author(s) declare that no Generative AI was used in the creation of this manuscript.
Publisher’s note
All claims expressed in this article are solely those of the authors and do not necessarily represent those of their affiliated organizations, or those of the publisher, the editors and the reviewers. Any product that may be evaluated in this article, or claim that may be made by its manufacturer, is not guaranteed or endorsed by the publisher.
Supplementary material
The Supplementary Material for this article can be found online at: https://www.frontiersin.org/articles/10.3389/fimmu.2025.1656044/full#supplementary-material
References
1. Yi JH, Yoon SE, Ryu KJ, Ko YH, Kim WS, and Kim SJ. Pre-treatment serum IL-10 predicts the risk of secondary central nervous system involvement in patients with diffuse large B-cell lymphoma. Cytokine. (2020) 129:155048. doi: 10.1016/j.cyto.2020.155048
2. Lantz J, Portell CA, and Ayers EC. Central nervous system prophylaxis in diffuse large B-cell lymphoma: What does the evidence tell us? Blood Rev. (2023) 61:101101. doi: 10.1016/j.blre.2023.101101
3. Kaplan LA, McLain JH, Ali A, Myint ZW, and Tulpule A. Prognosis of patients with diffuse large B cell lymphoma with central nervous system relapse: USC experience. Blood. (2023) 142:6305. doi: 10.1182/blood-2023-185451
4. Klánová M, Sehn LH, Bence-Bruckler I, Cavallo F, Jin J, Martelli M, et al. Integration of cell of origin into the clinical CNS international prognostic index improves CNS relapse prediction in DLBCL. Blood. (2019) 133:919–26. doi: 10.1182/blood-2018-07-862862
5. Faqah A, Asif S, Goksu SY, and Sheikh HS. Real-world data (RWD) on the 3-year follow-up outcomes of different CNS prophylaxis strategies across CNS-IPI risk groups in patients with diffuse large B-cell non-Hodgkin lymphoma. JCO Global Oncol. (2021) 7:486–94. doi: 10.1200/go.20.00422
6. Gleeson M, Counsell N, Cunningham D, Chadwick N, Lawrie A, Hawkes EA, et al. Central nervous system relapse of diffuse large B-cell lymphoma in the rituximab era: Results of the UK NCRI R-CHOP-14 versus 21 trial. Ann Oncol. (2017) 28:2511–6. doi: 10.1093/annonc/mdx353
7. Frontzek F, Renaud L, Dührsen U, Poeschel V, Bernard S, Chartier L, et al. Identification and clinical characterization of CNS relapse in DLBCL patients across 19 prospective phase 2 and 3 trials-a GLA/DSHNHL and LYSA collaboration. Blood. (2023) 142:71. doi: 10.1182/blood-2023-178815
8. Schmitz N, Zeynalova S, Nickelsen M, Kansara R, Villa D, Sehn LH, et al. CNS international prognostic index: A risk model for CNS relapse in patients with diffuse large B-cell lymphoma treated with R-CHOP. J Clin Oncol. (2016) 34:3150–6. doi: 10.1200/jco.2015.65.6520
9. NCCN clinical practice guidelines in oncology: B-cell lymphomas (Version 7.2019). Available online at: https://www.nccn.org/ (Accessed December 18, 2019).
10. Bao CH, Gu JY, Huang X, You LS, Zhou ZY, and Jin J. Cytokine profiles in patients with newly diagnosed diffuse large B-cell lymphoma: IL-6 and IL-10 levels are associated with adverse clinical features and poor outcomes. Cytokine. (2023) 169:156289. doi: 10.1016/j.cyto.2023.156289
11. Zhang L, Liu L, Wang CY, Zhao HJ, Zhou Y, and Xu B. Expressions of interleukin 6, interleukin 8 and interleukin 10 in the peripheral blood of patients with diffuse large B-cell lymphoma and their clinical significances. J Leukemia Lymphoma. (2021) 30:726–9. doi: 10.3760/cma.j.cn115356-20210811-00176
12. Song Y, Zhang W, Zhang L, Wu W, Zhang Y, Han X, et al. Cerebrospinal Fluid IL-10 and IL-10/IL-6 as accurate diagnostic biomarkers for Primary Central Nervous System Large B-cell Lymphoma. Sci Rep. (2016) 6:3867. doi: 10.1038/srep38671
13. Shao J, Chen K, Li Q, Ma JJ, Ma Y, Lin ZG, et al. High level of IL-10 in cerebrospinal fluid is specific for diagnosis of primary central nervous system Lymphoma. Cancer Manage Res. (2020) 12:6261–8. doi: 10.2147/cmar.S255482
14. Gu JY and Jin J. Cerebrospinal fluid IL-6 plus IL-10 as effective diagnostic biomarkers for secondary central nervous system lymphoma. Blood. (2023) 142:6160. doi: 10.1182/blood-2023-189580
15. Rubenstein JL, Wong VS, Kadoch C, Gao HX, Barajas R, Chen LJ, et al. CXCL13 plus interleukin 10 is highly specific for the diagnosis of CNS lymphoma. Blood. (2013) 121:4740–8. doi: 10.1182/blood-2013-01-476333
16. Gupta M, Han JJ, Stenson M, Maurer M, Wellik L, Hu GZ, et al. Elevated serum IL-10 levels in diffuse large B-cell lymphoma: a mechanism of aberrant JAK2 activation. Blood. (2012) 119:2844–53. doi: 10.1182/blood-2011-10-388538
17. Swerdlow SH, Campo E, Harris NL, Jaffe ES, Pileri SA, and Stein H eds. WHO Classification of Tumours of Haematopoietic and Lymphoid Tissues. 4th ed. Lyon: IRAC (2017).
18. Cwynarski K, Cummin T, Osborne W, Lewis J, Chaganti S, Smith J, et al. Management of secondary central nervous system lymphoma. Br J haematology. (2023) 200:160–9. doi: 10.1111/bjh.18539
19. Frontzek F, Renaud L, Dührsen U, Poeschel V, Bernard S, Chartier L, et al. Identification, risk factors, and clinical course of CNS relapse in DLBCL patients across 19 prospective phase 2 and 3 trials-a LYSA and GLA/DSHNHL collaboration. Leukemia. (2024) 38:2225–34. doi: 10.1038/s41375-024-02371-y
20. Wilson MR, Cwynarski K, Eyre TA, Smith J, Chaganti S, Fox CP, et al. Central nervous system prophylaxis in large B-cell lymphoma: A British Society for Haematology Good Practice Paper. Br J haematology. (2024) 205:2198–205. doi: 10.1111/bjh.19686
21. Bobillo S, Khwaja J, Ferreri AJM, and Cwynarski K. Prevention and management of secondary central nervous system lymphoma. Haematologica. (2023) 108:673–89. doi: 10.3324/haematol.2022.281457
22. Zhou Z, Sehn LH, Rademaker AW, Gordon LI, Lacasce AS, Crosby-Thompson A, et al. An enhanced International Prognostic Index (NCCN-IPI) for patients with diffuse large B-cell lymphoma treated in the rituximab era. Blood. (2014) 123:837–42. doi: 10.1182/blood-2013-09-524108
23. Hans CP, Weisenburger DD, Greiner TC, Gascoyne RD, Delabie J, and Ott G. Confirmation of the molecular classification of diffuse large B-cell lymphoma by immunohistochemistry using a tissue microarray. Blood. (2004) 103:275–82. doi: 10.1182/blood-2003-05-1545
24. Johnson NA, Slack GW, Savage KJ, Connors JM, Ben-Neriah S, Rogic S, et al. Concurrent expression of MYC and BCL2 in diffuse large B-cell lymphoma treated with rituximab plus cyclophosphamide, doxorubicin, vincristine, and prednisone. J Clin Oncol. (2012) 30:3452–9. doi: 10.1200/jco.2011.41.0985
25. Načinović-Duletić A, Štifter S, Dvornik Š, Škunca Ž, and Jonjić N. Correlation of serum IL-6, IL-8 and IL-10 levels with clinicopathological features and prognosis in patients with diffuse large B-cell lymphoma. Int J Lab Hematol. (2008) 30:230–9. doi: 10.1111/j.1751-553x.2007.00951.x
26. Liévin R, Maillard A, Hendel-Chavez H, Krzysiek R, Lancar R, Algarté-Génin M, et al. Immune reconstitution and evolution of B cell stimulating cytokines after R-CHOP therapy for HIV-associated DLBCL. Blood Adv. (2024) 8:6017–27. doi: 10.1182/bloodadvances.2024014116
27. Li LH, Yu R, Cai TG, Chen Z, Lan M, Zou TT, et al. Effects of immune cells and cytokines on inflammation and immunosuppression. Int Immunopharmacol. (2020) 88:106939. doi: 10.1016/j.intimp.2020.106939
28. Xie SF, Zhu LF, Wang L, Wang SB, Tong XM, and Ni WM. Assessment and prognostic significance of a serum cytokine panel in diffuse large B-cell lymphoma. Oncol Lett. (2024) 27:237. doi: 10.3892/ol.2024.14370
29. Charbonneau B, Maurer MJ, Ansell SM, Slager SL, Fredericksen ZS, Ziesmer SC, et al. Pretreatment circulating serum cytokines associated with follicular and diffuse large B-cell lymphoma: a clinic-based case-control study. Cytokine. (2012) 60:882–9. doi: 10.1016/j.cyto.2012.08.028
30. Dlouhy I, Filella X, Rovira J, Magnano L, Rivas-Delgado A, Baumann T, et al. High serum levels of soluble interleukin-2 receptor (sIL2-R), interleukin-6 (IL-6) and tumor necrosis factor alpha (TNF) are associated with adverse clinical features and predict poor outcome in diffuse large B-cell lymphoma. Leukemia Res. (2017) 59:20–5. doi: 10.1016/j.leukres.2017.05.014
31. Lech-Maranda E, Bienvenu J, Broussais-Guillaumot F, Warzocha K, Michallet AS, Robak T, et al. Plasma TNF-α and IL-10 level-based prognostic model predicts outcome of patients with diffuse large B-cell lymphoma in different risk groups defined by the international prognostic index. Archivum Immunologiae Therapiae Experimentalis. (2010) 58:131–41. doi: 10.1007/s00005-010-0066-1
32. Pauly F, Fjordén K, Leppä S, Holte H, Björkholm M, Fluge Ø, et al. Plasma immunoprofiling of patients with high-risk diffuse large B-cell lymphoma: a Nordic Lymphoma Group study. Blood Cancer J. (2016) 6:e501. doi: 10.1038/bcj.2016.113
33. Hamed Anber N, El-Sebaie AH, Darwish NHE, Mousa SA, and Shamaa SS. Prognostic value of some inflammatory markers in patients with lymphoma. Bioscience Rep. (2019) 39:BSR20182174. doi: 10.1042/bsr20182174
34. Šúri A and Mociková H. Diagnostic approach to leptomeningeal involvement in diffuse large B-cell lymphoma. Expert Rev Mol Diagn. (2025) 25:209–15. doi: 10.1080/14737159.2025.2485211
35. Westrhenen AV, Smidt LCA, Seute T, Nierkens S, Stork ACJ, Minnema MC, et al. Diagnostic markers for CNS lymphoma in blood and cerebrospinal fluid: a systematic review. Br J Haematology. (2018) 182:384–403. doi: 10.1111/bjh.15410
36. Sabat R, Grütz G, Warszawska K, Kirsch S, Witte E, Wolk K, et al. Biology of interleukin-10. Cytokine Growth Factor Rev. (2010) 21:331–44. doi: 10.1016/j.cytogfr.2010.09.002
37. Ikeguchi R, Shimizu Y, Shimizu S, and Kitagawa K. CSF and clinical data are useful in differentiating CNS inflammatory demyelinating disease from CNS lymphoma. Multiple Sclerosis J. (2017) 24:1212–1223. doi: 10.1177/1352458517717804
38. Geng MY, Song Y, Xiao H, Wu ZY, Deng XJ, Chen C, et al. Clinical significance of interleukin-10 concentration in the cerebrospinal fluid of patients with primary central nervous system lymphoma. Oncol Lett. (2021) 21:2. doi: 10.3892/ol.2020.12263
39. Nguyen-Them L, Alentorn A, Ahle G, Soussain C, Mathon B, Le Garff Tavernier M, et al. CSF biomarkers in primary CNS lymphoma. Rev Neurologique. (2023) 179:141–9. doi: 10.1016/j.neurol.2022.06.014
40. Ferreri AJM, Calimeri T, Lopedote P, Francaviglia I, Daverio R, Iacona C, et al. MYD88 L265P mutation and interleukin-10 detection in cerebrospinal fluid are highly specific discriminating markers in patients with primary central nervous system lymphoma: results from a prospective study. Br J Haematology. (2021) 193:497–505. doi: 10.1111/bjh.17357
41. Ungureanu A, Le Garff Tavernier M, Costopoulos M, Parratte T, Brinet A, Durand H, et al. CSF interleukin 6 is a useful marker to distinguish pseudotumoral CNS inflammatory diseases from primary CNS lymphoma. J Neurol. (2021) 268:2890–4. doi: 10.1007/s00415-021-10453-5
42. Wullschleger A, Kapina V, Molnarfi N, Courvoisier DS, Seebach JD, Santiago-Raber ML, et al. Cerebrospinal fluid interleukin-6 in central nervous system inflammatory diseases. PLoS One. (2013) 8:e72399. doi: 10.1371/journal.pone.0072399
43. Olie SE, Staal SL, Ter Horst L, van Zeggeren IE, Man WK, Tanck MWT, et al. Diagnostic accuracy of inflammatory markers in adults with suspected central nervous system infections. J infection. (2024) 88:106117. doi: 10.1016/j.jinf.2024.01.016
44. Armand M, Costopoulos M, Osman J, Tarfi S, Houillier C, Choquet S, et al. Optimization of CSF biological investigations for CNS lymphoma diagnosis. Am J Hematol. (2019) 94:1123–31. doi: 10.1002/ajh.25578
45. Huang RS, Mihalache A, Popovic MM, Cruz-Pimentel M, Pandya BU, Muni RH, et al. Diagnostic methods for primary vitreoretinal lymphoma: A systematic review. Survey Ophthalmol. (2024) 69:456–64. doi: 10.1016/j.survophthal.2023.12.001
46. Li JN, Tang XQ, Luo XH, Liu L, Li D, and Yang L. Clinicopathological analysis and specific discriminating markers of interleukin detection in cerebrospinal fluid with primary central nervous system lymphoma: results from a retrospective study. Ann Hematol. (2023) 102:2153–63. doi: 10.1007/s00277-023-05301-7
47. Li L, Zhang J, Chen J, Xu-Monette ZJY, Miao Y, Xiao M, et al. B-cell receptor-mediated NFATc1 activation induces IL-10/STAT3/PD-L1 signaling in diffuse large B-cell lymphoma. Blood. (2018) 132:1805–17. doi: 10.1182/blood-2018-03-841015
48. Béguelin W, Sawh S, Chambwe N, Chan FC, Jiang Y, Choo JW, et al. IL10 receptor is a novel therapeutic target in DLBCLs. Leukemia. (2015) 29:1684–94. doi: 10.1038/leu.2015.57
Keywords: diffuse large B-cell lymphoma, central nervous system, interleukin-10, interleukin-6, prognosis
Citation: Wen J, Nie X, Zhou Q, Liu Y, Yue J, Zhang Y, Su J, Liang X and Xu F (2025) Elevated serum IL-10/IL-6 ratio as a novel biomarker for secondary central nervous system lymphoma and poor prognosis in DLBCL. Front. Immunol. 16:1656044. doi: 10.3389/fimmu.2025.1656044
Received: 29 June 2025; Accepted: 18 July 2025;
Published: 13 August 2025.
Edited by:
Marshall Kadin, University of Virginia, United StatesReviewed by:
Xianhuo Wang, Tianjin Medical University Cancer Institute and Hospital, ChinaWanmao Ni, Zhejiang Provincial People’s Hospital, China
Copyright © 2025 Wen, Nie, Zhou, Liu, Yue, Zhang, Su, Liang and Xu. This is an open-access article distributed under the terms of the Creative Commons Attribution License (CC BY). The use, distribution or reproduction in other forums is permitted, provided the original author(s) and the copyright owner(s) are credited and that the original publication in this journal is cited, in accordance with accepted academic practice. No use, distribution or reproduction is permitted which does not comply with these terms.
*Correspondence: Fang Xu, MTQ3Mzc3ODA3QHFxLmNvbQ==
†These authors have contributed equally to this work