 Yin Xiao1
 Sigrun S. Haeusl1Gaurav Jethva1†Johannes Weber1Andreas Rosenwald1,2
 Friederike Berberich-Siebelt1*
- 1Institute of Pathology, Julius-Maximilians-University Würzburg, Würzburg, Germany
- 2Comprehensive Cancer Centre Mainfranken, Julius-Maximilians-University of Würzburg, Würzburg, Germany
Recently, we have identified CD4+PD-1+CXCR5+ T-follicular helper (TFH) cells with a distinct cytotoxic phenotype and named them “killer TFH (TFK)” cells. In this study, we aim to elucidate their presence and functional relevance in two different lymphoma subtypes, follicular lymphoma (FL) and diffuse large B-cell lymphoma (DLBCL). Flow cytometric analysis of tonsillar versus FL-cell suspensions revealed a heightened number of GZMK+NKG7/TIA-1+ TFK cells in the latter, accompanied by a significant increase in T-regulatory and T-follicular regulatory (TFR) cells. In contrast, DLBCL exhibited a decrease in TFH and TFR cell numbers, while concurrently demonstrating heightened frequencies of GZMK+TIA-1+ and especially GZMB+TIA-1+ TFK cells within the TFH population. Analysis of single-cell RNA sequencing data confirmed an origin-specific phenotype of TFK cells. Immunofluorescence staining of biopsy specimens detected CD4+BCL-6+TIA-1+ TFK cells within follicles and germinal centers (GC) in reactive lymph nodes and within their atypical counterparts in malignant lymph nodes. Their propensity to migrate into atypical GCs was more pronounced in higher grade FLs. Furthermore, the release of cytotoxic cargo by degranulation could be induced by stimulation of CD4+ cells in cultures of FL and DLBCL suspensions. In line, the direct cytotoxic capacity of TFK cells against lymphoma cells was demonstrated by killing assays with isolated cells, underscoring their potential as a prospective therapeutic target in lymphoma control.
Introduction
Cytotoxic CD4+ T cells have been identified during periods of chronic inflammation and are understood to be reprogrammed T-helper cells that retain their MHCII restriction and manifest a terminally differentiated phenotype. These cells contribute to host defense through their direct cytolytic capacity to kill infected cells (1–5). Cytotoxic CD4+ T cells occur in supercentenarians making a signature of healthy aging (6), but can also correlate with active progressive disease as exemplified by CNS-resident CD4+EOMES+GZMB+NR4A2+ T cells in secondary progressive multiple sclerosis (7).
Lymphopenic mice revealed that CD4+ T cells in those expand with a cytotoxic phenotype and are sufficient to eradicate melanoma (8, 9). Concurrently, CD4+ T cells are regarded as anti-tumor effector cell (10). A preponderance of reports document an activated T-helper 1 (TH1) phenotype of cytotoxic CD4+ T cells, including tumor microenvironment (TME)-associated ones, while alternate polarization patterns have been observed (11). These cells require antigen for their proliferation and respond to elevated IL-2 levels, which can occur in the absence of Treg cells. Direct tumor-killing capability has been reported (12–14).
We recently discovered a small subset of CD3+CD4+CD45RA–CXCR5+ T cells with a cytotoxic phenotype in peripheral blood as well as in tonsils of rather healthy individuals (15). As the chemokine receptor CXCR5 facilitates homing of lymphocytes to B-cell follicles building germinal centers (GC), the majority of CXCR5+ cells are specialized CD4+ T lymphocytes providing cognate help to GC-B cells, hence the term T-follicular helper (TFH) cells (16, 17). TFH cells are further characterized by high expression of other surface molecules, such as ICOS or PD-1, the transcription factor BCL-6, the cytokines IL-21 and IL-4, and – in humans – the chemokine CXCL13.
This newly identified cytotoxic TFH subtype was distinguished by high expression of NKG7 (Natural Killer Cell Granule Protein 7), granzymes, perforin, and CCL5. It could be triggered to degranulate its cytotoxic cargo, ultimately leading to its designation as a “killer TFH” (TFK) cell. Notably, while TFK cells express CXCR5 and BCL6, they co-express EOMES and BLIMP-1 (encoded by PRDM1), which may be crucial for their cytotoxic function (18, 19). BLIMP-1 and the detected LITAF have been shown to engage in a reciprocal negative loop with BCL-6 (20, 21). However, the co-expression of BLIMP-1 and BCL6 in TFK cells reflects the situation in CXCR5+FOXP3+BLIMP-1+ T-follicular regulatory (TFR) cells, in which the level of BCL6 is indeed less than in TFH cells (22). Additionally, TFK cells express markers of type 1 terminal differentiation, including CXCR3, CX3CR1 and KLRG1. In line with CXCR3 expression, TFK cells mostly remained in an extrafollicular position in the tonsils. Yet they shared TCR specificities with the majority of the other CD3+CD4+CD45RA–CXCR5+ subclusters, including classical GC-TFH cells and this was despite their predominant oligoclonal profile due to a constrained TCR diversity (15).
Several types of B-cell lymphomas express GC-B-cell signature genes. Follicular lymphoma (FL) is an indolent lymphoma that can transform into an aggressive subtype (transformed FL, most frequently to DLBCL) (23). In most cases FL is marked by a t(14;18) translocation, leading to BCL-2 overexpression (24). During affinity maturation within the GC, where only a few GC-B cells can receive survival signals from TFH cells, BCL-2-overexpressing B cells have an advantage and avoid apoptosis. These pre-cancerous cells acquire activation-induced deaminase (AID)-induced mutations within the GC. Cellular interactions in the GC-like TME of an FL resemble benign immune reactions (25). In lymph node (LN)-localized FL, follicular dendritic cells, fibroblastic reticular cells and TFH cells are the major components of the TME, further accompanied by Tregs, various CD4+ and CD8+ T-cell types, whose presence and frequency define subtypes of FL (26, 27).
DLBCL is classified based on gene expression patterns that define the cell of origin, i.e. two biologically and clinically distinct subtypes, namely GCB-DLBCL and ABC-DLBCL, representing the B-cell differentiation stages of GC (GCB) and post-GC (ABC) (28, 29). Several driver mutations and an overall severe genetic heterogeneity further characterize the subgroups (30). Like FL, GCB-DLBCL is transcriptionally reminiscent of light zone GC-B cells, but in all morphological variants any follicular structures have vanished (31).
Here, we show that lymphoma samples contain cytotoxic CD4+ T cells, which were predominantly NKG7/TIA-1+GZMK+ TFH-like in FL and TIA-1+GZMK+ and/or GZMB+ within the CXCR5+PD-1+ and CXCR5–PD-1+ subpopulations of DLBCL. In non-malignant, but reactive LNs and malignant FL these TFK cells were predominantly located in the follicles and GCs, while the degree of malignancy further supports their appearance in GCs. Tregs were enriched in number but rarely present in close contact with TFK cells. Single-cell RNA-seq datasets confirmed the abundant presence of cytotoxic CD4+ T cells in FL and DLBCL with origin-specific transcriptomes. Degranulation assays restricted to CD4-MHCII interactions indicated the ability for degranulation and cytotoxicity, while isolated and stimulated TFK cells could induce apoptosis in FL and DLBCL B cells, highlighting their potential role in anti-lymphoma immunity.
Materials and methods
Patient samples for cell suspensions and histology
Malignant LNs with FL and DLBCL had been collected in comparison to tonsils from patients undergoing tonsillectomy (Supplementary Table S1) at the Medical Faculty of the Julius-Maximilians-University Würzburg. After isolation of mononuclear cells (MNC) using cell sieves, cells were frozen and stored in liquid nitrogen at the Institute of Pathology.
Human tissue samples of FL, DLBCL, and reactive LNs (Supplementary Table S1), together with their clinical data, were available at the Institute of Pathology. All relevant histologic examinations were completed. Ethical approval was obtained for this study, i.e., the data were used according to the ethical guidelines of the Medical Faculty and approved by the Institutional Ethics Committee of the Julius-Maximilians-University (149/23 and 136/21). Informed consent was obtained after a written explanation of the nature and possible consequences of the studies (136/21), while in 149/23 it is residual diagnostic material that has been approved for research by the Ethics Committee. Therefore, our study adheres to the Declaration of Helsinki.
Flow cytometric analysis of human MNC from LN and non-malignant tonsils
A total of 5 × 10⁶ cells were used for flow cytometry analysis. Viable cells were first identified using the Zombie NIR™ Fixable Viability Kit or Zombie Green™ Fixable Viability Kit (both from BioLegend). Following viability staining, cells were incubated with Human TrueStain FcX™ (BioLegend) for 10 minutes to block Fc receptors. Surface staining was then performed at room temperature (RT) for 15 minutes using the following fluorophore-conjugated antibodies (Supplementary Table S2): BV510- or PerCP or FITC-conjugated CD4 (clone OKT4, BioLegend), APC-Cy7- or PE-Cy7-conjugated PD-1 (clone NAT105, BioLegend), PerCP-conjugated CD19 (clone, HIB19), Pacific Blue-conjugated CXCR5 (clone I252D4, BioLegend), PerCP-conjugated CD107a (clone H4A3, BioLegend), PE-Cy7-conjugated ICOS (clone C398.4A, BioLegend), and PE-conjugated TIA-1 (clone 2G9A10F5, Beckman Coulter). Following surface staining, cells were fixed and permeabilized using the FOXP3/Transcription Factor Staining Buffer Set (Invitrogen) according to the manufacturer’s instructions. Intracellular staining was subsequently performed using FITC-conjugated FOXP3 (clone 206D, BioLegend), APC-conjugated Granzyme K (clone GM26E7, BioLegend), and BV510-conjugated Granzyme B (clone GB11, BD Horizon™). Data were acquired on a FACSCanto II (BD Biosciences) flow cytometer and analyzed with FlowJo® v10.8.1 (Treestar Inc., Ashland, OR, USA).
Immunofluorescence histology staining and analysis
Consecutive formalin-fixed paraffin-embedded (FFPE) sections were used to localize TFK cells. The procedure of staining and image analysis has been described in detail (15). Briefly, the tissue sections were processed through deparaffinization followed by heat-induced antigen retrieval in citrate buffer (pH 6.0). After blocking with Dako protein block (DAKO, S3022) for 1 h at room temperature, sections were incubated with primary antibodies (Supplementary Table S3) for 1 h, washed three times with TBST, and then stained with appropriate secondary antibodies (Supplementary Table S3) alongside DAPI for 1 h at room temperature. Following final washes, slides were mounted with Fluoromount-G (ThermoFisher).
A Zeiss LSM780 confocal microscope was used for image acquisition. The 20x/0.8 objective and the required channels were selected. The smart-set-up of the microscope was set to “best signal”, while the detection range for the four channels was set to minimize signal spillover from the different channels. Prior to image acquisition, the GC was located using DAPI staining of the nuclei. The gain of the laser had to be adjusted according to the tissue, as LNs and FLs stained differently under the microscope.
The raw confocal images were then processed using Fiji (Fiji is just ImageJ. The steps of deconvolution, segmentation and cell counting were achieved as described (15). In addition, background correction could now be included in the macro before deconvolution. Cell subtype counting was achieved by applying a second macro, which used the Colocalization Finder. The actual overlap of the two images was transferred as regions of interest (ROIs) to the ROI manager, where the pixel size of each single overlap ROI was measured. If the ROI was larger than 200 pixels or smaller than 20 pixels, the ROI was discarded and deleted. Subsequently, the results were transferred into an Excel spreadsheet containing the sample number, cell subtype as well as ROI number and size. This plugin was used once more to indicate possible locations of TFK cells. TFK cell candidates were confirmed by creating intensity profiles as described (15). The process of creating and saving intensity profiles could now be automated using a Fiji macro. The measurement of follicles and GC sizes was automated as well, after manually specifying and creating ROIs for all follicles and GCs according to CD19 and BCL6 staining. The results were saved automatically in an Excel spreadsheet. The allocation of TFK cells to follicles and GCs was done according to the aforementioned ROIs of follicles and GCs. TFK numbers and all other cell numbers were collected in an Excel spreadsheet where sample averages and percentages were calculated.
For the cell-cell contact analysis of TFK cells with FOXP3+ Treg cells, CD4+ T cells were first identified by a Fiji plugin and afterwards checked by CellProfiler for at least 25% overlay with signal in the FOXP3 channel. The outlines of the Treg cells were superimposed on the merged image and manually checked for cell-cell contact with TFK cells.
scRNAseq
We used publicly available scRNAseq and TCRseq datasets to query gene expression as well as TCR usage in TFK cells of FL and DLBCL compared to tonsils. Samples and sequencing procedure can be found in (32).
scRNA-seq bioinformatics
All scRNA-seq data (32) were processed and analyzed using Seurat (v5.2.1). The FindAllMarkers function was applied to identify differentially expressed genes and to annotate clusters; however, gene set enrichment analysis (GSEA), KEGG pathway analysis, RITAN, and enrichR were not utilized in this study.
For TCR reconstruction and paired TCR clonotype calling, Cell Ranger (version 3.0.2) was used for variable diversity joining sequence assembly. TCR analysis was performed using scRepertoire (v2.2.1), where instead of random 1000, all sequenced cells were selected and single TCRα/TCRβ genes were retained for analysis.
In vitro stimulation of adenoid cultures
In vitro stimulation with staphylococcal enterotoxin B (SEB; Sigma S4881-1MG) was performed as previously described (15). Cells from tonsils, FL and DLBCL were plated in 96 well U-plate (Greiner bio-one), 2*10^5 cells/well were stimulated with 1 μg/ml of SEB for 4 days. For assessment of degranulation capacity, PerCP-conjugated CD107a (H4A3, Biolegend) antibody, with or without monensin (Biolegend) and brefeldin A (Biolegend), was added during the last 3 hours of stimulation. Samples were acquired on a FACS Canto II (BD Biosciences) flow cytometer.
TFK cell isolation and killing assay
The killing assay was optimized based on the methodology described (33). Fluorescence-activated cell sorting (FACS) was used to isolate TFK cells (CD4+CD25–CXCR5+PD1+TIA-1+), TFH cells (CD4+CD25–CXCR5+PD1+TIA-1–), and B cells (CD19+) from FL and DLBCL samples. Afterwards, B cells were incubated with 10 µg/mL anti-CD3 (clone: OKT3, BioLegend) for 1 hour at 37 °C to serve as target cells. Subsequently, anti-CD3 mAb-coated B cells were co-cultured with either TFH or TFK cells at a 1:1 ratio in a 96 well U-plate (Greiner bio-one) for 14 hours. After incubation, apoptotic target cells were quantified by flow cytometry following staining with the Zombie NIR™ Fixable Viability Kit (Biolegend) and APC-conjugated Annexin V (BioLegend) according to the manufacturer’s instructions.
Statistical analysis
All flow cytometric data are shown as mean ± SD and represent combined data from at least three independent experiments. The results were analyzed with Prism software (GraphPad) using Wilcoxon signed-rank test, Kruskal-Wallis One-way ANOVA. * p < 0.05, **p < 0.005, *** p < 0.001, ****p < 0.0001.
All statistical analyses and their respective graphs presented for IF staining were conducted created with GraphPad Prism by using T-test or Mann-Whitney test. * p < 0.05, **p < 0.005, *** p < 0.001, ****p < 0.0001.
Results
Germinal center-derived lymphoma harbor cytotoxic CD4+CXCR5+ T cells
Recently, we detected a subcluster of CD3+CD4+CD45RA–CXCR5+ TFH cells with a cytotoxic phenotype in peripheral blood and tonsils of rather healthy individuals (15). This observation prompted us to investigate whether GC-derived lymphoma harbor such cytotoxic TFH – hereafter referred to as killer TFH or TFK cells. To address this, we performed flow cytometry analysis on samples from 13 FL and 9 DLBCL patients, comparing them with tonsil specimens from non-cancer patients (Supplementary Figures S1A, B).
While CD4+ T cells were equally abundant in tonsils, FL and DLBCL, only FL samples exhibited a comparable proportion of CXCR5+PD-1+ TFH within the CD4+FOXP3– conventional T cells (Tconv) relative to tonsils (Figure 1A). Both lymphomas contained significantly more FOXP3+ Tregs, which was reflected in more CD4+FOXP3+CXCR5+PD-1+ TFR cells among CD4+ T cells, but not among Tregs for FL (Figure 1B). In contrast to FL, DLBCL samples exhibited a significant reduction in both TFH and TFR cells. Furthermore, DLBCL had significantly fewer TFR among CD4+FOXP3+ Tregs compared to tonsil.
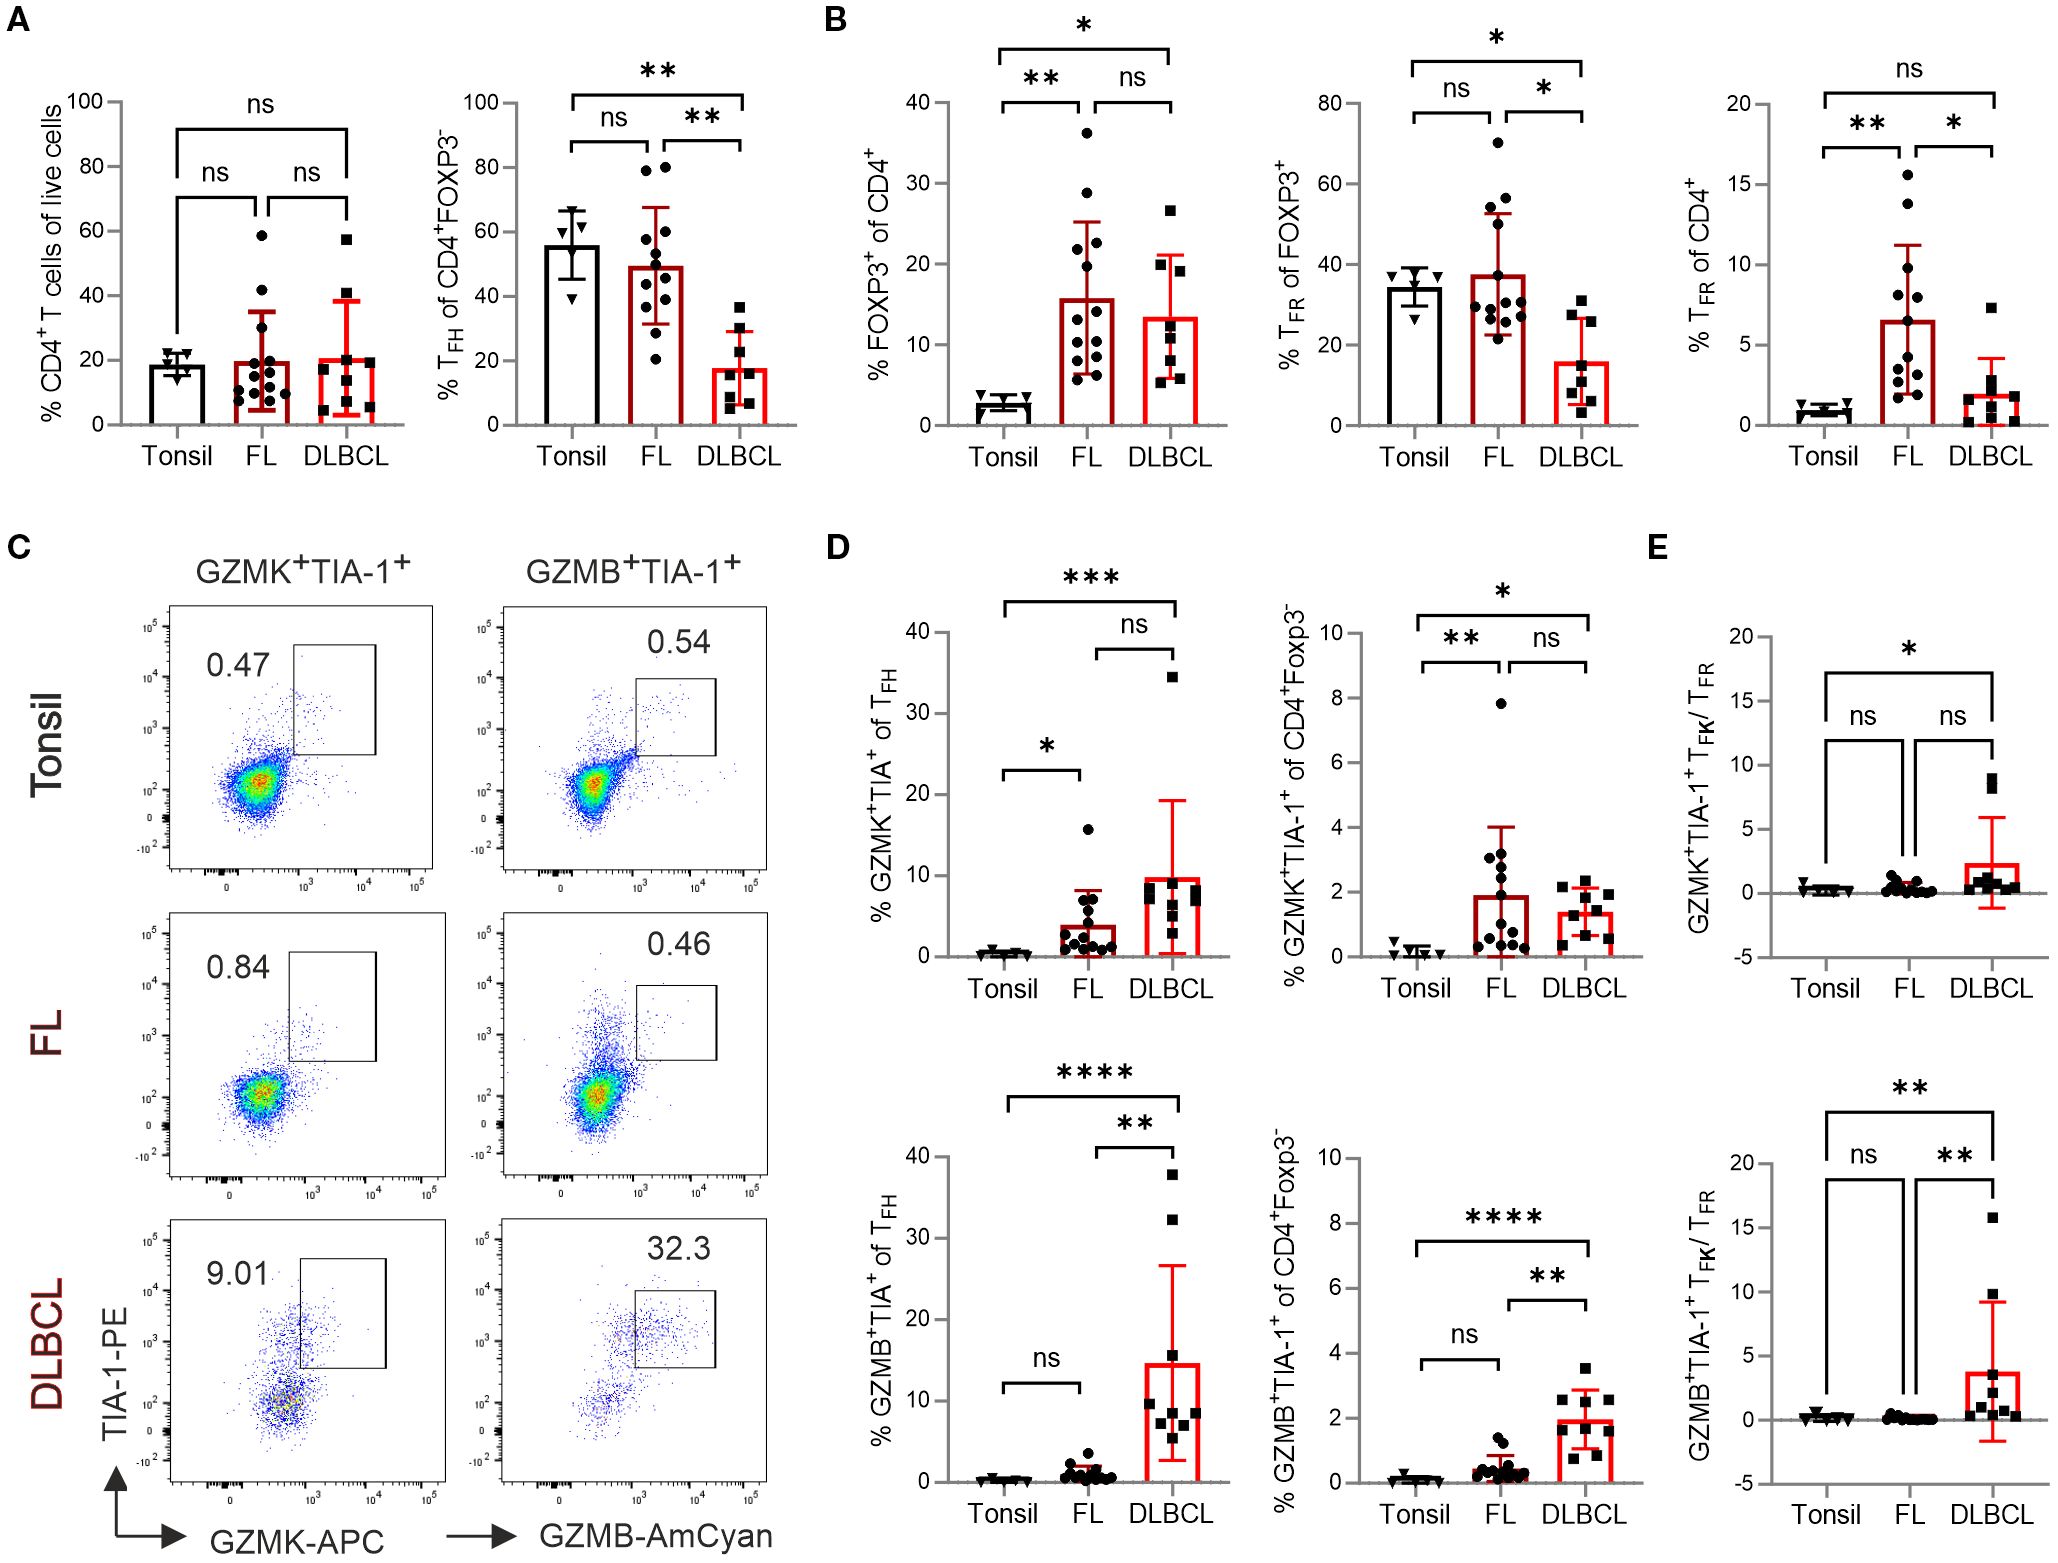
Figure 1. TFK cells are more frequent in FL and DLBCL patients. Flow cytometric analysis of different T-cell subpopulations in samples from tonsil (n=5), FL (n=13), and DLBCL (n=9). (A) Frequency of total CD4+ T cells and TFH cells. (B) Frequency of FOXP3+ regulatory T (Treg) cells and TFR cells. (C) Representative dot plots showing GZMK+TIA-1+ and GZMB+TIA-1+ TFH cells. (D) Frequency of GZMK+TIA-1+ and GZMB+TIA-1+ cells within TFH cells and CD4+Foxp3- T cells, respectively. (E) The ratio of GZMK+TIA-1+ or GZMB+TIA-1+ TFK cells to TFR cells. Kruskal-Wallis One-way ANOVA, ns, non-significant, *p < 0.05, **p < 0.005, ***p < 0.001, ****p < 0.0001.
TFK cells are characterized by high expression of NKG7 and granzymes, particularly the tryptases GZMK and GZMA, with lower level of GZMB (15). Given that human NKG7 can be recognized by the anti-TIA-1 antibody (clone 2G9A10F5) - which exhibits well-documented cross-reactivity with both TIA-1 and NKG7 through recognition of a conserved pentameric epitope (GYETQ in TIA-1 and GYETL in NKG7 (34)). We therefore quantified the number of GZMK+TIA-1+ or GZMB+TIA-1+ TFK cells within the CD4+FOXP3–CXCR5+PD-1+ TFH population (Figure 1C). Compared to tonsils, both FL and DLBCL showed a higher frequency of GZMK+TIA-1+ TFK cells within TFH or total CD4+ Tconv cells (Figure 1D). In contrast, the frequency of GZMB+TIA-1+ TFK cells was similarly low in tonsils and FL. Notably, DLBCL samples exhibited a relative enrichment of GZMB+TIA-1+ TFK cells within both the CXCR5+PD-1+ TFH and the total CD4+ Tconv population. Furthermore, the positive correlation between TFK cell abundance (both GZMK+TIA-1+ and GZMB+TIA-1+) and malignancy grade was confirmed by analyzing FL samples stratified by transformation stage (Supplementary Figures S2A, B). Given that TFR cells have been implicated in suppressing GZMK+ cytotoxic TFH cells in ectopic lymphoid follicles of patients with IgG4-related disease (35), we assessed the ratio of GZMK+TIA-1+ or GZMB+TIA-1+ TFK cells to TFR cells. Notably both TFK cell subsets outnumbered TFR cells in DLBCL samples, while this imbalance was not observed in FL (Figure 1E).
In summary, compared to tonsillar samples, FL exhibited an increased frequency of TFK cells, predominately of the GZMK+TIA-1+ phenotype, accompanied by significantly elevated Tregs and TFR cells. In contrast, DLBCL showed reduced numbers of TFH and TFR cells, but displayed enrichment of both GZMK+TIA-1+ and GZMB+TIA-1+ TFK cells as well as Tregs.
CD4+FOXP3–PD-1+ T-cell cytotoxicity decreases with CXCR5 expression in FL but not in DLBCL
Next, we aimed to determine whether tonsils, FL and DLBCL also contain cytotoxic non-TFH, defined as CD4+PD-1+CXCR5–TIA-1+ cells. Simultaneously we assessed CXCR5 expression level on the GZMK+TIA-1+ and GZMB+TIA-1+ TFK cells. For classification, we distinguished between PD-1+CXCR5med TFH and PD-1+CXCR5hi GC-TFH cells (16). In both tonsils and FL, most CD4+FOXP3–PD-1+ T cells express CXCR5 (Figure 2A). However, FL-derived CD4+FOXP3–PD-1+CXCR5+ cells exhibited intermediate CXCR5 expression level. In DLBCL, where TFH cells were less abundant (Figure 1A), the proportions of CD4+PD-1+CXCR5– and CD4+PD-1+CXCR5+ cells were roughly equal, while GC-TFH cells were underrepresented (Figure 2A). Interestingly, in tonsils, TIA-1+CD4+FOXP3–PD-1+ T cells were similarly frequent among CXCR5– and CXCR5hi subsets, though granzyme expression tended to decrease with increasing CXCR5 levels (Figures 2B, C; Supplementary Figures S3A-C). In FL, NKG7/TIA-1+ cells were predominantly non-TFH cells, less frequent in CXCR5med TFH cells, and rare in CXCR5hi TFH cells. Most TIA-1+ cells co-expressed granzymes, particularly GZMK in FL, while GZMK levels remained comparable across CXCR5–, CXCR5med, and CXCR5hiCD4+PD-1+ T cells. In DLBCL, no significant differences in cytotoxic phenotypes were observed among the analyzed T-cell subsets. However, CD4+FOXP3–PD-1+ T cells displayed generally high expression of TIA-1, GZMK, and GZMB, independent of CXCR5 expression level.
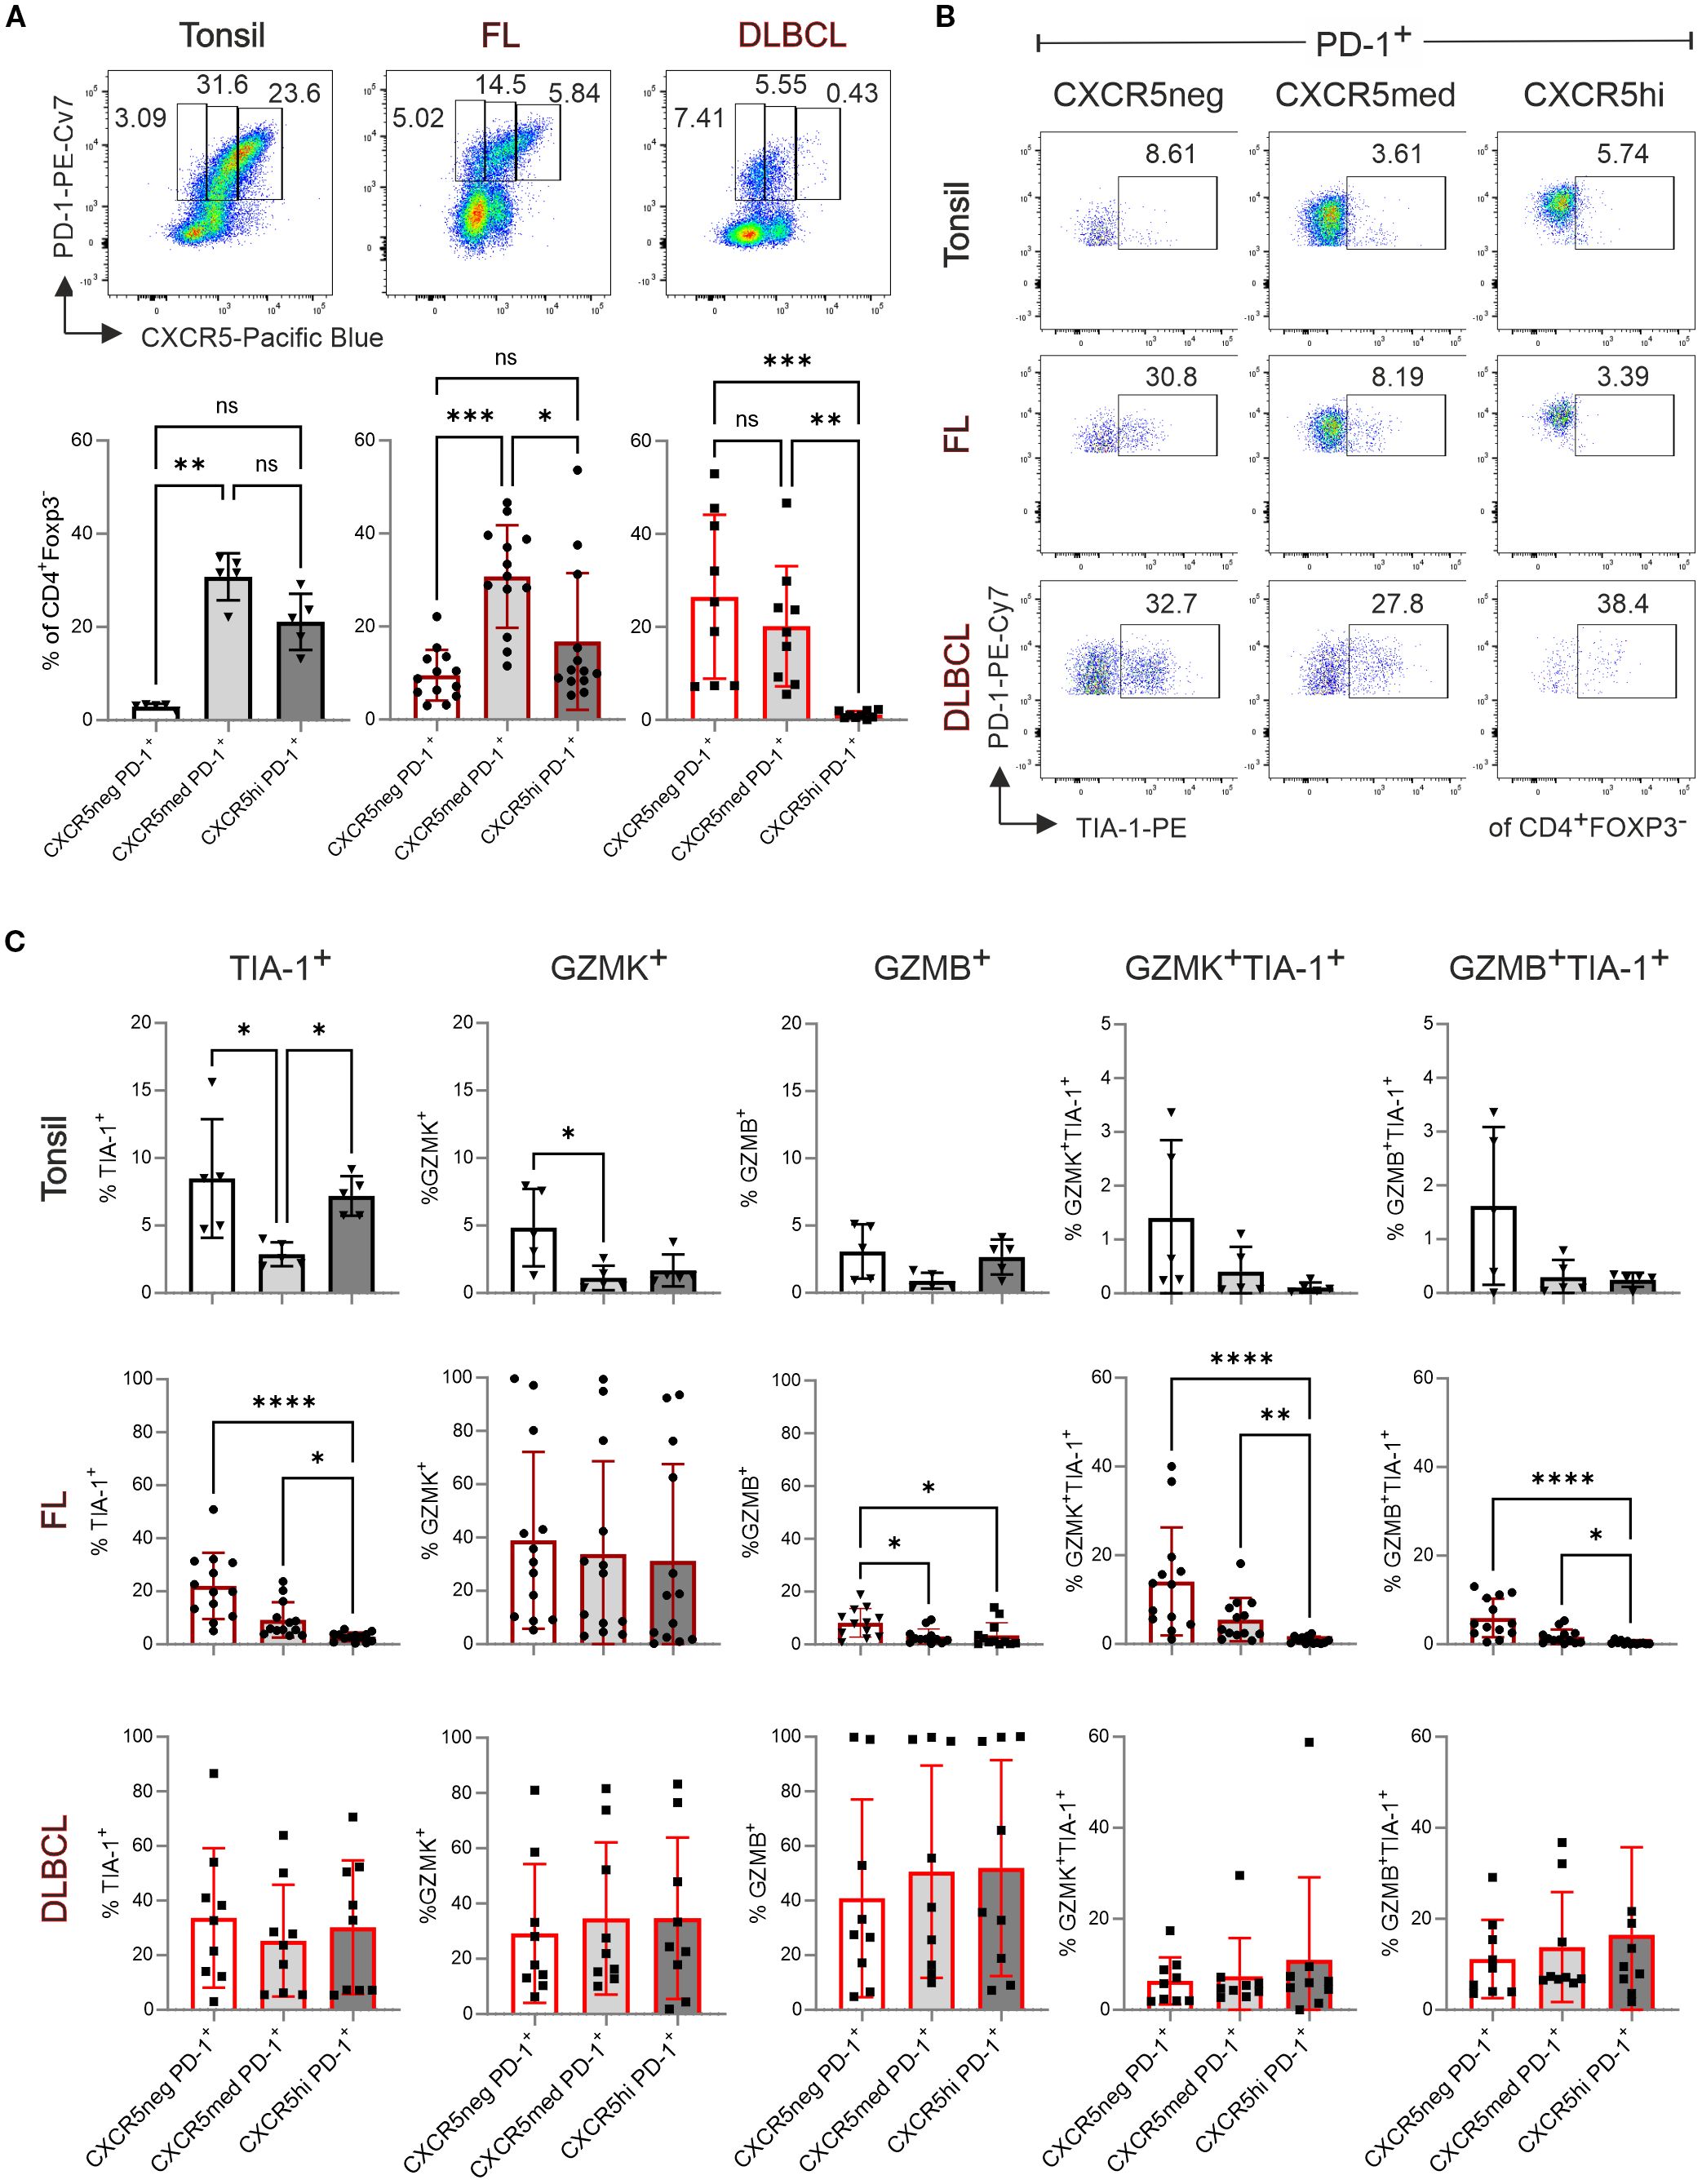
Figure 2. TFK cell frequency decreases with increasing CXCR5 expression in tonsils and FL but remains unchanged in DLBCL. Flow cytometric analysis of T-cell subpopulations in tonsil (n=5), FL (n=13), and DLBCL (n=9). (A) Representative dot plots (top panel) and frequency (bottom panel) of CXCR5–PD-1+, CXCR5medPD-1+, and CXCR5hiPD-1+ cells in tonsil, FL, and DLBCL samples. (B) Representative dot plots showing TIA-1 expression in CXCR5–, CXCR5med, and CXCR5hi populations. (C) Frequency of TIA-1+, GZMK+, GZMB+, GZMK+TIA-1+, and GZMB+TIA-1+ cells within CXCR5–PD-1+, CXCR5medPD-1+, and CXCR5hiPD-1+ population. Kruskal-Wallis One-way ANOVA, ns, non-significant, *p < 0.05, **p < 0.005, ***p < 0.001, ****p < 0.0001.
TFK cells localize in a higher likelihood to the atypical GCs in FL than to GCs in reactive LNs
Being CXCR5+, TFK cells could home to GCs. However, TFK cells in non-malignant tonsils are mainly localized extrafollicularly (15). To investigate their distribution in malignant tissues, we performed IF staining on FL samples, which maintain defined (though atypical) follicular structures with atypical GCs and partially preserved mantle zones, comparing them to reactive LNs as non-malignant controls. Using antibodies against CD19, CD4, TIA-1 and BCL6, we identified CD19+BCL6+ GC-B cells, CD4+BCL6+TIA-1– TFH and CD4+BCL6+TIA-1+ TFK cells. In both tissues we found single TFK cells, e.g. localized outside the follicles (Supplementary Figures S4, S5). Computer-assisted quantification uncovered comparable numbers of CD19+ B cells and total BCL6+ cells between FL and reactive LNs. However, FL samples contained fewer CD4+ T cells, fewer TIA-1+ cells, and a trend towards reduced TFH cell numbers (Figure 3A). Strikingly, the percentage of CD4+TIA-1+BCL6+ TFK cells within the CD4+BCL6+ TFH population was significantly higher in FL compared to reactive LNs (Figure 3B), although their cell numbers—whether total per sample, follicular, or GC-localized—did not differ significantly (Figure 3C). Morphometric analysis showed that atypical follicles and GCs in FL tended to be larger than their benign ones in reactive LNs. A similar trend was observed when comparing low-grade (grade 1–2) and intermediate-grade (grade 2–3A) FLs (Figure 3D). This size difference became statistically significant when quantified per image per sample (Figure 3E). In contrast, neither the number of follicles/GCs nor their frequency correlated with disease severity (Figure 3F).
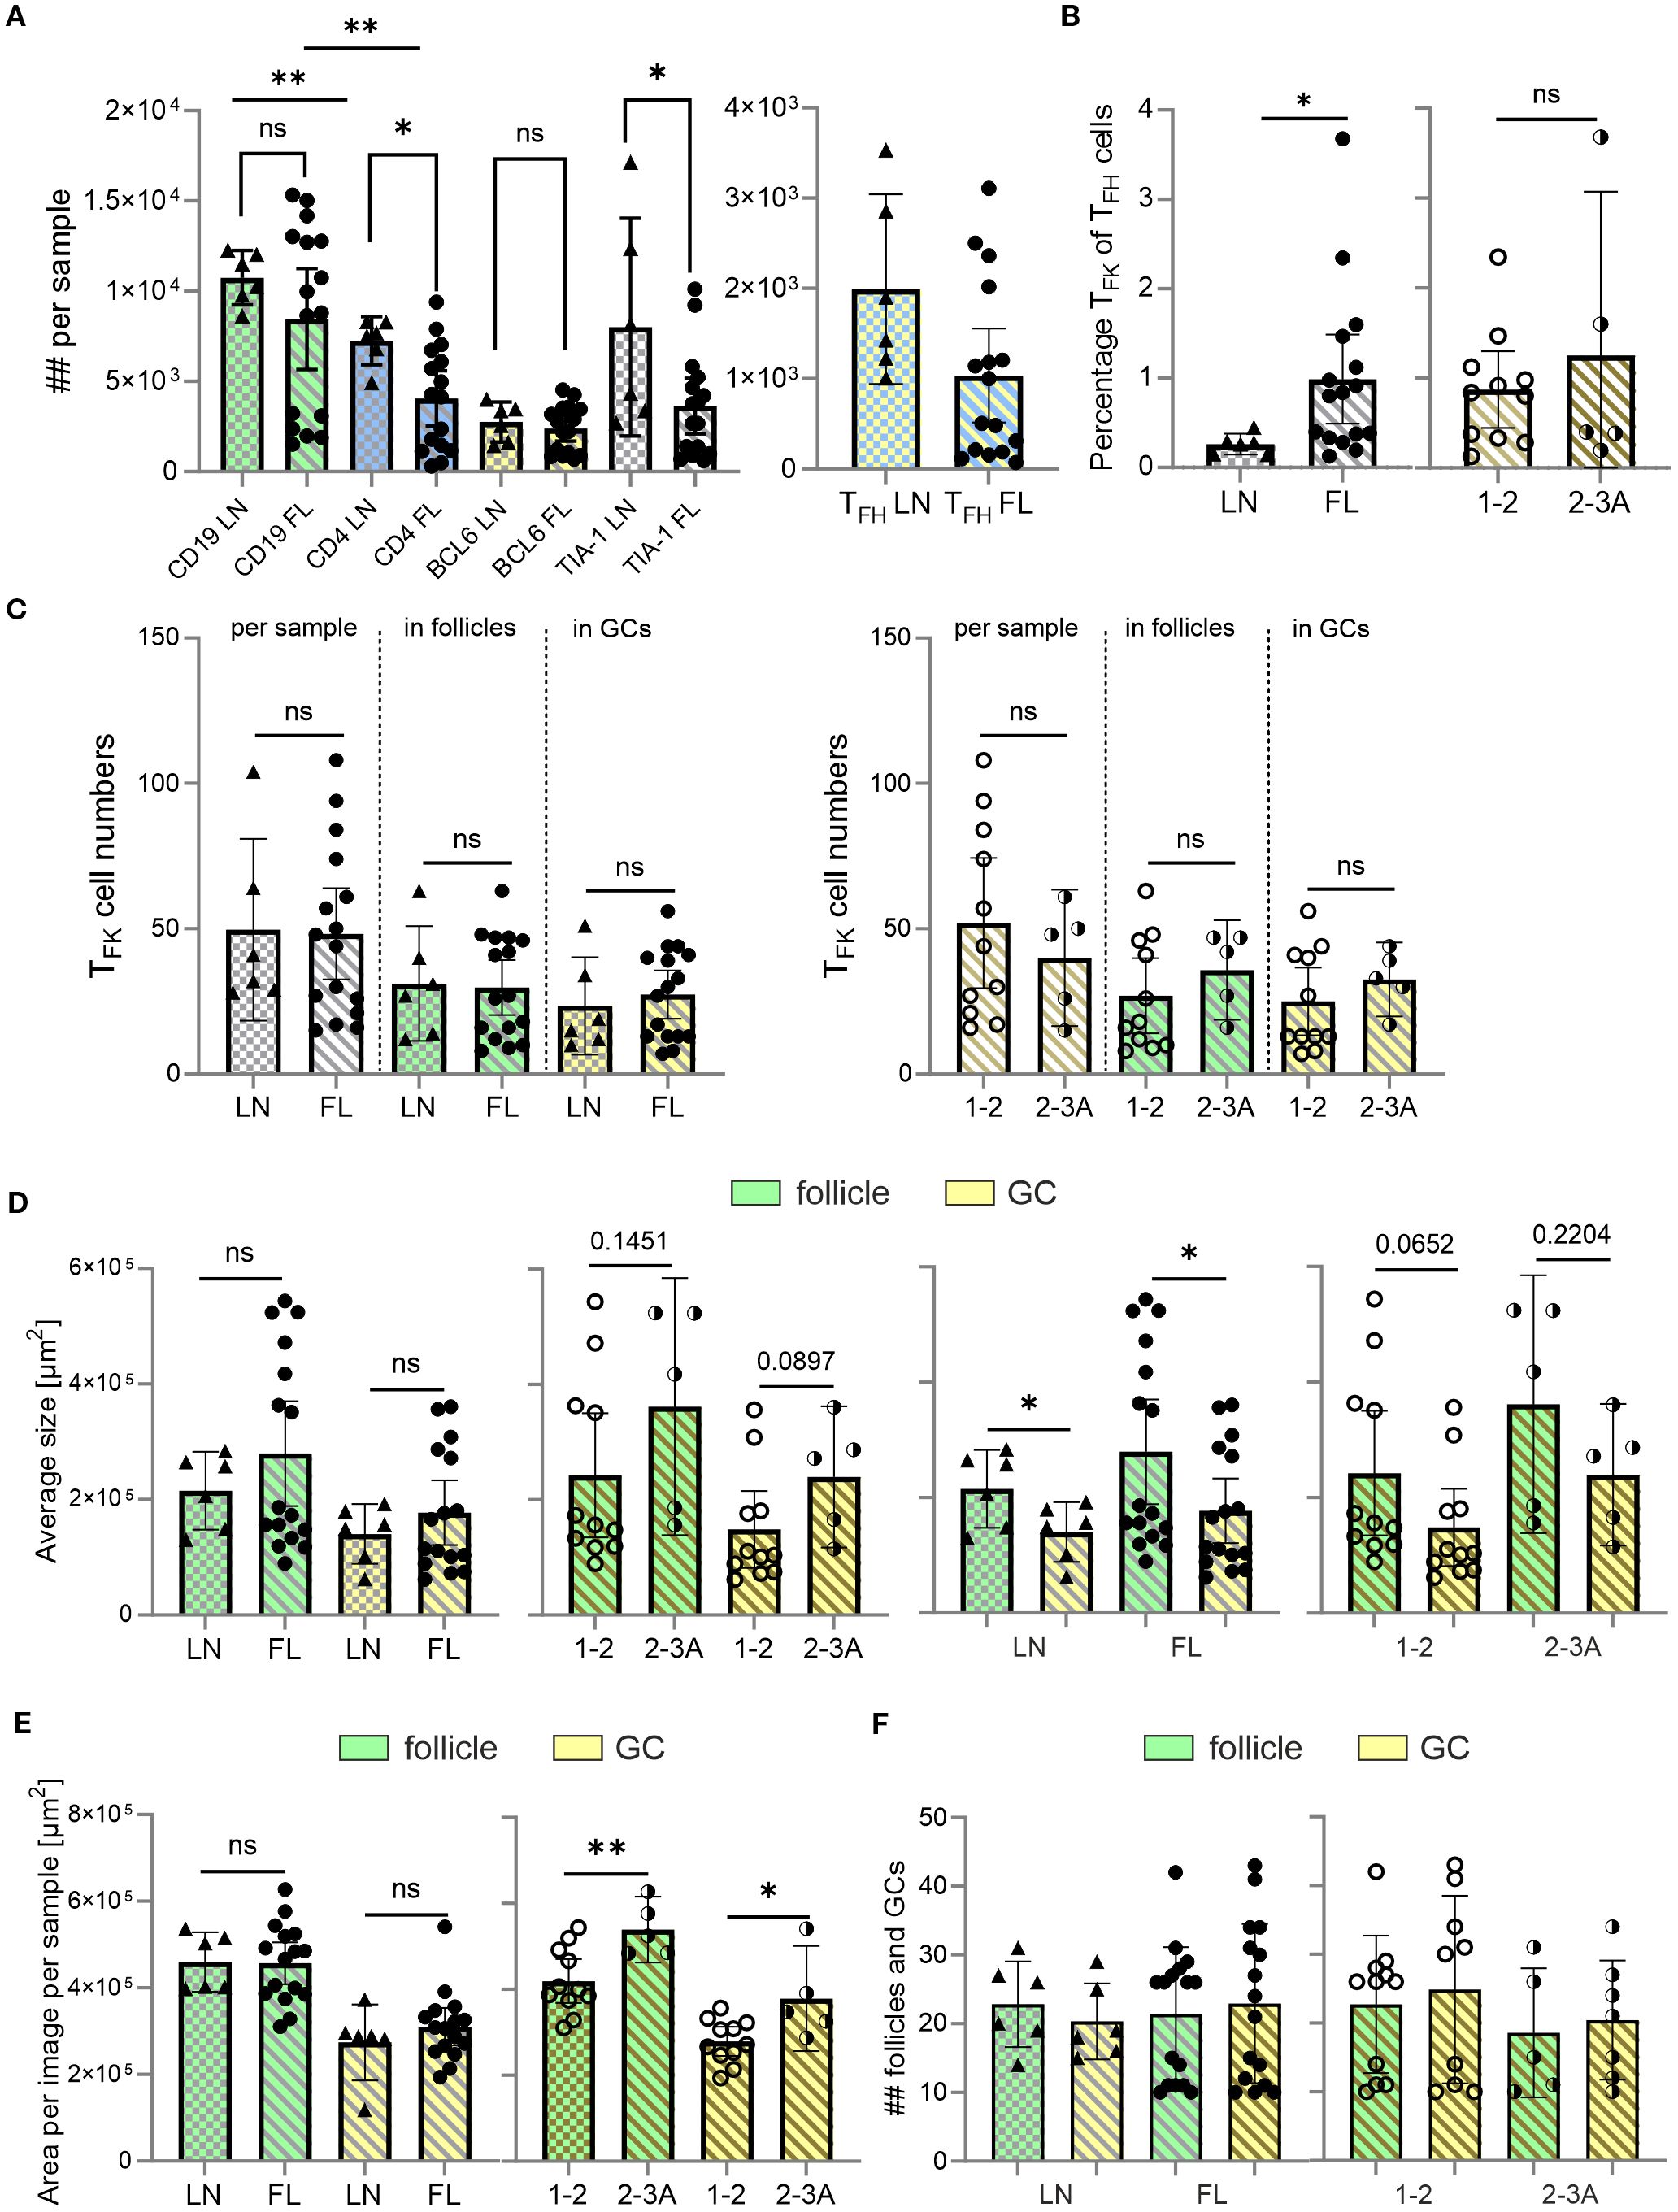
Figure 3. Despite no differences in TFK cell numbers, the percentage of TFK within TFH cells is enhanced in malignant versus non-malignant LNs. CD19 and follicles (green), CD4 (blue), BCL-6 and GCs (yellow), TIA-1 (cyan), FL grade 1-2 (light golden stripes), FL 2-3 (dark golden stripes). (A) Absolute cell numbers per sample of CD19+ B cells, CD4+ T cells, BCL6+ follicular cells, and TIA-1+ cells in non-malignant LNs and FL. (B) Percentage of TFK of TFH cells for LN, FL grade 1–2 and FL grade 2-3A. (C) TFK numbers between LN and low and intermediate graded FL in total, follicles or GCs. (D) Average follicle and GC size compared between FL and LN, as well as compared with each other within the same tissue origin. (E) Area covered by follicles and GCs in non-malignant LNs, and FL grade 1–2 or grade 2-3. (F) Absolute number of follicles and GCs in FL and LN. (A-F) Mann Whitney T-test, ns, non-significant, *p < 0.05, **p < 0.005.
Thus, immunofluorescence analysis unequivocally identified CD4+TIA-1+BCL6+ TFK within the atypical follicles and GCs of FL tissues (Figure 4A). Interestingly, their relative abundance in GCs/GC-like structures showed a significant stepwise increase with disease progression—first from reactive LN to FL overall, and then with disease severity (Figure 4B). This led to higher TFK cell numbers in the atypical follicles and especially in “GCs” of grade 2-3A FLs compared to grade 1–2 FLs (Figure 4C). In summary, while CD4+TIA-1+BCL6+ TFK cells are present in both reactive and malignant LNs, their follicular and GC localization is markedly more pronounced in FL than in mildly inflamed tonsils (15). Importantly, we observed that TFK cell frequencies among TFH cells and their GC homing propensity were highest in more advanced FL grades, suggesting a potential association between TFK cell accumulation and disease malignancy.
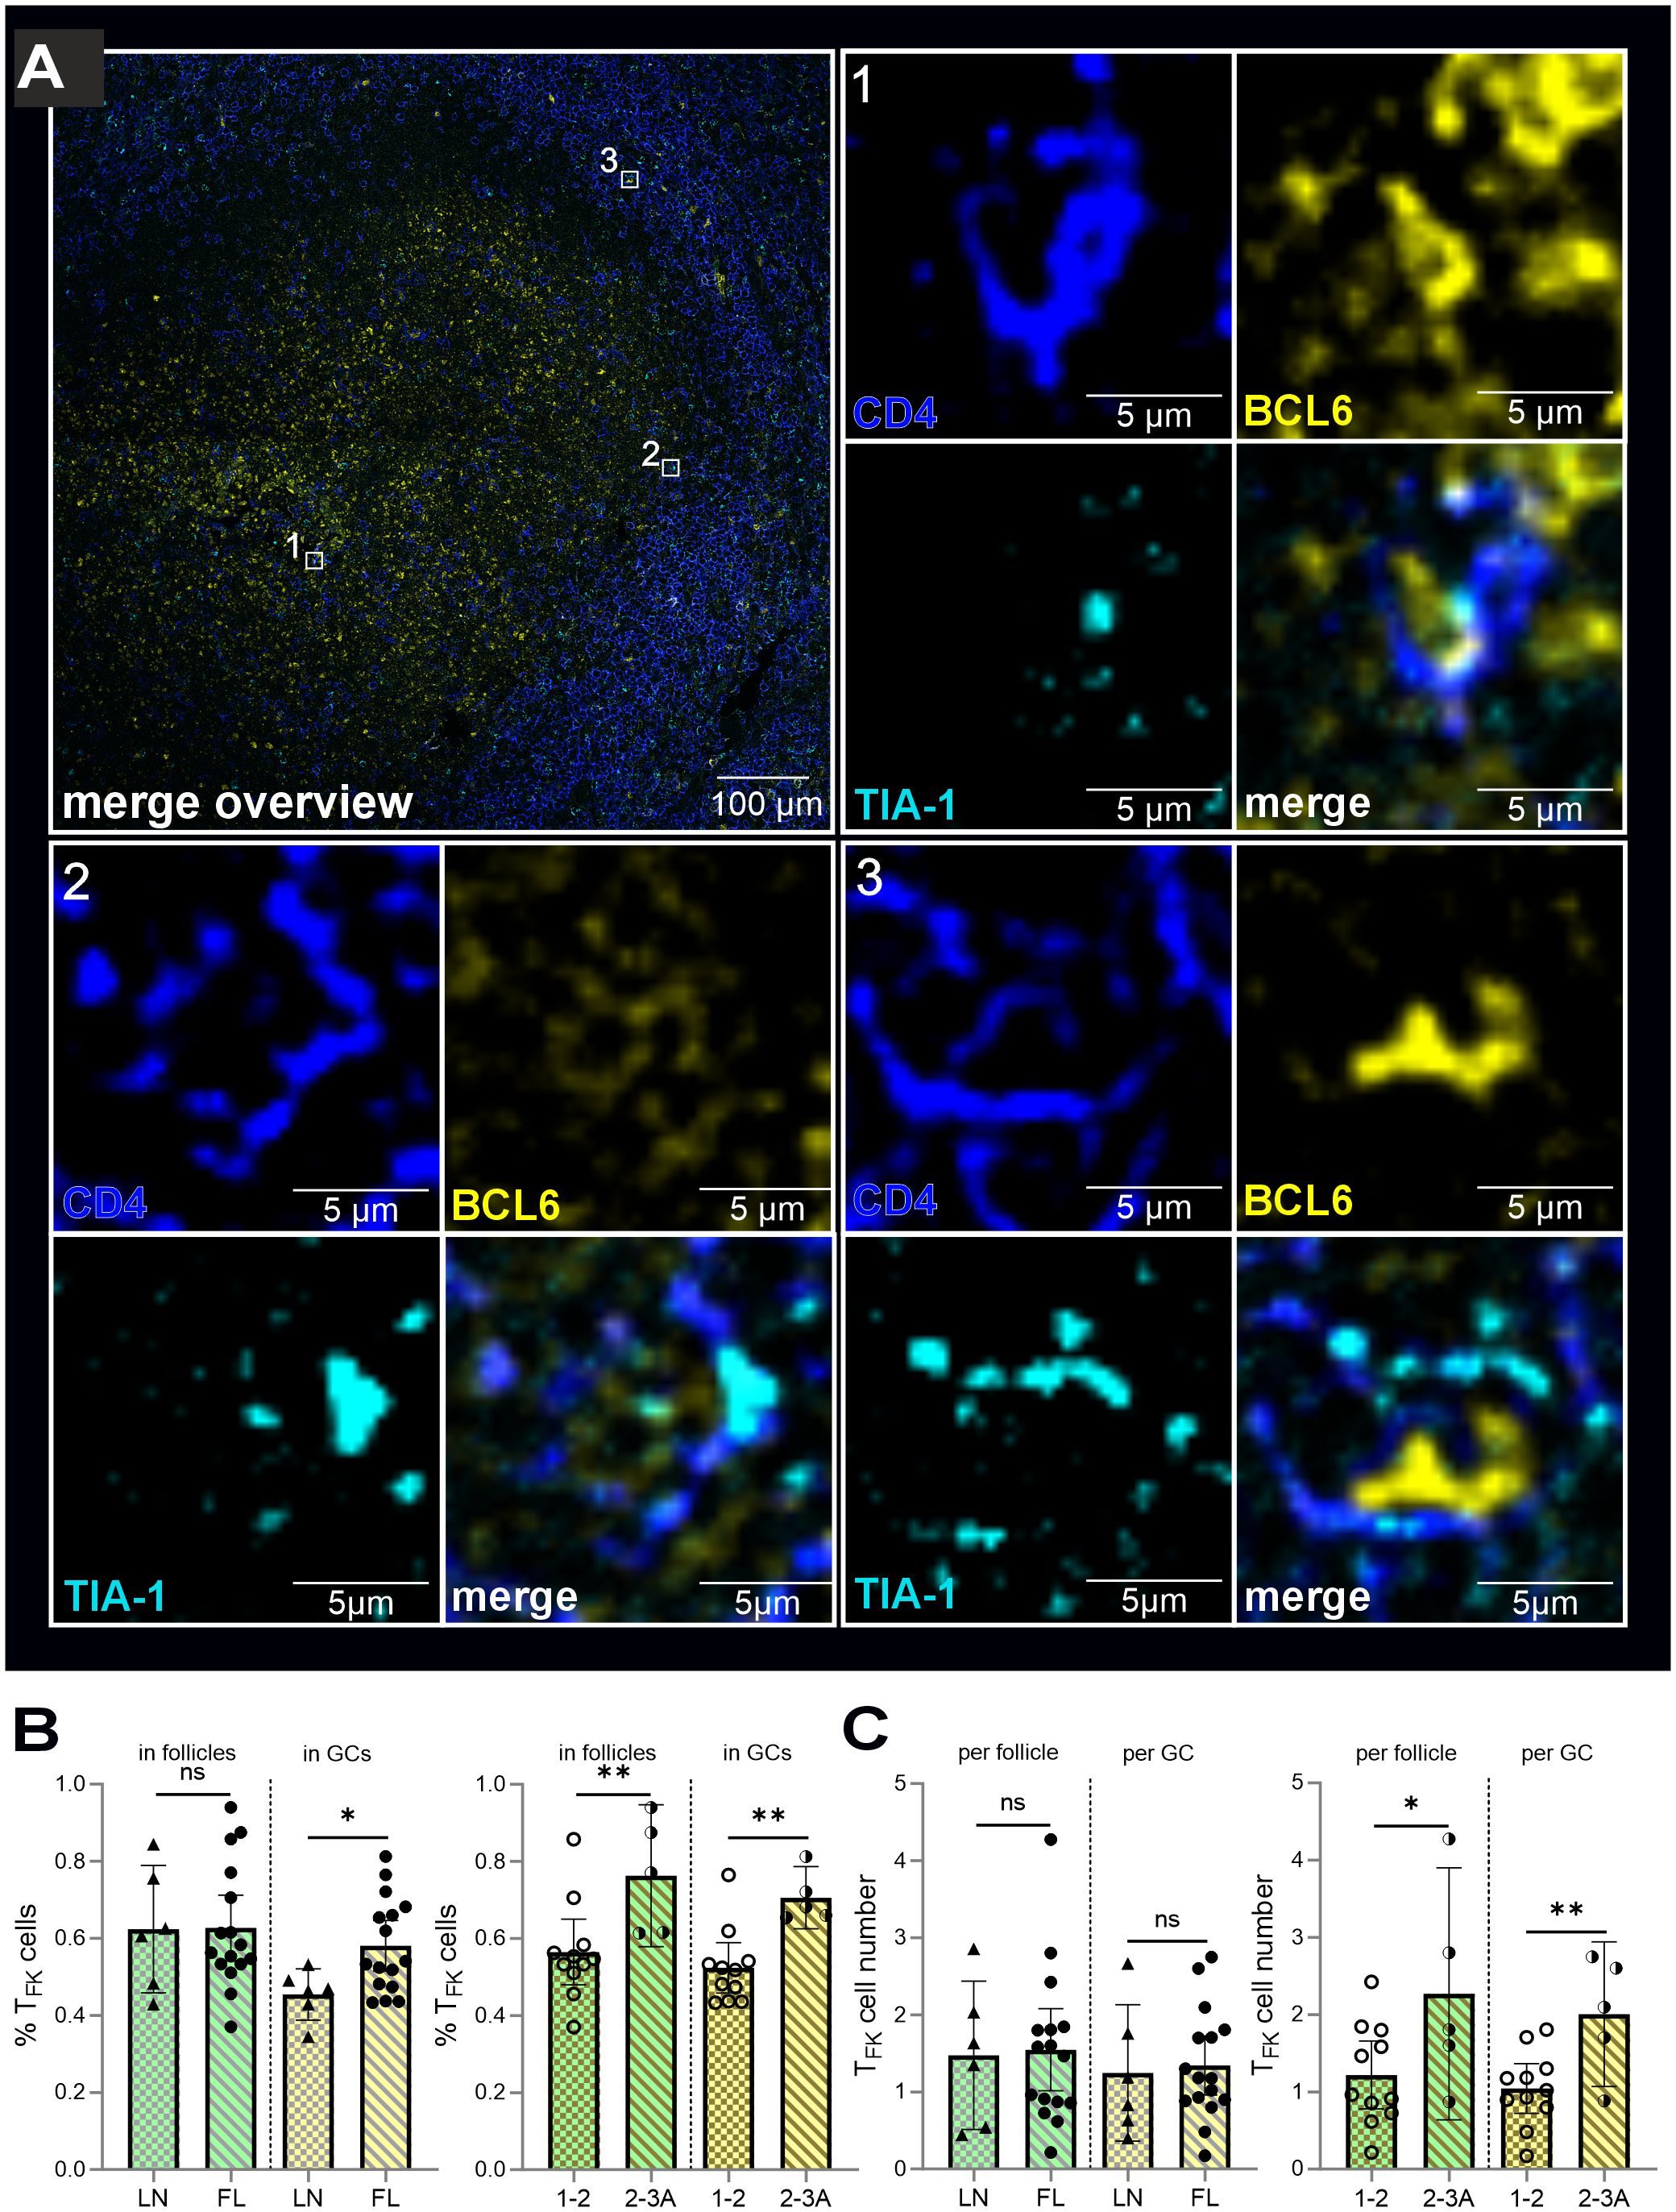
Figure 4. TFK cells are more likely to be located in the atypical GCs of FL than in the benign GCs of non-malignant LN. CD4 (blue), BCL6 and GCs (yellow), TIA-1 (blue), follicles (green), FL grade 1-2 (light golden stripes), FL 2-3 (dark golden stripes). (A) TFK cells in “GCs” of FL. Each cell is indicated in the overview. All three separate channels are shown for each cell as well as the merged images. (B) Percentage of TFK cells of all detected TFK cells within follicles and GCs of non-malignant versus FL-LNs, FL grade 1–2 and FL grade 2-3A. (C) Differences in absolute TFK cell numbers in non-malignant versus FL-LN as well as in low (1-2) and intermediate (2-3A) graded FL for atypical follicle and “GC”. (A-C) Mann Whitney T-test, ns, non-signigicant, *p < 0.05, **p < 0.005).
Single cell RNA sequencing CD4+ T cell confirmed the presence of TFK cells in FL and DLBCL
To further characterize the NKG7+/TIA-1+ CD4+FOXP3–PD-1+CXCR5+ in FL and DLBCL, we could rely on publicly available scRNAseq data (32). Spasevska et al. had been interested to define the phenotype of intratumoral Tregs in FL and DLBCL and sequenced CD4+ T cells from three FL, DLBCL and non-malignant tonsils each. Besides three Treg clusters, they defined 10 clusters of CD4+ Tconv cells of which two resembled TFH cells (PDCD1, CXCR5, IL21, and TOX2) and one displayed upregulated RNA for GZMK, NKG7, CST7, GZMA, GZMB, and PRF1 (32).
We reanalyzed the data using Seurat version (v5.2.1) and projected them in a weighted-nearest neighbor uniform manifold approximation and projection (wnnUMAP) defining the same clusters (c0 – c12; Figure 5A). Simplified UMAPs showed higher CXCR5, PDCD1, IL21 and TOX2 RNA expression in TFH c5 and c8 as well as FOXP3 in c3 and c10 or LAG3 in c9/FOXP3–LAG3+ Tregs (32) (Figure 5B). c1 [designated as GZM+ (32)] exhibited almost exclusive RNA expression of NKG7, CCL5, GZMK, GZMA, GZMB, and CST7 (encoding cystatin-F). However, cells in c1 also shared the expression of CXCR5, PDCD1, TOX2, or LAG3 with TFH cells, activated FOXP3+ and FOXP3–LAG3+ Tregs, albeit CXCR5 to a lesser extent than in TFH cells. Still, this classified c1 as a subtype of follicular cells, before named TFK cells by us (15). As a minimum it can be stated that c1 contained TFK and that c3 contained TFR cells as well as that c9/LAG3+ Tregs, expressing CXCR5, PD-1, TOX2, and IL-21, resembled TFH-like cells.
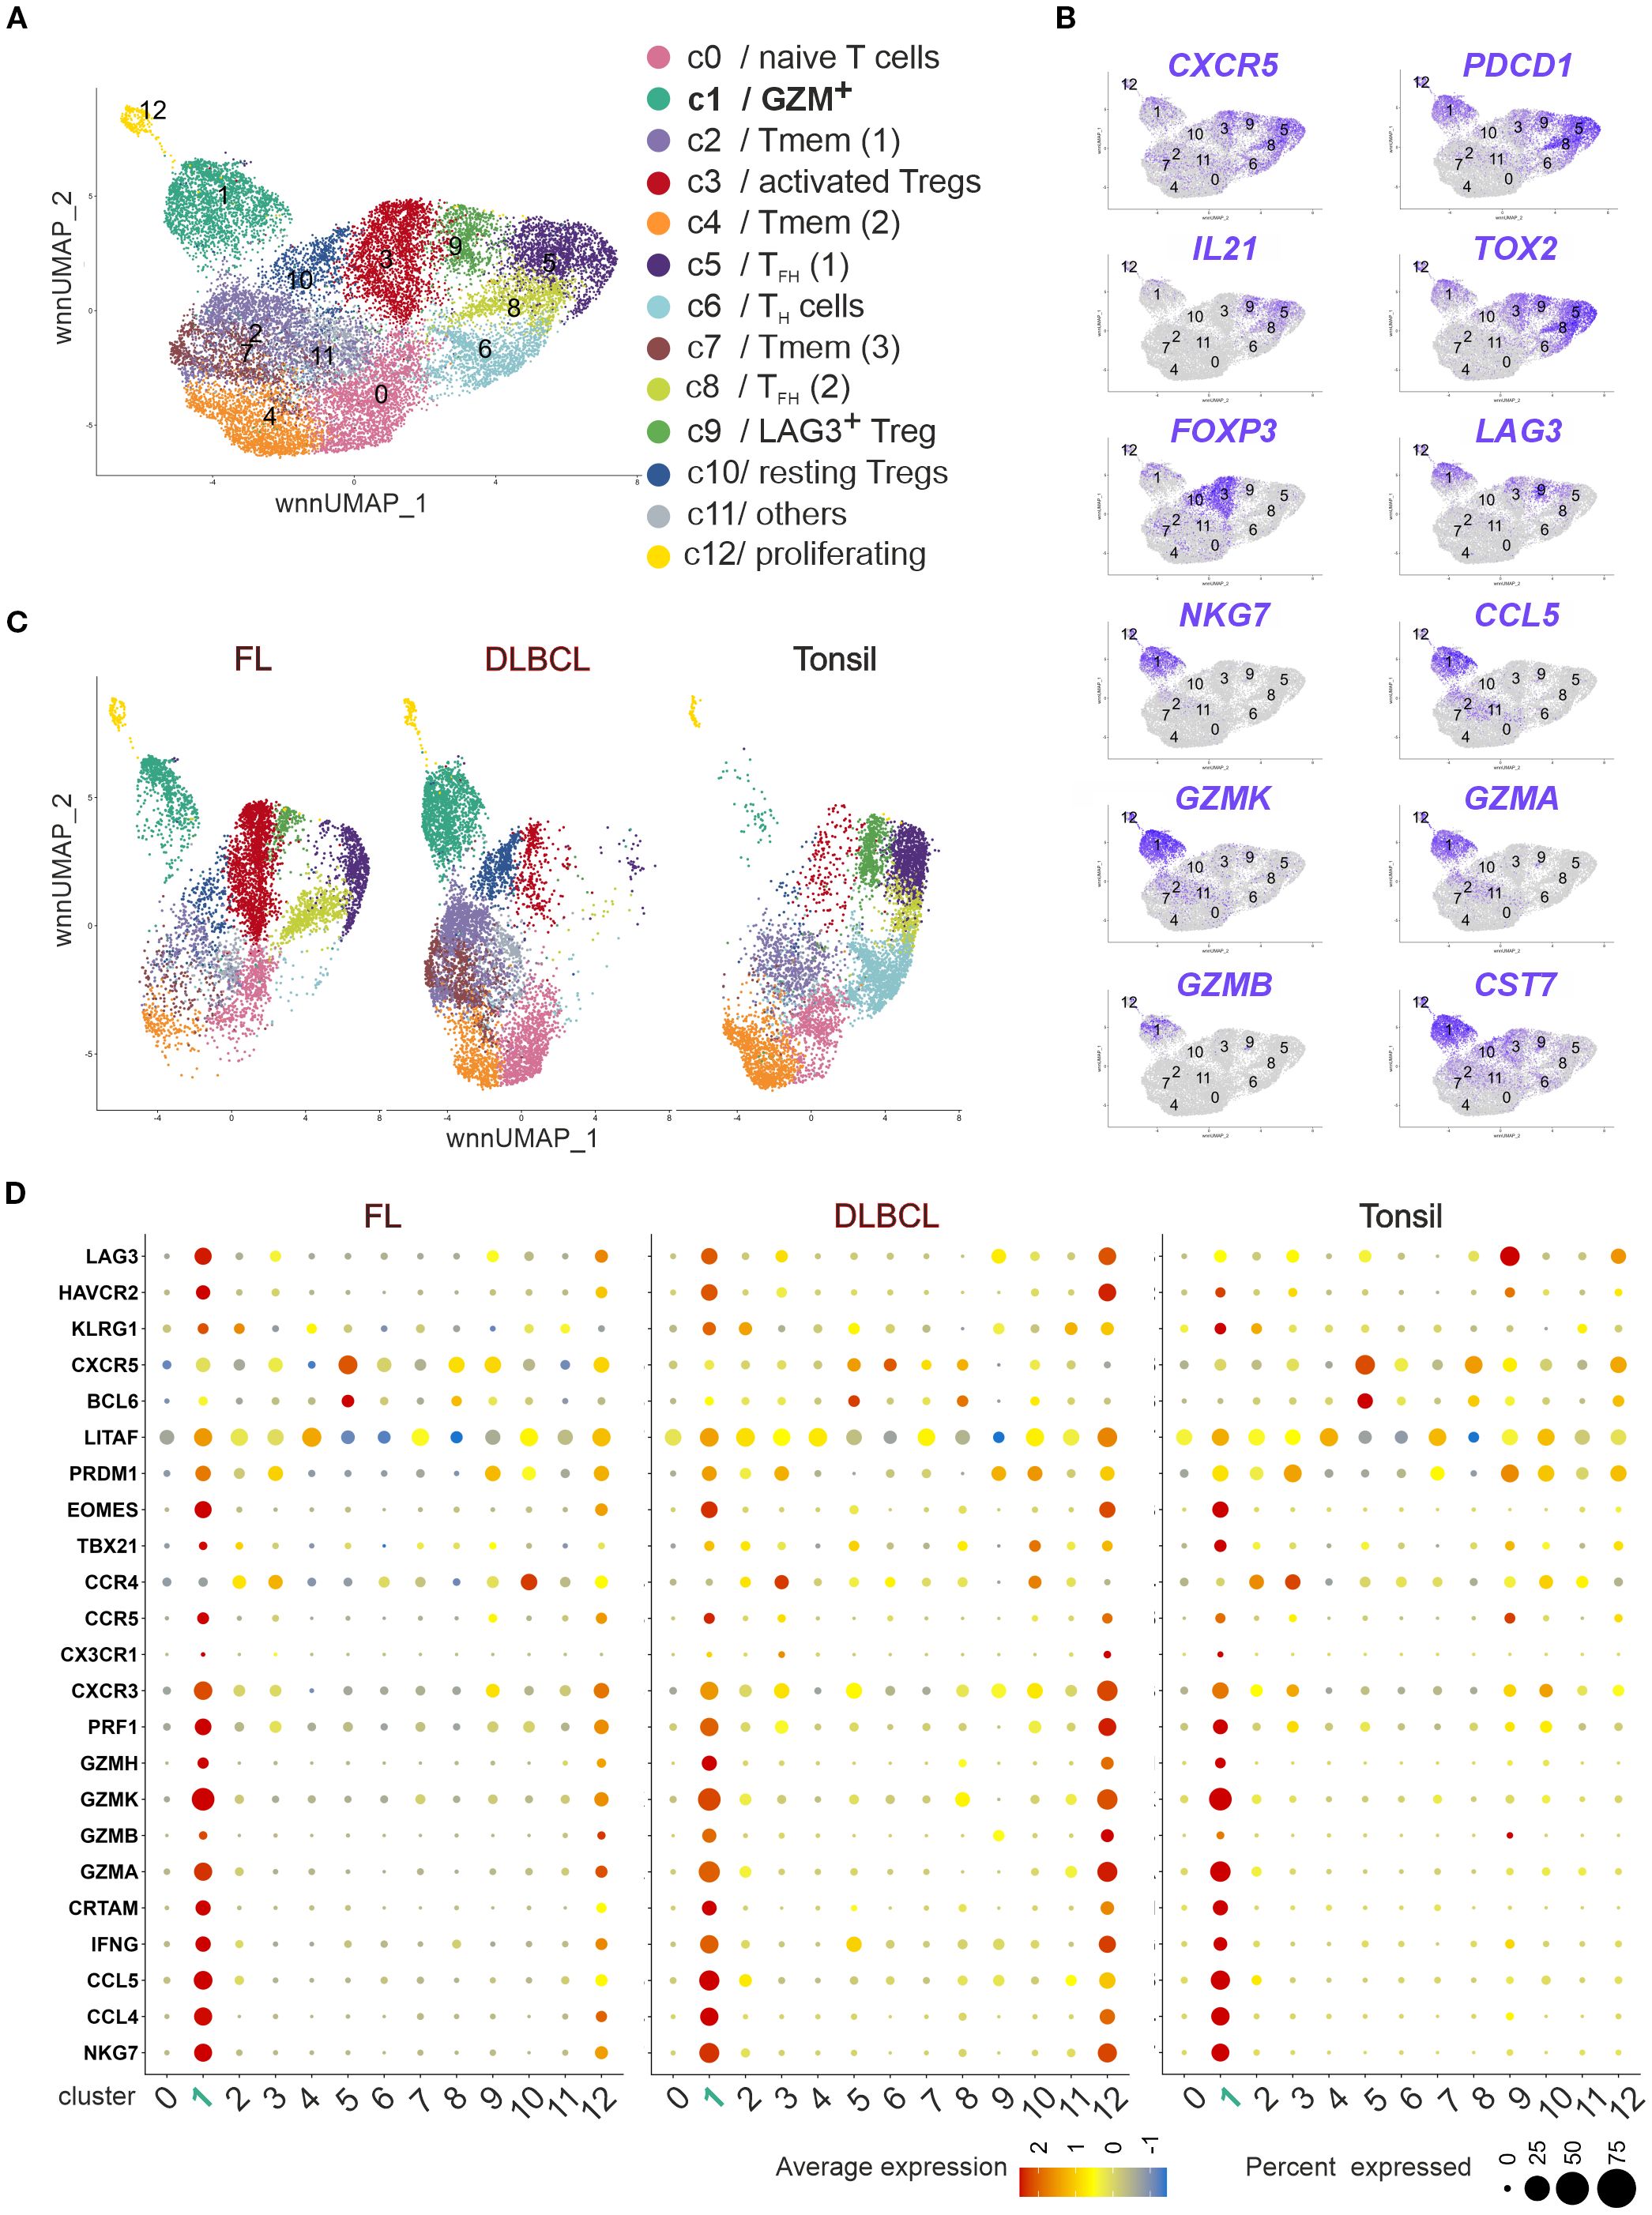
Figure 5. Tonsils, FL, and DLBCL harbor cytotoxic CD4+ T cells with a TFK transcriptome. Publicly available scRNAseq data of CD4+ T cells of three tonsils, three FL and three DLBCL lymphoma (32) were reanalyzed regarding their cytotoxic phenotype. (A) wnnUMAP of pooled CD4+ T cells (n = 18,771 cells, roughly 2,000/donor). Each dot corresponds to a single cell, color-indexed according to its cluster affiliation (c0-c12, cluster color code and annotation corresponding to (32). (B) Feature plots of TFH, Treg and TFK gene markers on simplified wnnUMAPs. (C) wnnUMAPs separated by origin. (D) Bubble plots to project TFK gene markers to each cluster in FL, DLBCL or tonsils. The size of a dot corresponds to the percentage of cells expressing the # feature in each cluster. The color represents the average expression level.
In agreement with our flow cytometric data, the three sequenced DLBCL samples enclosed almost no non-cytotoxic TFH cells (c5 and c8 or c9; Figure 5C). However, while only a limited number of cells from GZM+ c1 could be identified in tonsils, FL exhibited approximately 10% and DLBCL 20% cytotoxic CD4+ T cells (Figure 5C). Plotting the signature genes of TFK cells to all clusters in FL, DLBCL, and tonsils revealed the presence of them in tissues of each origin (Figure 5D). Interestingly, in FL and more pronounced in DLBCL the small cluster of proliferating CD4+ T cells (c12) acquired a similar cytotoxic phenotype. Taken together, despite lower CXCR5 and BCL6 levels than in TFH cells, tonsils, FL and DLBCL harbored cytotoxic CD4+ T cells with a TFK phenotype, confirming the TFH-like phenotype of cytotoxic CD4+ T cells found in FL (26).
c1/GZM+ can be divided into GZMKhi and GZMK+GZMBhi TFK cells
Next, we directly compared c1/GZM+ between the different origins (Figure 6A). Contrasted to non-malignant tonsils, the level of TFK marker gene expression was usually higher in at least one of the lymphomas. Only CCL4, CCR4 and TBX21 (encoding T-BET) were more pronounced in tonsillar TFK cells compared to FL and DLBCL. The follicular phenotype defined by CXCR5 and BCL6 was best observed in FL coinciding with LAG3, LITAF, PRDM1, EOMES, CCR5, CXCR3, and CRTAM upregulation. Of note, GZMK was expressed in a high percentage of all cytotoxic CD4+ and TFK cells, yet the GZMK expression level per cell was clearly chief in FL. c1 cells from DLBCLs exposed their cytotoxic transcriptome with comparably highest expression of GZMB, GZMA, GZMH, PRF1, IFNG, CCL5 and NKG7, HAVRC2 (encoding TIM3) and KLRG1 (Figure 6A). The differences were consistent with the appearance of c1 in the UMAPs of FL, DLBCL, and tonsils, defining the dominant phenotype of FL-TFK cells as GZMKhi and c1/GZM+ as either GZMK+ or GZMK+GZMBhi enriched in DLBCL (Figure 6B).
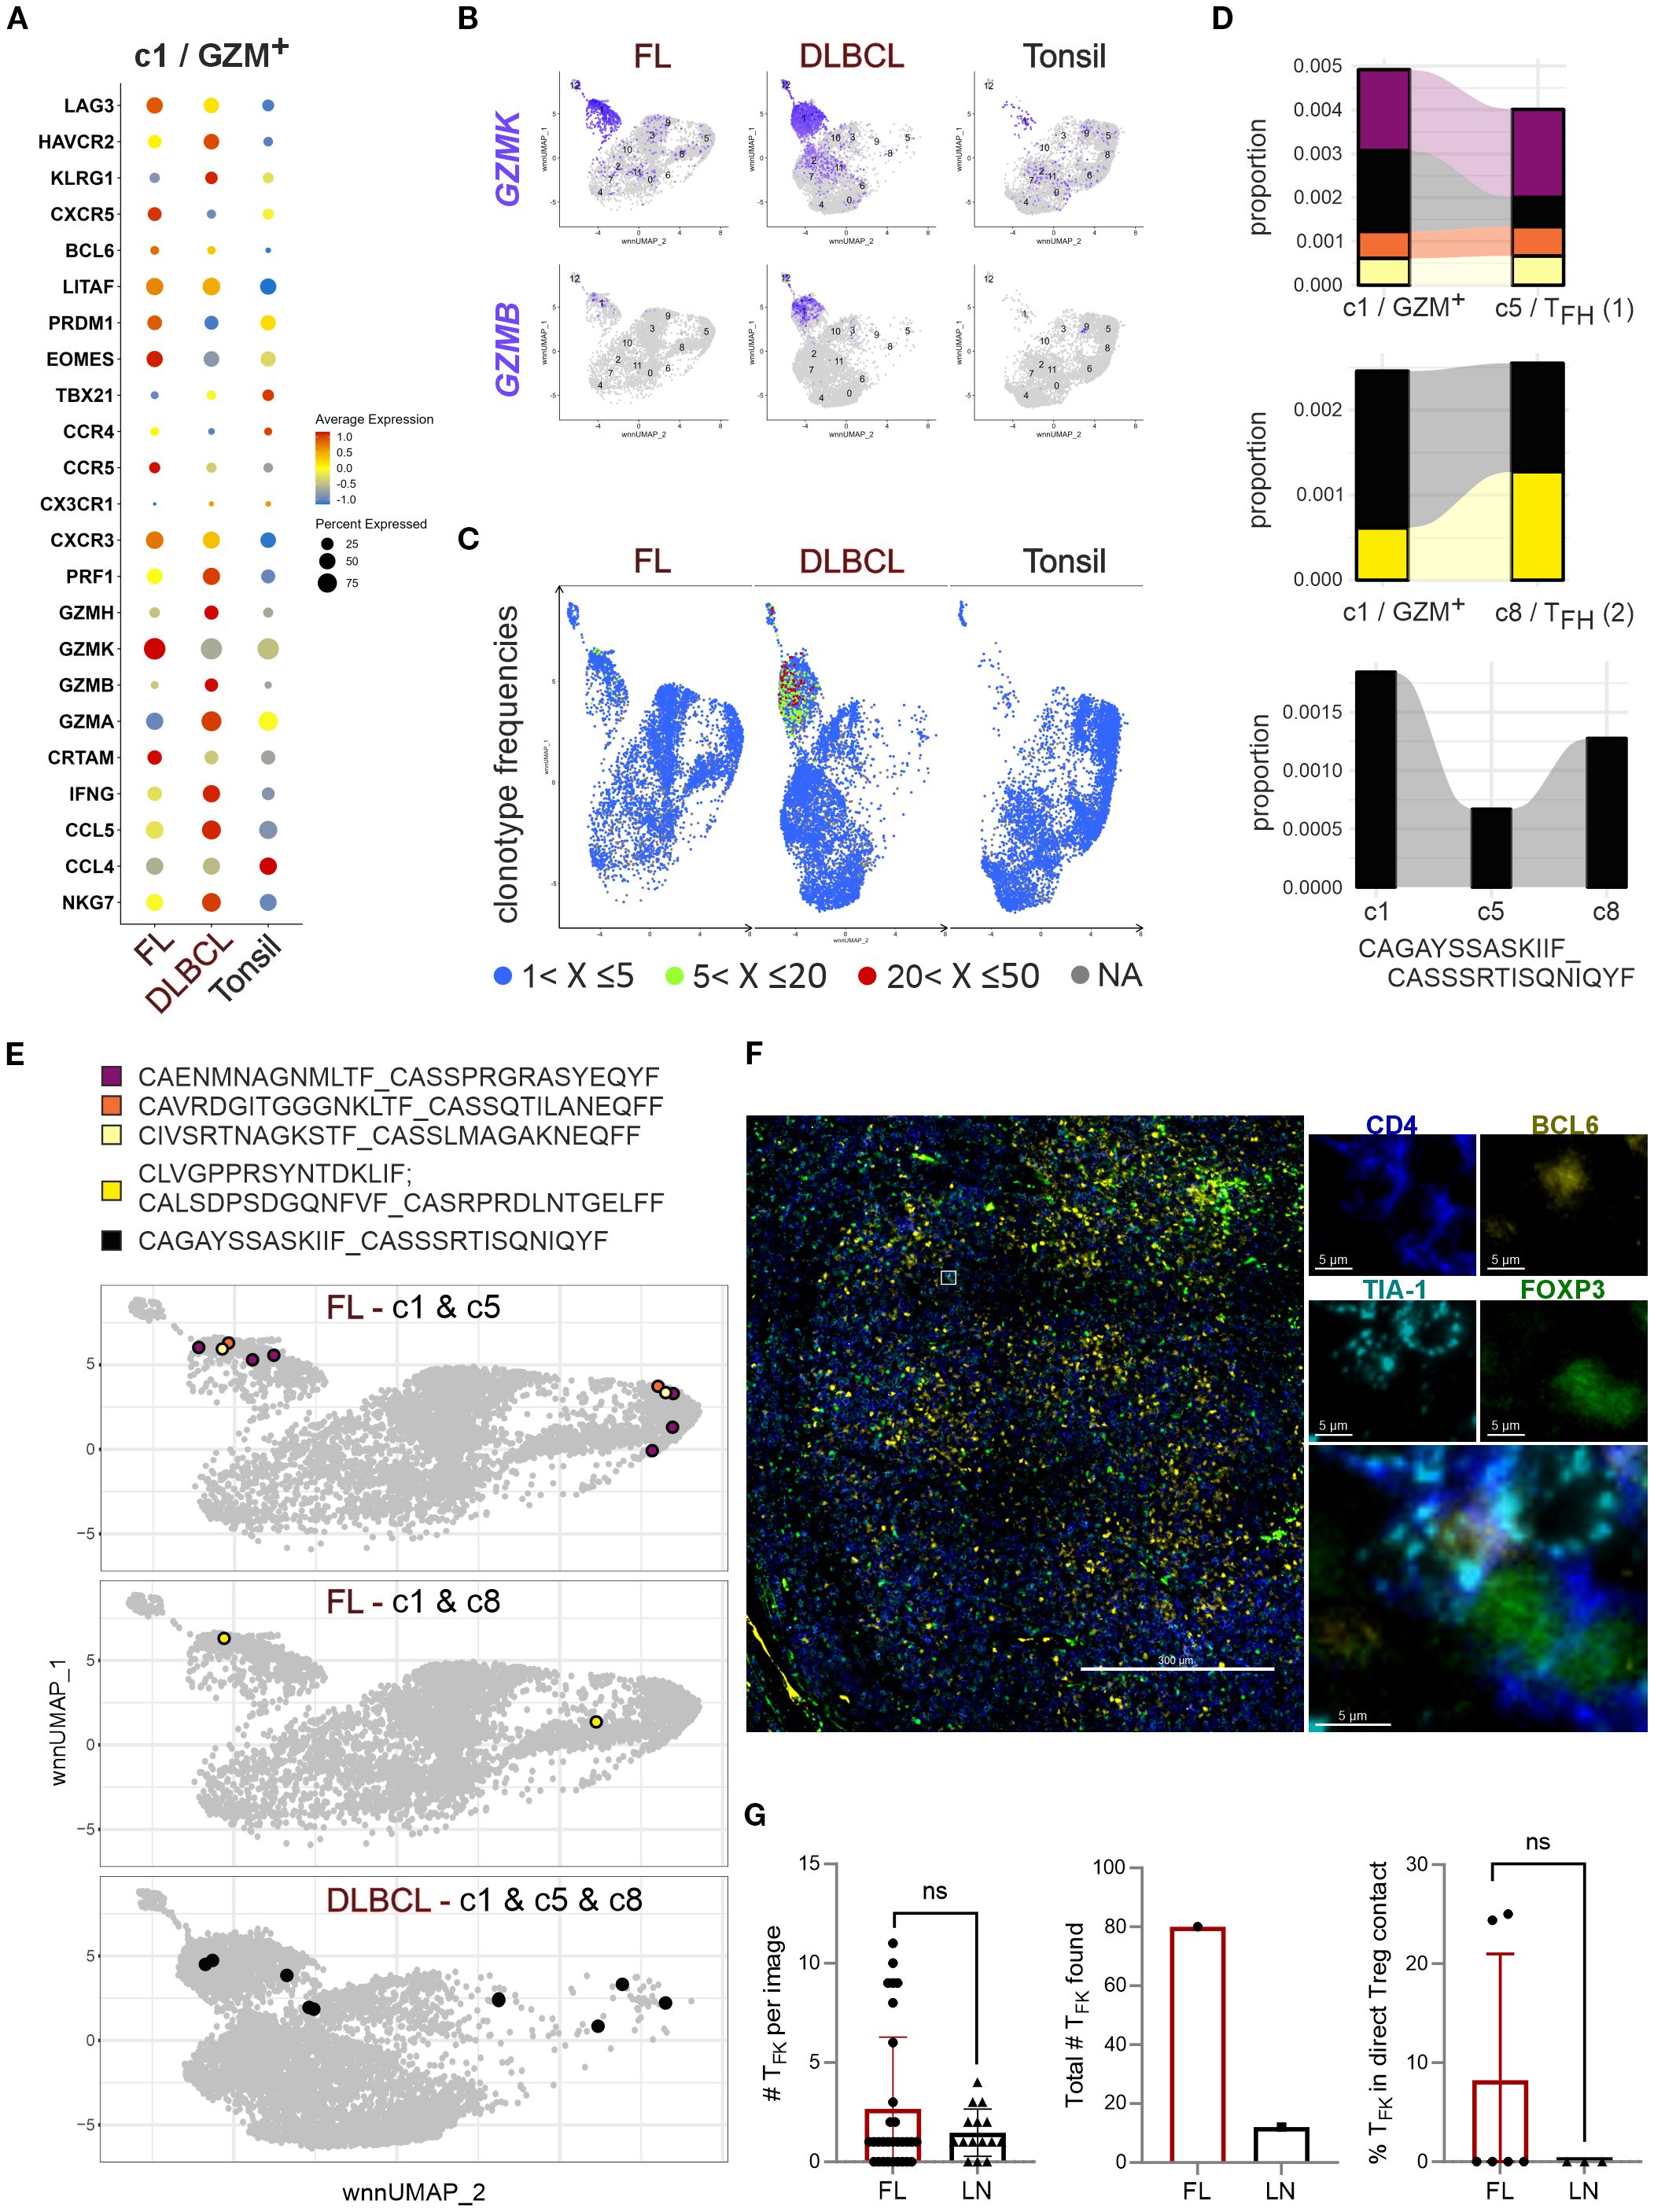
Figure 6. GC-lymphoma-derived TFK cells express GZMK +/- GZMB, are oligoclonal, and rarely cluster with Tregs. (A) Bubble plot to project TFK gene markers to c1/GZM+ of FL, DLBCL, and tonsils in direct comparison. (B) Feature plots of GZMK versus GZMB on simplified wnnUMAPs of FL, DLBCL or tonsillar CD4+ T cells. (C) TCR clonotype frequencies projected on the wnnUMAPs of FL, DLBCL, and tonsils. The color indicates the rank of a clone in frequency. (D) Proportion of enlarged c1-TFK TCR clones also occurring in c5-TFH (1) and/or c8-TFH (2). The size represents the proportion in the total types. The clonotype sequence shown is shared between c1-TFK and both TFH clusters. (E) The color-coded c1 clonotypes shared with c5 and/or c8 are given in sequence and on simplified wnnUMAPs of FL or DLBCL, depending on their occurrence. (F) FL with TFK cells and FOXP3+ Tregs: FOXP3 (green), CD4 (blue), BCL6 (yellow), TIA-1 (cyan). Shown is an overlayed overview and a selected TFK cell in direct contact with a FOXP3+ Treg in the four separate channels and as merged image; scale bars 300 µm or 5 µm. (G) Number of TFK cells per image, overall analyzed in this context, and the percentage of TFK cells in direct contact with Tregs. Mann-Whitney T-test. ns, nonsignificant.
TFK cells are oligoclonal sharing TCRs with non-cytotoxic TFH cells and Tregs
Our previous study demonstrated an oligoclonal nature of TFK cells (15), a finding corroborated by Spasevska et al. through TCR sequencing (32). Clonal expansion was particularly evident in c1/GZM+, showing moderate expansion in FL and more prominent in DLBCL (Figure 6C). Notably, some of the enriched TCRs in c1 could be found in the TFH clusters (Figures 6D-E). A comparison between the two TFH clusters indicated elevated CXCR4, ZNP331, TNFAIP3, and MAP3K8 transcript levels in c5/TFH (1) (Supplementary Figure S6), which is consistent with GC-TFH phenotypes (15). Interestingly, FL-c1/GZM+ cells were more likely to share TCRs with GC-TFH (c5) cells than with c8, although c8 was augmented in FL compared to tonsils (Figure 5C). One clone defined by a common TCR, appeared in c1, c5, and c8 of DLBCL. Amazingly, the DLBCL-c1-enriched TCR clone found in TFH cells were also present in activated and resting Tregs (Figure 6E).
This clonal overlap suggests potential antigen-driven associations, reminiscent of GZMK+CD4+ T cell behavior in IgG-related diseases (35). However, despite the abundance of GZMK+TIA-1+ TFK and TFR/Treg cells in FL, TIA-1+ TFK cells were rarely detected in direct cell-cell contact with FOXP3+ Treg cells (Figures 6F-G). Meanwhile, interactions between Tregs and B cells seemed inevitable (Supplementary Figures S7A-F). Nevertheless, spatial proximity testing by imaging mass spectrometry found activated Treg/TFR cells to rather interact with other T cells and macrophages than the malignant B cells, while indeed the cytotoxic TFH cells are closer to the malignant B cells (32). These findings collectively indicate that while TFK cells are oligoclonal and share TCRs with TFH cells, their activity in lymphoma appears independent of direct Treg-mediated suppression.
SEB-activated TFK cells increase in number, upregulate granzymes and degranulate
To measure the cytotoxic potential within the CD4+CXCR5+PD-1+ TFH population, we employed the ‘cytokine-independent activation-induced marker’ (AIM) method, which identifies Ag-specific GC-TFH cells (15, 36). Here, SEB activates CD4+ T cells in an MHCII-restricted manner. Following four days of SEB stimulation, we observed a significant induction of CD107a surface expression in FL and DLBCL cultures, indicating recent degranulation of cytotoxic granules (37) (Figures 7A, B). SEB stimulation not only increased the frequency of TFH cells within CD4+FOXP3– Tconv cells, but also significantly expanded GZMK+TIA-1+ and GZMB+TIA-1+ TFK cells (Figure 7C). In FL, the percentage of GZMK+TIA-1+ and GZMB+TIA-1+ TFK cells within the CD4+CXCR5+PD-1+ TFH population was markedly increased. Interestingly, the dominance of GZMK over GZMB in FL-TFK cells was lifted upon SEB stimulation. To ensure a specific TFK phenotype, we examined the expression of CD49b and LAG3, which are uniquely co-expressed by CD4+ TR1 cells—a subset also capable of cytotoxicity (38). Only a minor percentage of TFK cells co-expressed CD49b and LAG3 (Figure 7D). In sum, GZMK+TIA-1+ and GZMB+TIA-1+ TFK cells can degranulate and release their cytotoxic cargo upon MHCII-restricted stimulation.
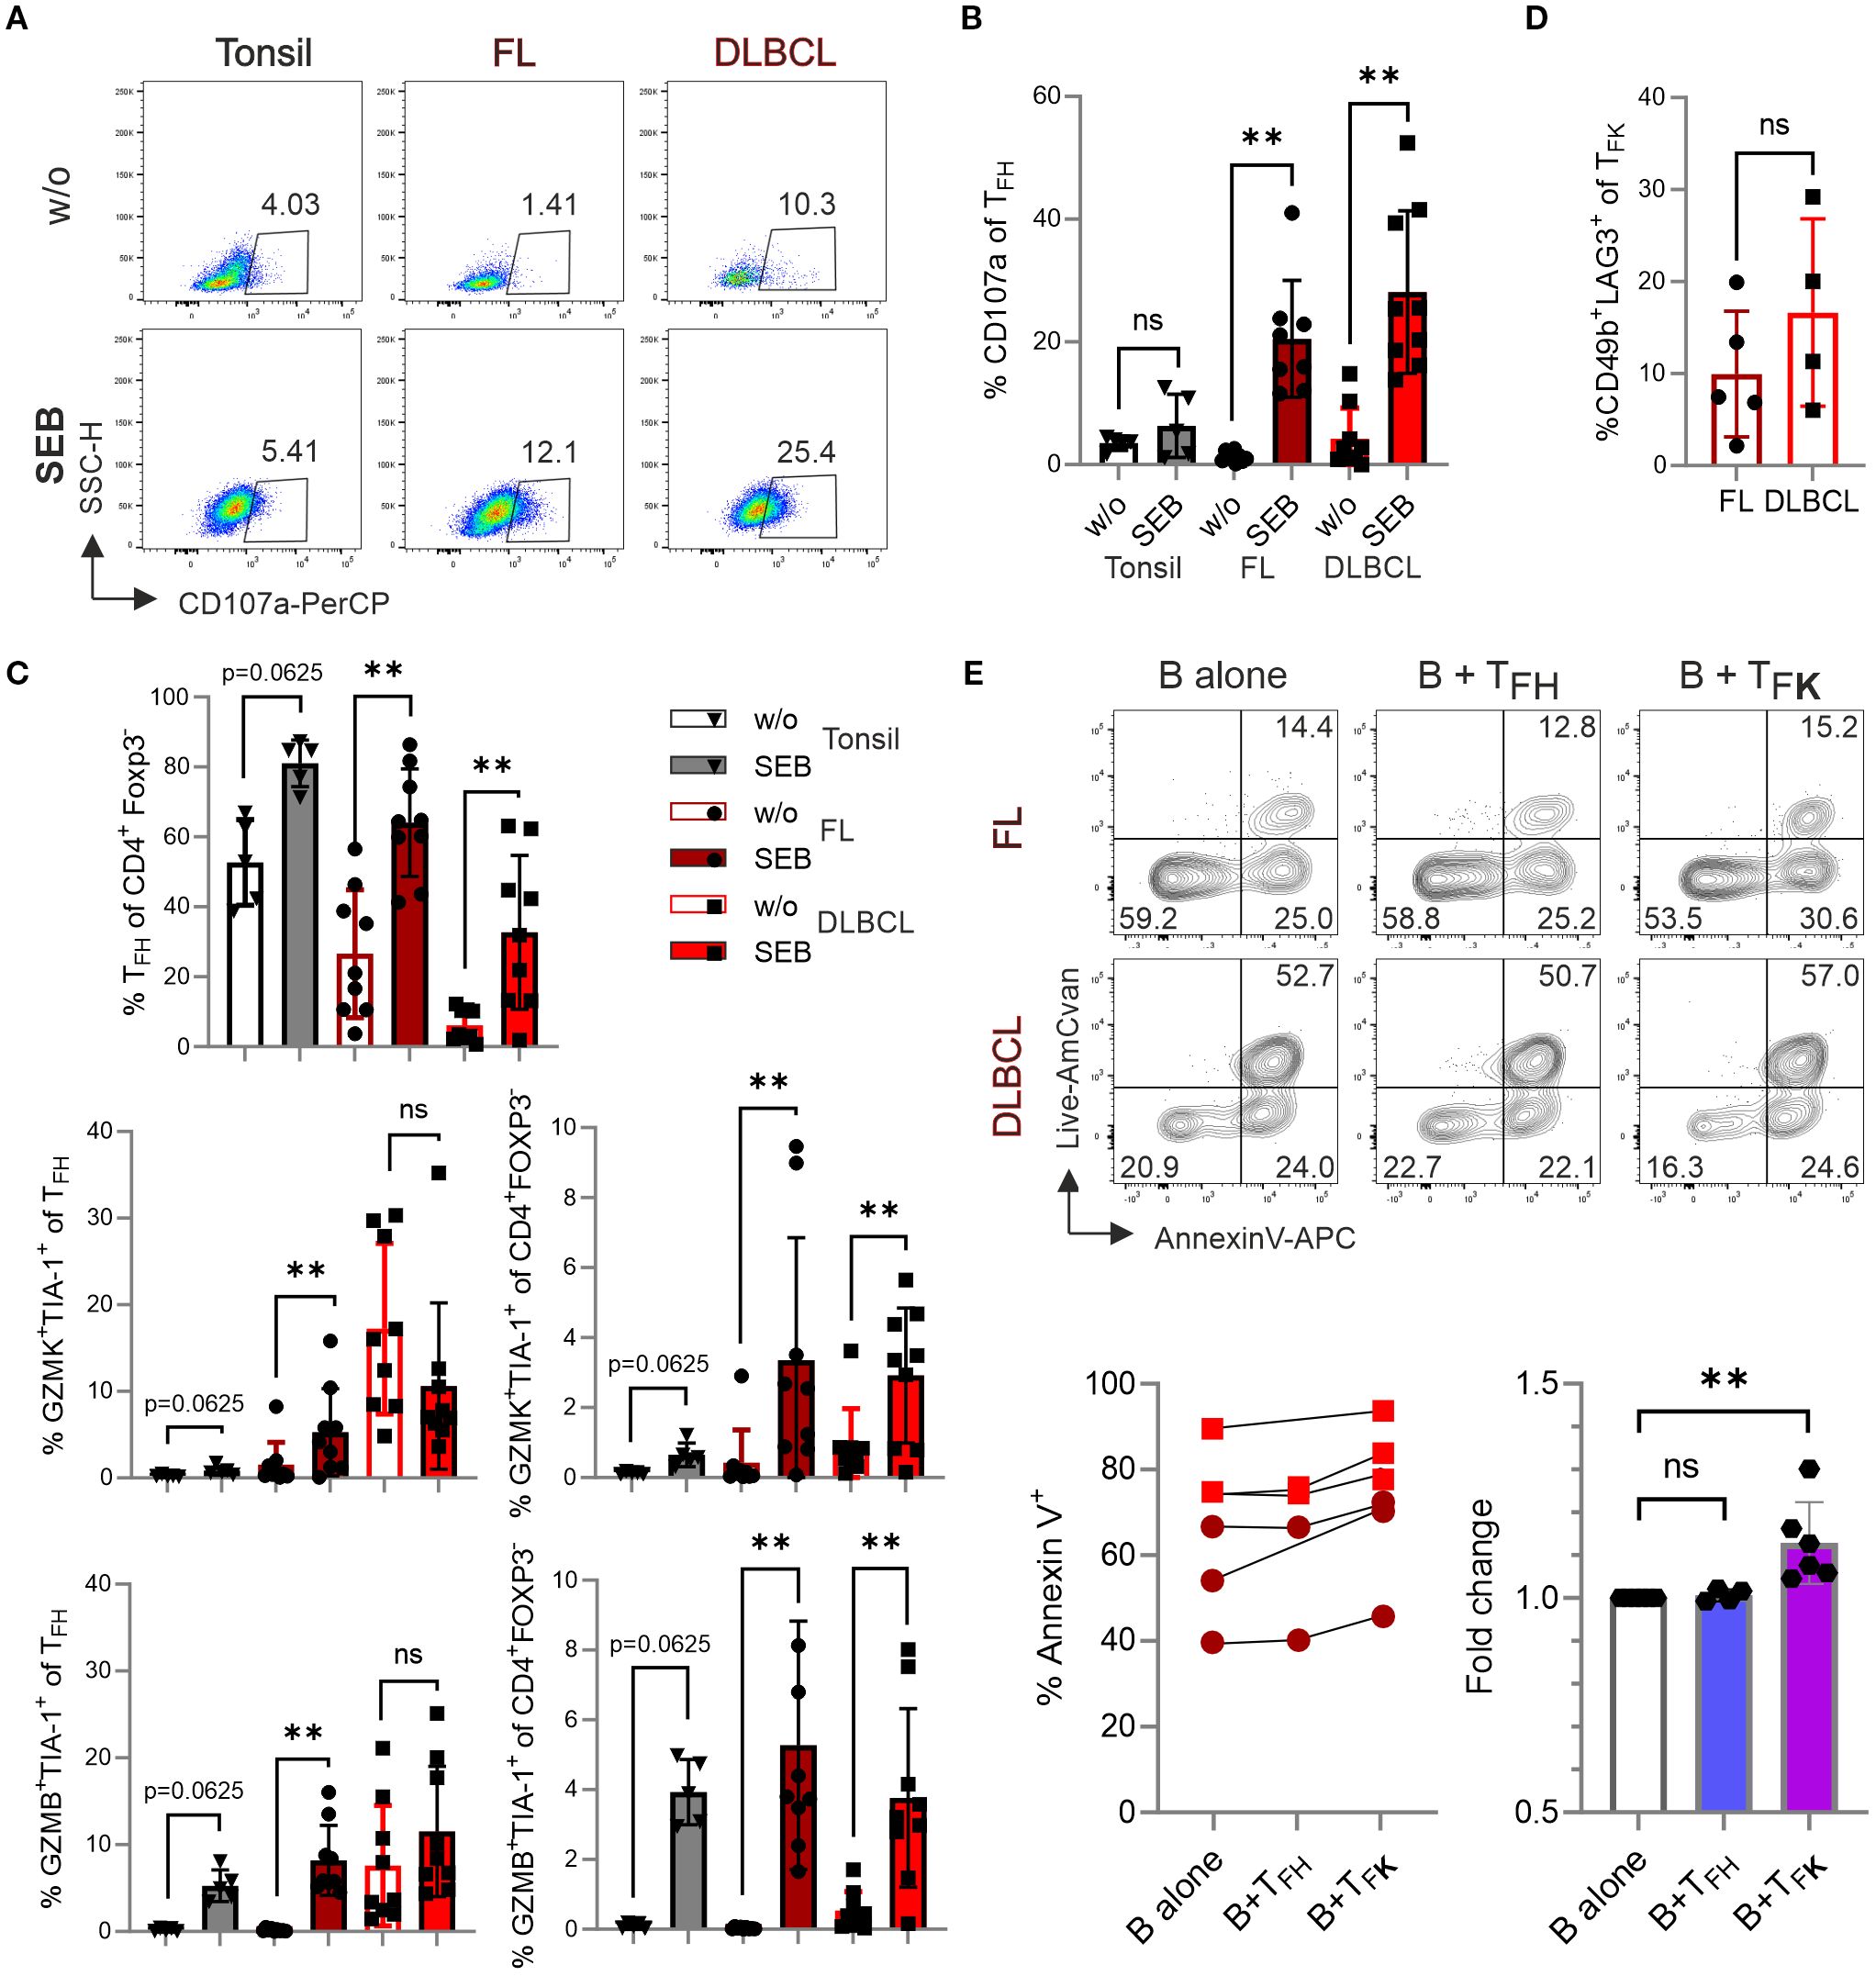
Figure 7. TFK cells exhibit cytotoxic activity against B cells. Cells from tonsil (n=5), FL (n=9), and DLBCL (n=9) were stimulated in the presence or absence of 1 μg/mL SEB for 4 days, and different T-cell populations were analyzed by flow cytometry. (A) Representative dot plots showing CD107a expression in TFH cells. (B) Frequency of CD107a expression in TFH cells. (C) Frequency of TFH cells, GZMK+TIA-1+ and GZMB+TIA-1+ cells within TFH cells and CD4+Foxp3- T cells. (D) Frequency of CD49b+LAG3+ TR1 cells within CXCR5+PD-1+GZMK+TIA-1+ TFK cells. (E, F) Representative contour plots (E) and frequency (F) of Annexin-V+ B cells after co-culture with sorted TFH (CXCR5+PD-1+CD25–TIA-1–) or TFK (CXCR5+PD-1+CD25–TIA-1+) cells for 14 hours. Wilcoxon signed-rank test. ns, non-significant, **p < 0.005.
Isolated TFK cells can kill lymphoma-derived B cells in vitro
To assess the cytotoxic potential of TFK cells, we performed a killing assay using FACS-sorted CD19+ B cells (predominantly malignant lymphoma cells) and co-cultured with either CD4+PD-1+CXCR5+TIA-1– TFH or CD4+PD-1+CXCR5+TIA-1+ TFK FACS-sorted from FL and DLBCL samples (Supplementary Figures S8A, B). While isolated GC-B cells (being mostly HLA-DR+; Supplementary Figure S8C) exhibit poor survival in vitro, the presence of TFK cells significantly increased the frequency of Annexin V+ B cells. This effect was not observed when B cells were co-cultured with TFH cells (Figure 7E). These findings suggest that TFK cells may exhibit direct cytotoxic activity against lymphoma cells in vivo.
Discussion
We found that GC-derived lymphomas contain a sizable number of PD-1+CXCR5+ TFK cells among the TFH cells and among the cytotoxic CD4+ T cells, respectively. In FL, they are mostly TIA-1/NKG7+GZMK+, whereases they are TIA-1+GZMK+ and/or GZMB+ in DLBCL. While B cell non-Hodgkin’s-lymphoma (NHLs) predominantly arise in aged individuals, and age-related T-cell changes—such as cytotoxic CD4+ T-cell accumulation, increased circulating TFH (cTFH) frequencies, and elevated pre-TFH formation in mice—have been documented (6, 39–41), these alterations do not fully recapitulate the disease-specific TFK cell expansion observed in lymphomas. Notably, aged reactive LN samples did not show increased TFK cells, supporting that their emergence is lymphoma-driven rather than age-dependent.
DLBCL exhibit a lower frequency of CD4+PD-1+CXCR5+ T cells but a higher proportion of TFK cells compared to tonsils and FL, with GZMB expression among CD4+ Tconv cells being a hallmark of DLBCL. Interestingly, transformation of FL to DLBCL has been associated with a shift from TFH and inflammatory responses to cytotoxic, exhausted phenotypes (42). This progression aligns with shared expression of CXCR5, TCF-1, and BCL6 by TFH and pre-exhausted CD8+ T cells, while terminally exhausted CD8+ T cells adopt a GZMB+CXCR5– profile (43). Collectively, these findings suggest a differentiation trajectory from TFH to GZMK+ TFK to GZMB+ TFK and finally GZMB+CXCR5–CD4+ T-cell phenotypes during lymphoma progression, reflecting the convergence of cytotoxic CD4+ and CD8+ T cells into exhausted T cells.
The resemblance of GZMB+ TFK to pre-exhausted CD8+ T cells does not necessarily imply dysfunction. The bias between either GZMK+ or GZMB+ cytotoxic CD4+ T cells has been observed in bladder cancer (44) and CD4+CXCL13+ TFH-like cells in endometrial cancer (45). Only CD4+CXCL13+GZMB+ TFH-like cells harbor neoantigen-specific TCR clonotypes and could be stimulated by neoantigens to further upregulate GZMB, similar to the increase in GZMB expression upon SEB stimulation in FL and DLBCL. Of note, TCR stimulation leads to activation of the nuclear factor of activated T-cells (NFAT), which binds to Gzmb but not to the other granzyme loci in briefly activated murine CD8+ T cells (46). The presence of shared TCR clonotypes among cytotoxic CD4+ T cells in both FL and DLBCL implies that recurrent antigen encounter and sustained TCR signaling drive TFK differentiation, potentially amplified by bystander activation through persistent pro-inflammatory cytokines. Crucially, mature TFK cells appear to possess functional TCRs, as evidenced by robust GZMB induction in FL-TFK cells, a notion supported by the proposed MHCII-dependent immune surveillance mediated by cytotoxic TFH-like cells in FL (26).
The TFK cells we found in relatively healthy humans dominantly express the tryptases GZMK and GZMA (15), while in FL they are predominantly GZMK+, a phenotype also observed in murine TFH cells provoked by either type-1 infections or immunization (47). There, granzymes mediate distinct cytotoxic mechanisms: GZMB provokes canonical apoptosis by activating the caspase cascade (48), consistent with the ability of isolated and activated TFK cells to kill lymphoma B cells by inducing apoptosis. In contrast, GZMA leads to activation and release of several proinflammatory cytokines such as IL-1-β as well as processing of gasdermin B, necessary for pyroptosis, altogether inducing an inflammatory form of cytotoxicity. Until recently, the other tryptase, GZMK, was thought to have a mostly overlapping function with GZMA. However, recent studies identify GZMK, but not GZMA, as a thoroughly complement-activating protease (49, 50). Accordingly, CD8+GZMK+ and CD4+GZMK+ T cells are enriched at sites of chronic inflammation in the context of autoimmune diseases and tumors likely contributing to chronicity, tumor immune escape, outgrowth and metastasis. Hence, an abundance of GZMA+GZMK+ cytotoxic CD4+ and CD8+ T cells was associated with poor survival of B-cell NHL patients (51). On the other hand, in antibody-rich sites like GC-derived lymphomas, immunocomplexes and antibody-dependent cell-mediated cytotoxicity may provide antitumor activity. At least in FL, the high frequency of FL-specific GZMK+ TFK cells correlates with indolence, suggesting a context-dependent protective role. Therapeutically, this aligns with the efficacy of curative antibodies such as anti-CD20, which rely on complement-mediated cytotoxicity (52, 53), highlighting the dual roles of granzyme-mediated pathways in lymphoma progression and treatment. The expression of NKG7/TIA-1 is critically linked to anti-tumor responses, particularly in CD8+ T cells (54, 55). In line with GZMK expression and chronic inflammation, NKG7 is upregulated in CD4+ TH1 and TR1 cells (56). In CD8+ T cells, NKG7 plays a key role in the exocytosis of cytotoxic molecules. We propose that NKG7 exerts the same function in cytotoxic CD4+ T cells including TFK cells, leading to GZMK-mediated complement activation or GZMB-mediated activation-induced cell death of target – possibly lymphoma – cells.
In IgG-related disease an abundant number of GZMK+ cytotoxic TFH cells are clustered with TFR cells, which likely suppress these TFK cells (35). Similarly, the CD4+ T cells being capable of killing autologous human bladder cancer cells, are subject to inhibition by Tregs (44). In FL and DLBCL a high number of Tregs – including TFR cells – are present as well. We detected some but by far not all TFK cells in direct cell-cell contact with FOXP3+ Tregs. It is even possible that the distance to TFR/Treg cells warrants IL-2+ microdomains supporting BLIMP-1-dependent gain of cytotoxicity and GZMB expression (19). It may be worthwhile to explore whether a tumor-specific Treg approach (32) or specific measures to enhance GC-B lymphoma cell killing by TFK cells are applicable. One next step will be to clone the TCRs from the expanded TFK clones and determine their antigen specificity, i.e. whether they are engaged by lymphoma-derived peptides or whether CXCR5+ TFK cells, which naturally home to the atypical follicles, should be equipped with a lymphoma-recognizing CAR.
Data availability statement
The datasets presented in this study can be found in online repositories. The names of the repository/repositories and accession number(s) can be found in the article/Supplementary Material.
Ethics statement
The studies involving humans were approved by Medizinische Ethikkommission an der Julius-Maximilians-Universität Würzburg. The studies were conducted in accordance with the local legislation and institutional requirements. The participants provided their written informed consent to participate in this study.
Author contributions
YX: Methodology, Investigation, Writing – review & editing, Data curation. SH: Data curation, Methodology, Writing – review & editing, Investigation. GJ: Methodology, Writing – review & editing, Formal Analysis, Data curation. JW: Methodology, Writing – review & editing, Investigation, Data curation. AR: Funding acquisition, Resources, Supervision, Writing – review & editing. FB-S: Validation, Project administration, Writing – review & editing, Funding acquisition, Data curation, Writing – original draft, Supervision, Investigation, Conceptualization.
Funding
The author(s) declare financial support was received for the research and/or publication of this article. The authors’ research was supported by the Deutsche Forschungsgemeinschaft (DFG, German Research Foundation), project number 324392634 -TRR 221, B01 (FB-S), and Z01 (AR). Additional funding was received from the DFG/FOR 2830 (FB-S), DFG/BE2309/8-2 (FB-S), and the German Cancer Aid/70114946 (FB-S).
Acknowledgments
We are indebted to Rémi Doucet-Ladevèze, Würzburg Institute of Systems Immunology, for cell sorting. We thank members of the Institute of Pathology, Würzburg, for collecting, characterizing and providing FL, DLBCL, and LN samples and PD Dr. Pascal Ickrath, Clinic and Polyclinic for Ear, Nose and Throat Medicine, Head and Neck Surgery, University Hospital Würzburg, for providing tonsils from patients undergoing tonsillectomy. All have given permission for their names and affiliations to be included.
Conflict of interest
The authors declare that the research was conducted in the absence of any commercial or financial relationships that could be construed as a potential conflict of interest.
Generative AI statement
The author(s) declare that no Generative AI was used in the creation of this manuscript.
Any alternative text (alt text) provided alongside figures in this article has been generated by Frontiers with the support of artificial intelligence and reasonable efforts have been made to ensure accuracy, including review by the authors wherever possible. If you identify any issues, please contact us.
Publisher’s note
All claims expressed in this article are solely those of the authors and do not necessarily represent those of their affiliated organizations, or those of the publisher, the editors and the reviewers. Any product that may be evaluated in this article, or claim that may be made by its manufacturer, is not guaranteed or endorsed by the publisher.
Supplementary material
The Supplementary Material for this article can be found online at: https://www.frontiersin.org/articles/10.3389/fimmu.2025.1657046/full#supplementary-material
References
1. Brown DM. Cytolytic CD4 cells: Direct mediators in infectious disease and Malignancy. Cell Immunol. (2010) 262:89–95. doi: 10.1016/j.cellimm.2010.02.008
2. Mucida D, Husain MM, Muroi S, van Wijk F, Shinnakasu R, Naoe Y, et al. Transcriptional reprogramming of mature CD4(+) helper T cells generates distinct MHC class II-restricted cytotoxic T lymphocytes. Nat Immunol. (2013) 14:281–9. doi: 10.1038/ni.2523
3. Marshall NB and Swain SL. Cytotoxic CD4 T cells in antiviral immunity. J BioMed Biotechnol. (2011) 2011:954602. doi: 10.1155/2011/954602
4. Weiskopf D, Bangs DJ, Sidney J, Kolla RV, De Silva AD, de Silva AM, et al. Dengue virus infection elicits highly polarized CX3CR1+ cytotoxic CD4+ T cells associated with protective immunity. Proc Natl Acad Sci U S A. (2015) 112:E4256–63. doi: 10.1073/pnas.1505956112
5. Casazza JP, Betts MR, Price DA, Precopio ML, Ruff LE, Brenchley JM, et al. Acquisition of direct antiviral effector functions by CMV-specific CD4+ T lymphocytes with cellular maturation. J Exp Med. (2006) 203:2865–77. doi: 10.1084/jem.20052246
6. Hashimoto K, Kouno T, Ikawa T, Hayatsu N, Miyajima Y, Yabukami H, et al. Single-cell transcriptomics reveals expansion of cytotoxic CD4 T cells in supercentenarians. Proc Natl Acad Sci U S A. (2019) 116:24242–51. doi: 10.1073/pnas.1907883116
7. Raveney BJE, Sato W, Takewaki D, Zhang C, Kanazawa T, Lin Y, et al. Involvement of cytotoxic Eomes-expressing CD4(+) T cells in secondary progressive multiple sclerosis. Proc Natl Acad Sci U S A. (2021) 118. doi: 10.1073/pnas.2021818118
8. Xie Y, Akpinarli A, Maris C, Hipkiss EL, Lane M, Kwon EK, et al. Naive tumor-specific CD4(+) T cells differentiated in vivo eradicate established melanoma. J Exp Med. (2010) 207:651–67. doi: 10.1084/jem.20091921
9. Quezada SA, Simpson TR, Peggs KS, Merghoub T, Vider J, Fan X, et al. Tumor-reactive CD4(+) T cells develop cytotoxic activity and eradicate large established melanoma after transfer into lymphopenic hosts. J Exp Med. (2010) 207:637–50. doi: 10.1084/jem.20091918
10. Speiser DE, Chijioke O, Schaeuble K, and Munz C. CD4(+) T cells in cancer. Nat Cancer. (2023) 4:317–29. doi: 10.1038/s43018-023-00521-2
11. Takeuchi A and Saito T. CD4 CTL, a cytotoxic subset of CD4(+) T cells, their differentiation and function. Front Immunol. (2017) 8:194. doi: 10.3389/fimmu.2017.00194
12. Haabeth OA, Tveita A, Fauskanger M, Hennig K, Hofgaard PO, and Bogen B. Idiotype-specific CD4(+) T cells eradicate disseminated myeloma. Leukemia. (2016) 30:1216–20. doi: 10.1038/leu.2015.278
13. Hirschhorn-Cymerman D, Budhu S, Kitano S, Liu C, Zhao F, Zhong H, et al. Induction of tumoricidal function in CD4+ T cells is associated with concomitant memory and terminally differentiated phenotype. J Exp Med. (2012) 209:2113–26. doi: 10.1084/jem.20120532
14. Cachot A, Bilous M, Liu YC, Li X, Saillard M, Cenerenti M, et al. Tumor-specific cytolytic CD4 T cells mediate immunity against human cancer. Sci Adv. (2021) 7. doi: 10.1126/sciadv.abe3348
15. Liang C, Spoerl S, Xiao Y, Habenicht KM, Haeusl SS, Sandner I, et al. Oligoclonal CD4(+)CXCR5(+) T cells with a cytotoxic phenotype appear in tonsils and blood. Commun Biol. (2024) 7:879. doi: 10.1038/s42003-024-06563-1
16. Crotty S. Follicular helper CD4 T cells (TFH). Annu Rev Immunol. (2011) 29:621–63. doi: 10.1146/annurev-immunol-031210-101400
17. Vinuesa CG, Linterman MA, Yu D, and MacLennan IC. Follicular helper T cells. Annu Rev Immunol. (2016) 34:335–68. doi: 10.1146/annurev-immunol-041015-055605
18. Qui HZ, Hagymasi AT, Bandyopadhyay S, St Rose MC, Ramanarasimhaiah R, Menoret A, et al. CD134 plus CD137 dual costimulation induces Eomesodermin in CD4 T cells to program cytotoxic Th1 differentiation. J Immunol. (2011) 187:3555–64. doi: 10.4049/jimmunol.1101244
19. Sledzinska A, Vila de Mucha M, Bergerhoff K, Hotblack A, Demane DF, Ghorani E, et al. Regulatory T cells restrain interleukin-2- and blimp-1-dependent acquisition of cytotoxic function by CD4(+) T cells. Immunity. (2020) 52:151–66:e6. doi: 10.1016/j.immuni.2019.12.007
20. Johnston RJ, Poholek AC, DiToro D, Yusuf I, Eto D, Barnett B, et al. Bcl6 and Blimp-1 are reciprocal and antagonistic regulators of T follicular helper cell differentiation. Science. (2009) 325:1006–10. doi: 10.1126/science.1175870
21. Shi Y, Kuai Y, Lei L, Weng Y, Berberich-Siebelt F, Zhang X, et al. The feedback loop of LITAF and BCL6 is involved in regulating apoptosis in B cell non-Hodgkin’s-lymphoma. Oncotarget. (2016) 7:77444–56. doi: 10.18632/oncotarget.12680
22. Koenig A, Vaeth M, Xiao Y, Chiarolla CM, Erapaneedi R, Klein M, et al. NFATc1/alphaA and blimp-1 support the follicular and effector phenotype of tregs. Front Immunol. (2021) 12:791100. doi: 10.3389/fimmu.2021.791100
23. Swerdlow SH, Campo E, Pileri SA, Harris NL, Stein H, Siebert R, et al. The 2016 revision of the World Health Organization classification of lymphoid neoplasms. Blood. (2016) 127:2375–90. doi: 10.1182/blood-2016-01-643569
24. Carbone A, Roulland S, Gloghini A, Younes A, von Keudell G, Lopez-Guillermo A, et al. Follicular lymphoma. Nat Rev Dis Primers. (2019) 5:83. doi: 10.1038/s41572-019-0132-x
25. Mlynarczyk C, Fontan L, and Melnick A. Germinal center-derived lymphomas: The darkest side of humoral immunity. Immunol Rev. (2019) 288:214–39. doi: 10.1111/imr.12755
26. Han G, Deng Q, Marques-Piubelli ML, Dai E, Dang M, Ma MCJ, et al. Follicular lymphoma microenvironment characteristics associated with tumor cell mutations and MHC class II expression. Blood Cancer Discov. (2022) 3:428–43. doi: 10.1158/2643-3230.BCD-21-0075
27. Laurent C, Dietrich S, and Tarte K. Cell cross talk within the lymphoma tumor microenvironment: follicular lymphoma as a paradigm. Blood. (2024) 143:1080–90. doi: 10.1182/blood.2023021000
28. Alizadeh AA, Eisen MB, Davis RE, Ma C, Lossos IS, Rosenwald A, et al. Distinct types of diffuse large B-cell lymphoma identified by gene expression profiling. Nature. (2000) 403:503–11. doi: 10.1038/35000501
29. Rosenwald A, Wright G, Chan WC, Connors JM, Campo E, Fisher RI, et al. The use of molecular profiling to predict survival after chemotherapy for diffuse large-B-cell lymphoma. N Engl J Med. (2002) 346:1937–47. doi: 10.1056/NEJMoa012914
30. Sehn LH and Salles G. Diffuse large B-cell lymphoma. N Engl J Med. (2021) 384:842–58. doi: 10.1056/NEJMra2027612
31. Victora GD, Dominguez-Sola D, Holmes AB, Deroubaix S, Dalla-Favera R, and Nussenzweig MC. Identification of human germinal center light and dark zone cells and their relationship to human B-cell lymphomas. Blood. (2012) 120:2240–8. doi: 10.1182/blood-2012-03-415380
32. Spasevska I, Sharma A, Steen CB, Josefsson SE, Blaker YN, Kolstad A, et al. Diversity of intratumoral regulatory T cells in B-cell non-Hodgkin lymphoma. Blood Adv. (2023) 7:7216–30. doi: 10.1182/bloodadvances.2023010158
33. Barbosa CD, Canto FB, Gomes A, Brandao LM, Lima JR, Melo GA, et al. Cytotoxic CD4(+) T cells driven by T-cell intrinsic IL-18R/MyD88 signaling predominantly infiltrate Trypanosoma cruzi-infected hearts. Elife. (2022) 11. doi: 10.7554/eLife.74636
34. Medley QG, Kedersha N, O’Brien S, Tian Q, Schlossman SF, Streuli M, et al. Characterization of GMP-17, a granule membrane protein that moves to the plasma membrane of natural killer cells following target cell recognition. Proc Natl Acad Sci U S A. (1996) 93:685–9. doi: 10.1073/pnas.93.2.685
35. Aoyagi R, Maehara T, Koga R, Munemura R, Tomonaga T, Murakami Y, et al. Single-cell transcriptomics reveals granzyme K-expressing cytotoxic Tfh cells in tertiary lymphoid structures in IgG4-RD. J Allergy Clin Immunol. (2024) 153:513–20 e10. doi: 10.1016/j.jaci.2023.08.019
36. Dan JM, Lindestam Arlehamn CS, Weiskopf D, da Silva Antunes R, Havenar-Daughton C, Reiss SM, et al. A cytokine-independent approach to identify antigen-specific human germinal center T follicular helper cells and rare antigen-specific CD4+ T cells in blood. J Immunol. (2016) 197:983–93. doi: 10.4049/jimmunol.1600318
37. Betts MR, Brenchley JM, Price DA, De Rosa SC, Douek DC, Roederer M, et al. Sensitive and viable identification of antigen-specific CD8+ T cells by a flow cytometric assay for degranulation. J Immunol Methods. (2003) 281:65–78. doi: 10.1016/s0022-1759(03)00265-5
38. Freeborn RA, Strubbe S, and Roncarolo MG. Type 1 regulatory T cell-mediated tolerance in health and disease. Front Immunol. (2022) 13:1032575. doi: 10.3389/fimmu.2022.1032575
39. Hasegawa T, Oka T, Son HG, Oliver-Garcia VS, Azin M, Eisenhaure TM, et al. Cytotoxic CD4(+) T cells eliminate senescent cells by targeting cytomegalovirus antigen. Cell. (2023) 186:1417–31:e20. doi: 10.1016/j.cell.2023.02.033
40. Zhou M, Zou R, Gan H, Liang Z, Li F, Lin T, et al. The effect of aging on the frequency, phenotype and cytokine production of human blood CD4 + CXCR5 + T follicular helper cells: comparison of aged and young subjects. Immun Ageing. (2014) 11:12. doi: 10.1186/1742-4933-11-12
41. Webb LMC, Fra-Bido S, Innocentin S, Matheson LS, Attaf N, Bignon A, et al. Ageing promotes early T follicular helper cell differentiation by modulating expression of RBPJ. Aging Cell. (2021) 20:e13295. doi: 10.1111/acel.13295
42. Sarkozy C, Wu S, Takata K, Aoki T, Neriah SB, Milne K, et al. Integrated single cell analysis reveals co-evolution of Malignant B cells and tumor micro-environment in transformed follicular lymphoma. Cancer Cell. (2024) 42:1630. doi: 10.1016/j.ccell.2024.07.012
43. Kallies A, Zehn D, and Utzschneider DT. Precursor exhausted T cells: key to successful immunotherapy? Nat Rev Immunol. (2020) 20:128–36. doi: 10.1038/s41577-019-0223-7
44. Oh DY, Kwek SS, Raju SS, Li T, McCarthy E, Chow E, et al. Intratumoral CD4(+) T cells mediate anti-tumor cytotoxicity in human bladder cancer. Cell. (2020) 181:1612–25 e13. doi: 10.1016/j.cell.2020.05.017
45. Fusagawa M, Tokita S, Murata K, Mariya T, Umemoto M, Sugita S, et al. Identification and phenotypic characterization of neoantigen-specific cytotoxic CD4+ T cells in endometrial cancer. Cancer Immunol Res. (2025) 13:171–84. doi: 10.1158/2326-6066.CIR-24-0514
46. Klein-Hessling S, Muhammad K, Klein M, Pusch T, Rudolf R, Floter J, et al. NFATc1 controls the cytotoxicity of CD8+ T cells. Nat Commun. (2017) 8:511. doi: 10.1038/s41467-017-00612-6
47. Kumar S, Basto AP, Ribeiro F, Almeida SCP, Campos P, Peres C, et al. Specialized Tfh cell subsets driving type-1 and type-2 humoral responses in lymphoid tissue. Cell Discov. (2024) 10:64. doi: 10.1038/s41421-024-00681-0
48. Hay ZLZ and Slansky JE. Granzymes: the molecular executors of immune-mediated cytotoxicity. Int J Mol Sci. (2022) 23. doi: 10.3390/ijms23031833
49. Lan F, Li J, Miao W, Sun F, Duan S, Song Y, et al. GZMK-expressing CD8(+) T cells promote recurrent airway inflammatory diseases. Nature. (2025) 638(8050):490–98. doi: 10.1038/s41586-024-08395-9
50. Donado CA, Theisen E, Zhang F, Nathan A, Fairfield ML, Rupani KV, et al. Granzyme K activates the entire complement cascade. Nature. (2025). doi: 10.1038/s41586-025-08713-9
51. Roider T, Baertsch MA, Fitzgerald D, Vohringer H, Brinkmann BJ, Czernilofsky F, et al. Multimodal and spatially resolved profiling identifies distinct patterns of T cell infiltration in nodal B cell lymphoma entities. Nat Cell Biol. (2024) 26:478–89. doi: 10.1038/s41556-024-01358-2
52. Merle NS and Roumenina LT. The complement system as a target in cancer immunotherapy. Eur J Immunol. (2024) 54:e2350820. doi: 10.1002/eji.202350820
53. Reis ES, Mastellos DC, Ricklin D, Mantovani A, and Lambris JD. Complement in cancer: untangling an intricate relationship. Nat Rev Immunol. (2018) 18:5–18. doi: 10.1038/nri.2017.97
54. Li XY, Corvino D, Nowlan B, Aguilera AR, Ng SS, Braun M, et al. NKG7 is required for optimal antitumor T-cell immunity. Cancer Immunol Res. (2022) 10:154–61. doi: 10.1158/2326-6066.CIR-20-0649
55. Weng T, Wang J, Yang M, Zhang W, Wu P, You C, et al. Nanomaterials for the delivery of bioactive factors to enhance angiogenesis of dermal substitutes during wound healing. Burns Trauma. (2022) 10:tkab049. doi: 10.1093/burnst/tkab049
Keywords: follicular lymphoma, cytotoxic CD4+ T cells, diffuse large B-cell lymphoma, GZMK, GZMB, NKG-7, T-follicular helper cells
Citation: Xiao Y, Haeusl SS, Jethva G, Weber J, Rosenwald A and Berberich-Siebelt F (2025) Cytotoxic CD4+ T-follicular cells may mediate killing against lymphoma cells. Front. Immunol. 16:1657046. doi: 10.3389/fimmu.2025.1657046
Received: 30 June 2025; Accepted: 26 August 2025;
Published: 15 September 2025.
Edited by:
Joaquim Carreras, Tokai University, JapanReviewed by:
Michał Zarobkiewicz, Medical University Of Lublin, PolandXiufen Chen, University of Chicago Medical Center, United States
Copyright © 2025 Xiao, Haeusl, Jethva, Weber, Rosenwald and Berberich-Siebelt. This is an open-access article distributed under the terms of the Creative Commons Attribution License (CC BY). The use, distribution or reproduction in other forums is permitted, provided the original author(s) and the copyright owner(s) are credited and that the original publication in this journal is cited, in accordance with accepted academic practice. No use, distribution or reproduction is permitted which does not comply with these terms.
*Correspondence: Friederike Berberich-Siebelt, cGF0aDIzMEBtYWlsLnVuaS13dWVyemJ1cmcuZGU=
†Present address: Gaurav Jethva, Department of Biological and Chemical Engineering, Medical Biotechnology, Aarhus University, Aarhus, Denmark