 Guixin Wang1,2,3,4†
 Junming Cao1,2,3,4†
 Chenglu Lu5†Yu Cao6†Shuo Wang1,2,3,4Ziyi Chen7Zhaohui Chen1,2,3,4
 Yingxi Li8,9
 Yue Yu1,2,3,4*
 Yao Tian10,11*Xin Wang1,2,3,4*
- 1the First Department of Breast Cancer, Tianjin Medical University Cancer Institute and Hospital, National Clinical Research Center for Cancer, Tianjin, China
- 2Key Laboratory of Cancer Prevention and Therapy, Tianjin, China
- 3Tianjin’s Clinical Research Center for Cancer, Tianjin, China
- 4Key Laboratory of Breast Cancer Prevention and Therapy, Ministry of Education, Tianjin Medical University, Tianjin, China
- 5Department of Pathology, Tangshan People’s Hospital, Tangshan, Hebei, China
- 6Department of Urology, Affiliated Hospital of Zunyi Medical University, Zunyi, Guizhou, China
- 7Department of Thoracic Oncology, Tianjin Lung Cancer Center, Key Laboratory of Cancer Prevention and Therapy, Tianjin’s Clinical Research Center for Cancer, Tianjin Medical University Cancer Institute and Hospital, Tianjin Medical University, Tianjin, China
- 8Health Science Center, Ningbo University, Ningbo, Zhejiang, China
- 9Immunology Department, Key Laboratory of Immune Microenvironment and Disease (Ministry of Education), Tianjin Medical University, Tianjin, China
- 10Department of Thoracic Surgery, The Affiliated LiHuiLi Hospital of Ningbo University, Ningbo, Zhejiang, China
- 11Department of General Surgery, Tianjin Medical University General Hospital, Tianjin Key Laboratory of Precise Vascular Reconstruction and Organ Function Repair, Tianjin General Surgery Institute, Tianjin, China
Background: Tumor heterogeneity impacts invasive behaviors, treatment response, and clinical outcomes in triple-negative breast cancer (TNBC). However, this heterogeneity remains incompletely characterized. This study aims to utilize multi-scale data to investigate inter-tumoral heterogeneity and identify potential TNBC biomarkers.
Methods: Single-cell RNA expression profiles were analyzed using R packages. Specifically, the infercnv, Pyscenic, GeneNMF, SCP, Vector, CellChat, and hdWGCNA packages were employed to identify malignant cells and characterize heterogeneity in transcription factors, metaprograms, lineage evolution, developmental trajectories, cell–cell interactions, and co-expression networks. Bulk RNA datasets were incorporated to assess the prognostic value of cell clusters and candidate genes. G Protein Subunit Alpha 15 (GNA15) expression was determined via reverse transcription–quantitative PCR (RT–qPCR) and immunohistochemistry. Cell functional assays were performed to evaluate proliferation, migration, and invasion capabilities.
Results: A total of 14,335 malignant cells were isolated from epithelial cells across 15 single-cell RNA samples. Six tumor cell clusters were identified, which exhibited distinct prognoses, biological functions, driver transcription factors, and co-expression networks. Notably, the S2 cluster demonstrated association with multiple malignancy-related pathways and inferior survival outcomes. GNA15 emerged as the S2 cluster hub gene. In vitro experiments confirmed that GNA15 knockdown significantly attenuated proliferation, migration, and invasion in TNBC cell lines.
Conclusions: Our study comprehensively delineated TNBC tumor cell heterogeneity and established the critical role of GNA15 in TNBC progression. These findings enhance the understanding of TNBC heterogeneity and provide a theoretical foundation for TNBC treatment.
Introduction
Breast cancer has become the leading cause of cancer-associated disease in women worldwide for decades (1, 2). As a heterogeneous disease, its high heterogeneity contributes to differential treatment responses, recurrence patterns, and metastatic potential (3). With advances in precision medicine, biomarkers including estrogen receptor (ER), progesterone receptor (PR), Erb-B2 receptor tyrosine kinase 2 (HER2), and Ki-67 have guided molecular subtyping and therapeutic strategies, substantially improving clinical management (4, 5). However, triple-negative breast cancer (TNBC) lacks ER, PR, and HER2 expression, restricting treatment options primarily to chemotherapy (6). As the most heterogeneous subtype of breast cancer, TNBC demonstrates more aggressive biological behavior than other subtypes, resulting in poorer prognoses and earlier metastasis (7). Hence, characterizing the intra-tumoral heterogeneity and disease progression process of TNBC is crucial for improving the prognosis of TNBC patients.
The emergence of sequencing technology has accelerated the exploration of tumor heterogeneity (8). Jiang et al. (9) classified TNBC into four subtypes—mesenchymal-like, basal-like immune-suppressed, immunomodulatory, and luminal androgen receptor subtypes—using transcriptomic and genomic data. In addition, Lehmann et al. (10) used expression profiles to identify six distinct TNBC subtypes: one mesenchymal stem-like, one immunomodulatory, two basal-like subtypes, one mesenchymal, and one luminal androgen receptor subtype. These studies revealed TNBC heterogeneity at the tissue level, informing therapeutic approaches. However, tumor progression represents a continuous process wherein transcriptional characteristics vary among tumor cells within individual patients. Single-cell RNA sequencing (scRNA-seq) technology represents a powerful tool for resolving cellular heterogeneity in TNBC (11, 12). Numerous single-cell studies have characterized immune cell heterogeneity. For example, Savas et al. (13) employed scRNA-seq to explore the role of CD8 tissue-resistant T cells and confirmed their favorable role and clinical benefit for early-stage TNBC. Zhang et al. (14) elucidated the important role of mast cells in TNBC immune checkpoint therapy via single-cell sequencing. However, the single-cell research of TNBC tumor cells mainly focuses on its cell subclonal heterogeneity and evolution (15). Translational research targeting tumor cell heterogeneity, including the identification of biomarkers and the development of clinical application tools, remains to be further explored. The combined analysis of different omics offers multi-scale perspectives for cancer research and enhances the value of clinical transformation.
In this study, we successfully isolated malignant cells from epithelial populations and classified six tumor clusters exhibiting distinct transcriptional profiles, metaprograms, and molecular functions. Importantly, the S2 tumor cluster demonstrated a more aggressive phenotype, correlating with poor prognosis. The pro-tumorigenic effect of the S2 cluster appears mediated by intrinsic lineage evolution and interactions with tumor-associated fibroblasts. Furthermore, we identified G Protein Subunit Alpha 15 (GNA15) as the hub gene of the S2 cluster. In vitro experiments confirmed that GNA15 drives proliferation, migration, and invasion in TNBC cells. Collectively, this work systematically delineates tumor cell heterogeneity across transcription factors, lineage evolution, and co-expression regulatory networks at single-cell resolution and provides the first documentation of the pro-tumorigenic role of GNA15 in TNBC. Our findings advance the understanding of TNBC intra-tumoral heterogeneity and propose a novel therapeutic target for TNBC treatment.
Methods
Data acquisition and sample selection
This study incorporated four public datasets: three scRNA-seq cohorts and one bulk RNA sequencing cohort. Fifteen TNBC scRNA-seq profiles were sourced from the Gene Expression Omnibus (GEO) database (GSE176078, GSE199515, and GSE180286), and the remaining profiles diagnosed with other molecular subtypes were excluded. Bulk RNA-seq profiles and corresponding clinical information were obtained from The Cancer Genome Atlas (TCGA) using the “TCGAbiolinks” (16) package. Gene expression matrices were converted to transcripts per million (TPM) format to normalize for gene length and sequencing depth. TNBC sample inclusion criteria were as follows: 1) availability of both expression profiles and complete survival data and 2) TNBC confirmation via immunohistochemical staining. The final cohort comprised 121 TNBC samples and 113 normal breast tissue samples. Additionally, a total of 319 TNBC samples (the METABRIC cohort) with expression profiles were downloaded from the cBioPortal database (https://www.cbioportal.org/).
Data preprocessing of scRNA-seq
A total of 15 scRNA-seq samples were downloaded (Supplementary File: Supplementary Table S1), and strict quality control standards were adopted to incorporate high-quality single cells for subsequent analysis using the “Seurat” (17) package (v4.3.0, v5.2.1). The single-cell matrix expression profile was standardized using the glmGamPoi algorithm. The specific inclusion criteria were as follows: 1) nFeatures_RNA > 200, 2) nCount_RNA > 500, 3) the proportion of mitochondrial genes < 20%, and 4) the proportion of hemoglobin genes < 1%. As potential doublets inevitably exist in single-cell sequencing, the “Doubletfinder” (18) package (v0.2.3) was utilized to remove doublets with the doublet ratio set as 0.8%. The batch effect among samples was removed using the “Harmony” (19) package, and the number of cell clusters at distinct resolutions was identified using the Louvain algorithm with the assistance of the “Clustree” package (v0.5.0) when needed. The similarity of the expression profiles of cells was visualized using a non-linear dimensionality reduction algorithm [Uniform Manifold Approximation and Projection (UMAP)]. After the single-cell standard quality control process, the distinct cell clusters were annotated based on public research and the CellMarker database (20, 21).
Copy number variation analysis
A copy number variation (CNV) analysis was performed to identify malignant cells from total epithelial cells. Specifically, the myeloid cells were extracted as reference cells for benign cells, while all the epithelial cells were used as observed cells. The “AnnoProbe” package was used to annotate the start and end positions of genes. The CNV score was calculated using the “infercnv” (https://github.com/broadinstitute/inferCNV) package (v1.14.2). Then, the top 50% observed cells of the CNV score were selected to calculate the correlation between them and the observed and reference cells (22). Ultimately, malignant cells were defined as CNV score > 0.001 and CNV correlation > 0.5.
Non-negative matrix factorization analysis
Non-negative matrix factorization is an unsupervised learning method widely used in the decomposition of complex data (23). The “GeneNMF” (https://github.com/carmonalab/GeneNMF) package (v0.4.0) was utilized to identify the metaprogram of tumor cells. The top 1,000 highly variable genes were identified using the “FindVariableFeatures” function. The K-value was set as 4 to 9. When the number of programs was set as 6, the metaprograms (MPs) were stable. The represented genes of distinct MPs were subjected to an enrichment analysis using the “fgsea” package. The signature scores of MPs were calculated using the “Ucell” (24) package.
Transcription factor analysis
The gene matrix of tumor cells was transformed into loom format. A transcription factor analysis was performed using pySCENIC (v0.12.1). “motifs-v10nr_clust-nr.hgnc-m0.001-o0.0.tbl” was used as motif annotation. “hg38_10kbp_up_10kbp_down_full_tx_v10_clust. genes_vs_motifs.rankings.feather” was used as an input file to infer the correlation strength between each gene and known motif. The “SCENIC” package was used to visualize the output results.
Pseudo-time and enrichment analysis
The “Vector” (25) package was utilized to infer the cell developmental origin. Then, the pseudo-time cell trajectory was analyzed using the slingshot method, which is an unsupervised algorithm. An enrichment analysis of each tumor cluster was performed using the “ClusterGVis” (https://github.com/junjunlab/ClusterGVis) package (v0.1.2). To be specific, the top marker genes were identified as log2FC > 0.25 and min.pct > 0.25. The biological and molecular functions of each cluster were investigated based on the gene sets collected by the Gene Ontology (GO) and Kyoto Encyclopedia of Genes and Genomes (KEGG) databases.
In silico cell cytometry and survival analysis
To infer the abundance of tumor clusters in TCGA-BRCA cohort, the single-cell RNA matrix of tumor clusters was extracted, non-repetitive random sampling was adopted, and 400 cells were selected from each cell cluster as the reference matrix. The TNBC samples obtained from TCGA cohort and the METABRIC cohort were used to infer the matrix. The absolute mode was selected. CIBERSOFTX (26) was used to calculate cell abundance. The analysis of the options was set to the default parameters. After the intersection of the cell abundance score file and survival information, the “survminer” package was used to determine the optimal cut-off value of distinct cell abundance. Log-rank test was used to evaluate the statistics of the overall survival outcome. p < 0.05 was considered statistically significant.
High-dimensional weight co-expression network and cell–cell communication analyses
The “hdWGCNA” (27) package (v0.2.18) was used to construct the weighted gene co-expression network analysis (WGCNA) for tumor clusters. The genes expressed in at least 5% cells were included. The metacells were constructed to reduce the sparsity of the single-cell expression matrix. The soft threshold was set as 9, and 19 modules were identified. Additionally, the cell–cell communication among cell types was investigated using the “CellChat” (28) package (v1.6.1). The receptor–ligand pairs were collected using “CellChatDB.human”. Data preprocessing involves identifying highly expressed genes and highly expressed receptor–ligand pairs.
Bulk RNA sequencing and online database analysis
Normal breast (N=113, TCGA cohort) and TNBC tissues (N=121, TCGA cohort) were downloaded, and a differentially expressed gene analysis was performed using the “limma” (29) package (v3.54.2). The genes with p < 0.05 and logFC > 0.5 were considered overexpressed. Also, a survival analysis was performed based on the optimal value of each gene using the “survminer” package (v0.4.9). Gene set enrichment analysis (GSEA) of GNA15 was performed using the “clusterProfiler” (30) package (v4.6.2). Concretely, the samples were divided into high and low groups based on the median value of gene expression. Differentially expressed gene results between the high and low GNA15 groups were used as an input file for GSEA. The expression level of GNA15 in distinct molecular subtypes of breast cancer was evaluated using the “UALCAN” database (31). In silico drug screening was performed using the Connectivity Map (https://clue.io/).
Breast cancer specimens
The specimens of triple-negative breast cancer confirmed by pathology were obtained from Tianjin Medical University Cancer Institute and Hospital. The study was approved by the Ethics Committee of Tianjin Medical University Cancer Institute and Hospital (Ek2021021), and written informed consent was obtained from the participants.
Cell culture and transfection
Breast cancer cell lines MCF-7, T47D, MDA-MB-231, and Cal-51 were obtained from American Type Culture Collection (ATCC; Manassas, VA, USA). MCF-7 and MDA-MB-231 were cultured in dulbecco’s Modified Eagle Medium (DMEM) (Gibco, Grand Island, NY, USA), while T47D and Cal-51 were cultured in 1640 (Gibco, Grand Island, NY,USA). All media included 10% fetal bovine serum (FBS; Vazyme, Nanjing, China) and 1% penicillin/streptomycin (Gibco, USA). The cells were maintained at 37°C in a humidified 5% CO2 atmosphere in a cell incubator. SiRNAs targeting GNA15 constructs were synthesized by GentleGen (Suzhou, China), and the oligonucleotide sequences are listed in Supplementary File: Supplementary Table S2.
Cell function assays
For the Cell Counting Kit-8 (CCK-8) assay, cells were seeded in 96-well plates at 2 × 10³ cells/well. On days 1–5, 100 µL of CCK-8 solution was added to each well and incubated in the dark for 1 hour. Absorbance was measured at 450 nm using a microplate reader (Bio-Rad Laboratories, Hercules, CA, USA). For colony formation assays, 5 × 10² cells/well were seeded in six-well plates and cultured until colonies formed. Colonies were fixed with 4% paraformaldehyde, stained with 1% crystal violet, imaged, and quantified. For the cell scratch assay, transfected cells were cultured in six-well plates for 24 hours to form confluent monolayers. A straight scratch was created in each well using a sterile pipette tip. Cells were maintained in serum-free medium to eliminate FBS influence on migration. Scratch images were captured at 0 and 24 hours under a light microscope (Olympus, Tokyo, Japan). The migration distance was quantified as the ratio of the distance at 24 hours to that at 0 hours and was statistically analyzed. For the Transwell invasion assay, Matrigel-coated inserts (BD Biosciences, San Jose, CA, USA) were used. Briefly, 5 × 10⁴ cells in serum-free medium were seeded into the upper chambers, with medium containing 20% FBS as a chemoattractant in the lower chambers. After 14–24 hours of incubation, invaded cells were fixed and stained using a commercial kit (Thermo Fisher Scientific, Waltham, MA, USA). Cells were counted under a light microscope (Olympus, Tokyo, Japan) at ×20 magnification.
Immunohistochemistry and antibodies
An immunohistochemistry (IHC) analysis was performed for GNA15 on TNBC tissue using a rabbit anti-GNA15 antibody (1:250, 12078-1-AP; Proteintech, Wuhan, China) with the EnVision two-step procedure (21). GNA15-positive samples were defined as those with brown staining in the cytoplasm. IHC scoring was assessed by two independent, experienced pathologists. GNA15 staining intensity was rated as follows: 0 (negative), 1 (weak yellow), 2 (moderate yellow), or 3 (strong brown). The percentage of positive cells was scored as follows: 0 (0%), 1 (1%–25%), 2 (26%–50%), 3 (51%–75%), or 4 (>75%). The final IHC score (range, 0–12) was calculated by multiplying the intensity score by the percentage score. Final scores between 1 and 3 of staining were considered low expression, while final scores between 4 and 8 were considered median expression. Final scores between 9 and 12 were considered high expression.
Reverse transcription–quantitative PCR analysis
Total RNA was isolated from tissues and cells using the SPARKeasy Cell/Bacterial RNA Kit (Sparkjade, Shandong, China) according to the manufacturer’s instructions. RNA quality and concentration were assessed using a NanoDrop 2000 spectrophotometer (Thermo Fisher Scientific, USA). For mRNA analysis, reverse transcription–quantitative PCR (RT–qPCR) was performed using the All-in-One First-Strand cDNA Synthesis SuperMix for qPCR (TransGen Biotech, Beijing, China). GNA15 and GAPDH primers were synthesized by GentleGen (Suzhou, China), and all specific sequences are listed in Supplementary File: Supplementary Table S3.
Statistical analysis
All bioinformatics analyses were performed using RStudio (v4.2.2 and v4.3.3), and the related statistics could be found in the corresponding section in the Methods section. For experimental assays, Student’s t-test was used for comparisons between two groups. Data were presented as mean ± standard deviation (SD), and p < 0.05 was considered significant.
Results
The characterization of tumor microenvironment landscape of TNBC
The overall design of the study is presented in Figure 1. To obtain high-quality single cells, the “DoubletFinder” package was employed to remove the doublets for each sample (Supplementary Figure S1). Subsequently, a large single-cell matrix was constructed by integrating samples, and the batch effect among samples was removed (Supplementary Figure S2). After preprocessing, a total of 54,867 cells with 29,259 features were obtained for further analysis. Twenty-four cell clusters were delineated. Using established markers, nine principal cell types were annotated: cycling cells, B cells, epithelial cells, endothelial cells, fibroblasts, T/NK cells, smooth muscle cells, plasma cells, and myeloid cells (Figure 2A). Cells lacking definitive markers were designated as undefined. UMAP visualization confirmed robust segregation of distinct cell types (Figure 2B). All markers utilized for annotation are cataloged in Figure 2C (e.g., B cells: CD19, CD79B, and MS4A1; epithelial cells: EPCAM, KRT18, and KRT19). As shown in Figure 2D, cell proportions of each sample were characterized, and the results showed that the tumor microenvironment of TNBC was highly heterogeneous among different samples. Collectively, a nine-cell-type framework was established for subsequent investigation, and pronounced inter-sample heterogeneity was observed in TNBC.
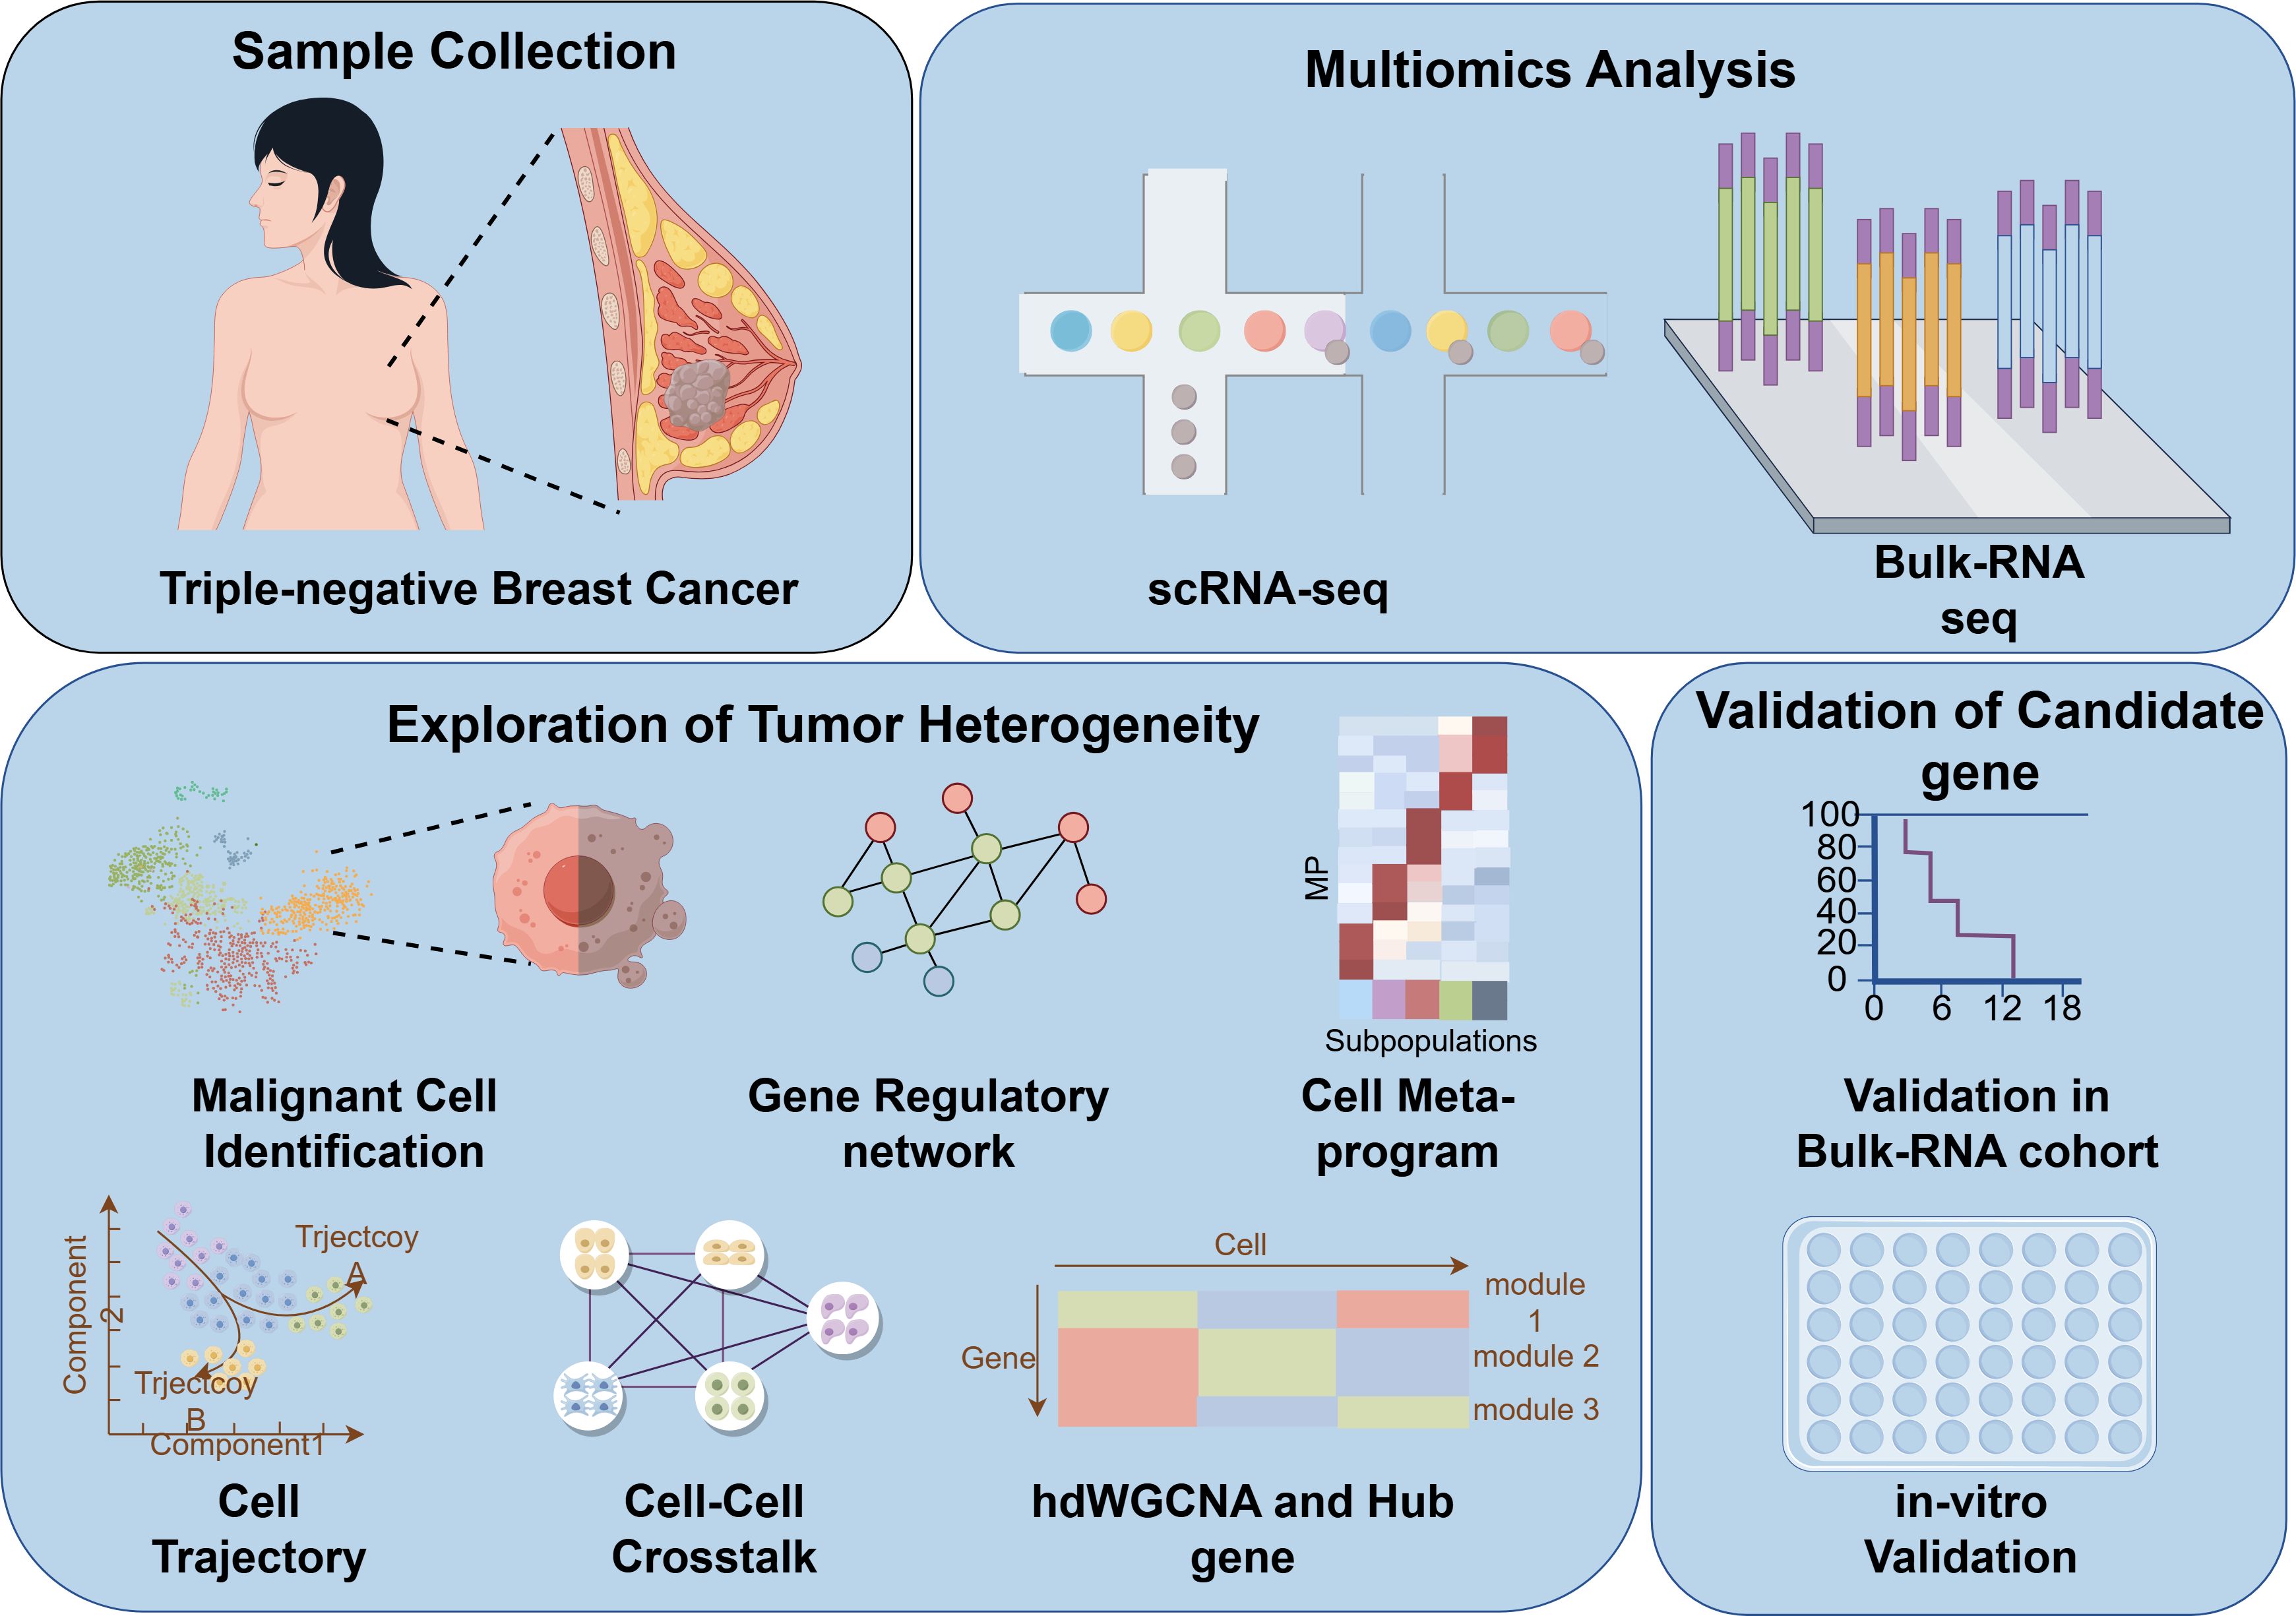
Figure 1. Flow chart of the study design. scRNA-seq, single-cell RNA sequencing; hdWGCNA, high-dimensional weighted gene co-expression network analysis.
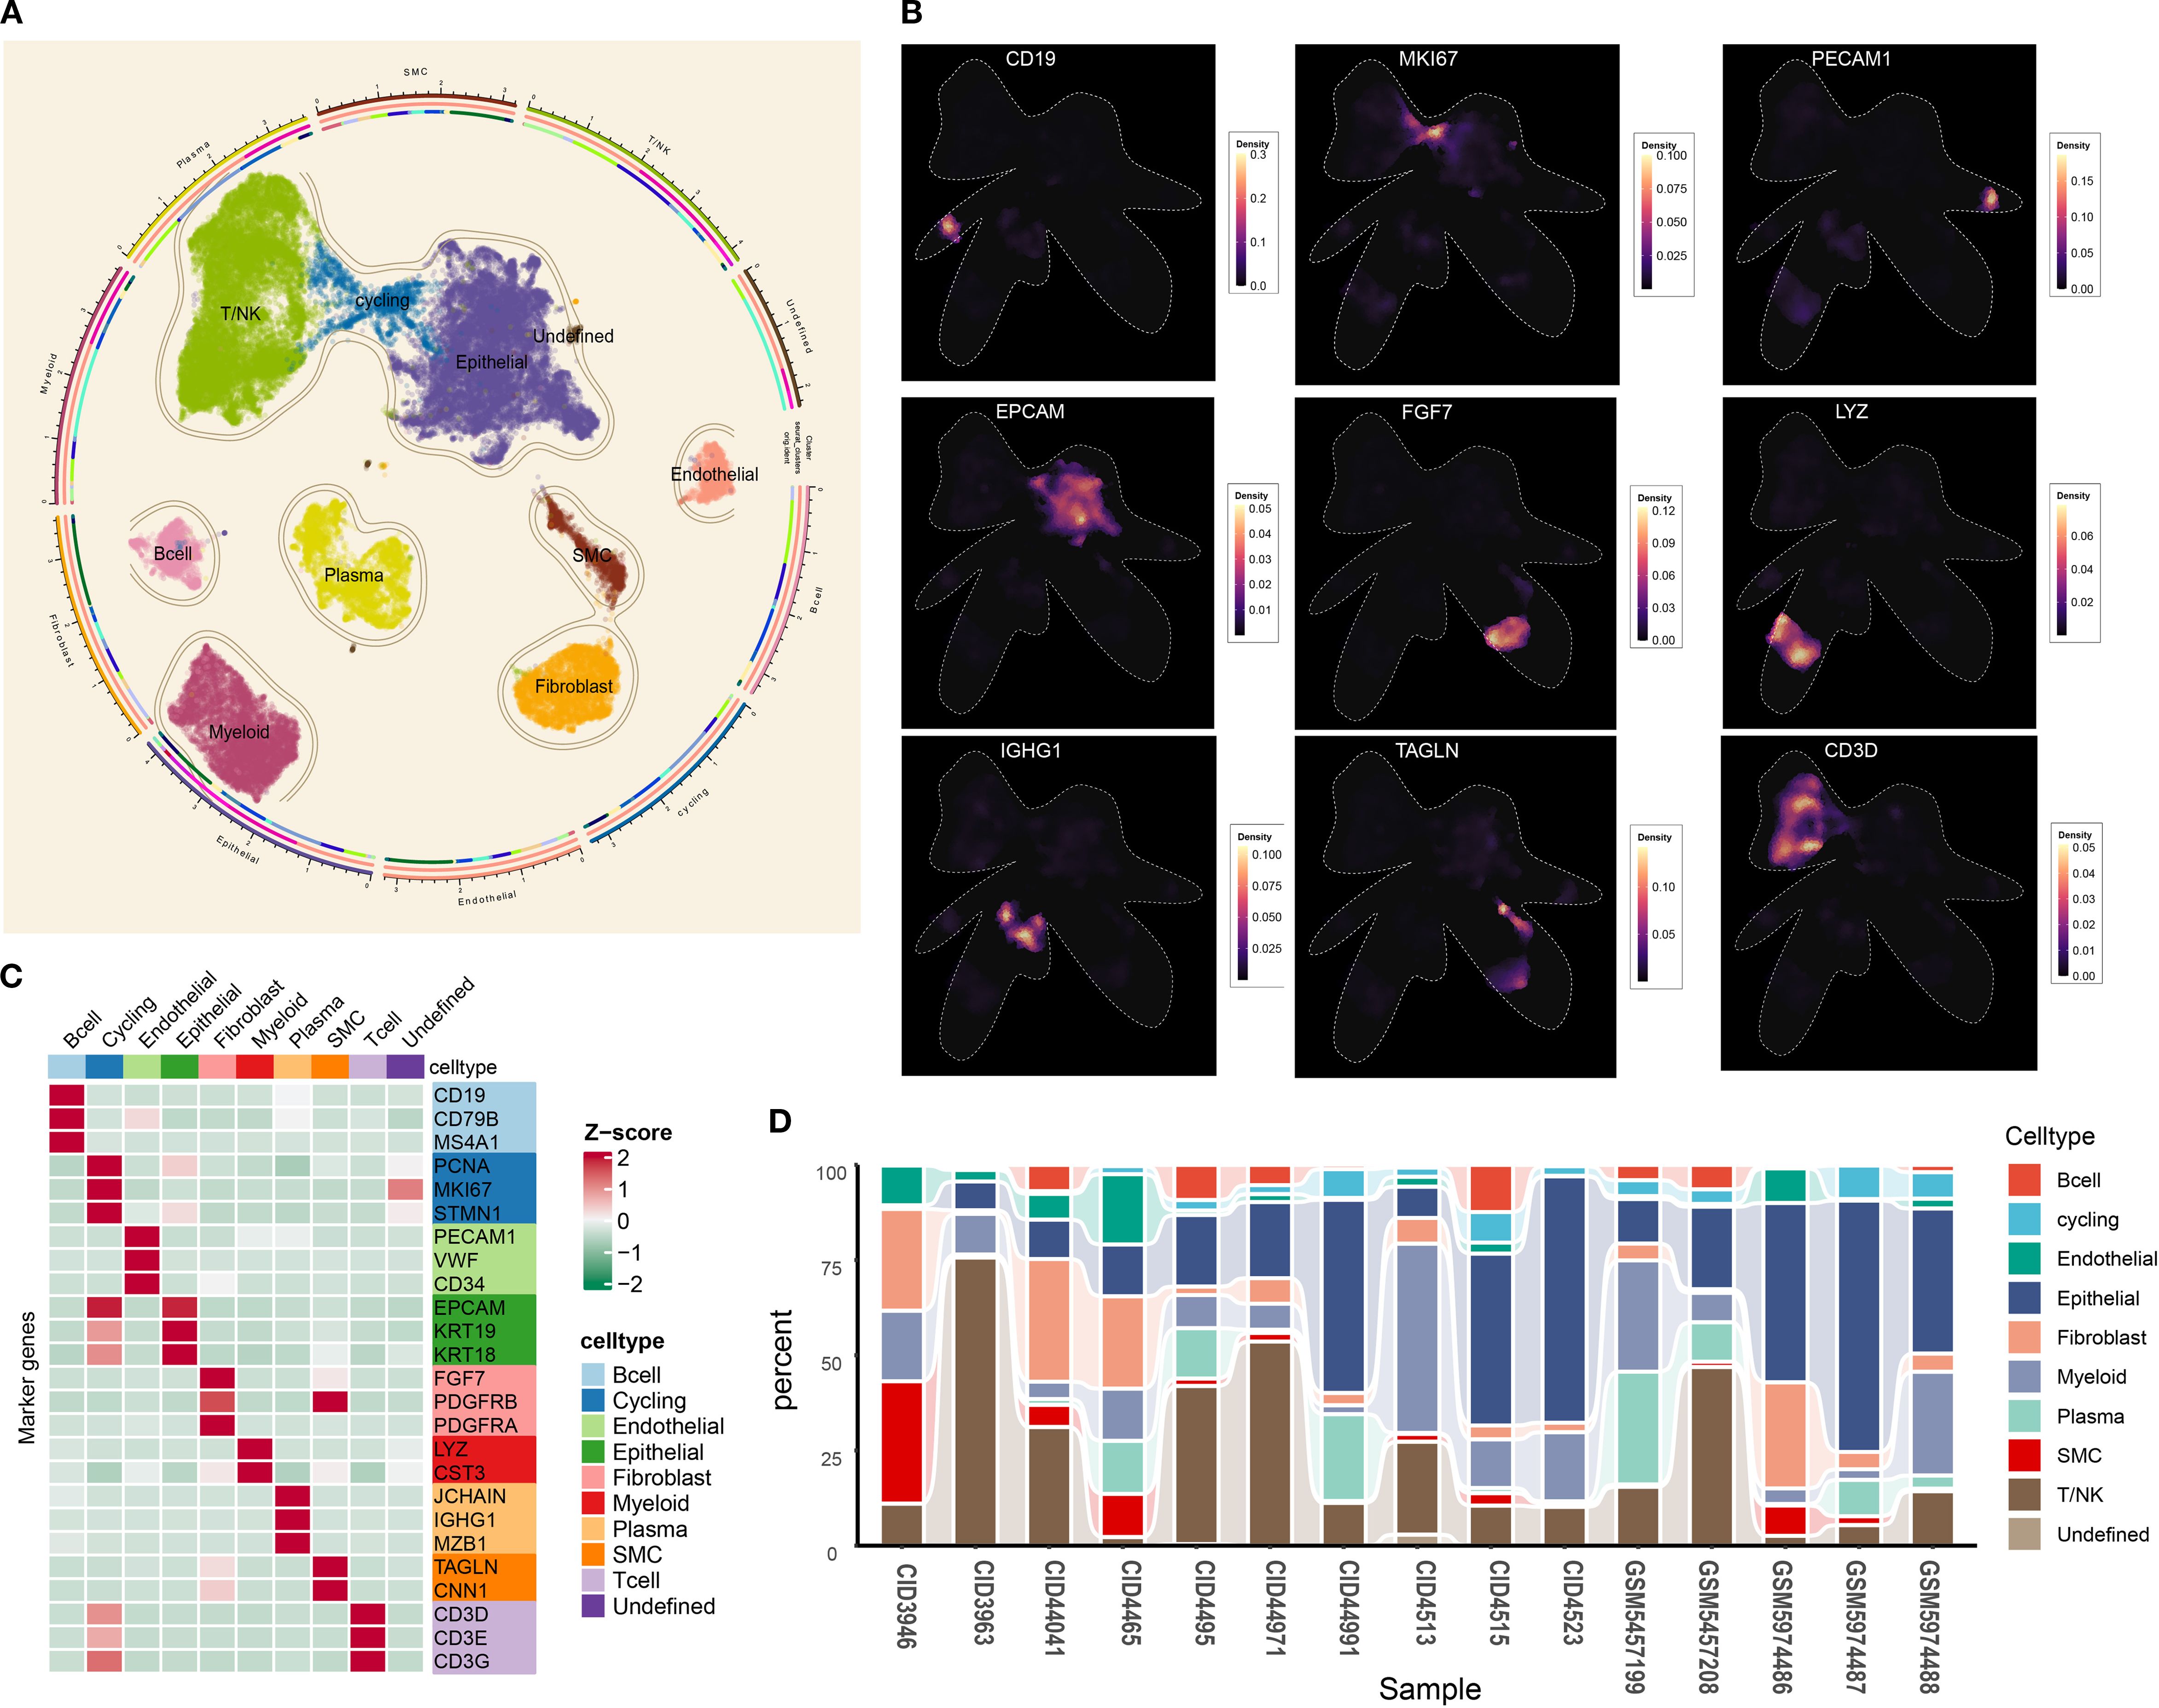
Figure 2. Tumor microenvironment landscape of triple-negative breast cancer. (A) UMAP scatter plots displaying nine different cell clusters in TNBC samples. (B) The density of cells with specific marker was illustrated using UMAP. The color represents the density level of the cells with the marker. (C) The markers used for distinct cell type identification. (D) The abundance of nine main cell types in TNBC samples. UMAP, Uniform Manifold Approximation and Projection; TNBC, triple-negative breast cancer.
Malignant cell identification
Epithelial cells are widely regarded as the origin of breast cancer cells (32). However, distinguishing tumor cells from epithelial populations solely through biomarker expression at single-cell resolution remains challenging. Therefore, the “inferCNV” package was used to infer the tumor cells for each sample. As illustrated in Figure 3A, epithelial cells exhibited significant chromosomal amplifications and deletions relative to myeloid reference cells. The CNV correlation and CNV score were calculated to identify malignant cells. As shown in Supplementary Figure S3, the CNV level of myeloid cells is almost concentrated in CNV score < 0.001 and CNV correlation < 0.5. Based on these results, tumor cells in epithelial cells were defined as a CNV score > 0.001 and CNV correlation > 0.5, and the remaining epithelial cells with a similar CNV level to myeloid cells were defined as normal epithelial cells. Figures 3B–P confirm that this threshold robustly segregated myeloid cells from malignant populations across all samples, with normal epithelial cells exhibiting intermediate CNV characteristics. In summary, 14,335 tumor cells were isolated for downstream analysis.
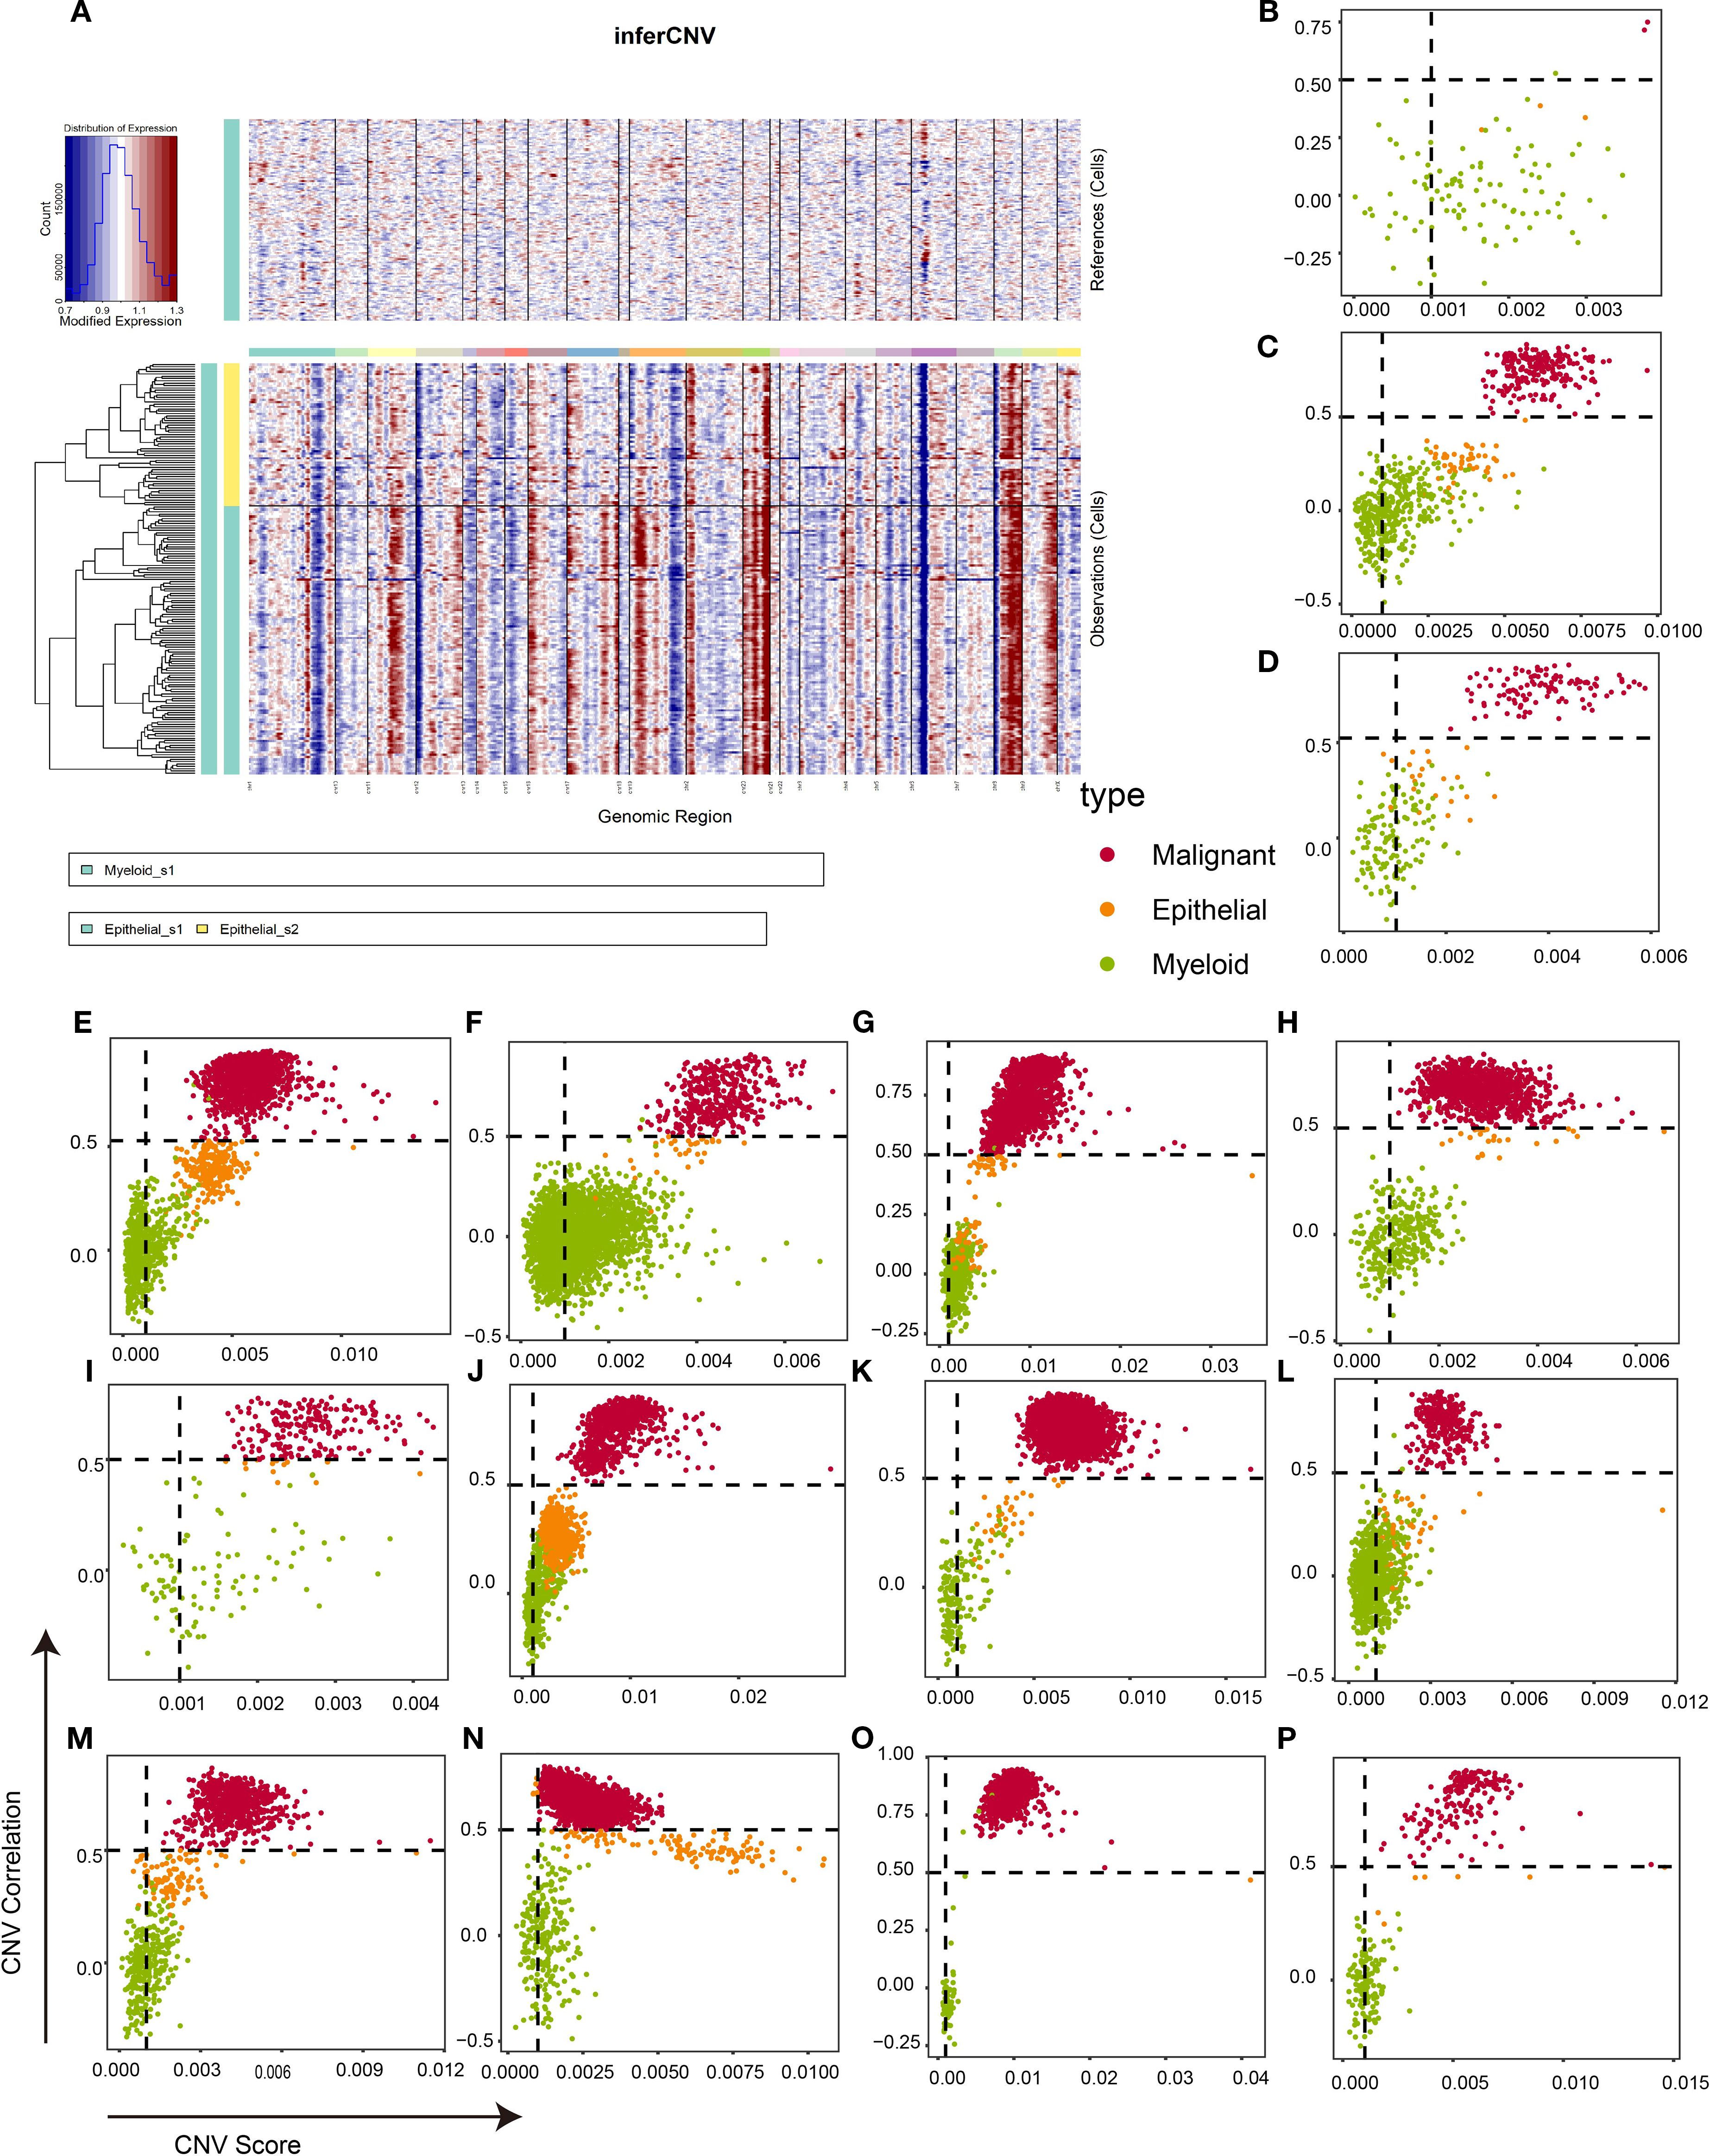
Figure 3. Identification of malignant cells in TNBC tissues based on infercnv algorithm. (A) An example of infercnv algorithm showing chromosomal landscape of inferred CNVs among epithelial cells. (B–P) Scatter plot showing the CNV correlation and CNV score of each sample in CID3946 (B), CID3963 (C), CID4465 (D), CID4495 (E), CID4513 (F), CID4515 (G), CID4523 (H), CID44041 (I), CID44971 (J), CID44991 (K), GSM5457199 (L), GSM5457208 (M), GSM5974486 (N), GSM5974487 (O), and GSM5974488 (P). TNBC, triple-negative breast cancer; CNVs, copy number variations.
Characterization of the heterogeneity of tumor cells in TNBC microenvironment
Tumor heterogeneity impacts the biological behavior, treatment response, and prognosis of tumors (33). Consequently, resolving tumor cell heterogeneity is critical for advancing TNBC precision medicine. Following high-confidence malignant cell identification, we integrated, re-normalized, and dimensionality-reduced tumor cells using established methods. Six tumor clusters were resolved: S0 (N=5,858), S1 (N=5,070), S2 (N=1,248), S3 (N=1,013), S4 (N=709), and S5 (N=436) (Figure 4A). A transcription factor (TF) analysis identified the top 10 most active TFs per subgroup (Figure 4B), revealing significant inter-cluster heterogeneity (Figure 4B). For example, TEAD4 and ETV exhibited high activity in the S1 cluster, which indicated that the cluster may be associated with stem-like breast cancer. Also, FOXO1, TEAD1, and SMAD3 showed high activity in the S2 cluster, suggesting that the S2 cluster may be correlated with more aggressive biological behaviors. These findings demonstrate intrinsic transcriptional heterogeneity across TNBC subpopulations.

Figure 4. The gene patterns of each tumor cluster. (A) UMAP scatter plots displaying six different tumor clusters in TNBC samples. (B) The heatmap showing the top 10 transcription factors in each cluster. (C) The non-negative matrix showing five different metaprograms of tumor clusters at mRNA level. (D) Violin plots exhibiting the signature score of each metaprogram in distinct tumor clusters. UMAP, Uniform Manifold Approximation and Projection; TNBC, triple-negative breast cancer.
Next, we constructed the stable MPs to further explore the heterogeneity of tumor clusters. As shown in Figure 4C, six metaprograms (representing coordinated biological programs) were identified. Concretely, MP2 was associated with the tumor metastasis (epithelial–mesenchymal transition), while MP5 and MP4 were correlated with cell proliferation (E2F targets, G2M checkpoint, MYC targets, and p53 pathway). MP3 was associated with tumor microenvironment formation (angiogenesis), and MP6 correlated with immune response (interferon-gamma response, TNFA signaling, and IL6–JAK–STAT3 signaling). Interestingly, the genes of MP1 have not been enriched in any pathway. Of note, we observed that the MP2 signature score was higher in the S1 and S2 clusters, indicating that these clusters may promote tumor metastasis (Figure 4D). Also, the tumor proliferation-related metaprogram MP5 signature score was higher in the S1, S2, and S3 clusters. However, the other tumor proliferation-related metaprogram MP4 signature score was observed to be higher in the S3 and S4 clusters. This suggests heterogeneous proliferative mechanisms within the TNBC microenvironment. All in all, these analyses elucidate functional divergence among tumor subpopulations and their mechanistic drivers, providing a framework for targeted therapeutic development.
Characterization of tumor cell trajectory
The plasticity of tumor cells is an important characteristic for their adaptation to microenvironmental changes (34). We therefore sought to reconstruct developmental lineages across tumor clusters. First, pseudotemporal ordering inferred cellular origins (Figure 5A), establishing the S3 cluster as the putative root state. A cell trajectory analysis showed two potential cell lineages (Figure 5B). Concretely, the S3 cluster may be the initial state of tumor cells, while the S4 and S1 clusters may be the intermediate states of tumor cells. The difference is that the S0 and S5 clusters are the final states of lineage 1, while the S2 cluster is the final state of lineage 2 (Figure 5C).
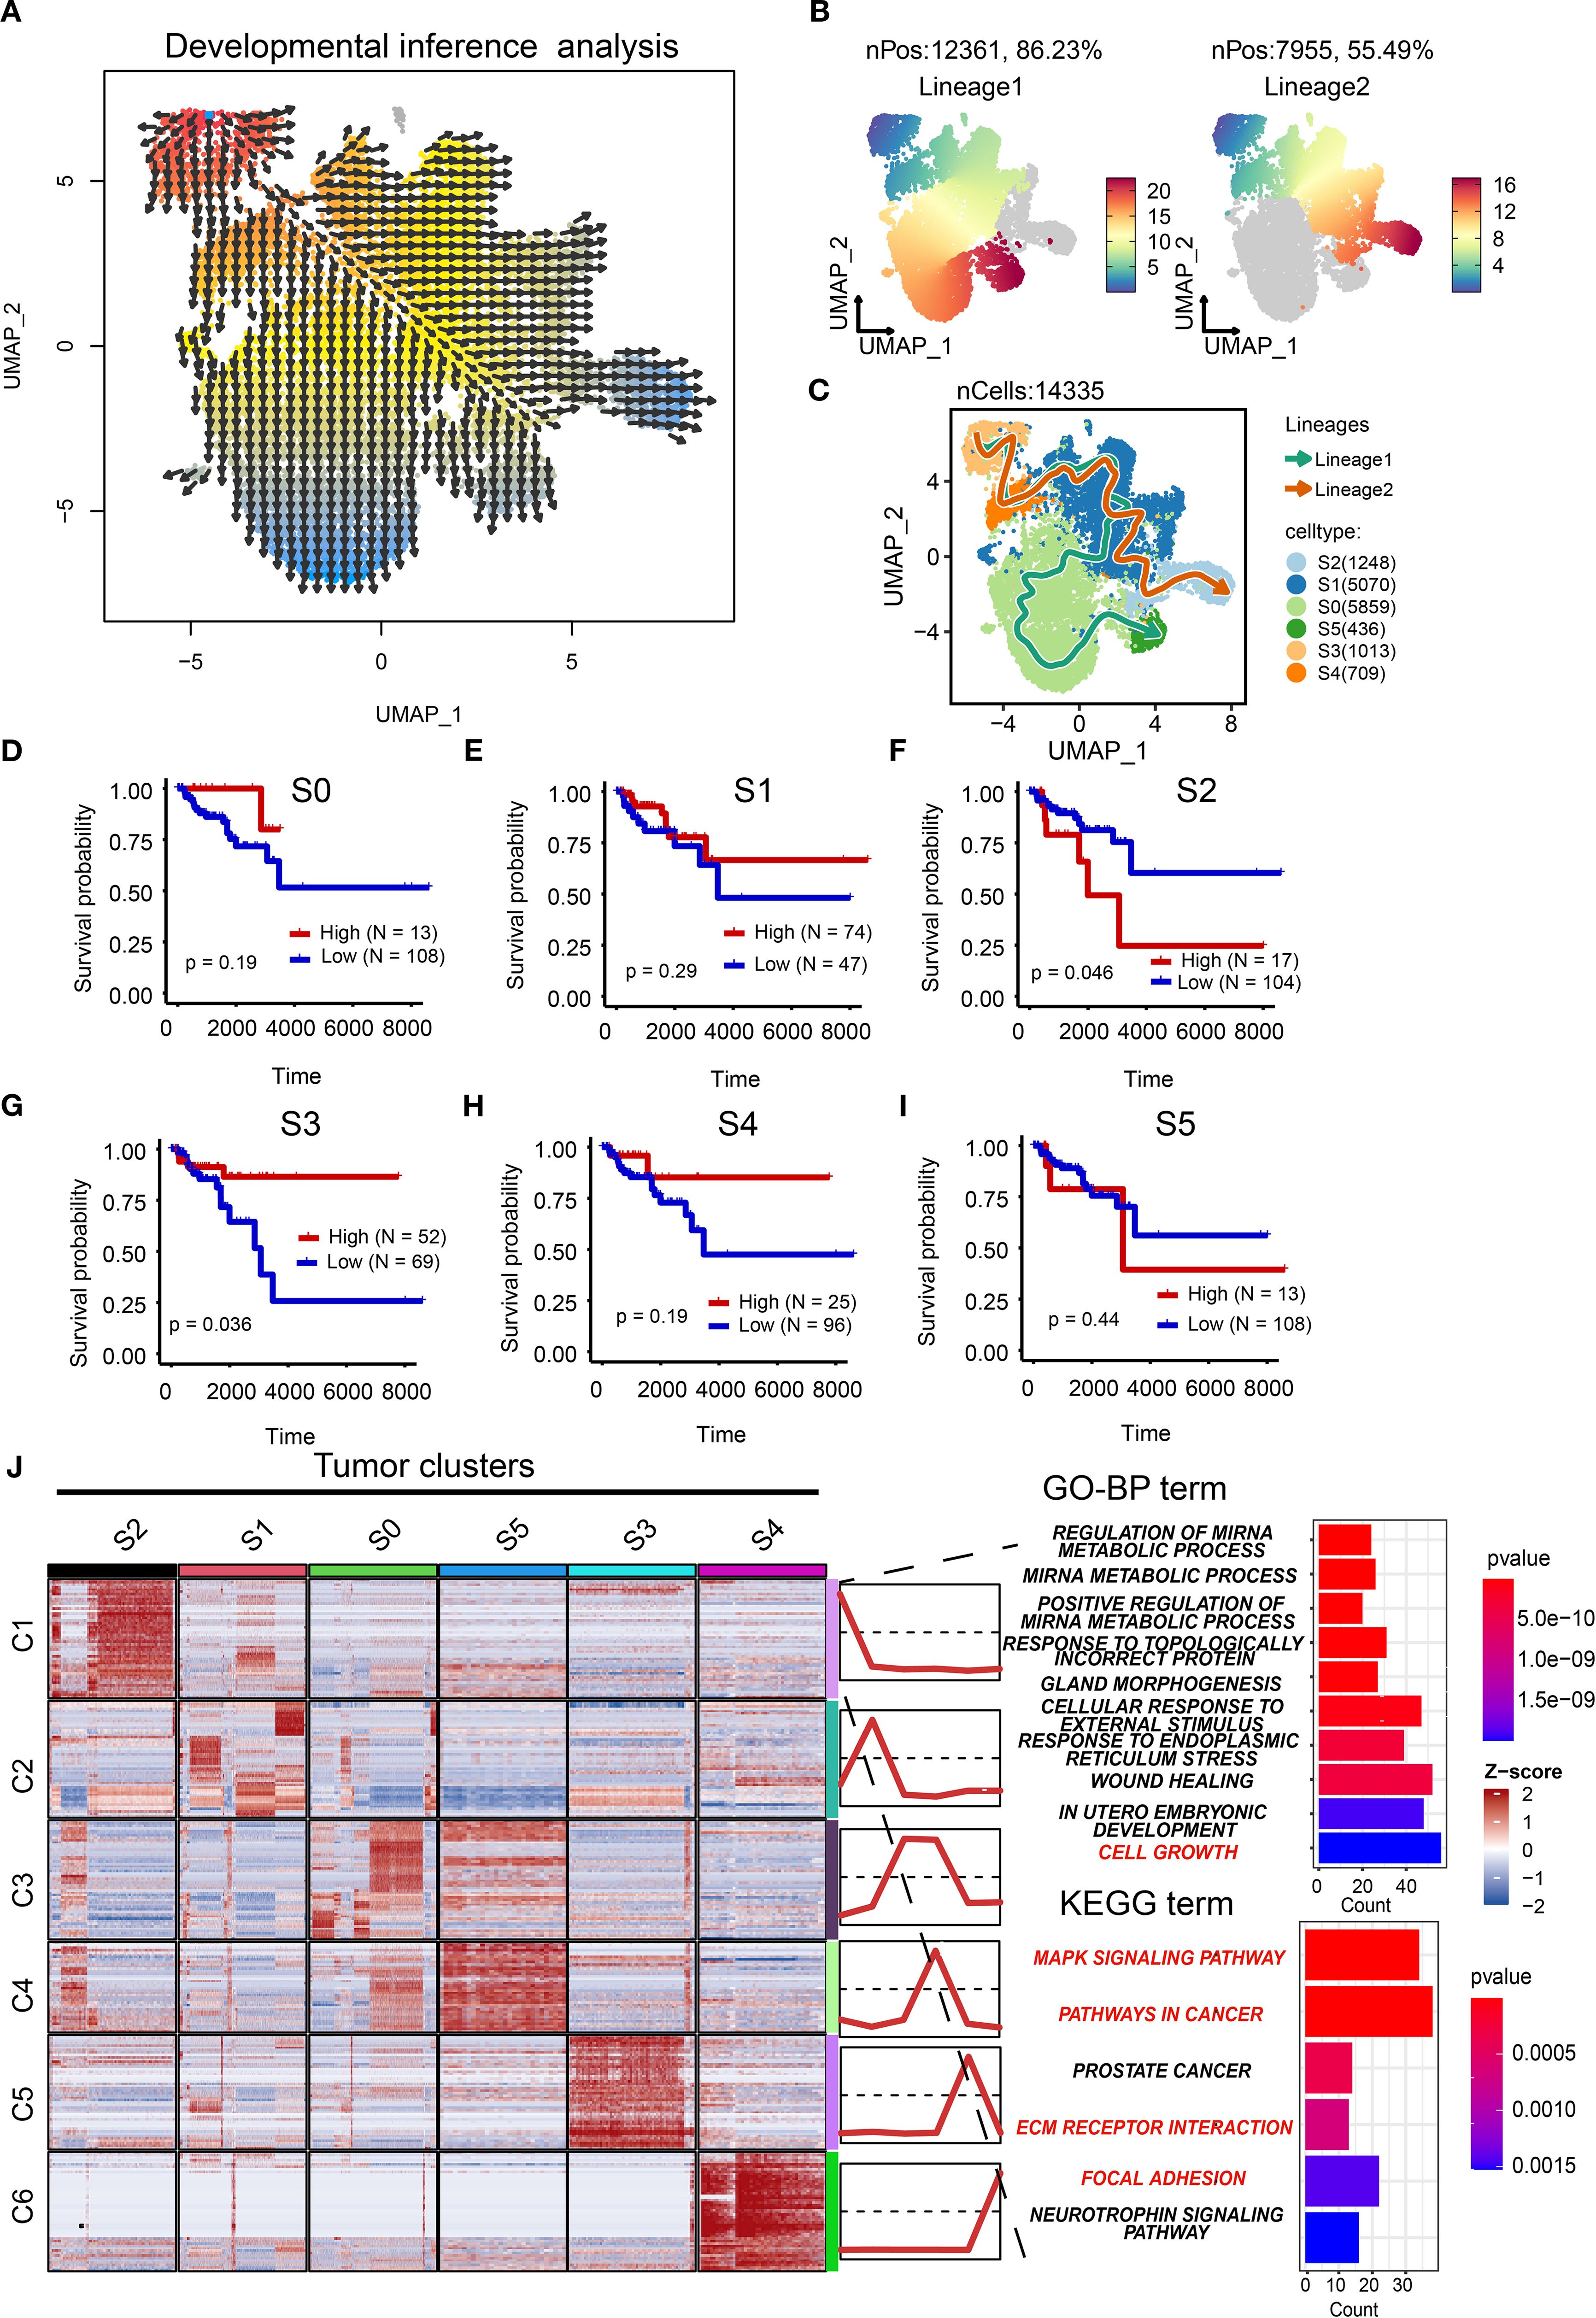
Figure 5. Characterization of cell trajectory. (A) Vector representation of developmental directions for tumor cells. (B) Two cell lineages of tumor cells with pseudo-time development. (C) The potential cell trajectory and lineages of tumor cells in tumor microenvironment. (D–I) The Kaplan-Meier (K-M) curves showing the overall survival rate of high and low S0 (D), S1 (E), S2 (F), S3 (G), S4 (H), and S5 (I) tumor clusters. (J) Heatmap showing the mean of top 50 marker genes of clusters. The line graph represents the differential expression of the mean of these marker genes in all clusters. The bar chart represents the functional enrichment of GO (BP, biological process; CC, cellular component; MF, molecular function) and KEGG pathways for marker genes in tumor cluster S2. GO, Gene Ontology; KEGG, Kyoto Encyclopedia of Genes and Genomes.
Prognostic validation using TCGA-BRCA cohort demonstrated that the root S3 cluster exhibited favorable survival (p=0.036; Figures 5D–I), whereas the terminal S2 cluster showed significantly poorer outcomes (p=0.046). This confirms the clinical relevance of our trajectory model and positions S2 as a high-priority therapeutic target. The poor prognostic role of the S2 cluster was also validated in the METABRIC cohort (Supplementary Figure S4). Therefore, it is necessary to explore the potential biological function of the S2 cluster. We analyzed the top marker genes of each cluster as well as associated pathways. As illustrated in Figure 5J, GO and KEGG analyses showed that the S2 cluster was associated with cell growth (Supplementary File: Supplementary Tables S4, S5), the MAPK signaling pathway, pathways in cancers, extracellular matrix (ECM) receptor interaction, and focal adhesion, indicating that the S2 cluster may drive tumor progression through proliferative, metastatic, and microenvironment-remodeling mechanisms. Taken together, we establish S2 as a pivotal driver of TNBC aggressiveness.
Cell–cell communication between tumor clusters and other components in tumor microenvironment of TNBC
The interactions between tumor clusters and other components have been confirmed to play a critical role in tumor progression (35). Beyond intrinsic evolution, we hypothesized that S2 cluster behavior may be modulated by extrinsic factors. The “CellChat” package was used to estimate the interactions and strength in the tumor microenvironment of TNBC (Figure 6A). We noticed a significant interaction between fibroblasts and the S2 cluster. Combining the previous KEGG results (Figure 5J), we focus on the interaction of ECM-related ligand–receptor pairs between fibroblasts and the S2 cluster. Fibroblasts and the S2 cluster exhibited pronounced enrichment in the collagen and FN1 pathways (Figures 6B, C). Key collagen ligand–receptor pairs (COL1A2-CD44, COL1A2-SDC4, COL1A1-SDC4, and COL1A1-CD44) demonstrated high communication probability (Figure 6D). Similarly, FN1 pairs (FN1-CD44 and FN1-SDC4) showed elevated interaction likelihood (Figure 6E). Fibroblasts, as signal initiators, highly expressed ligands COL1A1, COL1A2, and FN1 (Figures 6F, G). Conversely, S2 (signal receiver) highly expressed receptors CD44, SDC4, ITGAV, ITGA2, and ITGB6. Of note, CD44, ITGAV, ITGA2, and SDC4 were confirmed to be upstream of the PI3K/AKT or MAPK pathway (35–37). The results revealed the potential molecular mechanism between tumor clusters and cancer-associated fibroblasts. These results elucidate a molecular mechanism whereby cancer-associated fibroblasts (CAFs) regulate the S2 cluster through ECM receptor signaling, synergistically promoting malignant phenotypes beyond intrinsic evolutionary trajectories.
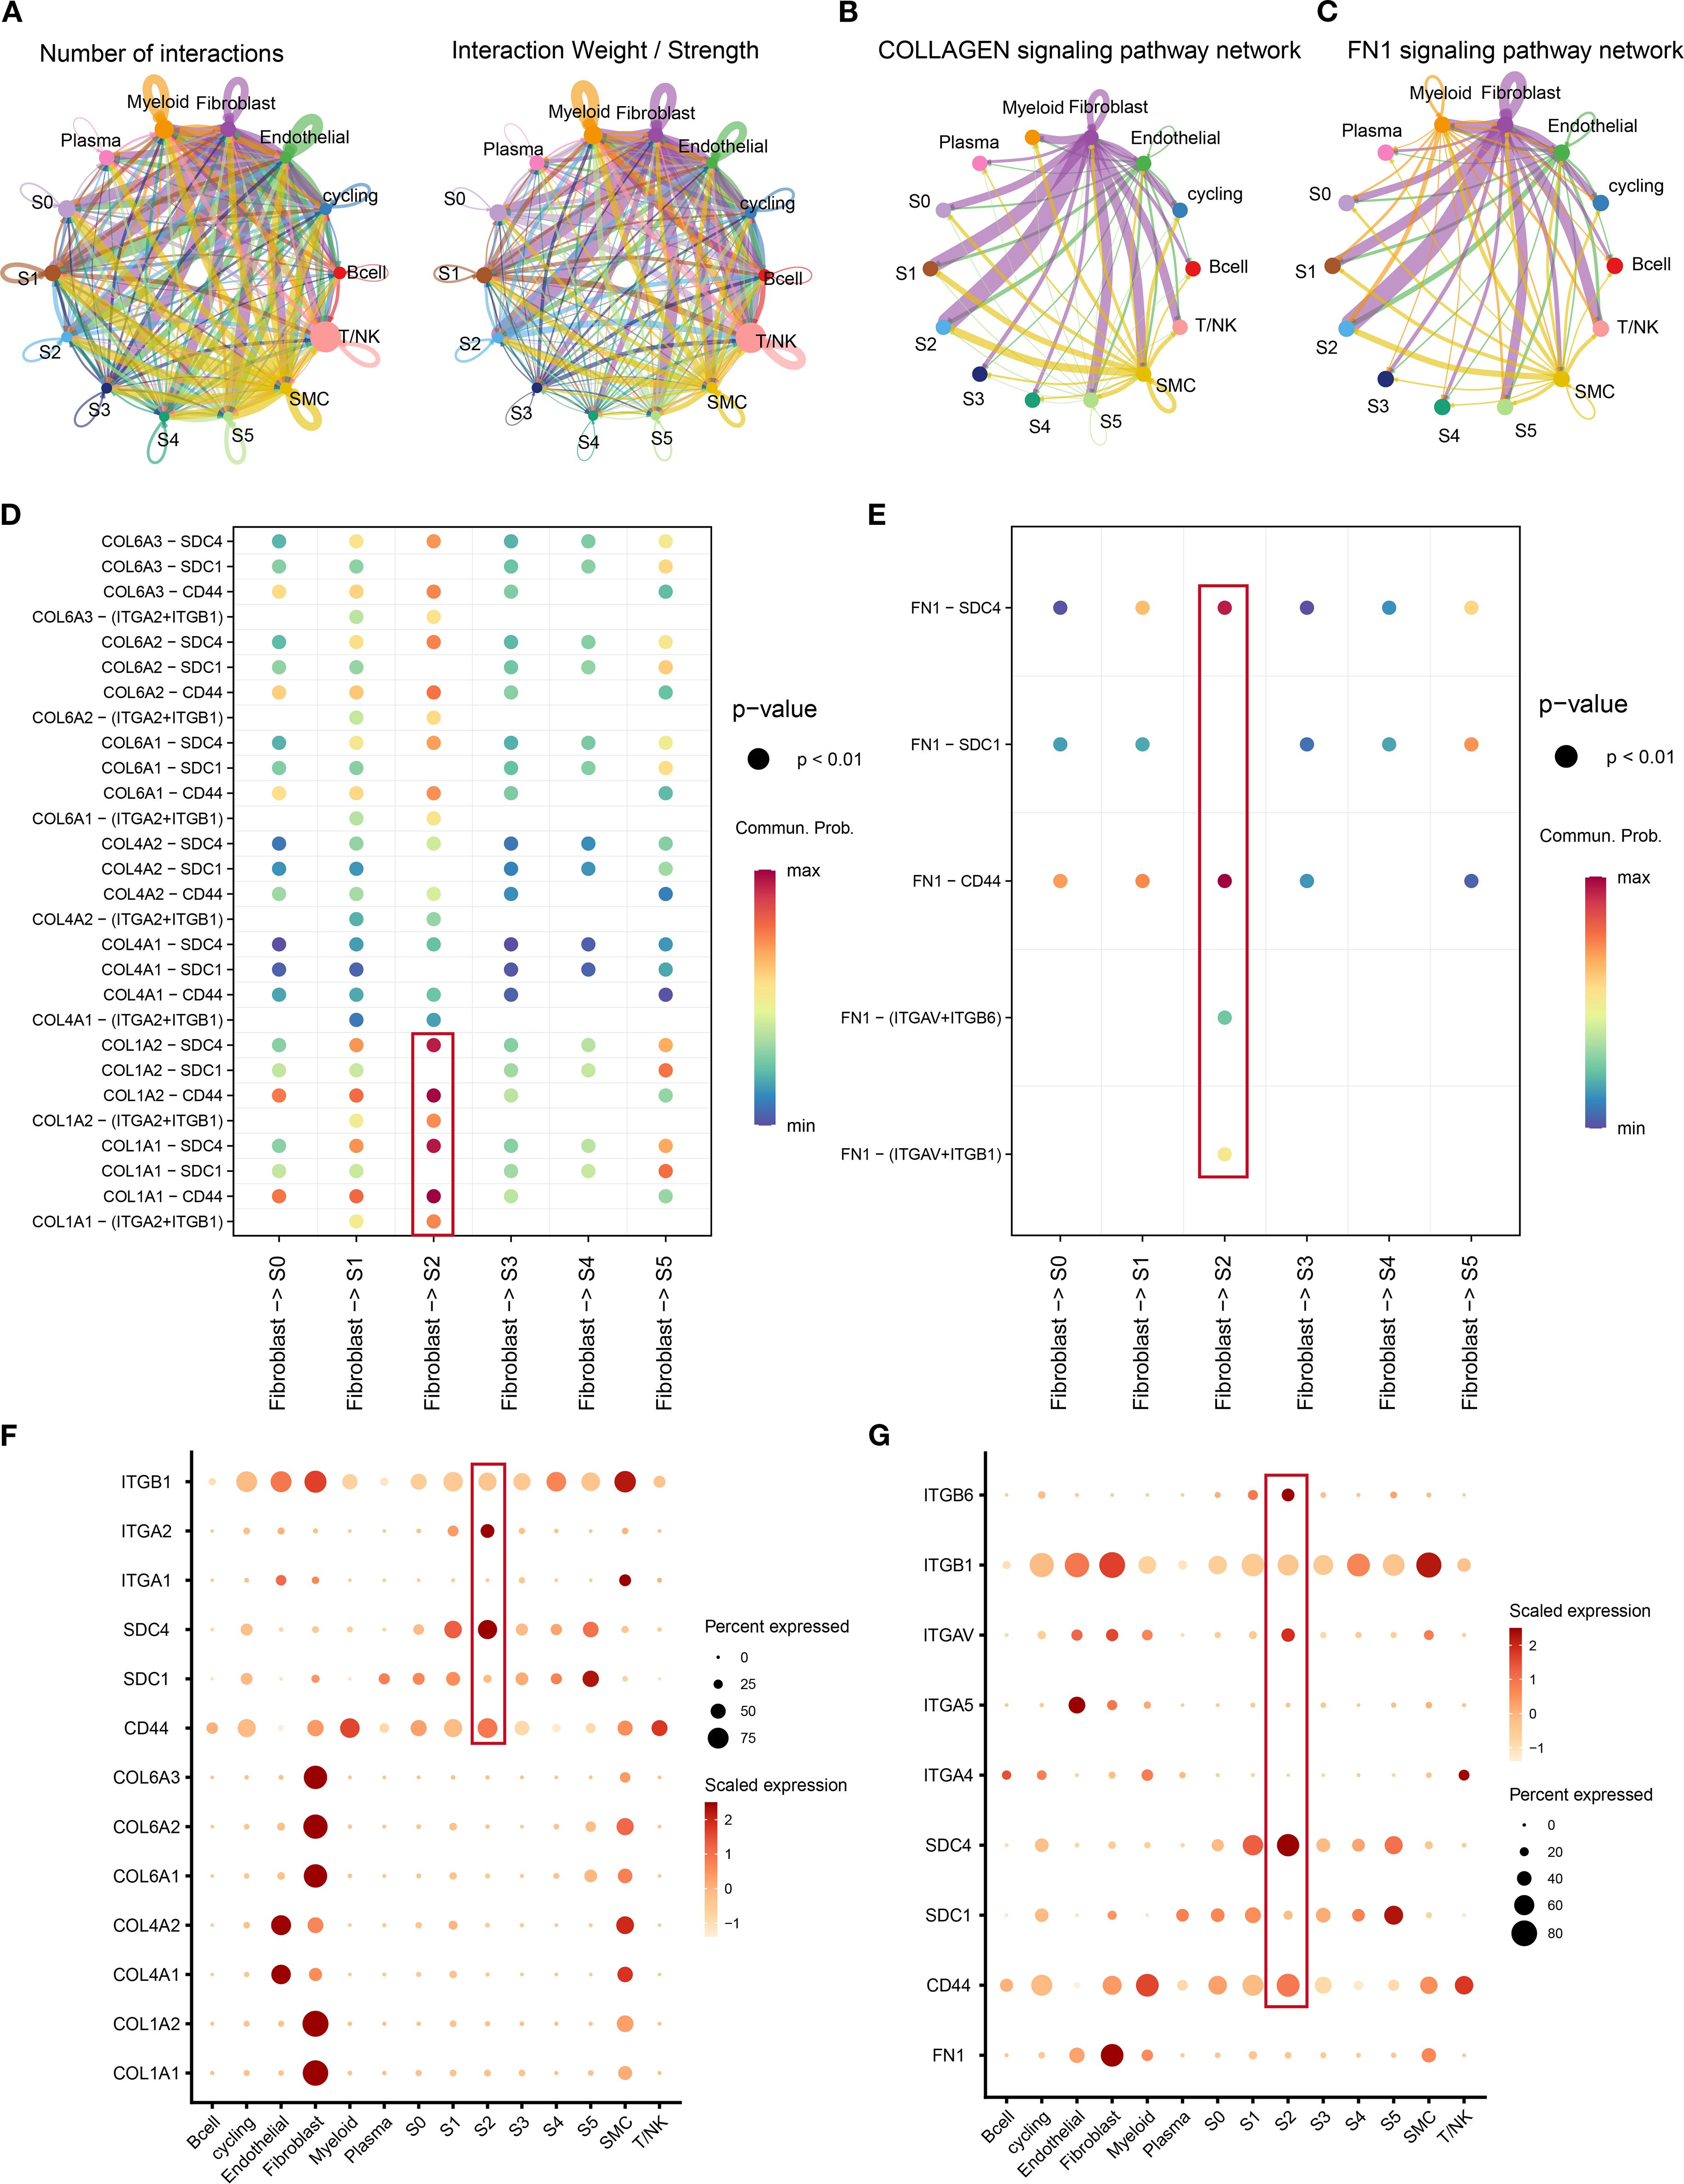
Figure 6. The crosstalk between tumor clusters and other components in tumor microenvironment. (A) The number of interactions and interaction weight among all cell types in TNBC microenvironment. The thickness of the lines represents the strength of the communication. (B, C) The pathway network of collagen (B) and FN1 (C) in tumor microenvironment. The thickness of the lines represents the strength of the communication. (D, E) Circle plot demonstrating the communication of collagen (D) and FN1 (E) signaling pathways between tumor clusters and cancer-associated fibroblasts. A color change from blue to red indicates an increase in communication probability. Dots from small to large represent smaller p-values. (F, G) The dot plots showing the expression level of collagen (F), FN1 (G), and associated genes among all cell types. A color change from light red to deep red indicates an increase in gene expression. Dots from small to large represent an increase in the percentage of gene expression. TNBC, triple-negative breast cancer.
Hub gene identification for S2 cluster
Given the pivotal role of the S2 cluster in the TNBC tumor microenvironment, identifying therapeutic targets is imperative for improving patient outcomes. We constructed a high-dimensional weighted gene co-expression network analysis (hdWGCNA) to identify cluster-specific co-expressed genes using single-cell RNA expression profiles. The network achieved optimal connectivity at a soft threshold power of 9 (Figure 7A). Nineteen co-expression modules were resolved, with the top 10 hub genes of each module cataloged in Figures 7B, C. Module signature scores, calculated using the Ucell package, revealed marked enrichment of modules 3 and 9 specifically in the S2 cluster (Figure 7D), suggesting that their genes represent hub candidates for this aggressive subpopulation. UMAP visualizations and violin plots corroborated these findings (Figures 7E, F). Collectively, we identified 271 hub genes for the S2 cluster. By integrating these with prior transcription factor analyses, we constructed a comprehensive molecular regulatory network for this subpopulation. These results establish a framework for elucidating TNBC tumor cell heterogeneity and advancing targeted therapies.
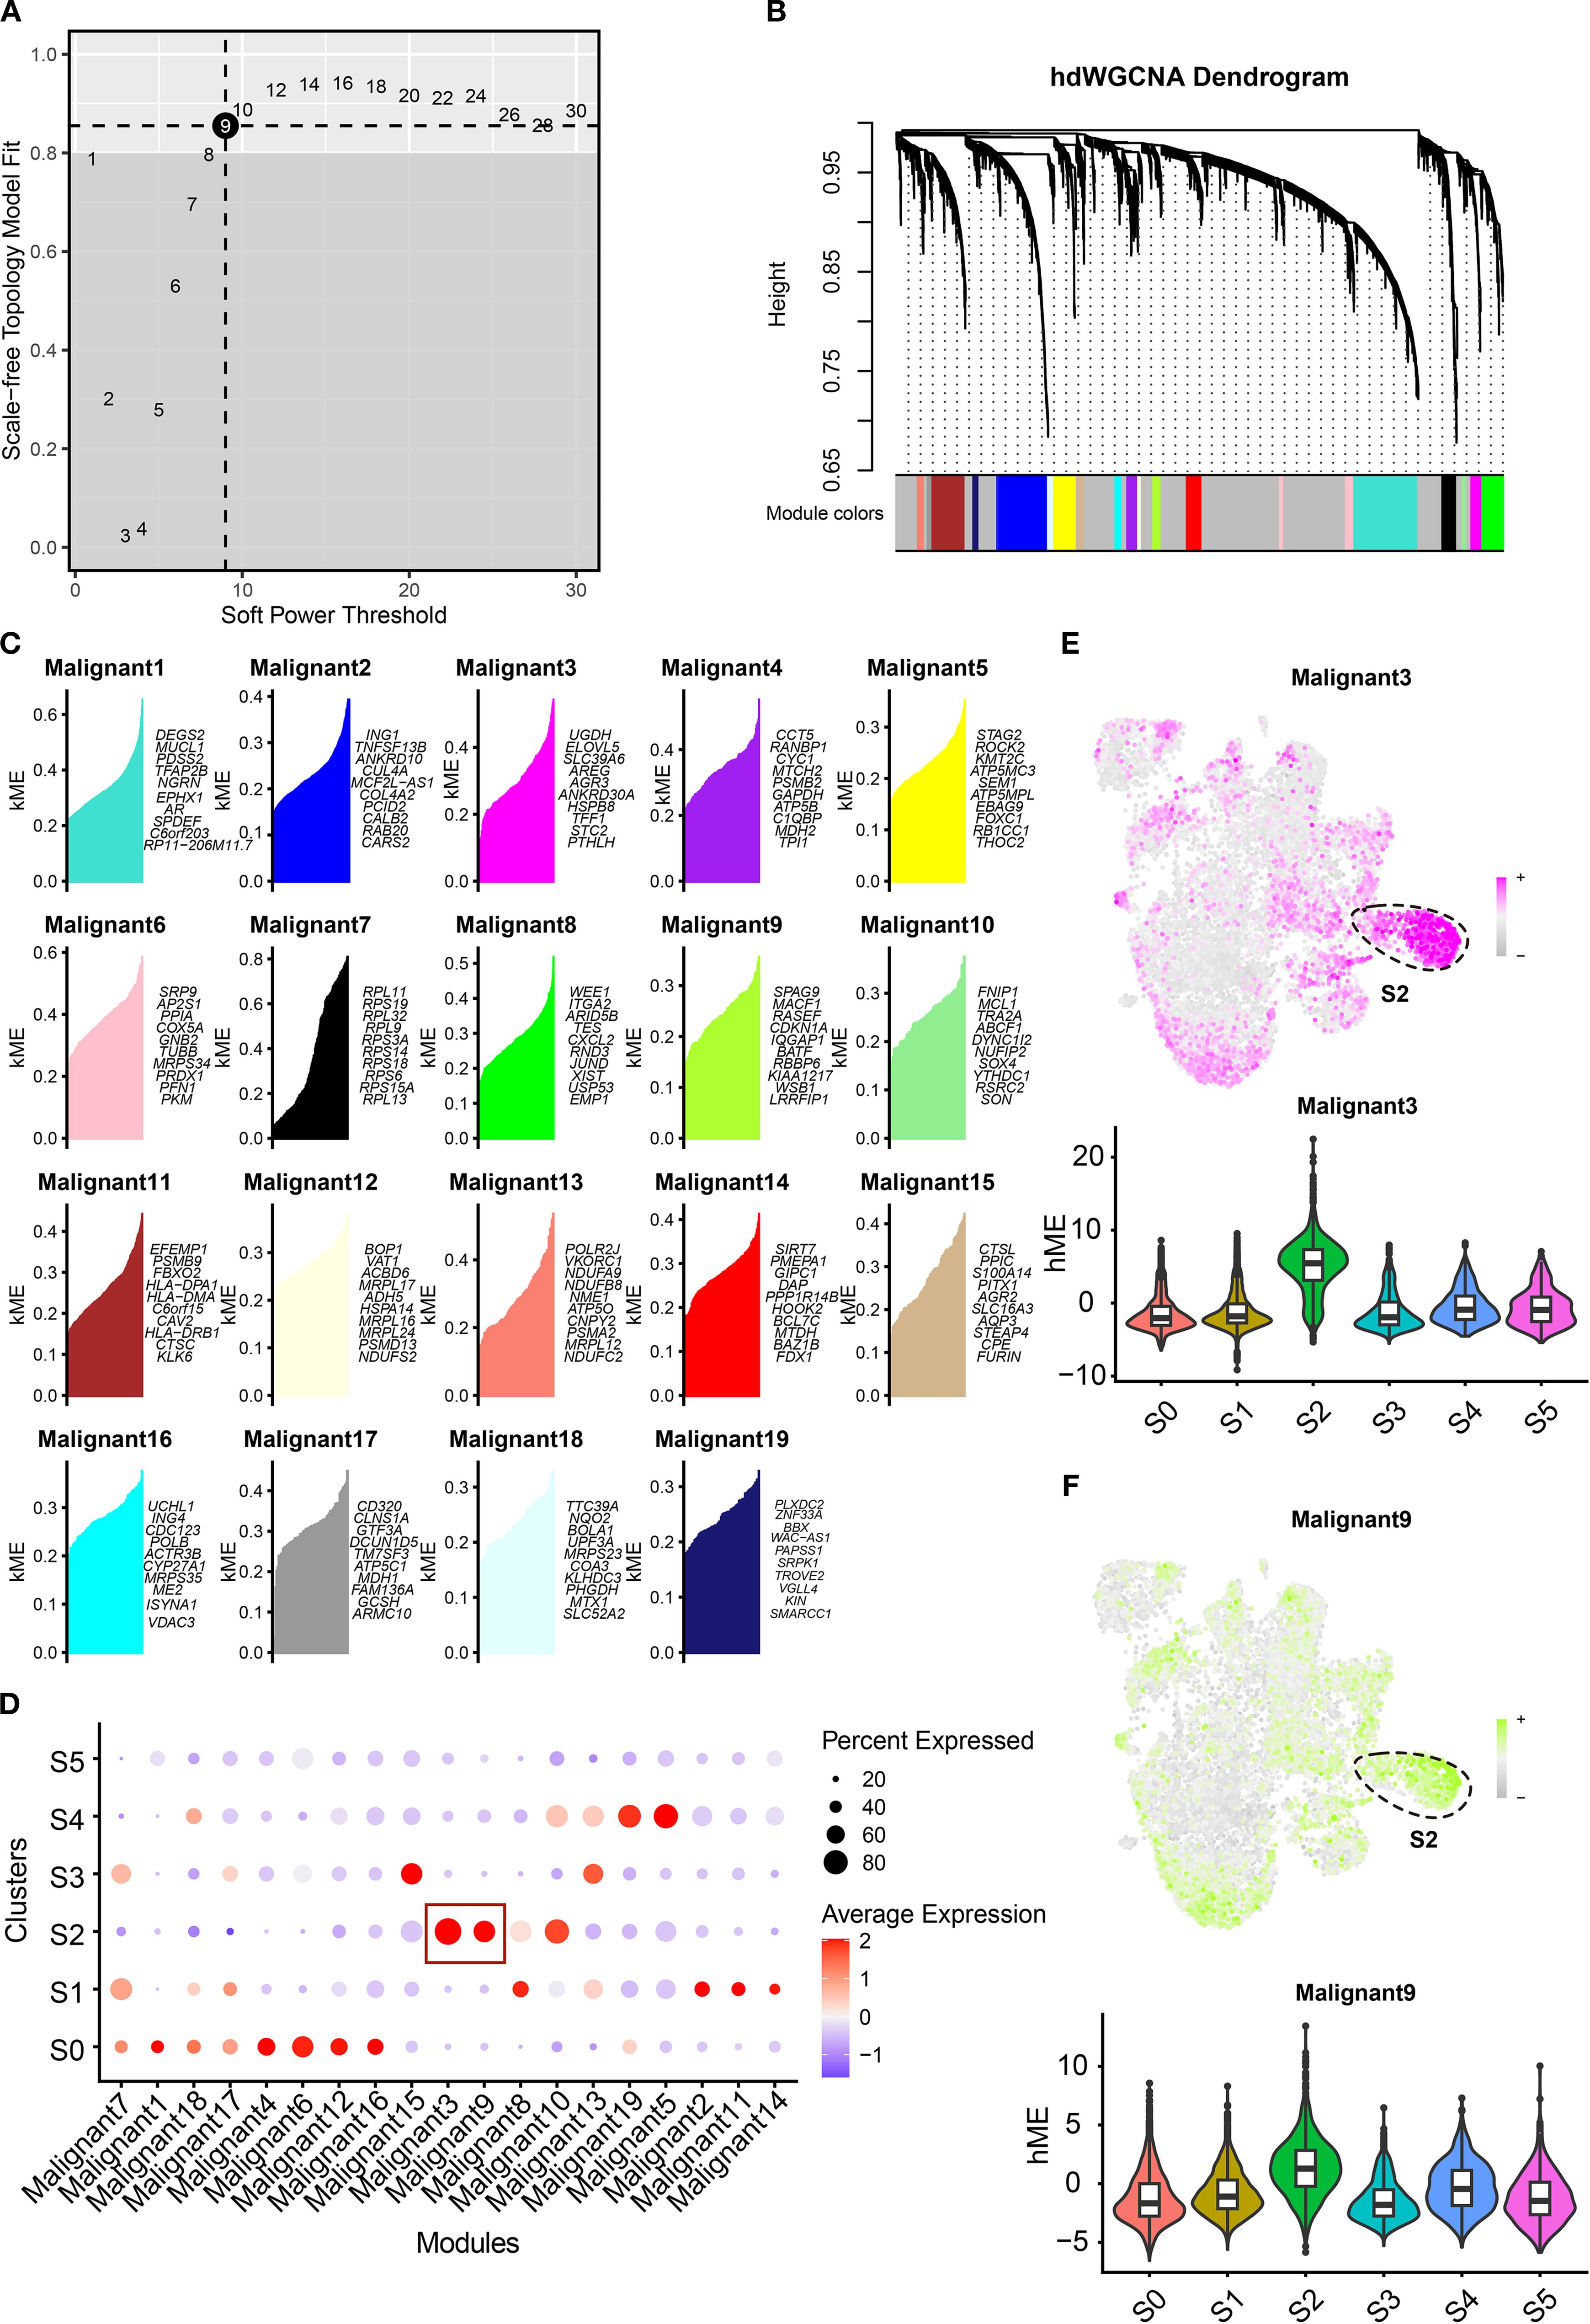
Figure 7. Construction of gene co-expression modules for TNBC clusters. (A) The optimal soft threshold was determined by weighted gene co-expression network analysis. (B) The hdWGCNA dendrogram showing 19 modules obtained. (C) Dot plots showing the signature score of distinct modules in each cluster. (D, E) The UMAP scatter and violin plots showing the score of malignant 3 (E) and malignant 9 (F) in tumor clusters. TNBC, triple-negative breast cancer; hdWGCNA, high-dimensional weighted gene co-expression network analysis; UMAP, Uniform Manifold Approximation and Projection.
GNA15 identified as a key gene for S2 cluster
To identify therapeutic targets and biomarkers for TNBC, we refined candidate genes through sequential filtering to establish core drivers and validate analytical accuracy. Differential gene analysis revealed TNBC-overexpressed genes versus normal breast tissue (Figure 8A). Subsequent survival analysis identified genes correlating with poor prognosis. The integration of overexpressed genes, module-associated genes (Supplementary File: Supplementary Table S6), and survival-linked genes pinpointed GNA15 as the S2 cluster core gene (Figure 8B). Elevated GNA15 expression correlated with significantly poorer overall survival (log-rank p = 0.031; Figure 8C). GNA15 was also overexpressed in the S2 cluster and TNBC tissues (Figures 8D, E). Gene set enrichment analysis confirmed that high expression of GNA15 was associated with the MAPK signaling pathway (Figure 8F, Normalized Enrichment Score (NES) = 1.82, adjusted p-value < 0.001), which was consistent with the biological function of the S2 cluster. Protein-level validation via immunohistochemistry demonstrated marked GNA15 upregulation in TNBC versus normal tissues (Figures 8G, H). The standard stain score of IHC is illustrated in Figure 8I. These results suggest GNA15 as a core regulatory element of the S2 cluster and a promising biomarker for TNBC progression.
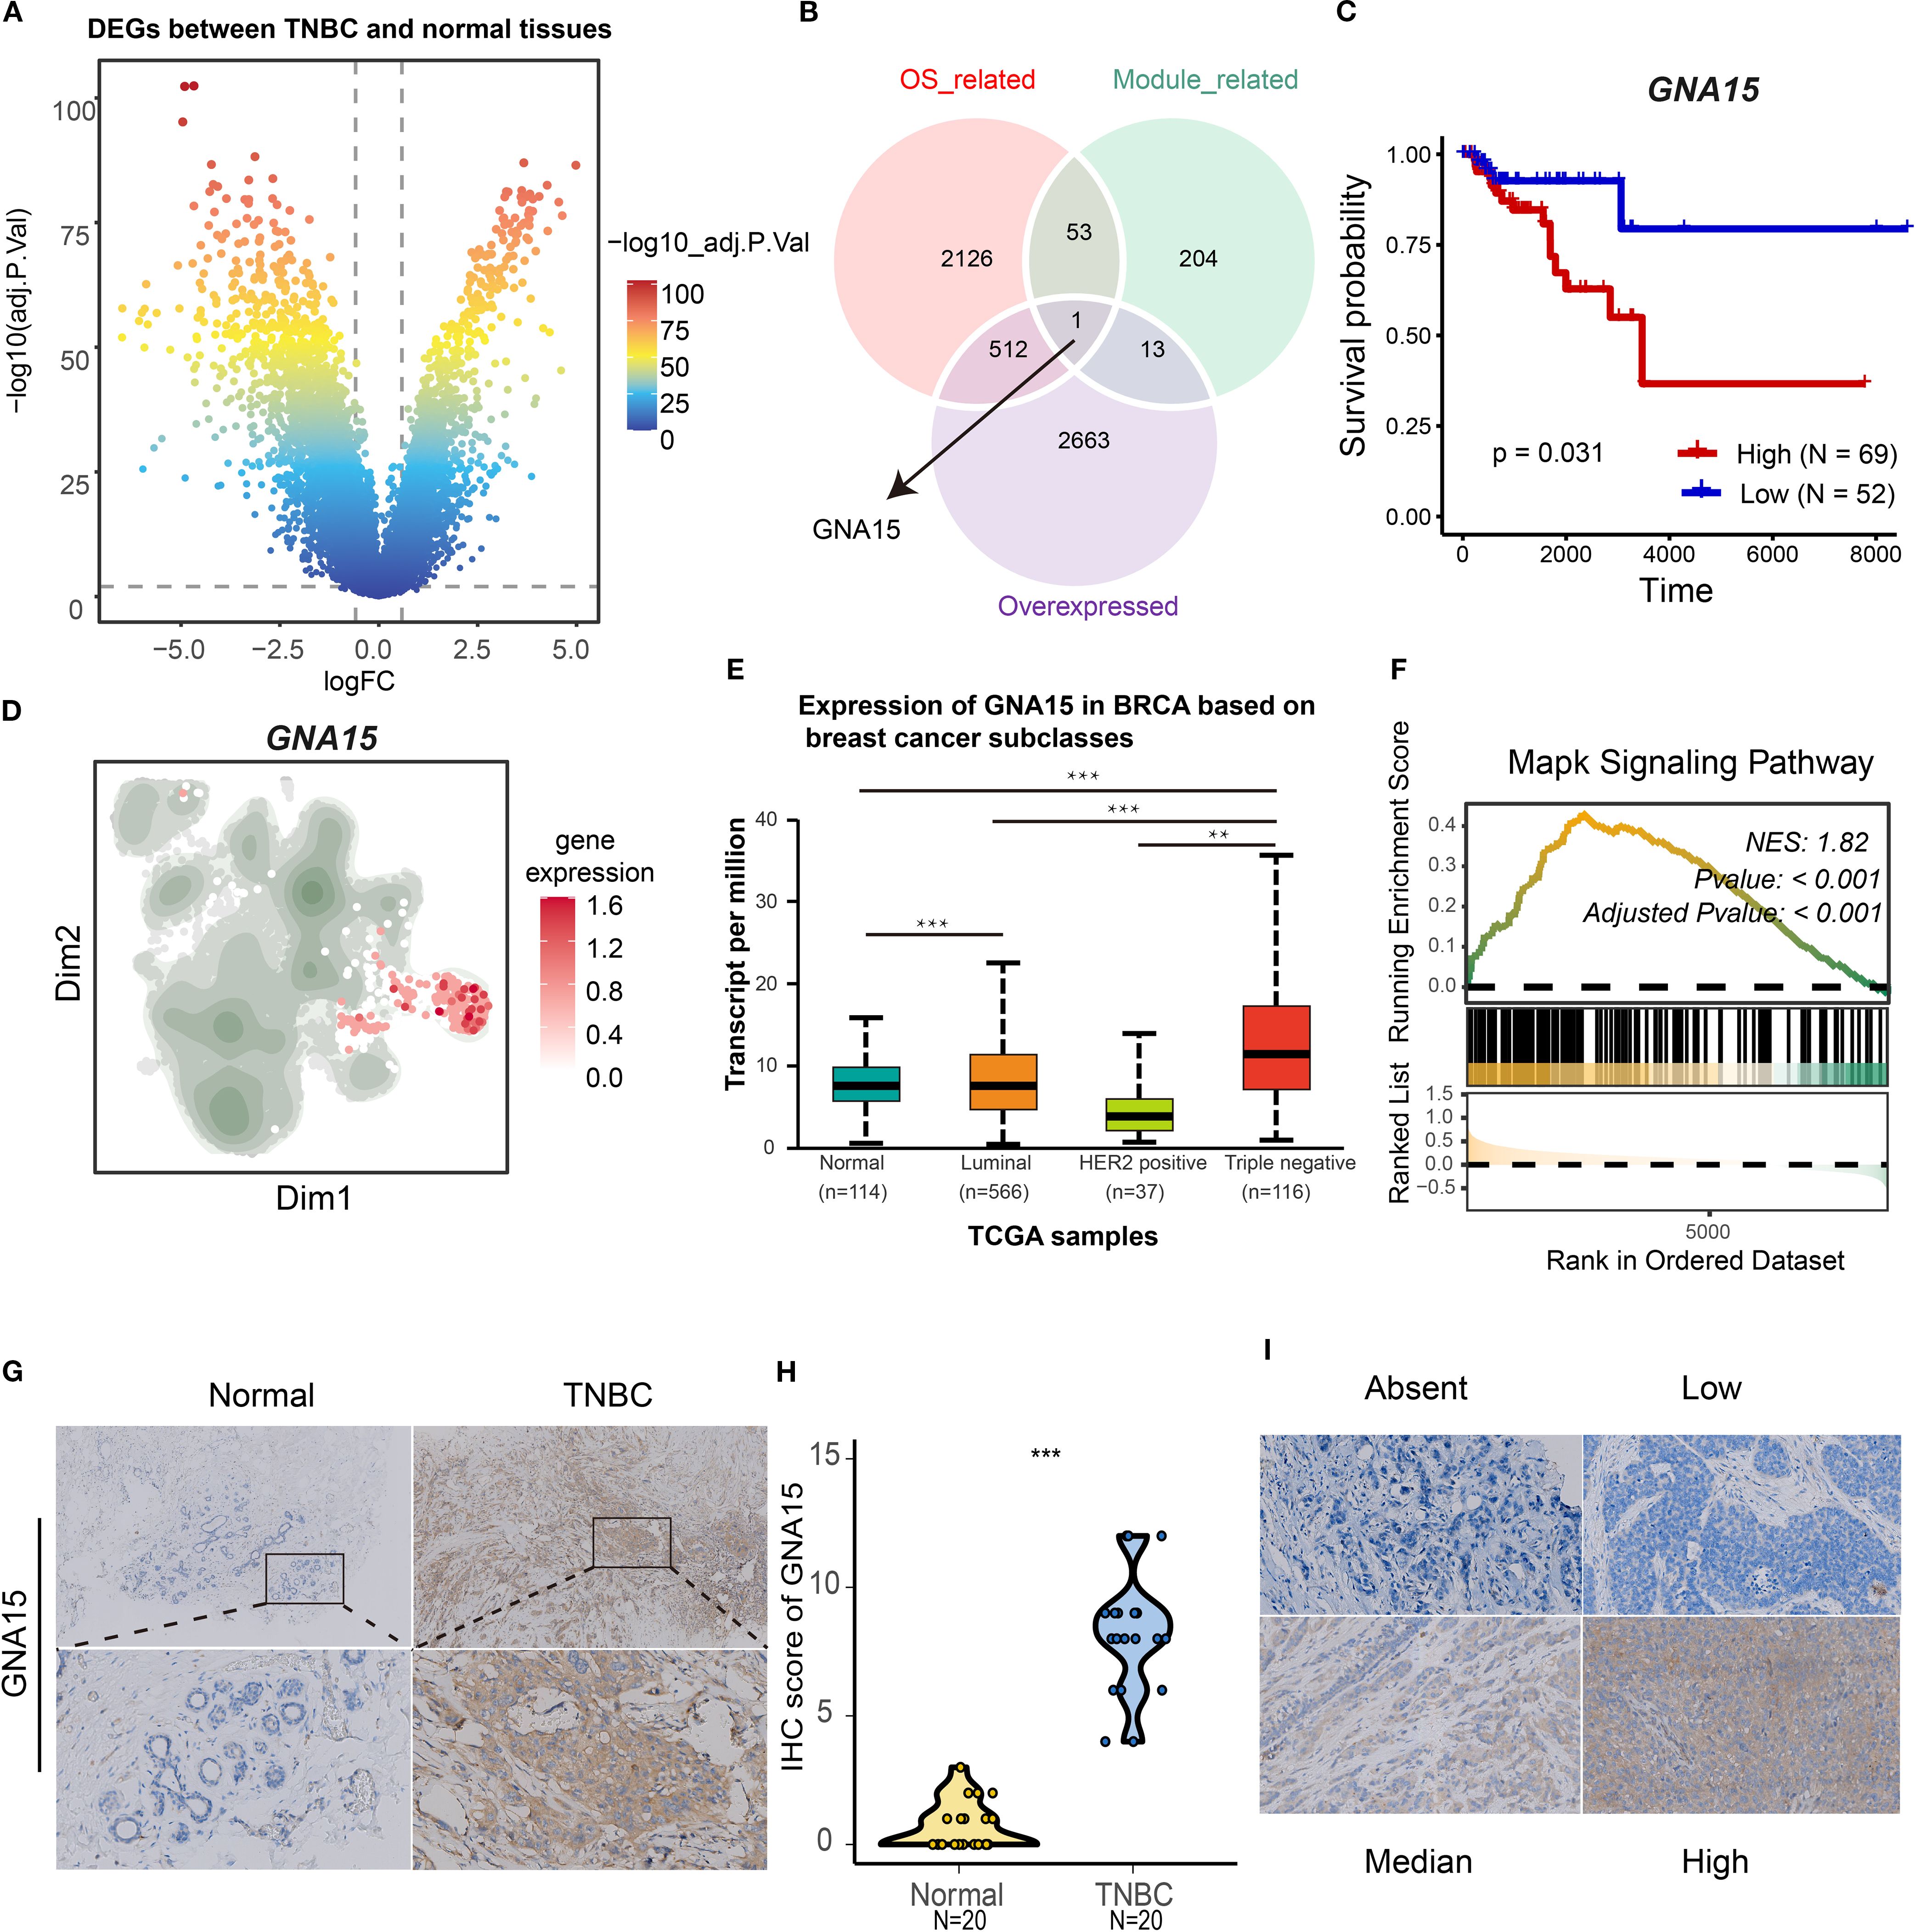
Figure 8. Identification of GNA15 as a core gene for S2 cluster. (A) Volcano map showing the differentially expressed genes between normal and TNBC patients based on TGCA-BRCA cohort. (B) The Venn plot showing the intersection of overexpressed genes, overall survival-associated genes, and module genes (malignant 3 and 9). (C) The K-M curves showing the overall survival rate of high and low GNA15 groups in TNBC. (D) The expression level of GNA15 in tumor clusters. (E) The boxplot showing the mRNA expression level of GNA15 in distinct breast cancer types and normal breast tissues. (F) GSEA plot showing the enrichment of MAPK signaling pathways associated with high expression level of GNA15. (G, H) The protein expression level of GNA15 in 20 paired TNBC tissues was detected by IHC, and the scores of IHC staining were obtained. ***p < 0.001. (I) The standard score of IHC staining. TNBC, triple-negative breast cancer; GSEA, gene set enrichment analysis; IHC, immunohistochemistry.
Downregulation of GNA15 suppresses proliferation, migration, and invasion of TNBC cells
To further elucidate the biological role of GNA15, we conducted cell functional assays. Initial assessment by RT–qPCR confirmed elevated GNA15 expression in TNBC cell lines (CAL-51 and MDA-MB-231), consistent with prior findings (Figure 9A). Using three specific siRNAs targeting GNA15, we identified two candidates that significantly reduced mRNA expression (Figure 9B). Subsequent CCK-8 and colony formation assays demonstrated that GNA15 knockdown dramatically suppressed proliferative capacity and compromised malignant phenotypes in TNBC cells (Figures 9C, D). Furthermore, GNA15 depletion substantially attenuated invasion rates in both cell lines (Figure 9E), while migration assays revealed significantly reduced migratory capacity in knockdown groups versus controls (Figures 9F, G). Considering the significant role of GNA15, we screened potential drugs for TNBC patients with high expression of GNA15 (Supplementary Figure S5). Taken together, these findings demonstrate that GNA15 critically regulates TNBC proliferation, migration, and invasion.
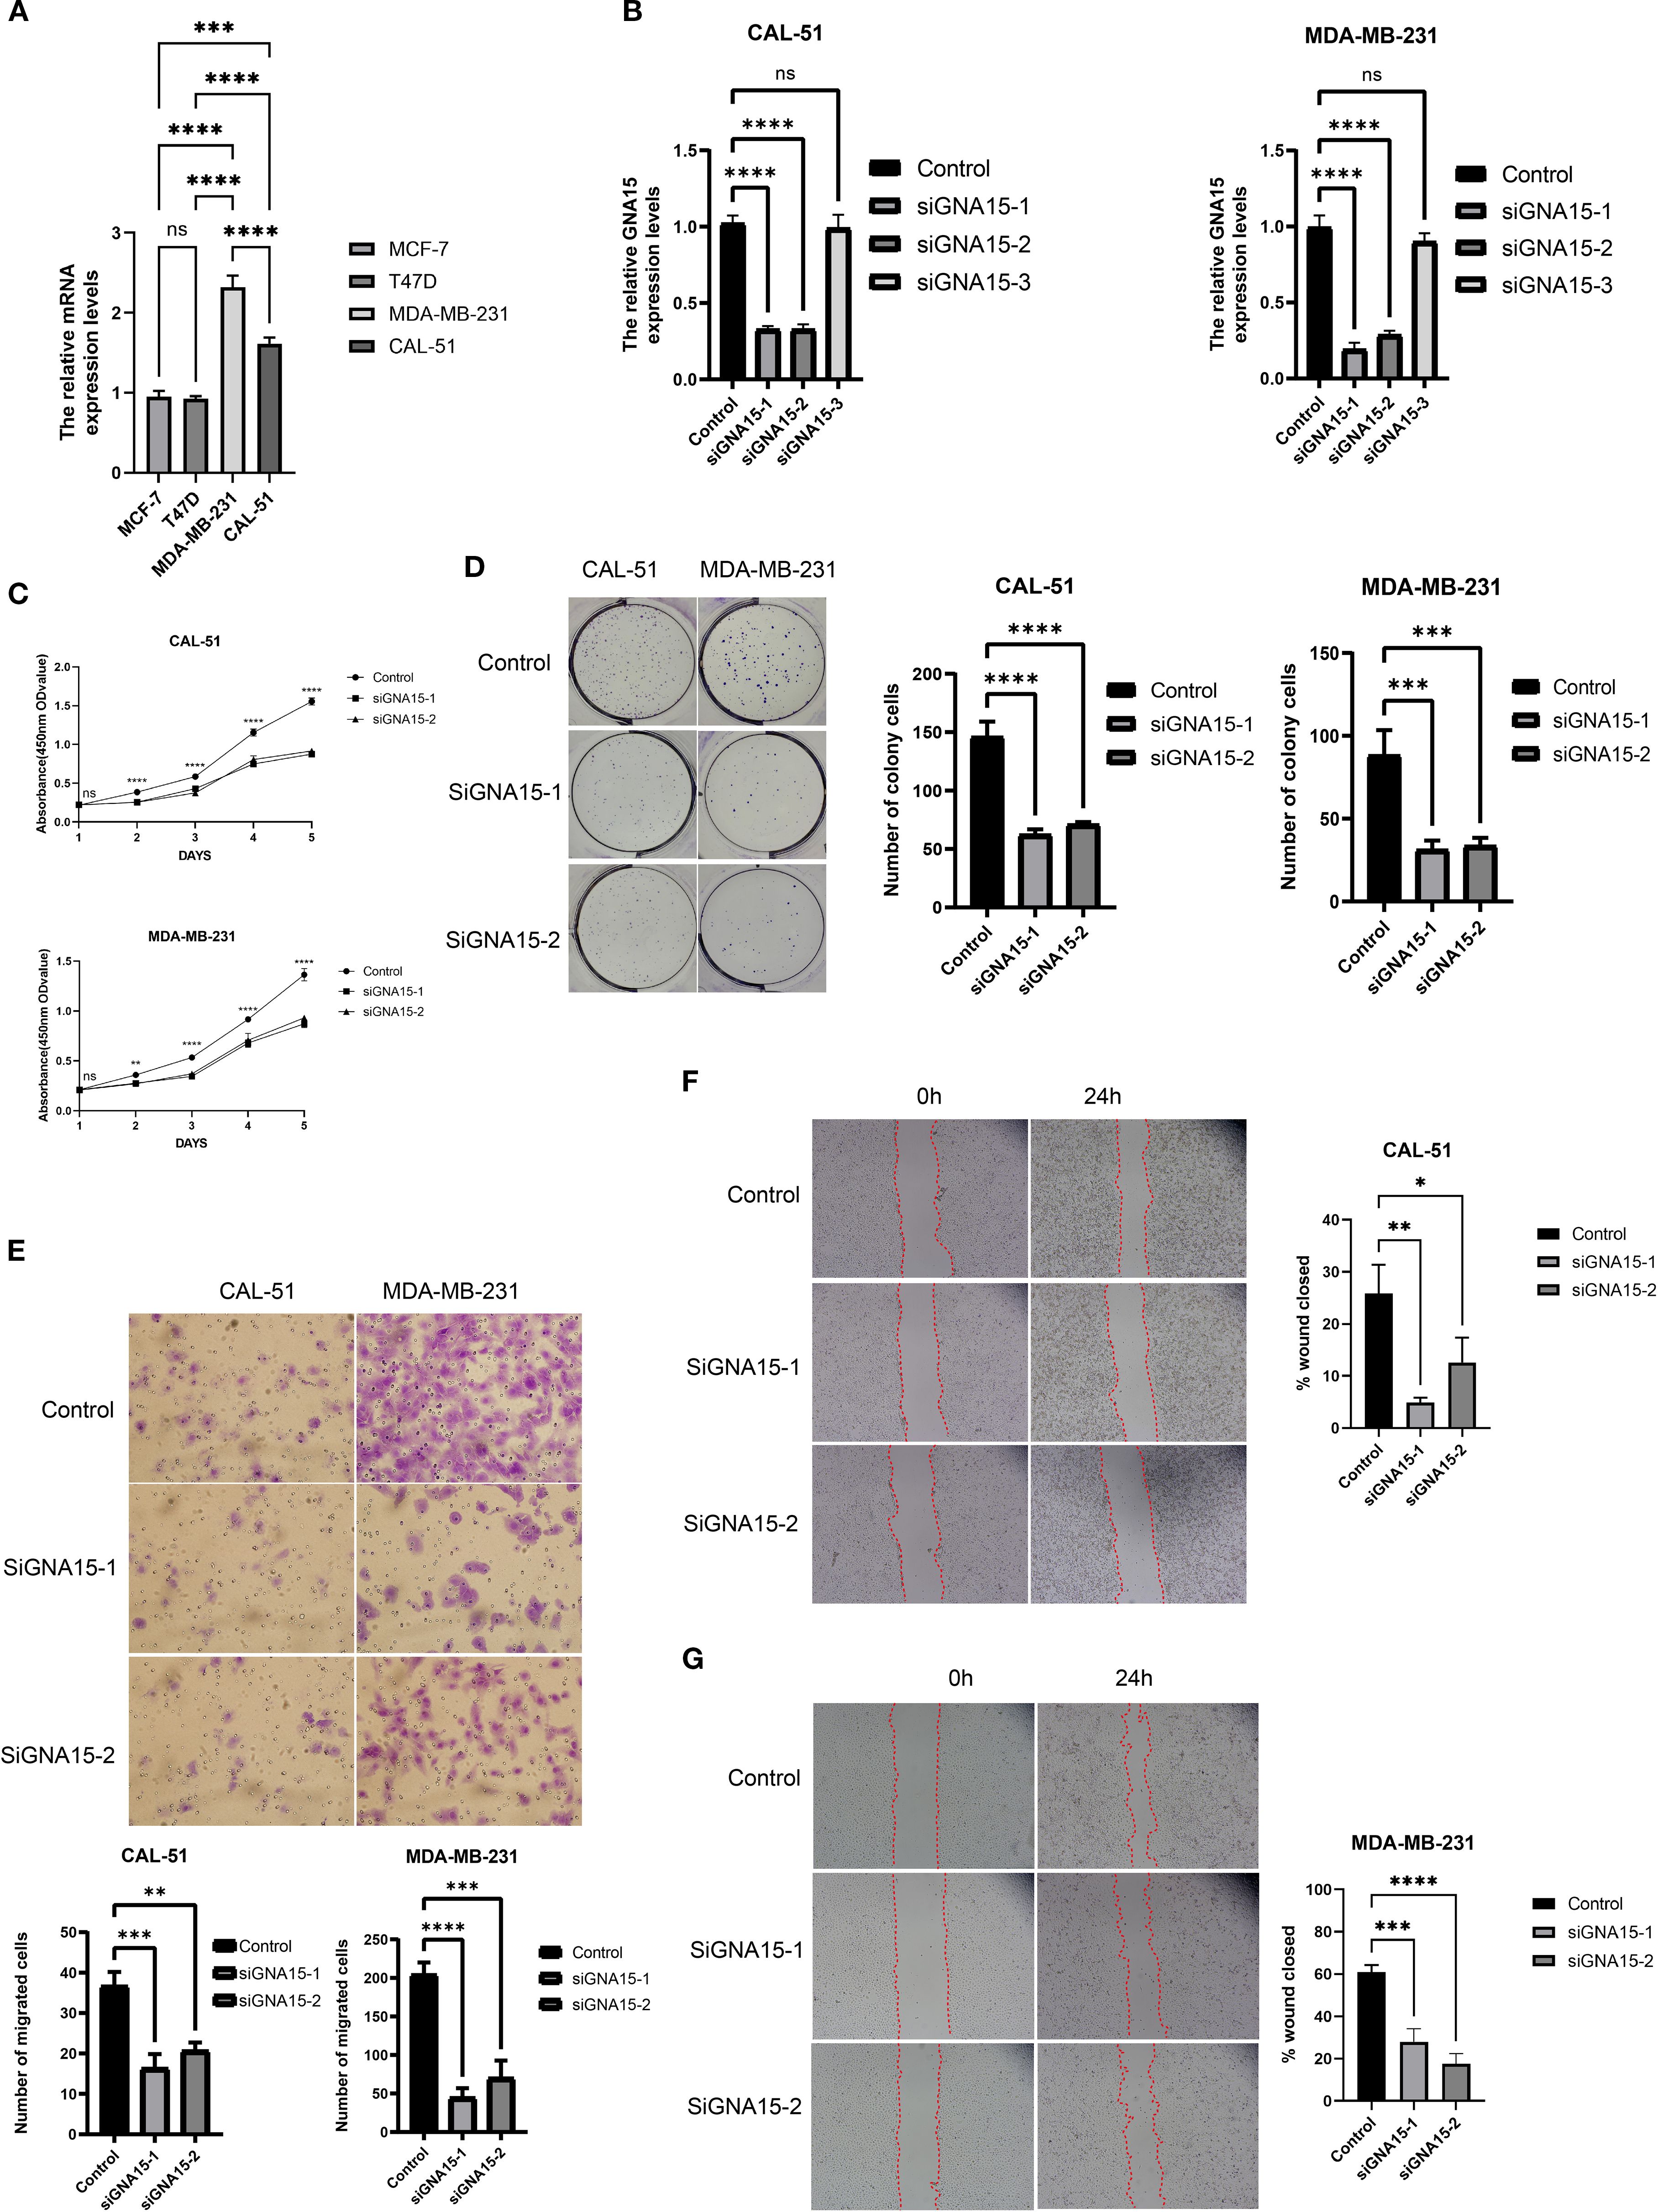
Figure 9. GNA15 was required for cell proliferation, migration, and invasion. (A) The mRNA level of GNA15 was detected by RT–qPCR in breast cancer cell lines. (B) The efficiency of siRNAs was detected by RT–qPCR in CAL-51 and MDA-MB-231. (C, D) The cell proliferation assays were conducted, including CCK-8 (C) and colony formation assay (D). (E–G) The invasion and migration assays were performed, including Transwell assay (E) and scratch assay (F, G). ns, no significance; *p < 0.05; **p < 0.01; ***p < 0.001; ****p < 0.0001.
Discussion
Tumor heterogeneity is pervasive, driving differential therapeutic responses even within histologically uniform cancers (38). This heterogeneity stems from diverse origins—including cellular ontogeny, microenvironmental component infiltration, and aberrant intercellular communication (39). Triple-negative breast cancer, as the subtype of breast cancer with the poorest prognosis, displays more extensive tumor heterogeneity than hormone receptor-positive and HER2-positive breast cancer (7). Consequently, elucidating the mechanistic basis of TNBC heterogeneity is essential for personalized therapeutic strategies. Recent advances in single-cell sequencing and novel analytical frameworks have created unprecedented opportunities to resolve cellular heterogeneity and microenvironmental signaling dynamics (21, 22, 40). In this study, we employed multi-scale data, including single-cell and bulk RNA sequencing, to comprehensively delineate the extensive heterogeneity among tumor clusters. To the best of our knowledge, this constitutes the first identification of a tumor progression-associated cluster characterized by GNA15 overexpression in TNBC.
Research on TNBC heterogeneity dates back over a decade. Recent classifications delineate four principal TNBC subtypes: immunomodulatory (IM), luminal androgen receptor (LAR), mesenchymal-like (MES), and basal-like immune-suppressive (BLIS) (9). Prognostically, IM subtypes demonstrate favorable outcomes, while MES subtypes exhibit poor survival—consistent with our findings where the S3 cluster aligned with IM characteristics and showed improved prognosis. The significant signaling pathways, including interferon-gamma (41), TNF-alpha (42), and IL6-JAK-STAT3 (43), were reported to correlate with immunomodulatory approaches in the tumor microenvironment and were highly enriched in the S3 cluster. Concurrently, we identified the aggressive S2 cluster as a trajectory endpoint exhibiting mesenchymal characteristics: epithelial–mesenchymal transition, angiogenesis, and MYC target activation. Complementary GO and KEGG analyses confirmed the enrichment of the top 50 markers of the S2 cluster in cell growth, ECM–receptor interactions, and focal adhesion, collectively indicating a mesenchymal-like phenotype. While our single-cell clusters partially recapitulate established transcriptomic subtypes, we further observed divergent cell-cycle regulatory programs: one driven by MYC/p53 signaling and another by the E2F/G2M pathways. Notably, androgen-sensitive and basal subtypes were not distinctly segregated at single-cell resolution, suggesting fundamental differences between tissue-level heterogeneity and cellular heterogeneity. All in all, our study provides a new theoretical basis for revealing the heterogeneity of TNBC.
Given the adverse prognostic effect of S2, we decided to further investigate the underlying reasons driving its malignant features. The lineage plasticity of tumors has been proven to prompt tumor cells to adapt to the external environment and change accordingly, thereby enhancing their survival ability (34). In consideration of this, we mapped the potential lineage trajectories of the cells, and the results confirmed that the S2 cluster may have evolved through the lineage of tumor subgroups. However, multiple determinants contribute to perturbations in tumor cell biological activities and infiltrative heterogeneity. We sought to further elucidate the origin of malignant features and the invasive biological behavior of the S2 cluster from the perspective of the tumor microenvironment. Cell–cell interaction analyses demonstrated that the S2 cluster, acting as a receptor, displayed the strongest reception of ligand signals emanating from CAFs. Receptors involved in the FN1 and collagen pathways were significantly overexpressed in the S2 cluster. Receptors, including CD44 (44), SDC4 (37), and ITGA2 (45), have been confirmed to be upstream molecules of malignant pathways. These findings revealed that the S2 cluster may be modulated by CAFs to further exhibit aggressive biological behaviors. Targeting the interaction molecules between CAFs and the S2 cluster may be a potential approach for the treatment of TNBC.
We further interrogated the co-expression gene network of the S2 cluster and identified GNA15 as a critical hub gene. Herein, we report, for the first time, the role of GNA15 in driving tumor progression in breast cancer, with in vitro experiments validating the findings of our bioinformatics analyses. While the molecular mechanism underlying GNA15 action awaits further experimental validation, published studies lend support to our results. Zanini et al. (46) found that downregulation of GNA15 inhibited cell proliferation in the small intestinal neuroendocrine neoplasia cell line and was associated with ERK, NF-kappaB, and Akt pathway signaling. Additionally, GNA15 has been reported to facilitate the malignant development of thyroid carcinoma and acute myeloid leukemia via the MAPK signaling pathway (47, 48). Moreover, Innamorati et al. (49) found that GNA15 could serve as a biomarker for early-stage pancreatic ductal adenocarcinoma. Several studies have also implicated GNA15 in promoting tumor drug resistance. Luo et al. (50) confirmed that GNA15 induces drug resistance in B-cell acute lymphoblastic leukemia via AMPK signaling. Li et al. (51) observed that GNA15 was upregulated in cisplatin-resistant ovarian cancer cells. Our results revealed that knockdown of GNA15 expression impairs the proliferation, invasion, and migration of triple-negative breast cancer cell lines. Bioinformatics analyses further indicated that GNA15 is associated with the MAPK signaling pathway. Collectively, these findings identify GNA15 as a hub gene for the S2 cluster and a potential therapeutic target for TNBC. In summary, single-cell and transcriptome data identified that the S2 subgroup affects the poor prognosis of triple-negative breast cancer, suggesting that the S2 subgroup may serve as a future therapeutic target for triple-negative breast cancer. Its infiltration abundance may serve as a potential indicator for monitoring the disease progression of triple-negative breast cancer. As the core gene of the S2 subgroup, GNA15, targeting this molecule or combining it with other breast cancer treatments in the future will provide more possible therapeutic strategies for triple-negative breast cancer.
Although this study comprehensively analyzed the heterogeneity of TNBC tumor cells by combining multiomics analysis and in vitro experiments, there are still some limitations. First, the limited number of bulk RNA samples may lead to analytical bias. More publicly available data would be incorporated to formally analyze the universality of the results. Second, the deconvolution algorithm was used to infer the prognosis of tumor subpopulations, which may not fully and accurately reflect the cell infiltration level of tumor subpopulations. Also, the p-values of survival analyses (the S2 and S3 clusters) are relatively borderline. Further multicenter studies are needed to confirm the prognostic role of the S2 cluster and GNA15. Third, the molecular mechanism of GNA15 has not yet been confirmed. We plan to conduct in vivo and in vitro experiments (Western blotting, Co-Immunoprecipitation (CO-IP), mass spectrometry, etc.) in the subsequent research to further explain the regulatory relationship between GNA15 and the MAPK signaling pathway.
Conclusions
Our study comprehensively elucidates the extensive heterogeneity among TNBC tumor cells, encompassing transcription factors, meta-programs, cell lineage evolution, cell communication, co-expression networks, and prognostic profiles. Most notably, we identified that GNA15, the core gene of the poor prognosis-associated S2 subgroup, drives the progression of TNBC. These findings deepen our understanding of TNBC heterogeneity and lay a theoretical foundation for the development of therapeutic strategies for TNBC.
Data availability statement
The datasets presented in this study can be found in online repositories. The names of the repository/repositories and accession number(s) can be found in the article/Supplementary Material.
Ethics statement
The studies involving humans were approved by Ethical Committee of Tianjin Medical University Cancer Institute and Hospital. The studies were conducted in accordance with the local legislation and institutional requirements. The participants provided their written informed consent to participate in this study.
Author contributions
GW: Conceptualization, Writing – original draft, Writing – review & editing. JC: Data curation, Writing – original draft, Writing – review & editing. CL: Formal Analysis, Investigation, Methodology, Writing – original draft. YC: Data curation, Formal Analysis, Methodology, Validation, Writing – original draft. SW: Data curation, Methodology, Writing – original draft. ZIC: Investigation, Writing – original draft. ZHC: Funding acquisition, Writing – original draft. YL: Funding acquisition, Writing – original draft. YY: Conceptualization, Writing – original draft, Writing – review & editing. YT: Conceptualization, Funding acquisition, Writing – original draft, Writing – review & editing. XW: Conceptualization, Funding acquisition, Investigation, Methodology, Writing – original draft, Writing – review & editing.
Funding
The author(s) declare financial support was received for the research and/or publication of this article. This work was supported by the National Natural Science Foundation of China (Grant Nos. 82304025, 82303857, 82403020, and 82172835).
Acknowledgments
The authors would like to thank the GEO, UALCAN, and TCGA databases for the availability of the data. Also, they thank the “home-for-researchers” database for creating Figure 1 (OYOOP7f786).
Conflict of interest
The authors declare that the research was conducted in the absence of any commercial or financial relationships that could be construed as a potential conflict of interest.
Generative AI statement
The author(s) declare that no Generative AI was used in the creation of this manuscript.
Any alternative text (alt text) provided alongside figures in this article has been generated by Frontiers with the support of artificial intelligence and reasonable efforts have been made to ensure accuracy, including review by the authors wherever possible. If you identify any issues, please contact us.
Publisher’s note
All claims expressed in this article are solely those of the authors and do not necessarily represent those of their affiliated organizations, or those of the publisher, the editors and the reviewers. Any product that may be evaluated in this article, or claim that may be made by its manufacturer, is not guaranteed or endorsed by the publisher.
Supplementary material
The Supplementary Material for this article can be found online at: https://www.frontiersin.org/articles/10.3389/fimmu.2025.1659183/full#supplementary-material
Abbreviations
TNBC, triple-negative breast cancer; GNA15, G Protein Subunit Alpha 15; CNV, copy number variation; IHC, immunohistochemistry; GSEA, gene set enrichment analysis; ER, estrogen receptor; PR, progesterone receptor; HER2, human epidermal growth factor receptor 2; TCGA, The Cancer Genome Atlas; GEO, Gene Expression Omnibus; scRNA-seq, single-cell RNA sequencing; ECM, extracellular matrix; CAFs, cancer-associated fibroblasts; GO, Gene Ontology; KEGG, Kyoto Encyclopedia of Genes and Genomes; MPs, metaprograms.
References
1. Siegel RL, Giaquinto AN, and Jemal A. Cancer statistics, 2024. CA Cancer J Clin. (2024) 74:12–49. doi: 10.3322/caac.21820
2. Siegel RL, Kratzer TB, Giaquinto AN, Sung H, and Jemal A. Cancer statistics, 2025. CA Cancer J Clin. (2025) 75:10–45. doi: 10.3322/caac.21871
3. Nolan E, Lindeman GJ, and Visvader JE. Deciphering breast cancer: from biology to the clinic. Cell. (2023) 186:1708–28. doi: 10.1016/j.cell.2023.01.040
4. Xiong X, Zheng LW, Ding Y, Chen YF, Cai YW, Wang LP, et al. Breast cancer: pathogenesis and treatments. Signal Transduct Target Ther. (2025) 10:49. doi: 10.1038/s41392-024-02108-4
5. Loibl S, Poortmans P, Morrow M, Denkert C, and Curigliano G. Breast cancer. Lancet. (2021) 397:1750–69. doi: 10.1016/S0140-6736(20)32381-3
6. Derakhshan F and Reis-Filho JS. Pathogenesis of triple-negative breast cancer. Annu Rev Pathol. (2022) 17:181–204. doi: 10.1146/annurev-pathol-042420-093238
7. So JY, Ohm J, Lipkowitz S, and Yang L. Triple negative breast cancer (TNBC): Non-genetic tumor heterogeneity and immune microenvironment: Emerging treatment options. Pharmacol Ther. (2022) 237:108253. doi: 10.1016/j.pharmthera.2022.108253
8. Bianchini G, De Angelis C, Licata L, and Gianni L. Treatment landscape of triple-negative breast cancer - expanded options, evolving needs. Nat Rev Clin Oncol. (2022) 19:91–113. doi: 10.1038/s41571-021-00565-2
9. Jiang YZ, Ma D, Suo C, Shi J, Xue M, Hu X, et al. Genomic and transcriptomic landscape of triple-negative breast cancers: subtypes and treatment strategies. Cancer Cell. (2019) 35:428–40.e425. doi: 10.1016/j.ccell.2019.02.001
10. Lehmann BD, Bauer JA, Sanders ME, Chakracarthy AB, Shyr Y, Pietenpol JA, et al. Identification of human triple-negative breast cancer subtypes and preclinical models for selection of targeted therapies. J Clin Invest. (2011) 121:2750–67. doi: 10.1172/JCI45014
11. Jovic D, Liang X, Zeng H, Lin L, Xu F, Luo Y, et al. Single-cell RNA sequencing technologies and applications: A brief overview. Clin Transl Med. (2022) 12:e694. doi: 10.1002/ctm2.694
12. Ding S, Chen X, and Shen K. Single-cell RNA sequencing in breast cancer: Understanding tumor heterogeneity and paving roads to individualized therapy. Cancer Commun (Lond). (2020) 40:329–44. doi: 10.1002/cac2.12078
13. Savas P, Virassamy B, Ye C, Salim A, Mintoff CP, Caramia F, et al. Single-cell profiling of breast cancer T cells reveals a tissue-resident memory subset associated with improved prognosis. Nat Med. (2018) 24:986–93. doi: 10.1038/s41591-018-0078-7
14. Zhang Y, Chen H, Mo H, Zhao N, Sun X, Liu B, et al. Distinct cellular mechanisms underlie chemotherapies and PD-L1 blockade combinations in triple-negative breast cancer. Cancer Cell. (2025) 43:446–63.e447. doi: 10.1016/j.ccell.2025.01.007
15. Karaayvaz M, Cristea S, Gillespie SM, Patel AP, Mylvaganam R, Luo CC, et al. Unravelling subclonal heterogeneity and aggressive disease states in TNBC through single-cell RNA-seq. Nat Commun. (2018) 9:3588. doi: 10.1038/s41467-018-06052-0
16. Colaprico A, Silva TC, Olsen C, Garofano L, Cava C, Garolini D, et al. TCGAbiolinks: an R/Bioconductor package for integrative analysis of TCGA data. Nucleic Acids Res. (2016) 44:e71. doi: 10.1093/nar/gkv1507
17. Hao Y, Stuart T, Kowalski MHChoudhary S, Hoffman P, and Hartman A. Dictionary learning for integrative, multimodal and scalable single-cell analysis. Nat Biotechnol. (2024) 42:293–304. doi: 10.1038/s41587-023-01767-y
18. McGinnis CS, Murrow LM, and Gartner ZJ. DoubletFinder: doublet detection in single-cell RNA sequencing data using artificial nearest neighbors. Cell Syst. (2019) 8:329–37.e324. doi: 10.1016/j.cels.2019.03.003
19. Korsunsky I, Millard N, Fan J, Slowikowski K, Zhang F, Wei K, et al. Fast, sensitive and accurate integration of single-cell data with Harmony. Nat Methods. (2019) 16:1289–96. doi: 10.1038/s41592-019-0619-0
20. Hu C, Li T, Xu Y, Zhang X, Li F, Bai J, et al. CellMarker 2.0: an updated database of manually curated cell markers in human/mouse and web tools based on scRNA-seq data. Nucleic Acids Res. (2023) 51:D870–6. doi: 10.1093/nar/gkac947
21. Wang G, Wang S, Song W, Lu C, Chen Z, He L, et al. Integrating multi-omics data reveals the antitumor role and clinical benefits of gamma-delta T cells in triple-negative breast cancer. BMC Cancer. (2025) 25:623. doi: 10.1186/s12885-025-14029-8
22. Wang G, Shi C, He L, Li Y, Song W, Chen Z, et al. Identification of the tumor metastasis-related tumor subgroups overexpressed NENF in triple-negative breast cancer by single-cell transcriptomics. Cancer Cell Int. (2024) 24:319. doi: 10.1186/s12935-024-03505-z
23. Hamamoto R, Takasawa K, Machino H, Kobayashi K, Takahashi S, Bolatkan A, et al. Application of non-negative matrix factorization in oncology: one approach for establishing precision medicine. Brief Bioinform. (2022) 23(4):bbac246. doi: 10.1093/bib/bbac246
24. Andreatta M and Carmona SJ. UCell: Robust and scalable single-cell gene signature scoring. Comput Struct Biotechnol J. (2021) 19:3796–8. doi: 10.1016/j.csbj.2021.06.043
25. Zhang F, Li X, and Tian W. Unsupervised inference of developmental directions for single cells using VECTOR. Cell Rep. (2020) 32:108069. doi: 10.1016/j.celrep.2020.108069
26. Newman AM, Liu CL, Green MR, Gentles AJ, Feng W, Xu Y, et al. Robust enumeration of cell subsets from tissue expression profiles. Nat Methods. (2015) 12:453–7. doi: 10.1038/nmeth.3337
27. Morabito S, Reese F, Rahimzadeh N, Miyoshi E, and Swarup V. hdWGCNA identifies co-expression networks in high-dimensional transcriptomics data. Cell Rep Methods. (2023) 3:100498. doi: 10.1016/j.crmeth.2023.100498
28. Jin S, Guerrero-Juarez CF, Zhang L, Chang I, Ramos R, Kuan CH, et al. Inference and analysis of cell-cell communication using CellChat. Nat Commun. (2021) 12:1088. doi: 10.1038/s41467-021-21246-9
29. Ritchie ME, Phipson B, Wu D, Hu Y, Law CW, Shi W, et al. limma powers differential expression analyses for RNA-sequencing and microarray studies. Nucleic Acids Res. (2015) 43:e47. doi: 10.1093/nar/gkv007
30. Yu G, Wang LG, Han Y, and He QY. clusterProfiler: an R package for comparing biological themes among gene clusters. OMICS. (2012) 16:284–7. doi: 10.1089/omi.2011.0118
31. Chandrashekar DS, Karthikeyan SK, Korla PK, Patel H, Shovon AR, Athar M, et al. UALCAN: An update to the integrated cancer data analysis platform. Neoplasia. (2022) 25:18–27. doi: 10.1016/j.neo.2022.01.001
32. Polyak K. Breast cancer: origins and evolution. J Clin Invest. (2007) 117:3155–63. doi: 10.1172/JCI33295
33. Turner KM, Yeo SK, Holm TM, Shaughnessy E, and Guan JL. Heterogeneity within molecular subtypes of breast cancer. Am J Physiol Cell Physiol. (2021) 321:C343–54. doi: 10.1152/ajpcell.00109.2021
34. Quintanal-Villalonga A, Chan JM, Yu HA, Pe'er D, Sawyers CL, Sen T, et al. Lineage plasticity in cancer: a shared pathway of therapeutic resistance. Nat Rev Clin Oncol. (2020) 17:360–71. doi: 10.1038/s41571-020-0340-z
35. Yang Y, Jin X, Xie Y, Ning C, Ai Y, Wei H, et al. The CEBPB(+) glioblastoma subcluster specifically drives the formation of M2 tumor-associated macrophages to promote Malignancy growth. Theranostics. (2024) 14:4107–26. doi: 10.7150/thno.93473
36. Zhao P, Damerow MS, Stern P, Liu AH, Sweet-Cordero A, Siziopikou K, et al. CD44 promotes Kras-dependent lung adenocarcinoma. Oncogene. (2013) 32:5186–90. doi: 10.1038/onc.2012.542
37. Cui C, Pan Y, Zhang C, Zhu D, Xuan Y, Hao P, et al. Eltrombopag binds SDC4 directly and enhances MAPK signaling and macropinocytosis in cancer cells. Am J Cancer Res. (2022) 12:2697–710.
38. Mayer IA, Abramson VG, Lehmann BD, and Pietenpol JA. New strategies for triple-negative breast cancer–deciphering the heterogeneity. Clin Cancer Res. (2014) 20:782–90. doi: 10.1158/1078-0432.CCR-13-0583
39. Finger AM, Hendley AM, Figueroa D, Gonzalez H, and Weaver VM. Tissue mechanics in tumor heterogeneity and aggression. Trends Cancer. (2025) 11(8):806–24. doi: 10.1016/j.trecan.2025.04.004
40. Chen Z, Yang C, Wang J, Wang B, He L, Liu Z, et al. Integrating of radiomics and single-cell transcriptomics uncovers the crucial role of gammadelta T cells in lung adenocarcinoma. J Cancer. (2025) 16:1167–80. doi: 10.7150/jca.105586
41. Yu R, Zhu B, and Chen D. Type I interferon-mediated tumor immunity and its role in immunotherapy. Cell Mol Life Sci. (2022) 79:191. doi: 10.1007/s00018-022-04219-z
42. Qu Y, Zhao G, and Li H. Forward and reverse signaling mediated by transmembrane tumor necrosis factor-alpha and TNF receptor 2: potential roles in an immunosuppressive tumor microenvironment. Front Immunol. (2017) 8:1675. doi: 10.3389/fimmu.2017.01675
43. Johnson DE, O’Keefe RA, and Grandis JR. Targeting the IL-6/JAK/STAT3 signalling axis in cancer. Nat Rev Clin Oncol. (2018) 15:234–48. doi: 10.1038/nrclinonc.2018.8
44. Ouhtit A, Rizeq B, Saleh HA, Rahman MM, and Zayed H. Novel CD44-downstream signaling pathways mediating breast tumor invasion. Int J Biol Sci. (2018) 14:1782–90. doi: 10.7150/ijbs.23586
45. Ren D, Zhao J, Sun Y, Li D, Meng Z, Wang B, et al. Overexpressed ITGA2 promotes Malignant tumor aggression by up-regulating PD-L1 expression through the activation of the STAT3 signaling pathway. J Exp Clin Cancer Res. (2019) 38:485. doi: 10.1186/s13046-019-1496-1
46. Zanini S, Giovinazzo F, Alaimo D, Lawrence B, Pfragner R, Bassi C, et al. GNA15 expression in small intestinal neuroendocrine neoplasia: functional and signalling pathway analyses. Cell Signal. (2015) 27:899–907. doi: 10.1016/j.cellsig.2015.02.001
47. Li M, Liu Y, Liu Y, Yang L, Xu Y, Wang W, et al. Downregulation of GNA15 inhibits cell proliferation via P38 MAPK pathway and correlates with prognosis of adult acute myeloid leukemia with normal karyotype. Front Oncol. (2021) 11:724435. doi: 10.3389/fonc.2021.724435
48. Sun Y and Han Y. GNA15 facilitates the Malignant development of thyroid carcinoma cells via the BTK-mediated MAPK signaling pathway. Histol Histopathol. (2024) 39:1217–27. doi: 10.14670/HH-18-714
49. Innamorati G, Wilkie TM, Malpeli G, Paiella S, Grasso S, Rusev B, et al. Galpha15 in early onset of pancreatic ductal adenocarcinoma. Sci Rep. (2021) 11:14922. doi: 10.1038/s41598-021-94150-3
50. Luo J, Pan S, Luo J, Wang L, Yin J, Zhao H, et al. GNA15 induces drug resistance in B cell acute lymphoblastic leukemia by promoting fatty acid oxidation via activation of the AMPK pathway. Mol Cell Biochem. (2025) 480:3719–33. doi: 10.1007/s11010-024-05198-4
Keywords: triple-negative breast cancer, scRNA-seq, tumor microenvironment, GNA15, heterogeneity
Citation: Wang G, Cao J, Lu C, Cao Y, Wang S, Chen Z, Chen Z, Li Y, Yu Y, Tian Y and Wang X (2025) Multiomics profiling identifies the poor prognostic role of a tumor cluster with GNA15 overexpression in triple-negative breast cancer. Front. Immunol. 16:1659183. doi: 10.3389/fimmu.2025.1659183
Received: 03 July 2025; Accepted: 29 August 2025;
Published: 22 September 2025.
Edited by:
Wei Wang, Nanjing Medical University, ChinaReviewed by:
Zhengrui Li, Shanghai Jiao Tong University, ChinaHongyan Lu, Southern Medical University, China
Yun Ding, Fujian Provincial Hospital, China
Copyright © 2025 Wang, Cao, Lu, Cao, Wang, Chen, Chen, Li, Yu, Tian and Wang. This is an open-access article distributed under the terms of the Creative Commons Attribution License (CC BY). The use, distribution or reproduction in other forums is permitted, provided the original author(s) and the copyright owner(s) are credited and that the original publication in this journal is cited, in accordance with accepted academic practice. No use, distribution or reproduction is permitted which does not comply with these terms.
*Correspondence: Yue Yu, eXV5dWVAdG11LmVkdS5jbg==; Yao Tian, dGlhbnlhb0B0bXUuZWR1LmNu; Xin Wang, d2FuZ3hpbkB0am11Y2guY29t
†These authors have contributed equally to this work