 Xia Zhang
 Qiu-Yue Han
 Jian-Gang Zhang
 Wei-Hua Yan
 Aifen Lin
- 1Biological Resource Center, Taizhou Hospital of Zhejiang Province, Wenzhou Medical University, Linhai, Zhejiang, China
- 2Key Laboratory of HLA-G Research and Development of Taizhou, Taizhou Hospital of Zhejiang Province, Wenzhou Medical University, Linhai, Zhejiang, China
- 3Key Laboratory of Minimally Invasive Techniques and Rapid Rehabilitation of Digestive System Tumor of Zhejiang Province, Taizhou Hospital of Zhejiang Province, Wenzhou Medical University, Linhai, Zhejiang, China
- 4Medical Research Center, Taizhou Hospital of Zhejiang Province, Wenzhou Medical University, Linhai, Zhejiang, China
Introduction: The concept that human leukocyte antigen-G (HLA-G) expression is specifically in various malignant lesions but absent in adjacent normal tissues has been well documented, and HLA-G is acknowledged as a novel immune checkpoint.
Methods: In this study, HLA-G expression in 523 gastric cancer (GC) lesions and 283 case-matched peritumoral tissues (PTTs) was analyzed by immunohistochemistry. The clinical significance of HLA-G expression in GC lesions and case-matched PTTs was evaluated, and a specific HLA-G-positive subpopulation in PTTs was identified.
Results: Data showed that HLA-G expression was significantly different between GC lesions (370/523, 70.7%) and PTTs (238/283, 84.1%; p<0.001). HLA-G in GC lesions was more frequently observed in older patients (76.2% vs. 65.3%, p=0.006), and HLA-G in PTTs was more commonly observed in female patients (92.0% vs. 80.5%, p=0.014). Survival analysis revealed that HLA-G expression in PTTs (overall survival: 42.0 months vs. 56.7 months, p=0.023), but not in GC lesions (52.1 months vs. 50.9 months, p=0.623), is significantly associated with poor prognosis. The fundic gland mucous neck cells were the only subpopulation that expressed HLA-G.
Discussion: Our findings, for the first time, suggest that fundic gland mucous neck cell HLA-G expression in PTTs is associated with GC progression.
Introduction
Human leukocyte antigen-G (HLA-G) expression was firstly evidenced in cytotrophoblasts in 1990, and that HLA-G rarely expressed in healthy adult tissues was well acknowledged (1, 2). To date, HLA-G expression has been observed only among few healthy tissues such as pancreatic islet β cells, erythroblasts, thymic medullary and subcapsular epithelium, and prostate gland tubule glandular epithelia and in glandular secretions (3–6). In contrast, aberrant HLA-G expression has been repeatedly observed in pathological conditions such as malignant lesions, virus-infected cells, and organ grafts (7–9).
Early studies revealed that HLA-G is an immune suppressor that is important to maintain the fetal–maternal immunotolerance during implantation and pregnancy (10). Regarding cancer, in 1998, it was first found that HLA-G expression is restricted to melanoma lesions, but not in adjacent normal skin tissues, and that HLA-G could inhibit NK cell function to enhance cancer immune evasion (11). Motivated by this finding, researchers evaluated HLA-G expression and its clinical relevance in more than 30 types of different pathological cancers. Most findings revealed that HLA-G expression was significantly associated with disease progression and poor survival of patients with cancer; however, the findings were not consistent among different studies or cancer types (12, 13).Mechanistically, through interactions with immune receptors such as ILT2, ILT4, and KIR2DL4, HLA-G could render multiple-level immune suppression function (14). Briefly, HLA-G could inhibit the cytotoxicity function of NK cell and CD8+ T cells, proliferation of CD4+ T cells, NK cells, and B cells, and differentiation and maturation of B cells and dendritic cells (15). Otherwise, HLA-G could also shift Th1 to Th2 immune response, increase the accumulation of MDSC and Treg, polarize M1 to M2 macrophages, and induce tolerogenic T cells, NK cells, and dendritic cells (14, 16).
Given its tumor-specific expression and immune inhibitory function and its anti-tumor efficacy further solidified by pre-clinical HLA-G-targeted in vitro and in vivo studies (17–21), HLA-G is expected to act as a promising immune checkpoint. In addition, HLA-G-targeted clinical trials for a wide range of advanced solid cancer immunotherapies have been evaluated since 2020 (https://clinicaltrials.gov/search?cond=HLA-G) (22).
While most previous studies have focused on the cancer itself and aberrant HLA-G expression has been repeatedly observed in various malignant lesions, few studies have reported weak or absent HLA-G expression in peritumoral tissues (PTTs) (6, 23). Whether HLA-G is expressed in PTTs and its clinical importance remain largely unknown. PTTs have distinct transcriptomic, proteomic, and biological behavioral features from the corresponding healthy tissues and cancer lesions (24, 25). Moreover, the clinical significance, such as prognostic and diagnostic values of biomarkers in PTTs, has been highlighted (26, 27).
In this study, HLA-G expression in 523 gastric cancer (GC) lesions and 283 case-matched PTTs was analyzed using immunohistochemistry (IHC), and the clinical significance of HLA-G expression in GC lesions and case-matched PTTs was evaluated. For the first time, we reported that HLA-G expression in PTTs is of obvious significance for the survival of patients with GC, that HLA-G expression is specifically restricted to mucous neck cells in PTTs and GC lesions, and that HLA-G expression in PTT, but not in GC lesions, is related to poor survival of GC patients.
Materials and methods
Tissue microarray
GC tissue microarrays (TMAs) were purchased from Shanghai Outdo Biotech Company (Shanghai, China). Patients underwent surgery between February 26, 2002 and September 4, 2009, and none of the patients underwent preoperative radiotherapy, chemotherapy, or other medical interventions. The clinicopathological characteristics of patients with GC, including age, sex, stage, tumor–node–metastasis (TNM) and American Joint Committee on Cancer (AJCC) stage, follow-up data, and survival information, were recorded and archived at the National Engineering Center for Biochip. The disease stage classification of patients with GC was based on the 7th AJCC Cancer Staging System (28). PTT samples were collected >5 cm from the margin of the tumor, and no metastatic specimens were included.
In total, 561 primary GC samples and 289 case-matched PTTs were included in the TMAs. After IHC staining, 38 cases and six PTT samples were detached from the TMA. Ultimately, 523 GC and 283 case-matched PTT samples were included in this study. The median age of the cohort was 63 years (range: 28–89 years). Among the 523 patients with GC (nmale=353, nfemale=170), 49, 148, 297, and 25 had AJCC stage I, II, III, and IV, respectively. The latest follow-up was completed in July 2015, at an average follow-up of 40.7 months. Patient overall survival was calculated from the date of surgery to the date of the event or the latest follow-up.
Furthermore, to explore the HLA-G-expressing subpopulation of gastric cells, six PTT samples for Western blot and additional four PTTs and two GC lesions (formalin-fixed paraffin-embedded) for multiplex immunohistochemistry (mIHC) were obtained from the Biological Resource Center, National Human Genetic Resources Platform of China (YCZYPT, 2017), Taizhou Hospital of Zhejiang Province, for IHC and multiplex IHC (mIHC) staining. Written informed consent was obtained from each participant. The study was approved by the Ethics Committee of Shanghai Outdo Biotech Company and the Ethics Committee of Taizhou Hospital of Zhejiang Province, China (K20240907) and was conducted in accordance with the principles of the Declaration of Helsinki.
Immunohistochemistry
The TMAs were deparaffinized and rehydrated, and antigens were retrieved by microwaving in sodium citrate buffer (10 mmol/L, pH6.0). HLA-G expression was detected using immunohistochemistry (IHC). TMA slides were incubated with anti-HLA-G mAb 4H84 (1:500, Exbio, CZ) and then incubated with a horseradish peroxidase (HRP)-conjugated rabbit/mouse secondary antibody (1:100, Dako, Glostrup, Denmark). IHC staining was performed using a Dako EnVision kit (Dako, Glostrup, Denmark). HLA-G expression was imaged by using 3DHistech (Budapest, Hungary). IHC was performed as described in our previous study (29). The percentage of HLA-G expression was evaluated using 3DHistech and then reviewed by two blinded observers. The percentage of HLA-G-positive cells was calculated by cell counting but irrespective of staining intensity among the GC lesions and PTTs. A percentage of HLA-G of at least 5% was considered positive (30).
Multiplex immunohistochemistry
In contrast to most previous studies reporting that HLA-G is absent in adjacent non-tumorous tissues or PTTs (7), our study observed that HLA-G expression was present in PTTs, which was further confirmed by Western blot with anti-HLA-G mAb 4H84 (39 KD, 1:1,000, Exbio, CZ) and anti-HLA-A,B,C,E mAb TP25.99SF (45 KD 1:1,000, Exbio, CZ) in six samples to discriminate the HLA-G expression from HLA-I antigens.
Moreover, our results showed that HLA-G expression was restricted to the fundic glands of the PTTs. However, the subpopulations of cells expressing HLA-G remain unclear. To define the HLA-G-positive subpopulation of cells in the gastric glands of PTTs and GC lesions, we performed multiplex immunohistochemistry (mIHC) staining on four PTTs (HLA-G positive by IHC) and two GC lesions (one HLA-G positive and one HLA-G negative by IHC). The gastric gland chief cell-specific marker PGA3/Pepsinogen I and mucous neck cell-specific marker MUC6/Mucin6 were used to identify the cell subpopulation expressing HLA-G by mIHC, in accordance with previous studies (31, 32).
mIHC staining was performed on 4-µm-thick, formalin-fixed, paraffin-embedded sections using a Bas Multiplex IHC Kit (Alpha X Beijing Biotech Co., Ltd., China). The staining procedure was performed according to the manufacturer’s protocol. Briefly, section slides were incubated at 60°C for 1 h, dewaxed, and hydrated, and antigens were retrieved using a Bas antigen retrieval solution (1:50, Alpha X Beijing Biotech Co., Ltd., China) in a microwave oven and blocked with 2% bovine serum albumin. Subsequently, the slides were incubated with the first primary anti-HLA-G mouse mAb 4H84 (1:200, 100 μL, Exbio, CZ) at 37°C for 1 h. They were washed three times with Tris-buffered saline with Tween 20 (TBST) and then incubated with the HRP-conjugated anti-rabbit/mouse secondary antibody (1:100, Dako, Glostrup, Denmark) at 37°C for 10 min. The slides were washed three times with TBST and incubated with a fluorophore solution (1:100, Bas Texas Red) in BAS signal amplification reagent (Alpha X Beijing Biotech Co., Ltd., China). The same procedure was repeated with the following primary antibodies: mouse mAb MUC6 (1:200, NBP2-44376, Novus Biologicals, USA) and rabbit Ab PGA3 (1:200, NBP2-54730, Novus Biologicals, USA). The fluorophore solution for mAb MUC6 was Bas Cy3 (1:100) and that for Ab PGA3 was Bas FITC (1:100). The slides were then incubated with the Bas DAPI working solution at room temperature for 5 min and finally with the mounting fluorescence quenching solution. The slides were imaged on a Zeiss Confocal Microscope LSM 800 with Airyscan (Carl Zeiss Microscopy, Germany), and the images were analyzed using ZEN (blue edition) software (Carl Zeiss Microscopy GmbH). The images were captured using the following emission/excitation wavelengths: 358/461 (DAPI), 588/616 (Texas Red), 494/525 (FITC), and 550/570 (Cy3).
Statistical analysis
Chi-square test was performed to analyze the association of HLA-G expression status in PTTs and GC lesions with patient clinicopathological parameters. Kaplan–Meier method and log-rank test were performed to evaluate the relevance of PTTs and GC HLA-G expression status and clinicopathological parameters in the survival of patients with GC. Statistically significant parameters for survival were analyzed for hazard ratios (HR) using the Cox proportional hazards model. All statistical analyses and plotting were performed using IBM SPSS Statistics version 25 (IBM Corp., USA). Statistical significance was set at p<0.05.
Results
Clinical relevance of HLA-G expression in GC lesions and PTTs
Both membrane and plasmatic HLA-G expressions were observed in GC lesions and PTTs, with variations in the positive percentages of HLA-G-expressing cells and staining intensity among samples. The percentages of HLA-G expression range from negative to 99%, with a mean of 56% for GC lesions (n=523) and from negative to 99%, with a mean of 66% for PTT tissues (n=283, p<0.001; Supplementary Figure S1). The HLA-G expression was further confirmed by Western blot in six PTT samples (Supplementary Figure S2), showing that mAb4H84 is specific for HLA-G detection. IHC staining also showed that HLA-G expression was restricted to the gastric glands in GC lesions and PTTs (Figure 1). Positive HLA-G expression was significantly more frequent in PTTs; positive HLA-G expression was observed in 70.7% (370/523) of GC lesions and 84.1% (238/283) of PTTs (p<0.001). Among the GC lesions, HLA-G expression was frequently observed in older patients (76.2% vs. 65.3%, p=0.006). Among PTTs, HLA-G expression was significantly associated with female sex (92.0% vs. 80.5%, p=0.014) and AJCC stages (p=0.043), whereas HLA-G expression was much higher in patients with GC of advanced AJCC stages (77.6% in AJCCI+II vs. 87.4% in AJCCIII+IV, p=0.031). No statistically significant association was observed between HLA-G expression status and pT, pN, and pM stages (Table 1).
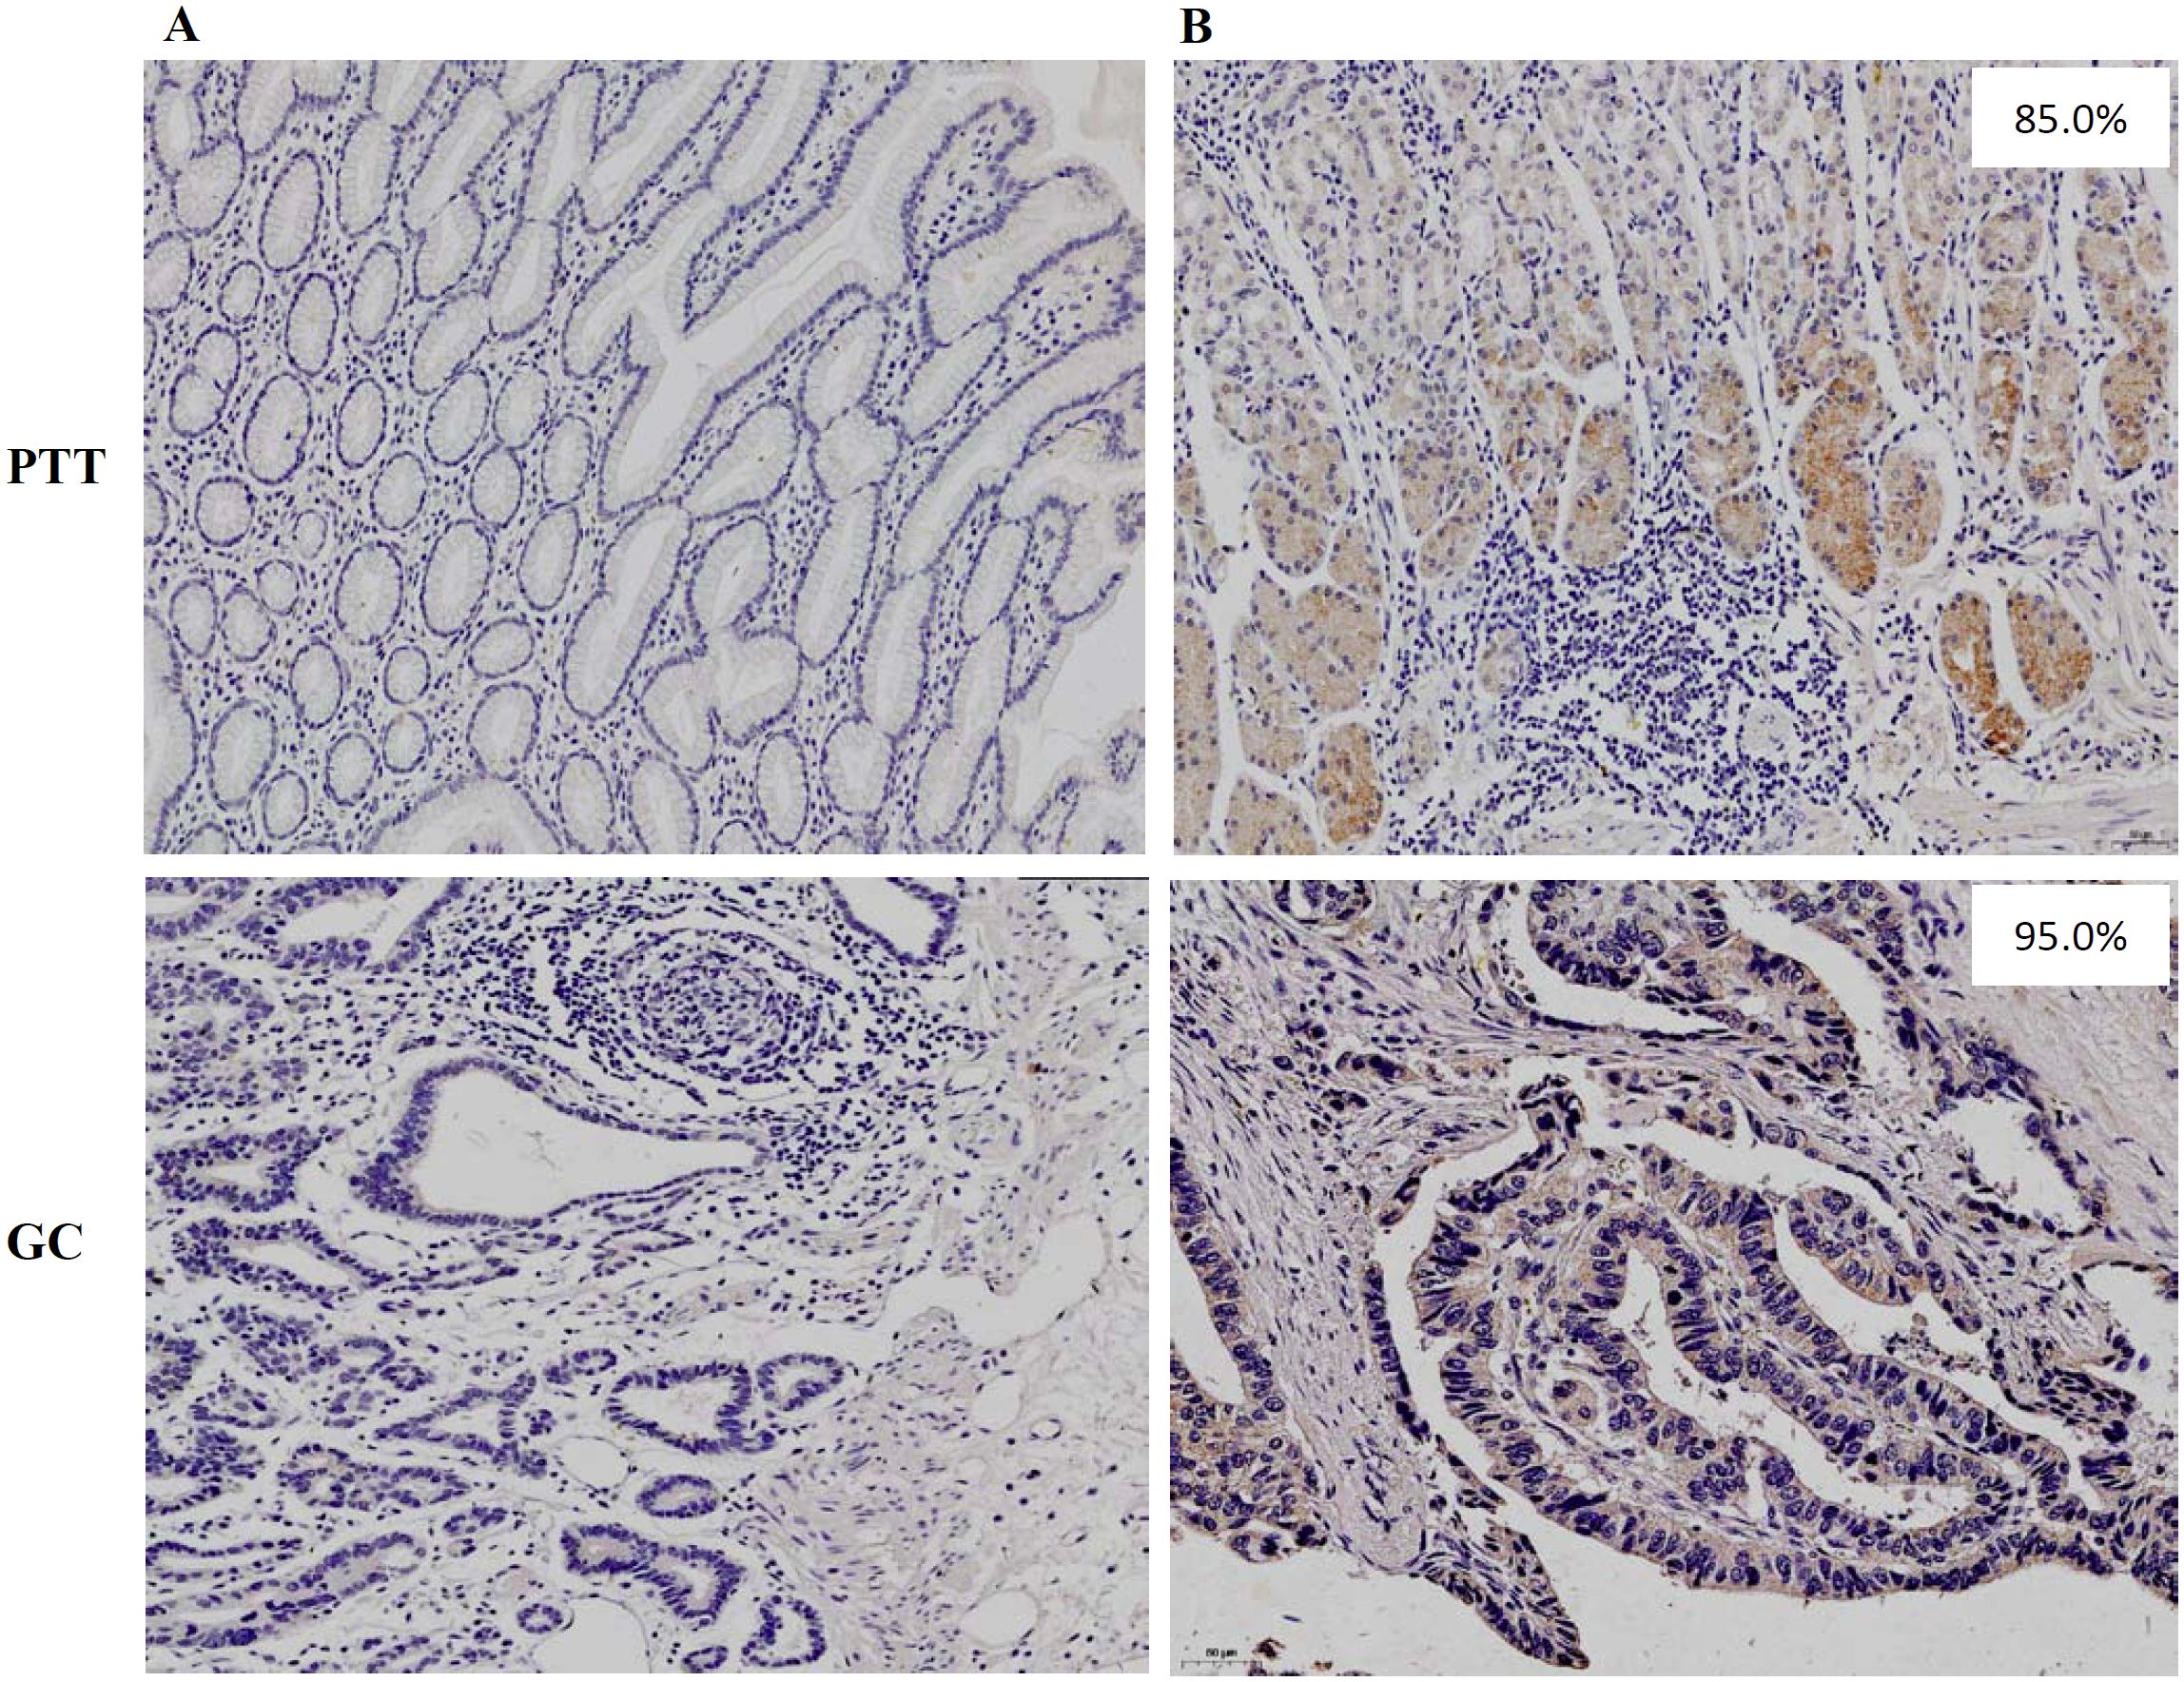
Figure 1. Immunohistochemistry staining of (A) negative HLA-G expression and (B) positive HLA-G expression in PTT and GC lesions, respectively (×100; mAb 4H84 1:500).
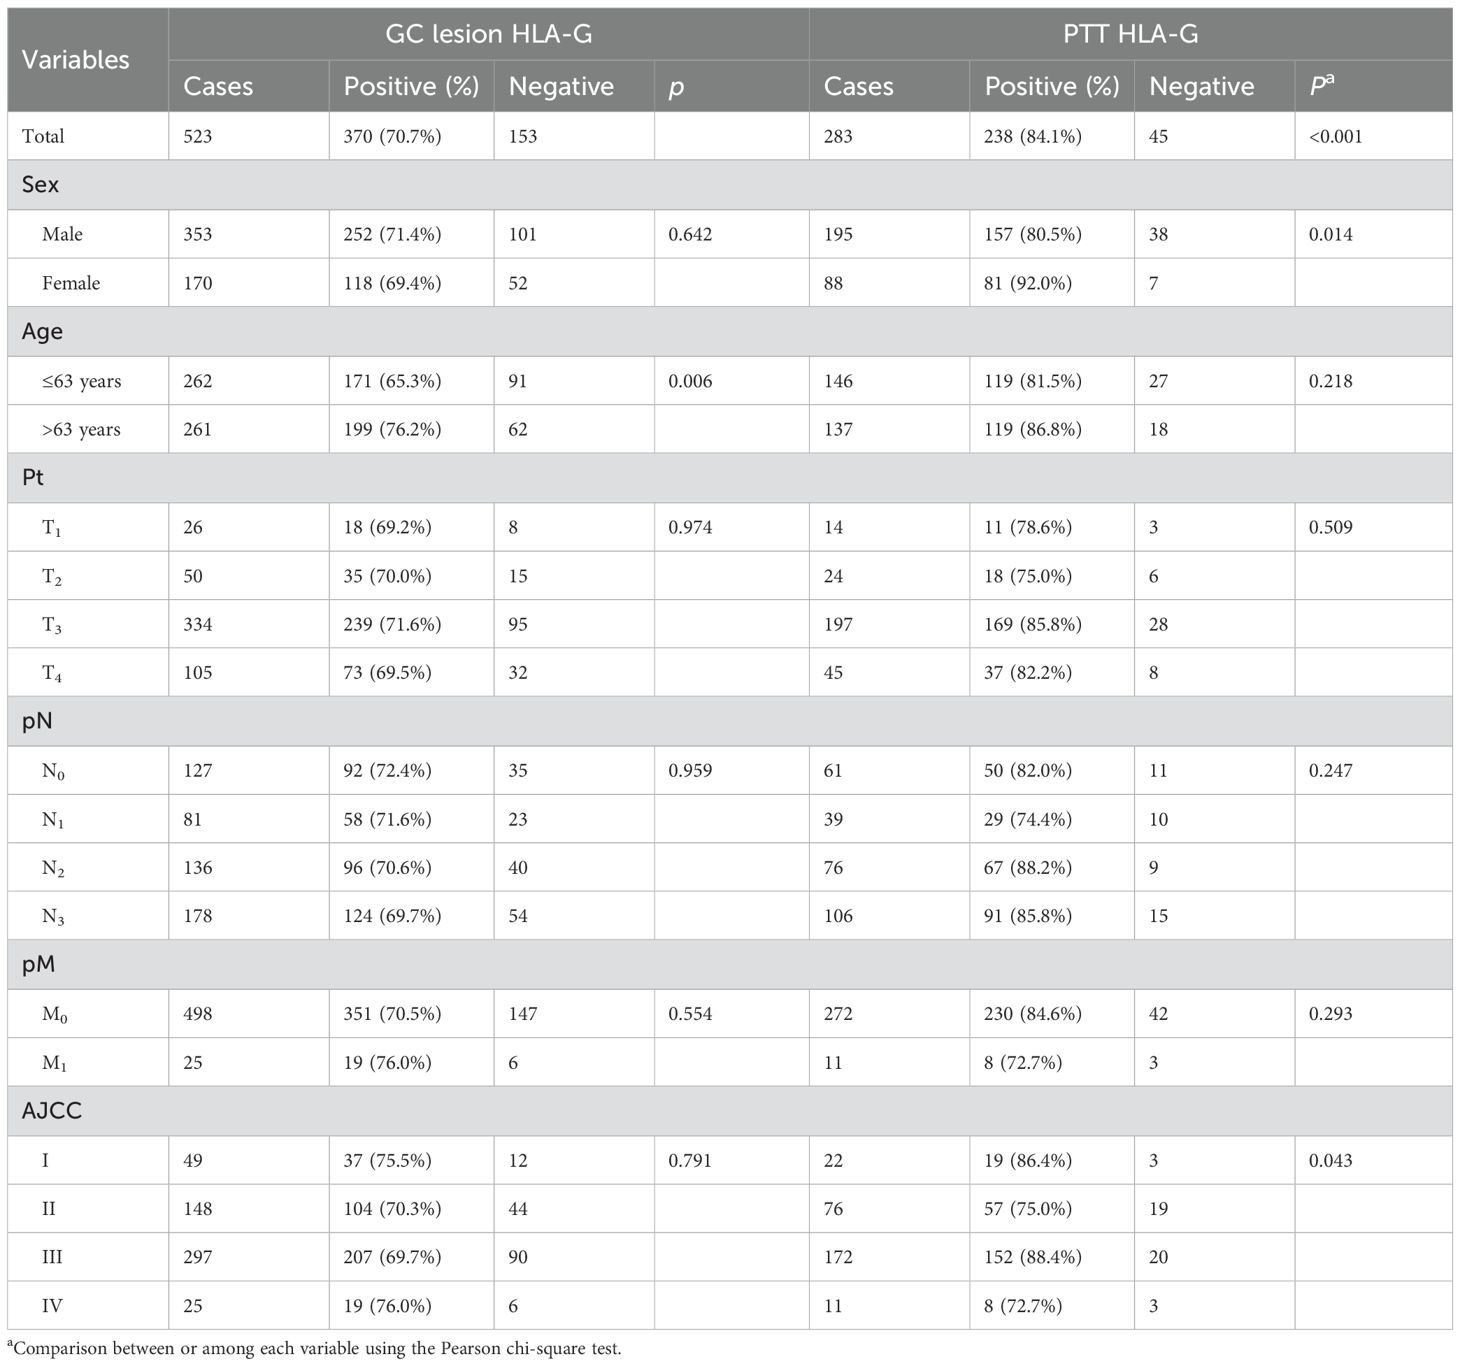
Table 1. Relevance of HLA-G expression in GC lesion and PTT tissue with clinical variables.
Prognostic significance of HLA-G expression in GC lesions and PTTs
The prognostic significance of HLA-G expression status in GC lesions and PTTs and clinicopathological parameters in the survival of patients with GC was analyzed using Kaplan–Meier method and log-rank test. The results (Table 2) showed that the HLA-G expression status in PTTs was significantly associated with the survival of patients with GC, with those having HLA-G-negative PTTs demonstrating longer survival than those with HLA-G-positive PTTs (56.7 months vs. 42.0 months, p=0.023; Figure 2A). However, HLA-G-negative and HLA-G-positive status in GC lesions was not significantly associated with the survival of patients with GC (50.9 months vs. 52.1 months, p=0.623; Figure 2B). Among other clinical parameters, advanced clinical stages, including pT, pN, pM, and AJCC stages, were significantly associated with worse survival (all p<0.001). No statistically significant differences were found for sex (p=0.079) or age (p=0.081) in the survival of patients with GC.
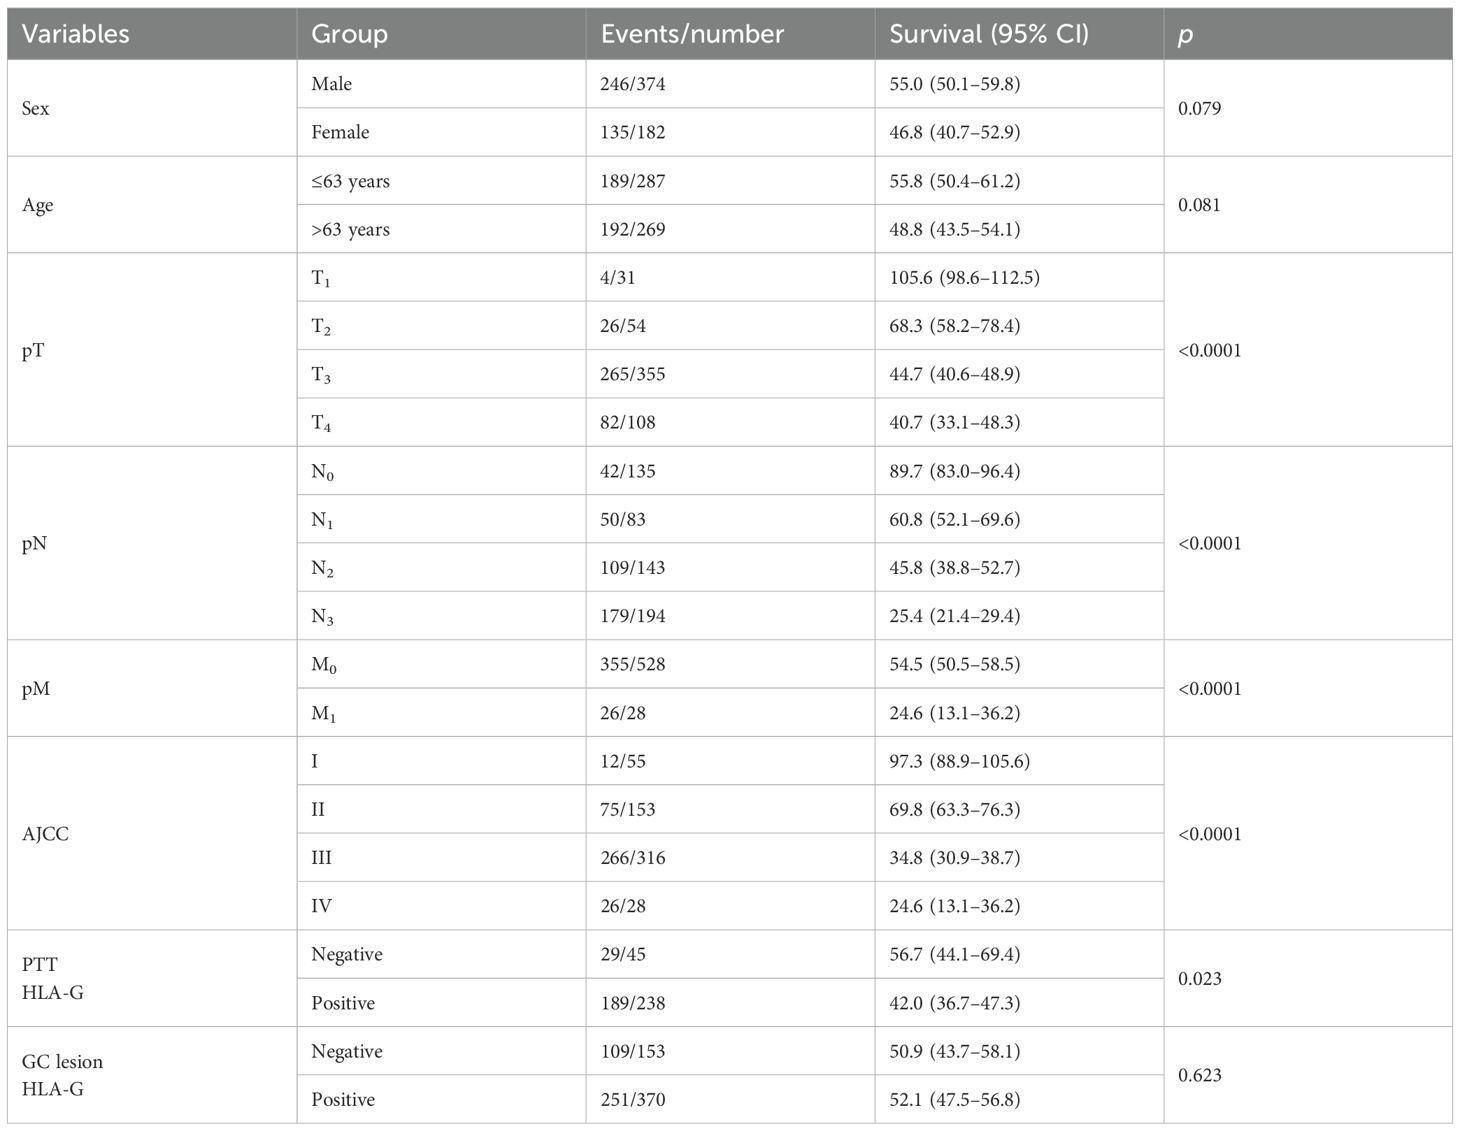
Table 2. Log-rank analysis for the significance of the clinical variables in the survival of GC patients.
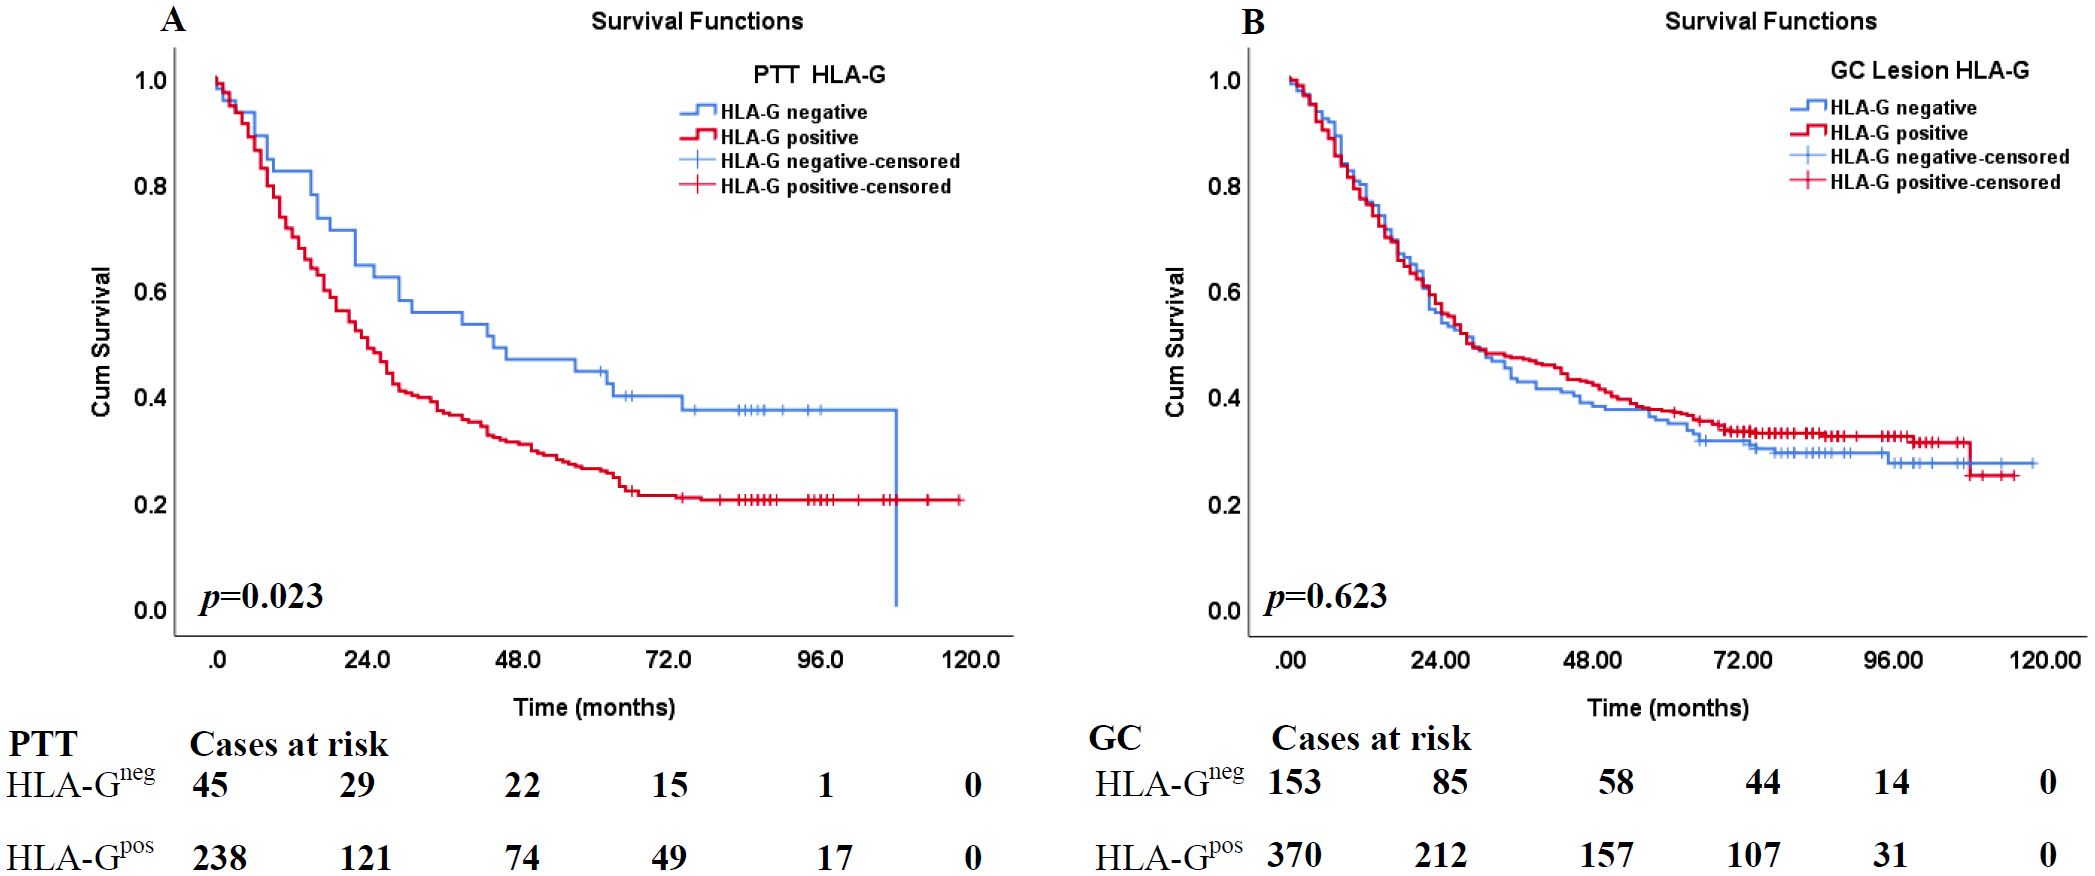
Figure 2. Kaplan–Meier analysis of HLA-G expression in PPT and GC lesions for the survival of GC patients. (A) Comparison of overall survival between HLA-G-negative and HLA-G-positive expression in PPT for CRC patients (p=0.023). (B) Comparison of overall survival between HLA-G -negative and HLA-G-positive expression in GC tumor lesions for CRC patients (p=0.523).
Furthermore, among the 271 case-matched GC lesions and PTTs with available HLA-G expression status, similar results were obtained. HLA-G-negative status in PTTs was associated with significantly longer survival than HLA-G-positive status (57.7 months vs. 41.2 months, p=0.014). Moreover, HLA-G-negative and HLA-G-positive status in GC lesions, respectively, was not significantly associated with the survival of patients with GC (p=0.289; Table 3).
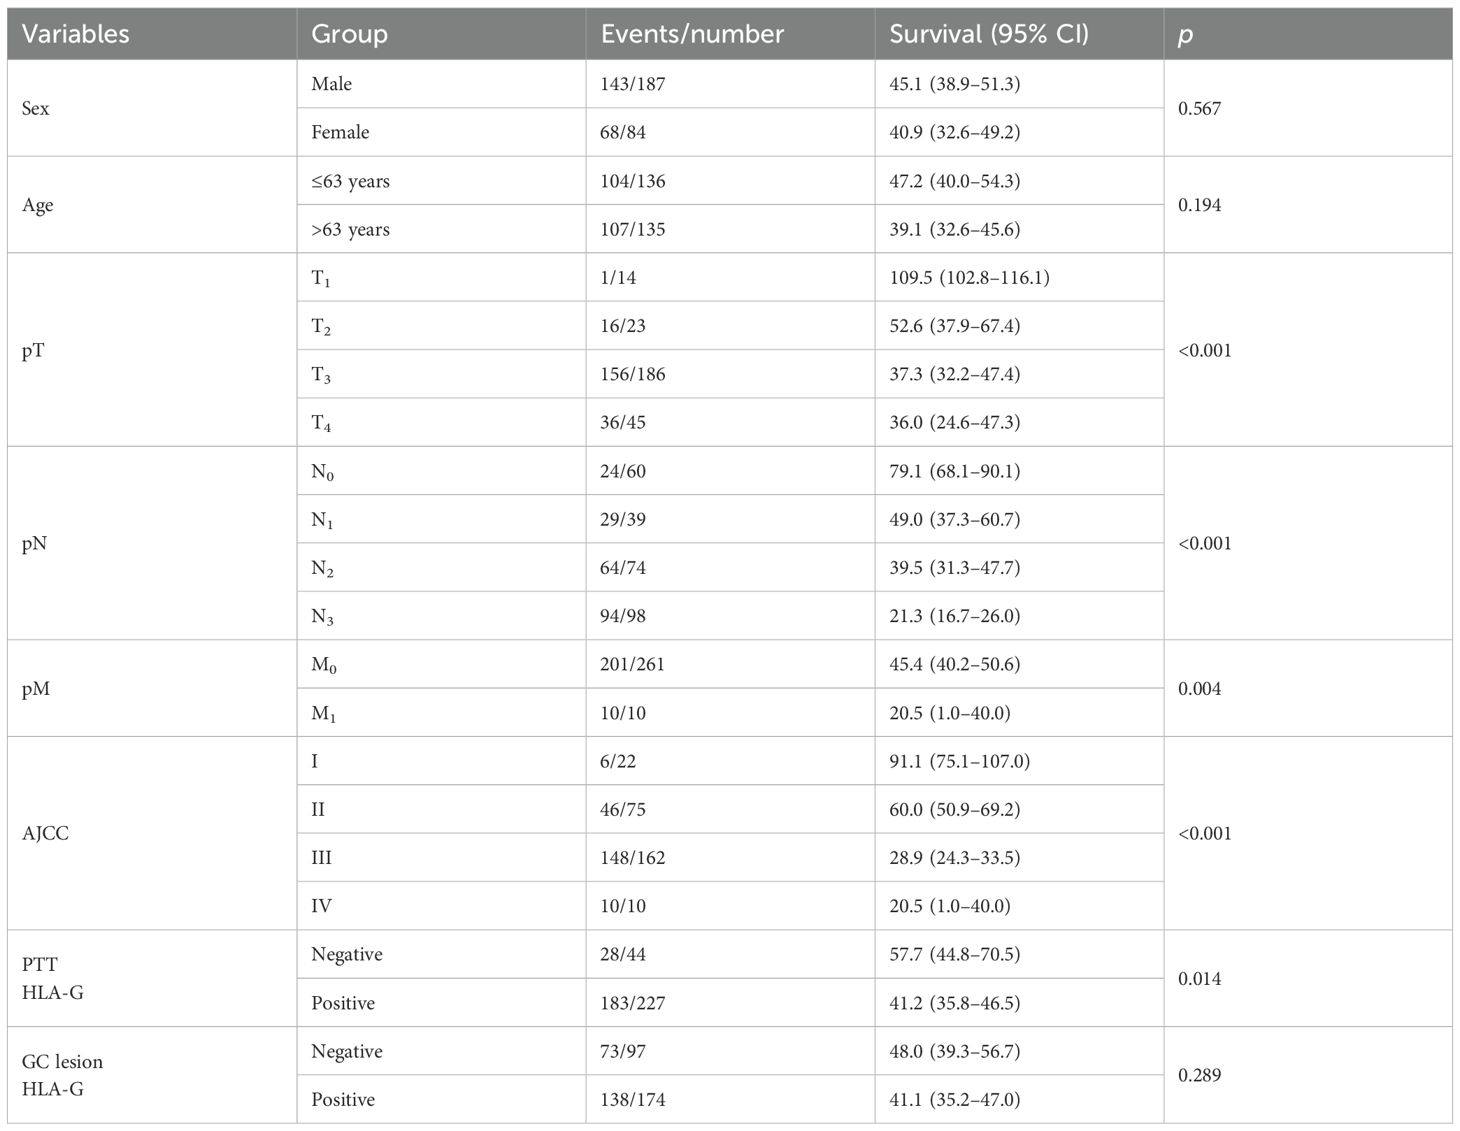
Table 3. Log-rank analysis for the significance of the clinical variables in the survival of case-matched GC lesion and PTT.
The aforementioned statistically significant factors were used to analyze the survival of the entire cohort of patients with GC, including sex, age, pT, pN, pM, and AJCC stages, and HLA-G expression status in PTTs using HRs derived from univariate and multivariate Cox proportional hazards models. Univariate Cox proportional hazards model results showed that both sex and age were not statistically significant factors for the survival of the GC patients. Multivariate Cox proportional hazards model results revealed that the HR for pT was 2.120 (95% confidence interval [CI]: 1.215–3.698, p=0.008), pN was 2.556 (95% CI: 1.102–5.929, p=0.029), pM was 1.799 (95% CI: 0.929–3.483, p=0.082), AJCC was 0.972 (95% CI: 0.403–2.343, p=0.949), and HLA-G expression status in PTTs of the entire cohort was 1.476 (95% CI: 0.984–2.213, p=0.060; Table 4).
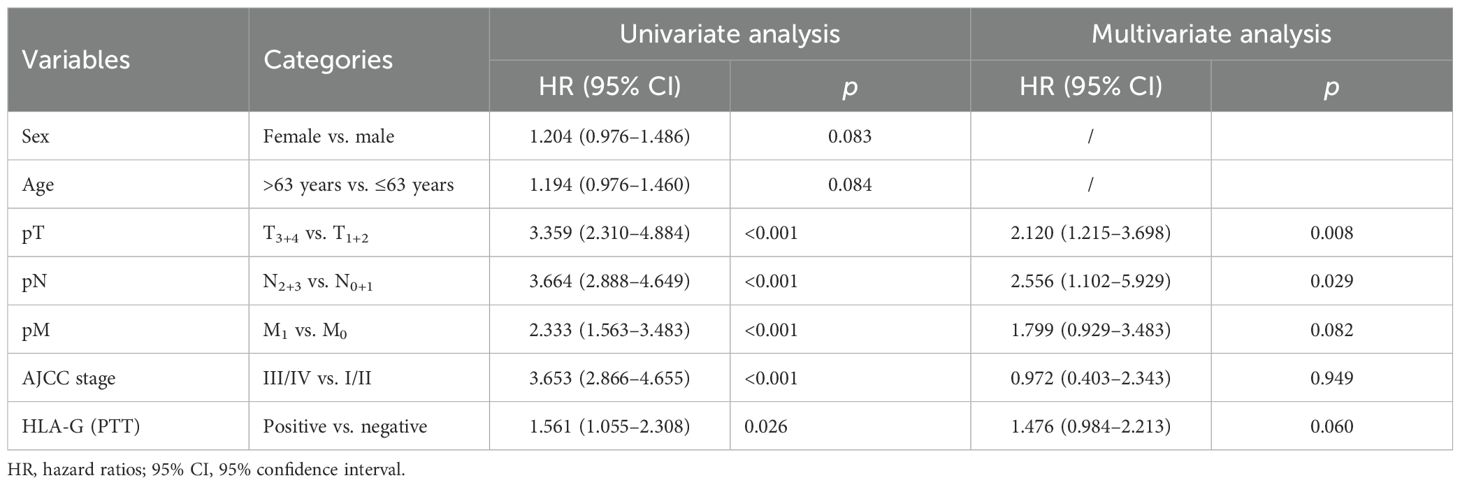
Table 4. Cox proportional hazards analysis of variables for overall survival in the whole cohort of GC patients.
Furthermore, among the 271 case-matched GC lesions and PTTs with available HLA-G expression status, the results were similar to those obtained for the entire cohort. The HR was 1.939 (p=0.022) for pT, 2.579 (p=0.024) for pN, 1.686 (p=0.024) for pM, and 1.048 (p=0.915) for AJCC, while the HLA-G expression status in PTT among case-matched cohort was 1.541 (95% CI: 1.023–2.321, p=0.039) for HLA-G expression status in PTTs (Table 5).
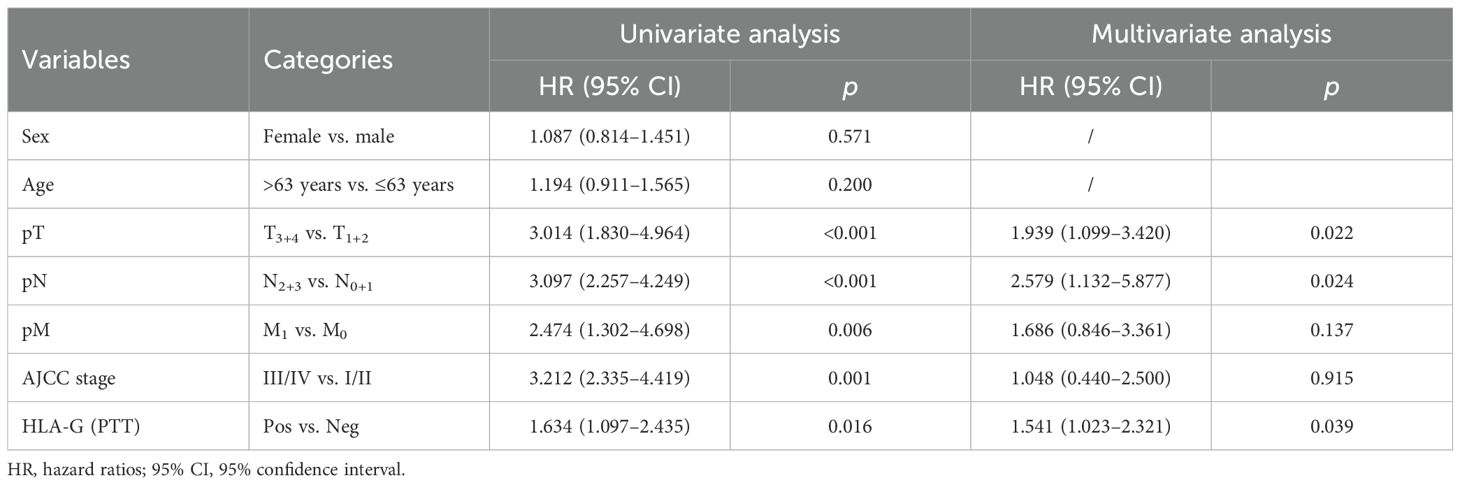
Table 5. Cox proportional hazards analysis of variables for overall survival in case-matched GC lesion and PTTs.
Identification of HLA-G-expressing cell populations in the gastric glands
IHC staining showed that HLA-G expression was restricted to the gastric glands of PTT (Figures 1B, 3A-a). We then used mIHC to identify the HLA-G-expressing cell subsets with the gastric gland chief cell-specific marker PGA3/Pepsinogen I and mucous neck cell-specific marker MUC6 as previously reported (31, 32). The mIHC results revealed that, in all four GC PTTs, HLA-G expression was restricted to MUC6positivePGA3negative mucous neck cells, but negative in MUC6positive/weakPGA3positivechief cells (Figures 3B-d, C-d, D-c showed the merged staining). Similar results were observed in HLA-G-positive GC lesions: HLA-G expression was restricted to MUC6positivePGA3negative/weak mucous neck cells (Figures 4A-d, B-d, C-d showed the merged staining).
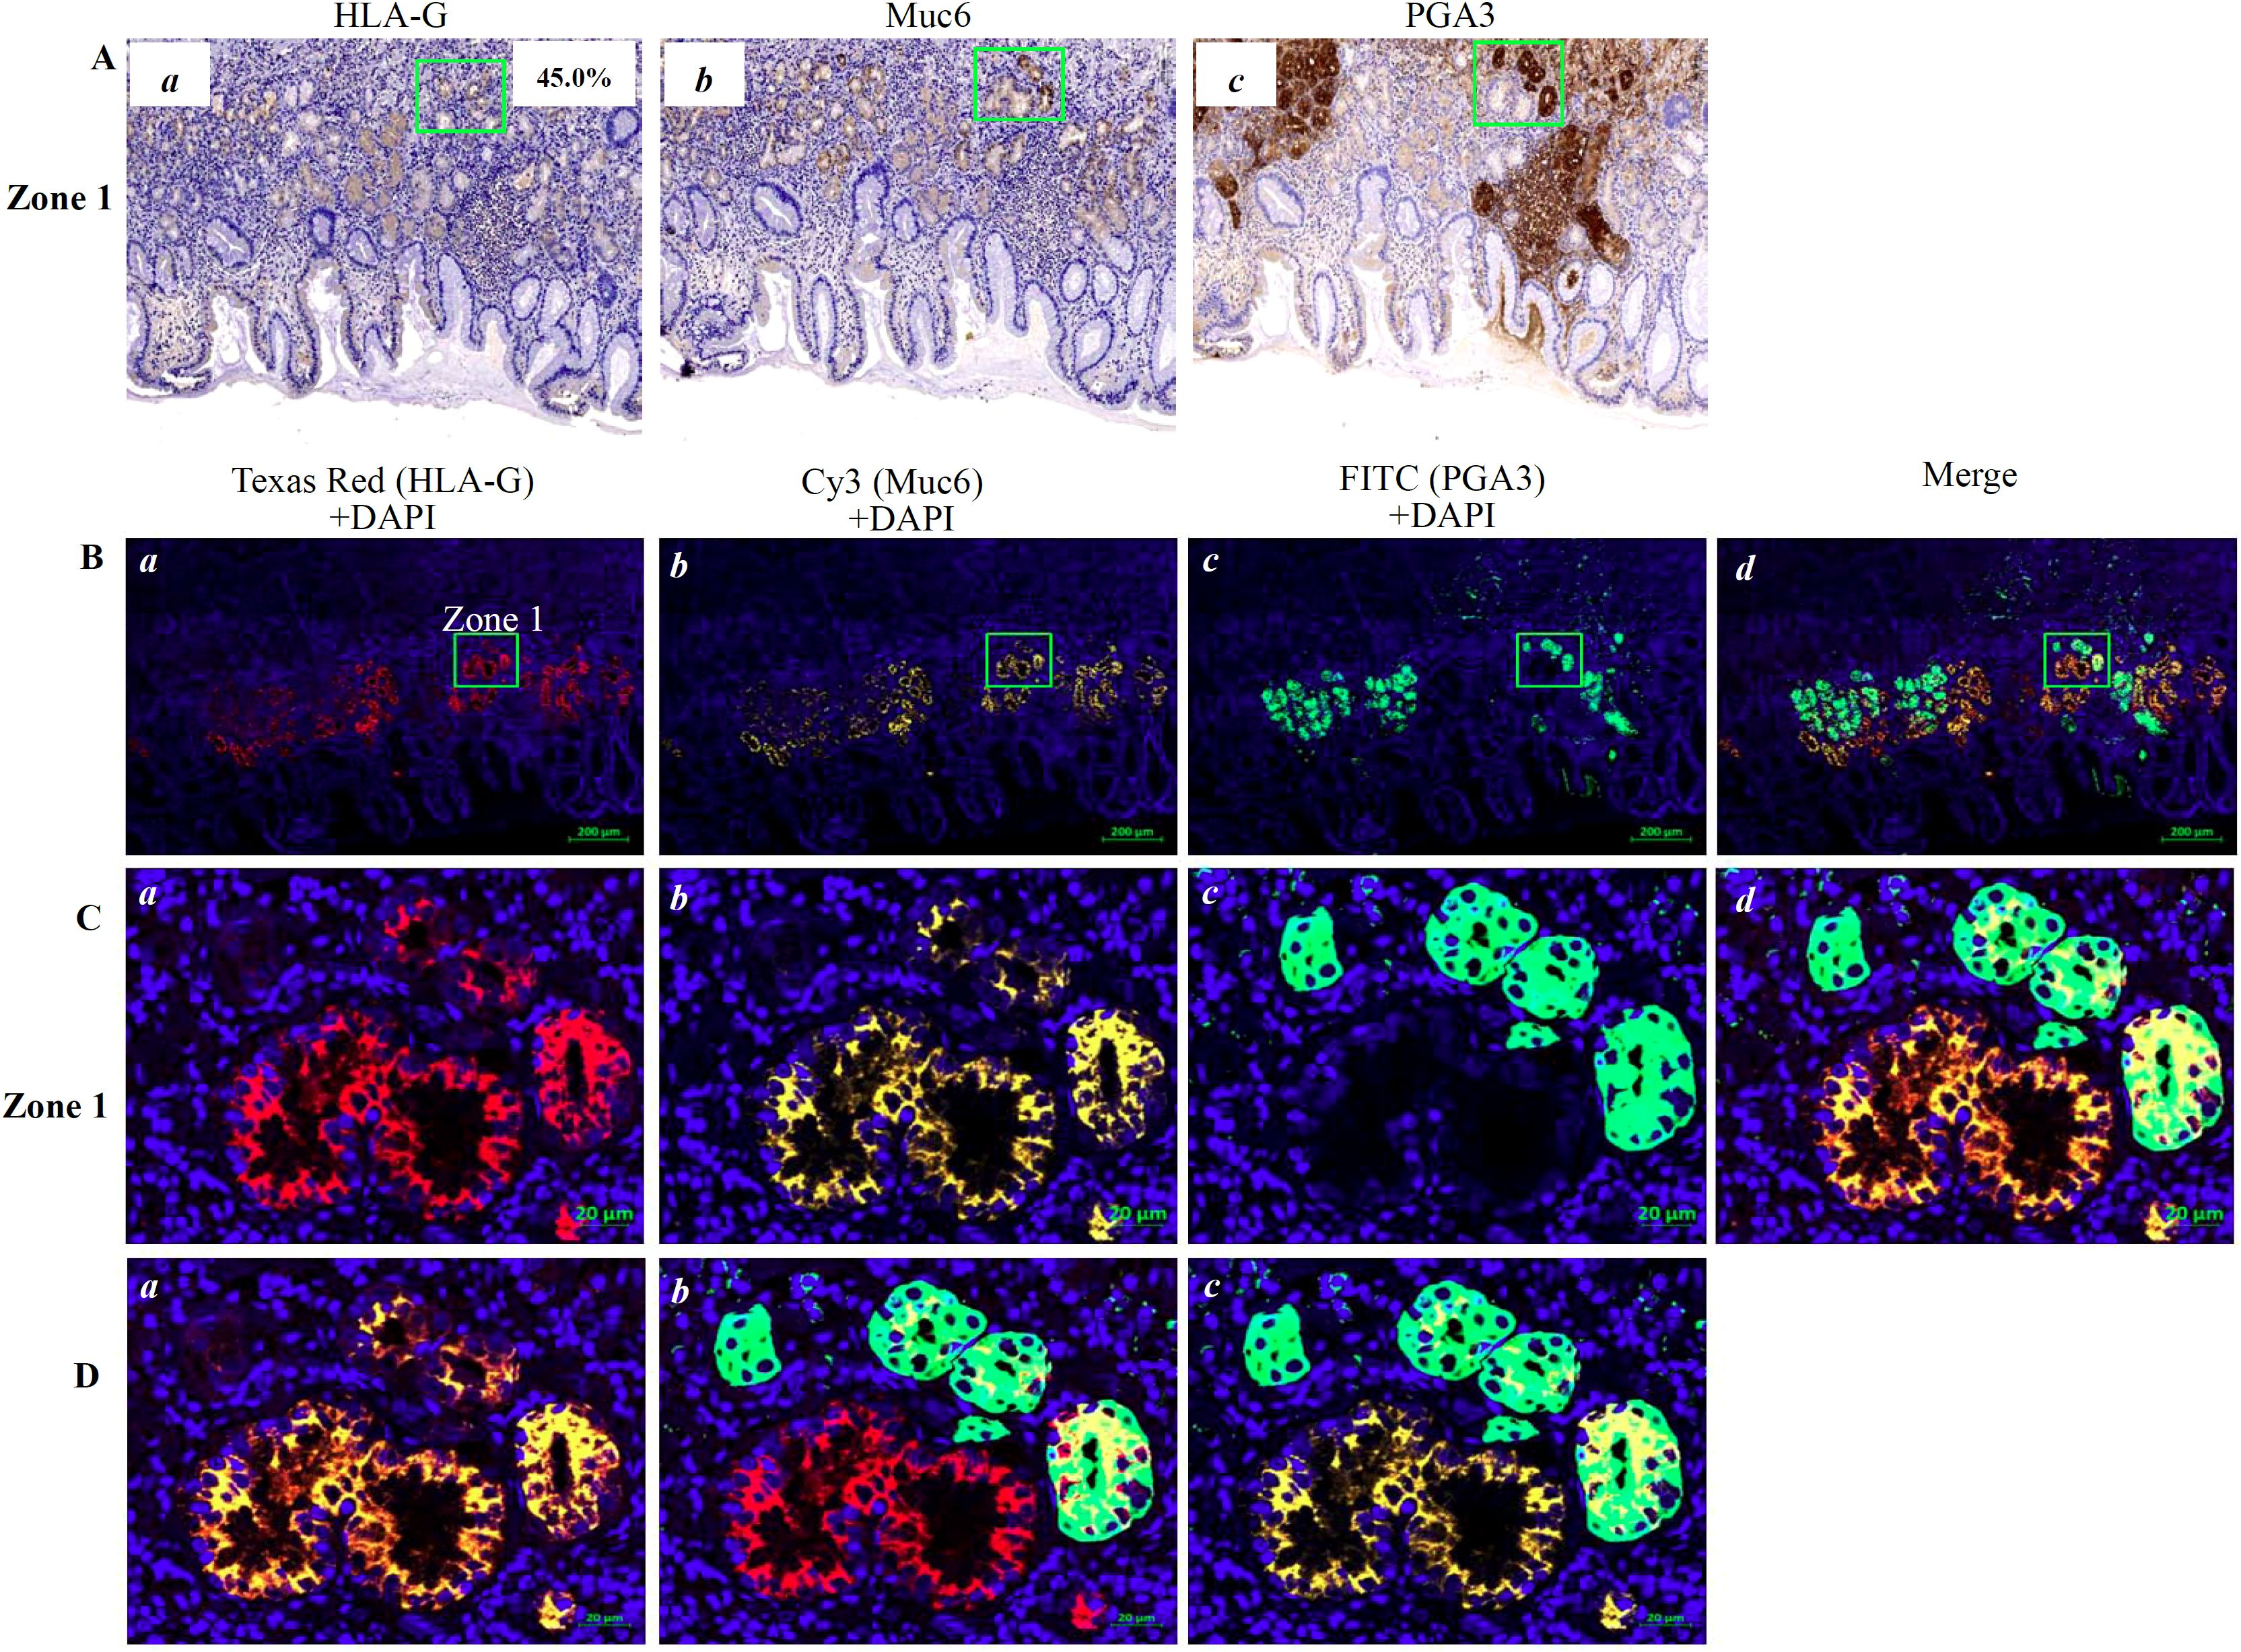
Figure 3. Immunostaining showing HLA-G expression in the cell population of the gastric gland in PTT. (A) Immunohistochemistry staining of (a) HLA-G, (b) MUC6 and (c) PGA3 cell populations of the gastric gland (×100). (B) Multiplex immunohistochemistry (mIHC) immunostaining showing the (a) HLA-G expression cells, (b) MUC6+ neck cell, and (c) PGA3+ chief cell in the gastric gland (bar=200 µm). The area in zone 1 was amplified and shown in (C) (bar=20 µm). (D) Images merged with (a) Texas Red/HLA-G+Cy3/Muc6+DAPI, (b) Texas Red/HLA-G+FITC/PGA3+DAPI, and (c) Texas Red/HLA-G+Cy3/Muc6+FITC/PGA3+DAPI.
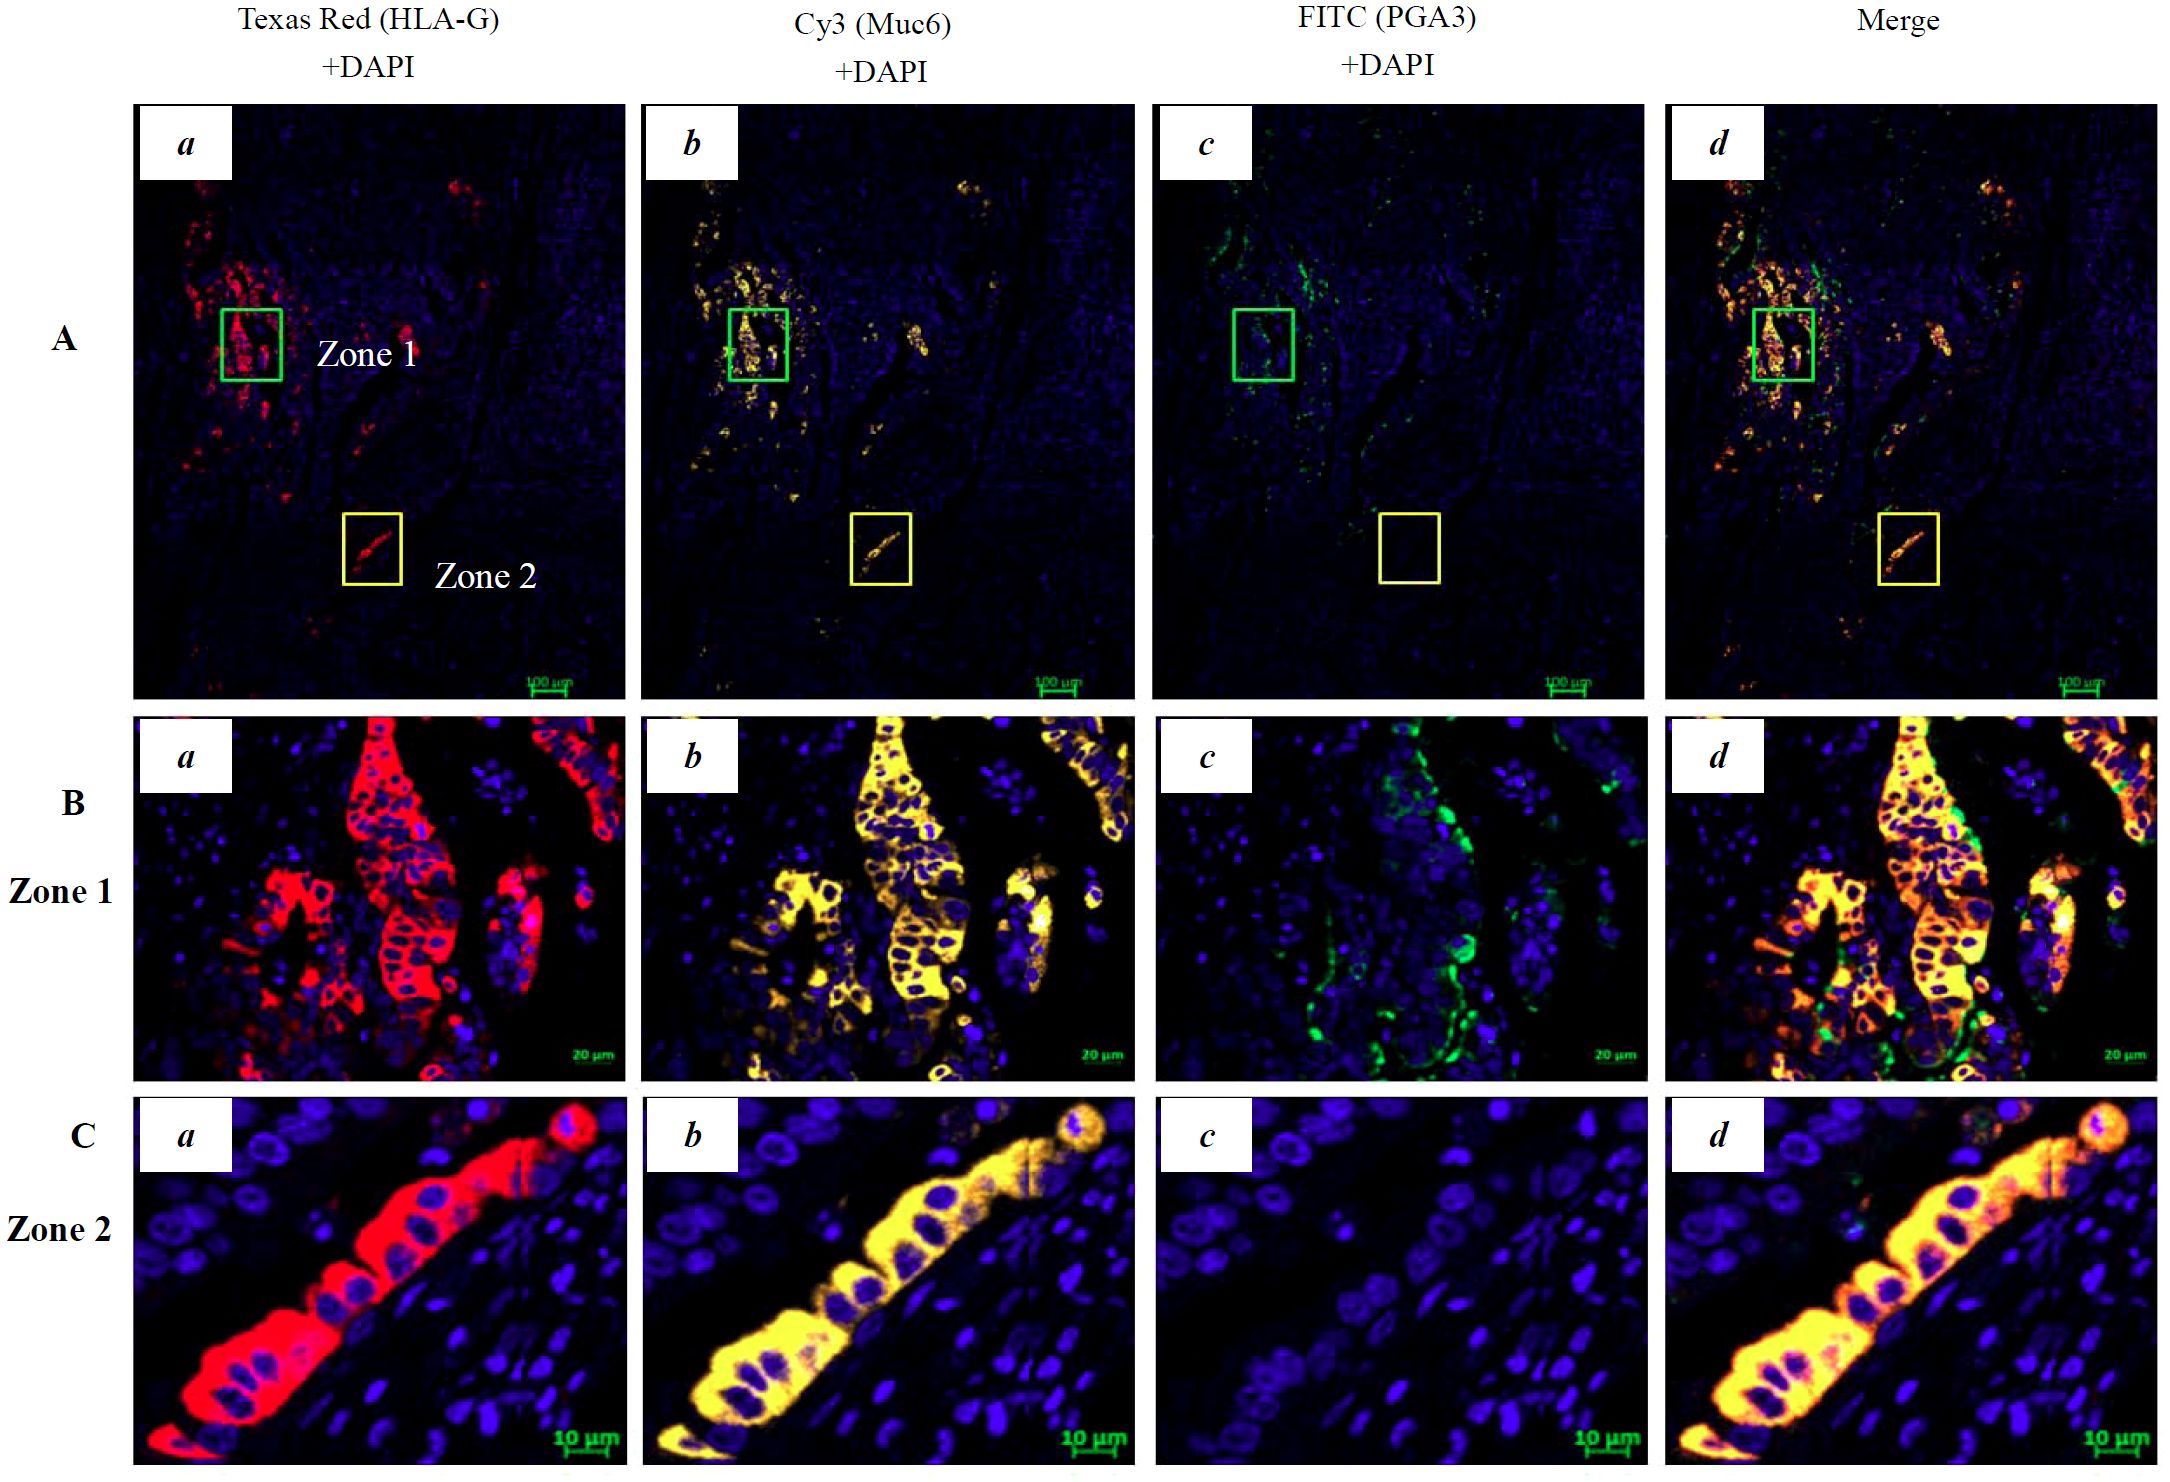
Figure 4. Multiplex immunohistochemistry (mIHC) immunostaining showing the HLA-G expression in the cell population of gastric gland in GC lesions. (A) Immunostaining showing the (a) HLA-G expression cells (Texas Red HLA-G+ +DAPI), (b) Cy3-Muc6+DAPI neck cell, (c) FITC-PGA3+DAPI chief cell, and (d) merged staining in GC lesions (Texas Red/HLA-G+Cy3/Muc6+FITC/PGA3+DAPI; bar=100 µm). The area in zone 1 and zone 2 was amplified and is shown in (B) (bar=20 µm) and (C) (bar=10 µm), respectively.
Discussion
Gastric cancer was the fifth most commonly diagnosed cancer (968,350 cases, 4.9% of the total cases) and the fifth leading cause of cancer-related death (659,853 cases, 6.8% of the total cancer-related deaths) worldwide in 2022 (33). Trends in the incidence (average annual percentage change [APCC] −2.9% for men and −2.8% for women) and mortality (APCC −3.7% for men and −4.3% for women) of GC were significantly decreased in 2000–2018. However, GC still ranked as the fifth most commonly diagnosed cancer (358,700 cases) and the third leading cause of cancer-related death (260,400 cases) in China in 2022 (34).
HLA-G expression was first observed in cytotrophoblasts in 1990 and in cancer in 1998 (1, 11). Different proportions and intensities of immune suppressor HLA-G expression have been frequently observed in various solid cancer lesions, while HLA-G is rarely expressed in tumor-adjacent non-tumorous tissues. An atlas of antigen-presenting-related genes generated from 4,323 publicly available RNA-Seq datasets by Boegel et al. (35) showed that the HLA-G transcript is expressed in various tissues. However, to date, proteomic HLA-G expression has only been observed in few cell populations in normal tissues, such as pancreatic islet β cells, erythroblasts, thymic medullary and subcapsular epithelium, tubule glandular epithelia, and glandular secretions in prostate gland and pituitary gland adenohypophyseal cells, testis Sertoli cells, and epidermal keratinocytes (3–6, 21, 36, 37). Upregulation of HLA-G expression can also be observed in macrophages in asthma with severe chronic inflammation, in mast cells in the liver and lung, and in kidney fibrosis (21, 38). In the context of cancers, several studies have shown that HLA-G expression in malignant lesions is associated with cancer progression and short patient survival, making it a promising target for cancer immunotherapy (17, 18, 20, 21, 39). HLA-G-targeted clinical trials for a wide range of advanced solid cancers with different strategies, including HLA-G antagonist alone (NCT04485013, NCT06380816) or combined with other immune checkpoint inhibitors and CAR-T (NCT05672459), are currently undergoing (https://clinicaltrials.gov/search?cond=HLA-G).
While most previous studies focused on the cancer itself, weak or absent HLA-G expression in PTTs has only been reported in a few studies with rather limited samples (6, 23). Glandular epithelia and/or secretions in normal prostate (n=5) and prostatic adenocarcinoma (n=4) were found to express HLA-G (6). Bai et al. (23) reported that normal (n=5) and cancer (n=97) endometrial tissues expressed HLA-G, while much higher levels of HLA-G expression were observed in endometrial cancer lesions. In this respect, HLA-G expression in PTT has rarely been explored; thus, whether HLA-G is expressed in PTT and its clinical importance remain largely unknown. PTTs have distinct molecular and biological behavioral features and clinical significance compared with their corresponding healthy tissues and cancer lesions (24–27). In this regard, peritumoral adipose-enriched stroma, but not myofibroblast-enriched stroma, was associated with poor survival of patients with breast carcinomas (26). Moreover, tumor-adjacent normal-tissue-derived transcriptomes were even better than those of primary tumors in predicting survival and disease recurrence in patients with colorectal cancer (27).
In patients with GC, previous studies have shown that tumor lesion HLA-G expression is significantly associated with advanced disease stage, susceptibility to immune suppression, disease progression, and poor patient survival (40–43). In contrast, in a study by Ishigami et al. (44), HLA-G expression in tumor lesions was markedly associated with better prognosis and prolonged survival in a cohort of 115 patients with GC. Chen et al. (45) reported that HLA-G expression was not significantly associated with worse survival in the entire cohort of 127 patients with GC but was significant in female patients. Although a meta-analysis revealed that HLA-G expression could be an independent prognostic factor for the poor survival of patients with GC, the divergent relevance of HLA-G in GC remains unclear (13). Among the aforementioned studies on HLA-G and GC, only two studies by Murdaca et al. (40) (number of PTT cases not described) and Du et al. (41) (n=179) had included PTT samples; however, no HLA-G expression was observed in non-neoplastic mucosa.
In this study, the clinical significance of HLA-G expression in GC lesions and PTTs was evaluated, and a specific HLA-G-positive subpopulation in PTTs and GC lesions was identified. Our results showed that HLA-G expression was more frequently observed in PTTs than in GC lesions (84.1% vs. 70.7%, p<0.001) and that HLA-G expression in PTTs (HR=1.561, p=0.026), but not in GC lesions, was associated with poor survival of GC patients. Our results agreed with previous studies that HLA-G expression status was not associated with worse prognosis (12, 45, 46). Disparities in the prognostic significance of HLA-G expression in patients with GC were multifactorial, such as high intratumor and intertumor heterogeneous expression of HLA-G, and variations in methodological protocols to determine the HLA-G expression among these studies were noted (12, 39).
We found for the first time that MUC6-positive fundic gland mucous neck cells in PTT were the predominant subpopulation expressing HLA-G. PTTs characterize a distinct microarchitecture and microenvironment that can facilitate tumor progression through a cross-talk between mechanical signaling and immune activity. Moreover, its informative importance in cancer tumorigenesis, metastasis, prognosis, drug response, and disease recurrence has been highlighted in various types of tumors (47–50). In line with this, differential gene expression in normal breast epithelium in PTT was reported to reflect the differences of ER+ and ER- status in invasive breast cancer, which could help identify early genomic events in breast cancer development (50). Hippo-related gene expression in PTTs can predict the prognosis of patients with hepatocellular carcinoma. In addition, transcriptomes and immune cell composition in PTT are much better than those in primary tumors for survival and tumor recurrence prediction among patients with CRC (27, 51).
PTT is an intermediate phase between tumors and healthy normal tissues. Histologically, normal PTT has distinct molecular characteristics compared with healthy normal tissue but shares transcriptional similarity with its corresponding tumor to a certain degree (52). A stepwise alternation of molecular and transcriptional accumulation in PTT is critical for cancer tumor development. TIGIT+CD20+ B cells in the PTTs of GC are an independent prognostic predictor of worse survival among patients with GC (53). In this scenario, HLA-G expression in fundic gland mucous neck cells in PTTs could play immunological modulation and pro-tumorigenic roles in pre-cancerous malignant transformation. The chief cells, which originate from mucous neck cells, are involved in tumorigenesis, which could serve as a source of GC cells via stem/progenitor cells (54, 55). Fundic gland chief cell-predominant type gastric adenocarcinoma (MUC6positive/weakPGA3positive) is a rare variant of well-differentiated adenocarcinoma and a novel disease entity (56). Inflammation, familial and environmental factors such as Helicobacter pylori infection, smoking, and irradiation are considered risk factors for GC (55, 57). In this regard, several studies reported genetic variations of HLA-G related to the susceptibility of H. pylori infection and GC progression and prognosis (58–61). Moreover, HLA-G expression was found to be associated with H. pylori infection and inflammation in gastric antrum (62).
However, our study obviously has limitations. First is the sample size in multiplex IHC to localize the HLA-G expressing cell subsets in the fundic gland, where only four PTTs and two GC lesions were performed; more samples are critically necessary to solidify our preliminary results that HLA-G expression is restricted to gastric mucous neck cells. Secondly, though HLA-G expression in PTTs is significantly related to the poor survival of GC patients, HLA-G in PTTs of GC patients are not an independent prognosticator when adjusted with other confounders including sex, age, and the patient’s clinical disease stage.
In summary, our preliminary findings revealed, for the first time, that HLA-G expression is restricted to fundic gland mucous neck cells and that HLA-G expression in PTTs is significantly related to the poor survival of patients with gastric cancer. However, underlying mechanisms, potential biological roles, and clinical significance of HLA-G expression in mucous neck cells in gastric cancer development remain unknown and require further exploration.
Data availability statement
The original contributions presented in the study are included in the article/Supplementary Material. Further inquiries can be directed to the corresponding authors.
Ethics statement
The study is based on the approvals from the Ethics Committee of Shanghai Outdo Biotech Company and Ethics Committee of Taizhou Hospital of Zhejiang Province, China (K20240907), and conducted according to the principles of the Declaration of Helsinki. The studies were conducted in accordance with the local legislation and institutional requirements. The participants provided their written informed consent to participate in this study.
Author contributions
XZ: Data curation, Funding acquisition, Methodology, Writing – review & editing, Investigation. Q-YH: Writing – review & editing, Funding acquisition, Investigation, Data curation, Methodology. J-GZ: Writing – review & editing, Data curation, Resources. W-HY: Methodology, Validation, Conceptualization, Funding acquisition, Formal Analysis, Writing – original draft. AL: Data curation, Investigation, Validation, Conceptualization, Methodology, Writing – review & editing, Formal Analysis.
Funding
The author(s) declare financial support was received for the research and/or publication of this article. This work was supported by grant from National Natural Science Foundation of China (82472836), Health Bureau of Zhejiang Province (2025KY1817) and Science and Technology Bureau of Taizhou Municipality (23ywa09).
Acknowledgments
We are grateful to the patients for their participation in this study.
Conflict of interest
The authors declare that the research was conducted in the absence of any commercial or financial relationships that could be construed as a potential conflict of interest.
The author(s) declared that they were an editorial board member of Frontiers, at the time of submission. This had no impact on the peer review process and the final decision.
Generative AI statement
The author(s) declare that no Generative AI was used in the creation of this manuscript.
Any alternative text (alt text) provided alongside figures in this article has been generated by Frontiers with the support of artificial intelligence and reasonable efforts have been made to ensure accuracy, including review by the authors wherever possible. If you identify any issues, please contact us.
Publisher’s note
All claims expressed in this article are solely those of the authors and do not necessarily represent those of their affiliated organizations, or those of the publisher, the editors and the reviewers. Any product that may be evaluated in this article, or claim that may be made by its manufacturer, is not guaranteed or endorsed by the publisher.
Supplementary material
The Supplementary Material for this article can be found online at: https://www.frontiersin.org/articles/10.3389/fimmu.2025.1660054/full#supplementary-material
Supplementary Figure 1 | Distribution of the percentage of HLA-G+ cells in gastric cancer lesions and PPTs.
Supplementary Figure 2 | Determination of HLA-G expression in PTTs with Western blot. PTT lysates (P1–P6) were probed (A) with anti-HLA-ABCE mAb TP25.99SF (1:1,000, Exbio) and (B) with anti-HLA-G mAb4H84 (1:1,000, Exbio).
References
1. Kovats S, Main EK, Librach C, Stubblebine M, Fisher SJ, and DeMars R. A class I antigen, HLA-G, expressed in human trophoblasts. Science. (1990) 248:220–3. doi: 10.1126/science.2326636
2. Carosella ED, Gregori S, and Tronik-Le Roux D. HLA-G/LILRBs: A cancer immunotherapy challenge. Trends Cancer. (2021) 7:389–92. doi: 10.1016/j.trecan.2021.01.004
3. Cirulli V, Zalatan J, McMaster M, Prinsen R, Salomon DR, Ricordi C, et al. The class I HLA repertoire of pancreatic islets comprises the nonclassical class Ib antigen HLA-G. Diabetes. (2006) 55:1214–22. doi: 10.2337/db05-0731
4. Menier C, Rabreau M, Challier JC, Le Discorde M, Carosella ED, and Rouas-Freiss N. Erythroblasts secrete the nonclassical HLA-G molecule from primitive to definitive hematopoiesis. Blood. (2004) 104:3153–60. doi: 10.1182/blood-2004-03-0809
5. Crisa L, McMaster MT, Ishii JK, Fisher SJ, and Salomon DR. Identification of a thymic epithelial cell subset sharing expression of the class Ib HLA-G molecule with fetal trophoblasts. J Exp Med. (1997) 186:289–98. doi: 10.1084/jem.186.2.289
6. Langat DK, Sue Platt J, Tawfik O, Fazleabas AT, and Hunt JS. Differential expression of human leukocyte antigen-G (HLA-G) messenger RNAs and proteins in normal human prostate and prostatic adenocarcinoma. J Reprod Immunol. (2006) 71:75–86. doi: 10.1016/j.jri.2006.01.006
7. Lin A and Yan WH. HLA-G/ILTs targeted solid cancer immunotherapy: opportunities and challenges. Front Immunol. (2021) 12:698677. doi: 10.3389/fimmu.2021.698677
8. Jasinski-Bergner S, Schmiedel D, Mandelboim O, and Seliger B. Role of HLA-G in viral infections. Front Immunol. (2022) 13:826074. doi: 10.3389/fimmu.2022.826074
9. Liu S, Bos NA, Verschuuren EAM, van Baarle D, and Westra J. Biological characteristics of HLA-G and its role in solid organ transplantation. Front Immunol. (2022) 13:902093. doi: 10.3389/fimmu.2022.902093
10. Xu X, Zhou Y, and Wei H. Roles of HLA-G in the maternal-fetal immune microenvironment. Front Immunol. (2020) 11:592010. doi: 10.3389/fimmu.2020.592010
11. Paul P, Rouas-Freiss N, Khalil-Daher I, Moreau P, Riteau B, Le Gal FA, et al. HLA-G expression in melanoma: a way for tumor cells to escape from immunosurveillance. Proc Natl Acad Sci U S A. (1998) 95:4510–5. doi: 10.1073/pnas.95.8.4510
12. van de Water RB, Krijgsman D, Houvast RD, and Vahrmeijer AL. Kuppen PJK. A critical assessment of the association between HLA-G expression by carcinomas and clinical outcome. Int J Mol Sci. (2021) 22:8265. doi: 10.3390/ijms22158265
13. Bartolome J, Molto C, Benitez-Fuentes JD, Fernandez-Hinojal G, Manzano A, Perez-Segura P, et al. Prognostic value of human leukocyte antigen G expression in solid tumors: a systematic review and meta-analysis. Front Immunol. (2023) 14:1165813. doi: 10.3389/fimmu.2023.1165813
14. Lin A and Yan WH. Intercellular transfer of HLA-G: its potential in cancer immunology. Clin Transl Immunol. (2019) 8:e1077. doi: 10.1002/cti2.1077
15. Wang S, Wang J, Xia Y, Zhang L, Jiang Y, Liu M, et al. Harnessing the potential of HLA-G in cancer therapy: advances, challenges, and prospects. J Transl Med. (2024) 22:130. doi: 10.1186/s12967-024-04938-w
16. Rebmann V, Konig L, Nardi Fda S, Wagner B, Manvailer LF, and Horn PA. The potential of HLA-G-bearing extracellular vesicles as a future element in HLA-G immune biology. Front Immunol. (2016) 7:173. doi: 10.3389/fimmu.2016.00173
17. Anna F, Bole-Richard E, LeMaoult J, Escande M, Lecomte M, Certoux JM, et al. First immunotherapeutic CAR-T cells against the immune checkpoint protein HLA-G. J Immunother Cancer. (2021) 9:e001998. doi: 10.1136/jitc-2020-001998
18. Jan CI, Huang SW, Canoll P, Bruce JN, Lin YC, Pan CM, et al. Targeting human leukocyte antigen G with chimeric antigen receptors of natural killer cells convert immunosuppression to ablate solid tumors. J Immunother Cancer. (2021) 9:e003050. doi: 10.1136/jitc-2021-003050
19. Lin YC, Hua CH, Lu HM, Huang SW, Chen Y, Tsai MH, et al. CAR-T cells targeting HLA-G as potent therapeutic strategy for EGFR-mutated and overexpressed oral cancer. iScience. (2023) 26:106089. doi: 10.1016/j.isci.2023.106089
20. Huang SW, Pan CM, Lin YC, Chen MC, Chen Y, Jan CI, et al. BiTE-secreting CAR-gammadeltaT as a dual targeting strategy for the treatment of solid tumors. Adv Sci (Weinh). (2023) 10:e2206856. doi: 10.1002/advs.202206856
21. Obermajer N, Zwolak A, van de Ven K, Versmissen S, Menard K, Rogers K, et al. JNJ-78306358, a first-in-class bispecific T cell engaging antibody targeting CD3 and HLA-G. iScience. (2025) 28:111876. doi: 10.1016/j.isci.2025.111876
22. Gilead buys into tizona’s anti-HLA-G strategy. Cancer Discov. (2020) 10:1433. doi: 10.1158/2159-8290.CD-NB2020-077
23. Bai Y, Liu W, Xie Y, Liang J, Wang F, and Li C. Human leukocyte antigen-G (HLA-G) expression plays an important role in the diagnosis and grading of endometrial cancer. J Obstet Gynaecol. (2022) 42:641–7. doi: 10.1080/01443615.2021.1920007
24. Aran D, Camarda R, Odegaard J, Paik H, Oskotsky B, Krings G, et al. Comprehensive analysis of normal adjacent to tumor transcriptomes. Nat Commun. (2017) 8:1077. doi: 10.1038/s41467-017-01027-z
25. Gadaleta E, Fourgoux P, Pirró S, Thorn GJ, Nelan R, Ironside A, et al. Characterization of four subtypes in morphologically normal tissue excised proximal and distal to breast cancer. NPJ Breast Cancer. (2020) 6:38. doi: 10.1038/s41523-020-00182-9
26. Lau HSH, Tan VKM, Tan BKT, Sim Y, Quist J, Thike AA, et al. Adipose-enriched peri-tumoral stroma, in contrast to myofibroblast-enriched stroma, prognosticates poorer survival in breast cancers. NPJ Breast Cancer. (2023) 9:84. doi: 10.1038/s41523-023-00590-7
27. Kim J, Kim H, Lee MS, Lee H, Kim YJ, Lee WY, et al. Transcriptomes of the tumor-adjacent normal tissues are more informative than tumors in predicting recurrence in colorectal cancer patients. J Transl Med. (2023) 21:209. doi: 10.1186/s12967-023-04053-2
28. Edge SB and Compton CC. The American Joint Committee on Cancer: the 7th edition of the AJCC cancer staging manual and the future of TNM. Ann Surg Oncol. (2010) 17:1471–4. doi: 10.1245/s10434-010-0985-4
29. Lin A, Zhang X, Zhang RL, Zhang JG, Zhou WJ, and Yan WH. Clinical Significance of Potential Unidentified HLA-G Isoforms Without alpha1 Domain but Containing Intron 4 in Colorectal Cancer Patients. Front Oncol. (2018) 8:361. doi: 10.3389/fonc.2018.00361
30. Chew SF, Kanaan C, and Tait BD. HLA expression and cancer–14th IHIWS immunohistochemistry quality control exercise exchange results. Tissue Antigens. (2007) 69 Suppl 1:248–51. doi: 10.1111/j.1399-0039.2006.774_2.x
31. Zhang M, Hu S, Min M, Ni Y, Lu Z, Sun X, et al. Dissecting transcriptional heterogeneity in primary gastric adenocarcinoma by single cell RNA sequencing. Gut. (2021) 70:464–75. doi: 10.1136/gutjnl-2019-320368
32. Zhao W, Jia Y, Sun G, Yang H, Liu L, Qu X, et al. Single-cell analysis of gastric signet ring cell carcinoma reveals cytological and immune microenvironment features. Nat Commun. (2023) 14:2985. doi: 10.1038/s41467-023-38426-4
33. Bray F, Laversanne M, Sung H, Ferlay J, Siegel RL, Soerjomataram I, et al. Global cancer statistics 2022: GLOBOCAN estimates of incidence and mortality worldwide for 36 cancers in 185 countries. CA Cancer J Clin. (2024) 74:229–63. doi: 10.3322/caac.21834
34. Han B, Zheng R, Zeng H, Wang S, Sun K, Chen R, et al. Cancer incidence and mortality in China, 2022. J Natl Cancer Cent. (2024) 4:47–53. doi: 10.1016/j.jncc.2024.01.006
35. Boegel S, Lower M, Bukur T, Sorn P, Castle JC, and Sahin U. HLA and proteasome expression body map. BMC Med Genomics. (2018) 11:36. doi: 10.1186/s12920-018-0354-x
36. Larsen MH, Bzorek M, Pass MB, Larsen LG, Nielsen MW, Svendsen SG, et al. Human leukocyte antigen-G in the male reproductive system and in seminal plasma. Mol Hum Reprod. (2011) 17:727–38. doi: 10.1093/molehr/gar052
37. Mestrallet G, Carosella ED, Martin MT, Rouas-Freiss N, Fortunel NO, and LeMaoult J. Immunosuppressive properties of epidermal keratinocytes differ according to their immaturity status. Front Immunol. (2022) 13:786859. doi: 10.3389/fimmu.2022.786859
38. Mouchet N, Vu N, Turlin B, Rioux-Leclercq N, Jouneau S, Samson M, et al. HLA-G is widely expressed by mast cells in regions of organ fibrosis in the liver, lung and kidney. Int J Mol Sci. (2021) 22:12490. doi: 10.3390/ijms222212490
39. Lin A and Yan WH. Heterogeneity of HLA-G expression in cancers: facing the challenges. Front Immunol. (2018) 9:2164. doi: 10.3389/fimmu.2018.02164
40. Murdaca G, Calamaro P, Lantieri F, Pigozzi S, Mastracci L, Grillo F, et al. HLA-G expression in gastric carcinoma: clinicopathological correlations and prognostic impact. Virchows Arch. (2018) 473:425–33. doi: 10.1007/s00428-018-2379-0
41. Du L, Xiao X, Wang C, Zhang X, Zheng N, Wang L, et al. Human leukocyte antigen-G is closely associated with tumor immune escape in gastric cancer by increasing local regulatory T cells. Cancer Sci. (2011) 102:1272–80. doi: 10.1111/j.1349-7006.2011.01951.x
42. Tuncel T, Karagoz B, Haholu A, Ozgun A, Emirzeoglu L, Bilgi O, et al. Immunoregulatory function of HLA-G in gastric cancer. Asian Pac J Cancer Prev. (2013) 14:7681–4. doi: 10.7314/APJCP.2013.14.12.7681
43. Wan R, Wang ZW, Li H, Peng XD, Liu GY, Ou JM, et al. Human leukocyte antigen-G inhibits the anti-tumor effect of natural killer cells via immunoglobulin-like transcript 2 in gastric cancer. Cell Physiol Biochem. (2017) 44:1828–41. doi: 10.1159/000485819
44. Ishigami S, Natsugoe S, Miyazono F, Nakajo A, Tokuda K, Matsumoto M, et al. HLA-G expression in gastric cancer. Anticancer Res. (2006) 26:2467–72.
45. Chen QY, Zhou WJ, Zhang JG, Zhang X, Han QY, Lin A, et al. Prognostic significance of the immune checkpoint HLA-G/ILT-4 in the survival of patients with gastric cancer. Int Immunopharmacol. (2022) 109:108798. doi: 10.1016/j.intimp.2022.108798
46. Yie SM, Yang H, Ye SR, Li K, Dong DD, and Lin XM. Expression of human leukocyte antigen G (HLA-G) correlates with poor prognosis in gastric carcinoma. Ann Surg Oncol. (2007) 14:2721–9. doi: 10.1245/s10434-007-9464-y
47. Zhang S, Regan K, Najera J, Grinstaff MW, Datta M, and Nia HT. The peritumor microenvironment: physics and immunity. Trends Cancer. (2023) 9:609–23. doi: 10.1016/j.trecan.2023.04.004
48. Koca D, Abedi-Ardekani B, LeMaoult J, and Guyon L. Peritumoral tissue (PTT): increasing need for naming convention. Br J Cancer. (2024) 131:1111–5. doi: 10.1038/s41416-024-02828-y
49. Trujillo KA, Heaphy CM, Mai M, Vargas KM, Jones AC, Vo P, et al. Markers of fibrosis and epithelial to mesenchymal transition demonstrate field cancerization in histologically normal tissue adjacent to breast tumors. Int J Cancer. (2011) 129:1310–21. doi: 10.1002/ijc.25788
50. Graham K, Ge X, de Las Morenas A, Tripathi A, and Rosenberg CL. Gene expression profiles of estrogen receptor-positive and estrogen receptor-negative breast cancers are detectable in histologically normal breast epithelium. Clin Cancer Res. (2011) 17:236–46. doi: 10.1158/1078-0432.CCR-10-1369
51. Pan Q, Qin F, Yuan H, He B, Yang N, Zhang Y, et al. Normal tissue adjacent to tumor expression profile analysis developed and validated a prognostic model based on Hippo-related genes in hepatocellular carcinoma. Cancer Med. (2021) 10:3139–52. doi: 10.1002/cam4.3890
52. Curtius K, Wright NA, and Graham TA. An evolutionary perspective on field cancerization. Nat Rev Cancer. (2018) 18:19–32. doi: 10.1038/nrc.2017.102
53. Liu H, Wu J, Xu X, Wang H, Zhang C, Yin S, et al. Peritumoral TIGIT(+)CD20(+) B cell infiltration indicates poor prognosis but favorable adjuvant chemotherapeutic response in gastric cancer. Int Immunopharmacol. (2022) 108:108735. doi: 10.1016/j.intimp.2022.108735
54. Leushacke M, Tan SH, Wong A, Swathi Y, Hajamohideen A, Tan LT, et al. Lgr5-expressing chief cells drive epithelial regeneration and cancer in the oxyntic stomach. Nat Cell Biol. (2017) 19:774–86. doi: 10.1038/ncb3541
55. He Z, Hu XH, He TY, and Zhao TT. Cellular plasticity and fate determination in gastric carcinogenesis. iScience. (2024) 27:109465. doi: 10.1016/j.isci.2024.109465
56. Miyazawa M, Matsuda M, Yano M, Hara Y, Arihara F, Horita Y, et al. Gastric adenocarcinoma of the fundic gland (chief cell-predominant type): A review of endoscopic and clinicopathological features. World J Gastroenterol. (2016) 22:10523–31. doi: 10.3748/wjg.v22.i48.10523
57. Nagtegaal ID, Odze RD, Klimstra D, Paradis V, Rugge M, Schirmacher P, et al. The 2019 WHO classification of tumours of the digestive system. Histopathology. (2020) 76:182–8. doi: 10.1111/his.13975
58. Genre J, Reginaldo FP, Andrade JM, Lima FP, da Camara AV, Donadi EA, et al. HLA-G 14-bp ins/ins genotype in patients harbouring helicobacter pylori infection: A potential risk factor? Scand J Immunol. (2016) 83:52–7. doi: 10.1111/sji.12390
59. Zemni I, Bortolotti D, Dhouioui S, Baroudi S, Ferjani M, Nasri I, et al. Associations of HLA-G 3’UTR polymorphisms and increased HLA-G expression with gastric cancer susceptibility and prognosis. Immunobiology. (2025) 230:152864. doi: 10.1016/j.imbio.2024.152864
60. Vaquero-Yuste C, Juarez I, Molina-Alejandre M, Molanes-López EM, Gutiérrez-Calvo A, López-García A, et al. HLA-G high-expressor 3’UTR markers are linked to gastric cancer development and survival. Cancer Immunol Immunother. (2024) 74:26. doi: 10.1007/s00262-024-03771-w
61. Suarez-Trujillo F, Juarez I, Vaquero-Yuste C, Gutierrez-Calvo A, Lopez-García A, Lasa I, et al. The immune modulation HLA-G*01:01:01 full allele is associated with gastric adenocarcinoma development. Int J Mol Sci. (2024) 25:10645. doi: 10.3390/ijms251910645
Keywords: HLA-G, gastric cancer, peritumoral tissue, mucous neck cell, survival
Citation: Zhang X, Han Q-Y, Zhang J-G, Yan W-H and Lin A (2025) HLA-G expression in peritumoral fundic gland mucous neck cells, but not in tumor lesions, related to poor survival in patients with gastric cancer. Front. Immunol. 16:1660054. doi: 10.3389/fimmu.2025.1660054
Received: 05 July 2025; Accepted: 29 September 2025;
Published: 16 October 2025.
Edited by:
Rahul Shivahare, The Ohio State University, United StatesReviewed by:
Fabio Suárez-Trujillo, Princess University Hospital, SpainLidy Vannessa Mejia Guarnizo, National Cancer Institute, Colombia
Copyright © 2025 Zhang, Han, Zhang, Yan and Lin. This is an open-access article distributed under the terms of the Creative Commons Attribution License (CC BY). The use, distribution or reproduction in other forums is permitted, provided the original author(s) and the copyright owner(s) are credited and that the original publication in this journal is cited, in accordance with accepted academic practice. No use, distribution or reproduction is permitted which does not comply with these terms.
*Correspondence: Wei-Hua Yan, eWFud2hAZW56ZW1lZC5jb20=; Aifen Lin, bGluYWZAZW56ZW1lZC5jb20=
†These authors have contributed equally to this work