 Rui Wang
 Weisong Zhang
 Xia Li
 Hao Wang
 Yanan Ji
 Jing Zhao
 JianXiang Song1*
 Zhongquan Yi
- 1Department of Cardiothoracic Surgery, Affiliated Hospital 6 of Nantong University, Yancheng Third People’s Hospital, Yancheng, China
- 2Department of Cardiovascular Surgery, The First Affiliated Hospital of Nanjing Medical University, Nanjing, China
- 3Department of General Medicine, Affiliated Hospital 6 of Nantong University, Yancheng Third People’s Hospital, Yancheng, China
- 4Department of Central Laboratory, Affiliated Hospital 6 of Nantong University, Yancheng Third People’s Hospital, Yancheng, China
Objective: In malignant tumors, a hypercoagulable state is frequently observed and is intricately intertwined with cancer development and the remodeling of the immune microenvironment. Recently, the coagulation-related genes (CRGs) signature has emerged as highly significant for the prognosis and immunotherapy of patients with various cancers. Nevertheless, their application in esophageal squamous cell carcinoma (ESCC) remains uninvestigated. Here, our objective is to explore the role of the CRGs signature in forecasting prognosis and predicting patient’s response to immunotherapy.
Methods: According to the prognostic CRGs, consensus clustering was utilized to stratify ESCC patients in the GSE53625 cohort into two subgroups. Subsequently, difference analysis and univariate cox analysis were conducted on the two subgroups, and a CRGs signature was constructed by leveraging these genes. Next, multiple RNA transcriptome cohorts were utilized to validate the signature. Moreover, functional enrichment, tumor mutation burden (TMB), tumor infiltration, immune function, and immunotherapy response of this signature were investigated.
Results: A CRGs signature composed of six genes (PTX3, CILP, CFHR4, SULT1B1, IL5RA, and FAM151A) was constructed. This signature serves as an independent and reliable prognostic factor. Additionally, when compared with the 32 prognostic signatures previously reported, the CRGs signature exhibited superior performance in the ESCC prognostic cohorts. Additionally, we found that high-risk ESCC exhibited higher immune infiltration, lower TMB, higher TIDE, and a lower proportion of immunotherapy response. In vitro experiments have shown that the gene SULT1B1, which exhibits the highest accuracy in predicting tumor status, significantly inhibited the proliferation and metastasis.
Conclusions: We constructed and validated a robust CRGs signature. Moreover, as one of the model CRGs, the tumor-suppressive role of SULT1B1 in ESCC was experimentally verified in vitro. These results provide novel insights into enhancing the prognosis of ESCC and formulating treatment strategies.
1 Introduction
With a high incidence worldwide, esophageal cancer (EC) is a major cause of deaths associated with cancer (1–3). Esophageal squamous cell carcinoma (ESCC) constitutes the prevailing type, comprising nearly 90% of cases (4). Despite the progress in treatments, the accessible treatment options for advanced ESCC remain limited, and the cure rates are comparatively low (3, 5, 6). Recently, with the deepening comprehension of tumor immune microenvironment (TME), immunotherapy has witnessed rapid development (7). Nevertheless, due to the significant heterogeneity in ESCC, merely a small proportion of cases exhibited a favorable response to immunotherapy (8). The TME exists within a complex and dynamic multicellular environment (9, 10). Conducting a thorough and detailed investigation of the TME in ESCC patients is instrumental to elucidating the immune landscape of ESCC. This has important practical significance for evaluating patients’ responsiveness to immunotherapy and formulating new strategies in immunotherapy (11).
The coagulation system, a sophisticated biological process, guarantees efficient hemostasis, maintains blood flow, and simultaneously prevents excessive bleeding (12–15). In malignant tumors, a hypercoagulable state is often observed (16, 17). This state may give rise to venous thromboembolism, thereby inducing local hypoxia and necrosis. Subsequently, it further triggers the proliferation of microvascular, the migration of tumor cells, and the remodeling of the TME (18–21). Recently, the significance of coagulation-related genes (CRGs) in prognostic prediction and predicting the response to immunotherapy has drawn attention (15, 16, 21–27). For instance, Wu et al. (15) constructed a CRGs signature for colon adenocarcinoma that reliably predicted both prognosis and treatment outcomes. He et al. (27) formulated a CRGs signature in hepatocellular carcinoma and analyzed its role in prognosis, immunotherapy, and chemotherapy response. Nevertheless, its role in ESCC remains unknown. Hence, it is essential to further explore the effects of the CRGs signature on ESCC, especially the prognosis prediction potential and its influence on clinical treatment decisions.
In this study, six transcriptome cohorts from TCGA and GEO databases were obtained for analysis. Subsequently, machine learning algorithms were employed to construct a CRGs prognostic signature, and the role of potential intervention targets in ESCC was verified through in vitro experiments. Our findings contributed to the advancement of prognostic biomarkers, offered a novel perspective on the involvement of CRGs in ESCC, and furnished new information for precision treatment.
2 Materials and methods
2.1 Samples and data collection
Figure 1 exemplified the investigation process. In this study, four transcriptome cohorts encompassing complete overall survival rate (OS) information and clinical information (TCGA-ESCC, GSE53625, GSE53624, and GSE53622) were obtained from TCGA and GEO databases. Besides, two other transcriptome cohorts from the GEO database were included (GSE20347and GSE38129). All the six transcriptome cohorts undergo a log-2 transformed to ensure normalization. Subsequently, to eliminate the batch effect, the ComBat algorithm was employed, and the extent of correction was examined via principal component analysis (PCA, Supplementary Figures 1A, B).

Figure 1. The flow chart of research design. ESCC, esophageal squamous cell carcinoma; PCA, principal component analysis; ROC, receiver operating characteristic; TMB, tumor mutational burden.
The pre-preprocessing of ESCC single-cell data (with a sample size of n = 7 for ESCC)) from the GSE145370 dataset was conducted using the Seurat v4 and Harmony (version 1.0). Low-quality cells with a mitochondrial gene proportion >20% and a gene count of <200 and >6000 were removed. To visualize the cell clusters, the t-distributed random neighbor embedding (t-SNE) was employed.
Furthermore, a curated list of 203 CRGs (Supplementary Table 1), such as SERPINE1, F3, and THBD, were obtained from the Gene Set Enrichment Analysis (GSEA) database. These genes originated from the hsa04610 pathway (complement and coagulation cascade) and the hsa04611 pathway (platelet activation). Both of these pathways are closely linked to coagulation and relevant processes.
2.2 Construction and validation of the CRGs signature
Initially, a univariate cox analysis of 203 CRGs in the GSE53625 cohort was conducted to identify prognostic CRGs. Next, the ‘ConsensusCluster Plus’ R package was utilized for consensus clustering with these prognostic CRGs. The optimal cluster count was determined by making use of the CDF curve, consensus score matrix, and PAC score. To detect prognostic DEGs between clusters, the ‘limma’ package (with a |logFC| > 0.585 and a p-value < 0.05) and univariate cox regression were utilized (28). In this research, the samples from the GSE53625 cohort were randomly assigned to a training cohort with 90 samples and a testing cohort encompassing 89 samples through the utilization of the R package ‘caret’. The clinical information of the two cohorts was shown in Table 1. Here, the CRGs signature was formulated with GSE53625 training cohort and verified in diverse cohorts, including the GSE53625 testing, the entire GSE53625, the GSE53624, the GSE53622, and the TCGA-ESCC cohorts. In the GSE53625 training cohort, hub prognostic DEGs were screened out through univariate cox regression, LASSO regression, and multiple cox regression analysis with a stepwise approach. Each sample’s risk score was evaluated utilizing the formula: Risk score =∑i=EXP (i) ×Coef (i). Next, the median score of each cohort was tallied, and each ESCC sample was categorized as high- or low-risk based on the median score. We utilized the ‘Survival’ R package and employed the ‘survival ROC’ package to evaluate the predictive capability (29). Additionally, cox regression and nomogram analysis were performed in conjunction with the clinical features.

Table 1. Comparisons of patient characteristics between training and testing cohorts.
2.3 Functional enrichment analysis
Researchers executed relevant enrichment analysis on DEGs utilizing ‘clusterProfiler’ R package (30), encompassing GO and KEGG analyses. Moreover, to analyze potential modifications in signaling pathways, Hallmark gene sets were applied in GSEA.
2.4 Prediction of immunotherapy response and analysis of gene mutation data and drug sensitivity
To analyze the differences between risk groups, the immune, estimate, stromal, and tumor purity scores were calculated by utilizing the ESTIMATE method. Moreover, ssGSEA algorithms were utilized to assess both the overall immune function and the immune cell infiltration.
Furthermore, the software package “maftools” was utilized to obtain tumor mutation burden (TMB) data (31). Meanwhile, the microsatellite instability (MSI) score was retrieved from the public data of TCGA (Supplementary Table 2). Besides, each patient’s TIDE scores were from the online website (32). Moreover, “oncoPredict” package was utilized to perform drug sensitivity analysis (p < 0.05) (33).
2.5 Cell lines
Three ESCC cell lines, KYSE30, KYSE150, and KYSE410, were sourced from Pricella (Wuhan, China), and cultured in RPMI-1640 (Pricella) supplemented with 10% FBS (Pricella) and 1% penicillin-streptomycin (Pricella). These cells were cultured at 37 °C in 5% CO2. The siRNAs for SULT1B1 (si- SULT1B1-1/-2/-3/-4, details in Supplementary Table 3), negative control (si-NC), and SULT1B1 overexpression plasmid were provided by GenePharma (Shanghai, China). And to transfect the cells, Lipofectamine 3000 regent (L3000015, Invitrogen, USA) was employed. Forty-eight hours post-transfection, cells were harvested to analyze the proteins levels, apoptosis, and cell cycle. Annexin V-FITC Apoptosis Detection Kit (Beyotime, C1062, China) and Cell cycle Analysis Kit (Beyotime, C1052, China) were used for apoptosis and cell cycle assay.
2.6 Western blotting
To prepare protein extracts, cells were lysed with a mixture of RIPA buffer (Beyotime, P0013B, China) and 1% PMSF (Beyotime, ST505, China). The protein samples were then denatured, and the proteins were resolved by SDS-PAGE gel. Subsequently, the proteins were transferred onto a PVDF membrane, which was blocked with 5% skim milk for 2 hours. Next, the membrane was incubated with primary antibodies, namely SULT1B1 (1:500; Proteintech, 16050-1-AP, China), E-cadherin (1:5000; Proteintech, 20874-1-AP, China), Vimentin (1:1000; Beyotime, AF1975, China), and GAPDH (1:1000; Servicebio, GB15004-100, China). After incubation with the secondary antibody, the bands were developed by means of the ECL developer (Beyotime, E422-01, China).
2.7 CCK-8 assay
A density of 2000 cells per well was utilized for seeding in 96-well plates. After that, to each well, 10 µL of CCK-8 solution in a serum-free medium was added and incubated at 37 °C for one hour. Next, measurements of absorbance were conducted at a wavelength of 450 nm, with the optical density (OD) being recorded at the same daily interval.
2.8 Cell migration assay
A volume of 100 µL of serum-free medium, which contained 5 × 10⁴ cells, was seeded on the top chamber of the transwell. Concurrently, 600 µL of complete medium was inoculated into the bottom chamber. Following 24 hours of incubation, the cells were stained with a 0.5% crystal violet solution and then counted under a microscope.
2.9 Scratch wound healing assay
Utilize the sterile plastic pipette to scrape the transfected cells. Subsequently, wash the cells twice with PBS, and then replenish the culture with fresh medium. Images of the scratch were captured under a microscope at 0 and 24 hours post-treatment.
2.10 Statistical analysis
For statistical analysis and graphing, R 4.3.1 and GraphPad Prism 8 were utilized. Differences between two groups were analyzed utilizing Student’s t-test or Wilcoxon’s rank sum test. For statistical analysis above two groups, a one-way ANOVA test was performed. A p < 0.05 was considered statistically significant.
3 Results
3.1 Identification and establishment of CRGs signature
Univariate cox regression was performed on 203 CRGs, and 19 prognostic CRGs were filtered out (Figure 2A). We then proceeded with a consensus cluster analysis, and identified the optimal number k was 2 (Figures 2B, C). The differences between the two consensus clusters (C1 and C2) in terms of 19 prognostic CRGs and clinical characteristics were illustrated in Figure 2D. According to the KM analysis, there were marked prognostic differences between the two clusters (Figure 2E). Next, 1025 DEGs (Figure 2F; Supplementary Table 4) and 215 prognostic DEGs were filtered out. No notable variations were observed between the two cohorts. Figure 2G illustrated the 36 prognostic DEGs in the training cohort. Subsequently, six model DEGs were screened out through the utilization of LASSO regression (Figures 2H, I) and multivariate Cox regression. Supplementary Table 5 presented the univariate and multivariate results of these six model DEGs. Thereafter, a CRGs signature was established (Figure 2J) according to the formula: Risk score = PTX3* 0.18815 + CILP * 0.14112 + CFHR4* (-0.17575) + SULT1B1* (-0.19359) + IL5RA * (-0.29789) + FAM151A * (-0.49759).

Figure 2. Identification and construction of the CRGs signature. (A) 19 prognostic CRGs were identified through univariate cox analysis (p < 0.05). (B) The consensus score matrix of the GSE53625 cohort when k = 2. (C) The CDF curves of consensus matrix for each k, where k ranges from 2 to 6. (D) A heatmap depicted the expression levels of 19 prognostic CRGs, accompanied by clinical characteristic annotations for each cluster. (E) The Kaplan-Meier survival curve depicted significant different overall survival between the two clusters (p = 0.018). (F) A volcano plot depicted DEGs between the two clusters with criteria of |logFC| > 0.585 and p value < 0.05. (G) Univariate cox regression analysis was conducted to identify prognostic DEGs with a significance level of p < 0.05. (H, I) The coefficient profile of prognostic DEGs was determined by Lasso regression analysis. The optimal λ was achieved when the partial likelihood deviance reached the minimum value. (J) The coefficients of the 6 prognostic DEGs (PTX3, CILP, CFHR4, SULT1B1, IL5RA and FAM151A), which were utilized to construct the CRGs signature, were obtained from multivariate cox analysis. CRGs, coagulation-related genes; DEGs, different expression genes.
3.2 Evaluation of the CRGs signature
The OS status and risk score distribution for GSE53625 training, testing, and entire cohorts were depicted in Figures 3D–I. Besides, within the aforementioned three cohorts, notably poorer prognosis was detected in high-risk group (Figures 3A–C). Additionally, the validity of signature prediction was corroborated by the TCGA-ESCC, GSE53624, and GSE53622 cohorts (Figures 3M–O). The time-dependent ROC of the signature was plotted (Figures 3J–L, P–R). The results indicated that across all cohorts, the AUC values at 1–5 years all exceeded 0.6. This observation evidenced high specificity and sensitivity. Furthermore, a random-effects meta-analysis was conducted on the hazard ratios (HR) across the above four cohorts (GSE53625, TCGA-ESCC, GSE53624, and GSE53622), and the results showed that the CRGs signature was a risk factor for OS in ESCC (HR = 1.73, 95% CI = 1.52 - 1.97, I2 = 0, illustrated in Supplementary Figure 1C).
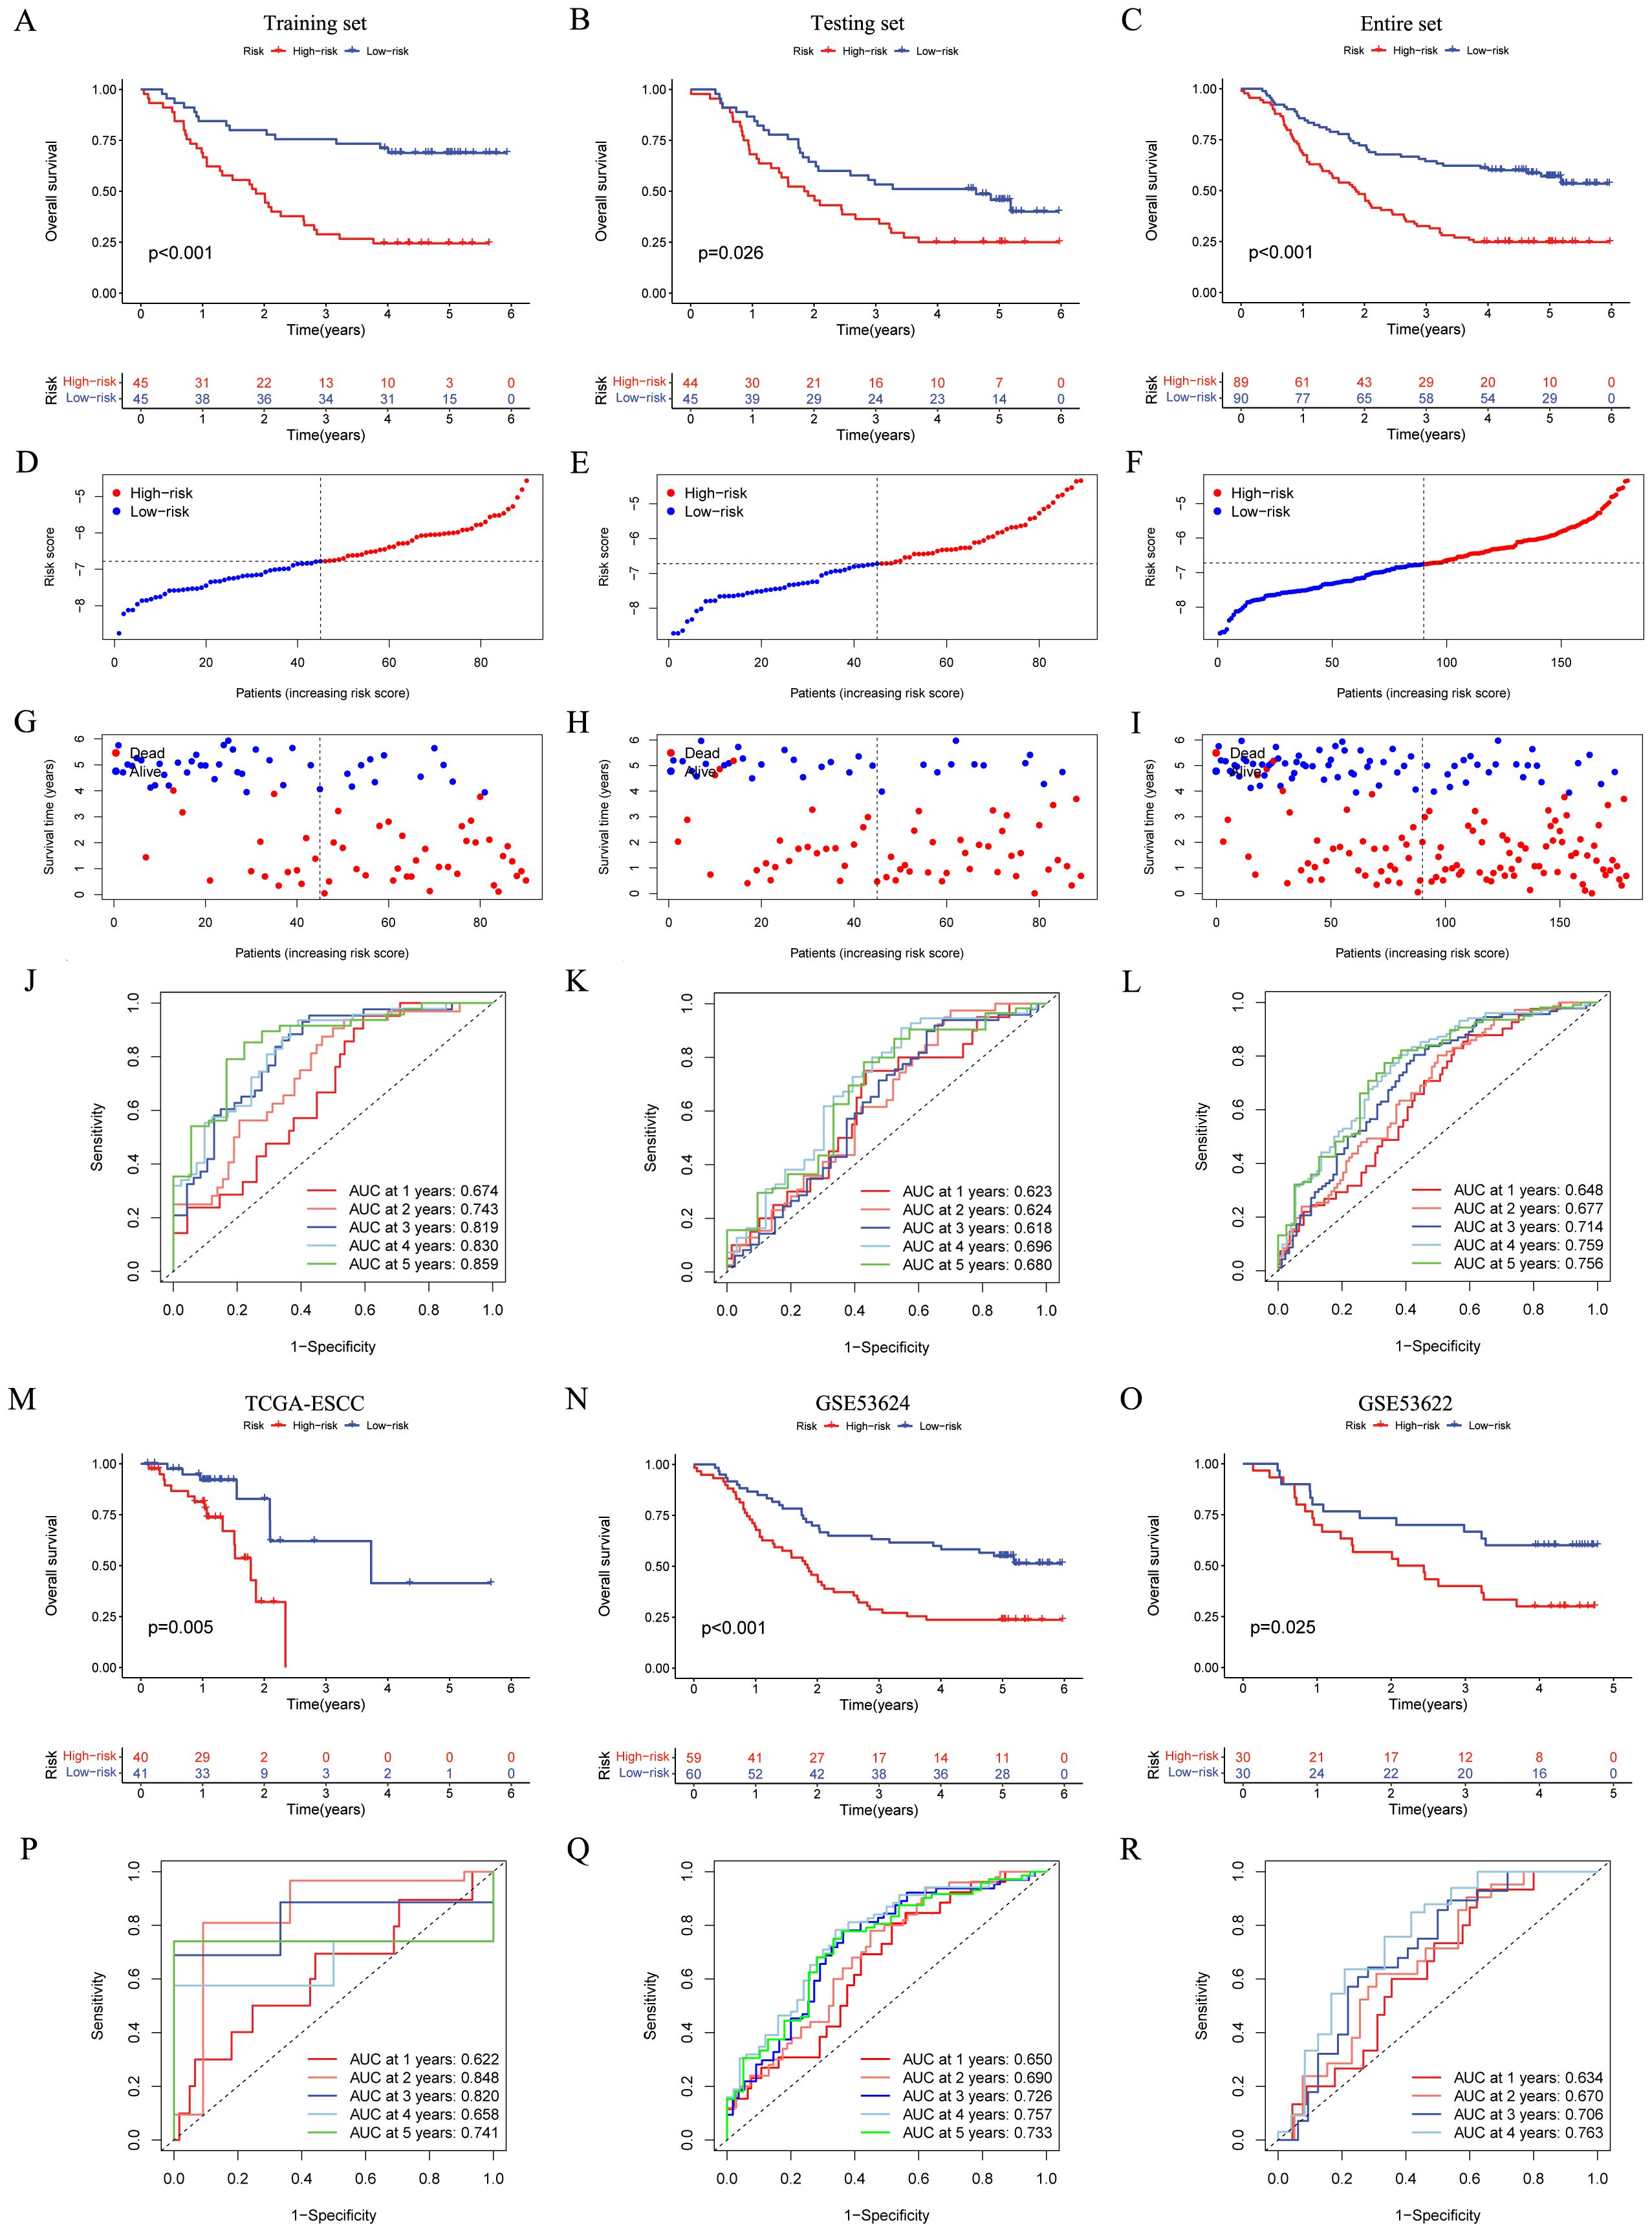
Figure 3. Establishment and validation of the CRGs signature in both internal and external cohorts. (A–C) Overall survival of patients in different risk groups in the GSE53625 training (n = 90, p < 0.001), testing (n = 89, p = 0.026), and entire (n = 179, p < 0.001) cohorts was analyzed, with low CRGs group showing better outcomes. (D–I) The distribution of risk scores (D–F) and OS status (G–I) for each patients in the GSE53625 training, testing, and entire cohorts. (J–L) Time-dependent ROC curves for predicting 1-, 2-, 3-, 4-, and 5-year OS in the GSE53625 training, testing, and entire cohorts. (M–R) Kaplan–Meier analysis and time-dependent ROC curves in three external validation cohorts: TCGA-ESCC, GSE53624, and GSE53622. CRGs, coagulation-related genes; OS, overall survival; ROC, Receiver operating characteristic; ESCC, esophageal squamous cell carcinoma.
Figures 4A–C illustrated that the CRGs signature shows a clear grouping effect as revealed by PCA. Moreover, we investigated the influence of clinical features on the CRGs signature, as depicted in Figures 4D–K, within subgroups including age, T, N and stage, the prognosis of the low-risk group was better. Furthermore, we conducted a comparison of the CRGs signature with 32 previously published prognostic signatures. The findings indicated that in the GSE53625, TCGA-ESCC, GSE53624, and GSE53622 cohorts, the CRGs signature was more effective in comparison to other published signatures (Figures 4L–O). In conclusion, these above results emphasized the remarkable predictive accuracy of CRGs signature in forecasting the prognosis of ESCC patients.
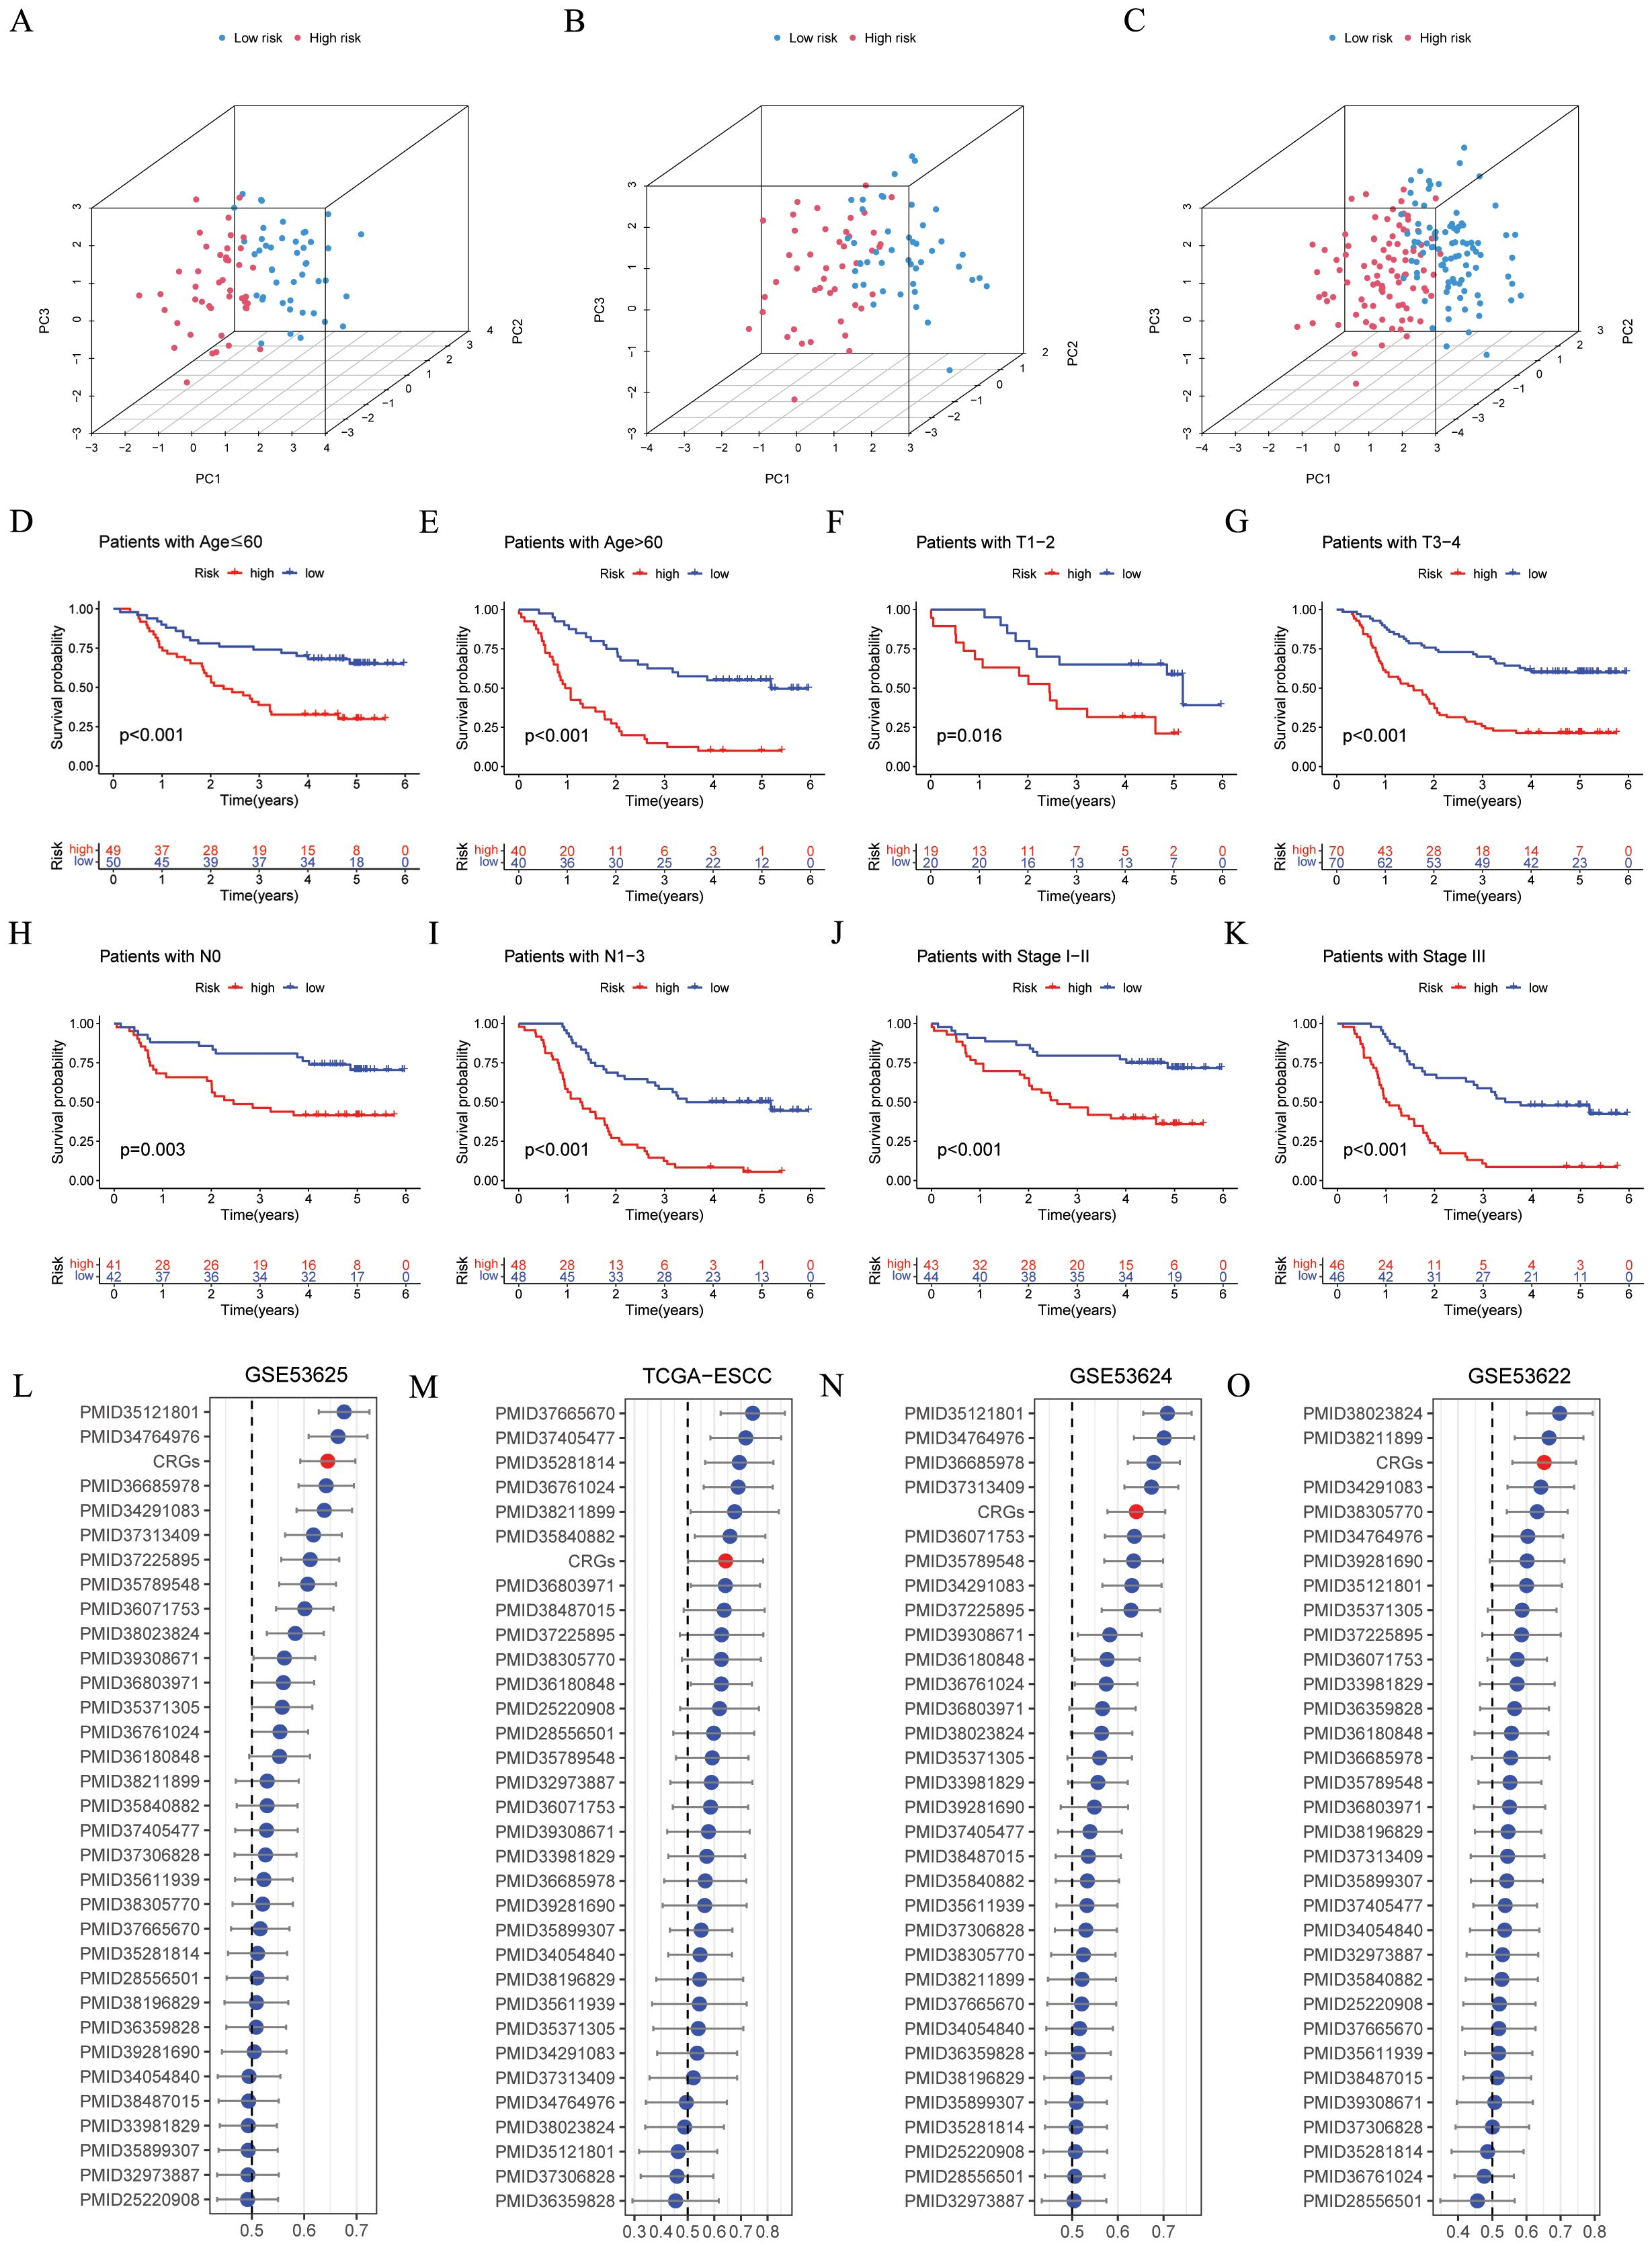
Figure 4. Evaluation of the CRGs signature performance. (A–C) PCA analyses for the CRGs signature were conducted in the GSE53625 training (n = 90), testing (n = 89), and entire (n = 179) cohorts. (D–K) Kaplan–Meier curves of OS according to the CRGs score in the GSE53625 subgroup (D) patients with Age ≤ 60 years, p < 0.001; (E) patients with Age > 60 years, p < 0.001; (F) patients with T1-2, p = 0.016; (G) patients with T3-4, p = 0.001; (H) patients with N0, p = 0.003; (I) patients with N1-3, p < 0.001; (J) patients with Stage I- II, p < 0.001; (K) patients with Stage III, p < 0.001, with low CRGs group showing better outcomes. (L–O) C-index analysis CRGs and 32 previously published signatures in GSE53625 (n = 179), TCGA-ESCC (n = 81), GSE53624 (n = 119), and GSE53622 (n = 60) cohorts. CRGs, coagulation-related genes; PCA, principal component analysis; OS, overall survival; ESCC, esophageal squamous cell carcinoma.
3.3 Independent prognosis analysis of CRGs signature and establishment of the Nomogram model
We utilized univariate and multivariate cox analyses in the GSE53625 (Figures 5A, B), GSE53624 (Figures 5C, D), and GSE53622 (Figures 5E, F) cohorts to explore the prognostic implications of CRGs signature alongside various clinical features. In the cohorts mentioned above, the CRGs signature was demonstrated to be an independent prognostic risk factor (p < 0.05), emphasizing its significant prognostic potential. Next, a nomogram was developed that integrates risk scores with several clinical features, illustrated in Figure 5G. Time-dependent ROC analysis indicated that this nomogram possessed high sensitivity and specificity (Figure 5H). The calibration curve verified the feasibility of this nomogram in practical settings (Figure 5I). The outcomes of DCA indicated and the C index indicated that, in comparison to other clinical features, this nomogram possessed stronger predictive power and a higher net clinical benefit (Figures 5J, K). Overall, this nomogram holds the potential to emerge as an effective instrument for the accurate prognosis of patients with ESCC.

Figure 5. Independent prognostic analysis and construction of a nomogram. (A–F) Based on univariate and multivariate cox analysis, CRGs signature was an independent prognostic risk factor in the GSE53625 (A, B, n = 179), GSE53624 (C, D, n = 119), and GSE53622 (E, F, n = 60) cohorts. (G) A nomogram was established based on the CRGs signature in the GSE53625 cohort. (H) ROC curves presenting the prediction performance of the nomogram in 1-, 2-, 3-, 4-, and 5-year OS. (I) The calibration curve of the nomogram for OS at 1, 3, and 5 year (J) A comparison of the C index was made between the nomogram and other clinical features. (K) Decision curve analysis presented the net benefit by applying the nomogram and other clinical features. CRGs, coagulation-related genes; OS, overall survival; ROC, Receiver operating characteristic. ***p < 0.001.
3.4 Function enrichment analysis
The DEGs (illustrated in Figure 6A and Supplementary Table 6) were mainly concentrated in “Inflammatory mediator regulation of TRP channels” and “Complement and coagulation cascades” (as shown in Figure 6B). GO analysis reveals a notable enrichment within the domain of biological process (BP), specifically in relation to “cellular developmental process” and “cell differentiation” (Figure 6C). Additionally, the GSEA analysis revealed that the high-risk groups predominantly display the activation of multiple cancer-associated signaling pathways, such as “UV RESPONSE DN” and “EPITHELIAL MESENCHYMAL TRANSITION”. Alternatively, the low-risk group was predominantly marked by “KRAS SIGNALING DN” and “P53 PATHWAY” (Figure 6D). The correlation analysis between CRGs scores and hallmarks pathway scores further indicated that CRGs scores was strongly associated with cancer-related biological processes and metabolic pathways (Figure 6E). To sum up, these results suggested that the activation or inhibition of these pathways might give rise to distinct prognostic outcomes observed in different CRGs signature subgroups.

Figure 6. Functional enrichment analyses. (A) The volcano plot showing the DEGs between different risk groups in the GSE53625 cohort (n = 179) with criteria of |logFC| > 0.585 and FDR < 0.05. (B, C) KEGG and GO enrichment analyses revealing the potential pathways enriched by the DEGs between different risk groups. (D) The differences in hallmark pathway activities scored by GSEA between different risk groups. (E) The correlation between the risk score and hallmark pathway activities scored by GSEA. DEGs, different expression genes. KEGG, Kyoto Encyclopedia of Genes and Genomes; GO, Gene Ontology; GSEA, Gene Set Enrichment Analysis.
3.5 Analysis of tumor microenvironment
Patients with high-risk ESCC exhibited notably elevated immune, stromal, and estimate scores, in conjunction with decreased tumor purity score (Figures 7A, C, E, G). Besides, the risk score was positively correlated with immune, estimate, and stromal scores (Figures 7B, D, F). In contrast, a negative correlation was observed in tumor purity (Figure 7H). By utilizing the ssGSEA algorithm and the Wilcoxon test, notable differences were found (Figure 7I). Specifically, activated dendritic cells, fibroblasts, and macrophages M0 were notably more common in patients with high-risk ESCC. In contrast, in low-risk ESCC patients, there was a higher abundance of activated mast cells, naive CD4 T cells, and plasma cells. Besides, Pearson correlation analysis pinpointed 8 immune cells (p < 0.05, Figure 7J). Moreover, five intersecting immune cell types were identified (Figure 7K). Then, researchers evaluated the associations among the 6 CRGs and immune cells (Figure 7L). Thereafter, the two risk groups exhibited disparities in HLA enrichment (Figure 7M). Finally, an analysis of immune checkpoints (ICs) was performed, and seventeen ICs exhibited notable (p < 0.05, Figure 7N). These findings underscored the distinctions in immune cell infiltration between CRGs signature subgroups.

Figure 7. The immune landscape associated with the CRGs signature in ESCC. In the GSE53625 cohort (n = 179), (A–H) the Wilcoxon’s rank sum test and correlation analysis were employed to quantitatively assess the distinct immune statuses between risk groups in terms of the immune score, stromal score, estimate score, and tumor purity. (I) The ssGSEA algorithm was employed to analyze the differences in immune cells between different risk groups. (J) Pearson correlation analysis was conducted to evaluate the correlations between immune cells and risk scores. (K) A Venn plot depicted the intersection of the ssGSEA algorithm and correlation analysis. (L) Pearson correlation analysis was conducted to evaluate the correlations between immune cells and 6 model CRGs. (M) The ssGSEA algorithm was used to analyze differences in immune functions between different risk groups. (N) Box plot of expression difference of 17 immune checkpoints between different risk groups. CRGs, coagulation-related genes; ESCC, esophageal squamous cell carcinoma; ssGSEA, single sample gene set enrichment analysis. *: p < 0.05, **: p < 0.01, ***: p < 0.001, ****: p < 0.0001.
3.6 Comparison of TMB and Immunotherapy response in high- and low-risk groups
Initially, in the TCGA-ESCC cohort, the waterfall plot was employed to depict the somatic mutation landscape (Figure 8A). Subsequent analysis unveiled patients within low-risk subgroup possessed higher TMB levels (Figure 8B), and the risk score was inversely related to TMB (R = -0.25, p = 0.025, Figure 8C). Moreover, the results suggested that patients in the “high risk + high TMB” category exhibited the poorest prognosis (Figure 8D, p = 0.031). Furthermore, we assessed the MSI score between different risk groups. No significant disparity in MSI score between different risk groups was detected (Supplementary Figure 1D), and no significant correlation existed between the risk score and the MSI score (Supplementary Figure 1E).
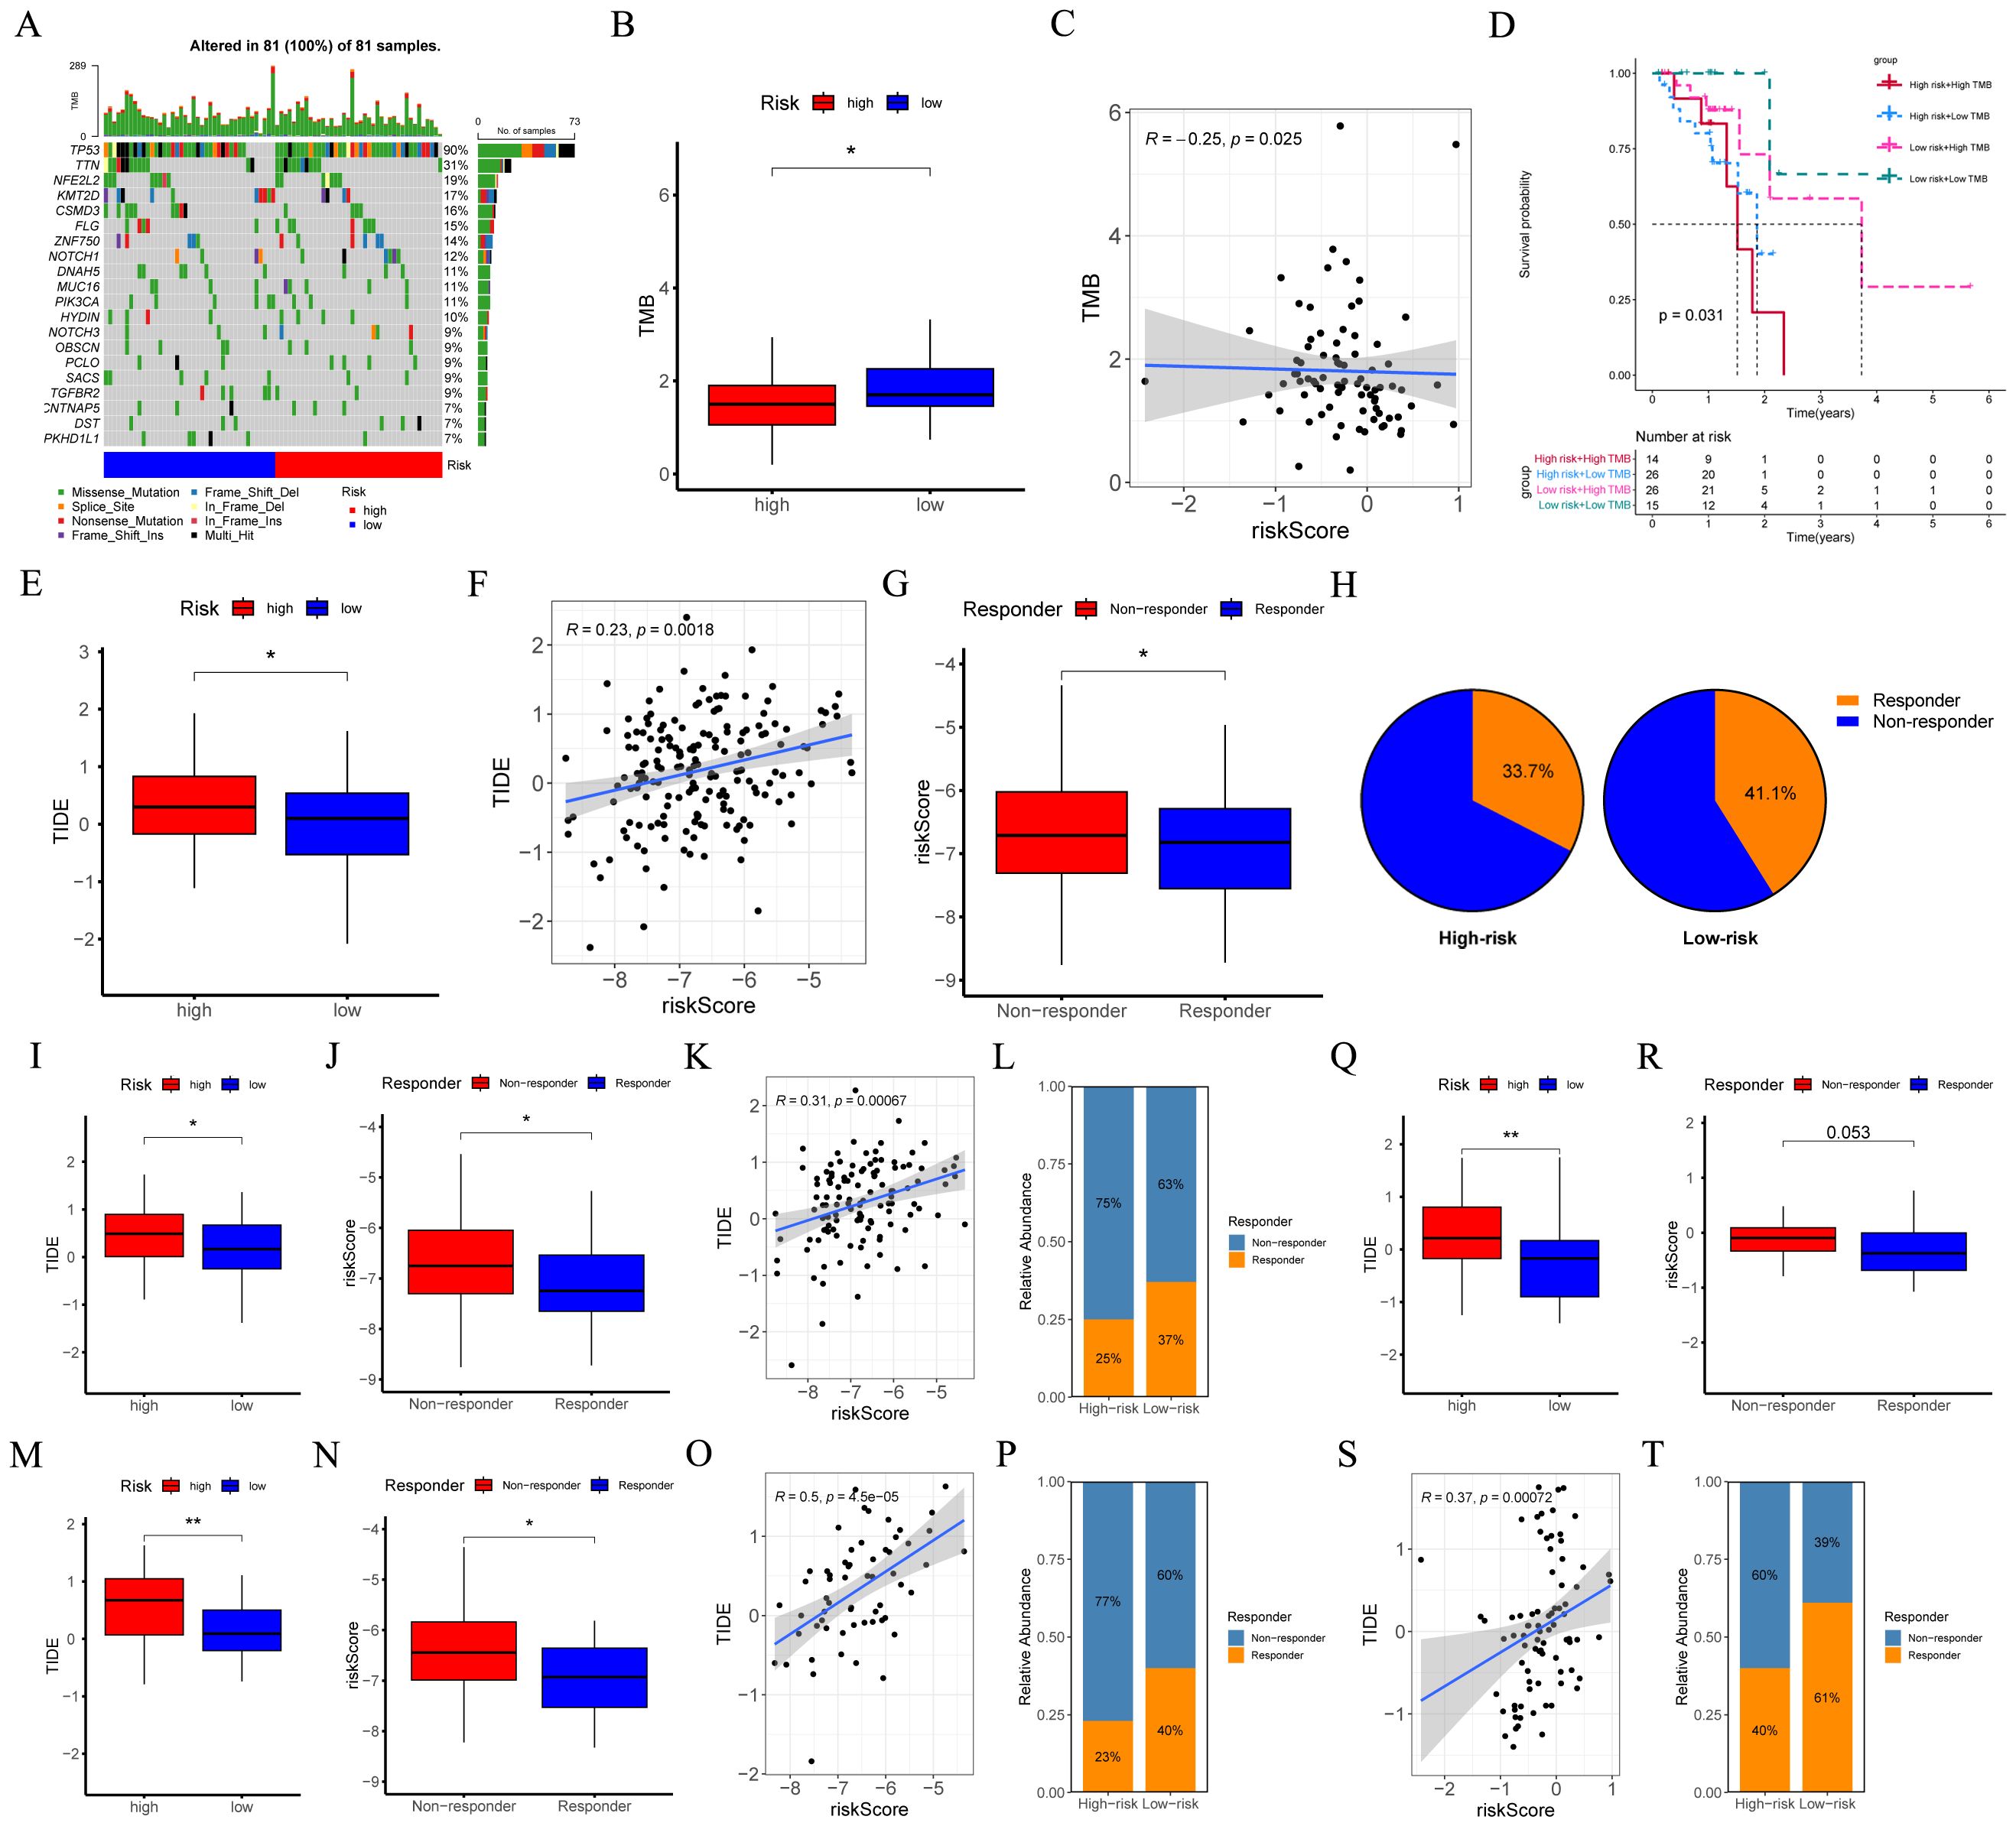
Figure 8. Evaluation of TMB and responsiveness to immunotherapy between different risk groups. (A) The waterfall plot of the somatic mutation landscape within high- and low-risk patients in the TCGA-ESCC cohort (n = 81). (B) Boxplots depicted the difference in TMB between high- and low-risk groups. (C) The correlation scatter plot depicted the relationship between TMB and risk score. (D) The Kaplan-Meier survival curve depicted different overall survival (p = 0.031) across four subgroups (high-risk and high-TMB, high-risk and low-TMB, low-risk and high-TMB, low-risk and low-TMB). (E, I, M, Q) Boxplots of the difference in TIDE between the high- and low-risk groups across GSE53625 (n = 119), GSE53624 (n = 119), GSE53622 (n = 60), and TCGA-ESCC (n = 81) cohorts. (F, K, O, S) The scatter plot showed the correlation between risk score and TIDE across GSE53625, GSE53624, GSE53622, and TCGA-ESCC cohorts. (G, J, N, R) Boxplots of the difference in risk score between non-response and response groups across GSE53625, GSE53624, GSE53622, and TCGA-ESCC cohorts. (H, L, P, T) The percentages of immunotherapy responders in the high-risk group compared to the low-risk group across GSE53625, GSE53624, GSE53622, and TCGA-ESCC cohorts. TMB, tumor mutational burden; ESCC, esophageal squamous cell carcinoma; TIDE, tumor immune dysfunction and exclusion. *: p < 0.05, **: p < 0.01.
We employed TIDE to assess the potential of the immunotherapy response between different risk groups. Analyses of the GSE53625, GSE53624, GSE53622, and TCGA-ESCC cohorts revealed that, when compared with low-risk ESCC patients, the TIDE score in high-risk ESCC patients was relatively higher. (Figures 8E, I, M, Q). Moreover, as opposed to the responder group, the average risk score of the non-responder group exhibited an upward tendency (Figures 8G, J, N, R). Additionally, a positive correlation was identified (Figures 8F, K, O, S). Furthermore, in the aforementioned four cohorts, a higher proportion of patients in the low-risk group were predicted to respond effectively to immunotherapy (Figures 8H, L, P, T). These findings indicated that the CRGs signature hold substantial potential in predicting the response to immunotherapy.
3.7 Drug sensitivity analysis
Through Pearson correlation analysis, nine drugs with the strongest correlation between IC50 values and risk scores were screened out. Patients with high-risk ESCC showed higher sensitivity to Erlotinib, Acetalax, Gefitinib, Afatinib, Ibrutinib, Sapitinib, AZD3759, Lapatinib, and SCH772984 (Figures 9A–I). The results of the Wilcoxon test revealed that notable statistical differences were identified (p < 0.05). The findings may provide insights into the selection of potential treatment options to inhibit the malignant progression of cancer.

Figure 9. Exploration of drug compounds targeting the CRGs. In the GSE53625 cohort (n = 179), (A–I) correlation scatter plot depicting the relationship of IC50 of the top 9 candidate drugs and risk score, and boxplots depicting the difference in IC50 of candidate drugs between high- and low-risk groups, with statistical significance assessed via the Wilcoxon rank sum test. Pearson correlation analysis was performed to assess the correlations between risk score and candidate drugs. CRGs, coagulation-related genes; IC50, the half-maximal inhibitory concentration. ****: p < 0.0001.
3.8 Identification of model CRGs in single−cell transcriptome
Figure 10A depicted the integration results of 7 ESCC patients after eliminating the batch effect. Subsequently, the cells were classified into nine clusters (Figure 10B), and Figure 10D illustrated the three marker genes in each cell clusters. Moreover, the histogram presented the proportions of cell clusters in the 7 samples (Figure 10C). Finally, the expression patterns of five model CRGs were analyzed (Figures 10E–J), and FAM151A was not detected in this dataset. The research findings showed that the expressions of five model CRGs exhibited significant differences. Specifically, SULT1B1 was predominantly expressed in fibroblasts.
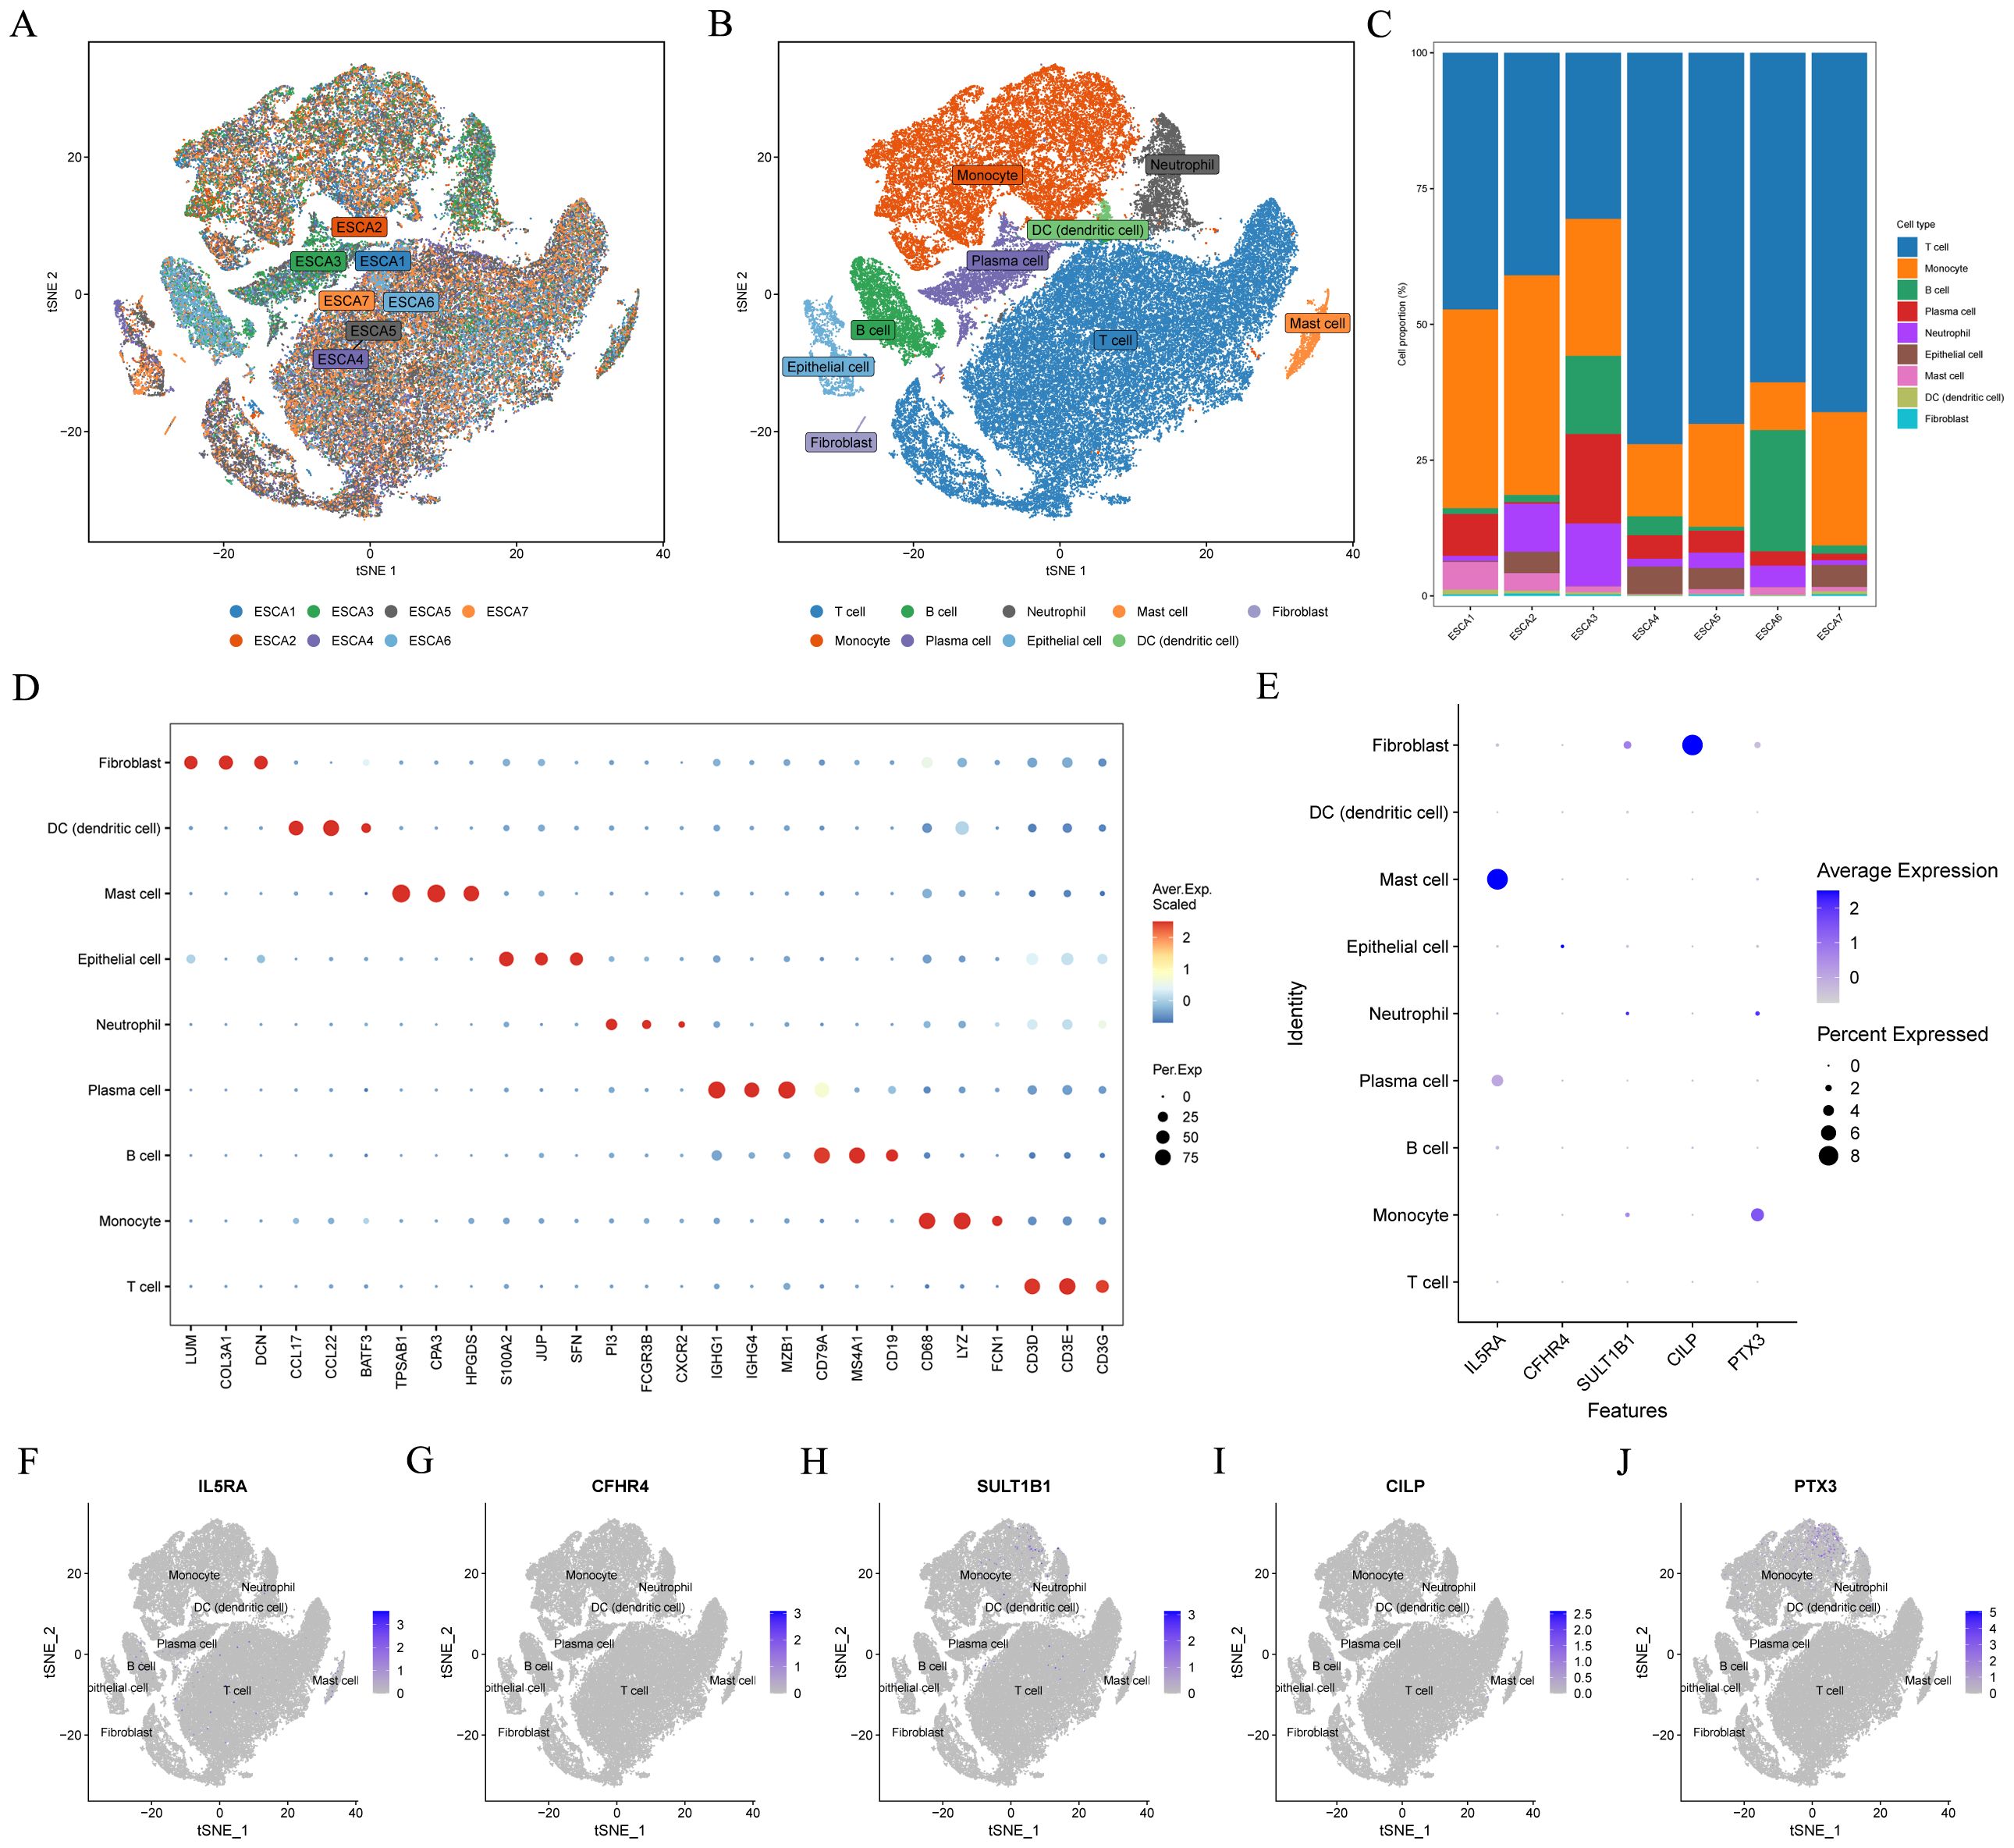
Figure 10. Single-cell sequencing data analysis. In the GSE145370 dataset (n = 7), (A) tSNE plot of cell distribution in 7 patients with ESCC. (B) tSNE plot for visualizing clustering profiles. (C) Proportion of each cell population in different samples. (D) Heatmap showing the top 3 unique marker genes in each cellular subpopulation. (E–J) The five model CRGs levels in each cellular subpopulation. ESCC, esophageal squamous cell carcinoma; t-SNE, t-distributed stochastic neighbor embedding.
3.9 SULT1B1 inhibits ESCC tumor proliferation and migration
In the GSE53625 cohort, consisting of 179 tumor samples and 179 normal adjacent samples, the capacity of six model CRGs to predict tumor states was assessed utilizing ‘pROC’ R package. The ROC results indicated that among the six model CRGs, SULT1B1 exhibited the highest accuracy in predicting the tumor status (Figure 11A). Consequently, we selected it as the focal point and investigated its role in ESCC. Initially, by accessing various online databases, such as GEPIA (http://gepia.cancer-pku.cn/), TNMplot (https://tnmplot.com), and Kaplan-Meier plotter (http://kmplot.com), we analyzed the expression level and prognosis of SULT1B1 in ESCC patients. The analysis revealed that, in comparison with normal tissues, a notable down-regulation of SULT1B1 was detected in ESCC cancer tissues (Figures 11B, D). Additionally, when compared with the SULT1B1-lower group, higher SULT1B1 patients expression presented better OS (Figure 11C). Furthermore, we conducted a comparison of the expression of SULT1B1 across five transcriptome cohorts retrieved from the GEO databases. The findings indicated that, in comparison with normal tissues, SULT1B1 was significantly down-regulated in ESCC cancer tissues (Figures 11E–I). Moreover, in the four prognostic cohorts, it was noted that, in compared to the SULT1B1-lower group, ESCC patients with higher SULT1B1 expression demonstrated better OS (Figures 11J–M). Subsequently, we examined three pairs of clinical ESCC tissue samples. The results showed that compared to the paired normal tissues, ESCC cancer tissues demonstrated decreased SULT1B1 expression (Figure 12A). The collected data proposed that SULT1B1 might have a tumor-suppressing function in the progression of ESCC.

Figure 11. Low expression of SULT1B1 is associated with poor prognosis in ESCC. (A) In the GSE53625 cohort (tumor samples = 179 and normal samples = 179), the six model CRGs were analyzed with the ‘pROC’ R package. (B, D) The mRNA expression level of SULT1B1 in esophageal cancerous tissues and normal tissues were assessed using the GEPIA and TNMplot databases. (C) The Kaplan-Meier survival curve depicted different overall survival (p = 0.00021) between the high- and low-SULT1B1 groups using Kaplan-Meier plotter database. (E–I) Boxplots of the difference in the mRNA expression level of SULT1B1 between tumor and normal groups across the GSE20347, GSE38129, GSE53625, GSE53624, and GSE53622 cohorts. (J–M) The Kaplan-Meier survival curve depicted different overall survival between the high- and low-SULT1B1 groups across the TCGA-ESCC, GSE53625, GSE53624, and GSE53622 cohorts. ESCC, esophageal squamous cell carcinoma. *: p < 0.05, **: p < 0.01, ****: p < 0.0001.
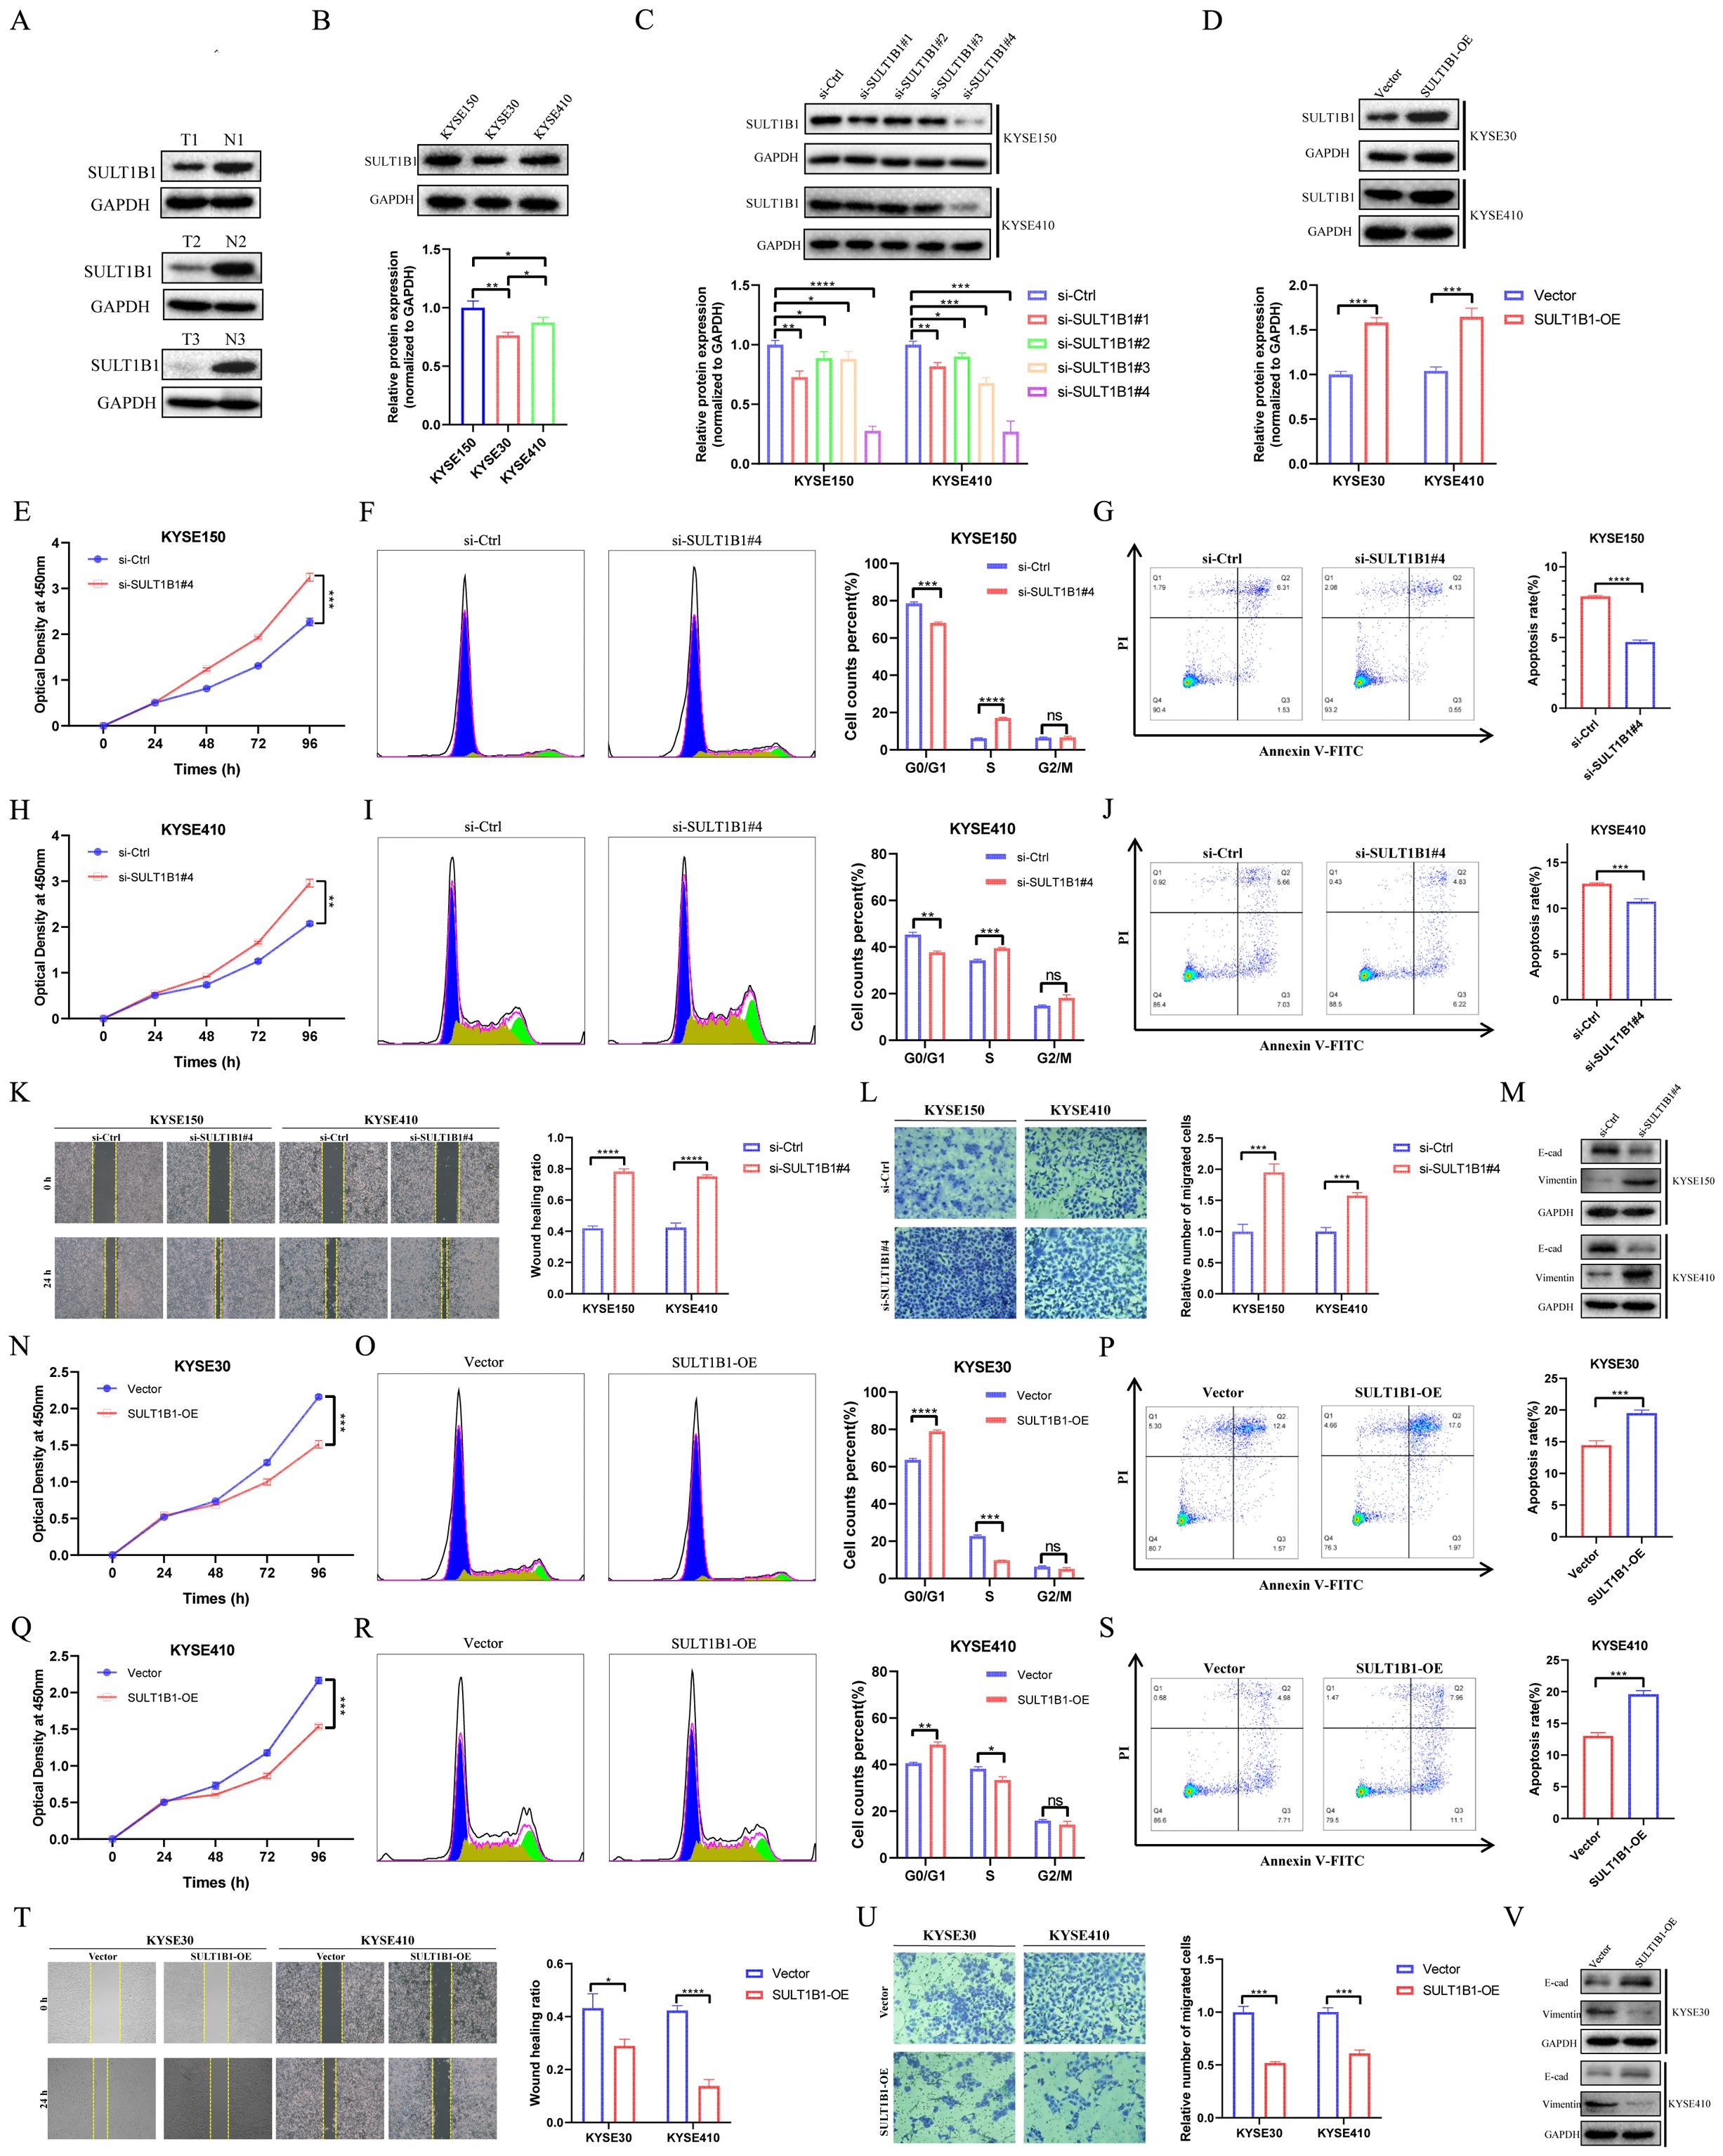
Figure 12. Effects of SULT1B1 on cell proliferation and migration in ESCC cell lines. (A) The expression of SULT1B1 protein in ESCC tissues and pericarcinomatous tissues was detected via western blot. (B) The protein expression levels of SULT1B1 in various ESCC cell lines with statistical analysis. (C) Western blot experiment validated the siRNA knockdown effect in KYSE150 and KYSE410 cells with statistical analysis. (D) Western blot experiment validated the SULT1B1 overexpression in KYSE30 and KYSE410 cells with statistical analysis. (E, H, N, Q) The results of CCK-8 assay in ESCC cells. (F, I, O, R) The effect of knockdown and overexpression of SULT1B1 on the cell cycle of ESCC was detected by flow cytometry. (G, J, P, S) The effect of knockdown and overexpression of SULT1B1 on the apoptosis of ESCC was detected by flow cytometry. (K) The results of scratch wound healing assay of KYSE150 and KYSE410 cells treated with siRNA or negative control of SULT1B1. (L) The results of transwell assay carried out in KYSE150 and KYSE410 cells treated with siRNA or negative control of SULT1B1. (M) Expression of E-cad and Vimentin in si-Ctrl group and si-SULT1B1 group in KYSE150 and KYSE410 cells via western blot. (T) The results of scratch wound healing assay of KYSE30 and KYSE410 cells with SULT1B1 overexpression. (U) The results of transwell assay carried out in KYSE30 and KYSE410 cells with SULT1B1 overexpression. (V) Expression of E-cad and Vimentin in vector group and SULT1B1-OE group in KYSE30 and KYSE410 cells via western blot. ESCC, esophageal squamous cell carcinoma. E-cad, E-cadherin. *: p < 0.05, **: p < 0.01, ***: p < 0.001, ****: p < 0.0001.
To investigate the role of SULT1B1, we initially assessed the basal protein expression levels of SULT1B1 in KYSE150, KYSE30, and KYSE410 (Figure 12B). The results indicated that SULT1B1 exhibited high expression in KYSE150 cell line, moderate expression in KYSE410 cell line, and low expression in the KYSE30 cell line. Subsequently, SULT1B1 was knocked down in the KYSE150 and KYSE410 cell lines (Figure 12C), while it was overexpressed in the KYSE30 and KYSE410 cell lines (Figure 12D). The efficiency of overexpression and knockdown was substantiated by western Blot analysis. Here, the subsequent experiments utilized si-SULT1B1#4, as it exhibited a higher level of knockdown efficacy. The CCK8 assay results demonstrated that the knockdown of SULT1B1 was capable of promoting the tumor cell proliferation of KYSE150 and KYSE410 cells (Figures 12E, H). Conversely, the overexpression of SULT1B1 was able to suppress the proliferation of KYSE30 and KYSE410 cells (Figures 12N, Q). Flow cytometry analysis revealed that upon knockdown of SULT1B1 in KYSE150 and KYSE410 cells, the proportion of cells in the G0/G1 phase showed a decline, whereas the proportion of cells in the S phase exhibited an increase (Figures 12F, I). Additionally, the apoptosis rate decreased (Figures 12G, J). Conversely, after the overexpression of SULT1B1 in KYSE30 and KYSE410 cells, the proportion of cells in the G0/G1 phase showed an upward trend, whereas the proportion of cells in the S phase declined (Figures 12O, R). Moreover, the apoptosis rate increased (Figures 12P, S). Results from the scratch assay and transwell invasion experiments confirmed that knockdown of SULT1B1 promoted the migration of KYSE150 and KYSE410 cells (Figures 12K, L), while overexpression of SULT1B1 inhibited the migration of KYSE30 and KYSE410 cells (Figures 12T, U). The findings of western Blot analysis indicated that upon the knockdown of SULT1B1, the expression of E-cadherin significantly decreased, while that of Vimentin significantly increased (Figure 12M). Conversely, when SULT1B1 was overexpressed, an opposite outcome was observed (Figure 12V). In summary, the findings of our research indicated that SULT1B1 is capable of effectively suppressing the proliferation and migration of ESCC cells. Further mechanistic investigations confirmed that its tumor-suppressing function is achieved through promoting cell cycle arrest at the G0/G1 phase, inducing apoptosis, and suppressing the epithelial-mesenchymal transition (EMT) process.
4 Discussion
ESCC is a kind of malignant tumor characterized by a high incidence and mortality rate. Given the complexity and high heterogeneity of ESCC, solely relying on the clinical and histopathological characteristics of patients does not adequately predict the prognosis of ESCC patients. Due to the remarkable progress of bioinformatics technology, it has now become practicable to predict the prognosis of patients via genetic analysis (34, 35). Hypercoagulable state is highly prevalent in malignant tumors (16, 17). This state facilitates the proliferation and migration of tumor cells, along with the remodeling of the immune microenvironment (18–21). Recent studies indicate that the CRGs signature is highly significant in forecasting the outcomes for patients with diverse cancers, such as colon adenocarcinoma (15), hepatocellular carcinoma (21), and lung adenocarcinoma (16), as well as the responses to immunotherapy. Nevertheless, the role it plays ESCC remains elusive. In this study, we carried out comprehensive analyses and validations across multiple ESCC cohorts, and successfully developed a novel CRGs prognostic signature. When compared with the previously reported 32 prognostic signatures, the CRGs signature demonstrated superior performance over most of the other published signature in ESCC prognostic cohorts. In summary, this signature has been utilized across multiple cohorts, and its effectiveness as a prognostic marker and for examining the efficacy of immunotherapy responses has been preliminarily verified, with the ultimate goal of enhancing the OS of ESCC patients.
In this research, we initially identified prognostic CRGs in patients with ESCC. Next, patients were sorted into two different clusters with cluster 1 having a poorer prognosis. By analyzing the DEGs between different clusters, we constructed a CRGs signature composed of six genes: PTX3, CILP, CFHR4, SULT1B1, IL5RA, and FAM151A. The efficacy of CRGs signature as prognostic predictors was validated in the training and multiple validation cohorts. Among the six model CRGs, SULT1B1 demonstrates the highest accuracy in predicting the tumor status. The SULT family of enzymes is involved in catalyzing the sulfonation process for a wide range of internal, medicinal, and foreign compounds (36). This family encompasses three subfamilies, namely SULT1, SULT2, and SULT4, encompassing a total of 13 distinct members (37). SULT1B1 is a member of the SULT1 family. Research has revealed that the expression level of SULT1B1 is highest in the human intestine. Moreover, it is moderately expressed in the human liver, kidney, lung, and white blood cells (38–40). Despite the role of SULT1B1 in ESCC remains uninvestigated, it is postulated to be associated with carcinogenesis (41). Moreover, numerous studies conducted in recent years have revealed that SULT1B1 might exhibit tumor suppressive activity in a diverse range of cancers. For instance, Eskandarion, M. R. et al. (42) discovered that SULT1B1 exhibited downregulation in gastric cancer and upregulation in intestinal metaplasia. This finding implies that SULT1B1 may possess tumor-suppressive activity during GC progression. In Cholangiocarcinoma, SULT1B1 is closely associated with tumor differentiation. Notably, in CCA, SULT1B1 is lowly expressed (43). Regarding colorectal cancer, the suppression of SULT1B1 is closely linked to tissue dedifferentiation. Moreover, the low expression level of SULT1B1 is associated with a poor survival rate (40, 44–46). In our investigation, through online databases and multiple cohorts, we discovered that the mRNA level of SULT1B1 in ESCC tissues was decreased, and low SULT1B1 was linked to poor survival rates. Correspondingly, the experimental findings indicated that, in ESCC tissues, the SULT1B1 protein levels were remarkably lower. Additionally, our cell-based experiments demonstrated that SULT1B1 exerts a tumor-suppressing effect by modulating cell proliferation and migration.
Recently, immunotherapy has emerged as an effective and highly promising treatment modality for cancer therapy (47, 48). Notwithstanding, only a limited number of patients derive benefits from it (49). Consequently, accurate prediction is of crucial for identifying those patients who are likely to respond favorably to immunotherapy. Our findings indicated that immunotherapy is more likely to elicit a positive response in patients with low-risk ESCC. Additionally, numerous studies have indicated that TMB levels could increase the potency of IC inhibitors (50–53). In this study, patients with low-risk ESCC exhibited higher TMB levels and demonstrated a more robust response to immunotherapy. This finding is in line with the conclusion mentioned above. Moreover, considering the TME’s significant influence on tumor growth and evolution (54, 55), a comprehensive investigation of the TME associated with signature in ESCC is conducive to elucidating its function in the anti-tumor immune response (10). The results showed that, within high-risk subgroup, the level of immune infiltration was higher, with a significant increase in fibroblasts and M0 macrophages. Notably, Cancer-associated fibroblasts, as the fundamental parts of TME, are vital to the development of cancer (56). Research has repeatedly that Cancer-associated fibroblasts can secrete various matrix metalloproteinases and other proteases to remodel the extracellular matrix, thereby leading to tissue hardening, promoting tumor survival, invasion and metastasis, therapy resistance, and immune exclusion (57–62). Furthermore, notable intergroup disparities in IC expression were observed. Given that IC play a critical importance in determining the efficacy of immunotherapy (10, 63), herein we postulate that this could potentially be one of the contributing factors underlying the differences in immunotherapy responses between risk groups. In summary, multiple cohorts have confirmed that CRGs signature is effective in predicting the response to immunotherapy. It should be noted that there is a lack of relevant data regarding immunotherapy in the ESCC cohorts. The aforementioned conclusion was derived through bioinformatics analysis and lacks comprehensive validation in a real ESCC cohort.
Our research has certain limitations. First, in this study, the immunotherapy response prediction is algorithmic. The effectiveness of the CRGs signature in predicting the response to immunotherapy in real clinical environment remains to be validated. Second, while the predictive significance and effectiveness of the CRGs signature have been validated, given that the sample size of the publicly available dataset remains limited, it is essential in larger real-world ESCC cohorts. Third, owing to the limited experimental conditions, this study was unable to further elucidate the molecular mechanisms of the model genes in ESCC. In subsequent research, additional investigations are required to confirm the CRGs signature and delve into the underlying mechanisms.
In conclusion, this study systematically analyzed CRGs related to ESCC via a series of bioinformatics approaches. Subsequently, a robust CRGs signature consisting of PTX3, CILP, CFHR4, SULT1B1, IL5RA, and FAM151A was successfully constructed and validated. Additionally, the CRGs signature is also closely linked to the clinical features, TME, and immunotherapy response of ESCC, holding potential guiding implications for personalized clinical decision-making. Moreover, we have initially elucidated the tumor-suppressing function of SULT1B1 in ESCC. However, it should be noted that the immunotherapy response prediction is algorithmic. Looking ahead, it is essential to validate the prognostic accuracy and the efficacy of immunotherapy responses of the CRGs signature in larger real-world ESCC cohorts.
Data availability statement
Publicly available datasets were analyzed in this study. This data can be found here: Publicly available datasets were derived from GEO (accession number GSE53625, GSE53644, GSE53622, GSE20347, GSE38129, and GSE145370) and TCGA.
Ethics statement
The studies involving humans were approved by The Medical Ethics Committee of the Sixth Affiliated Hospital of Nantong University. The studies were conducted in accordance with the local legislation and institutional requirements. The participants provided their written informed consent to participate in this study.
Author contributions
RW: Writing – review & editing, Validation, Conceptualization, Formal analysis, Methodology, Writing – original draft, Data curation, Resources, Visualization. WZ: Visualization, Resources, Writing – original draft, Formal analysis, Validation, Methodology, Data curation, Conceptualization, Writing – review & editing. XL: Formal analysis, Resources, Data curation, Writing – original draft, Visualization, Validation, Conceptualization, Writing – review & editing, Methodology. HW: Writing – review & editing, Writing – original draft, Software, Validation, Methodology. YJ: Methodology, Writing – original draft, Supervision, Writing – review & editing, Software. JZ: Project administration, Methodology, Writing – review & editing, Software, Writing – original draft. JS: Writing – review & editing, Methodology, Software, Investigation, Writing – original draft, Supervision, Data curation, Funding acquisition, Formal analysis, Project administration, Conceptualization, Resources. ZY: Resources, Formal analysis, Project administration, Writing – original draft, Writing – review & editing, Data curation, Supervision, Investigation, Conceptualization, Software, Funding acquisition, Methodology.
Funding
The author(s) declare financial support was received for the research and/or publication of this article. This study was supported by Specialized Clinical Medicine Research Project of Nantong University (2024JY018 and YXY-Z 2023001).
Conflict of interest
The authors declare that the research was conducted in the absence of any commercial or financial relationships that could be construed as a potential conflict of interest.
Generative AI statement
The author(s) declare that no Generative AI was used in the creation of this manuscript.
Any alternative text (alt text) provided alongside figures in this article has been generated by Frontiers with the support of artificial intelligence and reasonable efforts have been made to ensure accuracy, including review by the authors wherever possible. If you identify any issues, please contact us.
Publisher’s note
All claims expressed in this article are solely those of the authors and do not necessarily represent those of their affiliated organizations, or those of the publisher, the editors and the reviewers. Any product that may be evaluated in this article, or claim that may be made by its manufacturer, is not guaranteed or endorsed by the publisher.
Supplementary material
The Supplementary Material for this article can be found online at: https://www.frontiersin.org/articles/10.3389/fimmu.2025.1662599/full#supplementary-material
References
1. Morgan E, Soerjomataram I, Rumgay H, Coleman HG, Thrift AP, Vignat J, et al. The global landscape of esophageal squamous cell carcinoma and esophageal adenocarcinoma incidence and mortality in 2020 and projections to 2040: new estimates from GLOBOCAN 2020. Gastroenterology. (2022) 163:649–658.e2. doi: 10.1053/j.gastro.2022.05.054
2. Chen W, Li H, Ren J, Zheng R, Shi J, Li J, et al. Selection of high-risk individuals for esophageal cancer screening: A prediction model of esophageal squamous cell carcinoma based on a multicenter screening cohort in rural China. Int J Cancer. (2021) 148:329–39. doi: 10.1002/ijc.33208
3. Deboever N, Jones CM, Yamashita K, Ajani JA, and Hofstetter WL. Advances in diagnosis and management of cancer of the esophagus. Bmj. (2024) 385:e074962. doi: 10.1136/bmj-2023-074962
4. Sung H, Ferlay J, Siegel RL, Laversanne M, Soerjomataram I, Jemal A, et al. Global cancer statistics 2020: GLOBOCAN estimates of incidence and mortality worldwide for 36 cancers in 185 countries. CA Cancer J Clin. (2021) 71:209–49. doi: 10.3322/caac.21660
5. Puhr HC, Prager GW, and Ilhan-Mutlu A. How we treat esophageal squamous cell carcinoma. ESMO Open. (2023) 8:100789. doi: 10.1016/j.esmoop.2023.100789
6. Wu HX, Pan YQ, He Y, Wang ZX, Guan WL, Chen YX, et al. Clinical benefit of first-line programmed death-1 antibody plus chemotherapy in low programmed cell death ligand 1-expressing esophageal squamous cell carcinoma: A post hoc analysis of JUPITER-06 and meta-analysis. J Clin Oncol. (2023) 41:1735–46. doi: 10.1200/jco.22.01490
7. Sangro B, Sarobe P, Hervás-Stubbs S, and Melero I. Advances in immunotherapy for hepatocellular carcinoma. Nat Rev Gastroenterol Hepatol. (2021) 18:525–43. doi: 10.1038/s41575-021-00438-0
8. Smyth EC, Lagergren J, Fitzgerald RC, Lordick F, Shah MA, Lagergren P, et al. Oesophageal cancer. Nat Rev Dis Primers. (2017) 3:17048. doi: 10.1038/nrdp.2017.48
9. Ye B, Jiang A, Liang F, Wang C, Liang X, and Zhang P. Navigating the immune landscape with plasma cells: A pan-cancer signature for precision immunotherapy. Biofactors. (2025) 51:e2142. doi: 10.1002/biof.2142
10. Zhang P, Zhang X, Cui Y, Gong Z, Wang W, and Lin S. Revealing the role of regulatory T cells in the tumor microenvironment of lung adenocarcinoma: a novel prognostic and immunotherapeutic signature. Front Immunol. (2023) 14:1244144. doi: 10.3389/fimmu.2023.1244144
11. Zheng Y, Chen Z, Han Y, Han L, Zou X, Zhou B, et al. Immune suppressive landscape in the human esophageal squamous cell carcinoma microenvironment. Nat Commun. (2020) 11:6268. doi: 10.1038/s41467-020-20019-0
12. Neubauer K and Zieger B. Endothelial cells and coagulation. Cell Tissue Res. (2022) 387:391–8. doi: 10.1007/s00441-021-03471-2
13. Göbel K, Eichler S, Wiendl H, Chavakis T, Kleinschnitz C, and Meuth SG. The coagulation factors fibrinogen, thrombin, and factor XII in inflammatory disorders-A systematic review. Front Immunol. (2018) 9:1731. doi: 10.3389/fimmu.2018.01731
14. Al-Koussa H, AlZaim I, and El-Sabban ME. Pathophysiology of coagulation and emerging roles for extracellular vesicles in coagulation cascades and disorders. J Clin Med. (2022) 11:4932. doi: 10.3390/jcm11164932
15. Wu X, Zhu L, Sun X, Xia M, Zhao S, Zhang B, et al. A novel risk stratification approach and molecular subgroup characterization based on coagulation related genes in colon adenocarcinoma. Cancer Cell Int. (2024) 24:309. doi: 10.1186/s12935-024-03491-2
16. Huang M, Huang Z, Miao S, Chen X, Tan Y, Zhou Y, et al. Bioinformatics Analysis of coagulation-related genes in lung adenocarcinoma: unveiling prognostic indicators and treatment pathways. Sci Rep. (2025) 15:4972. doi: 10.1038/s41598-025-87669-2
17. Oshi M, Sarkar J, Tokumaru Y, Yan L, Kosaka T, Akiyama H, et al. Higher intra-tumoral expression of pro-coagulation genes is a predictor of angiogenesis, epithelial mesenchymal transition and worse patient survival in gastric cancer. Am J Cancer Res. (2022) 12:4001–14.
18. Riedl J, Preusser M, Nazari PM, Posch F, Panzer S, Marosi C, et al. Podoplanin expression in primary brain tumors induces platelet aggregation and increases risk of venous thromboembolism. Blood. (2017) 129:1831–9. doi: 10.1182/blood-2016-06-720714
19. Gofrit SG and Shavit-Stein E. The neuro-glial coagulonome: the thrombin receptor and coagulation pathways as major players in neurological diseases. Neural Regener Res. (2019) 14:2043–53. doi: 10.4103/1673-5374.262568
20. Feinauer MJ, Schneider SW, Berghoff AS, Robador JR, Tehranian C, Karreman MA, et al. Local blood coagulation drives cancer cell arrest and brain metastasis in a mouse model. Blood. (2021) 137:1219–32. doi: 10.1182/blood.2020005710
21. Lei C, Li Y, Yang H, Zhang K, Lu W, Wang N, et al. Unraveling breast cancer prognosis: a novel model based on coagulation-related genes. Front Mol Biosci. (2024) 11:1394585. doi: 10.3389/fmolb.2024.1394585
22. Feng T, Wang Y, Zhang W, Cai T, Tian X, Su J, et al. Machine learning-based framework develops a tumor thrombus coagulation signature in multicenter cohorts for renal cancer. Int J Biol Sci. (2024) 20:3590–620. doi: 10.7150/ijbs.94555
23. Ge J, Deng Q, Zhou R, Hu Y, Zhang X, and Zheng Z. Identification of key biomarkers and therapeutic targets in sepsis through coagulation-related gene expression and immune pathway analysis. Front Immunol. (2024) 15:1470842. doi: 10.3389/fimmu.2024.1470842
24. Sun Y, Zhang Y, Yang Y, and Liu and D. Yin. Coagulation-related genes for thyroid cancer prognosis W. immune infltration, staging, and drug sensitivity. Front Immunol. (2024) 15:1462755. doi: 10.3389/fimmu.2024.1462755
25. Cao M, Zhang W, Chen J, and Zhang Y. Identification of a coagulation-related gene signature for predicting prognosis in recurrent glioma. Discov Oncol. (2024) 15:642. doi: 10.1007/s12672-024-01520-0
26. Liu R, Wang Q, and Zhang X. Identification of prognostic coagulation-related signatures in clear cell renal cell carcinoma through integrated multi-omics analysis and machine learning. Comput Biol Med. (2024) 168:107779. doi: 10.1016/j.compbiomed.2023.107779
27. He Q, Yang J, and Jin Y. Immune infiltration and clinical significance analyses of the coagulation-related genes in hepatocellular carcinoma. Brief Bioinform. (2022) 23:bbac291. doi: 10.1093/bib/bbac291
28. Ritchie ME, Phipson B, Wu D, Hu Y, Law CW, Shi W, et al. limma powers differential expression analyses for RNA-sequencing and microarray studies. Nucleic Acids Res. (2015) 43:e47. doi: 10.1093/nar/gkv007
29. Blanche P, Dartigues JF, and Jacqmin-Gadda H. Estimating and comparing time-dependent areas under receiver operating characteristic curves for censored event times with competing risks. Stat Med. (2013) 32:5381–97. doi: 10.1002/sim.5958
30. Yu G, Wang LG, Han Y, and He QY. clusterProfiler: an R package for comparing biological themes among gene clusters. Omics. (2012) 16:284–7. doi: 10.1089/omi.2011.0118
31. Mayakonda A, Lin DC, Assenov Y, Plass C, and Koeffler HP. Maftools: efficient and comprehensive analysis of somatic variants in cancer. Genome Res. (2018) 28:1747–56. doi: 10.1101/gr.239244.118
32. Jiang P, Gu S, Pan D, Fu J, Sahu A, Hu X, et al. Signatures of T cell dysfunction and exclusion predict cancer immunotherapy response. Nat Med. (2018) 24:1550–8. doi: 10.1038/s41591-018-0136-1
33. Maeser D, Gruener RF, and Huang RS. oncoPredict: an R package for predicting in vivo or cancer patient drug response and biomarkers from cell line screening data. Brief Bioinform. (2021) 22:bbab260. doi: 10.1093/bib/bbab260
34. Wang M, Liao J, Wang J, Xu M, Cheng Y, Wei L, et al. HDAC2 promotes autophagy-associated HCC Malignant progression by transcriptionally activating LAPTM4B. Cell Death Dis. (2024) 15:593. doi: 10.1038/s41419-024-06981-3
35. Jiang F, Xu Y, Jiang Z, Hu B, Lv Q, and Wang Z. Deciphering the immunological and prognostic features of hepatocellular carcinoma through ADP-ribosylation-related genes analysis and identify potential therapeutic target ARFIP2. Cell Signal. (2024) 117:111073. doi: 10.1016/j.cellsig.2024.111073
36. Gamage N, Barnett A, Hempel N, Duggleby RG, Windmill KF, Martin JL, et al. Human sulfotransferases and their role in chemical metabolism. Toxicol Sci. (2006) 90:5–22. doi: 10.1093/toxsci/kfj061
37. Lindsay J, Wang LL, Li Y, and Zhou SF. Structure, function and polymorphism of human cytosolic sulfotransferases. Curr Drug Metab. (2008) 9:99–105. doi: 10.2174/138920008783571819
38. Riches Z, Stanley EL, Bloomer JC, and Coughtrie MW. Quantitative evaluation of the expression and activity of five major sulfotransferases (SULTs) in human tissues: the SULT “pie. Drug Metab Dispos. (2009) 37:2255–61. doi: 10.1124/dmd.109.028399
39. Wang J, Falany JL, and Falany CN. Expression and characterization of a novel thyroid hormone-sulfating form of cytosolic sulfotransferase from human liver. Mol Pharmacol. (1998) 53:274–82. doi: 10.1124/mol.53.2.274
40. Lian W, Jin H, Cao J, Zhang X, Zhu T, Zhao S, et al. Identification of novel biomarkers affecting the metastasis of colorectal cancer through bioinformatics analysis and validation through qRT-PCR. Cancer Cell Int. (2020) 20:105. doi: 10.1186/s12935-020-01180-4
41. Enokizono J, Kusuhara H, and Sugiyama Y. Regional expression and activity of breast cancer resistance protein (Bcrp/Abcg2) in mouse intestine: overlapping distribution with sulfotransferases. Drug Metab Dispos. (2007) 35:922–8. doi: 10.1124/dmd.106.011239
42. Eskandarion MR, Eskandarieh S, Shakoori Farahani A, Mahmoodzadeh H, Shahi F, Oghabian MA, et al. Prediction of novel biomarkers for gastric intestinal metaplasia and gastric adenocarcinoma using bioinformatics analysis. Heliyon. (2024) 10:e30253. doi: 10.1016/j.heliyon.2024.e30253
43. Long J, Huang S, Bai Y, Mao J, Wang A, Lin Y, et al. Transcriptional landscape of cholangiocarcinoma revealed by weighted gene coexpression network analysis. Brief Bioinform. (2021) 22:bbaa224. doi: 10.1093/bib/bbaa224
44. Ye Y and Xu G. Construction of a new prognostic model for colorectal cancer based on bulk RNA-seq combined with The Cancer Genome Atlas data. Transl Cancer Res. (2024) 13:2704–20. doi: 10.21037/tcr-23-2281
45. Yoshida T, Kobayashi T, Itoda M, Muto T, Miyaguchi K, Mogushi K, et al. Clinical omics analysis of colorectal cancer incorporating copy number aberrations and gene expression data. Cancer Inform. (2010) 9:147–61. doi: 10.4137/cin.s3851
46. Su Y, Tian X, Gao R, Guo W, Chen C, Chen C, et al. Colon cancer diagnosis and staging classification based on machine learning and bioinformatics analysis. Comput Biol Med. (2022) 145:105409. doi: 10.1016/j.compbiomed.2022.105409
47. Yang H, Li X, and Yang W. Advances in targeted therapy and immunotherapy for esophageal cancer. Chin Med J (Engl). (2023) 136:1910–22. doi: 10.1097/cm9.0000000000002768
48. Kumar AR, Devan AR, Nair B, Vinod BS, and Nath LR. Harnessing the immune system against cancer: current immunotherapy approaches and therapeutic targets. Mol Biol Rep. (2021) 48:8075–95. doi: 10.1007/s11033-021-06752-9
49. Pérez-Ruiz E, Melero I, Kopecka J, Sarmento-Ribeiro AB, García-Aranda M, and De Las Rivas J. Cancer immunotherapy resistance based on immune checkpoints inhibitors: Targets, biomarkers, and remedies. Drug Resist Update. (2020) 53:100718. doi: 10.1016/j.drup.2020.100718
50. Chan TA, Wolchok JD, and Snyder A. Genetic basis for clinical response to CTLA-4 blockade in melanoma. N Engl J Med. (2015) 373:1984. doi: 10.1056/NEJMc1508163
51. Rizvi NA, Hellmann MD, Snyder A, Kvistborg P, Makarov V, Havel JJ, et al. Cancer immunology. Mutational landscape determines sensitivity to PD-1 blockade in non-small cell lung cancer. Science. (2015) 348:124–8. doi: 10.1126/science.aaa1348
52. Chen C, Wang C, Li Y, Jiang S, Yu N, and Zhou G. Prognosis and chemotherapy drug sensitivity in liver hepatocellular carcinoma through a disulfidptosis-related lncRNA signature. Sci Rep. (2024) 14:7157. doi: 10.1038/s41598-024-57954-7
53. Song Z, Cao X, Wang X, Li Y, Zhang W, Wang Y, et al. A disulfidptosis-related lncRNA signature for predicting prognosis and evaluating the tumor immune microenvironment of lung adenocarcinoma. Sci Rep. (2024) 14:4621. doi: 10.1038/s41598-024-55201-7
54. Nallasamy P, Nimmakayala RK, Parte S, Are AC, Batra SK, and Ponnusamy MP. Tumor microenvironment enriches the stemness features: the architectural event of therapy resistance and metastasis. Mol Cancer. (2022) 21:225. doi: 10.1186/s12943-022-01682-x
55. Zhang J, Dong Y, Di S, Xie S, Fan B, and Gong T. Tumor associated macrophages in esophageal squamous carcinoma: Promising therapeutic implications. BioMed Pharmacother. (2023) 167:115610. doi: 10.1016/j.biopha.2023.115610
56. Nakanishi T, Koma YI, Miyako S, Torigoe R, Yokoo H, Omori M, et al. AREG upregulation in cancer cells via direct interaction with cancer-associated fibroblasts promotes esophageal squamous cell carcinoma progression through EGFR-erk/p38 MAPK signaling. Cells. (2024) 13:1733. doi: 10.3390/cells13201733
57. Biffi G and Tuveson DA. Diversity and biology of cancer-associated fibroblasts. Physiol Rev. (2021) 101:147–76. doi: 10.1152/physrev.00048.2019
58. Paszek MJ, Zahir N, Johnson KR, Lakins JN, Rozenberg GI, Gefen A, et al. Tensional homeostasis and the Malignant phenotype. Cancer Cell. (2005) 8:241–54. doi: 10.1016/j.ccr.2005.08.010
59. Mohammadi H and Sahai E. Mechanisms and impact of altered tumour mechanics. Nat Cell Biol. (2018) 20:766–74. doi: 10.1038/s41556-018-0131-2
60. Jain RK, Martin JD, and Stylianopoulos T. The role of mechanical forces in tumor growth and therapy. Annu Rev BioMed Eng. (2014) 16:321–46. doi: 10.1146/annurev-bioeng-071813-105259
61. Winkler J, Abisoye-Ogunniyan A, Metcalf KJ, and Werb Z. Concepts of extracellular matrix remodelling in tumour progression and metastasis. Nat Commun. (2020) 11:5120. doi: 10.1038/s41467-020-18794-x
62. Sahai E, Astsaturov I, Cukierman E, DeNardo DG, Egeblad M, Evans RM, et al. A framework for advancing our understanding of cancer-associated fibroblasts. Nat Rev Cancer. (2020) 20:174–86. doi: 10.1038/s41568-019-0238-1
Keywords: esophageal squamous cell carcinoma, coagulation-related genes, immune infiltration, prognosis signature, immunotherapy
Citation: Wang R, Zhang W, Li X, Wang H, Ji Y, Zhao J, Song J and Yi Z (2025) Multi−cohort validation based on coagulation-related genes for predicting prognosis of esophageal squamous cell carcinoma. Front. Immunol. 16:1662599. doi: 10.3389/fimmu.2025.1662599
Received: 09 July 2025; Accepted: 12 November 2025; Revised: 05 November 2025;
Published: 26 November 2025.
Edited by:
Anand Rotte, Arcellx Inc, United StatesReviewed by:
Hao Zhang, Shanghai Jiao Tong University, ChinaJiaqi Zhang, The First Affiliated Hospital of Dalian Medical University, China
Copyright © 2025 Wang, Zhang, Li, Wang, Ji, Zhao, Song and Yi. This is an open-access article distributed under the terms of the Creative Commons Attribution License (CC BY). The use, distribution or reproduction in other forums is permitted, provided the original author(s) and the copyright owner(s) are credited and that the original publication in this journal is cited, in accordance with accepted academic practice. No use, distribution or reproduction is permitted which does not comply with these terms.
*Correspondence: Zhongquan Yi, eWl6aG9uZ3F1YW5AMTYzLmNvbQ==; JianXiang Song, anhzb25neWNzeUAxNjMuY29t
†These authors have contributed equally to this work