 Chih-Chao Chang1*
 Ya Nan Liu1
 Zheng Xu1Elena-Rodica Vasilescu1Ping Li1Eric K. Ho1Muyang Li1Syed A. Husain2,3
 Govind Bhagat4Sumit Mohan2,3
 George Vlad1
 Nicole Suciu-Foca1
- 1Department of Pathology and Cell Biology, Division of Immunogenetics and Cellular Immunology, Columbia University Irving Medical Center, New York, NY, United States
- 2Department of Medicine, Division of Nephrology, Columbia University Irving Medical Center, New York, NY, United States
- 3Department of Epidemiology, The Columbia University Renal Epidemiology Group, Columbia University, New York, NY, United States
- 4Department of Pathology and Cell Biology, Division of Hematopathology, Columbia University Irving Medical Center, New York, NY, United States
Background: Controlling viral infections prior to solid organ transplantation is vital for successful engraftment and overall well-being of patients. One promising approach involves the deployment of viral antigen-specific cytotoxic T cells to eradicate viral pathogens. Although there have been attempts to develop anti-viral vaccines in the literature, the limited number of virus-specific cells which can be generated in vitro in the autologous system make it impracticable for autologous therapy.
Methods: We developed a straightforward and scalable method for the in vitro expansion of SARS-CoV-2 Spike S1 peptide-specific cytotoxic CD8+ T cells. This was achieved through combinatorial stimulation with S peptide-conjugated polystyrene microspheres in the presence of cytokines IL-2, IL-7, and IL-15 for 14 days.
Results: Using A2/S269-specific tetramers as markers, we compared induction of S-specific CD8+ T cells from patients awaiting kidney transplantation (n=67) with that of normal controls (n=65). We found that this method has the potential to achieve at least a 10-fold up to 200-fold increase in S-specific CD8+ T cells in 34.3% of kidney transplant candidates and 36.9% of normal controls, respectively. These SARS-CoV-2 specific CD8+ T cells released inflammatory cytokines, expressed effector-memory T cells markers, and killed target cells in a dose-dependent and antigen-specific manner.
Conclusion: Our study demonstrates that viral antigen-specific cytotoxic CD8+ T cells can be robustly enriched in vitro from peripheral blood mononuclear cells of both healthy individuals and patients with kidney diseases using peptide-conjugated microspheres. Our findings provide novel insights into a potential therapeutic approach, using autologous anti-viral CD8+ T cells for transplant recipients/candidates.
1 Introduction
The COVID-19 pandemic, caused by the novel coronavirus SARS-CoV-2, has resulted in significant global mortality and disruption since early 2020, particularly affecting older adults and population with underlying health conditions. The swift development and rollout of mRNA vaccines targeting the virus’s Spike (S) protein have been effective in reducing its spread by generating robust humoral and cellular immune responses. However, the emergence of mutations in the S protein has led to a marked increase in breakthrough infections, which reached 19.1% among fully vaccinated individuals in New York State as of May 2023 (1). This situation poses even greater risks for immunocompromised individuals, including patients who required solid organ transplants (SOT) and allogeneic stem cell transplants (ASCT), representing nearly half of the breakthrough hospitalizations (2, 3).
The clearance of the virus following SARS-CoV-2 infection, a vital step in recovery, has been shown to correlate more closely with the activation of S-specific CD8+ T cells than with the presence of S-specific neutralizing antibodies or N-specific CD8+ T cell activation (4, 5). These findings underscore the critical role of antigen specific CD8+ cytotoxic T cells, which persist longer than neutralizing antibodies in both infected and vaccinated individuals, in eradicating SARS-CoV-2 viruses. Recent studies have highlighted the persistence and protective capacity of virus-specific CD8+ T cells, even in the absence of robust antibody responses (6).
Despite advances in antiviral drug development, limitations such as drug resistance, toxicity, and incomplete viral clearance persist, motivating the exploration of alternative immunotherapeutic avenues. Among these, the adoptive transfer of antigen-specific cytotoxic T cells has emerged as a promising intervention to target persistent or refractory viral infections in immunocompromised individuals (7). This strategy hinges on the ability to generate or expand robust populations of virus-specific T cells capable of recognizing and eliminating infected cells with high precision.
Adoptive transfer of allogenic-antigen specific T cells against opportunistic viral infections, particularly by cytomegalovirus (CMV), BK virus (BKPyV), and JC virus (JCPyV) in immunocompromised individuals have been well studied (8–10). Both antiviral therapies (e.g., ganciclovir) and the adoptive transfer of the third-party virus-specific cytotoxic T lymphocytes (CTLs) have been utilized extensively, each offering distinct advantages and challenges (11).
However, generating enough functional, autologous virus-specific cytotoxic T cells from immunocompromised individuals has proven challenging. Factors like immunosuppression, underlying disease, and prior treatments may limit the frequency and functionality of these cells in transplant candidates. Thus, there is a pressing need for scalable, reproducible protocols to efficiently enrich and expand antigen-specific T cells suitable for therapeutic use, especially in the context of emerging pathogens such as SARS-CoV-2.
Attempts to develop antigen-specific cytotoxic T-cells for SARS-CoV-2 therapy have been performed with some success. Recent findings from two small Phase I clinical trials indicate that cytotoxic T cells, generated in vitro from healthy donors who have recovered from COVID-19, can be safely and effectively utilized to treat high-risk ambulatory COVID-19 patients (12, 13). In this study, we focused on the HLA-A*02:01-restricted antigen epitope S269-277, referred to as A2/S269, which is conserved across all SARS-CoV-2 variants and has been relatively well studied (14–16). Using A2/S269-specific tetramers as markers, we developed a straightforward and scalable method for the in vitro expansion of SARS-CoV-2 Spike S1 peptide-specific cytotoxic CD8+ T cells in both normal controls and kidney patients. This study lays the groundwork for a novel and personalized approach to adoptive T cell therapy using a patient’s virus-specific T cells (VSTs), offering a promising strategy for enhancing antiviral immunity in immuno-compromised populations. By leveraging advances in peptide-based stimulation and culture systems, it is now feasible to selectively expand populations of cytotoxic T cells targeting conserved viral epitopes, opening new avenues for personalized immunotherapy in at-risk patient populations.
2 Materials and methods
2.1 Reagents
FluoSpheres® were from Thermo-Fisher Scientific. Flow cytometry reagents, including CD27-PE-Cy7, CD28-PerCP -Cy5.5, CD69-Alexa Fluor 488, CD95- BV421 and other Flow Cytometry reagents were purchased from BD Biosciences. TaqMan® probes and Superscript® III first -strand synthesis for RT-PCR system were ordered from Thermo-Fisher Scientific. Peptides (9-mers) were synthesized by GenScript®. Tetramer PE-SARS-CoV-2 S (YLQPRTFLL 269-277), and tetramer PE-CMV pp65 (NLYPMVATV (495–503), and a photosensitive biotinylated monomer, HLA-A*02:01 KILGFVFJV were generously provided by NIH Tetramer Core Facility (Emory University, GA).
2.2 Human subjects, patients’ privacy protection and sample collections
Patients (n=67) awaiting kidney transplants or prospective kidney donors (n=51), who came to CUIMC for patient care from September 2022 to January 2025, were identified through our medical record system. Plasma and PBMCs prepared from these individuals were stored at -80°C and liquid nitrogen, respectively, prior to being used for the study. High resolution HLA typing was used to confirm if subjects were either heterozygous or homozygous for HLA-A*02:01. Immunological status of subjects with respective to COVID-19, besides the records of SARS-CoV-2 previous infection and/or COVID-19 vaccination, was confirmed by Multiplexed magnet bead-based anti-SARS-CoV-2 IgG assay as described in the next Section.
2.3 Multiplexed magnet bead-based assay for detection of IgG antibodies against SARS-CoV-2’s viral antigens
Bio-Plex Pro Human IgG SARS-CoV-2 Serology Assay System (Bio-Rad) for simultaneous detection of viral proteins (RBD, S1, S2 and nucleocapsid (N) proteins were previously described (17, 18). Sample data (Medium Fluorescence Intensity, MFI) were acquired using xPONENT® Software and analyzed by Microsoft Excel Software. Sample MFI above the cutoff (for Nucleocapsid (N),>2,000, for RBD, Spike 1 and Spike 2, > 6,800) were counted as positive for respective IgG antibodies. Subjects positive for both anti-N and anti-S1 IgG antibodies were counted as previous SARS-CoV-2 infected with or without COVID-19 vaccination. Subjects seropositive for Spike I IgG but were seronegative (MFI <1 ,000) for anti-N were as counted as COVID-19 vaccinated but SARS-CoV-2 uninfected.
2.4 Preparation of HLA-A*02:01 peptide conjugated spheres and priming autologous PBMCS
Carboxylate-modified polystyrene yellow/green Fluorescent (1.0 μm in size) and Blue Fluorescent (1.0 μm in size) FluoSpheres were purchased from Thermo-Fisher Scientific. For peptide-bead conjugation, 300 μl HLA-A*02:01 restricted peptides (at 1μg/ml) were added to MES buffer for a final concentration of 50 mM MES PH=6.0. After extensive vortex, 150 μl spheres (about 6.3x10⁹ beads) were added to the peptide solution as described above and incubated for 15 min at room temperature. Three hundred μl freshly prepared conjugation reagent, EDAC (10 mg/ml Thermo-Fisher Scientific), were then added to the mixture of peptide-Spheres with extensive vortex, incubated at room temp for 4 hours, or overnight with constant rotating. The glycine solution was added at the end of incubation to a final concentration of 100 mM and incubated for another 30 min at room temperature with rotating to stop EDAC reaction. Conjugated beads were collected at 4°C at 14,000 RPM centrifugation for 30 min, washed with PBS 3 times and resuspended in original volume (750 μl) with 1% BSA-PBS in the presence of Sodium Azide (0.4 nM). The degree of conjugation was monitored by Flow Cytometry using BD FACS(Lyric™) Analyzer. We typically used 10ul ( ∼1x10⁸ beads) of peptide-conjugated beads or control (non-peptide conjugated) beads per 106 cells for a 100:1 bead/cell ratio. Priming of PBMCs were described in Results Section.
2.5 Endocytosis inhibition assays
Frozen PBMC were thawed and washed with RPMI complete medium and were seeded on a 96-well flat-bottom plate at 1x10⁵/250 μl in complete medium for 30 minutes at 37°C prior to pre-treatment with cytochalasin D (Fisher Scientific) at various concentrations (1, 1.3, 10, 30 mM) for another 30 min at 37°C. Polystyrene Fluorescent (yellow-Green 505/515 nm), (1.0 mm in size) sphere beads at 100x excess were then added to cells and incubated for additional 1h at 37°C. Cell-beads mixtures were washed twice with a wash buffer (2 mM EDTA 0.5% BSA in PBS), measured by Flow Cytometric analyses.
2.6 Tetramer synthesis and staining, flow cytometric analyses of surface and intracellular markers
PE-SARS-CoV-2 (ORF1ab(2332-2340), hereafter referred to as PE-A2/ORF1ab2332 was prepared by ligand exchange between HLA-photosensitive A*02:01 KILGFVFJV monomer and peptide ILFTRFFYV (19) followed by tetramerization with PE-streptavidin using the protocol provided by Toebes et al (20). Detection of tetramer+CD8+ T cells was performed by culturing with Dasatinib (Sigma-Aldrich) at a final concentration of 50 μM at 37°C for 30 min, followed by immediate incubation with tetramer PE-A2/S269 (at 1:1,000) or PE-A2/CMV pp65495 (at 1:2,000) or PE- A2/ORF1ab2332 (at 1:2,000) for 1 h at 4 °C in the dark without washing. After tetramer staining, cells were washed with FACS buffer, stained with surface markers including APC-CD8 (clone HIT8a) along with other surface markers for 20 min at 4 °C.
Staining of intracellular cytoplasmic proteins was performed by treatment of cells with 100 μl IC fixation buffer (Invitrogen) for 40 min at 4 °C, followed by two washes with permeabilization Buffer (Invitrogen) for 10 min prior to staining with Perforin-PerCP-CY5.5 (BD Biosciences) at 4 °C for 30 min. After washing with 0.5 ml FACS buffer, cells were acquired on a BD FACS Lyric™ Cytometer and analyzed by FCSExpress™ Software. Multitest™ 6-ColorTBNK (BD Biosciences) antibodies were used to determine major lymphocyte subsets after 2 weeks of in vitro stimulation with peptide-spheres and cytokines as described in manufacturer’s protocol.
2.7 ELISPOT and Luminex based ProcartaPlex assays for detection of IFN-γ, TNF-α
The IFN-γ ELISPOT pair (capture and detection antibodies) kit was purchased from BD Bioscience whereas the immunodetection system was purchased from ImmunoSPOT™ (Ohio, USA). ELISPOT plates (Sigma-Aldrich) were first activated, coated with capture antibodies (5μg/ml), and blocked with 10% FBS-RPMI medium for 2 h prior to the experiment. Serum free medium (100 μl) in the presence and absence of cognate peptides (40 μg/ml) or 0.2x concentration of Phytohemagglutinin (PHA) solution were first added to an ELISPOT plate. In vitro activated (see above) or naïve (not activated) cells at 5x10⁴, were washed extensively, and added to the corresponding wells. After 18 h incubation at 37 °C, plates were washed four times with 0.05% Tween20-PBS prior to addition of anti-human IFN-γ detection antibodies (2μg/ml) and incubated for 2 h at room temperature with shaking. The spots were detected and developed by streptavidin-AP and Blue Developer Solution™. Visualization and quantitation were performed by ImmunoSPOT 2™ software.
For detection of cytokine release from supernatants of in vitro activated cells re-stimulated with cognate peptide, Luminex based combinable ProcartaPlex™ (Invitrogen) assay systems were used. Magnetic beads conjugated with capture mAbs recognizing IFN-γ and TNF-α were pre-mixed and added to a clear flat bottom 96-well plate, washed 3 times on a handheld magnetic stand, followed by incubation with 50 μl supernatant obtained from cell cultures of in vitro stimulated cells for 2 hours at room temperature with shaking (600 rpm). After incubation, beads were washed 3 times prior to incubation with biotinylated detection antibody for another 30 min at room temperature with shaking, followed by 3 washes and incubation with Streptavidin-PE. Beads were then washed and resuspended in Reading Buffer prior to being acquired by FLEXMAP 3D™ and analyzed by Microsoft’s Excel Software.
2.8 Realtime PCR gene expression analysis
To analyze RNA profile of A/S269+ CD8+ T cells, PBMCs from normal controls were stimulated in vitro with S269-277-peptide conjugated Spheres in the presence of cytokines for 2 weeks as described. Tetramer+ CD8+ cells and tetramer- CD8+ T cells were sorted by BD FACSAria™ III Neptune Cytometer and analyzed by FACSDiva 9.0.1 software. Fresh sorted cells were immediately lysed in RNeasy (Qiagen) RPE buffer supplemented with β-mercaptoethanol; total RNA from cells was then purified and stored at -80 °C. The first strand cDNA was synthesized from total RNA using Superscript III System (Invitrogen). Real-time PCR was performed using proprietary TaqMan gene expression probes (Applied Biosystems, Foster City, CA) and was run in duplicate in a Roche480 with a 384-well plate. Data was collected and analyzed for Realtime PCR measurement of gene expression. A housekeeping gene, GAPDH, was used as an internal reference.
2.9 Cell mediated cytotoxicity assay
We employed T2 (ATCC CRL-1922) as the target cells for HLA-A*02:01 restricted cytotoxicity assays. T2 cells were pulsed with either 20 μg/ml S269–277 peptide or 20 μg/m CMVpp65495–503 for 18 h at 37°C. The target cells were then washed twice and labeled with Calcein AM (Invitrogen) for 30 min whereas A2/S269+ T effectors generated in vitro (see above) were labeled with CellTrace Violet (Invitrogen) for 30 min at room temperature. Labelled target cells and effector cells were washed twice and adjusted to 5x10⁵/ml and 5x10⁶/ml in the medium containing IL2/IL7/IL15, respectively. Target cells at 2x10⁴ were added to wells of a 48-well plate followed by addition of effectors at different ratios (30:1, 15:1 7.5:1). Target cells alone and effectors alone were also placed in the plate as negative controls. The plate was briefly centrifuged for 1 min and incubated at 37 °C for 5 h. At the end of incubation, cells were washed twice and stained with Ethidium (Red) homodimer-1 (Invitrogen) at room temperature for 10 min, washed once prior to acquiring and analyzed by NovoExpress Software in NovoCyte Penteon (Agilent) Cytometer.
2.10 Statistical analyses
Comparative analyses and generation of the graphs were carried out using GraphPad Prism 10.04. Normally distributed data are presented as mean ± S.D., while data that were not normally distributed were presented as median ± interquartile range (Q1-Q3). Categorical data are reported as numbers and percentages. Mann-Whitney U test is used to compare two nonparametric groups. The Spearman correlation coefficient r was calculated for quantifying the association between continuous variables. Two-tailed p values were reported with p <0.05, considered significant.
3 Results
3.1 Cell stimulation protocol
Preparation of antigen peptide-conjugated spheres was detailed in Materials and Methods. Peptide conjugated spheres, along with control (unconjugated) spheres were used to stimulate thawed peripheral blood mononuclear cells (PBMCs) from donors with homozygous or heterozygous HLA-A*02:01 genotypes. The cultures were maintained for two weeks in the presence of cytokines IL-2 IL-7 and IL-15 (Figure 1A). It has been previously reported that combinations of IL-2, IL-7, and IL-15 can induce robust proliferation of both antigen-independent (21) and antigen-specific (22) CD8+T cells. Cell-bead aggregates, which formed after one day of culture, significantly increased in size by day three (Figure 1B). This growth indicates that cells were recruited to create a three-dimensional structure composed of beads and cells. Such cell-bead aggregates, often observed in co-cultures with polystyrene or silica beads (23), have been suggested to promote cell proliferation and differentiation (24). At the end of the culture period, we analyzed the composition of the expanded cell populations using 6-color TBNK- flow cytometry assays (BD Biosciences). The predominant cell population was CD8+ T cells (51.0 ± 12.9%), followed by CD4+T cells (35.3 ± 17.4%) and CD16+CD56+ natural killer cells (3.7 ± 1.7%), across six independent lines (data not shown). Notably, depletion of NK cells from PBMC resulted in only a modest reduction of NK cells in the final cultures (2.7%).
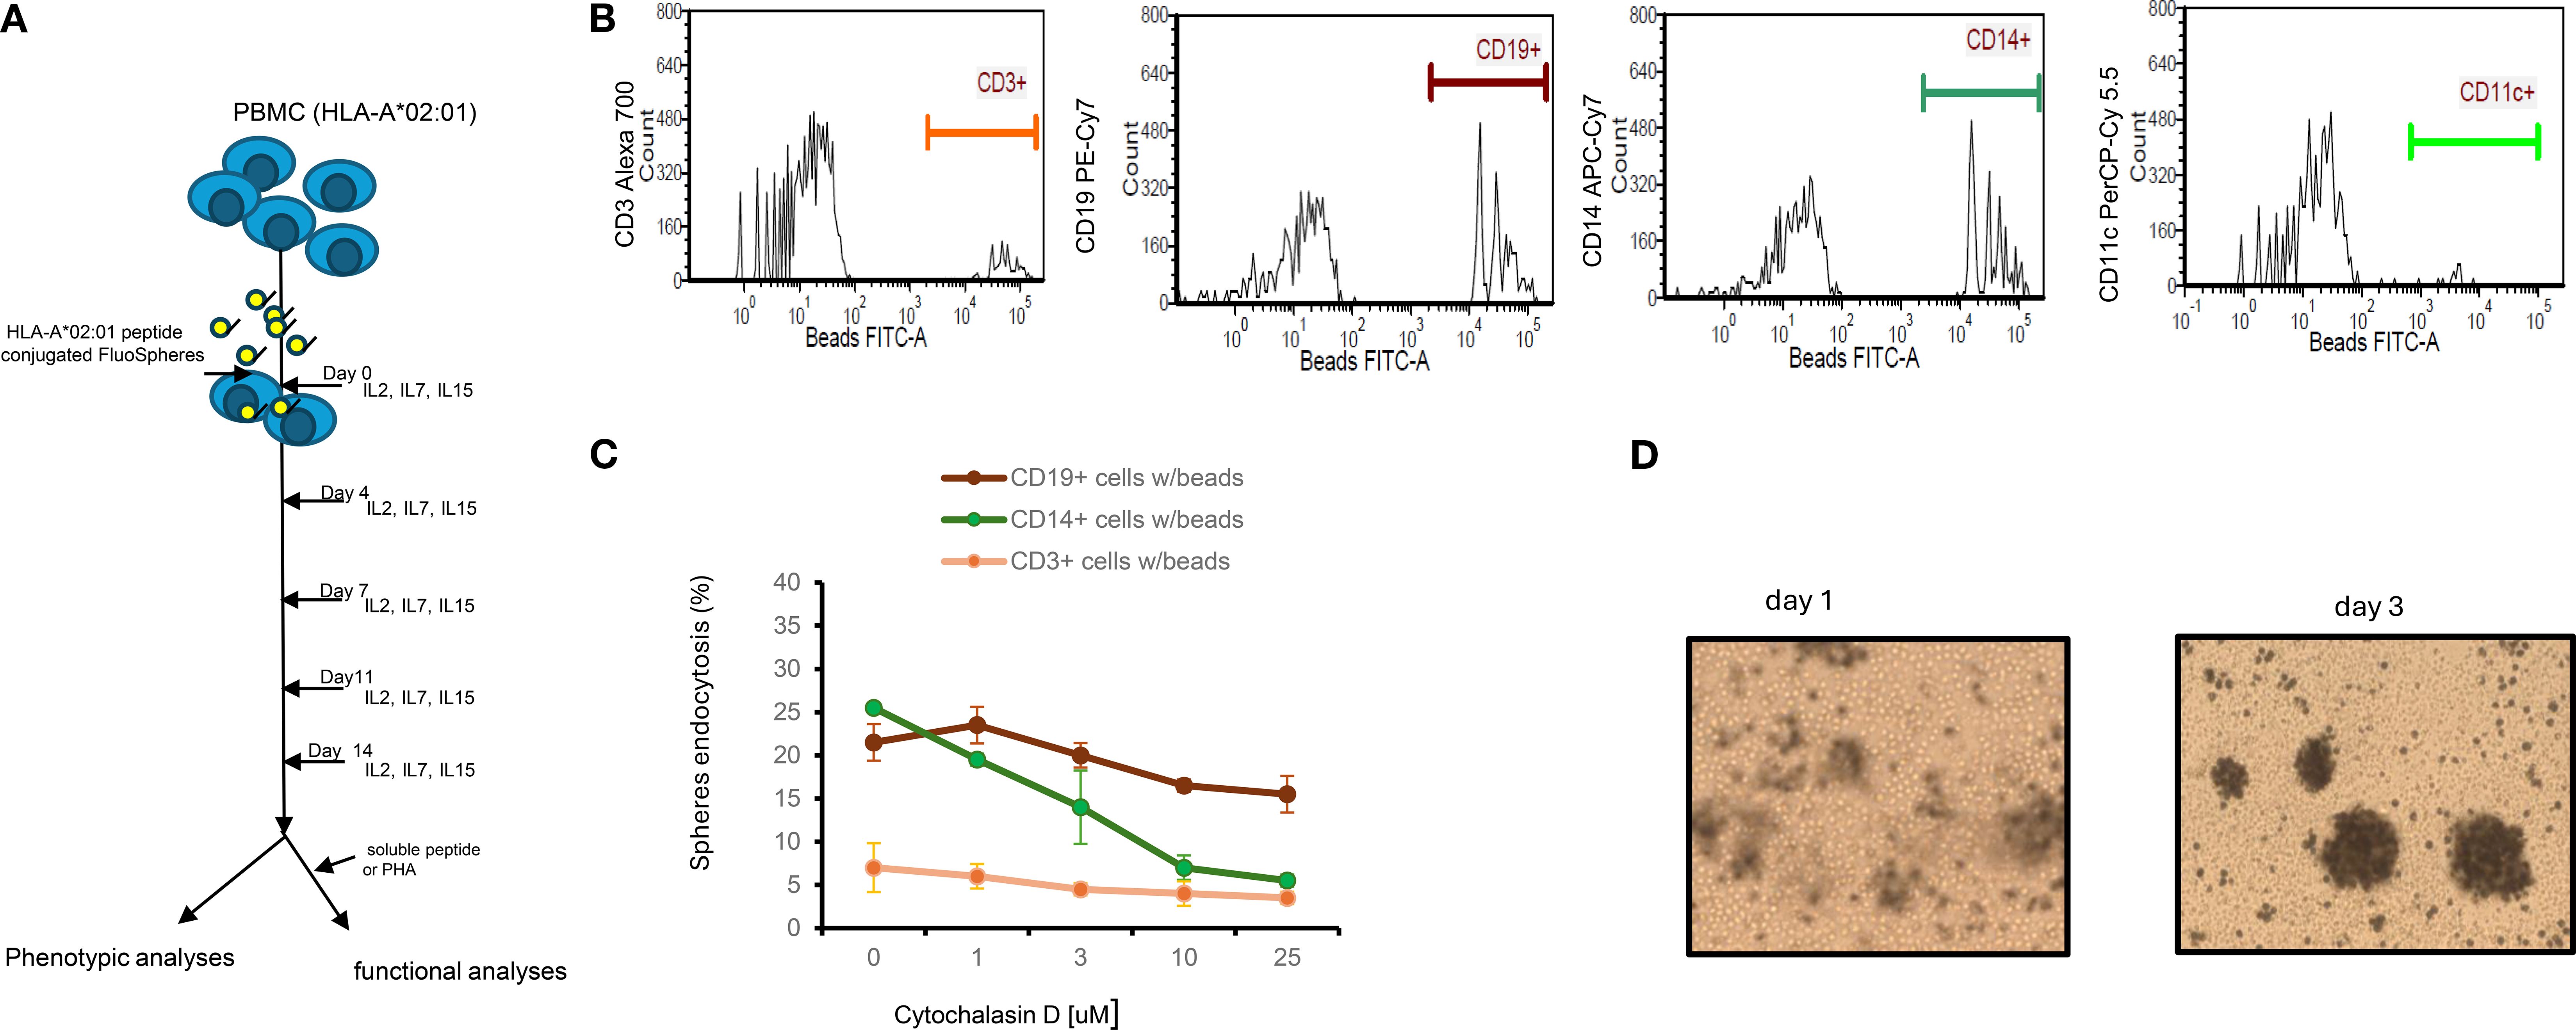
Figure 1. Experimental design, mechanism of endocytosis and cytokine dependent growth of lymphocyte. (A) Experimental design: Thawed PBMCs (1-3x10⁶) carrying HLA*02:01 genotype were cultured with peptide conjugated spheres (either yellow-green (365/415) nm or blue (505/515) at a ratio of 1:100 ratio in the presence of IL2/IL7/IL15 for 14 days. Half of the culture medium was replaced every 4 days. Cells were analyzed for the appearance of tetramer+ or surface markers; in some experiments, cell cultured supernatants were also collected for other assays such as IFN-γ release. (B) Endocytosis of FluoSpheres by cells from PBMCs. Thawed PBMCs (n=3) were cultured with yellow-green (detected in FITC channel) Spheres in the same culture medium as described for 1, 4 and 12 hours. Cells were then washed extensively and counter-stained with CD3, CD14, CD19 and CD11c mAbs prior to analyses by Flow Cytometry. A representative result of cells from one PBMCs after 1 h of co-culture was shown. (C) Inhibition of endocytosis of FluoSpheres by cytochalasin D in monocytes is dose dependent. The results are for one-hour treatment, which includes 30 min of pre-treatment and 30 min of treatment with cytochalasin D, are Mean ± S.D. of two experiments. (D) Snapshot (100X) of cells/beads co-cultures. PBMC cells at 1x10⁶ and beads at 1x10⁸ were co-cultured in a 48-well-plate containing 1ml medium supplemented with IL2/IL7/IL15. Photos were taken on day 1 and day 3. .
3.2 Uptake of peptide-conjugated FluoSpheres by B lymphocytes and monocytes in cryopreserved PBMCs via phagocytosis
Efficient priming of peripheral blood-derived T cells requires antigen presentation by either professional or non-professional antigen-presenting cells (APCs). To identify which cell types of peripheral blood mononuclear cells (PBMCs) internalize peptide-conjugated spheres, we incubated yellow-green FluoSpheres (detected in the FITC channel) with cryopreserved PBMCs at a 100:1 bead-to-cell ratio for varying durations (1, 4, and 12 hours). Following 1 hour incubation, cells were extensively washed and stained with monoclonal antibodies against CD19 (B lymphocytes), CD14 (monocytes), CD3 (T lymphocytes), and CD11c (dendritic cells/professional APCs). Samples were then analyzed via flow cytometry. As shown in Figure 1C, after 1 hour of incubation, FluoSpheres were internalized by: 21.5± 2.1% of CD19+ B lymphocytes, 25.5 ± 0.7% of CD14+ monocytes, 5.0 ± 2.8% of CD3+ T lymphocytes, and 0.2 ± 0.2% of CD11c+ dendritic cells. Bead retention remained stable up to 12 hours (data not shown).
Since CD11c+ dendritic cells are known to be extremely sensitive to cryopreservation, only an exceptionally low percentage of these cells may contain beads. The high uptake by B lymphocytes and monocytes indicates their significant role in internalizing peptide-conjugated spheres under these conditions. An insignificant number of bead-uptakes by CD3+ T cells may reflect non-specific bead binding due to their abundance in PBMCs.
To explore the mechanism of bead internalization, we evaluated various endocytosis inhibitors. When Cytochalasin D (3 µM), an inhibitor of F-actin polymerization (25), was added to cultures for 1 hour, bead uptake by monocytes was reduced by over 50% (Figure 1D) in a dose-dependent manner. This suggests that internalization of spheres is actin polymerization-dependent, implying that phagocytosis is the primary mechanism for microsphere uptake by monocytes. This aligns with the general understanding that particles ≥1 µm are mainly internalized via phagocytosis, a process significantly more efficient than passive peptide diffusion. B lymphocytes, despite having the same capacity to internalize FluoSpheres as monocytes in our study, were less sensitive to Cytochalasin D at the same concentration, implying that they may use a distinct uptake mechanism, possibly through B cell receptors (26).
We also tested Dynole 34-2™ (Cayman Chemical), a well-characterized Dynamin inhibitor (27), at 10 µM to assess the role of Dynamin-dependent endocytosis. We found no reduction in uptake by either B lymphocytes or monocytes (data not shown), suggesting that clathrin-mediated endocytosis (CME) and fast endophilin-mediated endocytosis (FEME), both of which require Dynamin GTPase activity (28), are unlikely to be involved in this context.
3.3 Cohorts and patient characteristics
For this study, we recruited a total of 133 subjects. Eligible participants were categorized into two cohorts: the kidney patient group (transplant candidates) (n=67) and the normal control group (n=66), consisting of 51 prospective kidney donors and 15 additional blood donors. Kidney patients in our cohort were significantly older (median age 64.0, IQR: 52-68) and predominantly male, while prospective kidney donors were younger (median age 49.0, IQR: 37-60) and predominantly female. Most patients (>95%) were either in advanced stages (III to V) of chronic kidney disease (CKD) or already with End-Stage Renal Disease (ESRD) requiring hemodialysis (62.7%) and kidney transplants. All patients carried a wide range of comorbidities, including hypertension (70.1%), diabetes (50.7%), cardio-vascular disease (46.2%) and others. The summary of subjects’ characteristics in these two cohorts is shown in Table 1. The details of patients and normal control cohort, with respect to demographic characteristics, disease associations and profiles of anti-SARS-CoV-2 IgG antibodies are shown in Table 2 and Supplementary Table S2, respectively. Subjects were genotyped for HLA during clinical evaluation at Columbia University Irving Medical Center (CUIMC) between September 2022 and January 2024 and confirmed to be either homozygous or heterozygous for the HLA-A*02:01 allele.
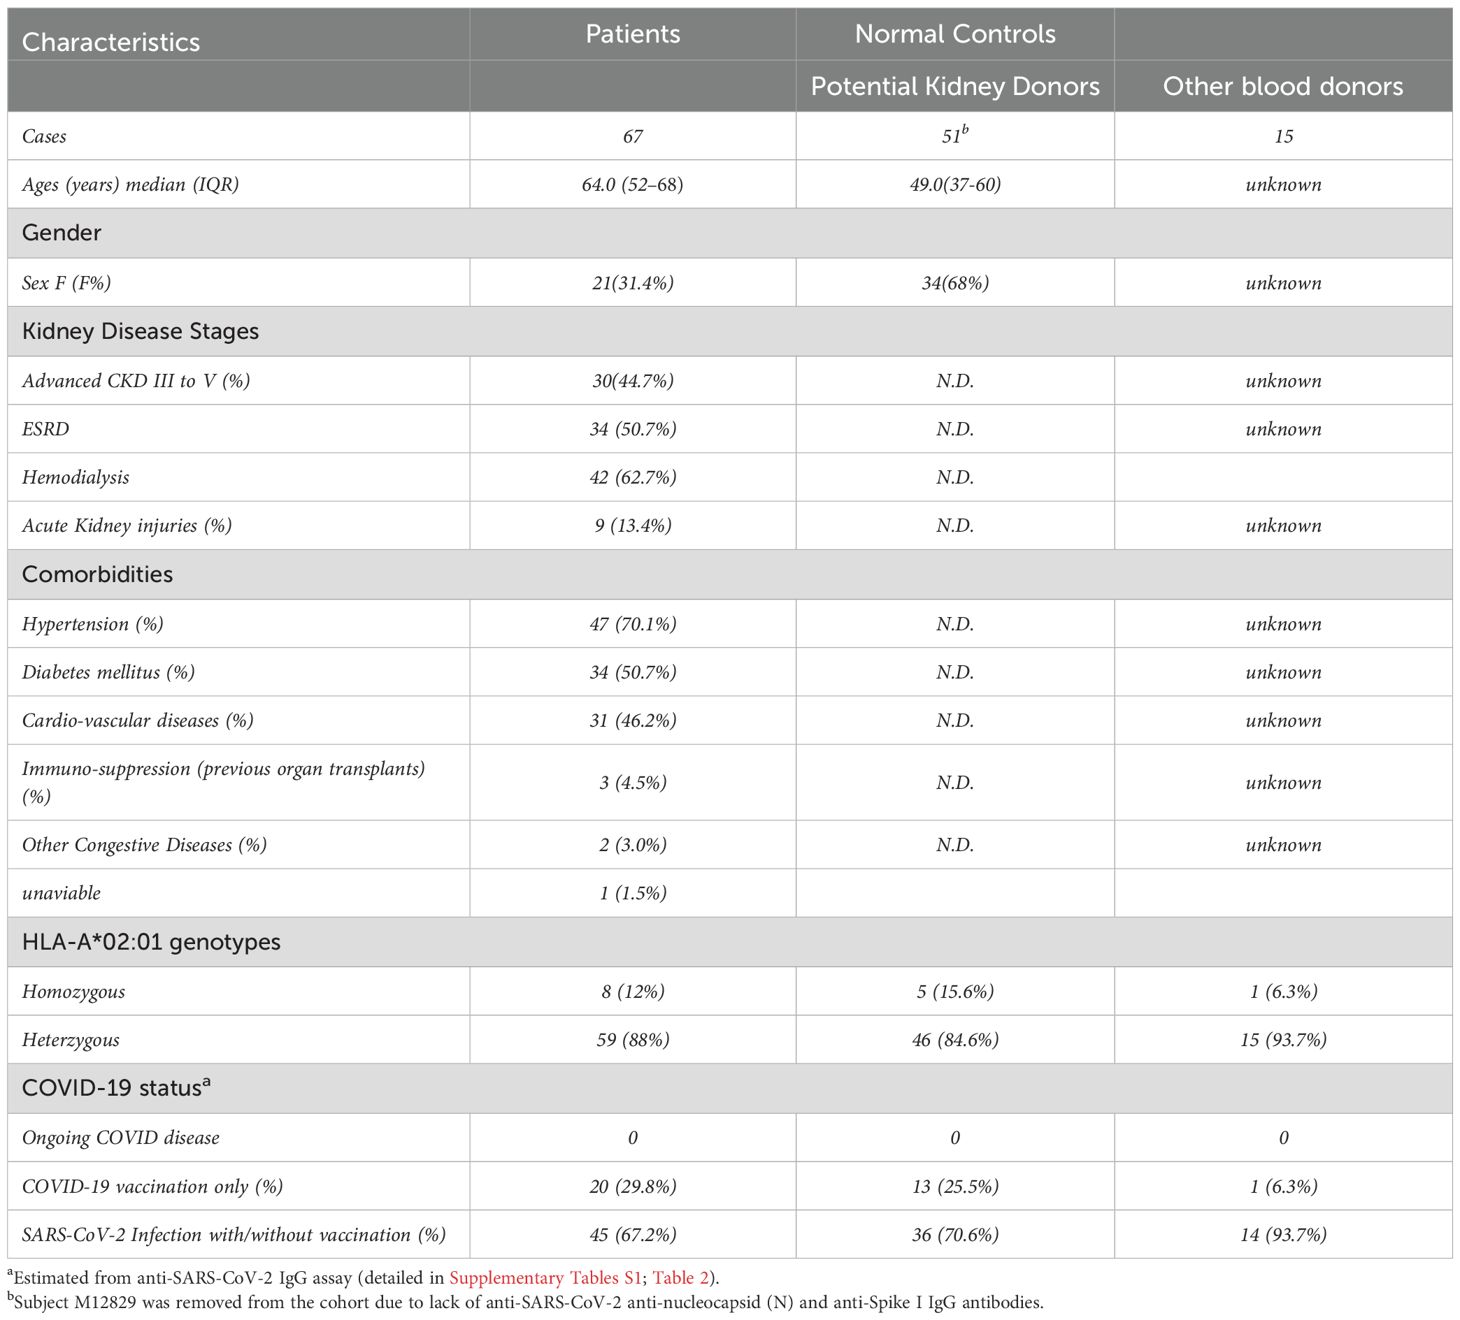
Table 1. Demographic characteristics of kidney patients and normal controls.
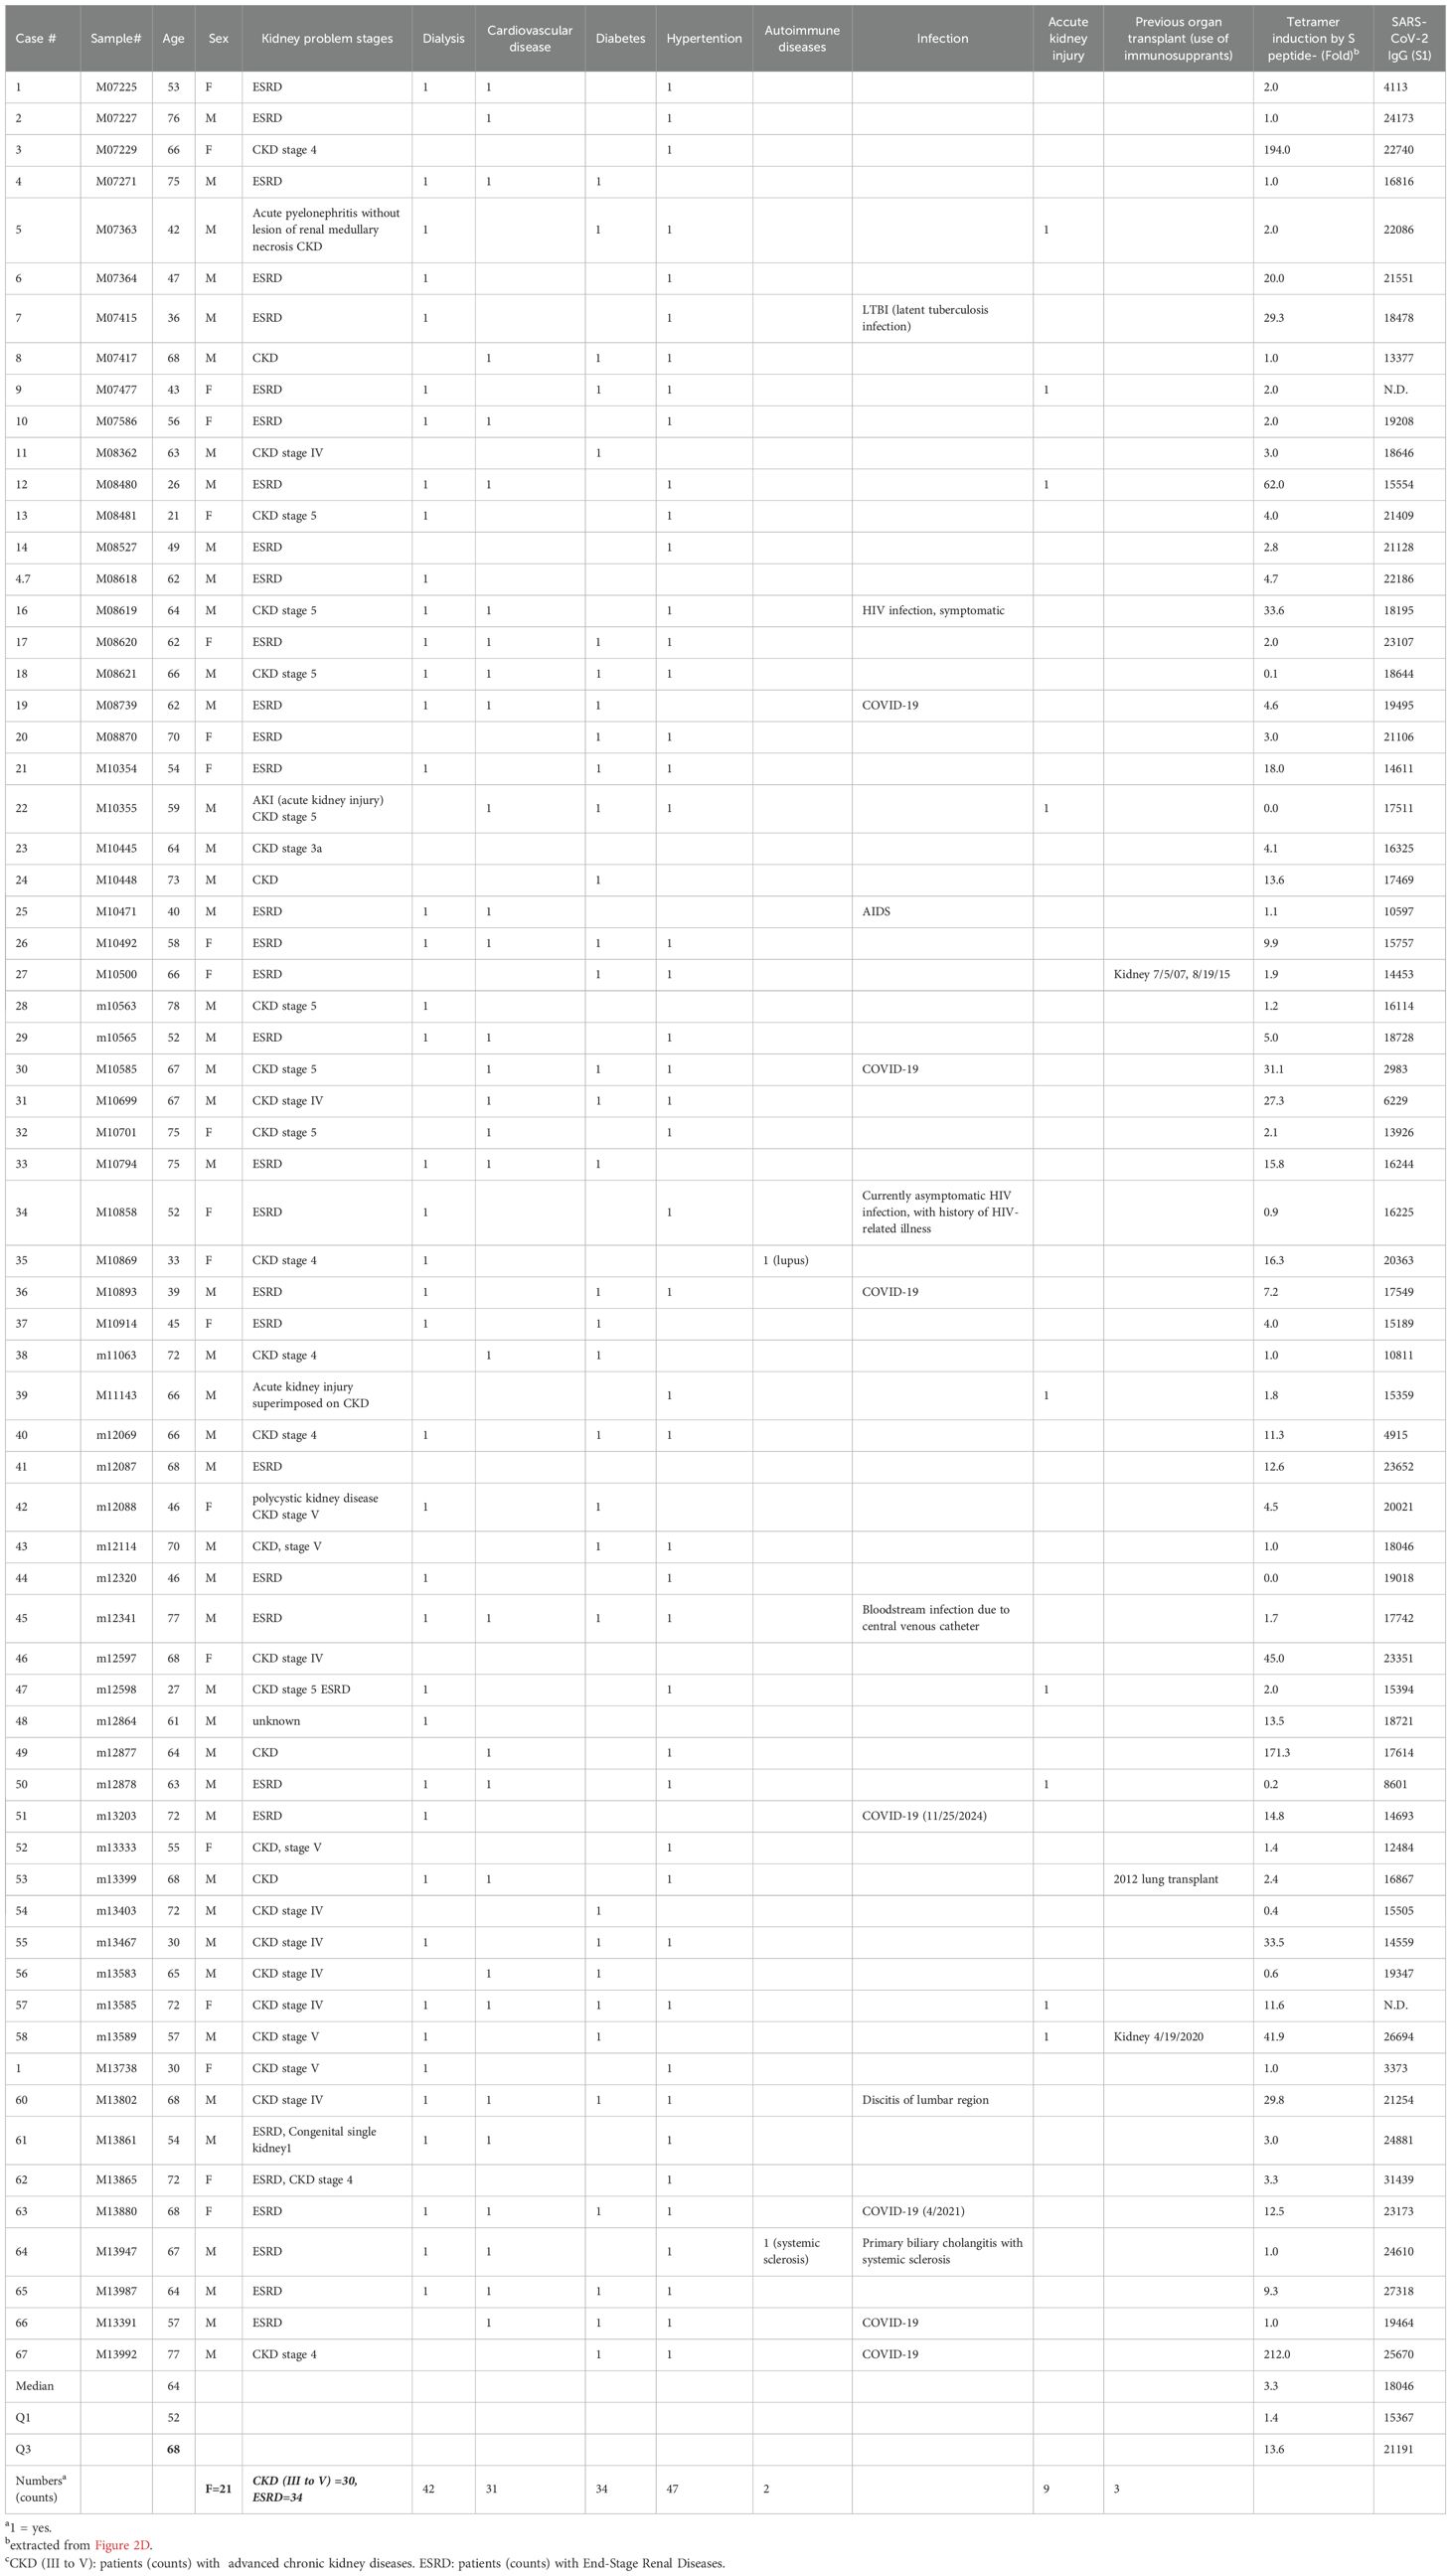
Table 2. Summary of characteristics of kidney patients.
3.4 HLA-A2:01/S1269-277 (hereafter referred as A2/S269) + CD8+ T cells are detectable only in SARS-CoV-2 spike seropositive individuals
To determine whether prior SARS-CoV-2 infection or COVID-19 vaccination is necessary for the detection of A2/S269-specific CD8+ T cells in peripheral blood, we first pre-screened 11 subjects, selected as naïve controls, for anti-nucleocapsid (N) and anti-S1 IgG antibodies. These individuals had serum samples collected either prior to the COVID-19 pandemic (before January 1, 2020) or during early 2020 when they were found to be negative for COVID-19. As shown in Figure 2A, all naïve subjects were tested negative for both anti-S1 and anti-N IgG antibodies.
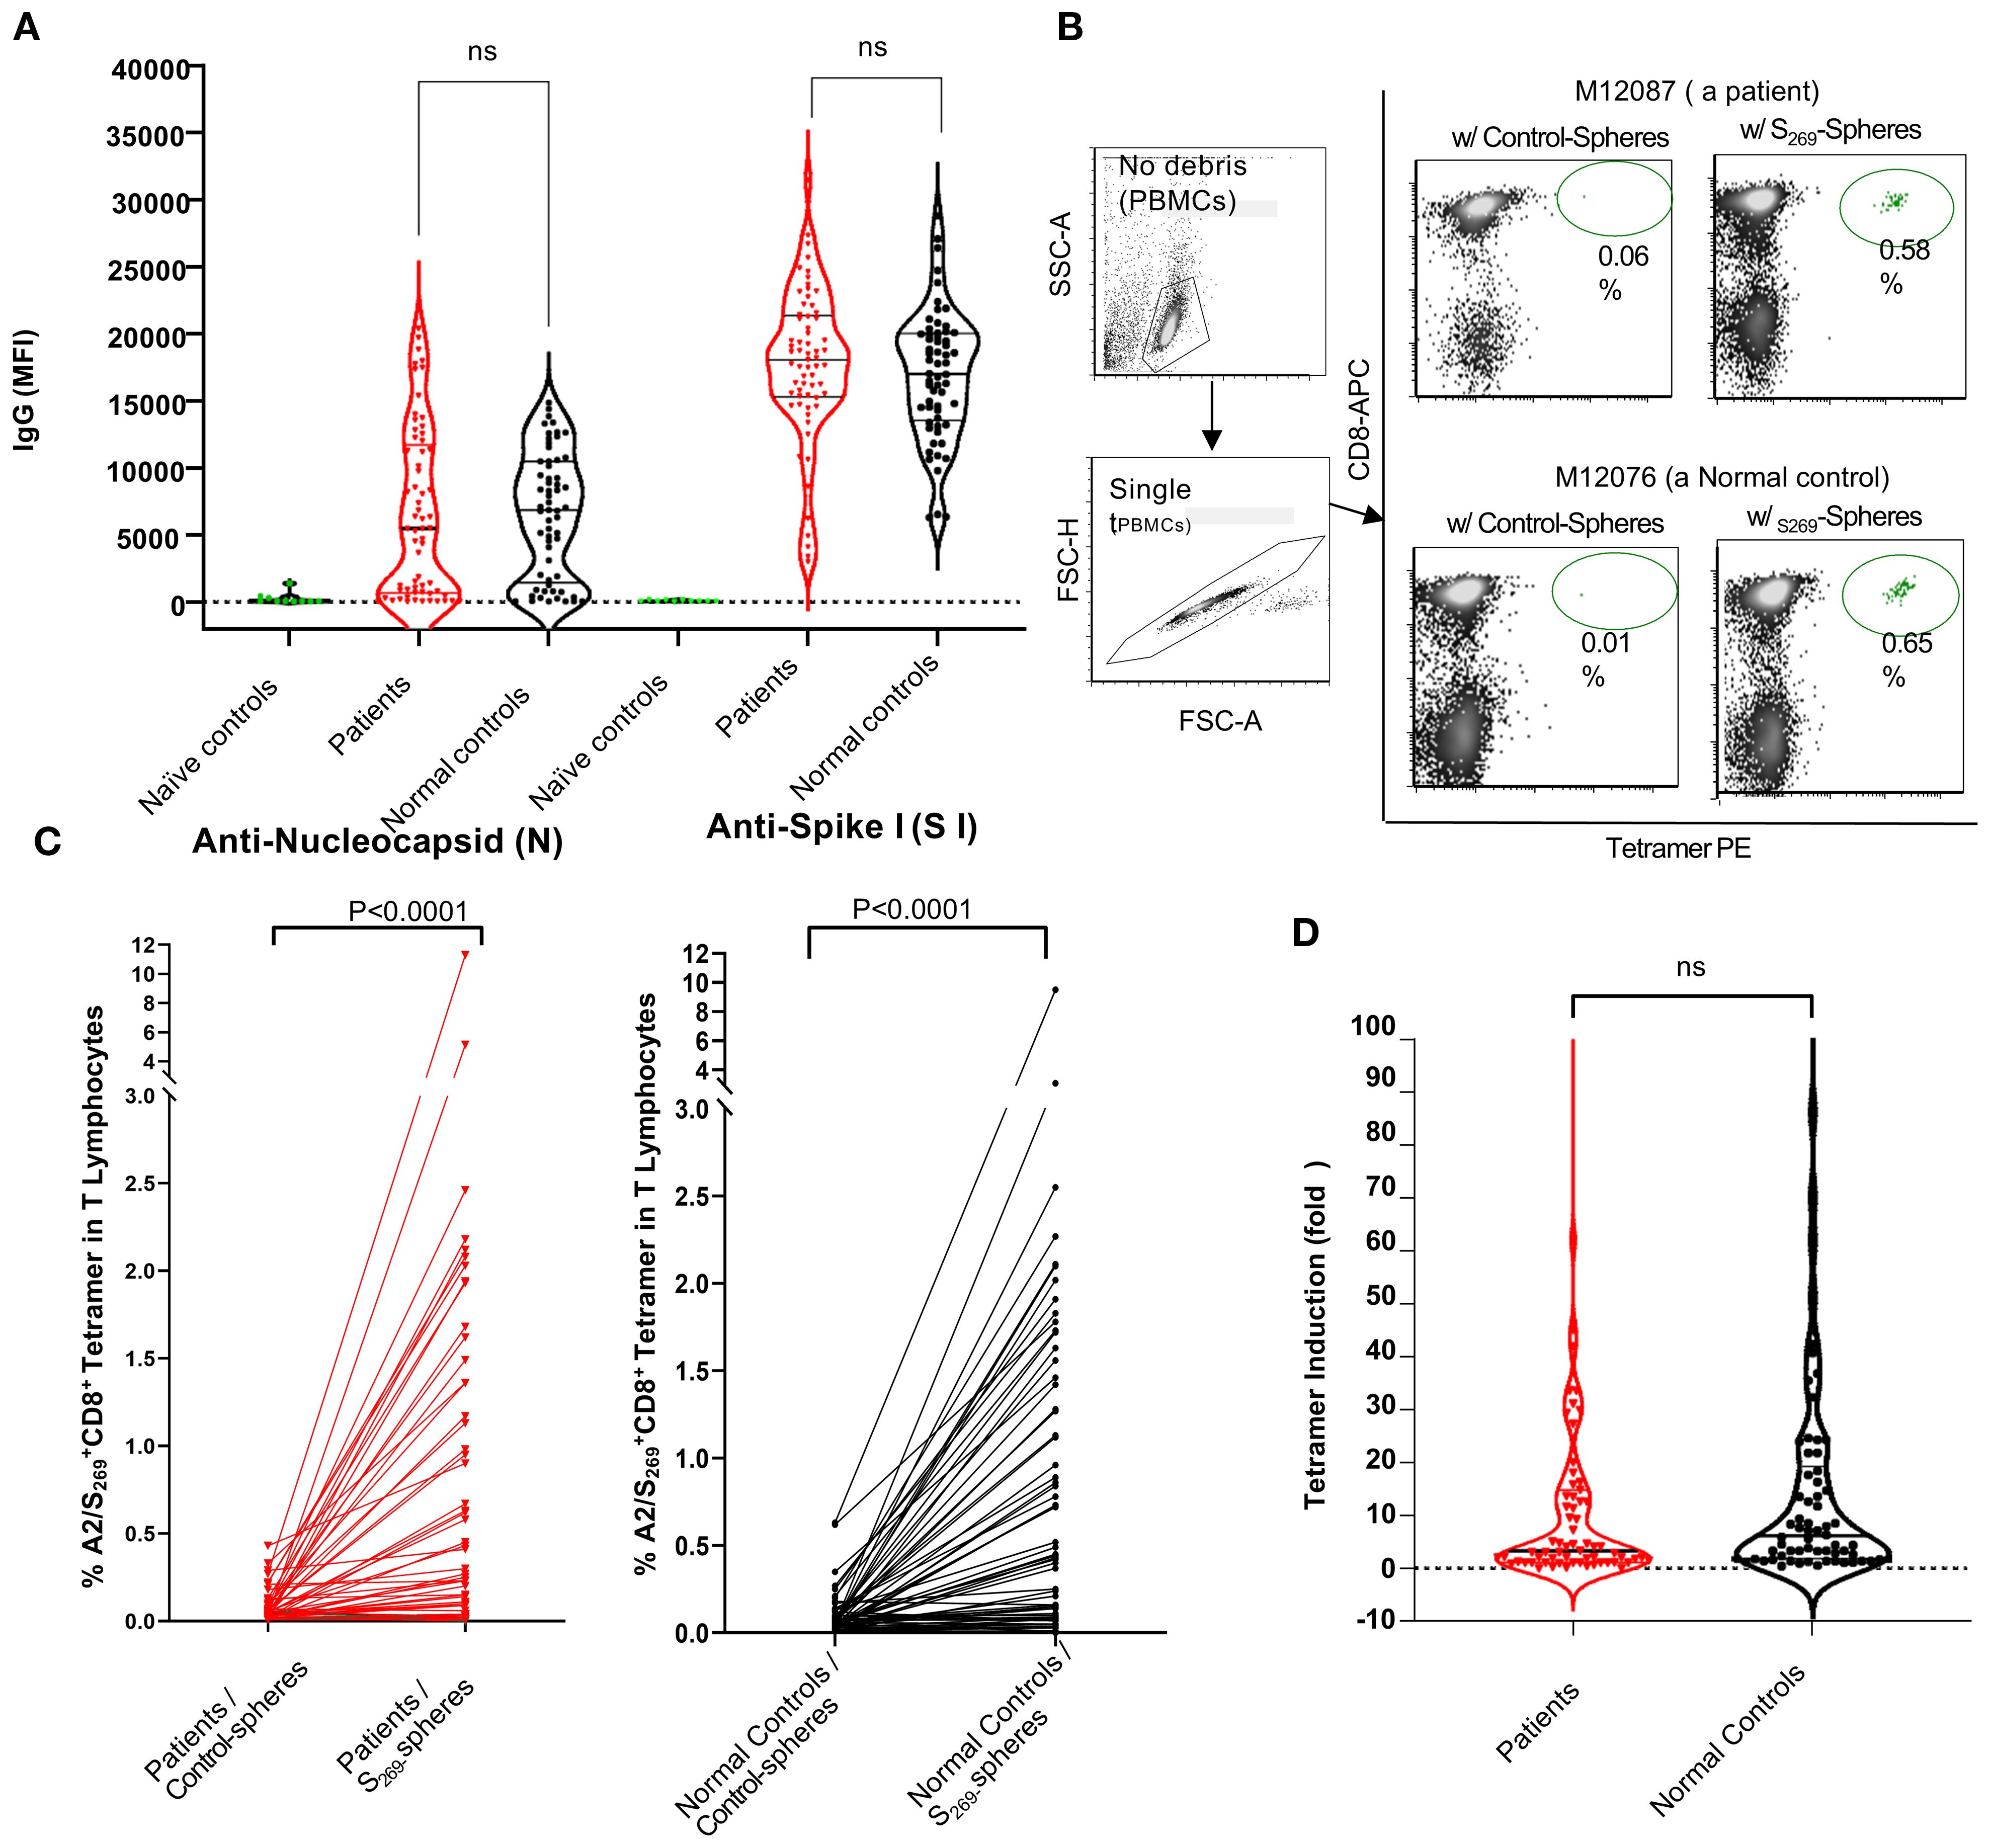
Figure 2. Analyses of anti-SARS-CoV-2 humoral and cellular responses in normal controls and kidney patients. (A) Violin Plot to show the levels of anti-SARS-CoV-2 IgG (anti-nucleocapsid and anti-S1) in individuals of naïve controls (n=11), normal control (n=66) and kidney patient individuals (n=67). Note that Naïve controls were designated as individuals whose sera were collected prior to or during 2020 with confirmation negative for COVID-19 tests done on nasal swabs. NS, no significance. B and C: Induction of A2/S269+CD8+ T subset cells in PBMCs by in vitro stimulation with either control-(no peptide) spheres or SARS-CoV-2S269--peptide conjugated spheres in normal controls and kidney patients. Representative results from one patient (M12087) and one normal control (M12076) were shown in (B) Compiling results from data of all subjects from both cohorts were shown in (C) Statistics of results were calculated by Mann-Whitney U (two-tailed) test. p < 0.05 was considered statistically significant. (D) Violin Plot to show no significant difference in induction of A2/S269+ CD8+T cell subsets between normal controls and patients. Tetramer induction was presented as folds (frequency of tetramer+ with peptide conjugated spheres/ frequency of tetramer+ with control-spheres). The p value returned by Mann-Whitney U (two-tailed) test was 0.3280. N.S, no significance.
In a parallel experiment, unstimulated PBMCs from a subset of these individuals (n=6) were analyzed using A2/S269 tetramer staining. None showed detectable (<0.01%) levels of A2/S269+ CD8+ T cells. In vitro stimulation with S269–277 peptide-conjugated spheres in the presence of cytokines also failed to increase the frequency of these cells (data not shown). These findings suggest that the emergence of A2/S269+ CD8+ T cells only occur after the exposure to SARS-CoV-2 antigens either through natural viral infection or COVID-19 vaccination. For this reason, we recruited only subjects with adequate humoral responses against SARS-CoV-2 for the study of cellular immune response.
3.5 Kidney transplant candidates mount adequate humoral responses to SARS-CoV-2
Analysis of anti-SARS-CoV-2 IgG antibodies in all eligible subjects across both cohorts showed no significant differences in humoral immune responses between kidney transplant candidates and normal controls, with respect to the levels of anti-N IgG and anti-S1 IgG (Figure 2A). Specifically, levels of anti-Spike S1 IgG antibodies were comparable between patients (median MFI: 18,046) and normal controls (median MFI: 17,016), with statistical analysis by Mann-Whitney’s two-tailed U test yielding p=0.2928. Similarly, anti-nucleocapsid (N) IgG levels did not differ significantly between patients (median MFI: 5,438) and controls (median MFI: 6,846); p=0.5824.
Given that both natural SARS-CoV-2 infection and COVID-19 vaccination can induce anti-S1 IgG production, while anti-N IgG is produced only following infection, these results indicate that patients with chronic kidney disease awaiting transplantation, like their normal counterparts, can mount equally effective humoral immune responses against SARS-CoV-2 following either COVID-19 vaccination and/or SARS-CoV-2 infection.
3.6 Kidney transplant candidates display similar strong A2/S269+CD8+ T cellular responses following in vitro stimulation
To evaluate the ability of kidney transplant candidates to mount antigen-specific CD8+ T cell responses, we stimulated PBMCs from subjects of both patient and control cohorts with either control-spheres or SARS-CoV-2 S269–277 peptide-conjugated spheres and cultured them in vitro as described (Figure 1A). All samples, arranged in chronological order by DNA ID, were thawed and processed in batch. A2/S269-specific CD8+ T cell subsets were subsequently detected via A2/S269 tetramer staining. A representative flow cytometric analysis of one patient (M12087) and one normal control (M12076) is shown in Figure 2B. A summary of analyses from all subjects of both cohorts is shown in Figure 2C.
Stimulation with control-spheres yielded low baseline frequencies of A2/S269+ CD8+ T cells: 0.088 ± 0.070% (Mean ± S.D.), stimulation with S269–277peptide-conjugated spheres significantly increased the frequency of A2/S269+CD8+ T cells to 0.85 ± 0.80% (Mean ± S.D.) in the control cohort. The induction of tetramer+ T cell frequencies by peptide-spheres is highly significant (p <0.0001, median:0.050 vs 0.425, n =65) by the Mann-Whitney U test. Similarly, stimulation with control-spheres or stimulation with S269–277peptide-conjugated spheres yielded the tetramer+ T cell frequencies of 0.067 ± 0.057% (Mean ± S.D.) and 0.76 ± 0.87% (Mean ± S.D.) in the patient’s cohort, respectively. The induction of tetramer+ T cell frequencies by peptide-spheres is also very significant (p<0.0001, median:0.040 vs 0.15, n =67) by the same statistical test.
To directly compare the magnitude of induction across cohorts, we calculated the fold-change in tetramer-positive cells. As shown in Figure 2D, no significant difference (p=0.3280) was observed between the control group (median fold increase=5.8) and the patient group (median fold increase=3.3), suggesting that kidney transplant candidates largely retain the capacity to mount antigen-specific CD8+ T cell responses, comparable to healthy individuals.
Notably, approximately one-third of subjects in each group exhibited strong expansion of predominantly tetramer positive CD8+T cells in response to peptide stimulation. Specifically, 24 of 65 normal controls (36.9%) and 23 of 67 kidney patients (34.3%) demonstrated at least a 10-fold increase and were classified as high responders (HRs). With HRs, the median fold of increase was 24.0 for the control cohort and 20.0 for the kidney cohort, respectively. In contrast, over half of the subjects in each group showed minimal or no induction, indicating a skewed distribution of T cell responsiveness within the population. These data, along with comparable SARS-CoV-2 IgG responses, demonstrate that patients with chronic kidney disease awaiting transplantation can mount robust humoral and cellular immune responses to SARS-CoV-2, despite their underlying comorbidities.
Due to the heterogeneity of the patient cohort with respect to underlying cause of kidney failure, we investigated whether the induction (fold) of A2/S269 tetramer+ cells was related to various kidney diseases. The induction of antigen-specific T cells was found to be randomly distributed among kidney patients ((Table 2). To clarify the roles of these disorders, we categorized kidney patients into two groups: ESRD, comorbidities due to non-immunological causes(hypertension, diabetes, cardio/vascular and acute injury) and ESRD caused by immunological conditions and(including autoimmune diseases and use of immunosuppressants for previous transplant. (Supplementary Figure S1 demonstrates that all two groups exhibited a similar median fold of induction (3.0) along with comparable interquartile ranges (IQR). A comparison analysis revealed that the differences were statistically insignificant (p=08157). The analyses indicated that comorbidities, immunosuppression, and autoimmune status did not influence the induction of tetramer-positive T cells or the responses specific to peptide antigens.
Both the patient and normal control groups exhibited comparable frequencies of high and low responders, suggesting that variability is not limited to disease status. Factors such as HLA genotype, age, sex, and comorbidities did not significantly influence the strength of the response. Furthermore, the capacity to respond to peptide antigen-specific T cell stimulation was found to be independent of the levels of anti-S1 SARS-CoV2 IgG, as every individual within the cohorts demonstrated adequate humoral responses.
3.7 A2/S269+ CD8+ T cell expansion correlates with increased production of IFN-γ and TNF-α in both normal controls and kidney patients
Pro-inflammatory cytokine secretion, particularly IFN-γ and TNF-α, is a hallmark of cytotoxic CD8+ T cell function and is essential for effective immunity against intracellular pathogens and tumor cells (29). To investigate whether antigen-specific A2/S269+CD8+ T cells can produce inflammatory cytokines, we first performed IFN-γ ELISpot assays on PBMCs from two A2/S269+ normal donors, M10315 and M11116, following in vitro stimulation. PBMCs were cultured with peptide-conjugated spheres targeting SARS-CoV-2 S269–277, SARS-CoV-2 ORF1ab (2332–2340) (19), or CMVpp65 (495–504) (30), along with cytokines as previously described. Post-stimulation, cells were split into two parts: one was analyzed for A2/tetramer+ frequencies, and the other was cultured for an additional 16 hours in serum-free medium with cognate peptides or PHA (as a positive control) to measure the frequency of IFN-γ secreting cells.
Tetramer staining revealed robust induction of A2/S269+CD8+ T cells and HLA-A*02:01/CMVpp65495-503 (hereafter referred to as CMVpp65495)+ CD8+ T cells following cognate peptide stimulation, with 10- and 7-fold increases, respectively (Figure 3A; Supplementary Figure S4). In contrast, A2/ORF1ab2332-specific T cells were undetectable by tetramer staining or cytokine release, suggesting that this epitope may be cryptic or poorly immunogenic. Consistent with the tetramer results, ELISpot assays showed negligible IFN-γ producing cells from unstimulated or control-sphere-treated PBMCs. In contrast, upon re-challenge with free cognate peptides, a marked increase, often >100-fold IFN-γ producing cells, was observed in cultures stimulated with A2/CMVpp65495 peptide-spheres, which served as ELISpot positive control, and cells stimulated with A2/S269 peptide-spheres.
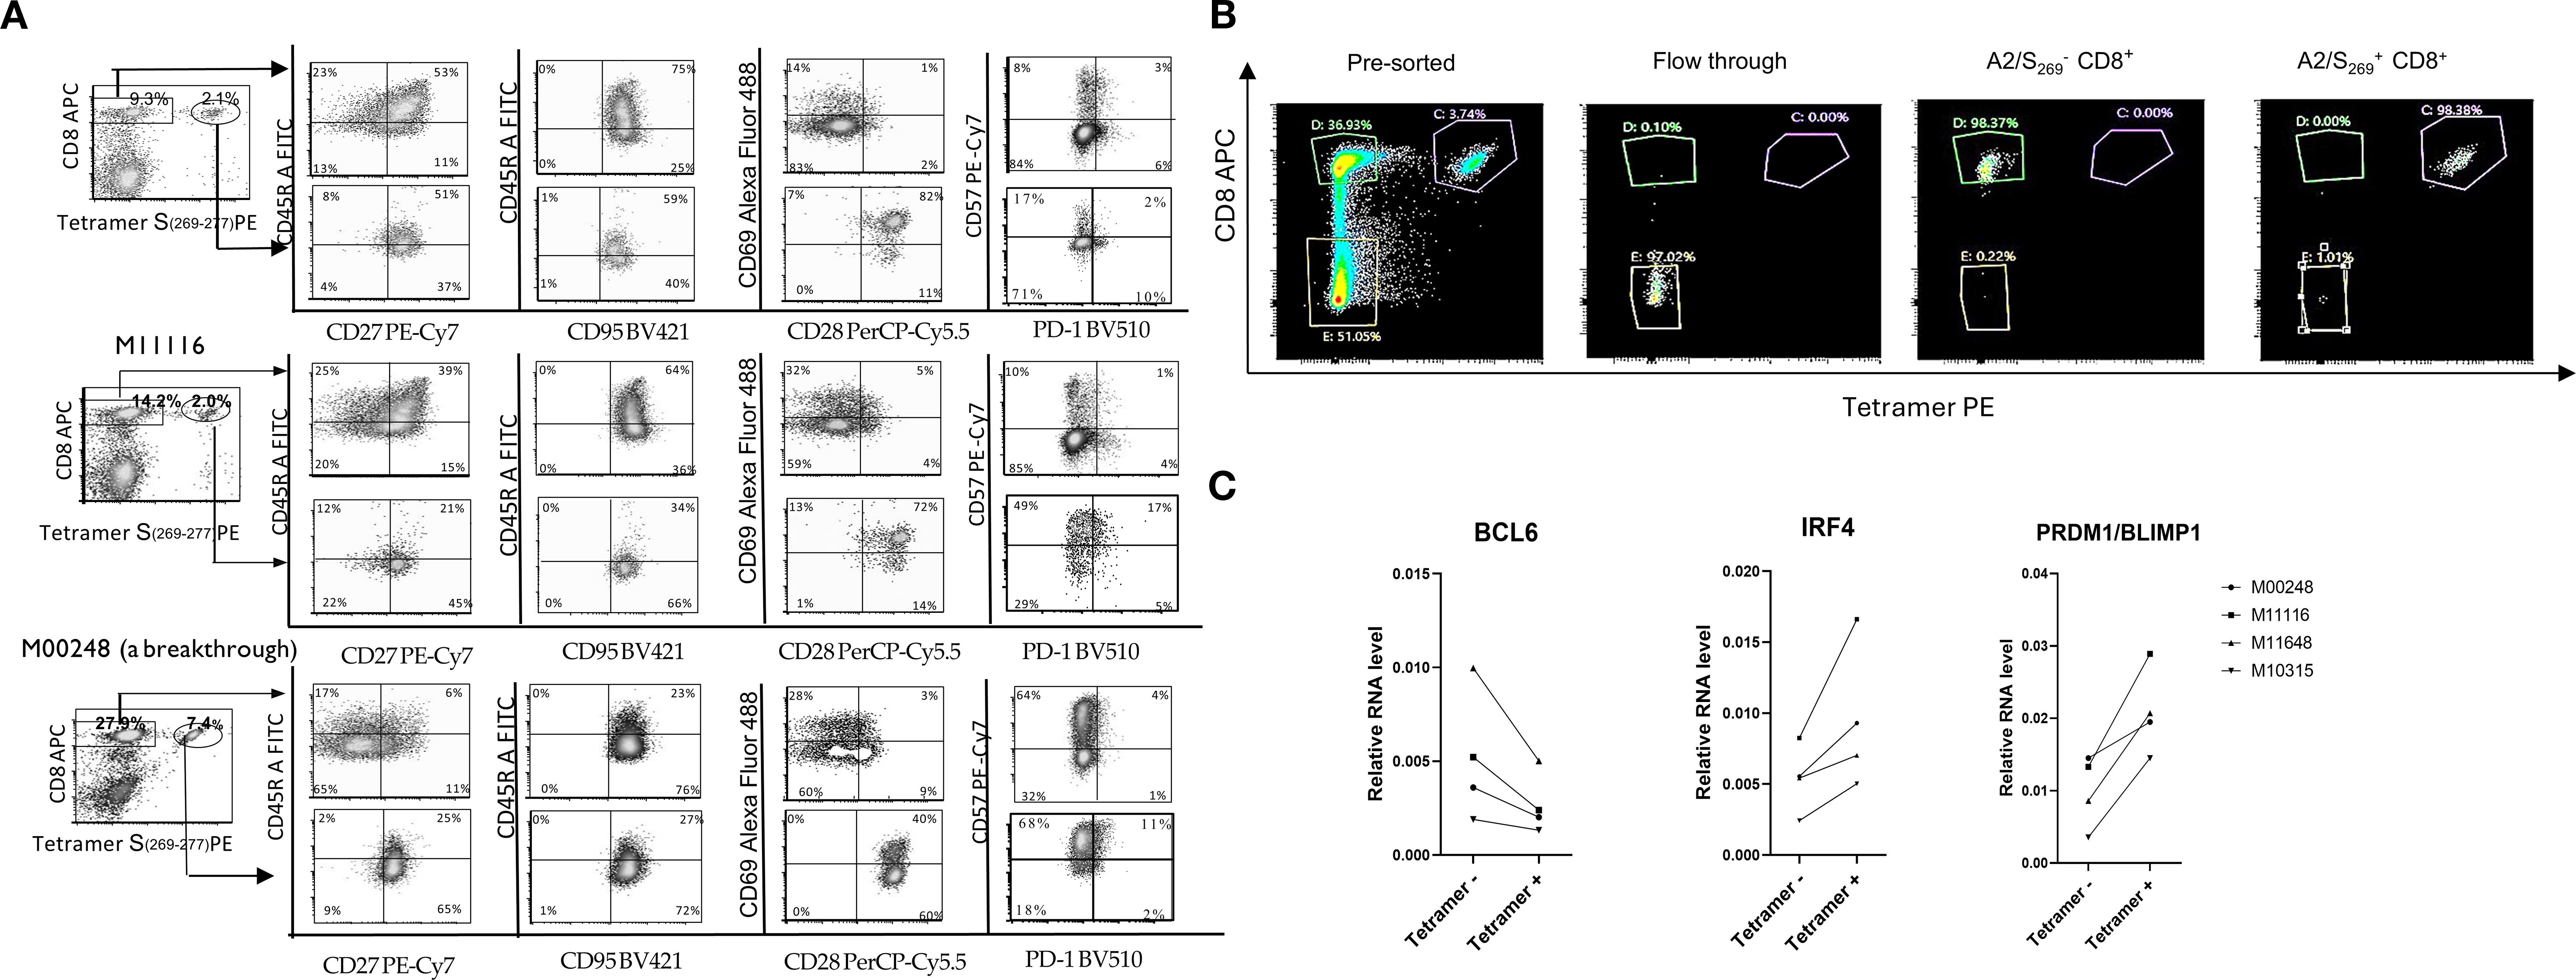
Figure 3. A2/S269+CD8+T cells exhibited effector-memory T cell phenotype. (A) Decreased expression of naïve and central memory marker CD45RA and increased expression of effector markers, CD57 in A2/S269+ T cell subsets when compared to bystander CD8+ T cells. PBMCs from 3 normal controls were analyzed for various memory T cells markers (CD45RA, CD27, CD95), effector markers (PD-1 and CD57) and co-stimulatory markers CD28 by Flow Cytometry. The histogram analysis of these results is shown in Supplementary Figure S2. Results were shown as Mean ± S.D. (B) A representative of sorting profile of A2/S269+ CD8+ T cell subset and bystander CD8+ T cells; typically, >97.5% purities. (C) Down-regulation of BCL6 and up-regulation of PRDM/Blimp1and IRF4 in A2/S269+CD8+ T cells, compared to bystander CD8+ T cells. RNA from 4 Tetramer A2/S269+ subsets and 4 tetramer- subsets were analyzed by quantitative RT-PCR with endogenous GAPDH as an internal control. The gene expression relative to housekeeping gene GAPDH was calculated using the formula 2-ddCt, where ddCt =(Ct[gene]-Ct[GAPDH]) and Ct is the crossing threshold value returned by the PCR instrument for every gene amplification. The results were recorded as an average from duplicate.
To further evaluate the relationship between antigen-specific CD8+ T cell expansion and cytokine release in all subjects, we employed Luminex-based multiplex cytokine assays (ProcartaPlex), allowing us to measure the release of several cytokines (IFN-γ, TNF-α and MIP-1β) simultaneously. PBMCs from both normal controls and patients’ cohorts were stimulated in vitro with S269–277 peptide-Spheres as previously described, then re-stimulated with cognate peptide. Cytokine levels released in supernatants were measured as fold induction (with peptide/without peptide), and results were plotted against A2/S269+ tetramer frequencies. As shown in Figure 4B, strong positive correlations were observed between A2/S269+ CD8+ T cell frequencies and cytokine production across both cohorts: In normal controls (n=42): IFN-γ: Spearman’s r=0.8182, p<0.0001; TNF-α: Spearman’s r=0.8478, p<0.0001. In kidney patients (n=48): IFN-γ: r=0.7874; p<0.0001. TNF-α: r=0.6905, p<0.0001. No significant correlation was observed between A2/S269+ CD8+ T cell frequency and MIP-1β production (data not shown), suggesting a biassed pro-inflammatory cytokine profile.
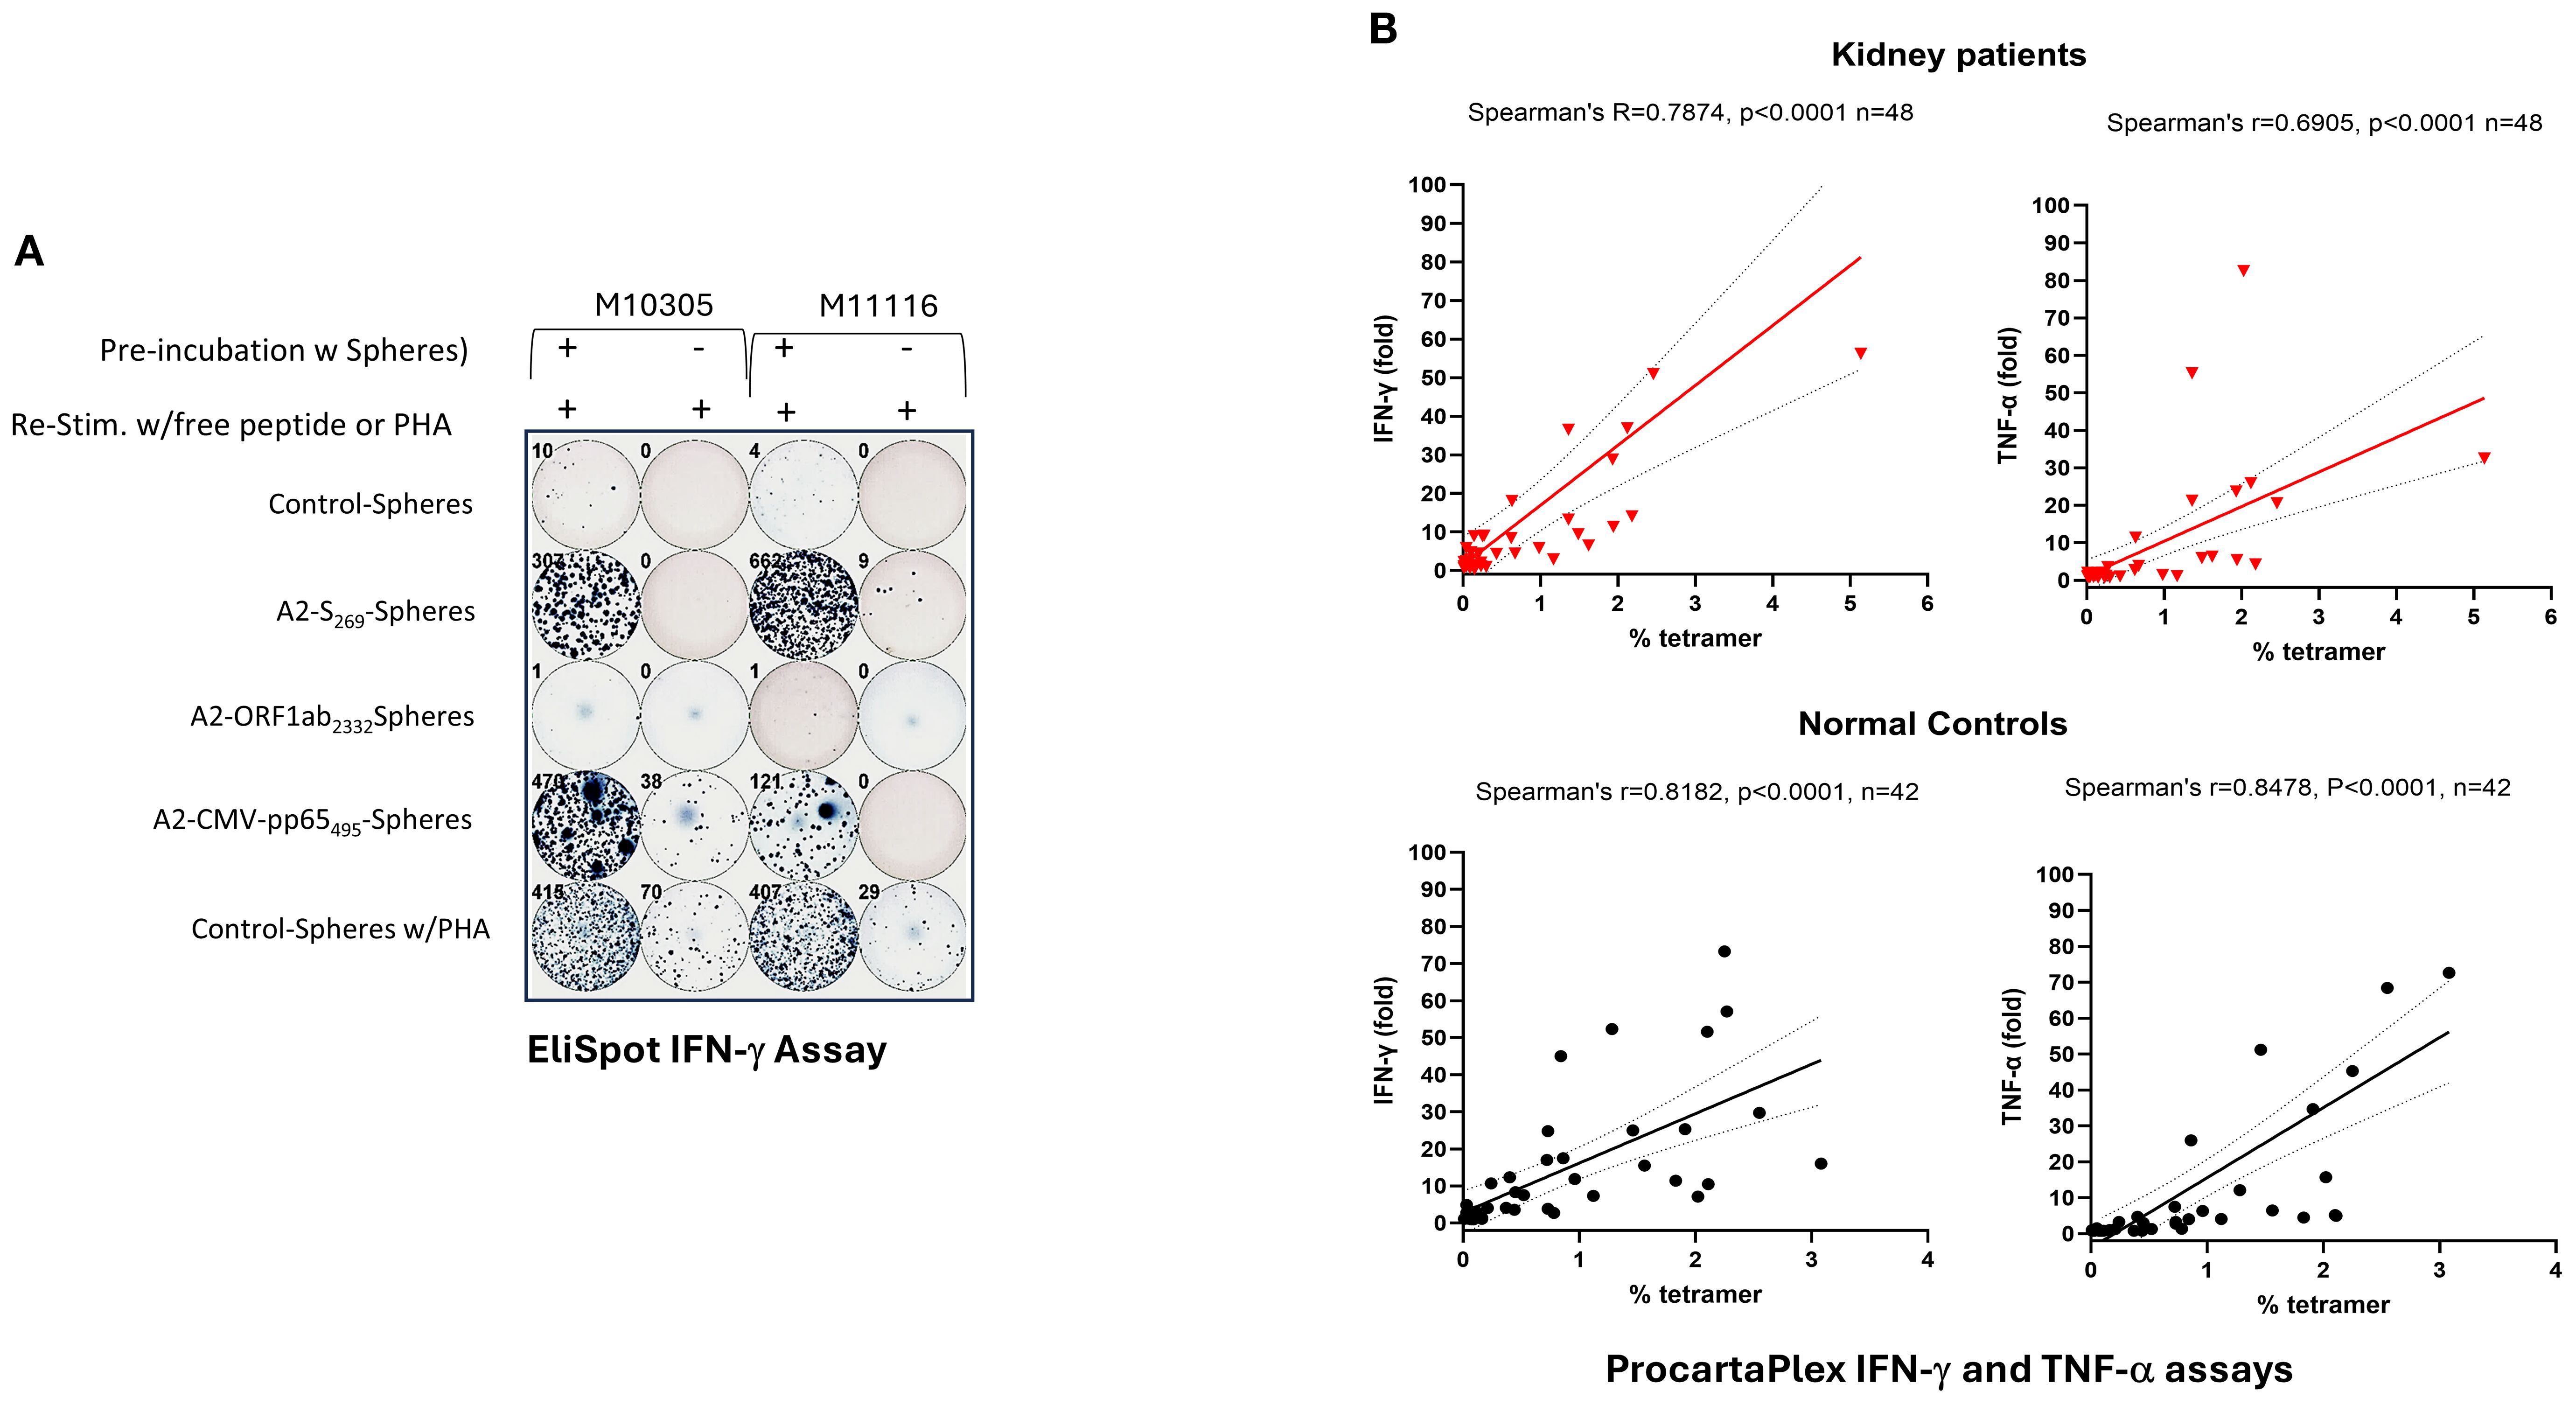
Figure 4. Induction of IFN-γ and TNF−α by PBMCs stimulated with A2/S269- peptide conjugated spheres in normal controls and kidney patients. (A) Increased IFN-γ producing cells in PBMCs by in vitro stimulation with various peptide conjugated spheres. In the ELISPOT assay, Cells cultured with A2-CMV-pp65495-spheres or with PHA (0.2x)were used as the positive controls, whereas cells cultured with control-spheres or without in vitro stimulation were used as the negative controls, respecitvely. Numbers of IFN-γ producing cells were visualized and automatically calculated by ImmunoSPOT2™ software. (B) ProcartaPlex assays of secreted IFN-γ and TNF-α in supernatants from cells stimulated with SARS-CoV-2S269-peptide conjugated spheres. Spearman’s rank correlation and simple linear regression were used to determine the relationship between the frequency of tetramer+ vs the fold of cytokine (IFN-γ and TNF-α) release by cognate peptide stimulation. .
Our findings indicate that in vitro peptide-sphere stimulation of PBMCs leads to clonal expansion and functional differentiation of A2/S269-specific CD8+ T cells into IFN-γ and TNF-α producing effector cells. Importantly, PBMCs from kidney transplant candidates exhibited expansion and cytokine-producing capacities comparable to those of healthy controls, highlighting their preserved potential to mount effective cellular immune responses despite their underlying comorbidities.
3.8 HLA-A2/S269+ CD8+ T Cells display both memory and effector T cell surface markers
The substantial enrichment of SARS-CoV-2 antigen-specific CD8+ T cells in our system enabled a direct comparison of phenotypic differences between T cells expanded by cytokines alone (bystander tetramer negative CD8+ T cells in the same culture) and those expanded by both cytokines and peptide antigen (tetramer positive CD8+ T cells). In vitro induced A2/S269 antigen specific T cells from three HLA-A*02:01 normal controls, in addition to M10315 and M11116, also including donor M00248, who had recently recovered from a breakthrough SARS-CoV-2 infection, were analyzed for expression of canonical memory and effector T cell surface markers via flow cytometry.
The memory T cell markers were evaluated including: CD27, CD45RA, CD95, and CD69 (a tissue-resident memory T cell marker), effector and activation markers including CD57, PD-1, and the co-stimulatory molecule CD28. As shown in Figure 3A and Supplementary Figure S2, the tetramer-CD8+ T cell population from 3 peptide-spheres/cytokine-stimulated cultures exhibited the following phenotype: CD45RA+(54 ± 20%, MFI: 2235 ± 709), CD27+ (45 ± 18%, MFI: 1878 ± 1164), CD28-(8 ± 3%, MFI:78 ± 53), CD69iow(27 ± 8%, MFI:1032 ± 208), CD95+(100%,MFI: 4301 ± 678), CD57low (30 ± 25%, MFI: 1770 ± 1951) and PD-1-(6 ± 1.7%, MFI: 779 ± 184). These phenotypes were indistinguishable from CD8+ T cells stimulated with control-spheres/cytokines (data not shown), indicating naïve/central memory T cell phenotype with minimal antigen-specific activation. In contrast, tetramer+CD8+T cells (antigen-specific) exhibited a distinct profile: CD45RAlow(40 ± 12%,MFI:1195 ± 552), CD27+(81 ± 10%,MFI:789 ± 594), CD28+(93 ± 5%, MFI:10417 ± 890), CD69+(71 ± 21%, MFI: 6186 ± 3217), CD95+ (99%, MFI: 3139 ± 219), CD57+ (55 ± 24%, MFI: 8904 ± 4298) and PD-1-(16 ± 4%, MFI: 1081 ± 76).
Comparison of the population of tetramer positive CD8+ T cells with bystanders of tetramer negative CD8+ T cells, shows that the former has a lower expression of CD45RA (CD45RAlow) and higher expression of CD57(CD57bright), suggesting that tetramer positive, antigen-specific CD8+ T cells have differentiated into more mature T cells with effector-memory T cell phenotype during in vitro peptide-sphere stimulation. This phenotype of CD45RAlowCD57bright was also observed in tetramer negative bystander CD8+ T cells in the breakthrough individual (M00248).
Importantly, increased expression of CD28 and lack of expression of PD-1 reinforce the interpretation that these cells were not terminally exhausted but rather maintained functional capacity and proliferative potential. Taken together, these results indicate that in vitro stimulation with S269-277-peptides- conjugated spheres had triggered differentiation of SARS-CoV-2-specific CD8+ T cells with highly differentiated effector-memory phenotypes.
3.9 Increased expression of IRF4 and PRDM1/BLIMP1 and decreased expression of BCL6 in A2/S269+CD8+ T cells
BCL6 and PRDM1/BLIMP1 are well-established transcriptional repressors (31, 32) originally identified for their roles in B cell differentiation. More recently, these two factors have been recognized as key antagonistic, or “Yin-Yang,” regulators of T cell fate, particularly involved in the differentiation of memory T lymphocytes into effector subsets (33, 34). Another key transcription factor that tightly regulated by both BCL6 and PRDM1/BLIMP1 is Interferon-Regulatory Factor 4 (IRF4). As the promoter of IRF4 contains binding sites for both BCL6 and Blimp-1 (35), IRF4 has been shown to be required for the generation of protective effector CD8+ T cells against intracellular bacterium Listeria monocytogenes in a murine model (36). To explore how these transcription factors function in human SARS-CoV-2-specific CD8+ T cells, we first sorted cells from in vitro S269-277-peptide-spheres stimulated PBMCs by Flow Cytometry into tetramer-positive (SARS-CoV-2-specific) and tetramer-negative subsets (bystander). A representative graph (Figure 3B) representing results obtained after sorting showed the purity of CD8+ T cells was greater than 97.5%. Four tetramer-positive subsets and four tetramer-negative subsets sorted from normal controls were subsequently assayed for RNA expression of BCL6, PRDM1/BLIMP1 and IRF4 by Real-time PCR.
As shown in Figure 3C, although heterogeneous, BCL6 RNA was down-regulated by an average of two-fold in all 4 sets of tetramer-positive cells when compared to the bystander tetramer-negative cells. Conversely, IRF4 and PRDM1/BLIMP1 were up-regulated in all 4 sets of tetramer-positive cells, when compared to the bystander tetramer-negative cells, with a similar 2-fold increase. It appears that the transcriptional profile of antigen specific CD8 T cells, characterized by upregulated PRDM1/BLIMP1 and IRF4 differs from that of noncommitted bystander CD8+T cells that show BCL6 upregulation. It also supports the notion that PRDM1/BLIMP1modulates transcriptional programs of CD8+ T cells during chronic viral infection as indicated in a murine model (37).
3.10 A2/S269+ CD8+ T cells exhibit potent antigen-specific cytolytic activity
CD57 (Leu-7) was regarded as a marker of senescence in CD8+ T cells (38). However, recent studies indicated that CD57+ T cells were not only able to proliferate in vivo (39) but also displayed heightened cytolytic potential, defining subsets enriched in lytic granules within both CD8+ T cells and natural killer (NK) cells (40, 41). Given that secretion of antiviral cytokines such as IFN-γ and TNF-α (Figure 4) does not always correlate with cytotoxic function, as observed in some HIV-specific CD8+ T cell responses (42), we next investigated whether A2/S269+ CD8+ T cells exhibit direct cytolytic effects to target cells.
We first determined the co-expression of CD57 and perforin within tetramer+ CD8+ T cells. As shown in Figure 5A and Supplementary Figure S3, three PBMCs from healthy controls, including a breakthrough donor M00248, showed high co-expression of CD57 expression and intracellular perforin expression within the tetramer+ subset. On average, 60.5% ± 33% of tetramer+ cells were double-positive for CD57bright and perforin+. In contrast, CD57dim/tetramer-cells were largely perforin-negative (80.5% ± 5.5%). This result is consistent with the finding by Chiang et al. (40) that CD57bright marks perforin-expressing CD8+T cell subsets. Notably, normal control M10248, who had a recent breakthrough COVID-19 infection, exhibited elevated perforin expression across both tetramer+ and tetramer- subsets, potentially reflecting immune stimulation following recurrent SARS-CoV-2 infections. Nonetheless, histogram (Supplementary Figure S3) analysis confirmed significantly higher perforin expression in tetramer+ cells (MFI=11,188) compared to tetramer- cells (MFI=3,337) in this donor.
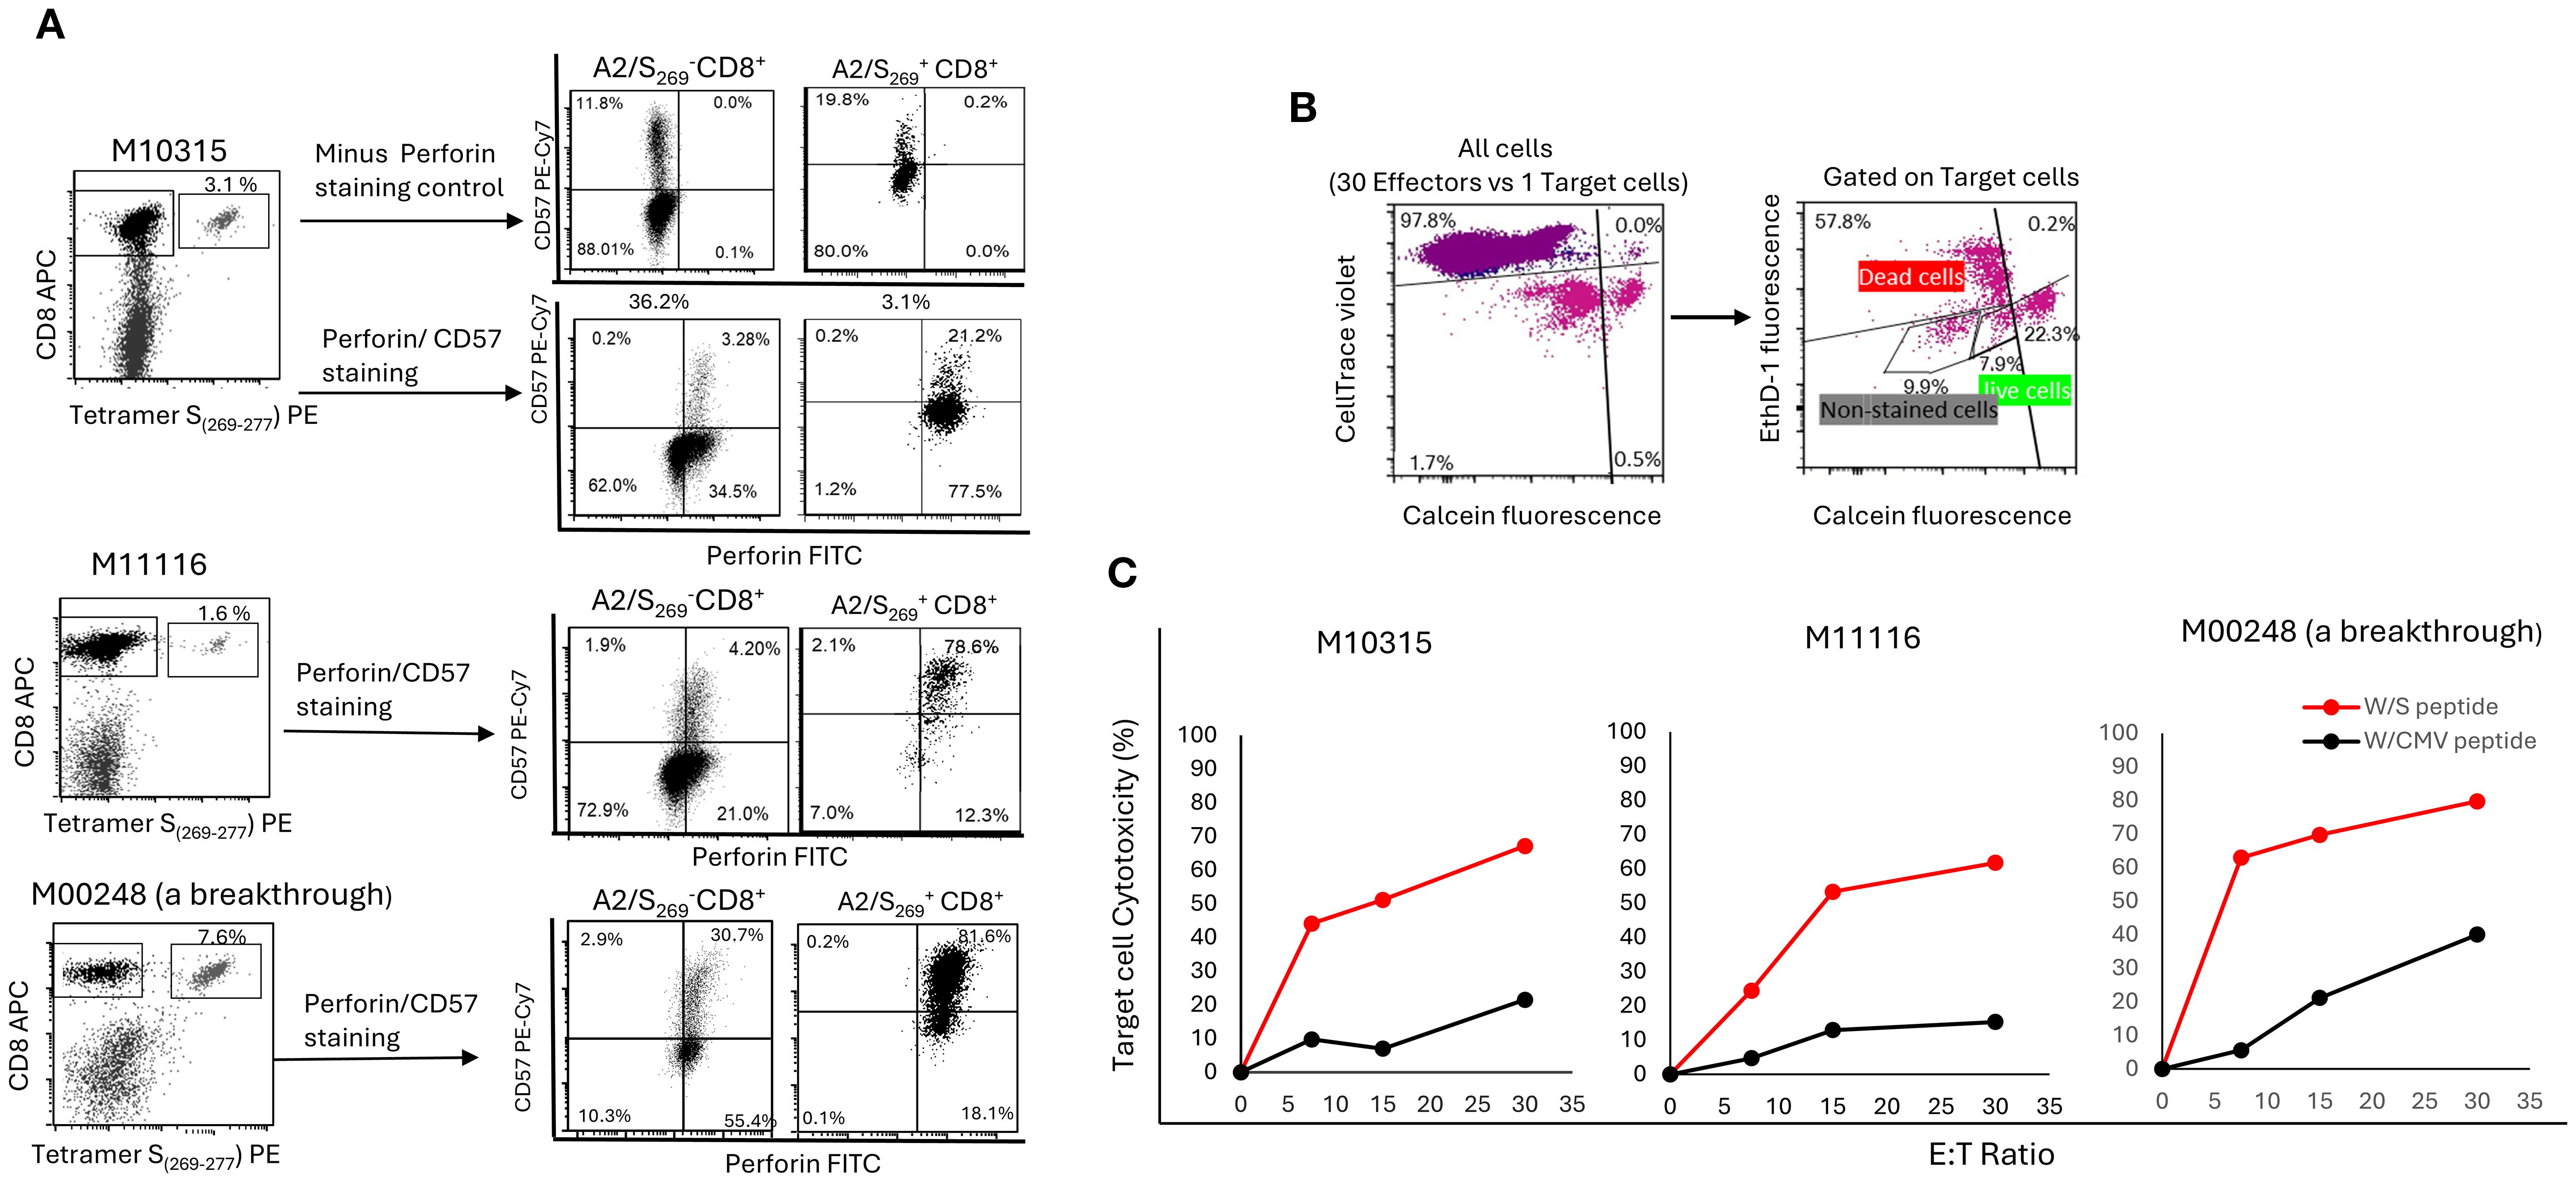
Figure 5. A2/S269+ CD8+T cells were enriched in CD57bright/Perforinhigh subset and were highly cytotoxic to HLA-A*02:01 target cells in an antigen specific- and a dose dependent- manner. (A) PBMC from 3 HR normal controls were in vitro stimulated as described. After tetramer staining, cells were counter-stained with CD57 and perforin mAbs. Minus-Perforin staining was also performed in M10315 to rule out some false positivity associated with intracellular staining of perforin. The histogram of this analysis is shown in Supplementary Figure S2. (B) Gating strategy for cell mediated cytotoxicity. Effectors which stained with CellTace Violet were first to be gated out, followed by gating out unstained target cells. Calcein AM (green) positive target cells were counted as live cells, whereas double positive [Ethidium (red) and Calcein AM (green)] and Ethidium positive (red) target cells were all counted as dead cells. (C) Target specific and dose dependent of A2/S269+CD8+ T cell mediated cytotoxicity. The percentage of effector cell mediated cytotoxicity was calculated using the following equation: Cytotoxicity (%) = 100*(total deaths target cells-spontaneous deaths) / (100-spontaneous deaths).
To evaluate cytolytic function directly, we conducted a cell-mediated cytotoxicity assay using HLA-A*02:01-expressing T2 cells pulsed with either cognate SARS-CoV-2 S269–277 peptide or with irrelevant peptide CMVpp65495–503 as a negative target control. Effector cells, generated by PBMCs primed with S269–277 peptide conjugated spheres, were co-cultured with cognate S peptide loaded target T2 cells or irrelevant CMV peptide loaded target T2 cells at varying effector-to-target (E: T) ratios. As shown in Figure 5B, peptide-primed effectors demonstrated the strongest dose-dependent cytotoxicity, lysing 62.8%, (Range: 51.2-69.8%) of cognate target cells at an E:T ratio of 15:1. In contrast, target cells loaded with CMV peptide were lysed in a much lower percentage (Mean=13.4%, Range: 7.0 - 21.3%) at the same E:T ratio. This result demonstrates that cell-mediated cytotoxicity was strictly antigen-specific, as less killing was observed when targets were loaded with a potentially irrelevant CMV-derived peptide.
Of note, antigen specific target cell killing was well correlated with the frequency of A2/S269+ T cells (Figure 5A). Donor M10248 (a breakthrough) with 7.6% tetramer+ T cells killed 63% of targets. Donor M10315 with 3.1% tetramer+ T cells killed 44.2% of targets, donor M11116 with 1.6% tetramer+ T cells killed 24.5% of targets, all had an E:T ratio of 7.5:1.
Taken together, our findings show that priming with SARS-CoV-2 S266–274-conjugated spheres efficiently generates a distinct population of antigen-specific CD8+ T cells characterized by high expression of both CD57 and perforin, key markers associated with cytotoxic effector function, as shown before (40). These CD57bright/perforinhigh T cells exhibited potent antigen-specific killing of peptide-loaded target cells in a dose-dependent and HLA-restricted manner, underscoring their robust functional cytolytic potential. In conclusion, A2/S269+ CD8+ T cells are not only capable of antigen-specific proliferation and cytokine secretion but also possess strong cytolytic potential. Their perforin expression and robust killing of peptide-loaded targets highlight their functional effector capacity, suggesting their suitability for T cell-based antiviral therapies.
4 Discussion
4.1 A2/S269+ antigen-specific CD8+ T cells as SARS-CoV-2-specific cytolytic effector cells in T cell therapy
In this study, we show that in vitro stimulation of T cells with peptide coated microspheres, memory A2/S269+ cells can be rapidly expanded and differentiated in vitro into T cells with an effector-memory and cytotoxic phenotype and function. These cells exhibit potent cytolytic activity and unique expression of surface CD28 and CD57 and of effector -related -transcriptional factor PRDM1/BLIMP1 and IRF4. Multiple rounds of division have evidently not resulted in exhaustion since these T cells remain CD28 +. To our knowledge, our current findings describe for the first time the distinct phenotype of these antigen specific cytotoxic CD 8 T cells.
Although initially considered indicative of sub-optimally Cov-2 activated T cells, in comparison to T cells activated by other viral epitopes (e.g., EBV A2/BMLF1280) (14)), longitudinal studies of cellular immune reactivity have subsequently revealed that a subset of SARS-CoV-2 specific T cells, including A2/S269-specific CD8+ T cells, persist for long periods of time(1–2 years). This was found both after “short” and “long “COVID-19 disease, reflecting the expansion of SARS-CoV-2 T memory cells specific for unique epitope(s) with stringent requirements of fitting TCR configuration (15). In particular, T cell receptor (TCR) analyses have identified a biased TCR repertoires specific to A2/S269, commonly featuring TRAV12-1 α chain gene usage (16). Hence, a restricted T cell repertoire, probably directed toward an immunodominant viral epitope, seems to be conserved in different populations.
The frequencies of A2/S269-specific CD8+T cells drastically increased (>10-fold up to 200-fold) and reached approximately 0.5%-3% of total CD8+ T cells in approximately 35% of individuals. Given that CD8 T cells increase from one third of total circulating T cells to 50-60% after peptide-sphere stimulation in 14-day cultures, we estimate that S-antigen-specific CD8+ T cells may have been enriched by more than 50-fold during the in vitro experiment. This finding highlights the therapeutic potential of our study, making it a promising candidate for adoptive T cell therapy.
4.2 Lessons from the COVID-19 pandemic: advancing the generation of viral-specific cytotoxic T cells beyond SARS-CoV-2
While the interest in adoptive transfer of SARS-CoV-2-specific T cells has decreased following the approval of antiviral agents such as Paxlovid, the demand for effective viral-specific T cell (VST) therapies remains high, particularly for immunocompromised patients undergoing solid organ transplantation (SOT) or hematopoietic stem cell transplantation (HSCT).
in vitro priming of PBMCs with CMVpp65 peptide-conjugated spheres, used as a control for our study, also results in significantly enhanced T cell proliferation (7-fold increase, Supplementary Figure S4) and IFN-γ secretion (>100-fold increase, Figure 4A). Hence, our approach may be appliable for the generation of VST against CMV, with stronger capacity to elicit both activation and subsequent differentiation. The ex vivo priming and re-infusion of autologous VST does not complicate the immunological conditions of a transplant patient. Unlike third-party T cells, the recipient’s autologous VST cells would not be targets of rejection, ensuring their longevity after transfusion and persistence of anti-viral immunity. Secondly, autologous VST cannot be effectors of graft vs host disease, increasing their safety profile.
Moreover, it is conceivable that in tumors with malignancies carrying well-identified immunogenic epitopes, the peptide antigen coated beads could provide an excellent tool for increasing the immunogenicity of tumor antigens. The method that we have developed, along with other optimizing approaches, such as better peptide design and delivery adjuvants, should facilitate the development of peptide-based vaccines as viable cancer therapeutics (43).
Despite the encouraging potential of antigen-specific T cells for both antiviral and anti-tumor therapies, developing long-term expansion protocols while consistently preserving antigen specificity, continues to be a challenge. Numerous studies have sought to tackle these challenges through various methods, including the complementary use of anti-CD3/autologous feeder cells (44). The implementation of antigen scaffolds constructed on a streptavidin-conjugated dextran backbone with both HLA-restricted peptides and biotinylated CD86 attached (45), or the utilization of recombinant molecules such as T-CEP (46) may be other promising approaches.
Furthermore, single-epitope vaccines may be more susceptible to immunological evasion (47), as mutations or substitutions of this epitope have been observed in the SARS-CoV-2 genome. For this reason, the combination of several well-characterized immunodominant epitopes for initial priming, may be advantageous for generating multiple distinct antigen-specific cytotoxic T cell populations. In the realm of CMV T-cell therapy, the use of pp65 and IE-1 peptides for inducing CMV-specific cytotoxic T cells has yielded favorable outcomes (48, 49).
4.3 Limitations of the study
Our study has several limitations that should be considered: 1) Sample size was relatively small due to the limited volume of leftover clinical blood samples (typically 2–4 milliliters),available phenotypic and functional analysis. 2) Sphere efficiency and priming could be eventually optimized by using spheres with magnetic properties which facilitate their retrieval after T cell expansion.3) Biodegradable artificial antigen-presenting cells, such as hyaluronic acid (HA) hydrogen-based platforms, have shown effectiveness in activating tissue-residual memory CD8+ T cells ex vivo for in vivo delivery (50) and may be advantageous also in context of our aims. 4) The small sample size in our study indicates the need for validation in a larger, more diverse cohort.
Data availability statement
Due to ethical/privacy/consent restrictions, raw data will be made available by the corresponding author only upon request.
Ethics statement
The studies involving humans were approved by Protocol AAAT3602 from Institutional Review Board of Columbia University Irving Medical Center. The studies were conducted in accordance with the local legislation and institutional requirements. The human samples used in this study were acquired from primarily isolated as part of our previous study for which ethical approval was obtained. Written informed consent for participation was not required from the participants or the participants’ legal guardians/next of kin in accordance with the national legislation and institutional requirements.
Author contributions
C-CC: Conceptualization, Data curation, Formal Analysis, Funding acquisition, Investigation, Methodology, Project administration, Resources, Software, Supervision, Validation, Writing – original draft, Writing – review & editing. YL: Methodology, Writing – review & editing. ZX: Methodology, Writing – review & editing. E-RV: Data curation, Formal Analysis, Writing – review & editing. PL: Data curation, Writing – review & editing. EH: Funding acquisition, Writing – review & editing. ML: Conceptualization, Writing – review & editing. SH: Data curation, Writing – review & editing. GB: Data curation, Investigation, Methodology, Writing – review & editing. SM: Data curation, Investigation, Writing – review & editing. GV: Formal Analysis, Funding acquisition, Writing – review & editing. NS-F: Conceptualization, Validation, Writing – review & editing, Investigation.
Funding
The author(s) declare that no financial support was received for the research and/or publication of this article.
Acknowledgments
We are very grateful for NIH Tetramer Core Facility (NIH Contract 75N93020D00005 RRID: SCR_026557) for providing Tetramer HLA-A*02:01_ SARS-CoV-2 S (YLQPRTFLL(269-277)-PE, HLA-A*02:01_CMVpp65(NLYPMVATV(495-503)-PE and a photosensitive biotinylated monomer, HLA-A*02:01 KILGFVFJV. We would like to thank every member of the Immunogenetics laboratory for encouragement and collection of samples and Elaine Silvia for critical reading of the manuscript. The work was supported by intramural research, Department of Pathology and Cell Biology, Columbia University.
Conflict of interest
The authors declare that the research was conducted in the absence of any commercial or financial relationships that could be construed as a potential conflict of interest.
Generative AI statement
The author(s) declare that no Generative AI was used in the creation of this manuscript.
Any alternative text (alt text) provided alongside figures in this article has been generated by Frontiers with the support of artificial intelligence and reasonable efforts have been made to ensure accuracy, including review by the authors wherever possible. If you identify any issues, please contact us.
Publisher’s note
All claims expressed in this article are solely those of the authors and do not necessarily represent those of their affiliated organizations, or those of the publisher, the editors and the reviewers. Any product that may be evaluated in this article, or claim that may be made by its manufacturer, is not guaranteed or endorsed by the publisher.
Supplementary material
The Supplementary Material for this article can be found online at: https://www.frontiersin.org/articles/10.3389/fimmu.2025.1664371/full#supplementary-material
References
1. State NY. COVID-19 breakthrough data (2023). Available online at: https://coronavirus.health.ny.gov/covid-19-breakthrough-data.
2. Wang X, Haeussler K, Spellman A, Phillips LE, Ramiller A, Bausch-Jurken MT, et al. Comparative effectiveness of mRNA-1273 and BNT162b2 COVID-19 vaccines in immunocompromised individuals: a systematic review and meta-analysis using the GRADE framework. Front Immunol. (2023) 14:1204831. doi: 10.3389/fimmu.2023.1204831
3. Bytyci J, Ying Y, and Lee LYW. Immunocompromised individuals are at increased risk of COVID-19 breakthrough infection, hospitalization, and death in the post-vaccination era: A systematic review. Immun Inflammation Dis. (2024) 12:e1259. doi: 10.1002/iid3.1259
4. Koutsakos M, Reynaldi A, Lee WS, Nguyen J, Amarasena T, Taiaroa G, et al. SARS-CoV-2 breakthrough infection induces rapid memory and de novo T cell responses. Immunity. (2023) 56:879–92 e4. doi: 10.1016/j.immuni.2023.02.017
5. Tan AT, Linster M, Tan CW, Le Bert N, Chia WN, Kunasegaran K, et al. Early induction of functional SARS-CoV-2-specific T cells associates with rapid viral clearance and mild disease in COVID-19 patients. Cell Rep. (2021) 34:108728. doi: 10.1016/j.celrep.2021.108728
6. Quinti I, Lougaris V, Milito C, Cinetto F, Pecoraro A, Mezzaroma I, et al. A possible role for B cells in COVID-19? Lesson from patients with agammaglobulinemia. J Allergy Clin Immunol. (2020) 146:211–3 e4. doi: 10.1016/j.jaci.2020.04.013
7. Leen AM, Heslop HE, and Brenner MK. Antiviral T-cell therapy. Immunol Rev. (2014) 258:12–29. doi: 10.1111/imr.12138
8. Kumar D, Chernenko S, Moussa G, Cobos I, Manuel O, Preiksaitis J, et al. Cell-mediated immunity to predict cytomegalovirus disease in high-risk solid organ transplant recipients. Am J Transplant. (2009) 9:1214–22. doi: 10.1111/j.1600-6143.2009.02618.x
9. Tzannou I, Papadopoulou A, Naik S, Leung K, Martinez CA, Ramos CA, et al. Off-the-shelf virus-specific T cells to treat BK virus, human herpesvirus 6, cytomegalovirus, epstein-barr virus, and adenovirus infections after allogeneic hematopoietic stem-cell transplantation. J Clin Oncol. (2017) 35:3547–57. doi: 10.1200/JCO.2017.73.0655
10. Schweitzer L and Muranski P. Virus-specific T cell therapy to treat refractory viral infections in solid organ transplant recipients. Am J Transplant. (2024) 24:1558–66. doi: 10.1016/j.ajt.2024.05.019
11. Parajuli S, Jorgenson M, Meyers RO, Djamali A, and Galipeau J. Role of virus-specific T cell therapy for cytomegalovirus and BK infections in kidney transplant recipients. Kidney360. (2021) 2:905–15. doi: 10.34067/KID.00001572021
12. Grosso D, Wagner JL, O’Connor A, Keck K, Huang Y, Wang ZX, et al. Safety and feasibility of third-party cytotoxic T lymphocytes for high-risk patients with COVID-19. Blood Adv. (2024) 8:4113–24. doi: 10.1182/bloodadvances.2024013344
13. Lee R, Kim N, Kim WB, Im KI, Nho D, Cho SY, et al. Effectiveness and safety of autologous virus-specific T cell therapy for persistent COVID-19 in people with immunocompromise: A clinical trial study. Clin Infect Dis. (2025), ciaf302. doi: 10.1093/cid/ciaf302
14. Habel JR, Nguyen THO, van de Sandt CE, Juno JA, Chaurasia P, Wragg K, et al. Suboptimal SARS-CoV-2-specific CD8(+) T cell response associated with the prominent HLA-A*02:01 phenotype. Proc Natl Acad Sci U S A. (2020) 117:24384–91. doi: 10.1073/pnas.2015486117
15. Rowntree LC, Audsley J, Allen LF, McQuilten HA, Hagen RR, Chaurasia P, et al. SARS-CoV-2-specific CD8(+) T cells from people with long COVID establish and maintain effector phenotype and key TCR signatures over 2 years. Proc Natl Acad Sci U S A. (2024) 121:e2411428121. doi: 10.1073/pnas.2411428121
16. Chaurasia P, Nguyen THO, Rowntree LC, Juno JA, Wheatley AK, Kent SJ, et al. Structural basis of biased T cell receptor recognition of an immunodominant HLA-A2 epitope of the SARS-CoV-2 spike protein. J Biol Chem. (2021) 297:101065. doi: 10.1016/j.jbc.2021.101065
17. Chang CC, Vlad G, Vasilescu ER, Husain SA, Liu YN, Sun WZ, et al. Disparity between levels of anti-RBD IgG and anti-nucleocapsid protein IgG antibodies in COVID-19-recovered patients who received a kidney transplant. Kidney Int. (2021) 100:240–1. doi: 10.1016/j.kint.2021.04.018
18. Chang CC, Vlad G, Vasilescu ER, Li P, Husain SA, Silvia EA, et al. Previous SARS-CoV-2 infection or a third dose of vaccine elicited cross-variant neutralising antibodies in vaccinated solid-organ transplant recipients. Clin Transl Immunol. (2022) 11:e1411. doi: 10.1002/cti2.1411
19. Schulien I, Kemming J, Oberhardt V, Wild K, Seidel LM, Killmer S, et al. Characterization of pre-existing and induced SARS-CoV-2-specific CD8(+) T cells. Nat Med. (2021) 27:78–85. doi: 10.1038/s41591-020-01143-2
20. Toebes M, Rodenko B, Ovaa H, and Schumacher TNM. Generation of peptide MHC class I monomers and multimers through ligand exchange. Curr Protoc Immunol. (2009) chapter 18:18.16.1-18. doi: 10.1002/0471142735.im1816s87
21. Wong P and Pamer EG. Cutting edge: antigen-independent CD8 T cell proliferation. J Immunol. (2001) 166:5864–8. doi: 10.4049/jimmunol.166.10.5864
22. Montes M, Rufer N, Appay V, Reynard S, Pittet MJ, Speiser DE, et al. Optimum in vitro expansion of human antigen-specific CD8 T cells for adoptive transfer therapy. Clin Exp Immunol. (2005) 142:292–302. doi: 10.1111/j.1365-2249.2005.02914.x
23. Nagarajan U, Beaune G, Lam AYW, Gonzalez-Rodriguez D, Winnik FM, and Brochard-Wyart F. Inert-living matter, when cells and beads play together. Commun Physics. (2021) 4:2. doi: 10.1038/s42005-020-00506-y
24. Bayoussef Z, Dixon JE, Stolnik S, and Shakesheff KM. Aggregation promotes cell viability, proliferation, and differentiation in an in vitro model of injection cell therapy. J Tissue Eng Regener Med. (2012) 6:e61–73. doi: 10.1002/term.482
25. Brenner SL and Korn ED. Substoichiometric concentrations of cytochalasin D inhibit actin polymerization. Additional evidence for an F-actin treadmill. J Biol Chem. (1979) 254:9982–5. doi: 10.1016/S0021-9258(19)86660-7
26. McShane AN and Malinova D. The ins and outs of antigen uptake in B cells. Front Immunol. (2022) 13:892169. doi: 10.3389/fimmu.2022.892169
27. Robertson MJ, Deane FM, Robinson PJ, and McCluskey A. Synthesis of Dynole 34-2, Dynole 2–24 and Dyngo 4a for investigating dynamin GTPase. Nat Protoc. (2014) 9:851–70. doi: 10.1038/nprot.2014.046
28. Szewczyk-Roszczenko OK, Roszczenko P, Shmakova A, Finiuk N, Holota S, Lesyk R, et al. The chemical inhibitors of endocytosis: from mechanisms to potential clinical applications. Cells. (2023) 12(18):2312. doi: 10.3390/cells12182312
29. Schoenborn JR and Wilson CB. Regulation of interferon-gamma during innate and adaptive immune responses. Adv Immunol. (2007) 96:41–101. doi: 10.1016/S0065-2776(07)96002-2
30. Wills MR, Carmichael AJ, Mynard K, Jin X, Weekes MP, Plachter B, et al. The human cytotoxic T-lymphocyte (CTL) response to cytomegalovirus is dominated by structural protein pp65: frequency, specificity, and T-cell receptor usage of pp65-specific CTL. J Virol. (1996) 70:7569–79. doi: 10.1128/jvi.70.11.7569-7579.1996
31. Chang CC, Ye BH, Chaganti RS, and Dalla-Favera R. BCL-6, a POZ/zinc-finger protein, is a sequence-specific transcriptional repressor. Proc Natl Acad Sci U S A. (1996) 93:6947–52. doi: 10.1073/pnas.93.14.6947
32. Turner CA Jr., Mack DH, and Davis MM. Blimp-1, a novel zinc finger-containing protein that can drive the maturation of B lymphocytes into immunoglobulin-secreting cells. Cell. (1994) 77:297–306. doi: 10.1016/0092-8674(94)90321-2
33. Crotty S, Johnston RJ, and Schoenberger SP. Effectors and memories: Bcl-6 and Blimp-1 in T and B lymphocyte differentiation. Nat Immunol. (2010) 11:114–20. doi: 10.1038/ni.1837
34. Ichii H, Sakamoto A, Hatano M, Okada S, Toyama H, Taki S, et al. Role for Bcl-6 in the generation and maintenance of memory CD8+ T cells. Nat Immunol. (2002) 3:558–63. doi: 10.1038/ni802
35. Gupta S, Anthony A, and Pernis AB. Stage-specific modulation of IFN-regulatory factor 4 function by Kruppel-type zinc finger proteins. J Immunol. (2001) 166:6104–11. doi: 10.4049/jimmunol.166.10.6104
36. Raczkowski F, Ritter J, Heesch K, Schumacher V, Guralnik A, Hocker L, et al. The transcription factor Interferon Regulatory Factor 4 is required for the generation of protective effector CD8+ T cells. Proc Natl Acad Sci U S A. (2013) 110:15019–24. doi: 10.1073/pnas.1309378110
37. Shin H, Blackburn SD, Intlekofer AM, Kao C, Angelosanto JM, Reiner SL, et al. A role for the transcriptional repressor Blimp-1 in CD8(+) T cell exhaustion during chronic viral infection. Immunity. (2009) 31:309–20. doi: 10.1016/j.immuni/2009.06.09.019
38. Brenchley JM, Karandikar NJ, Betts MR, Ambrozak DR, Hill BJ, Crotty LE, et al. Expression of CD57 defines replicative senescence and antigen-induced apoptotic death of CD8+ T cells. Blood. (2003) 101:2711–20. doi: 10.1182/blood-2002-07-2103
39. Ahmed R, Miners KL, Lahoz-Beneytez J, Jones RE, Roger L, Baboonian C, et al. CD57(+) memory T cells proliferate in vivo. Cell Rep. (2020) 33:108501. doi: 10.1016/j.celrep.2020.108501
40. Chiang SC, Theorell J, Entesarian M, Meeths M, Mastafa M, Al-Herz W, et al. Comparison of primary human cytotoxic T-cell and natural killer cell responses reveal similar molecular requirements for lytic granule exocytosis but differences in cytokine production. Blood. (2013) 121:1345–56. doi: 10.1182/blood-2012-07-442558
41. Kared H, Martelli S, Ng TP, Pender SL, and Larbi A. CD57 in human natural killer cells and T-lymphocytes. Cancer Immunol Immunother. (2016) 65:441–52. doi: 10.1007/s00262-016-1803-z
42. Appay V, Nixon DF, Donahoe SM, Gillespie GM, Dong T, King A, et al. HIV-specific CD8(+) T cells produce antiviral cytokines but are impaired in cytolytic function. J Exp Med. (2000) 192:63–75. doi: 10.1084/jem.192.1.63
43. Shah BA, Holden JA, Lenzo JC, Hadjigol S, and O’Brien-Simpson NM. Multi-disciplinary approaches paving the way for clinically effective peptide vaccines for cancer. NPJ Vaccines. (2025) 10:68. doi: 10.1038/s41541-025-01118-9
44. Li Y and Kurlander RJ. Comparison of anti-CD3 and anti-CD28-coated beads with soluble anti-CD3 for expanding human T cells: differing impact on CD8 T cell phenotype and responsiveness to restimulation. J Transl Med. (2010) 8:104. doi: 10.1186/1479-5876-8-104
45. Tvingsholm SA, Frej MS, Rafa VM, Hansen UK, Ormhoj M, Tyron A, et al. TCR-engaging scaffolds selectively expand antigen-specific T-cells with a favorable phenotype for adoptive cell therapy. J Immunother Cancer. (2023) 11(22):e006847. doi: 10.1136/jitc-2023-006847
46. Matus EI, Sparkes A, and Gariepy J. A soluble activator that favors the ex vivo expansion of CD8+CD27+ T cells. JCI Insight. (2020) 5(22):e141293. doi: 10.1172/jci.insight.141293
47. Dolton G, Rius C, Hasan MS, Wall A, Szomolay B, Behiry E, et al. Emergence of immune escape at dominant SARS-CoV-2 killer T cell epitope. Cell. (2022) 185:2936–51 e19. doi: 10.1016/j.cell.2022.07.002
48. Kampouri E, Ibrahimi SS, Xie H, Wong ER, Hecht JB, Sekhon MK, et al. Cytomegalovirus (CMV) reactivation and CMV-specific cell-mediated immunity after chimeric antigen receptor T-cell therapy. Clin Infect Dis. (2024) 78:1022–32. doi: 10.1093/cid/ciad708
49. Zamora D, Duke ER, Xie H, Edmison BC, Akoto B, Kiener R, et al. Cytomegalovirus-specific T-cell reconstitution following letermovir prophylaxis after hematopoietic cell transplantation. Blood. (2021) 138:34–43. doi: 10.1182/blood.20200009396
Keywords: SARS-CoV-2, COVID-19, T-cell therapy, tetramer, organ transplant, cell-mediated immunity, antigen specific-cytotoxic T cells, immunophenotyping
Citation: Chang C-C, Liu YN, Xu Z, Vasilescu E-R, Li P, Ho EK, Li M, Husain SA, Bhagat G, Mohan S, Vlad G and Suciu-Foca N (2025) Development of potent HLA-A02:01-restricted peptide-based cytotoxic T-cells against SARS-CoV-2 infections in patients awaiting a kidney transplant. Front. Immunol. 16:1664371. doi: 10.3389/fimmu.2025.1664371
Received: 11 July 2025; Accepted: 16 September 2025;
Published: 06 October 2025.
Edited by:
Yanmin Wan, Fudan University, ChinaReviewed by:
Ang Lin, China Pharmaceutical University, ChinaMin Kyung Jung, Institute for Basic Science (IBS), Republic of Korea
Copyright © 2025 Chang, Liu, Xu, Vasilescu, Li, Ho, Li, Husain, Bhagat, Mohan, Vlad and Suciu-Foca. This is an open-access article distributed under the terms of the Creative Commons Attribution License (CC BY). The use, distribution or reproduction in other forums is permitted, provided the original author(s) and the copyright owner(s) are credited and that the original publication in this journal is cited, in accordance with accepted academic practice. No use, distribution or reproduction is permitted which does not comply with these terms.
*Correspondence: Chih-Chao Chang, Y2M1NUBjdW1jLmNvbHVtYmlhLmVkdQ==