 Yuxin Liang1†
 Yuheng Gu2†
 Zilong Zhang3†
 Deyuan Zhong1
 Hongtao Yan1Yuhao Su1Yahui Chen1Fei Wang4Zhengwei Leng1*
 Xiaolun Huang1*
- 1Liver Transplantation Center and HBP Surgery, Sichuan Clinical Research Center for Cancer, Sichuan Cancer Hospital & Institute, Sichuan Cancer Center, School of Medicine, University of Electronic Science and Technology of China, Chengdu, China
- 2Clinical Medical College, Southwest Medical University, Luzhou, China
- 3Hepatic Surgery Center, Clinical Medical Research Center of Hepatic Surgery at Hubei Province, Hubei Key Laboratory of Hepato-Pancreatic-Biliary Diseases, Tongji Hospital, Tongji Medical College, Huazhong University of Science and Technology, Wuhan, Hubei, China
- 4Center for Natural Products Research, Chengdu Institute of Biology, Chinese Academy of Sciences, Chengdu, China
Background: Pancreatic cancer (PC) is characterized by a profoundly immunosuppressive tumor microenvironment and poor prognosis. Dendritic cells (DCs) are pivotal for antigen presentation and T-cell activation, yet their prognostic and mechanistic roles in PC remain incompletely defined.
Methods: This study performed weighted gene co-expression network analysis (WGCNA) on transcriptomic data from The Cancer Genome Atlas (TCGA) and two Gene Expression Omnibus cohorts (GSE62165, GSE85916) to identify DC–related gene modules. Consensus clustering based on these modules stratified patients into two immune phenotypes. A four-gene DC–related risk score (DCRS) was constructed using LASSO-Cox regression and validated in independent cohorts. Single-cell RNA sequencing data from 25 PC samples (GSE242230) were analyzed through cell clustering analysis, cell-cell communication analysis, and pathway-specific analysis. Functional assays following KCTD14 knockdown in CAPAN-1 and PANC-1 cell lines assessed its impact on proliferation, migration, invasion, and TNF signaling.
Results: WGCNA identified 130 overlapping DC–related genes enriched in immune pathways. Two DC–related patient clusters exhibited distinct overall survival (OS) (P < 0.05). The DCRS robustly stratified patients into high- and low-risk groups in both TCGA training and validation sets. DCRS demonstrated good predictive potential for OS and there is a significant difference in OS between the two groups of patients (P < 0.05). Single-cell analysis revealed KCTD14 enrichment in malignant epithelial cells and predicted its interaction with DCs via the TNF-TNFRSF1A axis. In vitro, KCTD14 knockdown significantly reduced PC cell proliferation, colony formation, migration, and invasion, and downregulated TNF-α and TNFRSF1A expression (P < 0.01).
Conclusion: We identified a novel DC–related gene signature that stratifies PC patients by prognosis and highlights KCTD14 as a novel immunomodulatory oncogene acting through the TNF-TNFR1 axis. Our findings provide a foundation for integrating DCRS into clinical risk assessment and for pursuing KCTD14/TNFR1-targeted therapies to overcome DC-mediated immune suppression in pancreatic cancer.
1 Introduction
Pancreatic cancer (PC) remains among the most aggressive malignancies, with a 5-year survival rate of less than 10% and limited therapeutic options (1–3). Despite advances in surgical techniques and systemic therapies, most patients are diagnosed at an advanced stage when curative treatment is no longer feasible (4). Postoperative recurrence, drug resistance, and persistent low response to treatment are still problems in the treatment of PC (5). Therefore, the development of reliable indicators for early detection and risk stratification represents an urgent unmet clinical need. To date, numerous studies have sought biomarkers for PC, ranging from subcellular organelle dysfunction, tumor-immune interactions and epigenetic alterations (6–8). Nevertheless, clinically validated early diagnostic markers, therapeutic targets, and risk assessment algorithms for PC remain lacking.
The tumor immune microenvironment of PC is characterized by chronic inflammation coupled with profound immunosuppression, which together impede the infiltration and function of antitumor effector cells (9, 10). In particular, dendritic cells (DCs), the professional antigen-presenting cells that bridge innate and adaptive immunity, are notably scarce or functionally impaired in PC (11, 12). DCs normally capture tumor antigens and migrate to lymphoid tissues to prime T and B lymphocytes, driving antitumor immune responses (13). Insufficient DCs numbers or maturation results in poor activation of cancer-specific T cells. Indeed, studies in PC models have shown that tumor-derived TNF-α signaling through TNF receptor 1 (TNFR1) causes apoptosis of DCs, thereby depleting intratumoral DCs and weakening immunity (9, 14). These findings highlight the pivotal role of DCs and the TNF-TNFR1 axis in shaping the anti-tumor immune landscape of PC.
In the present study, we aimed to develop a DC–related gene signature for PC prognosis and to elucidate the molecular crosstalk between tumor cells and DCs. Leveraging bulk transcriptomic datasets from multiple pancreatic ductal adenocarcinoma (PDAC) cohorts, we stratified patients into two immune phenotypes and constructed a DC-related gene signature. We then interrogated single-cell RNA-sequencing data to pinpoint key gene of DC-tumor interactions. Finally, we performed in vitro assays to assess its effect on tumor cell proliferation, migration, invasion, and downstream signaling pathways. Our integrative approach seeks to uncover novel biomarkers for early diagnosis and risk assessment and to identify potential targets for immunomodulatory therapy in PC.
2 Materials and methods
2.1 Data acquisition
Transcriptome profiles and corresponding clinicopathological information for PDAC were collected from The Cancer Genome Atlas (TCGA)-pancreatic adenocarcinoma (PAAD) and two independent Gene Expression Omnibus (GEO) cohorts (GSE62165 and GSE85916). To minimize inter-dataset variability, batch correction was implemented using the “ComBat” function within the sva R package (15, 16).
2.2 DC-related gene and consensus clustering analysis
Immune cell infiltration in TCGA-PAAD, GSE62165, and GSE85916 samples was quantified using the TIME method. Weighted gene co-expression network analysis (WGCNA) was then employed to construct gene modules correlated with DC infiltration across all cohorts. Intersection of module genes via Venn diagrams yielded a PDAC-specific DC–related gene set. Based on these genes, unsupervised consensus clustering of TCGA-PAAD samples based on this gene set was performed with the ConsensusClusterPlus package. Differentially expressed genes (DEGs) between clusters were determined by the limma package, with significance thresholds of adjusted P< 0.05.
2.3 Functional enrichment analysis
To characterize the biological significance of candidate genes, Gene Ontology (GO) and Kyoto Encyclopedia of Genes and Genomes (KEGG) pathway enrichment analyses were conducted. In addition, Gene Set Enrichment Analysis (GSEA) was performed to evaluate pathway–level enrichment (17). All analyses were performed using the clusterProfiler package.
2.4 Identification of the DC-related risk score for HCC
Patients from the TCGA-PAAD dataset were first stratified into two subtypes by consensus clustering. Candidate genes were obtained from the intersection of DEGs between subtypes and those between tumor and adjacent non-tumor samples. The TCGA-PAAD cohort was randomly divided into training and validation sets using the caret package. In the training cohort, prognostic genes were screened by univariate Cox regression and subsequently refined with least absolute shrinkage and selection operator (LASSO) regression using the glmnet package (18). Risk scores were generated as a weighted sum of gene expression values, with Cox coefficients as weights. Patients were dichotomized into high- and low-risk groups according to the median risk score, and the model’s predictive performance was further confirmed in the TCGA validation set.
2.5 Single-cell RNA sequencing analysis
Single-cell RNA sequencing data from 25 PDAC patients were acquired from the GEO database (GSE242230) for comprehensive analysis. The gene expression matrix was processed using the Seurat package, with stringent normalization and filtering criteria applied: a minimum of 200 genes per cell, no more than 20% mitochondrial genes, and at least 5% ribosomal genes (19). Subsequently, nonlinear dimensionality reduction, cell clustering, and visualization were performed to delineate the expression profiles of target genes across various cell types.
2.6 Cell clustering analysis, cell-cell communication analysis, and Pathway-specific analysis
Cell clustering analysis was conducted by t-distributed stochastic neighbor embedding (t-SNE) dimensionality reduction with a resolution parameter of 0.5. Clusters were visualized using the Seurat and ggplot2 packages (20), with custom color palettes applied for enhanced visualization. Cell type annotation was conducted through manual curation based on established marker genes and cluster characteristics. Gene expression visualization was performed using feature plots and dot plots to examine the expression patterns of DC markers including CLEC9A, XCR1, BATF3, CADM1, CD1C, FCER1A, CLEC10A, LILRA4, CLEC4C, and IRF7 across different clusters. Density plots for genes of interest (CD81, KCTD14, GBP1, and MYEOV) were generated using the Nebulosa package to visualize spatial expression patterns. For cell-cell communication analysis, epithelial cells were stratified based on KCTD14 expression status into KCTD14-positive and KCTD14-negative subgroups. Cell-cell communication networks were analyzed using the CellChat package with the human CellChatDB database. A subset of 3,000 randomly selected cells was used for computational efficiency. We computed interaction probabilities (cell threshold = 0; pathway threshold = 1), visualizing networks via circular plots. Pathway-specific analyses (TNF, TGFβ, SPP1, SEMA4, and MIF) included heatmaps, ligand–receptor contributions, and top interacting pairs. Interactions with P < 0.01 were deemed significant. All visualizations and statistical analyses were performed using R software with appropriate packages including Seurat, ggplot2, Nebulosa, CellChat, and ktplots.
2.7 Cell culture and cell transfection
Human pancreatic ductal epithelial cells (H6C7) and pancreatic cancer cell lines (CAPAN-1, PANC-1) were obtained from the Cell Bank of the Chinese Academy of Sciences (Shanghai, China). Cells were cultured in DMEM supplemented with 10% fetal bovine serum (FBS) and 1% penicillin-streptomycin at 37°C with 5% CO2 (21). For KCTD14 knockdown, cells at 60–70% confluence were transfected with small interfering RNAs (siRNAs) targeting KCTD14 (si−KCTD14−1, si−KCTD14−2, si−KCTD14−3) or non−targeting control siRNA using Lipofectamine 3000 (Invitrogen). After 48 hours, cells were harvested for downstream assays.
2.8 Quantitative real−time polymerase chain reaction
Total RNA was extracted with TRIzol reagent (Invitrogen) and reverse−transcribed using the PrimeScript RT kit (Takara). qRT−PCR was conducted with SYBR qPCR Master Mix (Vazyme, China). Primer sequences were as follows:
KCTD14 (Forward): 5′−AGCAAACATGAACAGTAGGTTA−3′,
KCTD14 (reverse): 5′−GGAATGAAGGTAAGCAAAC−3′. Relative gene expression was calculated by the 2^(−ΔΔCt) method with β-actin as internal reference.
2.9 Western blot
Cells were lysed in RIPA buffer supplemented with protease and phosphatase inhibitors (Roche). Protein concentrations were quantified by BCA assay (Pierce). Equal amounts of protein were separated on 10% SDS–PAGE gels and transferred onto PVDF membranes (Millipore). Membranes were blocked in 5% non−fat milk and incubated overnight at 4°C with primary antibodies against KCTD14, TNF−α, TNFRSF1A, TNFRSF1B, and β-actin. After washing, membranes were incubated using HRP−conjugated secondary antibodies and bands were visualized by ECL substrate (Thermo) and quantified by ImageJ (22).
2.10 CCK−8, colony formation, migration and invasion assays
Cell proliferation was assessed with the CCK-8 assay by seeding 3 × 10³ transfected cells per well in 96-well plates, with viability measured at 24, 48, 72, and 96 hours. Colony formation assays were performed by seeding 500 cells per well in six-well plates and allowing growth for 10–14 days before fixation and crystal violet staining. Colonies containing ≥50 cells were counted. Migration and invasion were examined using 8-μm pore Transwell chambers, with invasion assays performed in Matrigel-coated inserts. After incubation (24 h for migration, 48 h for invasion), cells on the lower membrane were fixed, stained, and quantified in five random fields (23, 24).
2.11 Statistical analysis
All statistical analyses were performed with R software version 4.0.1. Data were compared using Student’s t-test or Wilcoxon rank-sum test, as appropriate. Survival analyses were conducted with the Cox proportional hazards model and Kaplan–Meier method, with significance assessed by the log-rank test. Predictive accuracy was evaluated using time-dependent receiver operating characteristic (ROC) curves. For in vitro assays, all experiments were performed in three independent biological replicates, with each assay including three technical replicates unless otherwise specified. P value < 0.05 was considered statistically significant.
3 Results
3.1 Identification of the DC–related gene set in PC
WGCNA was applied to three independent PDAC cohorts to identify modules most closely associated with DC infiltration. In the TCGA cohort, the turquoise module (1746 genes) showed the strongest association with DC infiltration (correlation coefficient = 0.87, P < 1e-200) (Figures 1A, B). Similarly, in GSE62165, the brown module (743 genes) correlated most highly with DC infiltration (correlation coefficient = 0.91, P < 1e-200) (Figures 1C, D). In GSE85916, the green module (1926 genes) showed a moderate but significant association with DC infiltration (correlation coefficient = 0.32, P = 8.2e-5) (Figures 1E, F). Taking the intersection across these three modules, we identified a set of 130 DC–related genes (Figure 1G). GO enrichment analysis of these 130 genes revealed significant enrichment in pathways such as leukocyte chemotaxis, immune response–regulating signaling pathway, and lymphocyte differentiation (Figure 1H). KEGG enrichment analysis further revealed enrichment in pathways such as cytokine-cytokine receptor interaction, chemokine signaling pathway, T cell receptor signaling pathway, and TNF signaling pathway (Figure 1I). Protein–protein interaction (PPI) network construction identified ITGAL, GAS7, and STAB1 as hub nodes with high connectivity (Supplementary Figure S1), suggesting their central roles in DC recruitment and activation.
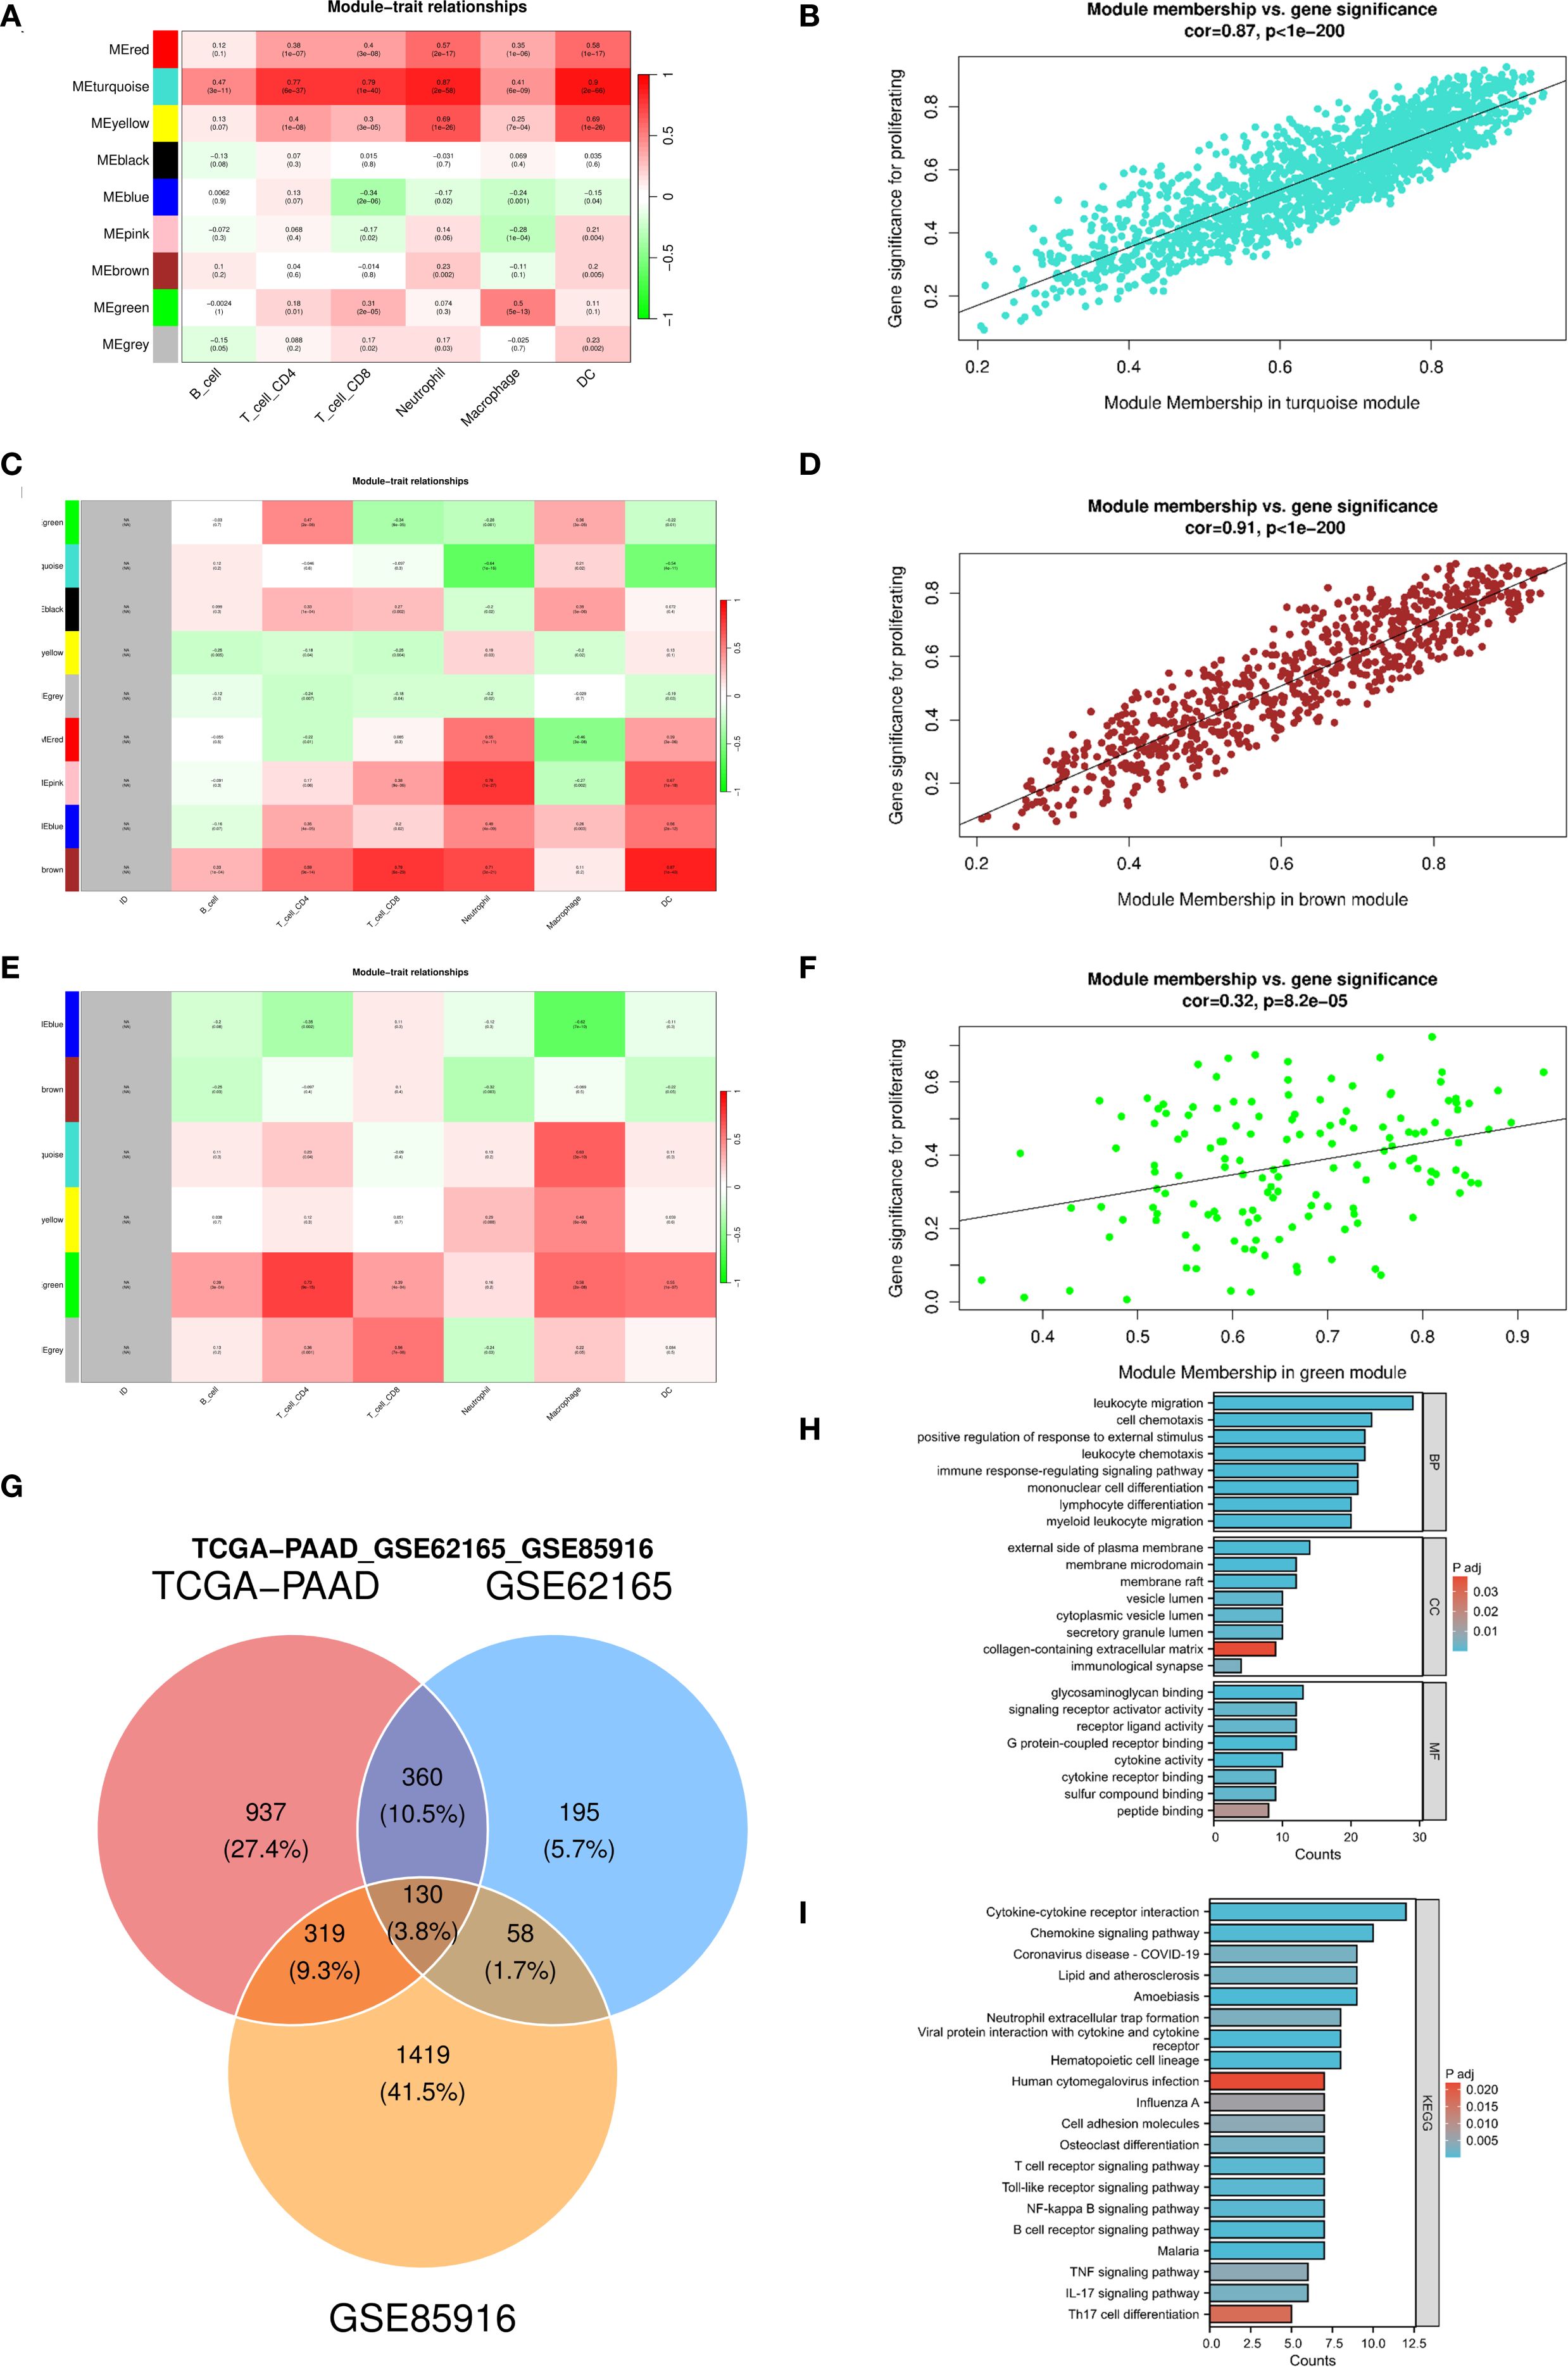
Figure 1. Identify DC-related gene modules and their functional enrichment across three pancreatic cancer cohorts. (A–F) Weighted gene co-expression network analysis identifies gene modules associated with immune cell infiltration and gene modules most strongly correlated with DCs in the TCGA-PAAD (A, B), GSE62165 (C, D), and GSE85916 (E, F) datasets separately; (G) Venn diagram showing the intersection of genes from the three dataset-specific modules to define a core set of DC-related genes; (H, I) GO enrichment analysis and KEGG pathway analysis of DC-related genes. DC, dendritic cell; TCGA, The Cancer Genome Atlas; PAAD, pancreatic adenocarcinoma; GO, Gene Ontology; KEGG, Kyoto Encyclopedia of Genes and Genomes.
3.2 Identification of DC–related molecular clusters
Using unsupervised consensus clustering based on the 130 DC–related genes, we stratified TCGA-PAAD patients into two distinct molecular clusters (Figures 2A, B). Principal component analysis confirmed clear separation between them (Figures 2C, D). The heatmap demonstrated generally higher expression of DC–related genes in cluster 2 compared to cluster 1 (Figure 2E). Survival analysis revealed that patients classified into cluster 1 demonstrated significantly improved overall survival (OS) compared to those in cluster 2 (P = 0.044, Figure 2F). Differential expression analysis between the two clusters identified 1,827 DEGs (adjusted P < 0.05, |log2FC| > 1, Figure 2G). Subsequent GSEA indicated that these DEGs were particularly enriched in immune-associated pathways, such as IL6–JAK–STAT3 signaling, TNF-α signaling via NF-κB, and IL2–STAT5 signaling, underscoring functional divergence in immune regulation between the two clusters (Figure 2H).
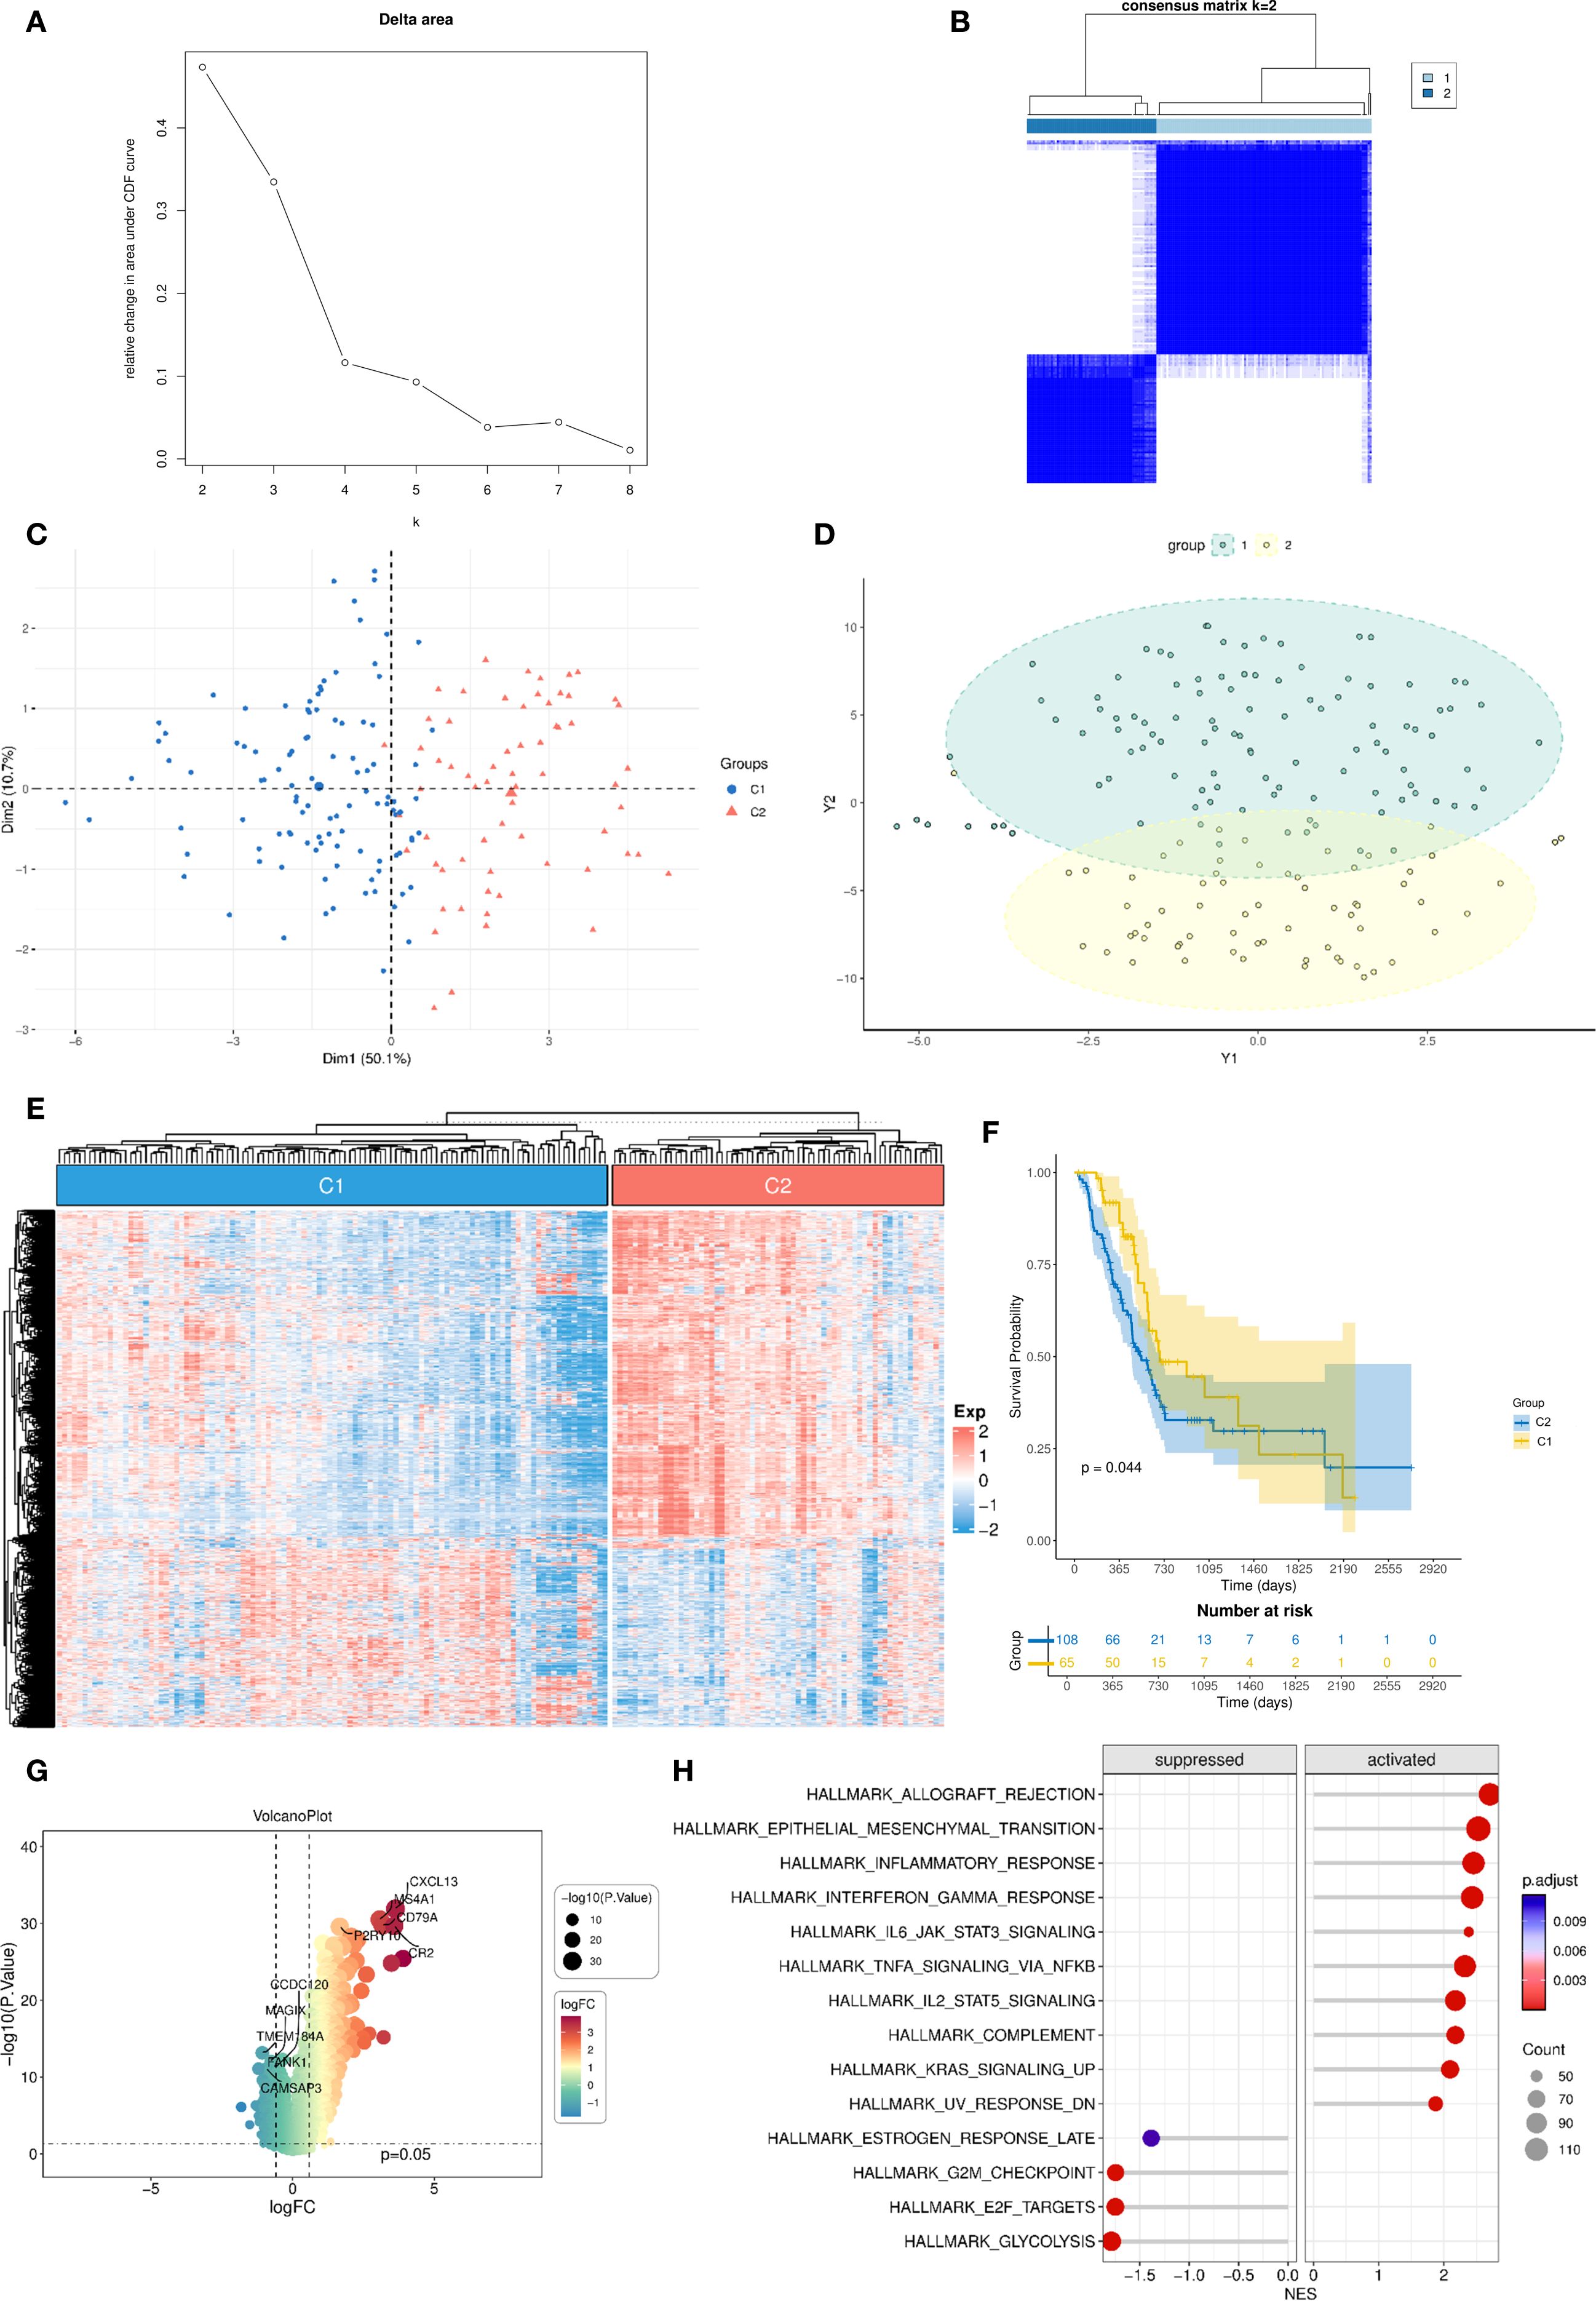
Figure 2. Unsupervised clustering into two DC–related clusters with expression profiling and survival analysis. (A, B) Consensus clustering analysis identifies two DC-related clusters in the TCGA-PAAD dataset; (C, D) PCA demonstrates distinct separation between the two DC-related clusters; (E) Heatmap shows the enrichment levels of DC-related genes in the two clusters; (F) Kaplan-Meier curve of overall survival between the two DC-related clusters. (G) Volcano plot of differentially expressed genes between the two DC-related clusters; (H) GSEA analysis of differentially expressed genes. DC, dendritic cell; TCGA, The Cancer Genome Atlas; PAAD, pancreatic adenocarcinoma; PCA, principal component analysis; GSEA, Gene Set Enrichment Analysis.
3.3 Construction and validation of a DC–related prognostic signature
To construct a prognostic model, we intersected the 1,827 cluster–associated DEGs with the 1,943 DEGs identified between tumor and adjacent normal tissues in TCGA-PAAD, yielding 771 candidate genes (Figure 3A). The TCGA cohort was randomly split into equal training and validation sets. In the training set, univariate Cox regression identified 22 genes significantly associated with OS (P < 0.05, Supplementary Figure S2). These candidates were further narrowed down using LASSO regression and stepwise regression analysis, resulting in a four-gene prognostic signature (Figures 3B, C). The DCRS was calculated using the formula: Risk score = CD81 × -0.806289828 + KCTD14 × 0.739669347 + GBP1 × 0.415429681 + MYEOV × 0.17556951. Using the medium value of the risk score, patients were divided into high- and low-risk groups. In the TCGA training cohort, patients in the low-risk group demonstrated significantly better OS compared to the high-risk group (P = 0.005, Figure 3D). The risk curves also showed higher survival probability in the low-risk group (Figure 3E). Similarly, in the TCGA validation cohort, the low-risk group showed significantly better OS compare to high-risk group (P = 0.006, Figure 3F), with risk curves corroborating superior survival probability in the low-risk group (Figure 3G). Time-dependent ROC curves demonstrated that area under the curve (AUC) values of the DCRS for OS in the TCGA training cohort at 1-, 3-, and 5-year were 0.727, 0.694, and 0.824, respectively (Figure 3H). Despite a slight decrease in the AUC values of the TCGA validation cohort, the results also demonstrated relatively good predictive potential for the short- and long-term OS of PC patients (1-year:0.651; 3-year: 0.684; 5-year:0.671, Figure 3I).
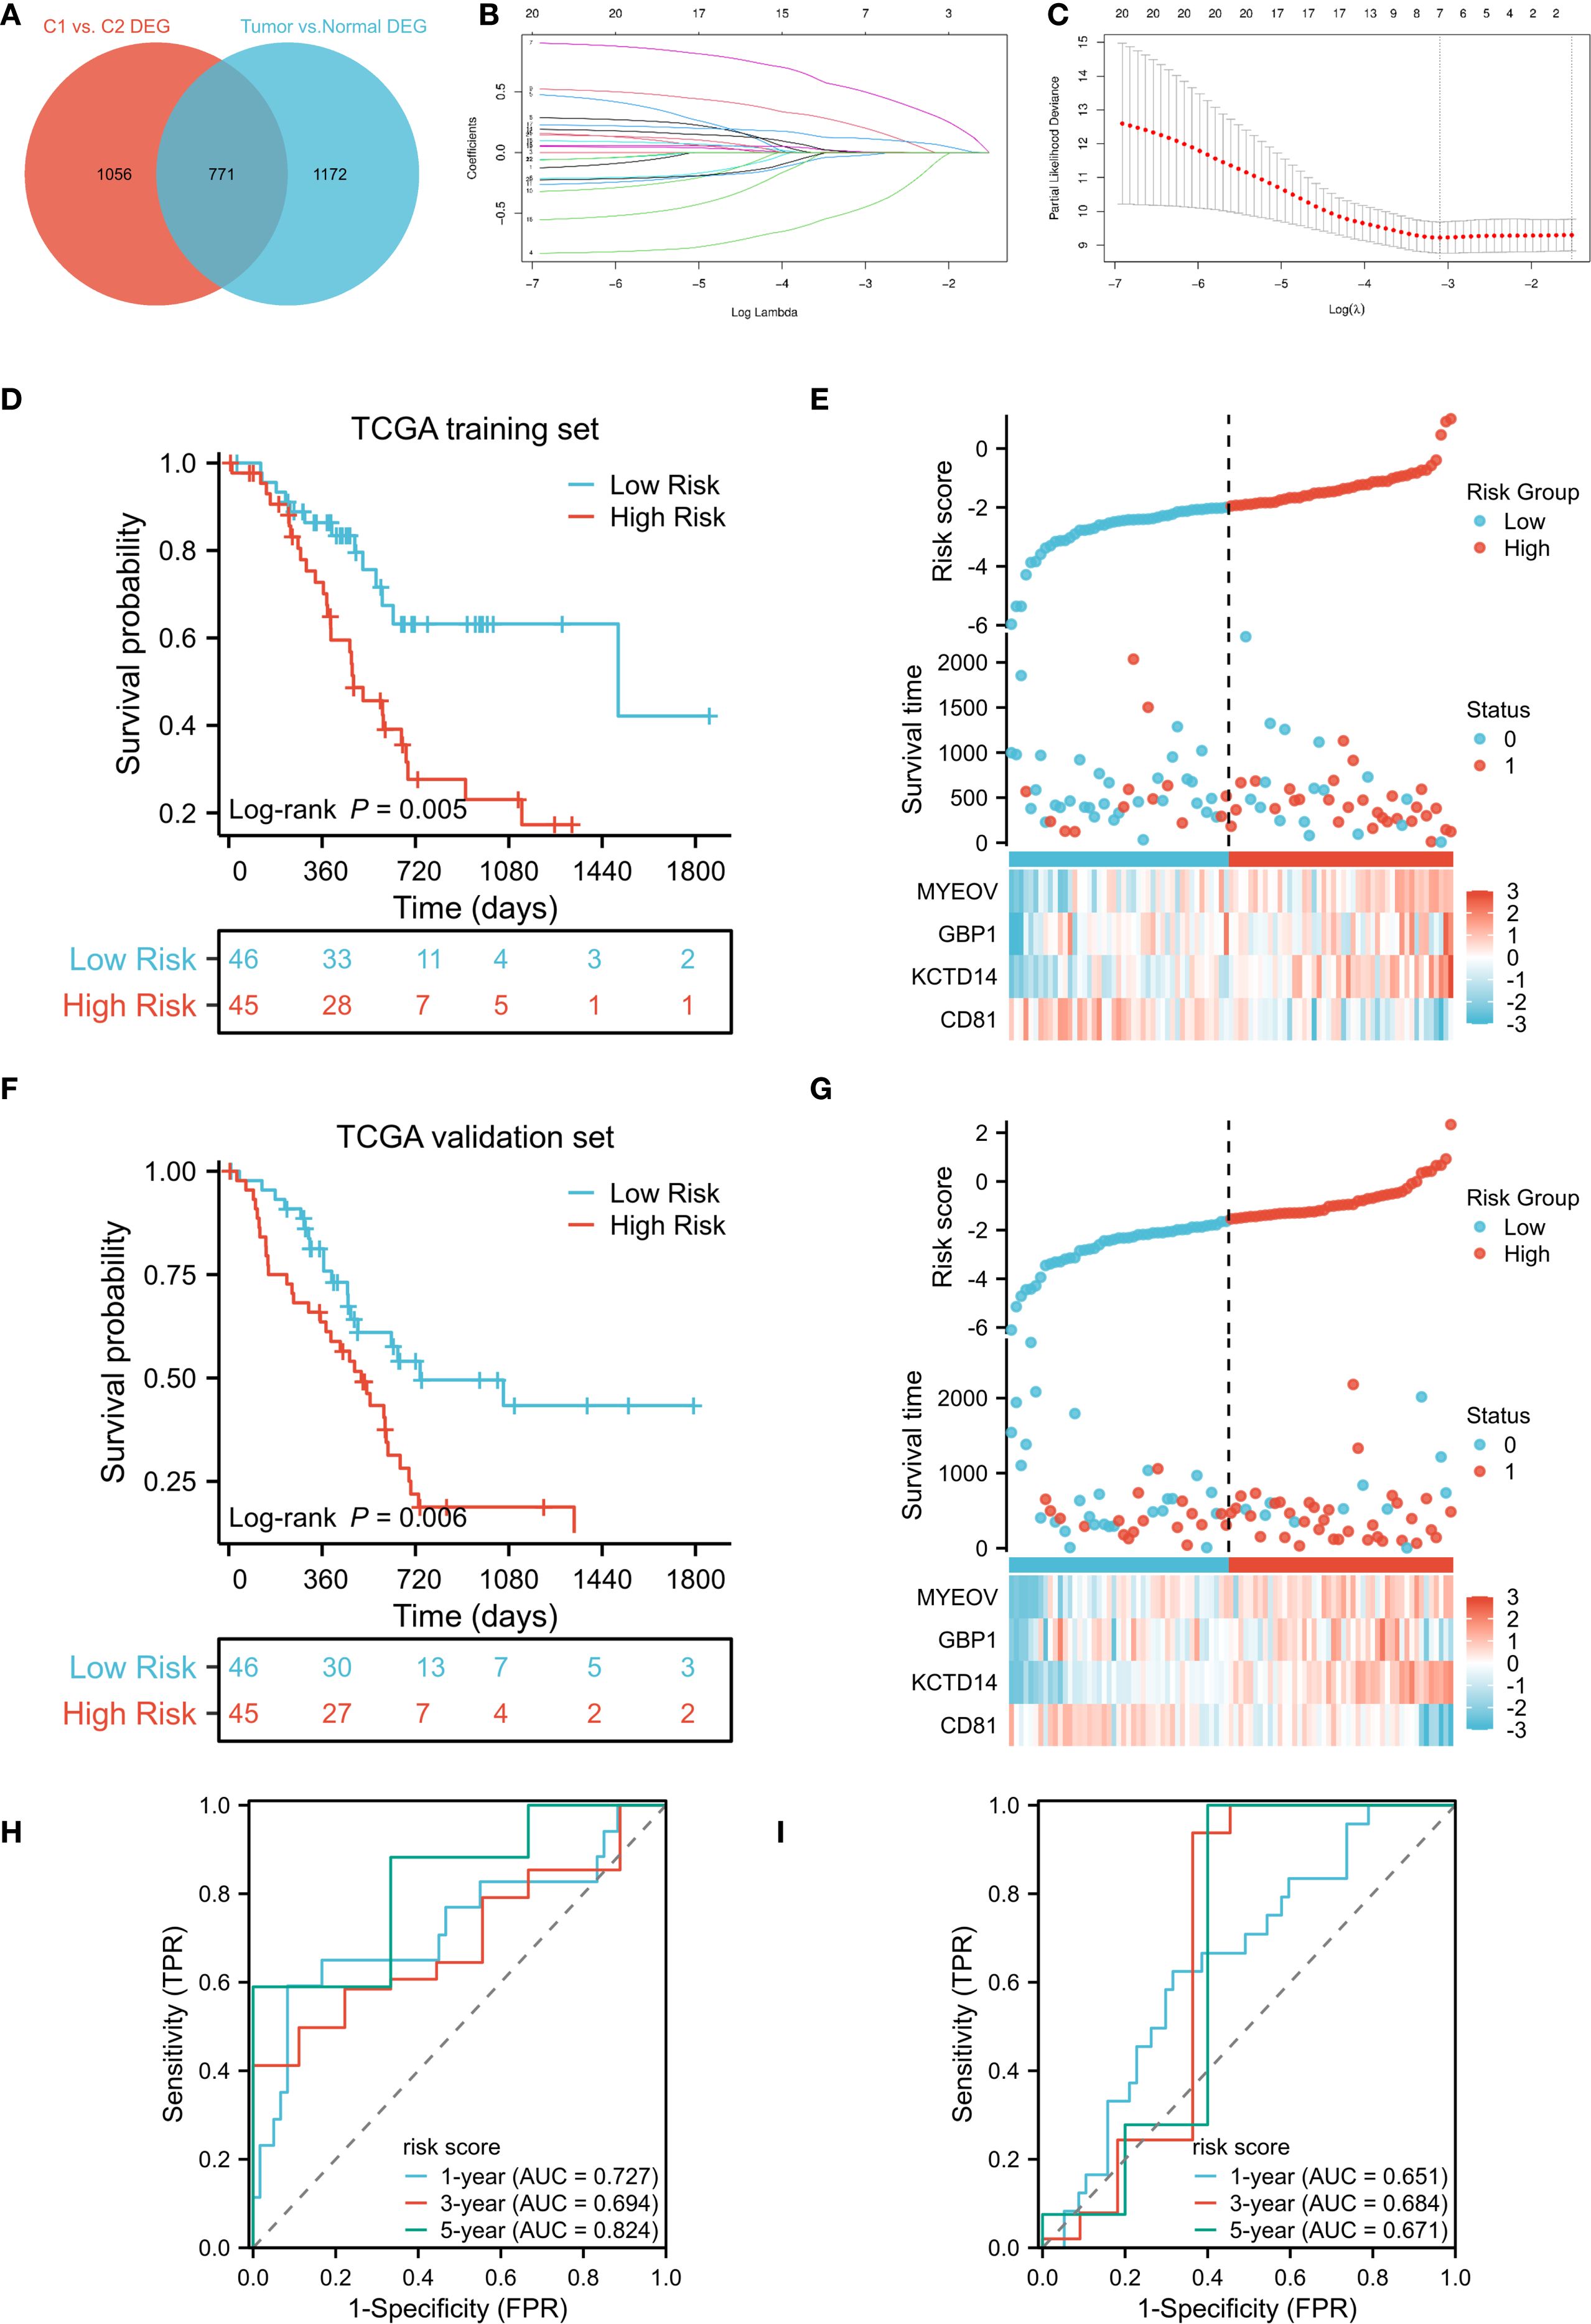
Figure 3. Development and validation of a DC-related gene signature. (A) Venn diagram identifies the intersection of DEGs in DC-related clusters and DEGs between TCGA-PAAD tumor and adjacent non-tumor tissues; (B, C) Construction of the DC-related signature based on LASSO regression; (D, F) Kaplan–Meier curves of OS for DCRS risk groups in the TCGA training and TCGA validation cohort; (E, G) Distribution of risk scores and corresponding survival status in the TCGA training and TCGA validation cohort; (H, I) Time-dependent ROC curves of OS for the risk scores in the TCGA training and TCGA validation cohort. DC, dendritic cell; DEGs, differentially expressed genes; TCGA, The Cancer Genome Atlas; PAAD, pancreatic adenocarcinoma; LASSO, Least Absolute Shrinkage and Selection Operator; OS, overall survival; DCRS, DC related risk score; ROC, receiver operating characteristic.
3.4 Single-cell transcriptomic profiling of DC–related genes
To elucidate cellular sources of the four signature genes, we analyzed single-cell RNA-seq data from PDAC tumors, clustering cells into 23 populations (Supplementary Figure S3). Cell type annotation identified 13 major cell clusters, including acinar cells, B cells, DCs, endothelial cells, erythrocytes, fibroblasts, malignant cells, mast cells, monocytes, NK/T cells, plasma cells, platelets, and stellate cells (Figure 4A). CD81, KCTD14, and MYEOV were predominantly expressed in malignant clusters, whereas GBP1 localized primarily to DC clusters (Figure 4B).
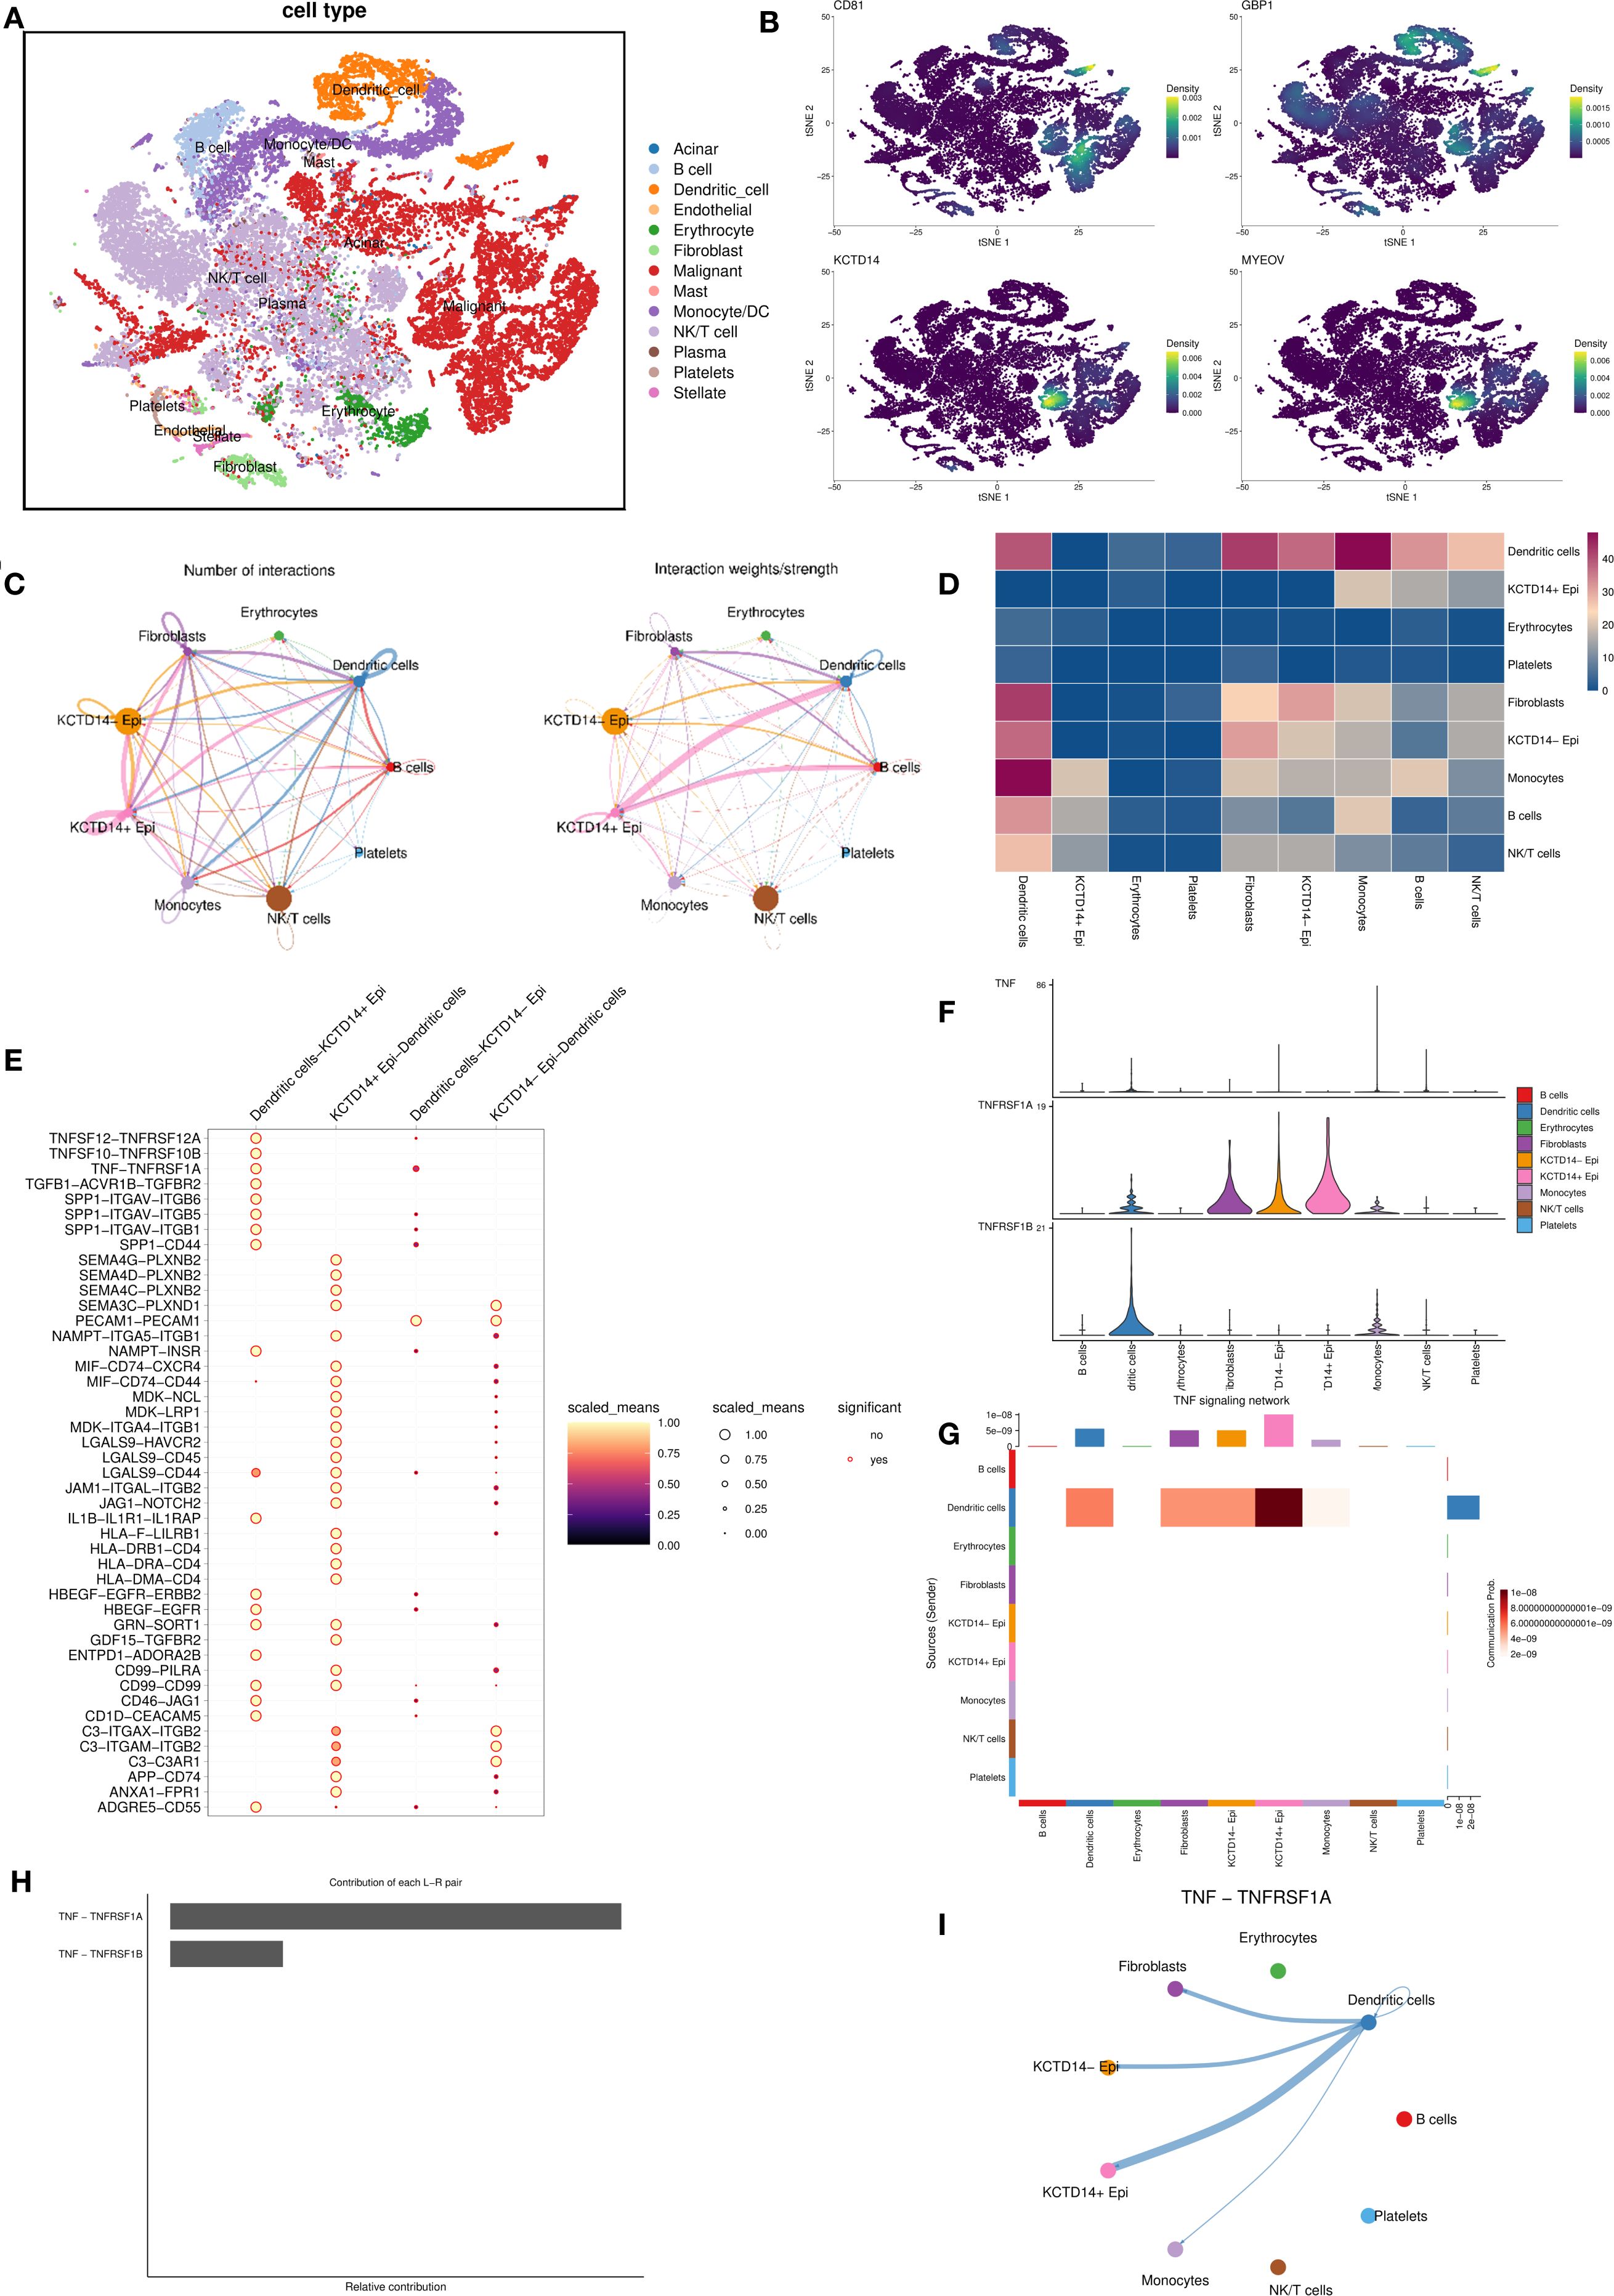
Figure 4. Single−cell transcriptomic profiling of DC-related gene expression and cellular communication. (A) Cell type annotation identifies 13 major cell clusters in the pancreatic cancer tumor microenvironment; (B) The expression of four key genes across the identified cell clusters; (C, D) Cell-cell communication analysis between epithelial cells with different KCDT14 expression status and various immune cell populations; (E–I) Pathway-specific analysis of epithelial cells with different KCDT14 expression status and DCs. DC, dendritic cell.
3.5 Cell–cell communication analysis and pathway-specific analysis of KCDT14
In the risk model, KCTD14 carried the largest positive coefficient, suggesting the strongest prognostic weight. CD81 is a canonical exosomal tetraspanin involved in extracellular vesicles (EV) biogenesis and immune modulation across solid tumors. PDAC EV studies indicate that circulating EV features correlate with survival or treatment response, underscoring a biomarker-oriented role rather than a single-gene driver in tumor–DC crosstalk (25–27). GBP1, a prototypical IFN-induced GTPase, is enriched in myeloid/immune cells and mediates innate immune programs (28, 29). In line with this biology, our single-cell analysis localized GBP1 predominantly to DC clusters rather than malignant epithelial clusters. In contrast, MYEOV already has PDAC-specific mechanistic evidence showing it enhances SOX9 transactivity to elevate HES1 and drive tumor progression (30), which reduces incremental novelty for the present study’s mechanistic focus. Therefore, we centered subsequent analyses on KCTD14 in PDAC. The cell–cell communication analysis revealed significant negative correlations between KCDT14+ epithelial cells and DCs (Figures 4C, D). Pathway-specific analyses showed that the connection between KCDT14+ epithelial cells and DCs is related to a series of signaling pathways, including TNF-TNFRSF1A, SPPA-CD44, and SEMA4G-PLXNB2 (Figure 4E). Given that prior GSEA, GO, and KEGG results consistently highlighted TNF signaling among DC-related gene programs (Figures 1H, I; Figure 2H), we prioritized TNF pathway for in-depth investigation. The results confirmed that the TNF-TNFRSF1A pathway plays a crucial role in the connection between KCDT14+ epithelial cells and DCs (Figures 4F–I).
3.6 In vitro validation of KCTD14 function in PC cell lines
KCTD14 expression and function were validated in H6C7, CAPAN-1, and PANC-1 cell lines. According to the Western Blot and qRT-PCR assays, the expression of KCTD14 was significantly up-regulated in CAPAN-1 and PANC-1 cell lines compared with H6C7 cell line (Figures 5A, B, **P < 0.01, ***P < 0.001). Among three siRNAs, si-KCTD14–3 achieved the highest knockdown efficiency and was therefore chosen for subsequent experiments. In both CAPAN-1 and PANC-1 cell lines, the expression of KCTD14 was significantly reduced after si-KCTD14–3 transfection (Figure 5C, **P < 0.01). Functionally, the cell viability was significantly reduced following KCTD14 knockdown in both cell lines (Figure 5D, **P < 0.01, ***P < 0.001). Clonal formation assays demonstrated significantly fewer colonies in both cell lines after KCTD14 knockdown (Figures 5E, F, **P < 0.01). In Transwell assays, the numbers of migrated and invaded cells significantly decreased in both cell lines following KCTD14 knockdown (Figures 6A, B, **P < 0.01). The Western Blot results confirmed lowered protein levels of TNF-α, TNFRRSF1A, and TNFRRSF1B following KCTD14 knockdown in both cell lines (Figure 6C). Collectively, KCTD14 knockdown significantly reduced PC cell proliferation, colony formation, migration, and invasion, and downregulated TNF pathway–related proteins.
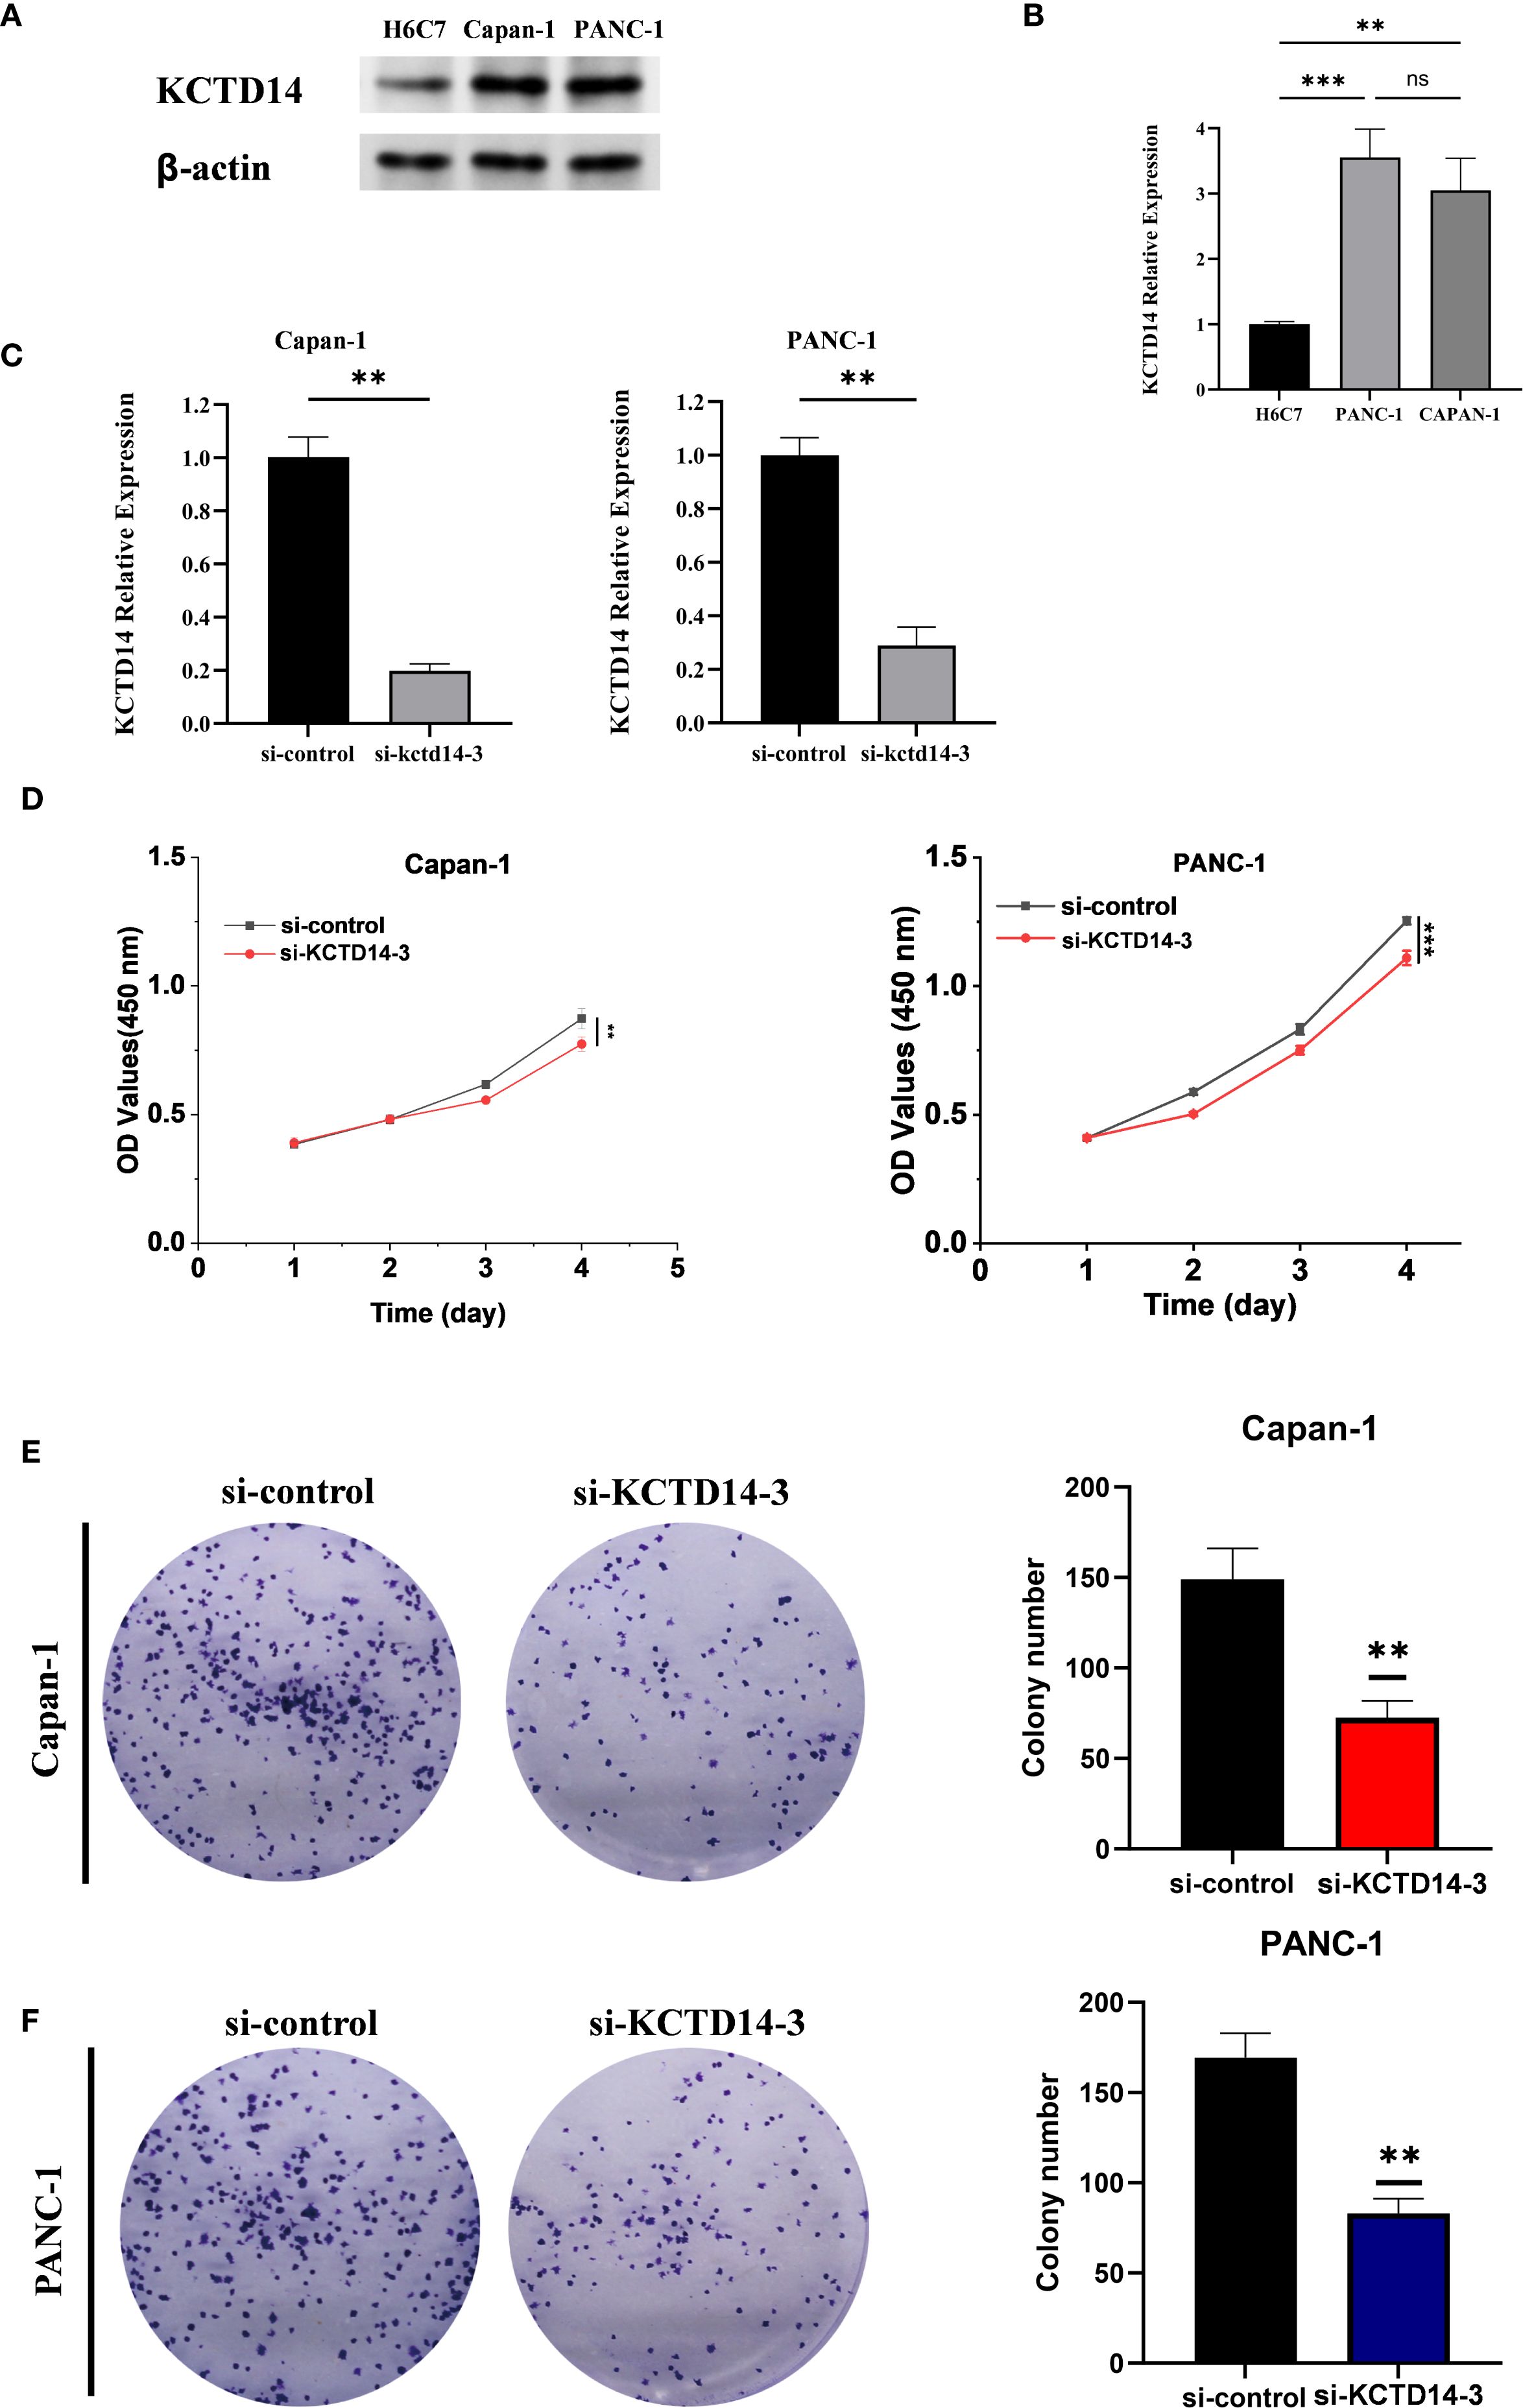
Figure 5. In vitro validation of KCTD14 knockdown effects on proliferation and colony formation in pancreatic cancer cell lines. (A, B) Baseline KCTD14 mRNA and protein levels are significantly higher in CAPAN-1 and PANC-1 cells compared to the H6C7 cell line (**P < 0.01, ***P < 0.001); (C) KCTD14 expression is significantly reduced in both the CAPAN-1 and PANC-1 cell lines after knockdown (**P < 0.01); (D) CCK-8 assays show significantly reduced viability of CAPAN-1 and PANC-1 cells following KCTD14 knockdown (**P < 0.01, ***P < 0.001); (C, D) Colony formation assays demonstrate a significantly decrease in clonogenic capacity after KCTD14 knockdown in CAPAN-1 and PANC-1 cell lines (**P < 0.01).
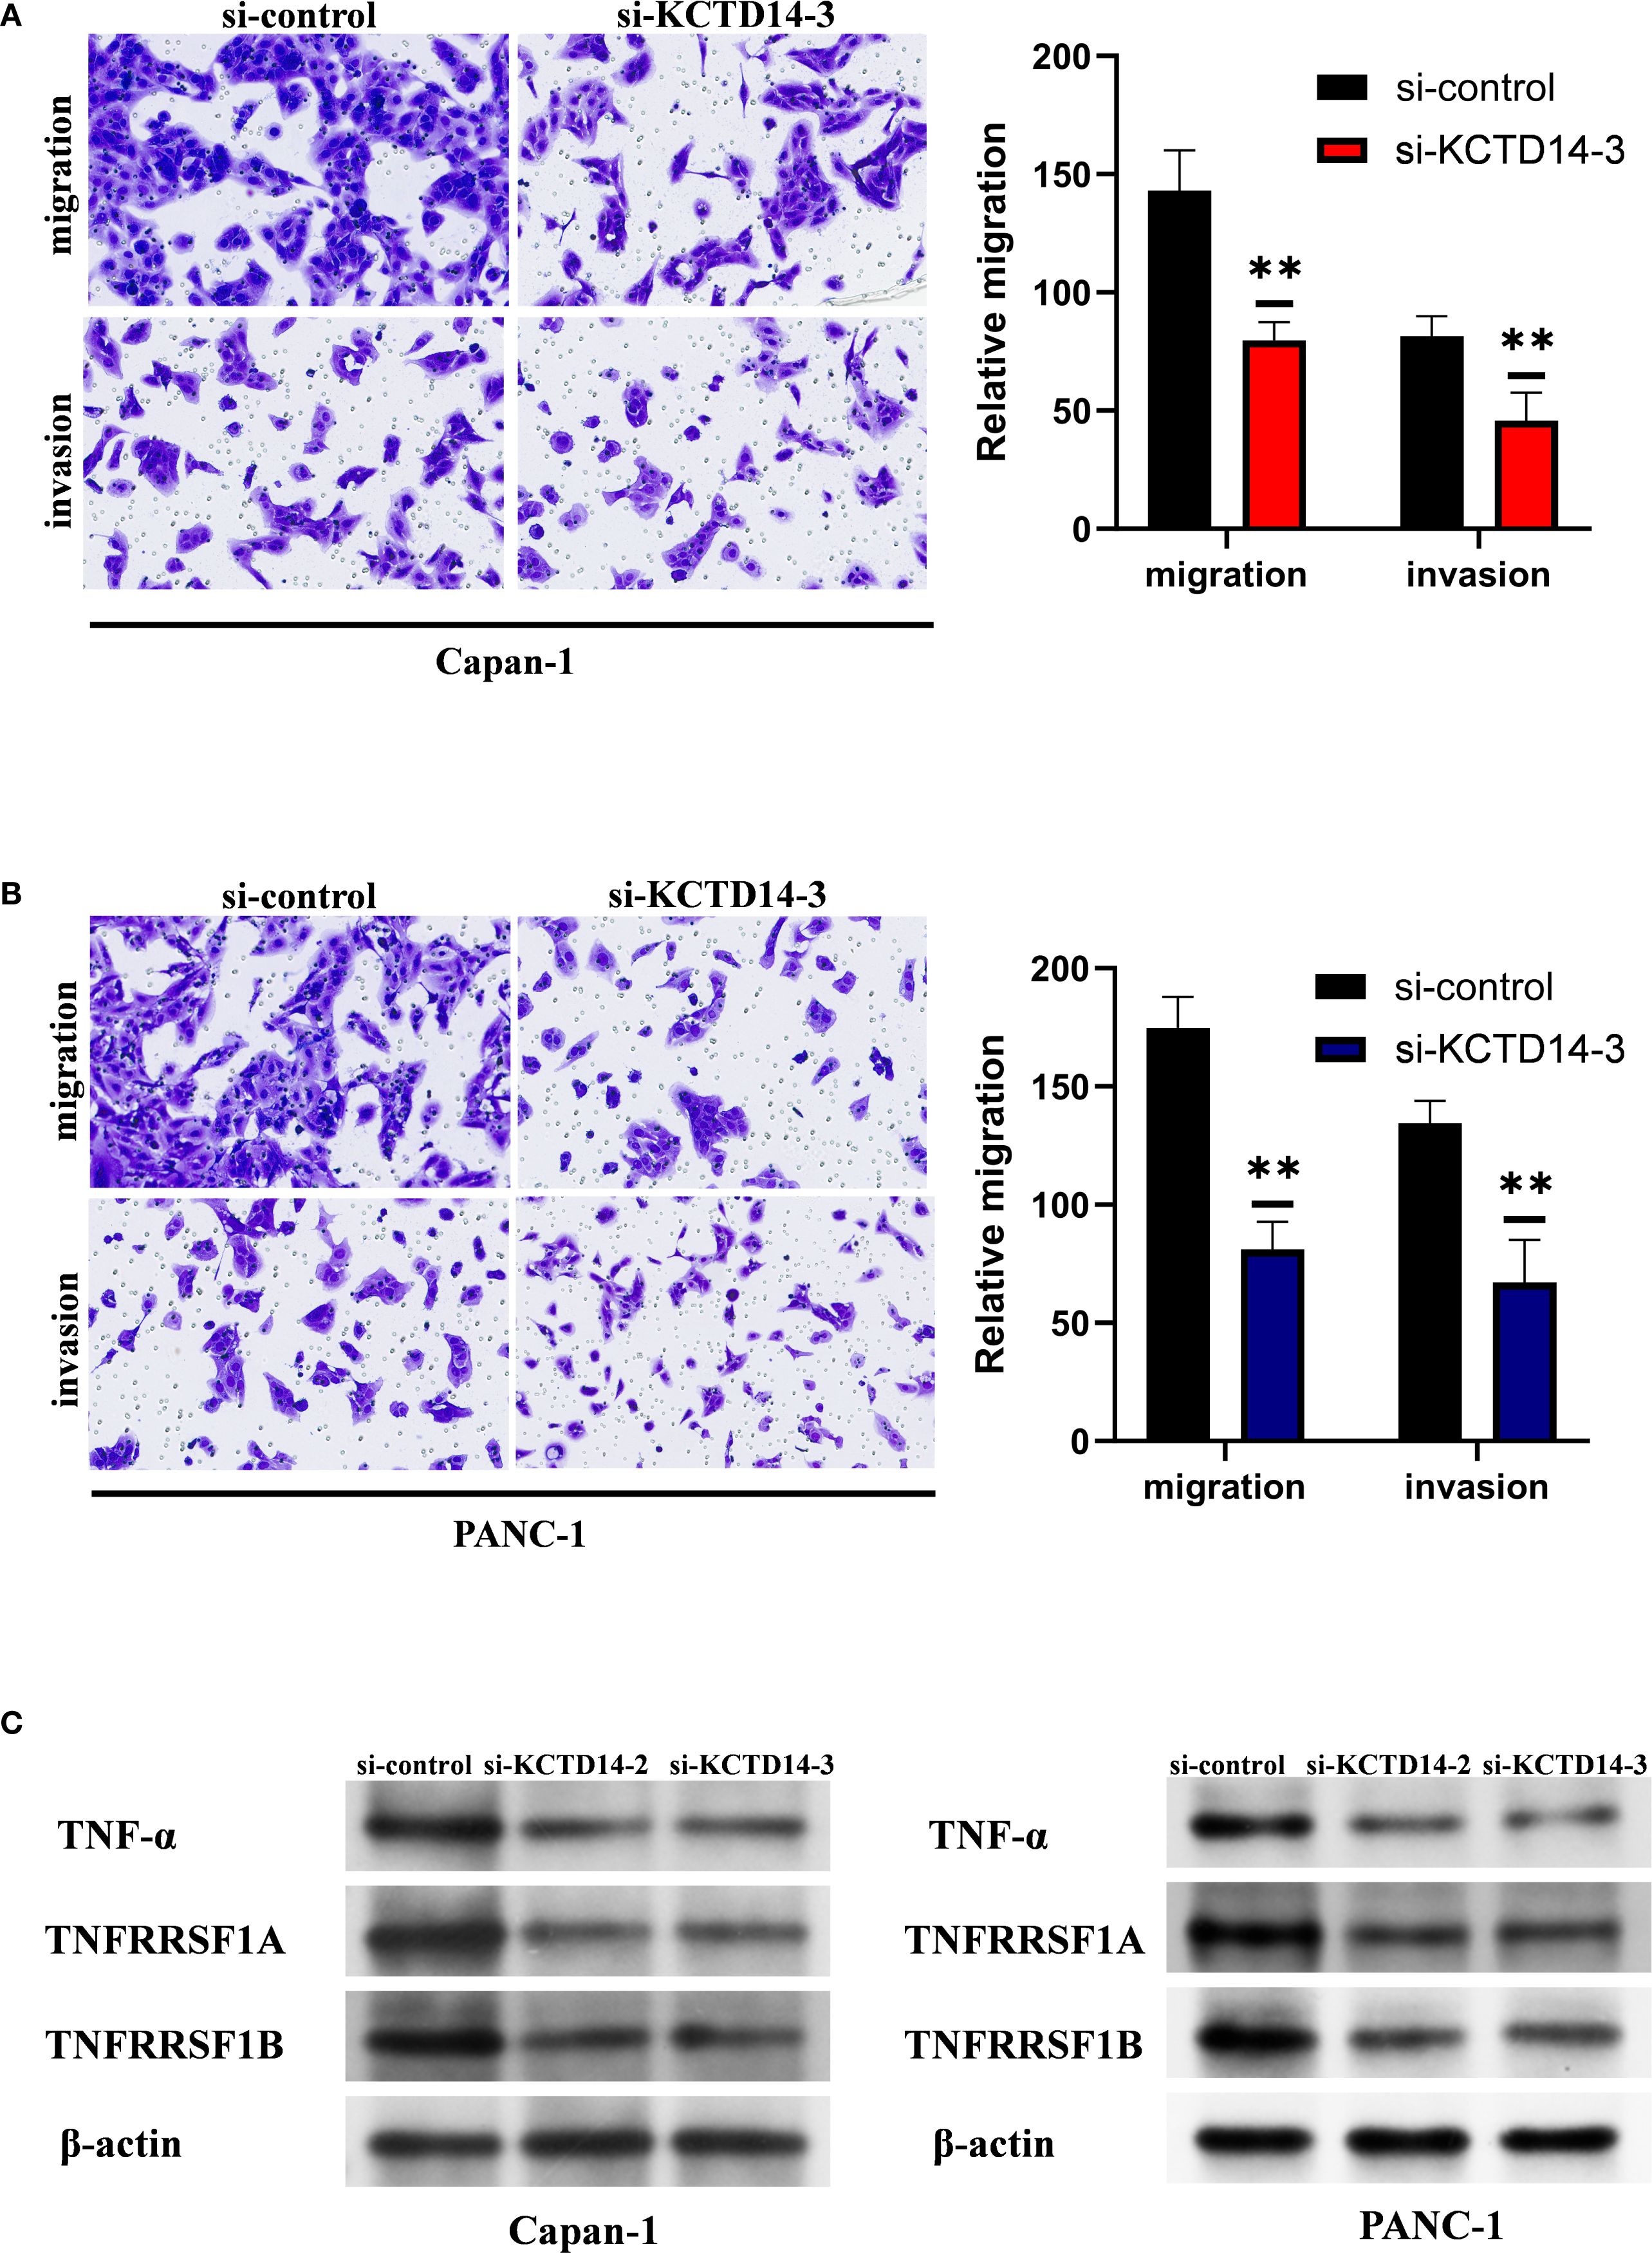
Figure 6. KCTD14 knockdown significantly suppresses migration, invasion, and TNF-TNFR1 signaling in pancreatic cancer cell lines. (A, B) Transwell assays reveal significantly reduced migration and invasion abilities of CAPAN−1 and PANC−1 cells after KCTD14 knockdown (**P < 0.01). (C) Western Blot analysis shows decreased expression of TNF-α, TNFRSF1A, and TNFRSF1B in KCTD14-knockdown cells compared to controls.
4 Discussion
PC remains one of the most lethal malignancies, in part due to its profoundly immunosuppressive tumor microenvironment (TME) and the paucity of reliable prognostic biomarkers (31–33). Here, we leveraged WGCNA across three independent transcriptomic cohorts to uncover a DC-related gene set that captures inter-tumoral heterogeneity in immune infiltration. Consensus clustering based on these 130 DC-related genes robustly stratified patients into two subgroups with distinct OS, underscoring the central role of DCs in shaping PC prognosis.
Building upon these findings, we developed a four-gene DCRS via Cox and LASSO regression analysis. The DCRS demonstrated consistent prognostic power of OS in both training and validation cohorts, with AUC values exceeding 0.65 at 1-, 3-, and 5-year time points. Notably, high DCRS scores correlated with poorer OS, aligning with prior reports of similar signatures in hepatocellular carcinoma and colorectal cancer (34, 35). In addition, previous PDAC signatures have primarily captured T cell–inflamed states, delineated broad molecular subtypes, or linked epigenetic programs to immunity through methylation-based features (6, 7, 36). While these gene signatures are prognostic and valuable for stratification, they are not DC-centric and typically do not converge on a tumor-intrinsic, targetable pathway that explains DC loss. In contrast, our DCRS advances beyond prior PDAC signatures by being derived directly from DC-associated modules, integrating single-cell communication analyses to explore a tumor-intrinsic KCTD14–TNFR1 axis, and aligning with PDAC-specific preclinical evidence on DC depletion and the therapeutic potential of TNFR1 blockade (9). Collectively, this positions DCRS not only as a prognostic biomarker but also as a mechanistically actionable signature.
In the present study, the DCRS also captures a DC–anchored program that influences broader antitumor immunity. First, cDC1–T-cell coupling depends on effective DC recruitment and cross-priming. Across tumor settings, NK cells recruit cDC1 via CCL5/XCL1–XCR1, and disruption of this circuit contributes to immune exclusion (37). In PDAC, the paucity of DCs is a causal determinant of immune failure, whereas restoring DC abundance and function reinstates T-cell priming (12). Moreover, myeloid reprogramming can complement DC recovery. For example, CD40 agonists reprogram macrophages, remodel the stroma, and enhance DC costimulatory capacity (MHC-II, CD80, CD86), thereby facilitating antigen trafficking and T-cell activation (38, 39).
A particularly novel insight from our study is the identification of KCTD14 as a pivotal mediator of DC-tumor crosstalk in PDAC. KCTD14, a member of the potassium channel tetramerization domain family, has been found to be associated with cancer hallmarks and involved in the modulation of specific oncogenic pathways (40–42). Our single-cell RNA-seq analyses revealed enriched KCTD14 expression in malignant epithelial cells and a strong association with the low-immune (poor prognosis) cluster. The cell-cell communication and pathway specific analyses further implicated KCTD14 in signaling to DCs via the TNF–TNFRSF1A (TNFR1) axis. Chronic TNF signaling through TNFR1 can induce DC apoptosis and promote immune escape in PDAC (9). In line with this, targeting TNF+ myeloid programs in PDAC can activate antitumor immunity and expand DC/T-cell activity, further reinforcing the biological plausibility of a TNF-centered axis in this disease (43). Therefore, it is plausible that tumor-derived KCTD14 modulates TNF availability or receptor activation, thereby exacerbating DC depletion. Many KCTDs act as CUL3 E3-ligase adaptors via their BTB domains and can tune NF-κB pathway components. Some KCTDs modulate signaling by scaffolding/ubiquitinating receptors or adaptors (40, 44). We therefore hypothesize KCTD14 may scaffold CUL3-dependent ubiquitination that stabilizes TNF/TNFR1 signaling complexes, or alter receptor internalization/turnover, thereby biasing downstream TNFR1–NF-κB outputs that deplete DCs in PDAC. Functional assays confirmed that KCTD14 knockdown in PDAC cells significantly reduced proliferation, migration, and invasion, and diminished TNF-α/TNFRSF1A expression in vitro, supporting an oncogenic and immunomodulatory role.
Furthermore, our results reinforce the therapeutic relevance of targeting the TNF-TNFR1 pathway in PC. Preclinical evidence has demonstrated that selective TNFR1 inhibition can restore DC viability, augment T-cell priming, and synergize with checkpoint blockade more effectively than broad DC activation strategies (9, 45). The convergence of our KCTD14-TNF findings with these data suggested that combining KCTD14 inhibition or downstream TNFR1 blockade with existing immunotherapies may yield enhanced antitumor efficacy. Moreover, the repurposing of clinically approved TNF inhibitors or the development of TNFR1-specific antagonists could accelerate clinical translation and broaden therapeutic options. In parallel, additional approaches to bolster DC recovery and function merit consideration. Flt3L has been shown to expand cDC populations. When combined with CD40 agonism, Flt3L could promote DC maturation and T-cell priming. Recent translational data support feasibility and activity of Flt3L plus CD40 agonist combinations in PDAC (46). In addition, targeting the CXCL12–CXCR4 axis could overcome stromal and chemokine barriers, thereby enhancing T-cell infiltration and antitumor responses in PDAC, and potentially synergizing with the DC restoration captured by DCRS (47). Collectively, these therapeutic strategies highlight the potential of integrating TNFR1 blockade with DC-directed interventions to overcome immune resistance and improve outcomes in PC.
Despite these promising observations, there are still some limitations in the present study. First, our analysis is retrospective and based on publicly available transcriptomic datasets, where prospective clinical validation is necessary to confirm the utility of the DCRS as a prognostic tool. Second, although single-cell RNA sequencing data were analyzed, the majority of our findings rely on bulk RNA sequencing, which inherently averages signals across heterogeneous tumor samples and may obscure cell type–specific contributions or introduce confounding factors. Third, the mechanistic role of KCTD14, while supported by in vitro experiments, requires in vivo validation to establish causality. Integrating spatial transcriptomics and multiplex immunostaining into future prospective cohorts will enable high-resolution mapping of immune cell infiltration and direct visualization of DC–tumor interactions within the intact tissue microenvironment. Such approaches will be crucial for refining the DCRS, confirming its translational applicability, and informing rational design of combination immunotherapies in PDAC.
5 Conclusion
In summary, our study identified a novel DC-related gene signature that stratifies PC patients by prognosis and highlights KCTD14 as a novel immunomodulatory oncogene acting through the TNF-TNFR1 axis. Our findings provide a foundation for integrating DCRS into clinical risk assessment and for pursuing KCTD14/TNFR1-targeted therapies to overcome DC-mediated immune suppression in pancreatic cancer.
Data availability statement
The datasets analyzed in this study are publicly available from the following repositories: The Cancer Genome Atlas (TCGA), accessible via project ID TCGA-PAAD, and Gene Expression Omnibus (GEO), accession numbers: GSE62165, GSE85916, GSE242230 (single-cell RNA-seq data of PDAC). All data used are open-access and can be freely retrieved using the accession numbers provided above.
Ethics statement
The study was approved by the Research Ethics Committee of Sichuan Cancer Hospital. All procedures were carried out in accordance with the ethical principles of the Declaration of Helsinki.
Author contributions
YL: Conceptualization, Data curation, Validation, Writing – original draft, Writing – review & editing. YG: Conceptualization, Data curation, Validation, Writing – original draft, Writing – review & editing. ZZ: Conceptualization, Data curation, Validation, Writing – original draft, Writing – review & editing. DZ: Validation, Writing – review & editing. HY: Validation, Writing – review & editing. YS: Validation, Writing – review & editing. YC: Validation, Writing – review & editing. FW: Validation, Writing – review & editing. ZL: Conceptualization, Validation, Writing – review & editing. XH: Conceptualization, Validation, Writing – review & editing.
Funding
The author(s) declare financial support was received for the research and/or publication of this article. This study was supported by Research Project of Science and Technology Department of Sichuan Province (2024YFHZ0358), and Noncommunicable Chronic Diseases-National Science and Technology Major Project(2024ZD0525500/2024ZD0525506).
Conflict of interest
The authors declare that the research was conducted in the absence of any commercial or financial relationships that could be construed as a potential conflict of interest.
Generative AI statement
The author(s) declare that no Generative AI was used in the creation of this manuscript.
Any alternative text (alt text) provided alongside figures in this article has been generated by Frontiers with the support of artificial intelligence and reasonable efforts have been made to ensure accuracy, including review by the authors wherever possible. If you identify any issues, please contact us.
Publisher’s note
All claims expressed in this article are solely those of the authors and do not necessarily represent those of their affiliated organizations, or those of the publisher, the editors and the reviewers. Any product that may be evaluated in this article, or claim that may be made by its manufacturer, is not guaranteed or endorsed by the publisher.
Supplementary material
The Supplementary Material for this article can be found online at: https://www.frontiersin.org/articles/10.3389/fimmu.2025.1665906/full#supplementary-material
References
1. Siegel RL, Giaquinto AN, and Jemal A. Cancer statistics, 2024. CA: Cancer J Clin. (2024) 74:12–49. doi: 10.3322/caac.21820
2. Wang S, You L, Dai M, and Zhao Y. Mucins in pancreatic cancer: A well-established but promising family for diagnosis, prognosis and therapy. J Cell Mol Med. (2020) 24:10279–89. doi: 10.1111/jcmm.15684
3. Mizrahi JD, Surana R, Valle JW, and Shroff RT. Pancreatic cancer. Lancet (London England). (2020) 395:2008–20. doi: 10.1016/s0140-6736(20)30974-0
4. Tempero MA. NCCN guidelines updates: pancreatic cancer. J Natl Compr Cancer Network: JNCCN. (2019) 17:603–5. doi: 10.6004/jnccn.2019.5007
5. Wang YZ, An Y, Li BQ, Lu J, and Guo JC. Research progress on circularrnas in pancreatic cancer: emerging but promising. Cancer Biol Ther. (2019) 20:1163–71. doi: 10.1080/15384047.2019.1617563
6. Romero JM, Grünwald B, Jang GH, Bavi PP, Jhaveri A, Masoomian M, et al. A four-chemokine signature is associated with a T-cell-inflamed phenotype in primary and metastatic pancreatic cancer. Clin Cancer research: an Off J Am Assoc Cancer Res. (2020) 26:1997–2010. doi: 10.1158/1078-0432.Ccr-19-2803
7. Xiao M, Liang X, Yan Z, Chen J, Zhu Y, Xie Y, et al. A DNA-methylation-driven genes based prognostic signature reveals immune microenvironment in pancreatic cancer. Front Immunol. (2022) 13:803962. doi: 10.3389/fimmu.2022.803962
8. Zhuo Z, Lin H, Liang J, Ma P, Li J, Huang L, et al. Mitophagy-related gene signature for prediction prognosis, immune scenery, mutation, and chemotherapy response in pancreatic cancer. Front Cell Dev Biol. (2021) 9:802528. doi: 10.3389/fcell.2021.802528
9. Alam MS, Gaida MM, Witzel HR, Otsuka S, Abbasi A, Guerin T, et al. Tnfr1 signaling promotes pancreatic tumor growth by limiting dendritic cell number and function. Cell Rep Med. (2024) 5:101696. doi: 10.1016/j.xcrm.2024.101696
10. Han J and Wang H. Cytokine-overexpressing dendritic cells for cancer immunotherapy. Exp Mol Med. (2024) 56:2559–68. doi: 10.1038/s12276-024-01353-5
11. Hirooka S, Yanagimoto H, Satoi S, Yamamoto T, Toyokawa H, Yamaki S, et al. The role of circulating dendritic cells in patients with unresectable pancreatic cancer. Anticancer Res. (2011) 31:3827–34.
12. Hegde S, Krisnawan VE, Herzog BH, Zuo C, Breden MA, Knolhoff BL, et al. Dendritic cell paucity leads to dysfunctional immune surveillance in pancreatic cancer. Cancer Cell. (2020) 37:289–307.e9. doi: 10.1016/j.ccell.2020.02.008
13. Wculek SK, Cueto FJ, Mujal AM, Melero I, Krummel MF, and Sancho D. Dendritic cells in cancer immunology and immunotherapy. Nat Rev Immunol. (2020) 20:7–24. doi: 10.1038/s41577-019-0210-z
14. Ding X, Yang W, Shi X, Du P, Su L, Qin Z, et al. TNF receptor 1 mediates dendritic cell maturation and CD8 T cell response through two distinct mechanisms. J Immunol (Baltimore Md: 1950). (2011) 187:1184–91. doi: 10.4049/jimmunol.1002902
15. Wang L, Xu Y, Jiang L, and Liu J. The elevated expression of ADGRL4 indicates poor prognosis in gastric cancer. Asian J Surg. (2024). doi: 10.1016/j.asjsur.2024.07.355
16. Wang K, Zhao L, Che T, Zhou C, Qin X, Hong Y, et al. Development and validation of web-based risk score predicting prognostic nomograms for elderly patients with primary colorectal lymphoma: A population-based study. J Trans Internal Med. (2024) 12:569–80. doi: 10.1515/jtim-2023-0133
17. Zhao Y, Chen X, Huang Y, Zhang Z, Wang K, Zou D, et al. Transcriptomic insights into hub genes, immune infiltration, and candidate drugs in erosive esophagitis. J Inflammation Res. (2024) 17:7745–60. doi: 10.2147/jir.S479032
18. Wang X, Zhao Y, Strohmer DF, Yang W, Xia Z, and Yu C. The prognostic value of micrornas associated with fatty acid metabolism in head and neck squamous cell carcinoma. Front Genet. (2022) 13:983672. doi: 10.3389/fgene.2022.983672
19. Yang Z, Chen Y, Miao Y, Yan H, Chen K, Xu Y, et al. Elucidating stearoyl metabolism and ncoa4-mediated ferroptosis in gastric cancer liver metastasis through multi-omics single-cell integrative Mendelian analysis: advancing personalized immunotherapy strategies. Discov Oncol. (2025) 16:46. doi: 10.1007/s12672-025-01769-z
20. Zhang P, Wang L, Liu H, Lin S, and Guo D. Unveiling the crucial role of glycosylation modification in lung adenocarcinoma metastasis through artificial neural network-based spatial multi-omics single-cell analysis and mendelian randomization. BMC Cancer. (2025) 25:249. doi: 10.1186/s12885-025-13650-x
21. Zhai X, Xia Z, Du G, Zhang X, Xia T, Ma D, et al. LRP1B suppresses HCC progression through the NCSTN/PI3K/AKT signaling axis and affects doxorubicin resistance. Genes Dis. (2023) 10:2082–96. doi: 10.1016/j.gendis.2022.10.021
22. Zhai X, Zhang H, Xia Z, Liu M, Du G, Jiang Z, et al. Oxytocin alleviates liver fibrosis via hepatic macrophages. JHEP Rep. (2024) 6:101032. doi: 10.1016/j.jhepr.2024.101032
23. Li Z, Zhou H, Xia Z, Xia T, Du G, Franziska SD, et al. HMGA1 augments palbociclib efficacy via PI3K/mTOR signaling in intrahepatic cholangiocarcinoma. biomark Res. (2023) 11:33. doi: 10.1186/s40364-023-00473-w
24. Jiang L, Jiang Y, Zhou X, Wang L, Zhang S, Jiang C, et al. The key role of coa6 in pancreatic ductal adenocarcinoma: metabolic reprogramming and regulation of the immune microenvironment. J Cell Mol Med. (2025) 29:e70685. doi: 10.1111/jcmm.70685
25. Kurywchak P, Tavormina J, and Kalluri R. The emerging roles of exosomes in the modulation of immune responses in cancer. Genome Med. (2018) 10:23. doi: 10.1186/s13073-018-0535-4
26. Verel-Yilmaz Y, Fernández JP, Schäfer A, Nevermann S, Cook L, Gercke N, et al. Extracellular vesicle-based detection of pancreatic cancer. Front Cell Dev Biol. (2021) 9:697939. doi: 10.3389/fcell.2021.697939
27. Nicoletti A, Negri M, Paratore M, Vitale F, Ainora ME, Nista EC, et al. Diagnostic and prognostic role of extracellular vesicles in pancreatic cancer: current evidence and future perspectives. Int J Mol Sci. (2023) 24:885. doi: 10.3390/ijms24010885
28. Tretina K, Park ES, Maminska A, and MacMicking JD. Interferon-induced guanylate-binding proteins: guardians of host defense in health and disease. J Exp Med. (2019) 216:482–500. doi: 10.1084/jem.20182031
29. Honkala AT, Tailor D, and Malhotra SV. Guanylate-binding protein 1: an emerging target in inflammation and cancer. Front Immunol. (2019) 10:3139. doi: 10.3389/fimmu.2019.03139
30. Liang E, Lu Y, Shi Y, Zhou Q, and Zhi F. MYEOV increases HES1 expression and promotes pancreatic cancer progression by enhancing SOX9 transactivity. Oncogene. (2020) 39:6437–50. doi: 10.1038/s41388-020-01443-4
31. Ge J, Ge J, Tang G, Xiong D, Zhu D, Ding X, et al. Machine learning-based identification of biomarkers and drugs in immunologically cold and hot pancreatic adenocarcinomas. J Trans Med. (2024) 22:775. doi: 10.1186/s12967-024-05590-0
32. Song W, Yu Y, Wang S, Cui Z, Zhu Q, Liu W, et al. Metabolic reprogramming shapes the immune microenvironment in pancreatic adenocarcinoma: prognostic implications and therapeutic targets. Front Immunol. (2025) 16:1555287. doi: 10.3389/fimmu.2025.1555287
33. Mo L, Pan W, Cao W, Wang K, and Huang L. Immune cells and intracerebral hemorrhage: A causal investigation through mendelian randomization. Brain Behav. (2025) 15:e70263. doi: 10.1002/brb3.70263
34. Ouyang Y, Yu M, Liu T, Suo M, Qiao J, Wang L, et al. An activated dendritic-cell-related gene signature indicative of disease prognosis and chemotherapy and immunotherapy response in colon cancer patients. Int J Mol Sci. (2023) 24:15959. doi: 10.3390/ijms242115959
35. Huang H, Peng S, Wei Y, Lan C, Qin W, Liao X, et al. Dendritic cell-related gene signatures in hepatocellular carcinoma: an analysis for prognosis and therapy efficacy evaluation. J hepatocellular carcinoma. (2024) 11:1743–61. doi: 10.2147/jhc.S481338
36. Collisson EA, Sadanandam A, Olson P, Gibb WJ, Truitt M, Gu S, et al. Subtypes of pancreatic ductal adenocarcinoma and their differing responses to therapy. Nat Med. (2011) 17:500–3. doi: 10.1038/nm.2344
37. Böttcher JP, Bonavita E, Chakravarty P, Blees H, Cabeza-Cabrerizo M, Sammicheli S, et al. Nk cells stimulate recruitment of cdc1 into the tumor microenvironment promoting cancer immune control. Cell. (2018) 172:1022–37.e14. doi: 10.1016/j.cell.2018.01.004
38. Beatty GL, Chiorean EG, Fishman MP, Saboury B, Teitelbaum UR, Sun W, et al. CD40 agonists alter tumor stroma and show efficacy against pancreatic carcinoma in mice and humans. Sci (New York NY). (2011) 331:1612–6. doi: 10.1126/science.1198443
39. Ma HS, Poudel B, Torres ER, Sidhom JW, Robinson TM, Christmas B, et al. A CD40 agonist and PD-1 antagonist antibody reprogram the microenvironment of nonimmunogenic tumors to allow T-cell-mediated anticancer activity. Cancer Immunol Res. (2019) 7:428–42. doi: 10.1158/2326-6066.Cir-18-0061
40. Angrisani A, Di Fiore A, De Smaele E, and Moretti M. The emerging role of the kctd proteins in cancer. Cell communication signaling: CCS. (2021) 19:56. doi: 10.1186/s12964-021-00737-8
41. Zhang R and Liu F. Cancer-associated fibroblast-derived gene signatures predict radiotherapeutic survival in prostate cancer patients. J Trans Med. (2022) 20:453. doi: 10.1186/s12967-022-03656-5
42. Wang S, Fu J, and Fang X. A novel DNA methylation-related gene signature for the prediction of overall survival and immune characteristics of ovarian cancer patients. J Ovarian Res. (2023) 16:62. doi: 10.1186/s13048-023-01142-0
43. Dixit A, Sarver A, Zettervall J, Huang H, Zheng K, Brekken RA, et al. Targeting TNF-α-producing macrophages activates antitumor immunity in pancreatic cancer via IL-33 signaling. JCI Insight. (2022) 7:e153242. doi: 10.1172/jci.insight.153242
44. Pinkas DM, Sanvitale CE, Bufton JC, Sorrell FJ, Solcan N, Chalk R, et al. Structural complexity in the KCTD family of cullin3-dependent E3 ubiquitin ligases. Biochem J. (2017) 474:3747–61. doi: 10.1042/bcj20170527
45. Chopra M, Lang I, Salzmann S, Pachel C, Kraus S, Bäuerlein CA, et al. Tumor necrosis factor induces tumor promoting and anti-tumoral effects on pancreatic cancer via tnfr1. PloS One. (2013) 8:e75737. doi: 10.1371/journal.pone.0075737
46. Hogg GD, Weinstein AG, Kingston NL, Liu X, Dres OM, Kang LI, et al. Combined Flt3L and CD40 agonism restores dendritic cell-driven T cell immunity in pancreatic cancer. Sci Immunol. (2025) 10:eadp3978. doi: 10.1126/sciimmunol.adp3978
Keywords: pancreatic ductal adenocarcinoma, dendritic cells, Kctd14, prognosis, signature, TNF signaling
Citation: Liang Y, Gu Y, Zhang Z, Zhong D, Yan H, Su Y, Chen Y, Wang F, Leng Z and Huang X (2025) Dendritic cell–related gene signature in pancreatic cancer stratifies patient subtypes and implicates a KCTD14–TNF signaling axis. Front. Immunol. 16:1665906. doi: 10.3389/fimmu.2025.1665906
Received: 14 July 2025; Accepted: 11 September 2025;
Published: 25 September 2025.
Edited by:
Wei Wang, Nanjing Medical University, ChinaReviewed by:
Lexin Wang, Ningxia Medical University, ChinaWei Pan, Foshan Women and Children Hospital, China
Copyright © 2025 Liang, Gu, Zhang, Zhong, Yan, Su, Chen, Wang, Leng and Huang. This is an open-access article distributed under the terms of the Creative Commons Attribution License (CC BY). The use, distribution or reproduction in other forums is permitted, provided the original author(s) and the copyright owner(s) are credited and that the original publication in this journal is cited, in accordance with accepted academic practice. No use, distribution or reproduction is permitted which does not comply with these terms.
*Correspondence: Xiaolun Huang, aHVhbmd4aWFvbHVuQG1lZC51ZXN0Yy5lZHUuY24=; Zhengwei Leng, bGVuZ3poZW5nd2VpQHNjc3pseXkub3JnLmNu
†These authors have contributed equally to this work