 Xiaojie Yang1†
 Annan Dai1†Yirao Lai1
 Lei Pan1
 Yiwen Deng1Xuemin Shen1
 Xiaozhe Han2
 Lei Sun3
 Yufeng Wang1*Guoyao Tang1,4*
- 1Department of Oral Medicine, Shanghai Ninth People’s Hospital, Shanghai Jiao Tong University School of Medicine & College of Stomatology, Shanghai Jiao Tong University & National Center for Stomatology & National Clinical Research Center for Oral Diseases & Shanghai Key Laboratory of Stomatology & Shanghai Research Institute of Stomatology, Shanghai, China
- 2Department of Oral Science and Translation Research, College of Dental Medicine, Nova Southeastern University, Fort Lauderdale, FL, United States
- 3Institue of Developmental Biology and Molecular Medicine, Fu Dan University, Shanghai, China
- 4Department of Stomatology, Shanghai Xin Hua Hospital, Shanghai Jiao Tong University School of Medicine, Shanghai, China
Background: Oral lichen planus (OLP) and oral lichenoid lesions (OLL) are chronic immune-mediated mucosal disorders with heterogeneous clinical presentations. While T cell-mediated mechanisms have been extensively studied, the role of humoral immunity, particularly B cell activation and plasma cell differentiation, remains insufficiently understood.
Methods: RNA sequencing datasets from healthy oral mucosa and OLP lesions were integrated and analyzed to identify differentially expressed genes. Consensus clustering based on a validated tertiary lymphoid structure (TLS) signature genes (TSGs) was used to define immune subtypes. Associations with clinical severity and recurrence were validated in an independent RNA-seq cohort. Immunohistochemistry analysis of CD20+ B cells and CD38+ plasma cells was conducted in a separate clinical cohort of OLP/OLL patients.
Results: Based on TSGs, two immune subtypes were identified: Subtype A was enriched for CCL3, IL2RA, and IL1R2. Subtype B exhibited elevated expression of humoral activation markers IRF4 and TNFRSF17 and enrichment of B cell-related pathways. Transcriptomic features of Subtype B were significantly associated with erosive and recurrent OLP cases. Immunohistochemistry confirmed that CD20+ B cells were enriched in TLS-like structures (P < 0.001), whereas CD38+ plasma cells were closely linked to erosive phenotypes (P = 0.038).
Conclusions: TLS-associated B cell maturation and plasma cell infiltration define a humoral activation axis linked to unfavorable clinical outcomes in OLP/OLL. The presence of activated B cells and plasma cells correlates with erosive and recurrent disease phenotypes, highlighting their potential as prognostic biomarkers and therapeutic targets for improving disease management.
1 Introduction
Oral lichen planus (OLP) and oral lichenoid lesions (OLL) are chronic immune-mediated mucosal disorders affecting approximately 0.98% of the general population, with a higher prevalence in middle-aged women (1, 2). Clinically, these lesions are categorized into erosive and non-erosive forms; the former is often accompanied by pain or discomfort of varying severity (3). The World Health Organization (WHO) classifies OLP/OLL as oral potentially malignant disorders, with the erosive variants considered to carry a higher risk of malignant transformation (4). Despite the widespread use of topical corticosteroids and immunomodulatory agents as first-line therapies, OLP/OLL remains prone to recurrence and chronic persistence, underscoring the need for more effective and durable immunotherapeutic strategies (5, 6).
OLP/OLL has long been regarded as a T cell-driven disease, supported by evidence of cytotoxic CD8+ T cell infiltration and Th1/Th17 polarization. In addition, analyses of T cell receptor (TCR) variable region genes have suggested that these lesions may be triggered by a limited set of extrinsic antigens, altered self-antigens, or superantigens (6–10). However, antigen-specific T cell subsets have not been consistently identified in either peripheral blood or lesional tissues. This inconsistency challenges the adequacy of a purely T cell-centric model and underscores the need to examine the broader immune microenvironment in mediating disease persistence and immunopathological heterogeneity. Recent evidence increasingly points to a critical contribution of humoral immunity in shaping local immune responses. B cell activation and plasma cell infiltration are frequently observed in OLP lesions, suggesting that B-lineage cells may contribute to disease persistence (11–19). CD20+ B cells have been reported in over 80% of OLP/OLL cases, while CD138+ plasma cells are found in more than 60% (13, 20). Notably, CD38+ plasma cells are consistently present in B cell–dominant lesions but are nearly absent in T cell–dominant counterparts, indicating distinct immune polarization patterns across the disease spectrum (21).
Tertiary lymphoid structures (TLSs) are ectopic lymphoid aggregates that arise in non-lymphoid tissues under conditions of chronic antigenic stimulation. These structures recapitulate the architectural and functional features of secondary lymphoid organs, providing localized niches for B cell maturation, somatic hypermutation, class-switch recombination, antigen presentation, and T cell priming (22–25). While TLSs have been shown to enhance protective immunity in chronic infections and tumors (26, 27), increasing evidence suggests they may also perpetuate aberrant immune activation and contribute to tissue damage in autoimmune and chronic inflammatory diseases (28). In the context of OLP/OLL, TLS-like aggregates have been identified in over 85% of lesions, with their presence correlating with more severe clinical phenotypes (15, 29). Furthermore, B cell infiltration has been associated with responsiveness to corticosteroid therapy, highlighting potential immunological subtypes within OLP/OLL (30). Despite these observations, the immunopathological significance of TLS formation in OLP/OLL remains incompletely defined-particularly regarding its potential to drive local humoral responses, including B cell activation, plasma cell differentiation, and immunoglobulin production. It remains unclear whether TLS-associated humoral activation drives clinical deterioration-including mucosal erosion, chronic recurrence, and poor outcomes.
In this study, we hypothesized that TLS-associated B cell maturation and plasma cell differentiation may play a role in the immunopathogenesis of erosive and recurrent OLP/OLL. To investigate this, we conducted immune subtyping using a validated TLS signature genes (TSGs) across integrated bulk RNA-seq datasets. We then examined subtype-specific humoral activation markers in relation to clinical phenotypes. Finally, we validated our transcriptomic findings in an independent clinical cohort using immunohistochemical analysis of CD20+ B cells and CD38+ plasma cells. This integrative approach highlights the association of TLS-associated humoral responses to disease severity and recurrence, and proposes B and plasma cells as potential biomarkers for risk stratification and therapeutic targeting in OLP/OLL.
2 Materials and methods
2.1 Patients and sample collection
This study was approved by the Ethics Committee of Shanghai Ninth People’s Hospital, Shanghai Jiao Tong University School of Medicine (Approval ID: SH9H-2021-T100-2). All participants provided written informed consent in accordance with the Declaration of Helsinki (version 2002). From January 2017 to December 2018, oral mucosal tissue samples were collected from patients diagnosed with oral lichen planus (OLP) or oral lichenoid lesions (OLL) and from healthy volunteers undergoing orthognathic surgery. Diagnoses were established based on clinical and histopathological criteria as previously described (1, 31–34). OLL cases were strictly defined as lesions with atypical clinicopathologic features after excluding known triggers, including drug-induced, contact-induced, and GVHD-associated lesions (35). Inclusion and exclusion criteria followed our previously reported standards (30). The workflow is presented in Figure 1.
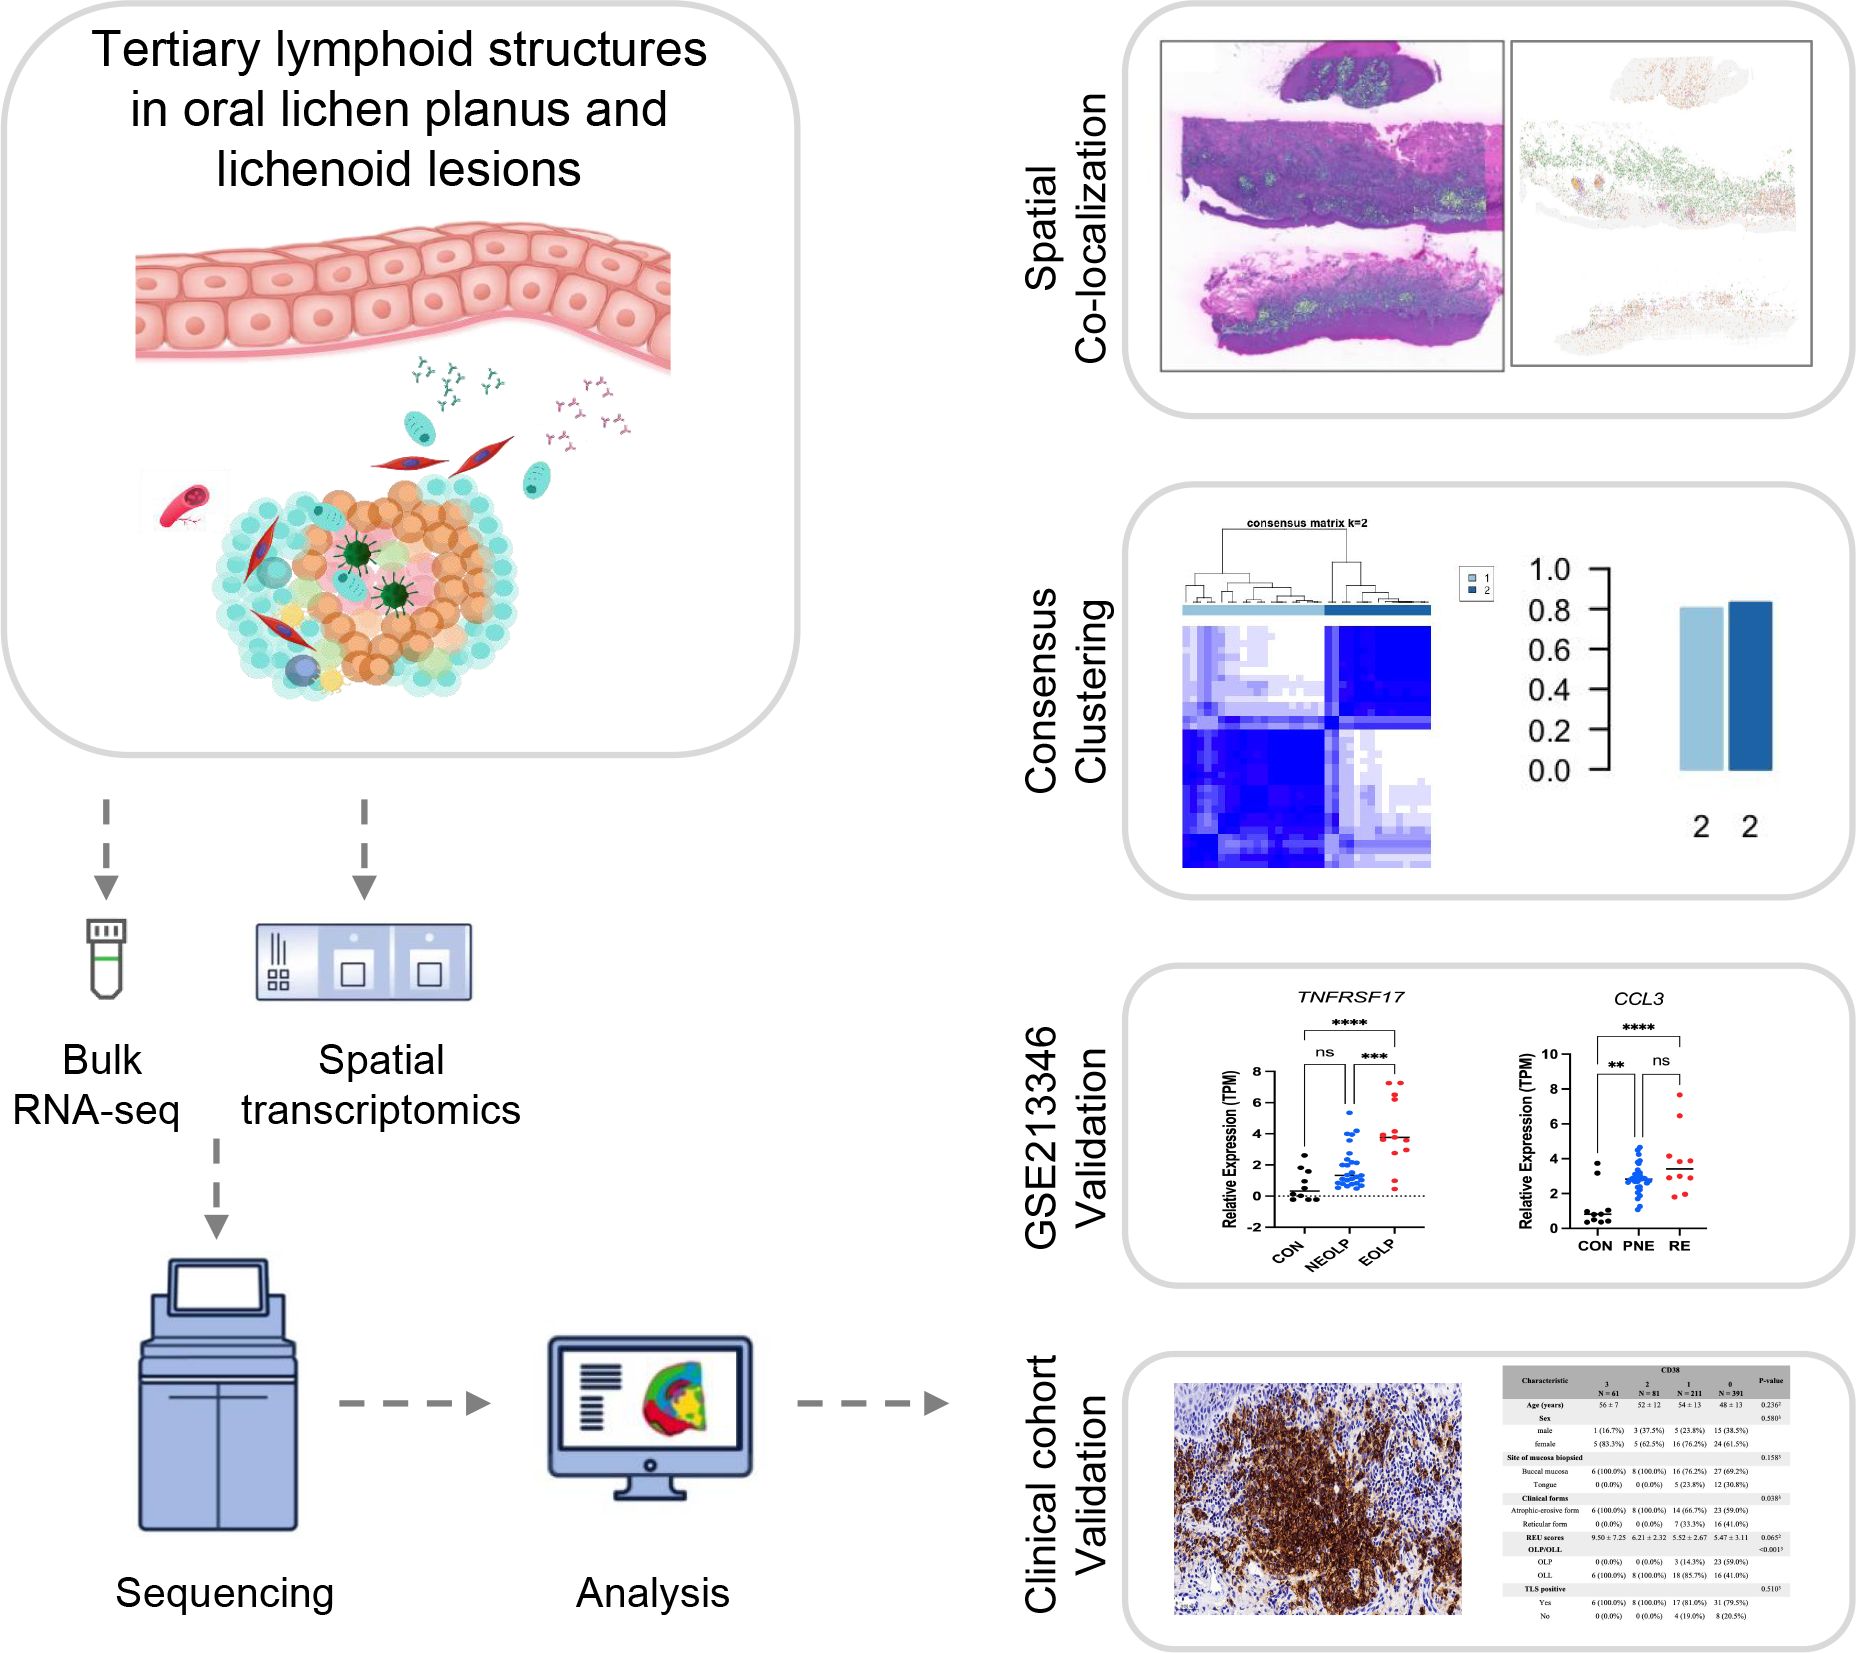
Figure 1. Workflow of this study.
2.2 Spatial transcriptomics
Formalin-fixed, paraffin-embedded (FFPE) oral mucosal tissue sections from three patients (two with non-erosive and one with erosive OLP/OLL) and three healthy controls were analyzed using the 10x Genomics Visium HD platform. Tissue sections (10 μm) were deparaffinized, permeabilized, and stained with hematoxylin and eosin (H&E) for spatial alignment, following the Visium HD FFPE Tissue Preparation Handbook (CG000684, 10x Genomics). The CytAssist system was used to position the tissue onto Visium HD slides, which contain a high-density array of 2 × 2 μm spatially barcoded capture spots. RNA quality of FFPE tissue was assessed using the DV200 metric, with a minimum of 30% of RNA fragments >200 nucleotides required for high-quality RNA. Probe hybridization, ligation, extension, and library construction were performed according to the Visium HD Spatial Gene Expression Reagent Kits User Guide (CG000685), and libraries were sequenced on an Illumina NovaSeq X Plus-25B platform with paired-end reads.
The raw sequencing data were processed using the Space Ranger pipeline (version 4.0.1). Initially, reads were trimmed to remove template switch oligo (TSO) sequences from the 5’ end and polyA tails from the 3’ end. Barcode correction was performed by matching observed barcodes to a predefined inclusion list, allowing up to four permissible edits. The reads were then aligned to the GRCh38 human reference genome (GENCODE v38 annotation) using the STAR aligner (version 2.7.1b), with high sensitivity to spliced alignments. Alignment quality was assessed by classifying reads as exonic, intronic, or intergenic based on their overlap with annotated genomic features. A filtered feature-barcode matrix was generated by counting unique molecular identifiers (UMIs) for each gene, ensuring the inclusion of only high-quality reads in downstream analysis. Custom quality control filters were applied to exclude low-quality spots, specifically those with fewer than 10 detected features (nFeature_Spatial) or total counts (nCount_Spatial) below 10. These thresholds were chosen to eliminate spots with insufficient gene expression data, thereby reducing noise and improving result accuracy. The data were normalized and variance-stabilized using SCTransform to account for both technical noise and biological variability. Dimensionality reduction was performed using UMAP (Uniform Manifold Approximation and Projection) on the highly variable genes to capture the most informative features of the dataset. Unsupervised clustering was then applied to identify spatially distinct transcriptional domains. Finally, marker gene expression was mapped to reconstruct the local immune architecture within the tissue. For downstream analysis, the data were initially generated at a 2 μm resolution, with additional binning resolutions of 8 μm and 16 μm. To balance cell resolution and the mean transcripts per bin, the 8 × 8 μm bin resolution was selected for further analysis. This resolution offers an optimal compromise between spatial resolution and noise reduction, providing sufficient detail while maintaining data quality.
Spatial transcriptomics gene signature scoring: Tertiary lymphoid structure (TLS) gene lists were compiled from previous studies (24). Gene signature scores for each Visium slide were calculated using the AddModuleScore function in Seurat (v4.4.1) with default settings. Briefly, AddModuleScore computes the average expression of the genes in the set for each spatial spot and subtracts the aggregated expression of control feature sets, which are randomly sampled from bins of genes with similar average expression to control for expression-level biases. The resulting scores represent relative TLS-associated transcriptional activity per spot and were visualized using SpatialFeaturePlot in Seurat, where the color scale corresponds to these relative values.
2.3 Bulk RNA sequencing and public datasets integration
Oral mucosal biopsies were collected under local anesthesia and bisected for histopathological evaluation. Total RNA was extracted using TRIzol reagent (Invitrogen, CA, USA) according to the manufacturer’s protocol. RNA purity and concentration were evaluated using the NanoDrop 2000 spectrophotometer (Thermo Scientific, USA), and RNA integrity was assessed using the Agilent 2100 Bioanalyzer (Agilent Technologies, Santa Clara, CA, USA).
RNA-seq libraries were constructed using the VAHTS Universal V10 RNA-seq Library Prep Kit (Premixed Version) following the manufacturer’s instructions. Libraries were then sequenced on the Illumina NovaSeq 6000 platform, generating 150 bp paired-end reads. Raw FASTQ reads were processed with fastp to remove low-quality sequences, yielding clean reads for subsequent analyses.
The clean reads were aligned to the reference genome using HISAT2. Gene-level read counts were obtained using HTSeq-count. Bulk RNA-seq was performed on samples from 16 OLP patients and 10 healthy controls. To expand the dataset, two publicly available transcriptomic datasets (GSE213346 and GSE204663) were retrieved from the Gene Expression Omnibus (GEO, https://www.ncbi.nlm.nih.gov/geo) and integrated with the in-house cohort.
Raw counts were normalized to Transcripts Per Million (TPM), and batch effects were corrected using the ComBat function in the sva R package. Principal component analysis (PCA) was performed using R (version 4.4.1) to assess biological variation and sample clustering.
2.4 TLS signature and consensus clustering
A curated set of 39 tertiary lymphoid structure (TLS)-associated genes was compiled based on published literature (24). These genes include chemokines (CCL2/3/4/5/8/18/19/21, CXCL9/10/11/13), T follicular helper (TFH) cell markers (CXCL13, CD200, FBLN7, ICOS, SGPP2, SH2D1A, TIGIT, PDCD1), genes shared by T helper 1 (TH1) and B cell lineages (CD4, CCR5, CXCR3, CSF2, IGSF6, IL2RA, CD38, CD40, CD5, MS4A1, SDC1, GFI1, IL1R1, IL1R2, IL10, CCL20, IRF4, TRAF6, STAT5A), and TNFRSF17 as a canonical plasma cell marker. To characterize immune heterogeneity in OLP, consensus clustering was performed using the intersection of differentially expressed genes (DEGs) and TLS signature genes (TSGs). Unsupervised clustering was conducted using the R package ConsensusClusterPlus, with the number of clusters (k) explored from 2 to 7. To ensure clustering stability, 1,000 bootstrap resampling iterations were performed. In each iteration, 80% of features (Pltem = 0.8) were randomly selected, while all genes were eligible for inclusion (pFeature = 1.0). Hierarchical clustering (clusterAlg = “hc”) with Pearson correlation distance (distance = “pearson”) was applied. The optimal number of clusters was determined based on cumulative distribution function (CDF) plots and delta area analysis, aiming for maximal intra-cluster homogeneity and inter-cluster separation. Clustering consistency was visualized using the ggplot2 package.
2.5 Differential gene expression and functional enrichment analysis
Differentially expressed genes (DEGs) were identified using the DESeq2 package in R. Gene symbols were converted to Entrez IDs using the org.Hs.eg.db package. Genes with an adjusted P-value (Padj) < 0.05 and |log2FoldChange| > 1 were considered statistically significant and visualized using a volcano plot to highlight robust transcriptional changes.
To explore the biological functions and pathways associated with the observed gene expression changes, Gene Ontology (GO) enrichment analysis was performed using the ClueGO plugin in Cytoscape (36). For enrichment input, a slightly broader threshold of nominal P-value < 0.05 and |log2FoldChange| > 1 was applied to include additional genes and minimize false negatives. Functional enrichment was assessed using a right-sided hypergeometric test, with P-values corrected for multiple testing using the Benjamini-Hochberg method (36). GO terms were grouped based on kappa statistics (threshold = 0.4) into functionally related categories. Enriched pathways with adjusted P-value < 0.05 were considered statistically significant.
In summary, more stringent criteria were applied for DEG visualization, whereas a more inclusive threshold was used for enrichment analysis to balance specificity and sensitivity across different analytical purposes.
2.6 Immunohistochemical analysis of B and plasma cells
An independent retrospective clinical cohort of 26 OLP and 48 OLL patients was enrolled to validate spatial immune cell infiltration. Disease severity was assessed using the Reticular-Erythema-Ulcerative (REU) scoring system (37), with consistent diagnostic and scoring protocols applied across cases to reduce inter-observer bias.
The formalin-fixed paraffin-embedded (FFPE) tissue sections were deparaffinized in xylene and rehydrated through a graded ethanol series. Endogenous peroxidase activity was quenched by incubating the sections with 3% hydrogen peroxide in methanol for 5 minutes. Antigen retrieval was performed by heating the sections in tris-EDTA buffer (pH 8.0) in a 100°C water bath for 30 minutes, followed by cooling at room temperature and rinsing with tap water. The sections were then incubated with a blocking solution (P0102, Beyotime, Hangzhou, China) at room temperature for 1 hour to reduce nonspecific binding. Following blocking, the slides were incubated overnight at 4°C with primary antibodies: anti-CD20 (1:50, ab78237, Abcam, Cambridge, UK) and anti-CD38 (1:500, ab108403, Abcam, Cambridge, UK). After washing with phosphate-buffered saline (PBS), the sections were incubated with the secondary antibody, Goat Anti-Rabbit IgG H&L (HRP) (1:2000, ab205718, Abcam, Cambridge, UK), for 1 hour at room temperature. Detection was carried out using diaminobenzidine (DAB) (Celnovte, MD, USA) as a chromogen, followed by counterstaining with hematoxylin for 1 minute. The slides were then dehydrated through a graded ethanol series, cleared in xylene, and mounted with a coverslip for microscopic examination.
For semiquantitative evaluation, five representative fields per slide within the inflammatory zone were selected at 400× magnification. Immunostaining was graded as follows: Grade 3 (> 2/3 positive area or follicle-like aggregates), Grade 2 (1/3 to 2/3 positive area), Grade 1 (< 1/3 or focal positivity), and Grade 0 (no detectable staining) (30).
In addition, TLSs were assessed in the same sections using the criteria established in our previous study (29), where positivity was defined by the presence of high endothelial venules (HEVs, MECA-79) and CD3+ T-cell clusters surrounding CD20+ B-cell aggregates. All sections were independently reviewed by two experienced pathologists. In case of discrepancy, consensus was reached via joint discussion.
2.7 Statistical analysis
Continuous variables are presented as mean ± standard deviation (SD), while categorical variables are expressed as counts and percentages. For continuous variables, Welch’s t-test was applied for two-group comparisons, and one-way ANOVA followed by Tukey’s post-hoc test was used for comparisons among three or more groups. Categorical variables were compared using Fisher’s exact test or Chi-squared test, as appropriate. All statistical analyses were conducted in R software (version 4.2.2), with two-sided P < 0.05 considered statistically significant.
3 Results
3.1 TLS-based clustering stratifies OLP patients into distinct immune subtypes
A curated panel of 39 tertiary lymphoid structure (TLS) signature genes (TSGs), encompassing chemokines, T follicular helper cell markers, and genes shared by Th1 and B cell lineages, was selected based on previous studies (24). Spatial transcriptomic analysis of oral mucosal tissues (n = 6; 3 OLP/OLL patients and 3 healthy controls) revealed increased expression of TLS-related genes in OLP/OLL lesions, with a stronger signal observed in erosive cases (Figure 2A). TLS-like aggregates were visualized based on the spatial co-localization of canonical TLS markers, including CD3E, FDCSP, AICDA, BCL6, MS4A1, and CD38 (Figure 2B), supporting the presence of organized immune niches within inflamed tissues.
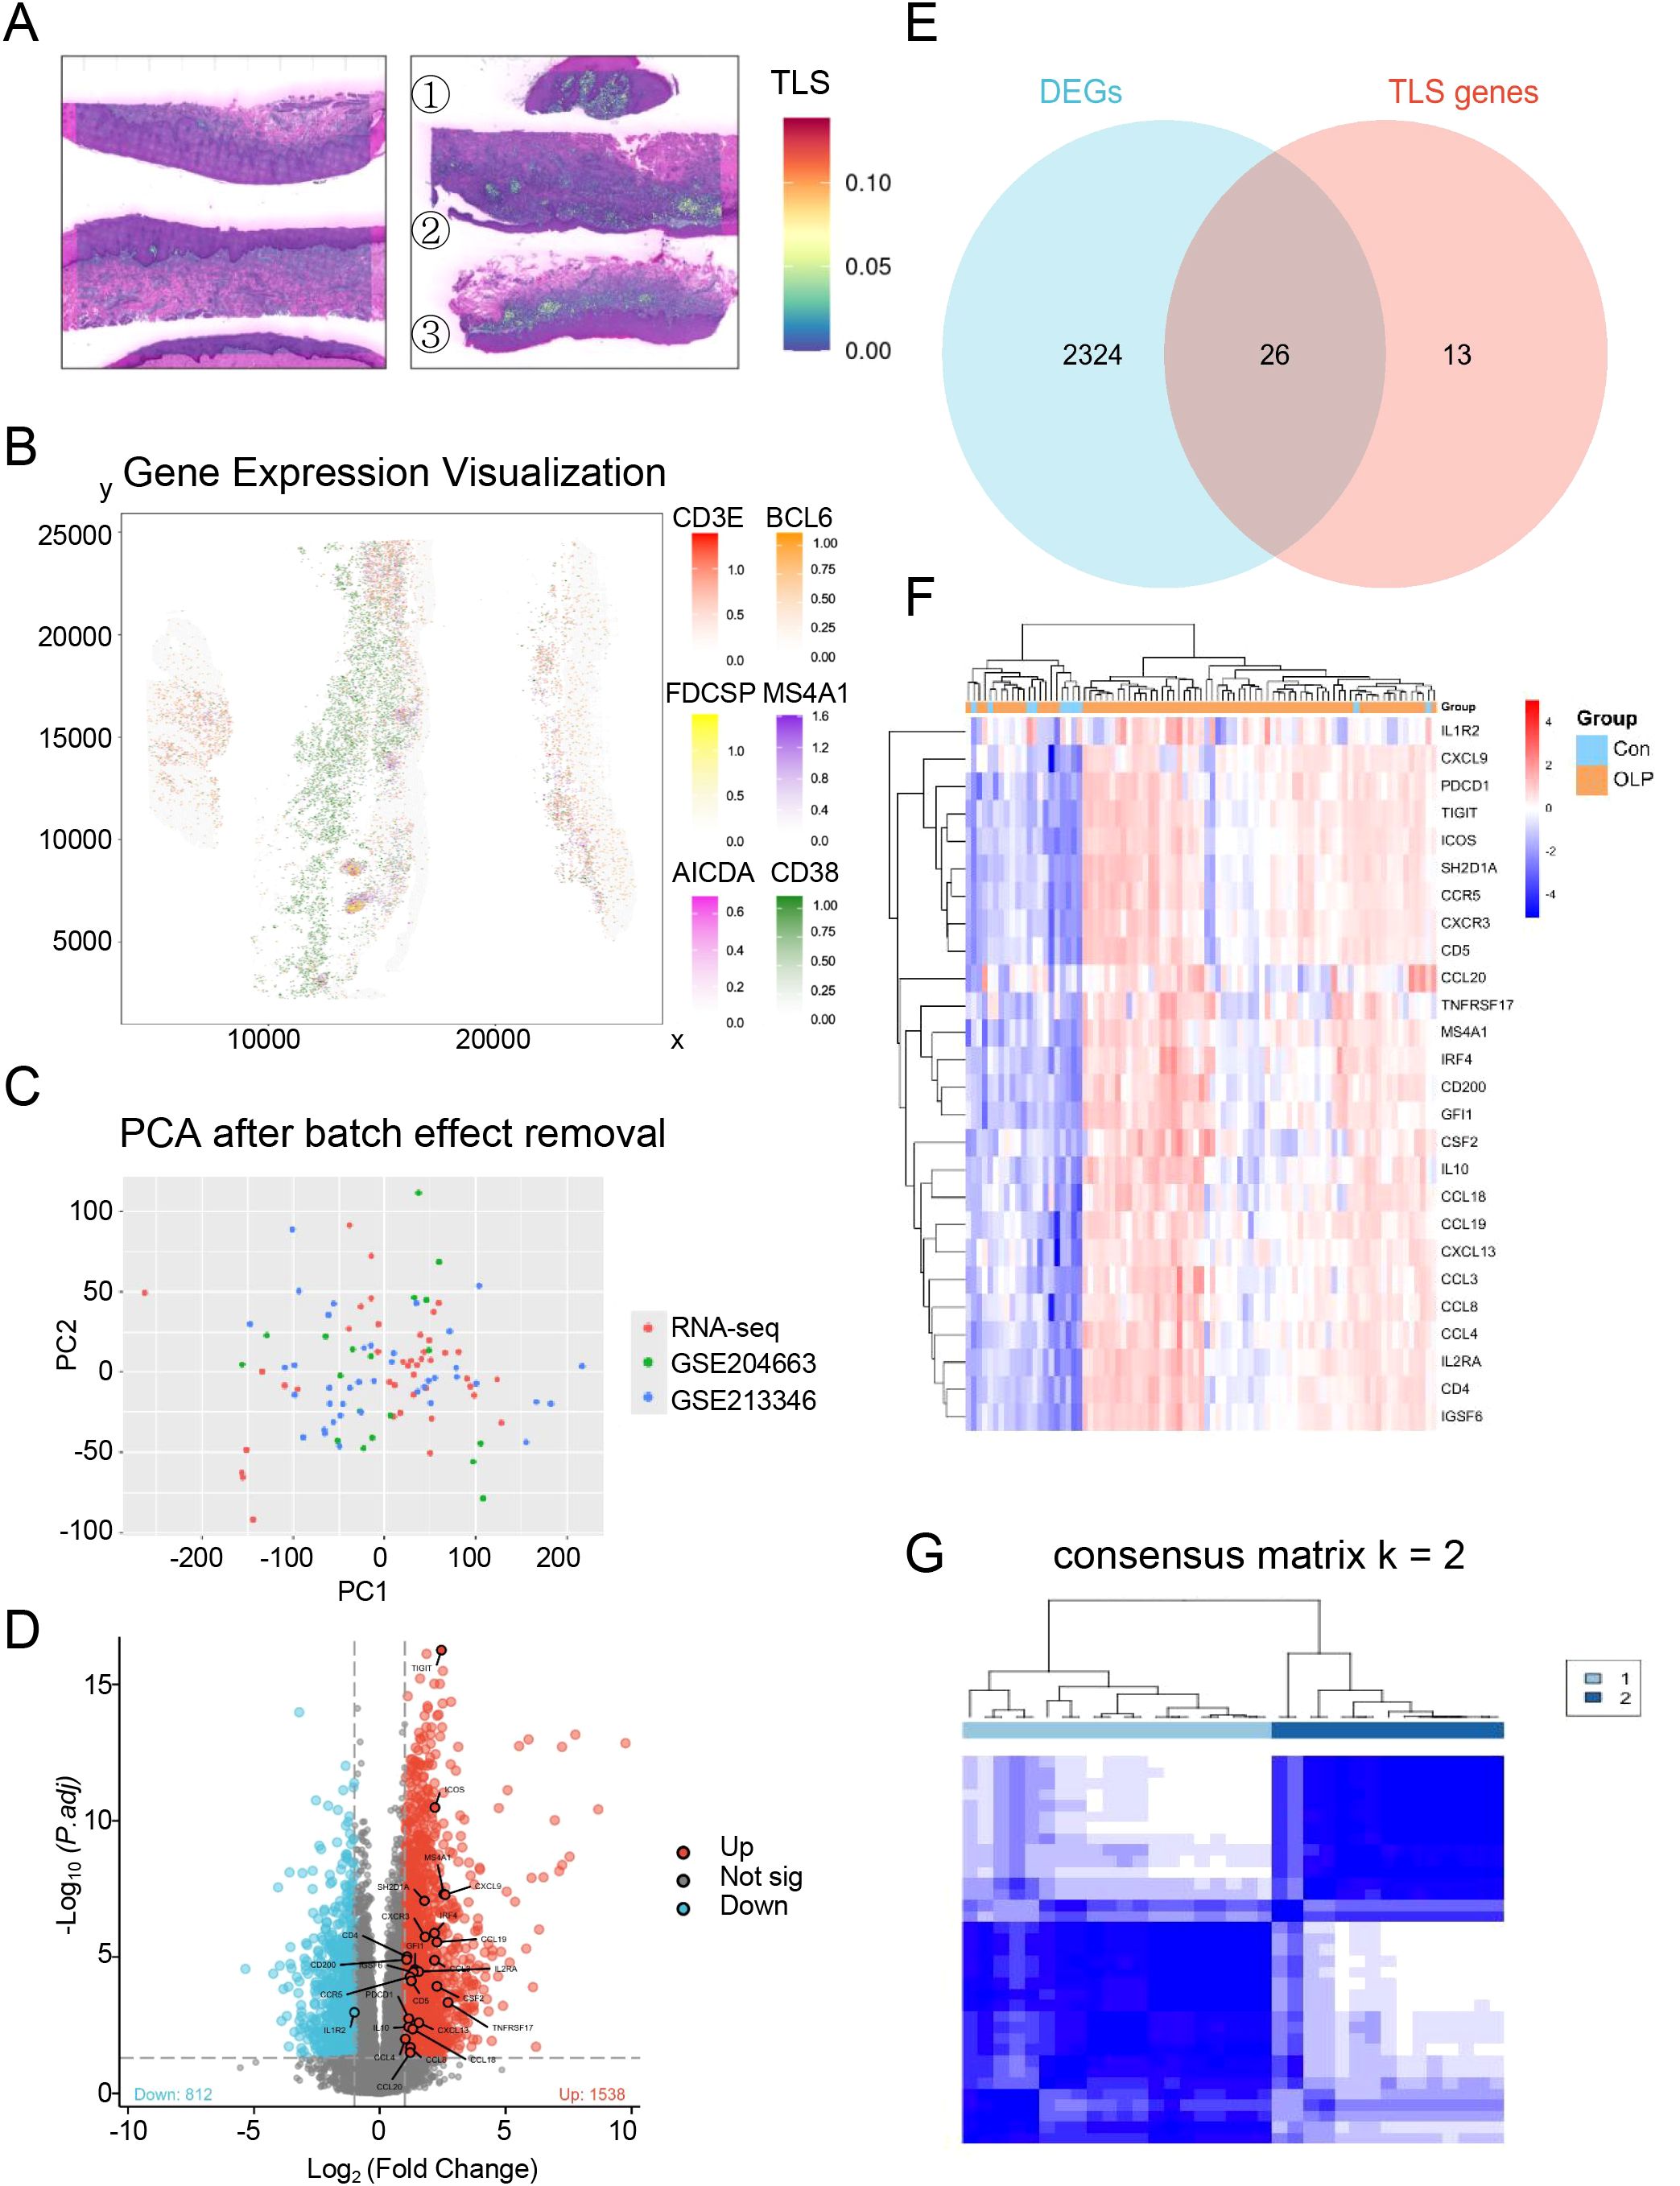
Figure 2. Identification of distinct TLS patterns by unsupervised consensus clustering. (A) Spatial transcriptomics reveal TLS-related genes in normal oral mucosa(left) and OLP/OLL lesions(right) (①③non-erosive types; ②erosive types); (B) The spatial mapping of genes CD3E, FDCSP, AICDA, BCL6, MS4A1 and CD38 within the OLP/OLL tissues; (C) Principal component analysis after batch correction; (D) DEGs were visualized by the volcano map; (E) Venn diagram was conducted to obtain the intersection of the DEGs and TSGs; (F) Heatmap of intersecting genes across all samples; (G) Unsupervised clustering of 26 TLS related DEGs in OLP samples and Consensus clustering matrix for k = 2.
To further characterize immune heterogeneity in OLP, we integrated three transcriptomic datasets comprising 16 in-house OLP samples, 10 healthy controls, and two public datasets (GSE204663: 19 OLP; GSE213346: 40 OLP). Batch effects were corrected using the ComBat algorithm, and successful integration was confirmed by principal component analysis (PCA) (Figure 2C). Differential expression analysis comparing OLP (n = 75) and healthy controls (n = 10) identified 2,350 significantly dysregulated genes (Figure 2D). By intersecting these differentially expressed genes (DEGs) with the 39 TSGs, we identified 26 transcripts (Figure 2E) with consistent upregulation in the OLP group (Figure 2F).
To define TLS-related immune subtypes, we performed unsupervised consensus clustering on the 26 overlapping TSGs in a discovery cohort of 35 samples (in-house + GSE204663, lacking clinical annotations). Optimal cluster number was determined as k = 2 (Supplementary Figures S1A–C), resulting in two robust immune subtypes: Subtype A (n = 20) and Subtype B (n = 15) (Figure 2G). Subtype A was enriched for CCL3, IL2RA, and IL1R2, suggesting a T cell–dominant immune response. In contrast, Subtype B showed upregulation of IRF4 and TNFRSF17, genes involved in B cell activation and terminal plasma cell differentiation (Supplementary Figure S1D).
3.2 Subtype-specific DEGs highlight enrichment of B cell and plasma cell pathways
To investigate the functional divergence between TLS-based immune subtypes, we conducted differential expression analysis followed by Gene Ontology (GO) enrichment using ClueGO. The resulting functional network revealed 11 significantly enriched GO terms (Figures 3A, B), most of which were related to immune processes.
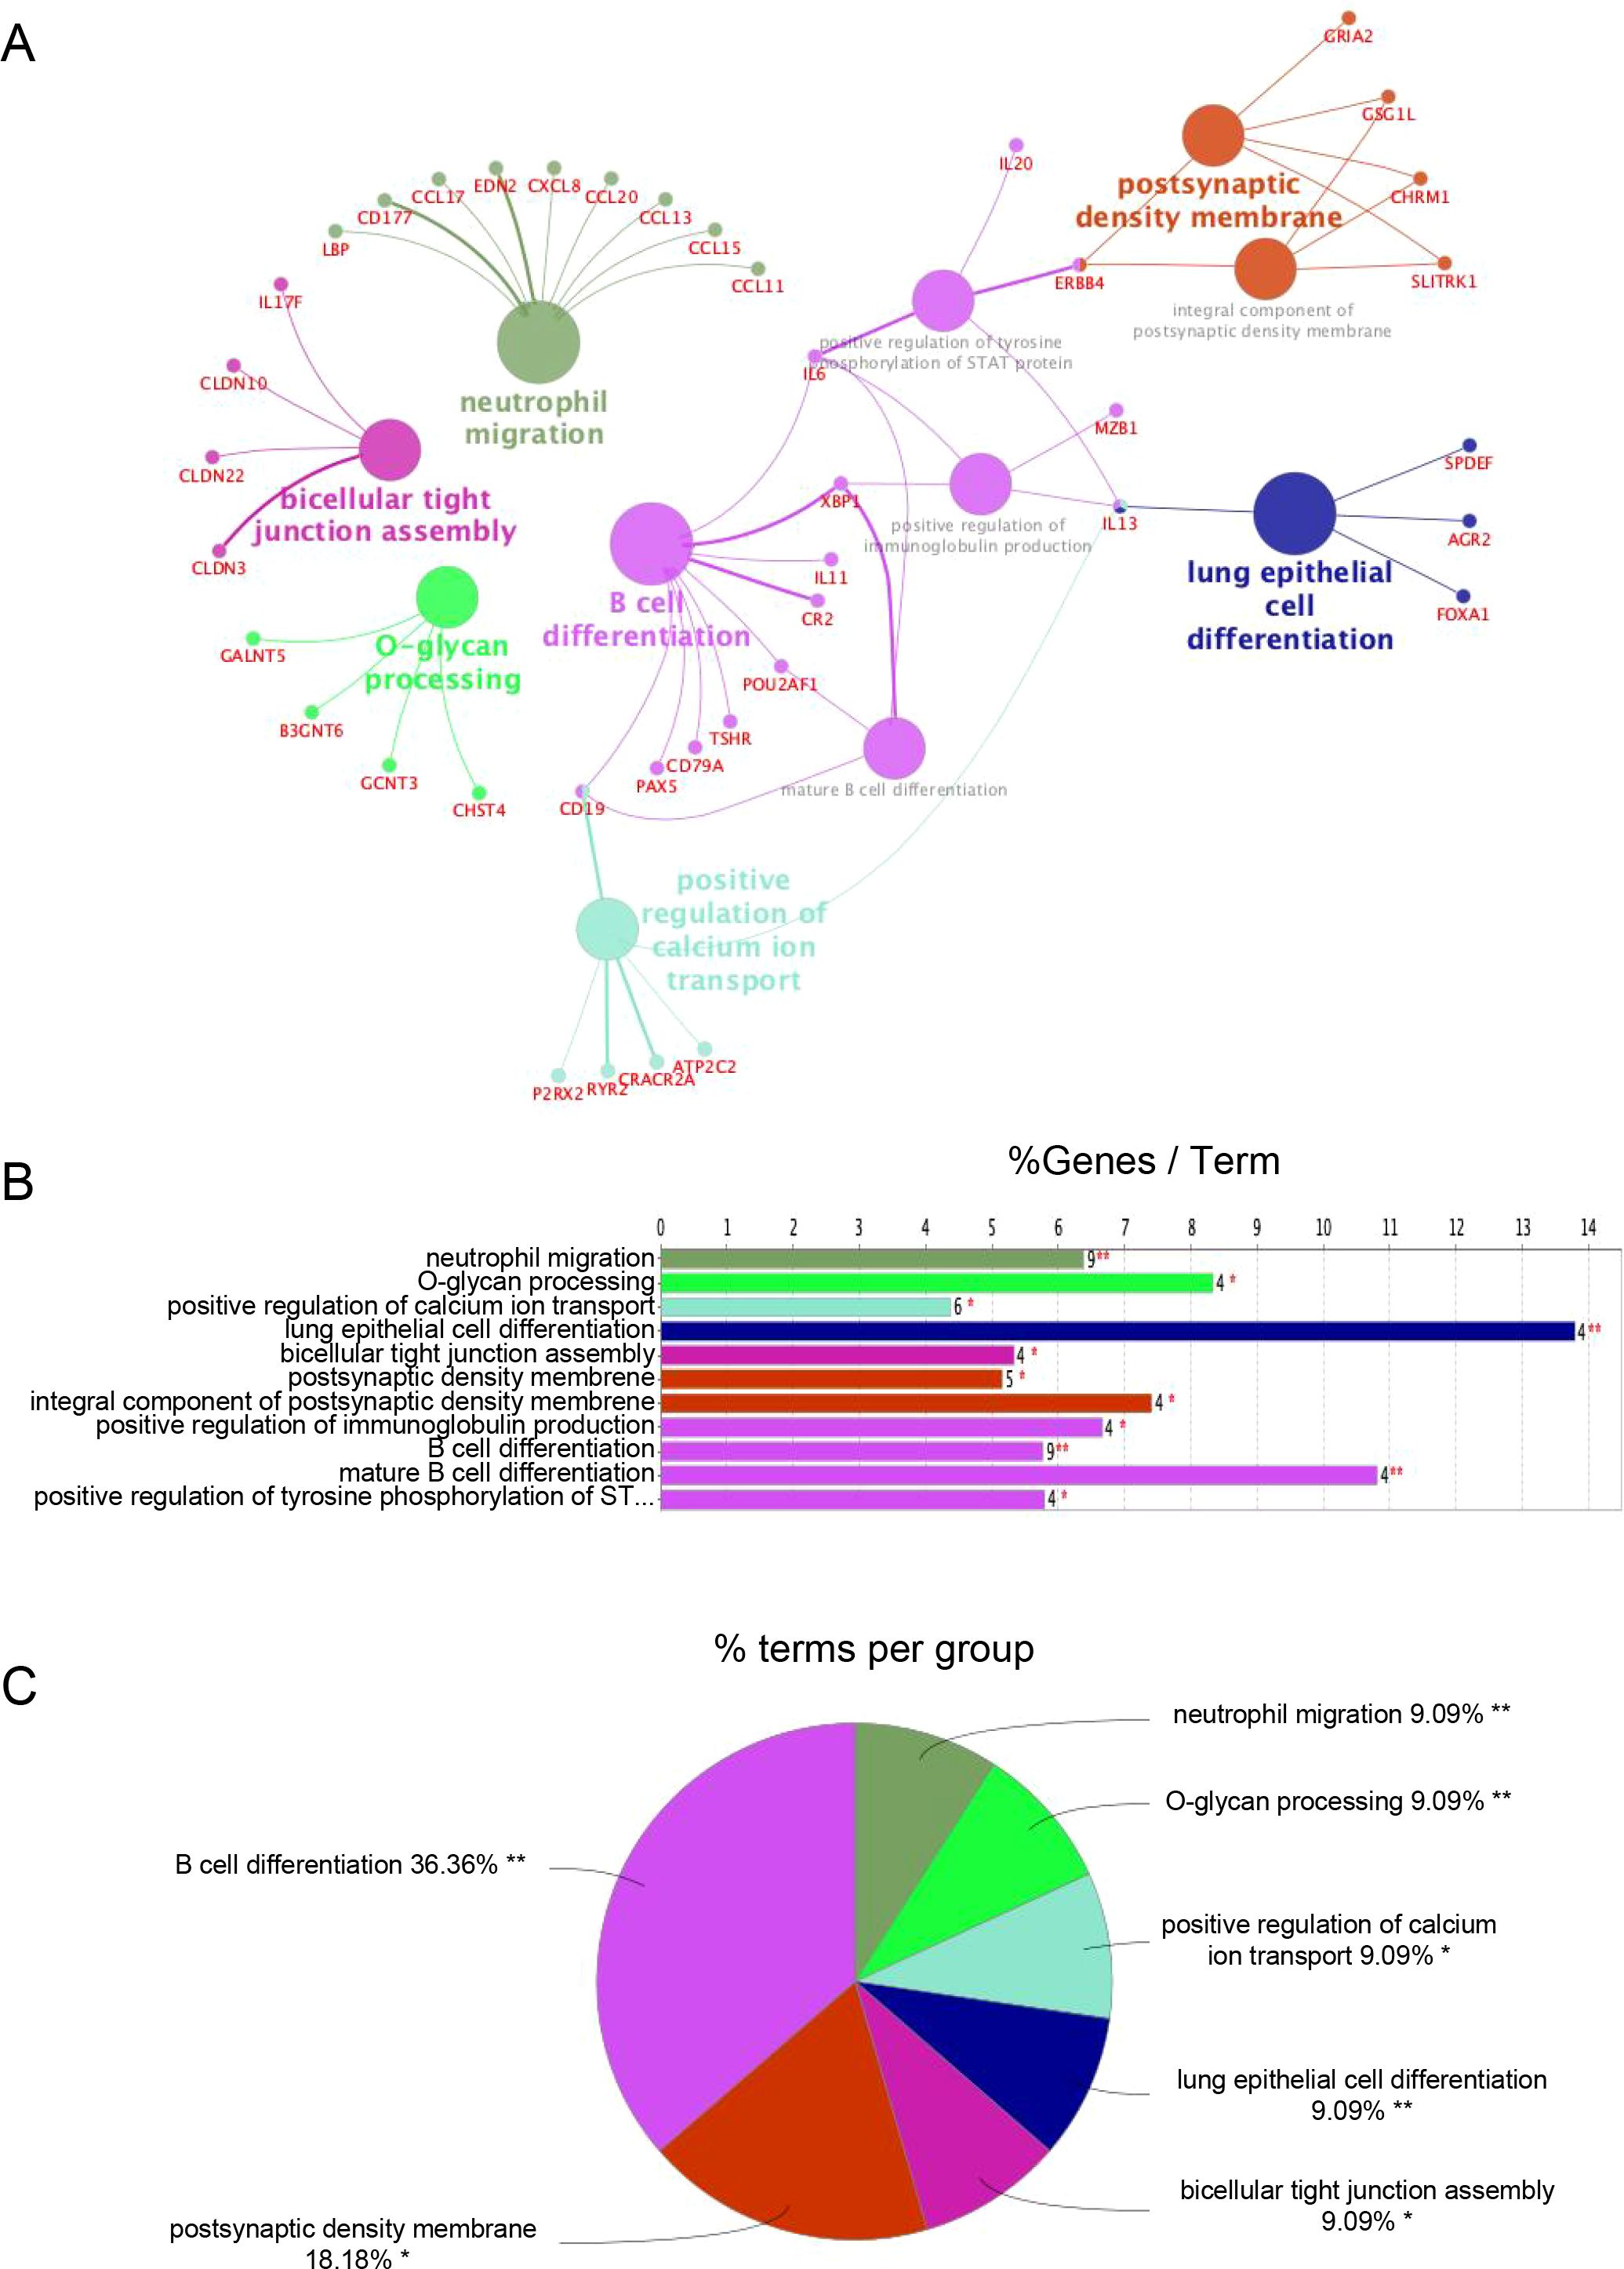
Figure 3. Functional enrichment analysis of DEGs. (A) ClueGO Functional Network Diagram of genes displayed by Cytoscape. Each dot represents a GO function term. The larger the P-value, the larger the size of the dot. Connections between dots reflect functional correlations, and the larger the κ coefficient, the thicker the line. Multicolor dots represent multiple GO functions; (B) The X-axis represents the percentage of enriched genes within each GO term, and the Y-axis displays the GO term names, consistent with the pie chart. The number next to each bar indicates the count of genes enriched in the respective GO term from the uploaded gene list. ClueGO enrichment analysis was performed using a right-sided hypergeometric test. * represents a P-value between 0.01 and 0.05, while ** indicate P < 0.01; (C) Functionally enriched pie graph, which represents the ratio of GO function.
Importantly, Subtype B demonstrated marked enrichment of B cell-associated pathways, including “B cell differentiation,” “positive regulation of immunoglobulin production,” and “mature B cell differentiation.” These pathways were driven by genes consistently upregulated in Subtype B (Supplementary Table S1), reflecting a transcriptional program indicative of active humoral immunity.
Notably, 36.36% of the top enriched GO terms were directly linked to B cell function (Figure 3C), supporting the notion that Subtype B is characterized by a B cell–dominant immune phenotype that may underlie its association with more aggressive clinical behavior.
3.3 B/plasma cell marker genes are elevated in erosive and recurrent OLP
We next assessed the clinical relevance of TLS-associated subtypes using the GSE213346 dataset, which includes clinical annotations for 40 OLP patients. Patients were categorized as non-erosive OLP (NEOLP, n = 27) or erosive OLP (EOLP, n = 13). Following one year of follow-up, they were further stratified into a recurrent erosion (RE) group defined by erosive episodes recurring within 3 months and a persistent non-erosion (PNE) group, who remained erosion-free during the same period, as previously described (3). For comparison, 10 healthy controls from our in-house RNA-seq dataset were included.
Subtype B-associated genes IRF4 and TNFRSF17 were significantly upregulated in both EOLP and RE groups. Similarly, canonical B and plasma cell markers CD79A, CD79B, CD19, MZB1, and CD38 were also elevated in patients with erosive and recurrent disease (Figures 4A, B). In contrast, among Subtype A-enriched genes, IL2RA was associated with both erosion and recurrence, whereas CCL3 was linked only to erosion. IL1R2 and CD8+ T cell markers (CD8A, CD8B) showed no significant correlation with clinical outcomes (Figures 4A, B). These findings reinforce the role of humoral immune activation-particularly B cell maturation and plasma cell differentiation-in driving aggressive OLP phenotypes characterized by erosion and recurrence.
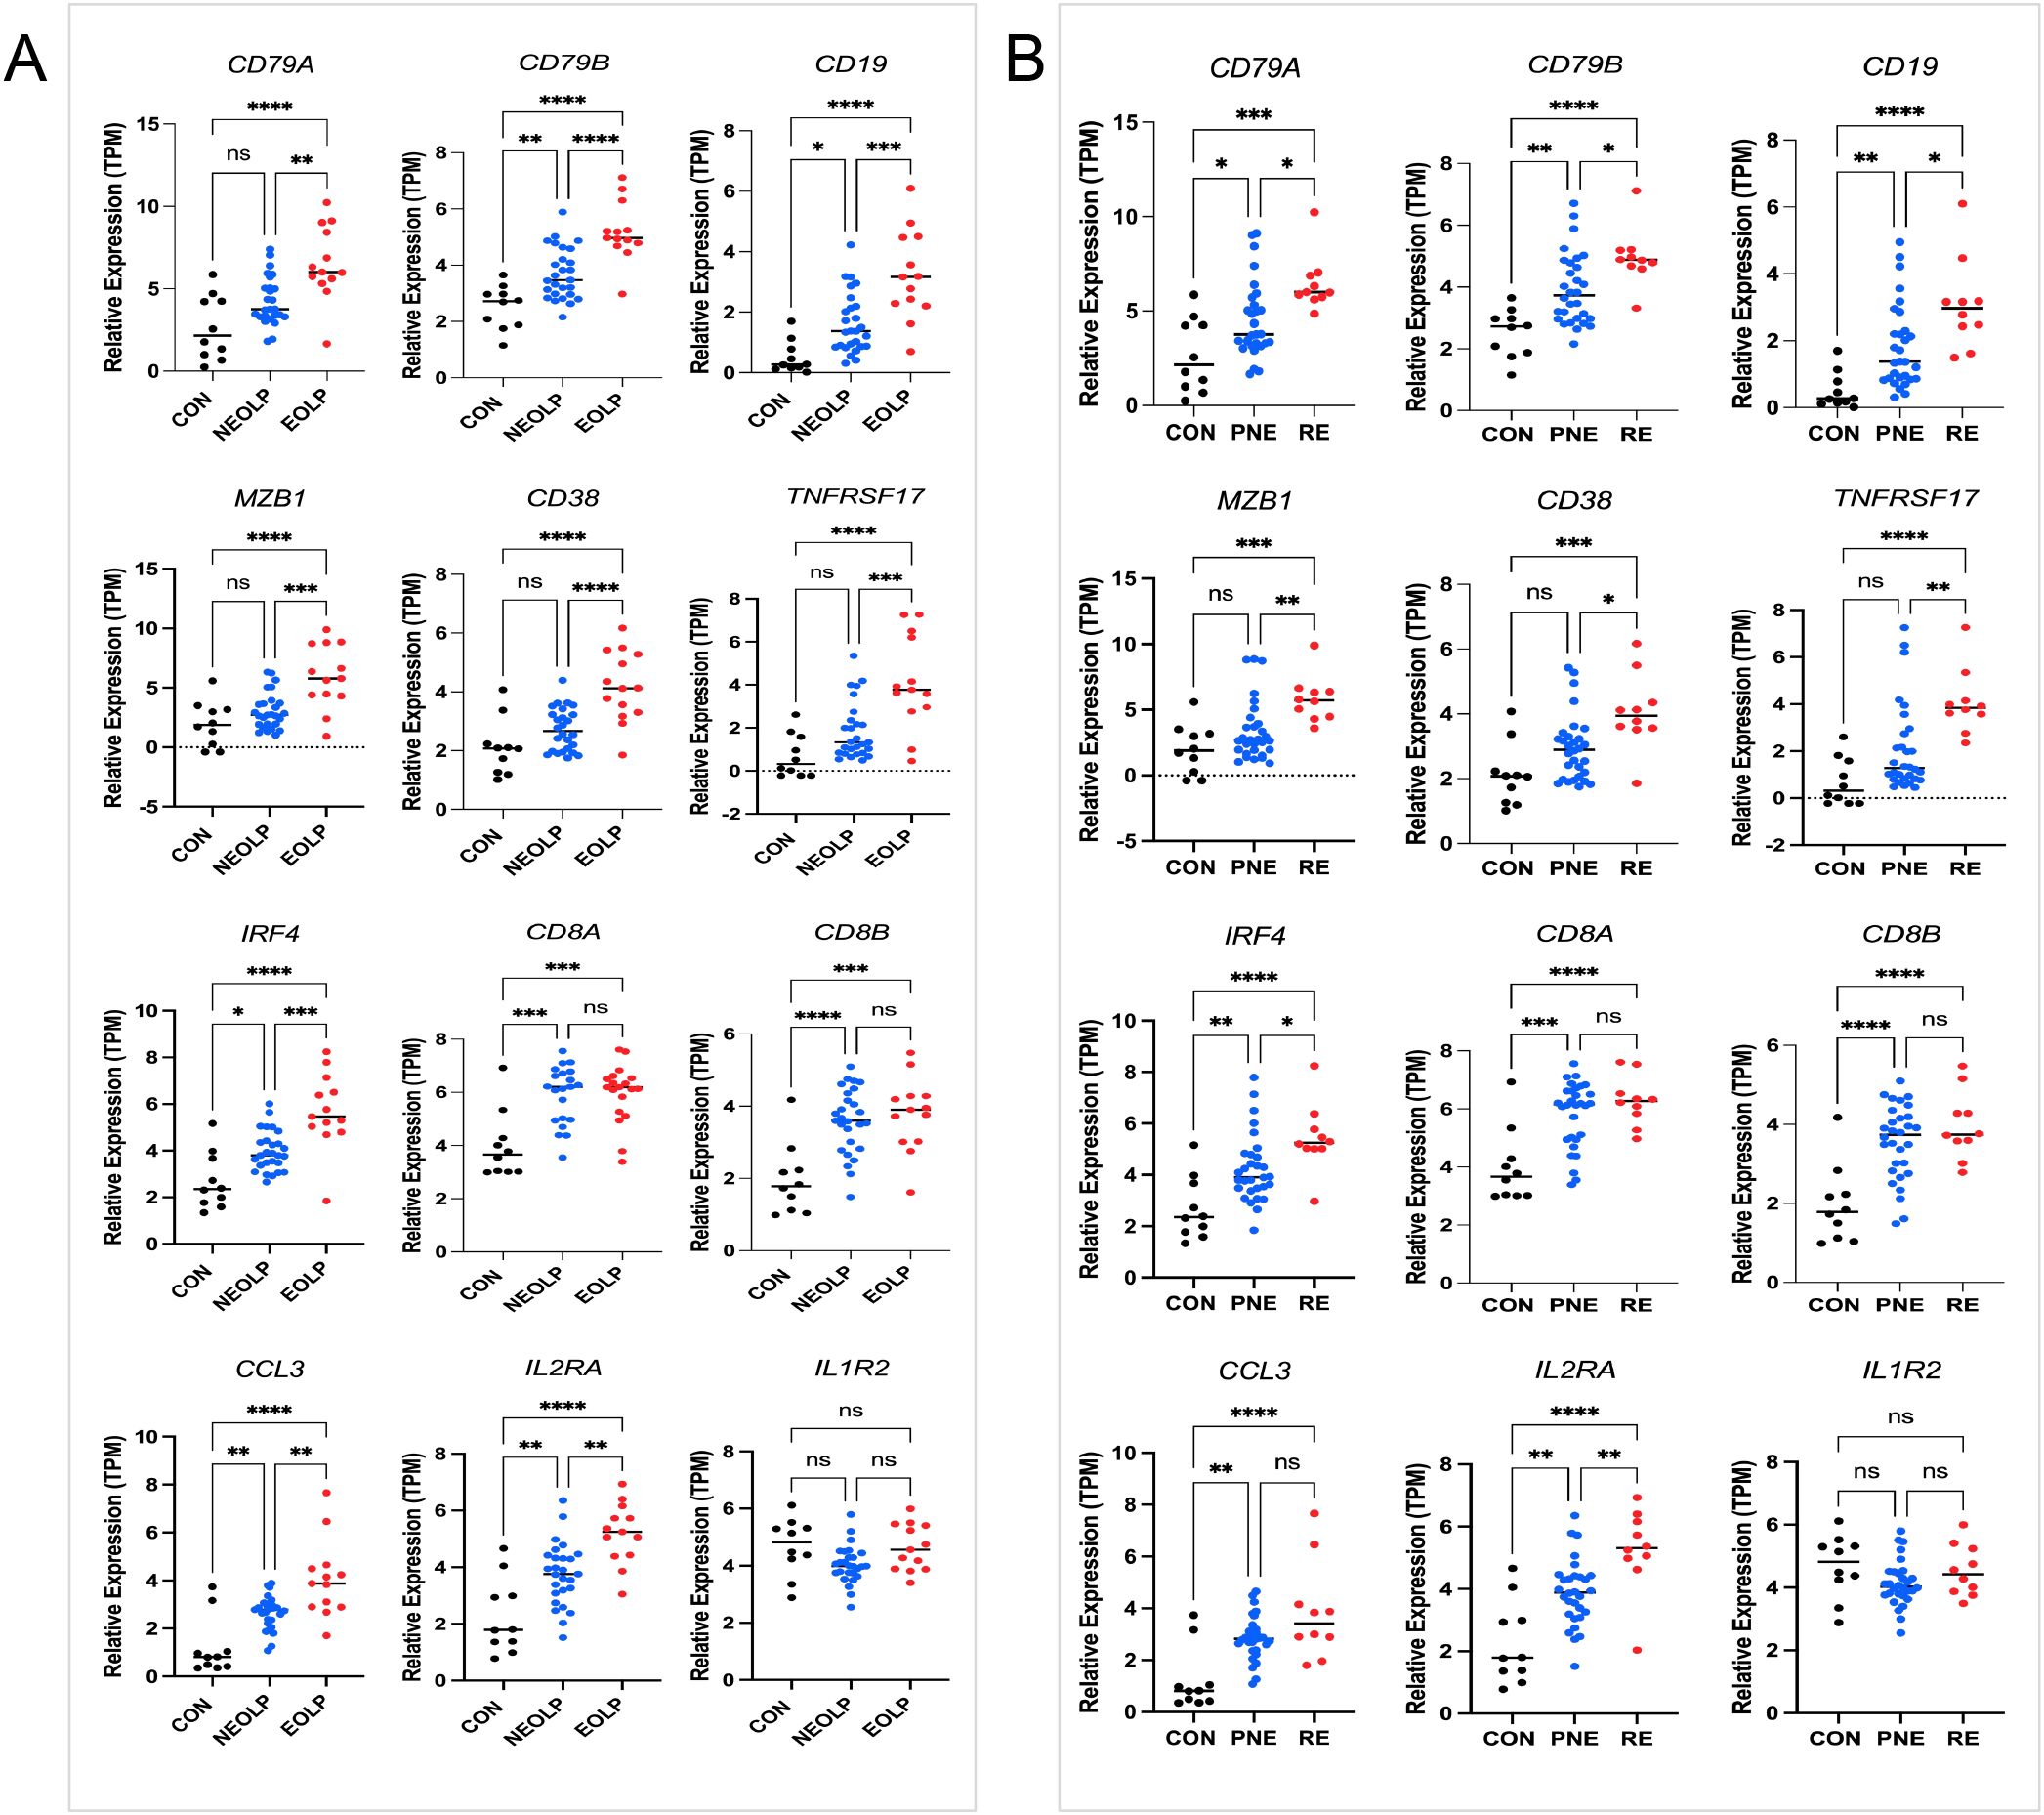
Figure 4. Genes expression and clinical stratification. (A) Marker genes in 13 erosive oral lichen planus (EOLP)/27non-erosive oral lichen planus (NEOLP); (B) Marker genes in 10 recurrent erosion (RE)/30 persistent non-erosion (PNE). Statistical analysis was performed using one-way ANOVA followed by Tukey’s post-hoc test. *P < 0.05, **P < 0.01, ***P < 0.001.n = 10 healthy controls (in-house RNA-seq).
3.4 CD20+ B cells and CD38+ plasma cells infiltrate OLP/OLL lesions, with plasma cell infiltration correlating with clinical severity
To validate transcriptomic findings at the protein level, we performed immunohistochemical analysis of CD20 (B cell marker) and CD38 (plasma cell marker) in an independent retrospective clinical cohort of 74 patients (26 OLP, 48 OLL).
CD20+ B cells were detected in 97.3% of cases and were significantly associated with TLS positivity (P < 0.001), but showed no correlation with clinical subtype or severity (Table 1; Figure 5).
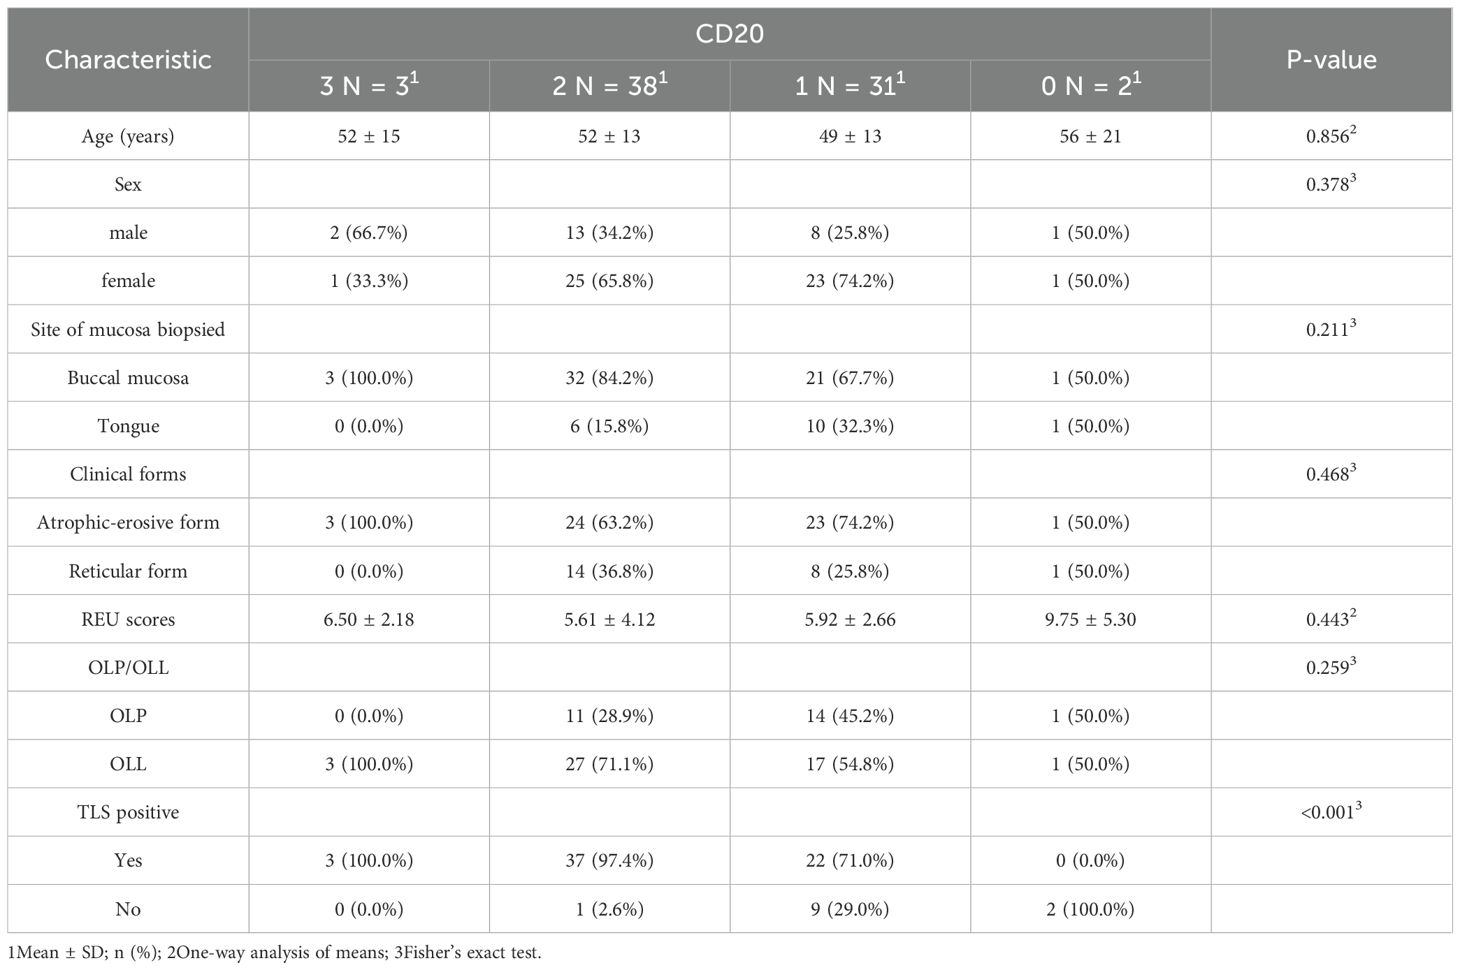
Table 1. Clinical and pathological characteristics of OLP patients across four CD20 expression grades.
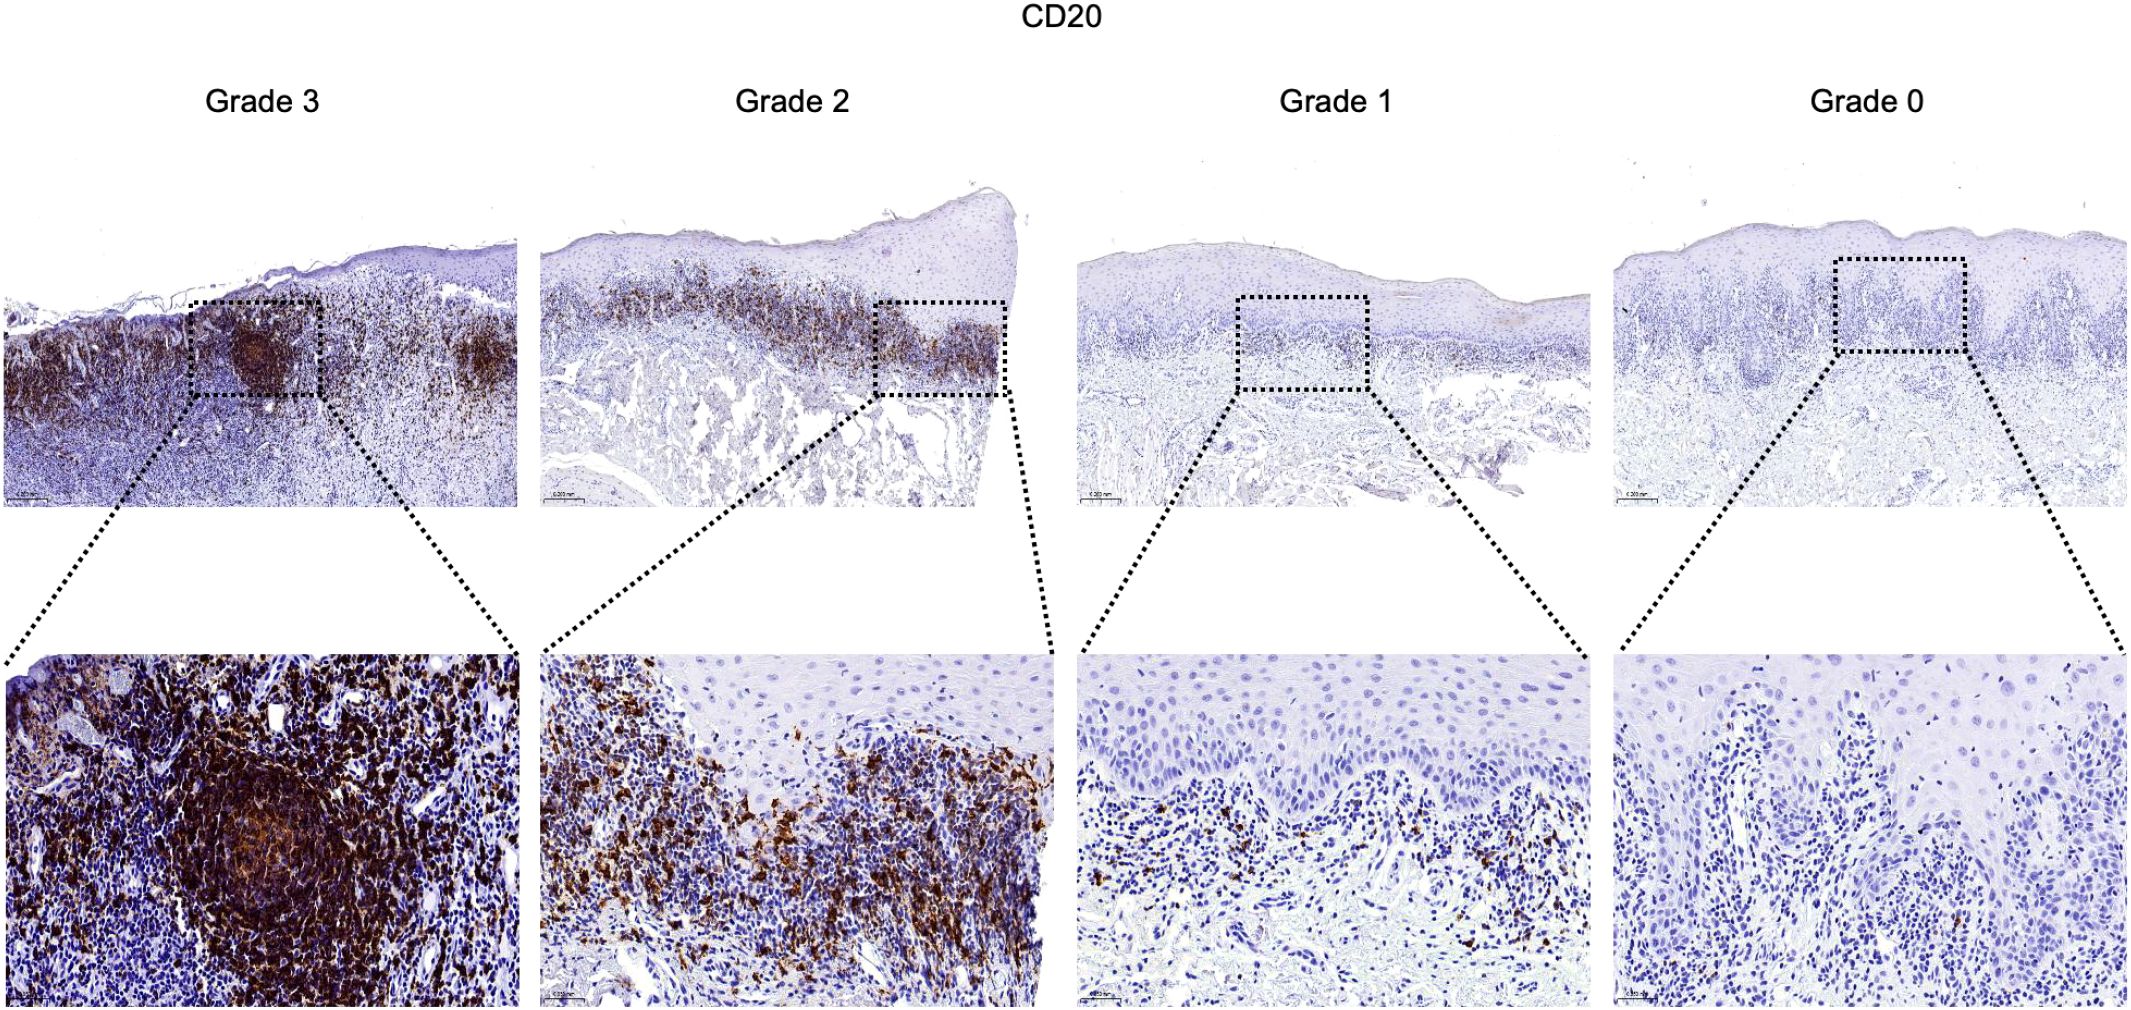
Figure 5. Infiltration and distribution of CD20+ B cells (brown) in oral mucosal tissue. Immunohistochemistry for CD20 of OLP and OLL group, 100 × (up) and 400 × (lower) magnification. Staining was graded on a four-tier scale.
In contrast, CD38+ plasma cells were present in 47.3% of cases and demonstrated a significant association with erosive disease (P = 0.038). Higher grades of plasma cell infiltration were more frequently observed in erosive rather than reticular lesions, and REU scores tended to increase with CD38+ cell density (P = 0.065). Notably, OLL cases were overrepresented in higher plasma cell infiltration grades (P < 0.001), while TLS positivity remained uniformly high across all plasma cell levels (P = 0.510) (Table 2; Figure 6).
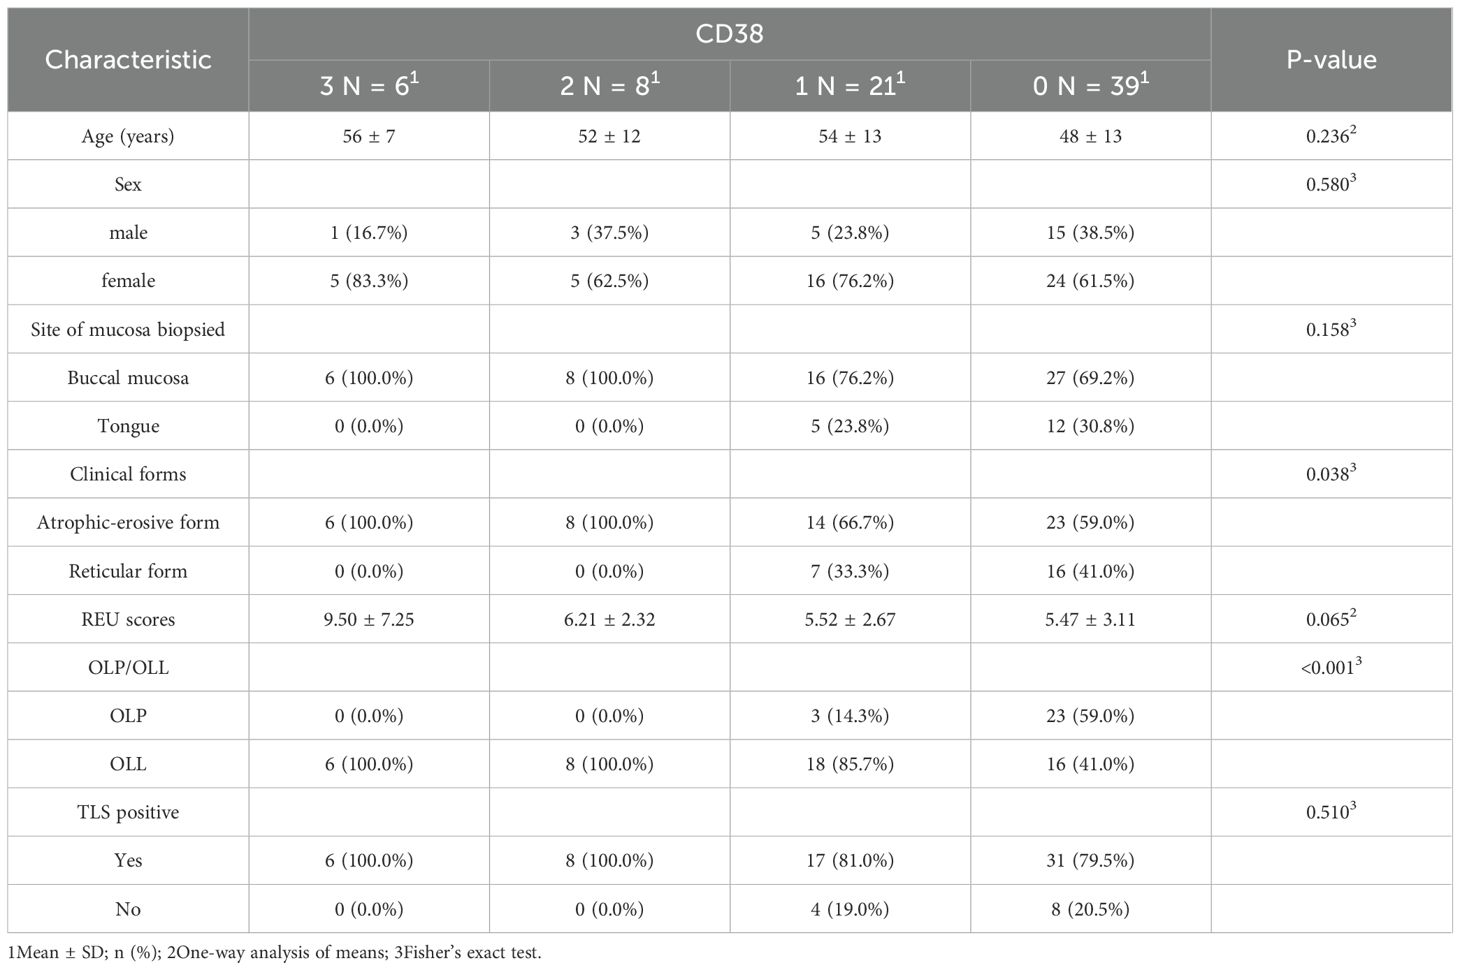
Table 2. Clinical and pathological characteristics of OLP patients across four CD38 expression grades.
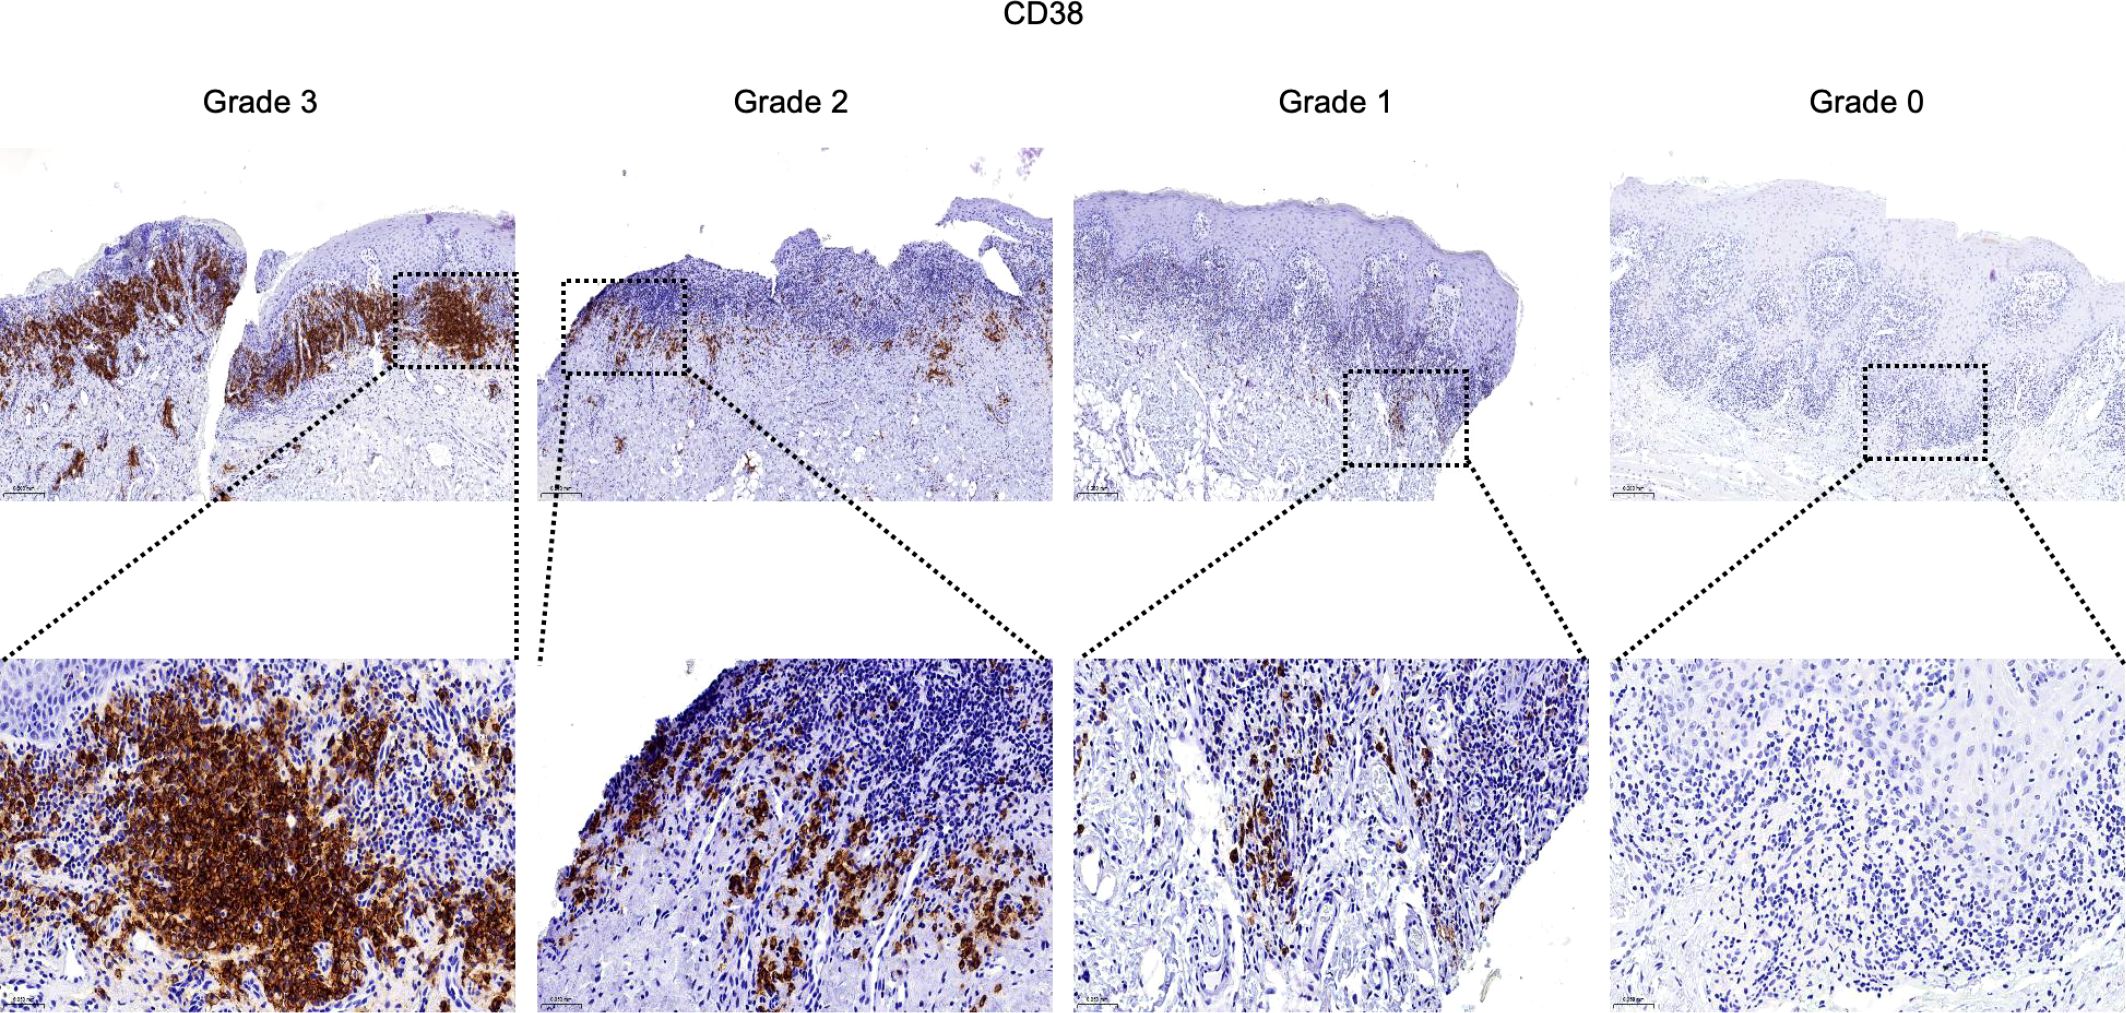
Figure 6. Infiltration and distribution of CD38+ plasma cells (brown) in oral mucosal tissue. Immunohistochemistry for CD38 of OLP and OLL group, 100 × (up) and 400 × (lower) magnification. Staining was graded on a four-tier scale.
These results suggest distinct roles for B cell subsets in OLP/OLL pathogenesis: CD20+ B cells contribute to TLS formation and structural organization, whereas CD38+ plasma cells reflect terminal humoral activation and are associated with more severe clinical phenotypes.
4 Discussion
Understanding the immunopathological heterogeneity of oral lichen planus (OLP) and oral lichenoid lesions (OLL), and its relationship with clinical outcomes, remains a major challenge in clinical practice. While T cell-mediated mechanisms have been extensively studied, the drivers of disease severity and recurrence are still incompletely defined. In this study, we addressed this knowledge gap by focusing on the humoral immune axis, investigating tertiary lymphoid structure (TLS)-associated B cell activation and plasma cell differentiation using transcriptomic and immunohistochemical approaches.
TLSs are ectopic lymphoid structures that support local antigen-specific immune responses. Mature TLSs containing germinal centers with CD21+CD23+ follicular dendritic cells have previously been associated with severe OLP manifestations (22, 24, 29). Within TLSs, B cells undergo class-switch recombination, clonal expansion, and somatic hypermutation under the influence of T follicular helper (Tfh) cells and cytokines such as IL-6 and BAFF. This process ultimately leads to the generation of IgG+ and IgA+ plasma cells (26, 38, 39). Clinical observations further highlight humoral dysregulation in OLP, such as the presence of autoantibodies against desmogleins (Dsg1/3) and bullous pemphigoid antigens (BP180 and BP230) (40–43). Notably, B cell depletion with rituximab can alleviate symptoms, but relapses frequently occur upon B cell reconstitution, highlighting the critical role of B/plasma cells in disease persistence (44). Through TLS-based immune subtyping, we identified two transcriptionally distinct subgroups. Subtype B was characterized by elevated expression of IRF4 and TNFRSF17 and enrichment of pathways related to B cell maturation and plasma cell differentiation. Our transcriptomic validation using the GSE213346 dataset confirmed increased expression of TLS-related genes (IRF4, TNFRSF17) and B/plasma cell markers (CD79A/B, CD19, MZB1, CD38) in erosive and recurrent OLP, further linking humoral activation to poor clinical outcomes. Strikingly, this observation stands in sharp contrast to findings in various cancers, where B cell or plasma cell infiltration often predicts improved prognosis (38, 45–54). This suggests a tissue and context dependent role of humoral immunity-potentially protective in tumors, but pathogenic in chronic inflammatory diseases like OLP.
Immunohistochemistry revealed that CD20+ B cells were strongly associated with TLS formation, suggesting their key role in establishing ectopic immune architecture. Functionally, B cells also serve as professional antigen-presenting cells capable of activating CD4+ and CD8+ T cells via MHC presentation, co-stimulatory signals, and cytokine production (55–59). B cells have also been shown to cross-present antigens and secrete cytotoxic molecules in both inflammatory and neoplastic settings (60–64). In OLP/OLL, B cells within TLS regions exhibited transcriptional enrichment in T cell co-stimulation pathways, indicating their contribution to sustained T cell-driven inflammation (65). While total B cell density was not significantly linked to disease phenotype, CD38+ plasma cell infiltration was strongly associated with erosive lesions. Consistently, Epstein–Barr virus (EBV)-infected plasma cells have been found to accumulate in OLP, where they correlate with both local inflammatory activity and disease severity (11). These observations indicate that terminally differentiated B cells are more likely to drive disease progression than bulk B cell numbers. As rituximab does not deplete plasma cells (66), targeting plasma cell function may represent a more rational therapeutic approach in aggressive OLP/OLL. Previous work from our group showed that plasma cell signatures co-localized with immunoglobulin transcripts (IGHG1, IGHG3, IGHA1, IGKC, IGLC1) in OLP/OLL tissues, suggesting that plasma cells may contribute to pathology through local immunoglobulin production (65). Antibody isotype and specificity shape distinct immune responses. IgG1-producing cells promote cytotoxicity (67, 68), whereas IgA+ plasma cells especially those expressing IL-10 and PD-L1 may suppress immune responses and facilitate tissue remodeling (69–72). Although plasma cell infiltration was evident in our study, IgG staining in OLP/OLL was often absent or weak (73), suggesting that other mechanisms may mediate tissue damage. Beyond antibody production, plasma cells modulate immunity by secreting cytokines, promoting antibody-dependent cellular cytotoxicity (ADCC) and phagocytosis, activating complement, enhancing antigen presentation by dendritic cells, and driving cytotoxic T cell responses (74–76). In OLP/OLL, the precise roles and functional mechanisms of plasma cells remain unclear and warrant further investigation.
These findings align with emerging evidence highlighting the role of cellular immunity in OLP/OLL. CD8+ tissue-resident memory T cells (Trm) are enriched in erosive lesions and correlate with disease activity (3). Moreover, erosive OLP also demonstrates a Th17-biased immune profile, while non-erosive forms exhibit Th2 dominance (9, 10). Recent studies also implicate innate lymphoid cells (ILCs), particularly the ILC1hi/ILC3low phenotype, in a subset of OLP/OLL patients, which correlates with better clinical treatment response. These findings suggest a potential role for ILC profiling in guiding treatment stratification (77, 78). Together, these insights underscore the multifactorial nature of OLP/OLL, in which both cellular and humoral immune components interact within TLS-enriched microenvironments to shape disease progression.
The distinction between OLP and OLL remains debated. The term “oral lichenoid lesions” (OLL) was introduced in 2003 to describe lesions that are histopathologically or clinically compatible with OLP but exhibit atypical features (79). In 2016, the classification of OLL was further questioned, as it encompasses lichenoid contact lesions, drug-induced reactions, and lesions associated with graft-versus-host disease (GVHD) (31). In 2020, the French GEMUB working group refined this concept by introducing “induced oral lichenoid lesions” (IOLL), which includes lesions triggered by conditions such as GVHD, lupus, Good’s syndrome, as well as local factors and systemic drugs (35). In our study, OLL was strictly defined as lesions with atypical features, but without identifiable triggers, in line with this expanded classification. We observed that OLL cases were more frequently associated with higher plasma cell infiltration grades, a finding consistent with prior reports of deeper connective tissue infiltration in OLLs, including eosinophils, neutrophils, and plasma cells, compared to OLP (80–82). This observation provides valuable insights into the potential biological and clinical distinctions between OLP and OLL, which should be further explored in future research.
Despite these insights, several limitations should be acknowledged. First, the integration of multiple bulk RNA-seq datasets may introduce residual batch effects despite correction. The transcriptomic- defined subtypes (Subtype A and Subtype B) require further validation in clinical settings using accessible methods such as IHC for representative markers. Second, the cross-sectional nature of our clinical cohort limits causal inference. Longitudinal studies are required to determine whether B/plasma cell infiltration can predict lesion severity or recurrence. The distinction between OLP and OLL should be considered when interpreting immune infiltration patterns; Future studies with larger, prospectively collected cohorts are needed to explore potential differences. Third, spatial relationships between B cells and T cell subsets were not directly assessed. Multiplex imaging or Spatial transcriptomics will be valuable in elucidating intercellular interactions. Finally, the functional mechanisms of plasma cells remain incompletely understood. Underscoring the need for future studies integrating cytokine profiling and co-localization of immunoglobulins with plasma cells to clarify their pathogenic roles in OLP/OLL.
5 Conclusion
In summary, this study suggests a potential involvement of TLS-associated humoral immune responses in the pathogenesis and progression of OLP and OLL (Figure 7). Our findings demonstrate that B cells and plasma cells are strongly associated with disease severity and recurrence and may serve as prognostic biomarkers or therapeutic targets. This work advances our understanding of OLP/OLL immunopathology and lays the groundwork for future immune subtype–based precision management strategies.
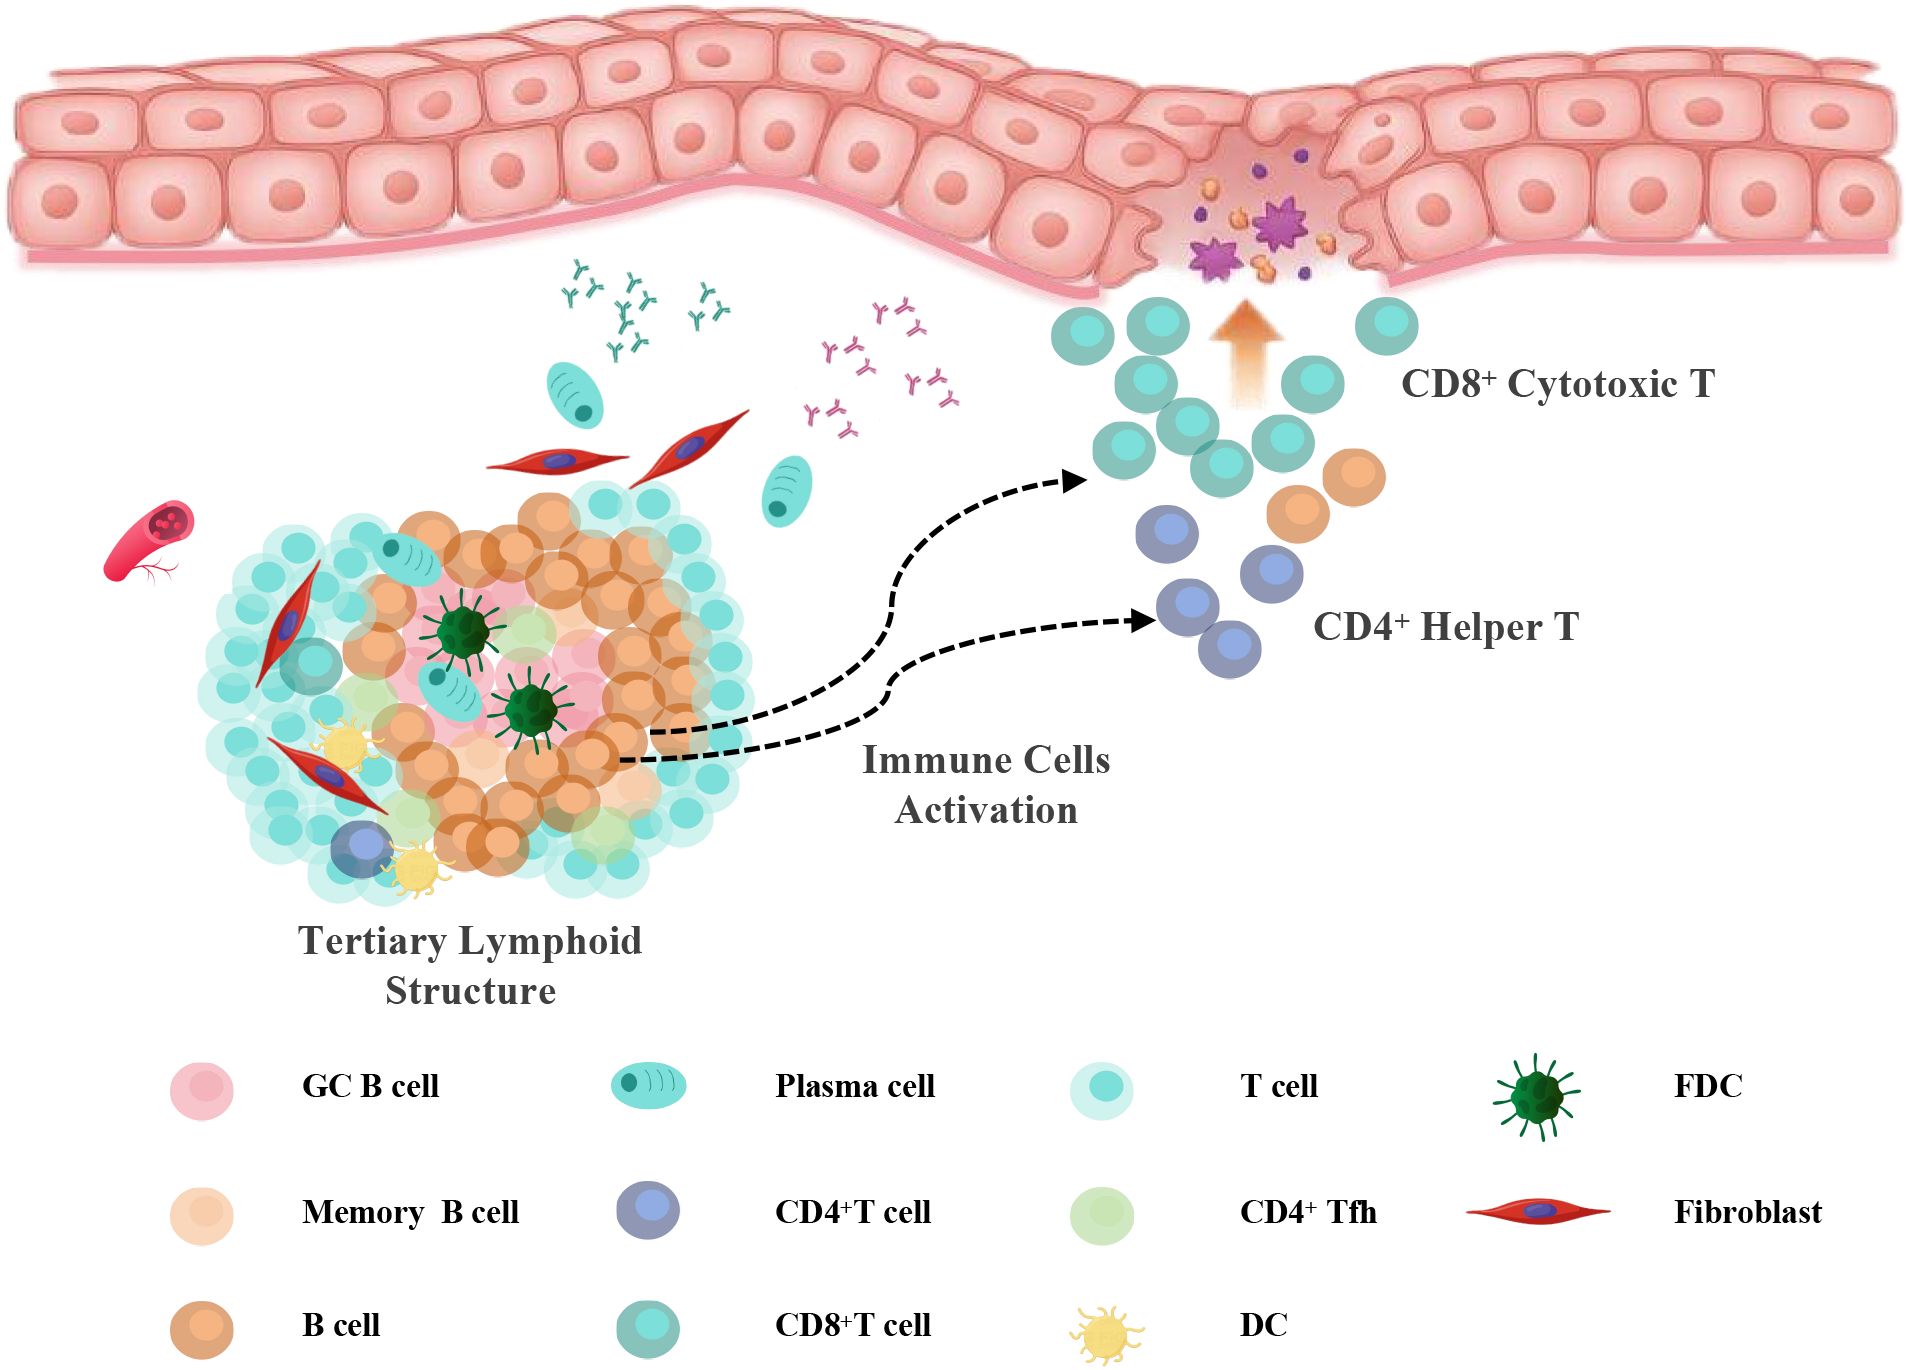
Figure 7. Working model. Schematic illustration of TLS-associated immune activation in OLP/OLL. In response to chronic antigenic stimulation, tertiary lymphoid structures (TLSs) develop in the subepithelial region, comprising B cells, follicular helper T (Tfh) cells, dendritic cells (DCs), and follicular dendritic cells (FDCs). Within TLSs, B cells undergo maturation and differentiate into plasma cells under the influence of Tfh- and DC-derived signals. Concurrently, B cells may function as antigen-presenting cells that activate CD4+ helper T cells and, under certain conditions, contribute to CD8+ T cell activation. These activated T cells migrate toward the epithelial interface, where they amplify inflammation and induce mucosal injury, contributing to the pathogenesis of erosive and recurrent OLP/OLL.
Data availability statement
The datasets presented in this study can be found in online repositories. The names of the repository/repositories and accession number(s) can be found in the article/Supplementary Material.
Ethics statement
The studies involving humans were approved by Ethics Committee of Shanghai Ninth People’s Hospital, Shanghai Jiao Tong University School of Medicine. The studies were conducted in accordance with the local legislation and institutional requirements. The participants provided their written informed consent to participate in this study.
Author contributions
XY: Formal Analysis, Methodology, Writing – original draft. AD: Formal Analysis, Methodology, Writing – original draft. YL: Methodology, Writing – original draft. LP: Data curation, Investigation, Software, Writing – original draft. YD: Formal Analysis, Funding acquisition, Writing – original draft. XS: Data curation, Resources, Validation, Writing – original draft. XH: Data curation, Writing – review & editing, Methodology. LS: Writing – original draft, Resources, Visualization. YW: Writing – review & editing, Funding acquisition, Supervision. GT: Writing – review & editing, Funding acquisition, Supervision.
Funding
The author(s) declare financial support was received for the research and/or publication of this article. This work was supported by a grant from the National Natural Science Foundation of China (82270976, 82020108010, 82205200).
Conflict of interest
The authors declare that the research was conducted in the absence of any commercial or financial relationships that could be construed as a potential conflict of interest.
Generative AI statement
The author(s) declare that no Generative AI was used in the creation of this manuscript.
Any alternative text (alt text) provided alongside figures in this article has been generated by Frontiers with the support of artificial intelligence and reasonable efforts have been made to ensure accuracy, including review by the authors wherever possible. If you identify any issues, please contact us.
Publisher’s note
All claims expressed in this article are solely those of the authors and do not necessarily represent those of their affiliated organizations, or those of the publisher, the editors and the reviewers. Any product that may be evaluated in this article, or claim that may be made by its manufacturer, is not guaranteed or endorsed by the publisher.
Supplementary material
The Supplementary Material for this article can be found online at: https://www.frontiersin.org/articles/10.3389/fimmu.2025.1667976/full#supplementary-material
References
1. Society of Oral M, Chinese Stomatological A. Guideline for the diagnosis and treatment of oral lichen planus (revision). Zhonghua Kou Qiang Yi Xue Za Zhi. (2022) 57:115–21. doi: 10.3760/cma.j.cn112144-20211115-00505
2. Wu T, Bai Y, Jing Y, and Chen F. What can we learn from treatments of oral lichen planus? Front Cell Infect Microbiol. (2024) 14:1279220. doi: 10.3389/fcimb.2024.1279220
3. Qing M, Yang D, Shang Q, Peng J, Deng J, Lu J, et al. CD8(+) tissue-resident memory T cells induce oral lichen planus erosion via cytokine network. Elife. (2023) 12:e83981. doi: 10.7554/eLife.83981
4. Zotti F, Nocini R, Capocasale G, Bertossi D, Fior A, Peretti M, et al. Oral Lichen Planus: risk factors of Malignant transformation and follow up. Ten years retrospective study. J Clin Exp Dent. (2021) 13:e630–e6. doi: 10.4317/jced.57688
5. El-Howati A, Thornhill MH, Colley HE, and Murdoch C. Immune mechanisms in oral lichen planus. Oral Dis. (2023) 29:1400–15. doi: 10.1111/odi.14142
6. Carrozzo M, Porter S, Mercadante V, and Fedele S. Oral lichen planus: A disease or a spectrum of tissue reactions? Types, causes, diagnostic algorhythms, prognosis, management strategies. Periodontol 2000. (2019) 80:105–25. doi: 10.1111/prd.12260
7. Zhou XJ, Sugerman PB, Savage NW, Walsh LJ, and Seymour GJ. Intra-epithelial CD8+ T cells and basement membrane disruption in oral lichen planus. J Oral Pathol Med. (2002) 31:23–7. doi: 10.1046/j.0904-2512.2001.10063.x
8. Deng X, Wang Y, Jiang L, Li J, and Chen Q. Updates on immunological mechanistic insights and targeting of the oral lichen planus microenvironment. Front Immunol. (2022) 13:1023213. doi: 10.3389/fimmu.2022.1023213
9. Husein-ElAhmed H and Steinhoff M. Potential role of INTERLEUKIN-17 in the pathogenesis of oral lichen planus: a systematic review with META-analysis. J Eur Acad Dermatol Venereol. (2022) 36:1735–44. doi: 10.1111/jdv.18219
10. Wang H, Bai J, Luo Z, Fu J, Wang H, and Sun Z. Overexpression and varied clinical significance of Th9 versus Th17 cells in distinct subtypes of oral lichen planus. Arch Oral Biol. (2017) 80:110–6. doi: 10.1016/j.archoralbio.2017.04.003
11. Raybaud H, Olivieri CV, Lupi-Pegurier L, Pagnotta S, Marsault R, Cardot-Leccia N, et al. Epstein-barr virus-infected plasma cells infiltrate erosive oral lichen planus. J Dent Res. (2018) 97:1494–500. doi: 10.1177/0022034518788282
12. Qing M, Yang D, Shang Q, Li W, Zhou Y, Xu H, et al. Humoral immune disorders affect clinical outcomes of oral lichen planus. Oral Dis. (2024) 30:2337–46. doi: 10.1111/odi.14667
13. Mahdavi N, Aminishakib P, and Soltani N. Presence of B cells and plasma cells in oral lichen planus. J Dent (Shiraz). (2020) 21:209–14. doi: 10.30476/DENTJODS.2020.81804.0
14. Vlad CS, Vlad DC, Popescu R, Boruga VM, Istrate SL, Flangea C, et al. Oral lichen planus - case report. Rom J Morphol Embryol. (2020) 61:563–7. doi: 10.47162/RJME.61.2.28
15. Wang MY, Zhu WW, Zhang JY, Yu M, Zhai RD, and Liu LK. Tertiary lymphoid structures in oral lichen planus and oral epithelial dysplasia with lichenoid features: A comparative study. Oral Dis. (2023) 29:154–64. doi: 10.1111/odi.14097
16. Becker PD, Ratnasothy K, Sen M, Peng Q, Romano M, Bazoer J, et al. B lymphocytes contribute to indirect pathway T cell sensitization via acquisition of extracellular vesicles. Am J Transplant. (2021) 21:1415–26. doi: 10.1111/ajt.16088
17. Li JJ, Song CC, Li CX, Xia RH, Deng YW, Wang YF, et al. Experimental study on the structure and immune cell phenotypes of the lymphoid tissues in oral lichenoid lesions. Shanghai Kou Qiang Yi Xue. (2021) 30:113–9. Available online at: https://www.ncbi.nlm.nih.gov/pubmed/34109346
18. Dafar A, Siarov A, Mostaghimi Y, Robledo-Sierra J, De Lara S, Giglio D, et al. and B cells in oral lichen planus and oral leukoplakia. Int J Dent. (2022) 2022:5430309. doi: 10.1155/2022/5430309
19. Li Q, Wang F, Shi Y, Zhong L, Duan S, Kuang W, et al. Single-cell immune profiling reveals immune responses in oral lichen planus. Front Immunol. (2023) 14:1182732. doi: 10.3389/fimmu.2023.1182732
20. Orlandini R, Jacinto R, Teixeira LR, Silva GA, Gallo CB, Innocentini L, et al. Evidence for a significant role of B-cells in the pathogenesis of oral lichen planus: Preliminary results of a cross-sectional study. J Cutan Pathol. (2020) 47:310–3. doi: 10.1111/cup.13636
21. Mattila R, Ahlfors E, and Syrjanen S. CD27 and CD38 lymphocytes are detected in oral lichen planus lesions. Oral Surg Oral Med Oral Pathol Oral Radiol Endod. (2011) 111:211–7. doi: 10.1016/j.tripleo.2010.09.075
22. Sautes-Fridman C, Verneau J, Sun CM, Moreira M, Chen TW, Meylan M, et al. Tertiary Lymphoid Structures and B cells: Clinical impact and therapeutic modulation in cancer. Semin Immunol. (2020) 48:101406. doi: 10.1016/j.smim.2020.101406
23. Gago da Graca C, van Baarsen LGM, and Mebius RE. Tertiary lymphoid structures: diversity in their development, composition, and role. J Immunol. (2021) 206:273–81. doi: 10.4049/jimmunol.2000873
24. Sautes-Fridman C, Petitprez F, Calderaro J, and Fridman WH. Tertiary lymphoid structures in the era of cancer immunotherapy. Nat Rev Cancer. (2019) 19:307–25. doi: 10.1038/s41568-019-0144-6
25. Ruddle NH. High endothelial venules and lymphatic vessels in tertiary lymphoid organs: characteristics, functions, and regulation. Front Immunol. (2016) 7:491. doi: 10.3389/fimmu.2016.00491
26. Germain C, Gnjatic S, Tamzalit F, Knockaert S, Remark R, Goc J, et al. Presence of B cells in tertiary lymphoid structures is associated with a protective immunity in patients with lung cancer. Am J Respir Crit Care Med. (2014) 189:832–44. doi: 10.1164/rccm.201309-1611OC
27. Hiraoka N, Ino Y, Yamazaki-Itoh R, Kanai Y, Kosuge T, and Shimada K. Intratumoral tertiary lymphoid organ is a favourable prognosticator in patients with pancreatic cancer. Br J Cancer. (2015) 112:1782–90. doi: 10.1038/bjc.2015.145
28. Manzo A, Bombardieri M, Humby F, and Pitzalis C. Secondary and ectopic lymphoid tissue responses in rheumatoid arthritis: from inflammation to autoimmunity and tissue damage/remodeling. Immunol Rev. (2010) 233:267–85. doi: 10.1111/j.0105-2896.2009.00861.x
29. Lai YR, Pan L, Jiang XK, Deng YW, Feng MH, Li J, et al. CCL19(+) fibroblasts promote tertiary lymphoid structure in oral lichen planus: A retrospective study. Oral Dis. (2025) 31:2191–205. doi: 10.1111/odi.15266
30. Feng MH, Lai YR, Deng YW, Li XY, Pan L, Tian Z, et al. B cells infiltration potentially responded better to systemic corticoids in oral lichen planus and oral lichenoid lesions. Inflammation. (2024) 48(3):1235–44. doi: 10.1007/s10753-024-02112-4
31. Cheng YS, Gould A, Kurago Z, Fantasia J, and Muller S. Diagnosis of oral lichen planus: a position paper of the American Academy of Oral and Maxillofacial Pathology. Oral Surg Oral Med Oral Pathol Oral Radiol. (2016) 122:332–54. doi: 10.1016/j.oooo.2016.05.004
32. Louisy A, Humbert E, and Samimi M. Oral lichen planus: an update on diagnosis and management. Am J Clin Dermatol. (2024) 25:35–53. doi: 10.1007/s40257-023-00814-3
33. Chen QM, Deng JX, and Zeng X. Development and chinization of diagnostic criteria for oral lichen planus. Zhonghua Kou Qiang Yi Xue Za Zhi. (2020) 55:191–5. doi: 10.3760/cma.j.issn.1002-0098.2020.03.010
34. Kamath VV, Setlur K, and Yerlagudda K. Oral lichenoid lesions - a review and update. Indian J Dermatol. (2015) 60:102. doi: 10.4103/0019-5154.147830
35. Campana F, Lan R, Girard C, Rochefort J, Le Pelletier F, Leroux-Villet C, et al. French guidelines for the management of oral lichen planus (excluding pharmacological therapy). Ann Dermatol Venereol. (2022) 149:14–27. doi: 10.1016/j.annder.2021.04.003
36. Bindea G, Mlecnik B, Hackl H, Charoentong P, Tosolini M, Kirilovsky A, et al. ClueGO: a Cytoscape plug-in to decipher functionally grouped gene ontology and pathway annotation networks. Bioinformatics. (2009) 25:1091–3. doi: 10.1093/bioinformatics/btp101
37. Park HK, Hurwitz S, and Woo SB. Oral lichen planus: REU scoring system correlates with pain. Oral Surg Oral Med Oral Pathol Oral Radiol. (2012) 114:75–82. doi: 10.1016/j.oooo.2012.02.013
38. Cabrita R, Lauss M, Sanna A, Donia M, Skaarup Larsen M, Mitra S, et al. Author Correction: Tertiary lymphoid structures improve immunotherapy and survival in melanoma. Nature. (2020) 580:E1. doi: 10.1038/s41586-020-2155-6
39. Meylan M, Sautes-Fridman C, and Fridman WH. Tertiary lymphoid structures generate and propagate anti-tumor antibody-producing plasma cells in renal cell cancer. Med Sci (Paris). (2022) 38:536–8. doi: 10.1051/medsci/2022069
40. Lukac J, Brozovic S, Vucicevic-Boras V, Mravak-Stipetic M, Malenica B, and Kusic Z. Serum autoantibodies to desmogleins 1 and 3 in patients with oral lichen planus. Croat Med J. (2006) 47:53–8. Available online at: https://www.ncbi.nlm.nih.gov/pubmed/16489697
41. Rambhia KD, Kharkar V, Pradhan V, Patwardhan M, Ghosh K, and Khopkar US. A study of prevalence of autoantibodies in patients with lichen planus from Mumbai, India. Indian J Dermatol Venereol Leprol. (2018) 84:667–71. doi: 10.4103/ijdvl.IJDVL_182_17
42. Kinjyo C, Kaneko T, Korekawa A, Rokunohe A, Aizu T, Matsuzaki Y, et al. Oral lichen planus with antibodies to desmogleins 1 and 3. J Dermatol. (2015) 42:40–1. doi: 10.1111/1346-8138.12661
43. Didona D and Hertl M. Detection of anti-desmoglein antibodies in oral lichen planus: What do we know so far. Front Immunol. (2022) 13:1001970. doi: 10.3389/fimmu.2022.1001970
44. Parmentier L, Bron BA, Prins C, Samson J, Masouye I, and Borradori L. Mucocutaneous lichen planus with esophageal involvement: successful treatment with an anti-CD20 monoclonal antibody. Arch Dermatol. (2008) 144:1427–30. doi: 10.1001/archderm.144.11.1427
45. Fridman WH, Meylan M, Petitprez F, Sun CM, Italiano A, and Sautes-Fridman C. B cells and tertiary lymphoid structures as determinants of tumour immune contexture and clinical outcome. Nat Rev Clin Oncol. (2022) 19:441–57. doi: 10.1038/s41571-022-00619-z
46. Fridman WH, Petitprez F, Meylan M, Chen TW, Sun CM, Roumenina LT, et al. B cells and cancer: To B or not to B? J Exp Med. (2021) 218(1):e20200851. doi: 10.1084/jem.20200851
47. Laumont CM, Banville AC, Gilardi M, Hollern DP, and Nelson BH. Tumour-infiltrating B cells: immunological mechanisms, clinical impact and therapeutic opportunities. Nat Rev Cancer. (2022) 22:414–30. doi: 10.1038/s41568-022-00466-1
48. Petitprez F, de Reynies A, Keung EZ, Chen TW, Sun CM, Calderaro J, et al. B cells are associated with survival and immunotherapy response in sarcoma. Nature. (2020) 577:556–60. doi: 10.1038/s41586-019-1906-8
49. Helmink BA, Reddy SM, Gao J, Zhang S, Basar R, Thakur R, et al. B cells and tertiary lymphoid structures promote immunotherapy response. Nature. (2020) 577:549–55. doi: 10.1038/s41586-019-1922-8
50. Kroeger DR, Milne K, and Nelson BH. Tumor-infiltrating plasma cells are associated with tertiary lymphoid structures, cytolytic T-cell responses, and superior prognosis in ovarian cancer. Clin Cancer Res. (2016) 22:3005–15. doi: 10.1158/1078-0432.CCR-15-2762
51. Berntsson J, Nodin B, Eberhard J, Micke P, and Jirstrom K. Prognostic impact of tumour-infiltrating B cells and plasma cells in colorectal cancer. Int J Cancer. (2016) 139:1129–39. doi: 10.1002/ijc.30138
52. Ruffin AT, Cillo AR, Tabib T, Liu A, Onkar S, Kunning SR, et al. B cell signatures and tertiary lymphoid structures contribute to outcome in head and neck squamous cell carcinoma. Nat Commun. (2021) 12:3349. doi: 10.1038/s41467-021-23355-x
53. Weiner AB, Vidotto T, Liu Y, Mendes AA, Salles DC, Faisal FA, et al. Plasma cells are enriched in localized prostate cancer in Black men and are associated with improved outcomes. Nat Commun. (2021) 12:935. doi: 10.1038/s41467-021-21245-w
54. Schmidt M, Micke P, Gehrmann M, and Hengstler JG. Immunoglobulin kappa chain as an immunologic biomarker of prognosis and chemotherapy response in solid tumors. Oncoimmunology. (2012) 1:1156–8. doi: 10.4161/onci.21653
55. Hua Z and Hou B. The role of B cell antigen presentation in the initiation of CD4+ T cell response. Immunol Rev. (2020) 296:24–35. doi: 10.1111/imr.12859
56. Kambayashi T and Laufer TM. Atypical MHC class II-expressing antigen-presenting cells: can anything replace a dendritic cell? Nat Rev Immunol. (2014) 14:719–30. doi: 10.1038/nri3754
57. Hong S, Zhang Z, Liu H, Tian M, Zhu X, Zhang Z, et al. B cells are the dominant antigen-presenting cells that activate naive CD4(+) T cells upon immunization with a virus-derived nanoparticle antigen. Immunity. (2018) 49:695–708 e4. doi: 10.1016/j.immuni.2018.08.012
58. Hon H, Oran A, Brocker T, and Jacob J. B lymphocytes participate in cross-presentation of antigen following gene gun vaccination. J Immunol. (2005) 174:5233–42. doi: 10.4049/jimmunol.174.9.5233
59. Marino E, Tan B, Binge L, Mackay CR, and Grey ST. B-cell cross-presentation of autologous antigen precipitates diabetes. Diabetes. (2012) 61:2893–905. doi: 10.2337/db12-0006
60. Nielsen JS, Sahota RA, Milne K, Kost SE, Nesslinger NJ, Watson PH, et al. CD20+ tumor-infiltrating lymphocytes have an atypical CD27- memory phenotype and together with CD8+ T cells promote favorable prognosis in ovarian cancer. Clin Cancer Res. (2012) 18:3281–92. doi: 10.1158/1078-0432.CCR-12-0234
61. Gnjatic S, Atanackovic D, Jager E, Matsuo M, Selvakumar A, Altorki NK, et al. Survey of naturally occurring CD4+ T cell responses against NY-ESO-1 in cancer patients: correlation with antibody responses. Proc Natl Acad Sci U S A. (2003) 100:8862–7. doi: 10.1073/pnas.1133324100
62. Marino E, Tan B, Binge L, Mackay CR, and Grey ST. B-cell cross-presentation of autologous antigen precipitates diabetes. Diabetes. (2012) 61:2893–905. doi: 10.2337/db12-0006
63. Bruno TC, Ebner PJ, Moore BL, Squalls OG, Waugh KA, Eruslanov EB, et al. Antigen-presenting intratumoral B cells affect CD4(+) TIL phenotypes in non-small cell lung cancer patients. Cancer Immunol Res. (2017) 5:898–907. doi: 10.1158/2326-6066.CIR-17-0075
64. Jahrsdorfer B, Blackwell SE, Wooldridge JE, Huang J, Andreski MW, Jacobus LS, et al. B-chronic lymphocytic leukemia cells and other B cells can produce granzyme B and gain cytotoxic potential after interleukin-21-based activation. Blood. (2006) 108:2712–9. doi: 10.1182/blood-2006-03-014001
65. Yang XJ, Lai YR, Jiang XK, Deng YW, Pan L, Dai AN, et al. Comprehensive analysis of the structural phenotypes and functional characteristics of B cells in oral lichen planus and oral lichenoid lesions through single-cell and spatial transcriptomics. Zhonghua Kou Qiang Yi Xue Za Zhi. (2025) 60:201–10. doi: 10.3760/cma.j.cn112144-20241220-00500
66. Huang H, Benoist C, and Mathis D. Rituximab specifically depletes short-lived autoreactive plasma cells in a mouse model of inflammatory arthritis. Proc Natl Acad Sci U S A. (2010) 107:4658–63. doi: 10.1073/pnas.1001074107
67. Boyerinas B, Jochems C, Fantini M, Heery CR, Gulley JL, Tsang KY, et al. Antibody-dependent cellular cytotoxicity activity of a novel anti-PD-L1 antibody avelumab (MSB0010718C) on human tumor cells. Cancer Immunol Res. (2015) 3:1148–57. doi: 10.1158/2326-6066.CIR-15-0059
68. Carmi Y, Spitzer MH, Linde IL, Burt BM, Prestwood TR, Perlman N, et al. Allogeneic IgG combined with dendritic cell stimuli induce antitumour T-cell immunity. Nature. (2015) 521:99–104. doi: 10.1038/nature14424
69. Welinder C, Jirstrom K, Lehn S, Nodin B, Marko-Varga G, Blixt O, et al. Intra-tumour IgA1 is common in cancer and is correlated with poor prognosis in bladder cancer. Heliyon. (2016) 2:e00143. doi: 10.1016/j.heliyon.2016.e00143
70. Shalapour S, Lin XJ, Bastian IN, Brain J, Burt AD, Aksenov AA, et al. Author Correction: Inflammation-induced IgA(+) cells dismantle anti-liver cancer immunity. Nature. (2018) 561:E1. doi: 10.1038/s41586-018-0304-y
71. Biswas S, Mandal G, Payne KK, Anadon CM, Gatenbee CD, Chaurio RA, et al. IgA transcytosis and antigen recognition govern ovarian cancer immunity. Nature. (2021) 591:464–70. doi: 10.1038/s41586-020-03144-0
72. Shalapour S, Font-Burgada J, Di Caro G, Zhong Z, Sanchez-Lopez E, Dhar D, et al. Immunosuppressive plasma cells impede T-cell-dependent immunogenic chemotherapy. Nature. (2015) 521:94–8. doi: 10.1038/nature14395
73. Mao F, Dong Y, Wang Z, Cai L, Pan D, Zhang C, et al. Direct immunofluorescence and immune function in patients with oral lichen planus. J Dent Sci. (2022) 17:795–801. doi: 10.1016/j.jds.2021.10.002
74. Bao J, Betzler AC, Hess J, and Brunner C. Corrigendum: Exploring the dual role of B cells in solid tumors: implications for head and neck squamous cell carcinoma. Front Immunol. (2023) 14:1327795. doi: 10.3389/fimmu.2023.1327795
75. Sharonov GV, Serebrovskaya EO, Yuzhakova DV, Britanova OV, and Chudakov DM. B cells, plasma cells and antibody repertoires in the tumour microenvironment. Nat Rev Immunol. (2020) 20:294–307. doi: 10.1038/s41577-019-0257-x
76. Zhang Y, Liu G, Zeng Q, Wu W, Lei K, Zhang C, et al. CCL19-producing fibroblasts promote tertiary lymphoid structure formation enhancing anti-tumor IgG response in colorectal cancer liver metastasis. Cancer Cell. (2024) 42:1370–85 e9. doi: 10.1016/j.ccell.2024.07.006
77. Wang ZM, Zhang J, Wang F, and Zhou G. The tipped balance of ILC1/ILC2 in peripheral blood of oral lichen planus is related to inflammatory cytokines. Front Cell Dev Biol. (2021) 9:725169. doi: 10.3389/fcell.2021.725169
78. Li XY, Pan L, Deng YW, Chen JJ, Tian Z, Tang GY, et al. Variable innate lymphoid cells predominancy in oral lichen planus latently led to diverse clinical outcomes: a proof-of-concept study. Front Immunol. (2025) 16:1551311. doi: 10.3389/fimmu.2025.1551311
79. van der Meij EH and van der Waal I. Lack of clinicopathologic correlation in the diagnosis of oral lichen planus based on the presently available diagnostic criteria and suggestions for modifications. J Oral Pathol Med. (2003) 32:507–12. doi: 10.1034/j.1600-0714.2003.00125.x
80. Lodolo M, Gobbo M, Bussani R, Torelli L, Rupel K, Ottaviani G, et al. Histopathology of oral lichen planus and oral lichenoid lesions: An exploratory cross-sectional study. Oral Dis. (2023) 29:1259–68. doi: 10.1111/odi.14112
81. Mravak-Stipetic M, Loncar-Brzak B, Bakale-Hodak I, Sabol I, Seiwerth S, Majstorovic M, et al. Clinicopathologic correlation of oral lichen planus and oral lichenoid lesions: a preliminary study. ScientificWorldJournal. (2014) 2014:746874. doi: 10.1155/2014/746874
Keywords: tertiary lymphoid structure, oral lichen planus, B cells, plasma cells, humoral immunity, immune subtyping
Citation: Yang X, Dai A, Lai Y, Pan L, Deng Y, Shen X, Han X, Sun L, Wang Y and Tang G (2025) Humoral immune activation within tertiary lymphoid structures is correlated with poor outcomes in oral lichen planus and lichenoid lesions. Front. Immunol. 16:1667976. doi: 10.3389/fimmu.2025.1667976
Received: 17 July 2025; Accepted: 10 October 2025;
Published: 22 October 2025.
Edited by:
Takao Fukuda, Kyushu University, JapanCopyright © 2025 Yang, Dai, Lai, Pan, Deng, Shen, Han, Sun, Wang and Tang. This is an open-access article distributed under the terms of the Creative Commons Attribution License (CC BY). The use, distribution or reproduction in other forums is permitted, provided the original author(s) and the copyright owner(s) are credited and that the original publication in this journal is cited, in accordance with accepted academic practice. No use, distribution or reproduction is permitted which does not comply with these terms.
*Correspondence: Guoyao Tang, dGFuZ2d5QHNoc211LmVkdS5jbg==; Yufeng Wang, d2FuZ3lmMTcwMUBzanR1LmVkdS5jbg==
†These authors have contributed equally to this work and share first authorship