 Miguel Resanoa1
 Mounia S. Braza
- 1Department of Surgical Pathology, University Hospital of Navarra, Navarra, Pamplona, Spain
- 2Biogipuzkoa Health Research Institute, San Sebastian, Spain
- 3Department of Oncological Sciences, Icahn School of Medicine at Mount Sinai, New York, NY, United States
- 4Ikerbasque Basque Foundation for Science, Bilbao, Spain
Diffuse large B-cell lymphoma (DLBCL) is one of the most frequent B-cell non-Hodgkin lymphoma types. It is characterized by a complex immune microenvironment, rich in macrophages (innate immunity cells), and high aggressiveness. DLBCL cells might respond to the increased energy demand by enhancing key metabolic processes, such as autophagy in which damaged cell constituents and debris are sequestered/removed for recycling. Here, we investigated the autophagy gene expression profile in DLBCL and in non-tumor controls using publicly available gene expression datasets and a substantial cohort of patients’ tissue samples. For the first time, we describe in the DLBCL microenvironment, a differential autophagy gene expression profile characterized by overexpression of BCL2 (anti-apoptotic factor) in M1 pro-inflammatory macrophages compared with M2 immuno-suppressive macrophages. Moreover, the expression levels of CD86 (M1 macrophage marker) and CSF1R (M2 macrophage marker) were positively correlated with those of BECN1 (autophagy regulator) and BCL2 (only CD86) that were in turn correlated with MTOR expression in tumor B cells and in the CD86+ macrophage subtype. We confirmed these results by immunohistochemistry and immunofluorescence analyses of DLBCL and non-tumor tissue samples. Our finding of an autophagy-related pro-inflammatory signature highlights the crucial role of autophagy in the DLBCL immune microenvironment and suggests its potential as a therapeutic target.
Introduction
Most lymphoid tissue malignancies (90%) are classified as non-Hodgkin lymphomas (NHL). This group of blood cancers is characterized by a complex and deregulated immunological response (1) due to specific tumor-supportive cells that become corrupted/biased when interacting with tumor B cells (2, 3). Diffuse large B-cell lymphoma (DLBCL) is one of the most common NHL types. It is characterized by a highly proliferative behavior and morphological heterogeneity with a diffuse architecture: most tumor lymph nodes do not show a regular morphology because of the infiltration by medium-to-large B cells with huge nucleoli and cytoplasm. These features explain the variable clinical course and response to therapy (1, 4–7). Moreover, this aggressive and very active cancer has an increased energy demand and therefore, its metabolism deregulation (for instance, through autophagy and apoptosis alterations) could be targeted by new therapeutics (8, 9).
Autophagy is a key metabolic process in which unnecessary or dysfunctional cellular components are removed through degradation/recycling (10–13). Autophagy can have tumor suppressive or tumor supportive roles, depending on the cancer origin and type, and the tumor microenvironment composition (13–16). Beclin-1 (encoded by the BECN1 gene) is a key autophagy factor involved in the initiation of this process (17). However, when deregulated, it could play a tumorigenic role (18). Moreover, beclin-1 physiologically interacts with Bcl-2 (encoded by the BCL2 gene), an important anti-apoptotic protein that is overexpressed and often mutated in follicular lymphoma and DLBCL (19). Their interaction regulates autophagy by determining the fate (autophagy or apoptosis) of the concerned cells (17).
We previously showed that the DLBCL immune microenvironment is characterized by a strong infiltration of pro-inflammatory M1 macrophages that promote the inflammatory state in this lymphoma (20). We also found that SIRT1 (a metabolic function regulator implicated in autophagy) is overexpressed in DLBCL and its expression level is correlated with the infiltration of pro-inflammatory M1 macrophages and linked to a pro-autophagic signature (under revision). Therefore, in the present study, we wanted to determine the autophagy and apoptosis gene expression profiles in DLBCL, particularly in M1 macrophages. To this aim, we exploited publicly available gene expression data on 48 DLBCL (TCGA database) and 337 control (GTEx database) samples. Then, we validated these results in independent DLBCL (n=128) and control (n=20) samples included in different tissue microarrays (TMA). Overall, we found that in the DLBCL microenvironment, key autophagy and apoptosis factors were upregulated. However, by comparing their expression profiles in the M1 and M2 macrophage subtypes, BECN1 and BCL2 were overexpressed only in pro-inflammatory M1 macrophages and correlated with mTOR expression.
Materials and methods
Computational biology datasets
To perform the bioinformatics analysis, we used a TCGA dataset of 48 DLBCL tumor samples (patients’ characteristics in Supplementary Table S1, Supplementary Figure S1) and a GTEx dataset of 337 control samples.
Tissue microarray samples
For the immunohistochemistry (IHC) and immunofluorescence (IF) analyses, we used several commercially available TMAs: TMA1 (TissueArray, LY2086b) that includes 176 lymphoma samples of different subtypes (118 DLBCL, 3 Burkitt-like lymphoma, 5 follicular lymphoma, 1 mantle cell lymphoma, 4 plasma cell lymphoma, 7 anaplastic large cell lymphoma, 22 T-cell lymphoma, 4 angioimmunoblastic T-cell lymphoma, 12 Hodgkin’s lymphoma samples) and 16 lymph node samples as controls; TMA2 (TissueArray, MC1081) that includes 108 samples of different blood cancer types (20 leukemia, 10 DLBCL, 10 other non-Hodgkin’s lymphoma, 20 Hodgkin’s lymphoma, 11 plasma cell myeloma, 9 extramedullary plasmacytoma, 20 malignant thymoma samples), and 8 normal lymphoid organs as controls (2 lymph node, 2 spleen, 2 bone marrow and 2 thymus gland tissue samples); and TMA3 (TissueArray, CTRL141) that includes 14 controls (2 lymph node, 2 spleen, 2 bone marrow, 2 tonsil, 2 placenta, 2 appendix, and 2 thymus gland tissue samples, in duplicate). From these TMAs, we analyzed only 128 DLBCL and 38 control samples to validate the in silico findings at the protein level. Among the control samples, we used 20 non-tumor lymph nodes as negative controls and the other lymphoid organs (e.g. spleen, bone marrow) as positive controls to validate the IHC and IF staining protocols.
The patients’ characteristics are summarized in Supplementary Tables S2 (DLBCL samples) and S3 (controls).
Gene expression profiling interactive analysis
As previously described (20), we used the GEPIA server (21, 22) and its new version (23) and publicly available mRNA sequencing data for differential gene expression profiling in non-tumor control (GTEx dataset) and DLBCL (TCGA dataset) samples. Using the CIBERSORT-ABS, EPIC and quanTIseq tools, we performed a deconvolution analysis of each sample tool in TCGA/GTEx. For each bulk RNA sample, starting from the cell proportions, we performed downstream analyses, such as proportion, correlation, sub-expression and survival. We used boxplots to display the results of the gene expression and deconvolution analyses, and dot plots to summarize the results of the correlation analyses.
CBioPortal for cancer genomics
We used the CBioPortal server (https://www.cbioportal.org/) to transform the multimodal cancer genomic data of the TCGA DLBCL cohort into interactive graphs and to summarize the patients’ main characteristics, as previously described (24–26).
TIMER2.0
As previously described (27–29), we used the TIMER2.0 server (http://timer.cistrome.org/) and different algorithms, such as CIBERSORT-ABS and EPIC, for the deconvolution analysis of cell type and subtype signatures to evaluate the tumor-infiltrating immune cell types. We used the list of differentially expressed genes in DLBCL vs non-tumor samples to identify changes in tumor-infiltrating immune cell populations.
Immunohistochemistry procedure
For IHC, we used DLBCL and control samples in commercially available TMAs. After heat-induced epitope retrieval, we incubated sections (4 °C, overnight) with primary antibodies against CD86 (Novus Biologicals, AF141, USA), CSF1-R (Abcam, Ab183316, UK), beclin-1 (Abcam, ab11407, UK), Bcl-2 (Abcam, Ab182858, UK) and mTOR (Abcam, ab109268, UK), followed by incubation with biotin-streptavidin horseradish peroxidase-conjugated secondary antibodies and 3,3′ -diaminobenzidine. We scanned each slide with a Philips Pathology Scanner SG300 and analyzed the obtained images with the Philips IntelliSite Pathology Solution image management system. We used the IHCExpert artificial intelligence tool to quantify the percentage of positive cells per core. In addition, a pathologist (co-author in this manuscript) validated all the quantitative results using a light microscope (Olympus BX41, model U-DO). We evaluated the histoscore of each sample as previously described (20).
Immunofluorescence procedure
For IF staining, we used DLBCL and control samples in the same commercially available TMAs. After drying the TMA sections at 73°C for 10 minutes followed by dewaxing and rehydration using decreasing concentrations of alcohol, we performed antigen recovery by incubation in Tris-EDTA buffer, pH 9, in a microwave for 25 minutes. Then, after non-specific binding inhibition by incubation in 10% donkey serum for 1 hour, we incubated sections (4°C, overnight) with primary antibodies against CD20 (ab64088, Abcam, UK), CD68 (ab201340, ab213363, ab289671, Abcam, UK), CD86 and CSF1-R (AF141, NBP1-43362, Novus, UK), Bcl-2 (ab692, Abcam, UK), and mTOR (ab109268, Abcam, UK). This was followed by incubation with the secondary antibodies at room temperature for 1 hour and then with Sudan Black for 1 hour to reduce autofluorescence. We acquired images at 20X and 40X magnification with a Zeiss AxioObserver 7 microscope and ZEN, version 3.7. We quantified and qualified cell staining manually in triplicate in each TMA core (DLBCL and controls).
For IF data interpretation, particularly when specific antibodies could not be combined or used, we determined the peri-tumor (peri-T) and/or intra-tumor (intra-T) localization of the cells and their characteristics (size and morphology) to correlate the IF signal to the main cell population (macrophages and tumor cells). A pathologist (co-author in this manuscript) validated the analysis and results.
Statistical analysis
For quantitative data, we used fold changes, ranks and correlation coefficients. We considered significant p-values ≤ 0.05. For the TCGA and GTEx datasets, we evaluated the significance of the gene expression correlation analyses by computing the Pearson, Spearman and Kendall correlation coefficient values and P-values. In GEPIA, we used the non-log scale for calculation and the log-scale axis for visualization. As shown in the boxplots, we compared differential gene expression data, cell type proportions and sub-expression analyses between DLBCL and non-tumor control samples using one-way ANOVA. We used the Mantel–Cox test to estimate the survival contribution of specific autophagy- and inflammation-related genes expressed in DLBCL and displayed them as log10 hazard ratios (HR). We displayed the IHC and IF quantitative results as percentages ± SD and compared them with the two-tailed unpaired Student’s t-test.
Results
The expression levels of many autophagy and apoptosis factors are increased in the DLBCL microenvironment and are correlated with BCL2 and BECN1 expression
In our previous study, we identified a high pro-inflammatory signature in the macrophage-rich DLBCL microenvironment (20). Moreover, we found that SIRT1 and SIRT3, two sirtuins with key roles in metabolism regulation, are upregulated in the macrophage-rich DLBCL microenvironment and that SIRT1 expression is correlated with autophagy in M1 pro-inflammatory macrophages (under revision). Now, in the last part of this project, we asked whether autophagy is deregulated in M1 and M2 macrophages from the DLBCL microenvironment and whether the autophagy gene expression signatures are different in these macrophage subpopulations. To this aim, first, we compared the gene expression profiles of 48 DLBCL samples (TCGA database) and 337 healthy control samples (GTEx database). BECN1, NADPH, PARG and TPN were significantly upregulated in DLBCL samples compared with controls (p ≤ 0.05) (Figure 1A). Moreover, comparison of their expression in several cancer types (from the TCGA database) showed that BECN1 (the key autophagy factor) was specifically overexpressed in DLBCL samples (Supplementary Figure S2A). Therefore, we selected BECN1 as reference autophagy factor for the next analyses. Then, as the BCL2 anti-apoptosis factor is frequently overexpressed in NHL and specifically in DLBCL (30), we evaluated its expression profile in several cancer types (from the TCGA database) and we confirmed its overexpression specifically in DLBCL and acute myeloid leukemia (AML) (Supplementary Figure S2B). Therefore, we compared the expression profiles of the main apoptotic factors in the 48 DLBCL samples from the TCGA database and 337 healthy control samples. We found that BCL2, CASP3, CASP9 were significantly upregulated and CASP8 was significantly downregulated in the DLBCL samples compared with controls (p ≤ 0.05) (Figure 1B).
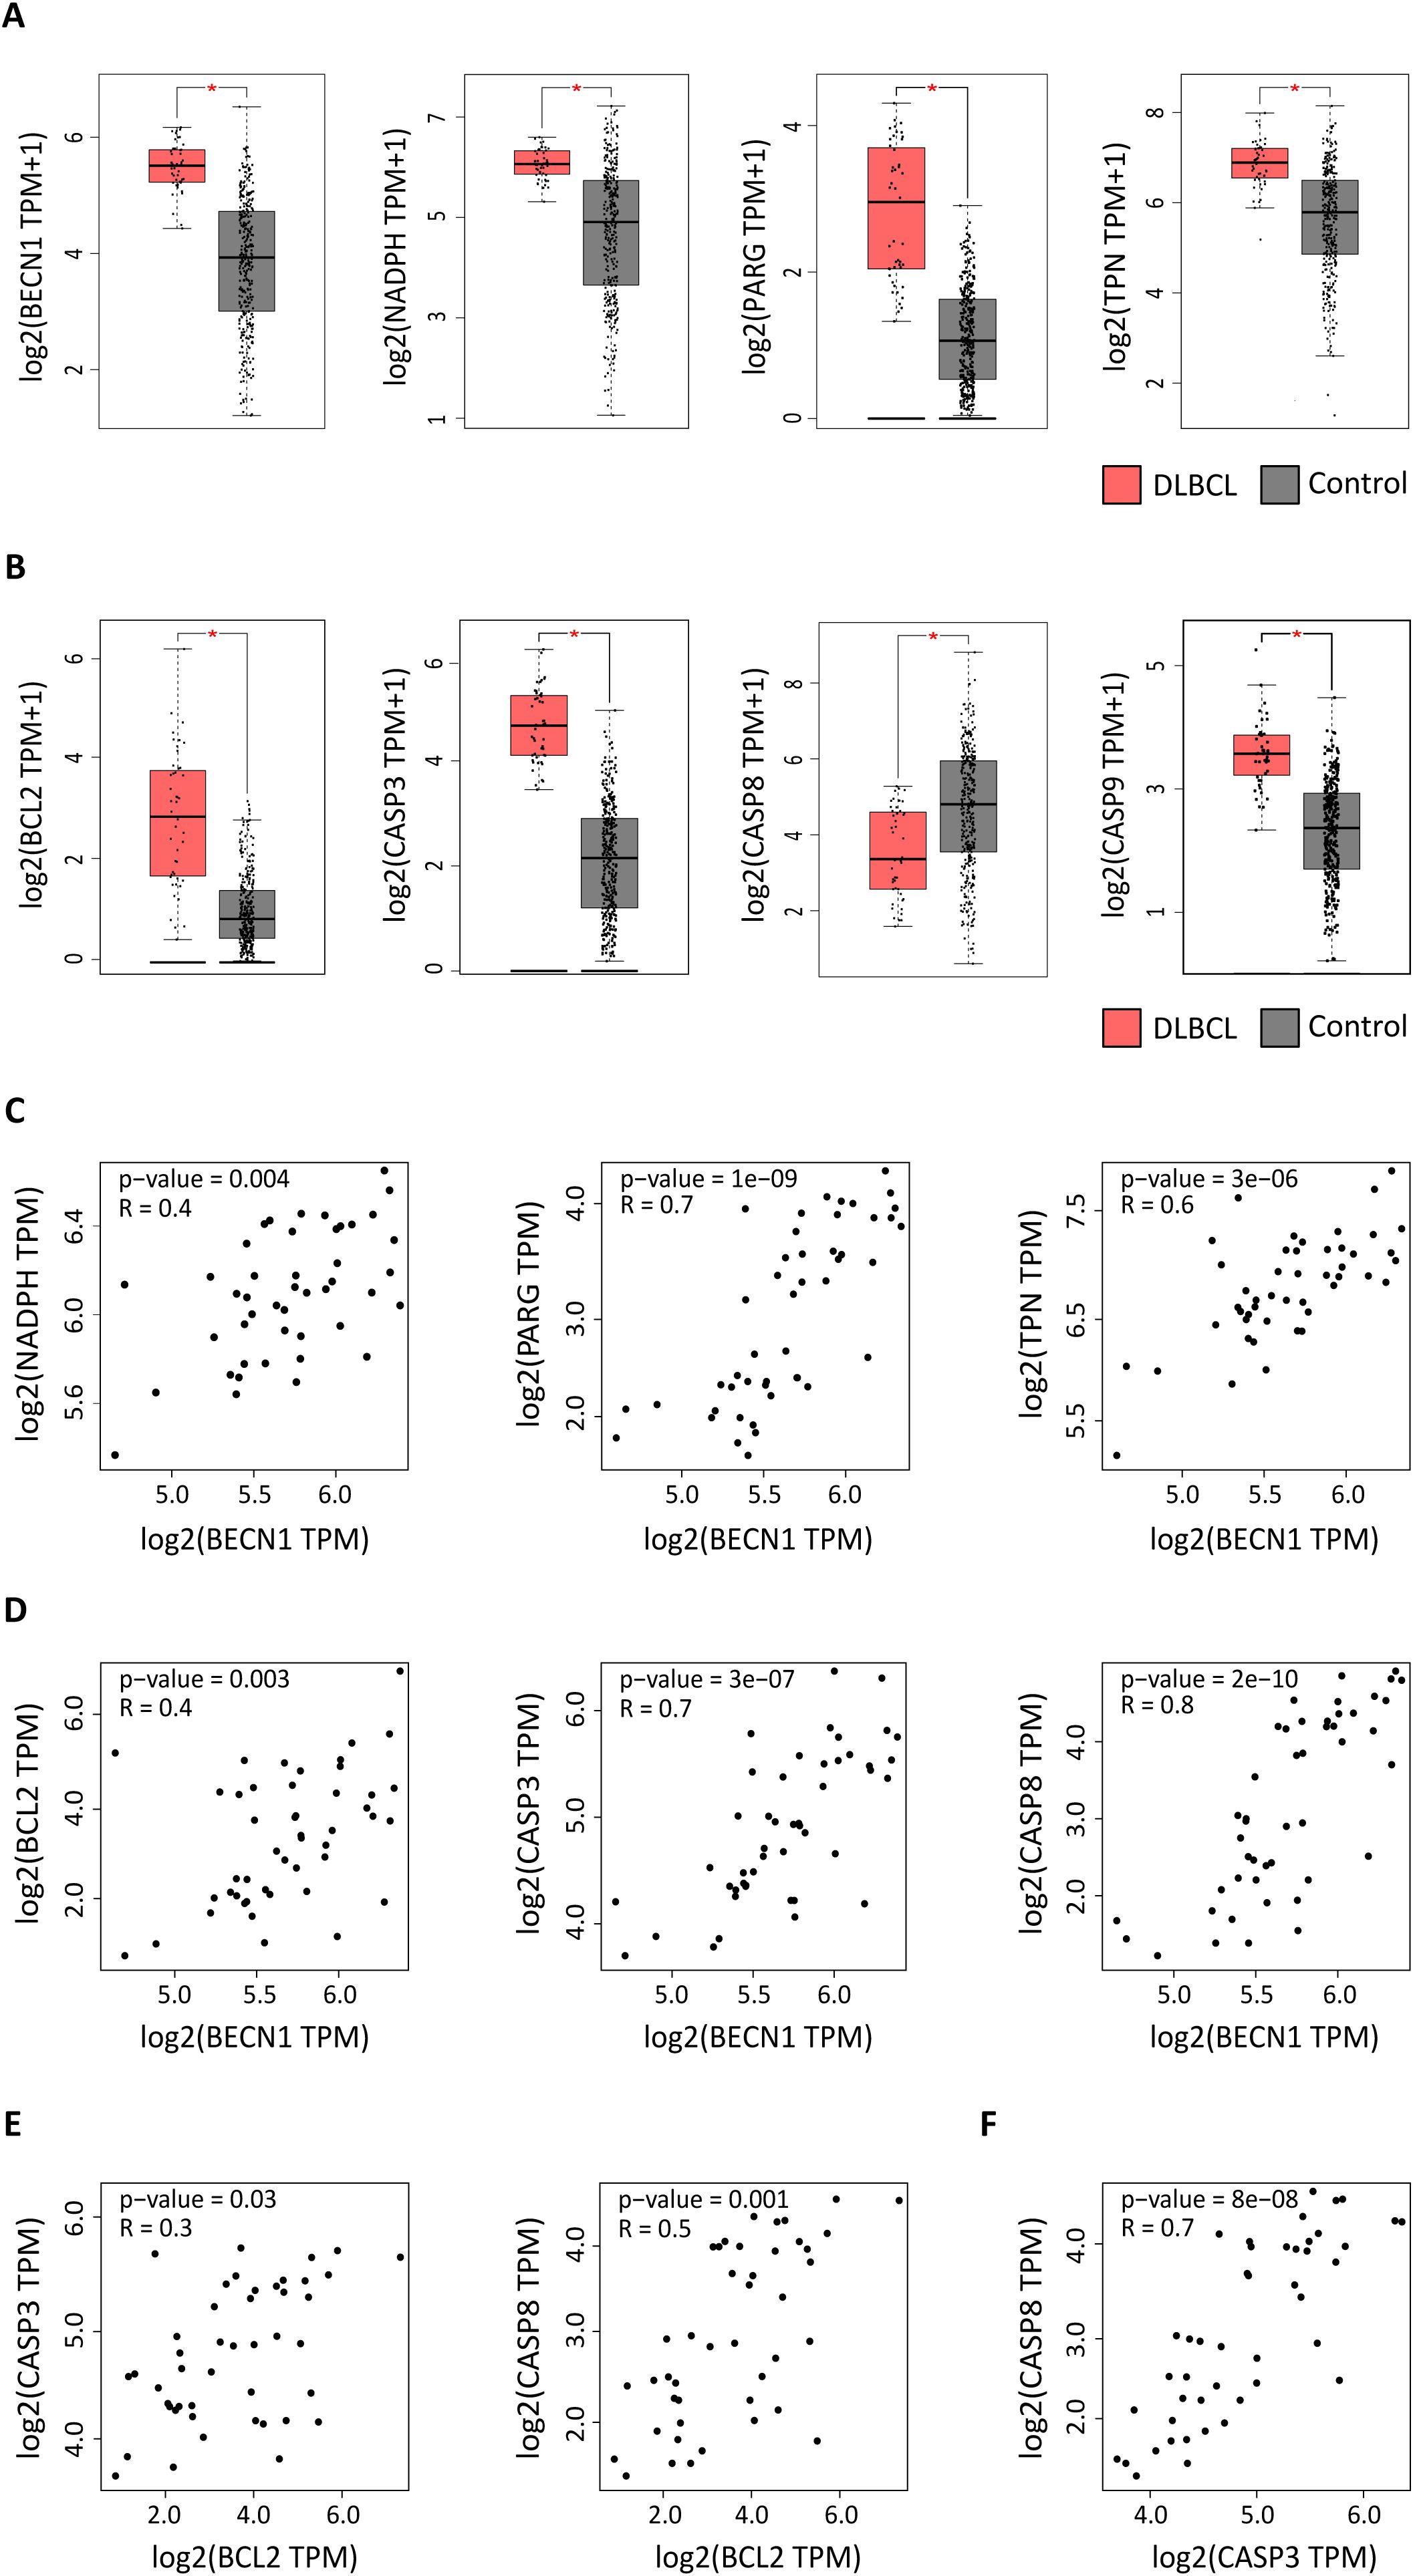
Figure 1. Expression of autophagy and apoptosis factors in DLBCL and control samples. Expression profiling of autophagy and apoptosis genes in 47 DLBCL (TCGA database) (red boxes) and 337 non-tumor control (GTEx database) (gray boxes) tissue samples. (A) Expression levels of the BECN1, NADPH, PARG, and TPN autophagy factors (log2 (TPM + 1). (B) Expression levels of the BCL2, CASP3, CASP8, and CASP9 apoptosis components (log2 (TPM + 1). TPM: transcript count per million reads. (C) Correlation of BECN1 expression with NADPH, PARG and TPN expression levels. (D) Correlation of BECN1 expression with BCL2, CASP3 and CASP8 expression levels. (E) Correlation of BCL2 expression with CASP3 and CASP8 expression levels. (F) Correlation of CASP3 and CASP8 expression levels. *p ≤ 0.05 (one-way ANOVA).
Next, we focused on BECN1 and BCL2 and asked whether their upregulation in DLBCL was correlated with the expression levels of other autophagy (NADPH, PARG, TPN) and apoptosis (CASP3, CASP8 and CASP9) components. BECN1 expression level was positively correlated with that of NADPH, PARG and TPN (autophagy factors) (r = 0.4, p =0.004; r = 0.7, p = 1e-09 and r = 0.6, p = 3e-05) (Figure 1C), and of BCL2, CASP3 and CASP8 (apoptosis components) (r = 0.4, p =0.003; r = 0.7, p = 3e-07 and r = 0.8, p = 2e-10) (Figure 1D). Similarly, BCL2 expression level was positively correlated with that of CASP3 and CASP8 (r = 0.3, p = 0.03; r = 0.5, p = 0.001) (Figure 1E). Moreover, CASP3 and CASP8 expression levels were positively correlated (r = 0.7, p = 8e-08) (Figure 1F).
Altogether, these results suggest that in the DLBCL microenvironment, some autophagy and apoptosis genes are upregulated and that BECN1 and BCL2 expression levels are correlated with those of other autophagy and apoptosis factors.
In DLBCL, the expression of autophagy and apoptosis components is correlated with the expression levels of the macrophage markers CD68, CD86 and CSF1R
As we previously showed that the DLBCL immune microenvironment is enriched in macrophages, we asked whether the upregulation of autophagy and apoptosis factors in DLBCL was correlated with the presence of M1 and M2 macrophages. First, we evaluated the correlation between the expression levels of CD68 (a pan-macrophage marker) (31) and BECN1, NADPH, PARG, TPN (autophagy genes) and BCL2, CASP3, CASP8, CASP9 (apoptosis genes). In DLBCL samples, CD68 expression was positively correlated with the expression of BECN1 and TPN (r = 0.4, p = 0.011; r = 0.7, p = 2e-07) and of CASP3 and CASP8 (r = 0.4, p = 0.017; r = 0.4, p = 0.002) (Figure 2A). Then, we evaluated in DLBCL, the correlation of CD68 expression with M1 and M2 macrophage infiltration and with the expression levels of CD86 (M1 macrophage marker) and CSF1R (M2 macrophage marker) (32, 33). As expected, CD68 expression was positively correlated with M1 and M2 macrophage infiltration (r = 0.7, p = 3e-07; r =0.5, p = 1e-03) and with CD86 and CSF1R expression levels (r = 0.4, p = 0.008; r = 0.8, p = 9e-13) (Figure 2B). Lastly, we determined whether CD86 and CSF1R expression levels were correlated with those of BECN1, NADPH, PARG, TPN (autophagy genes) and BCL2, CASP3, CASP8, CASP9 (apoptosis genes). CD86 expression was positively correlated with the expression level of BECN1 and TPN (r =0.6, p =4e-05; r =0.5, p =0.0004) and also of BCL2 and CASP8 (r = 0.4, p = 0.003; r = 0.5, p = 0.0002) (Figure 2C). Moreover, CSF1R expression was positively correlated with the expression level of BECN1 and TPN (r = 0.6, p = 3e-05; r = 0.7, p = 2e-07) and of CASP8 (r = 0.7, p = 8e-08), but not of BCL2 (r = 0.3, p = 0.06) (Figure 2D).
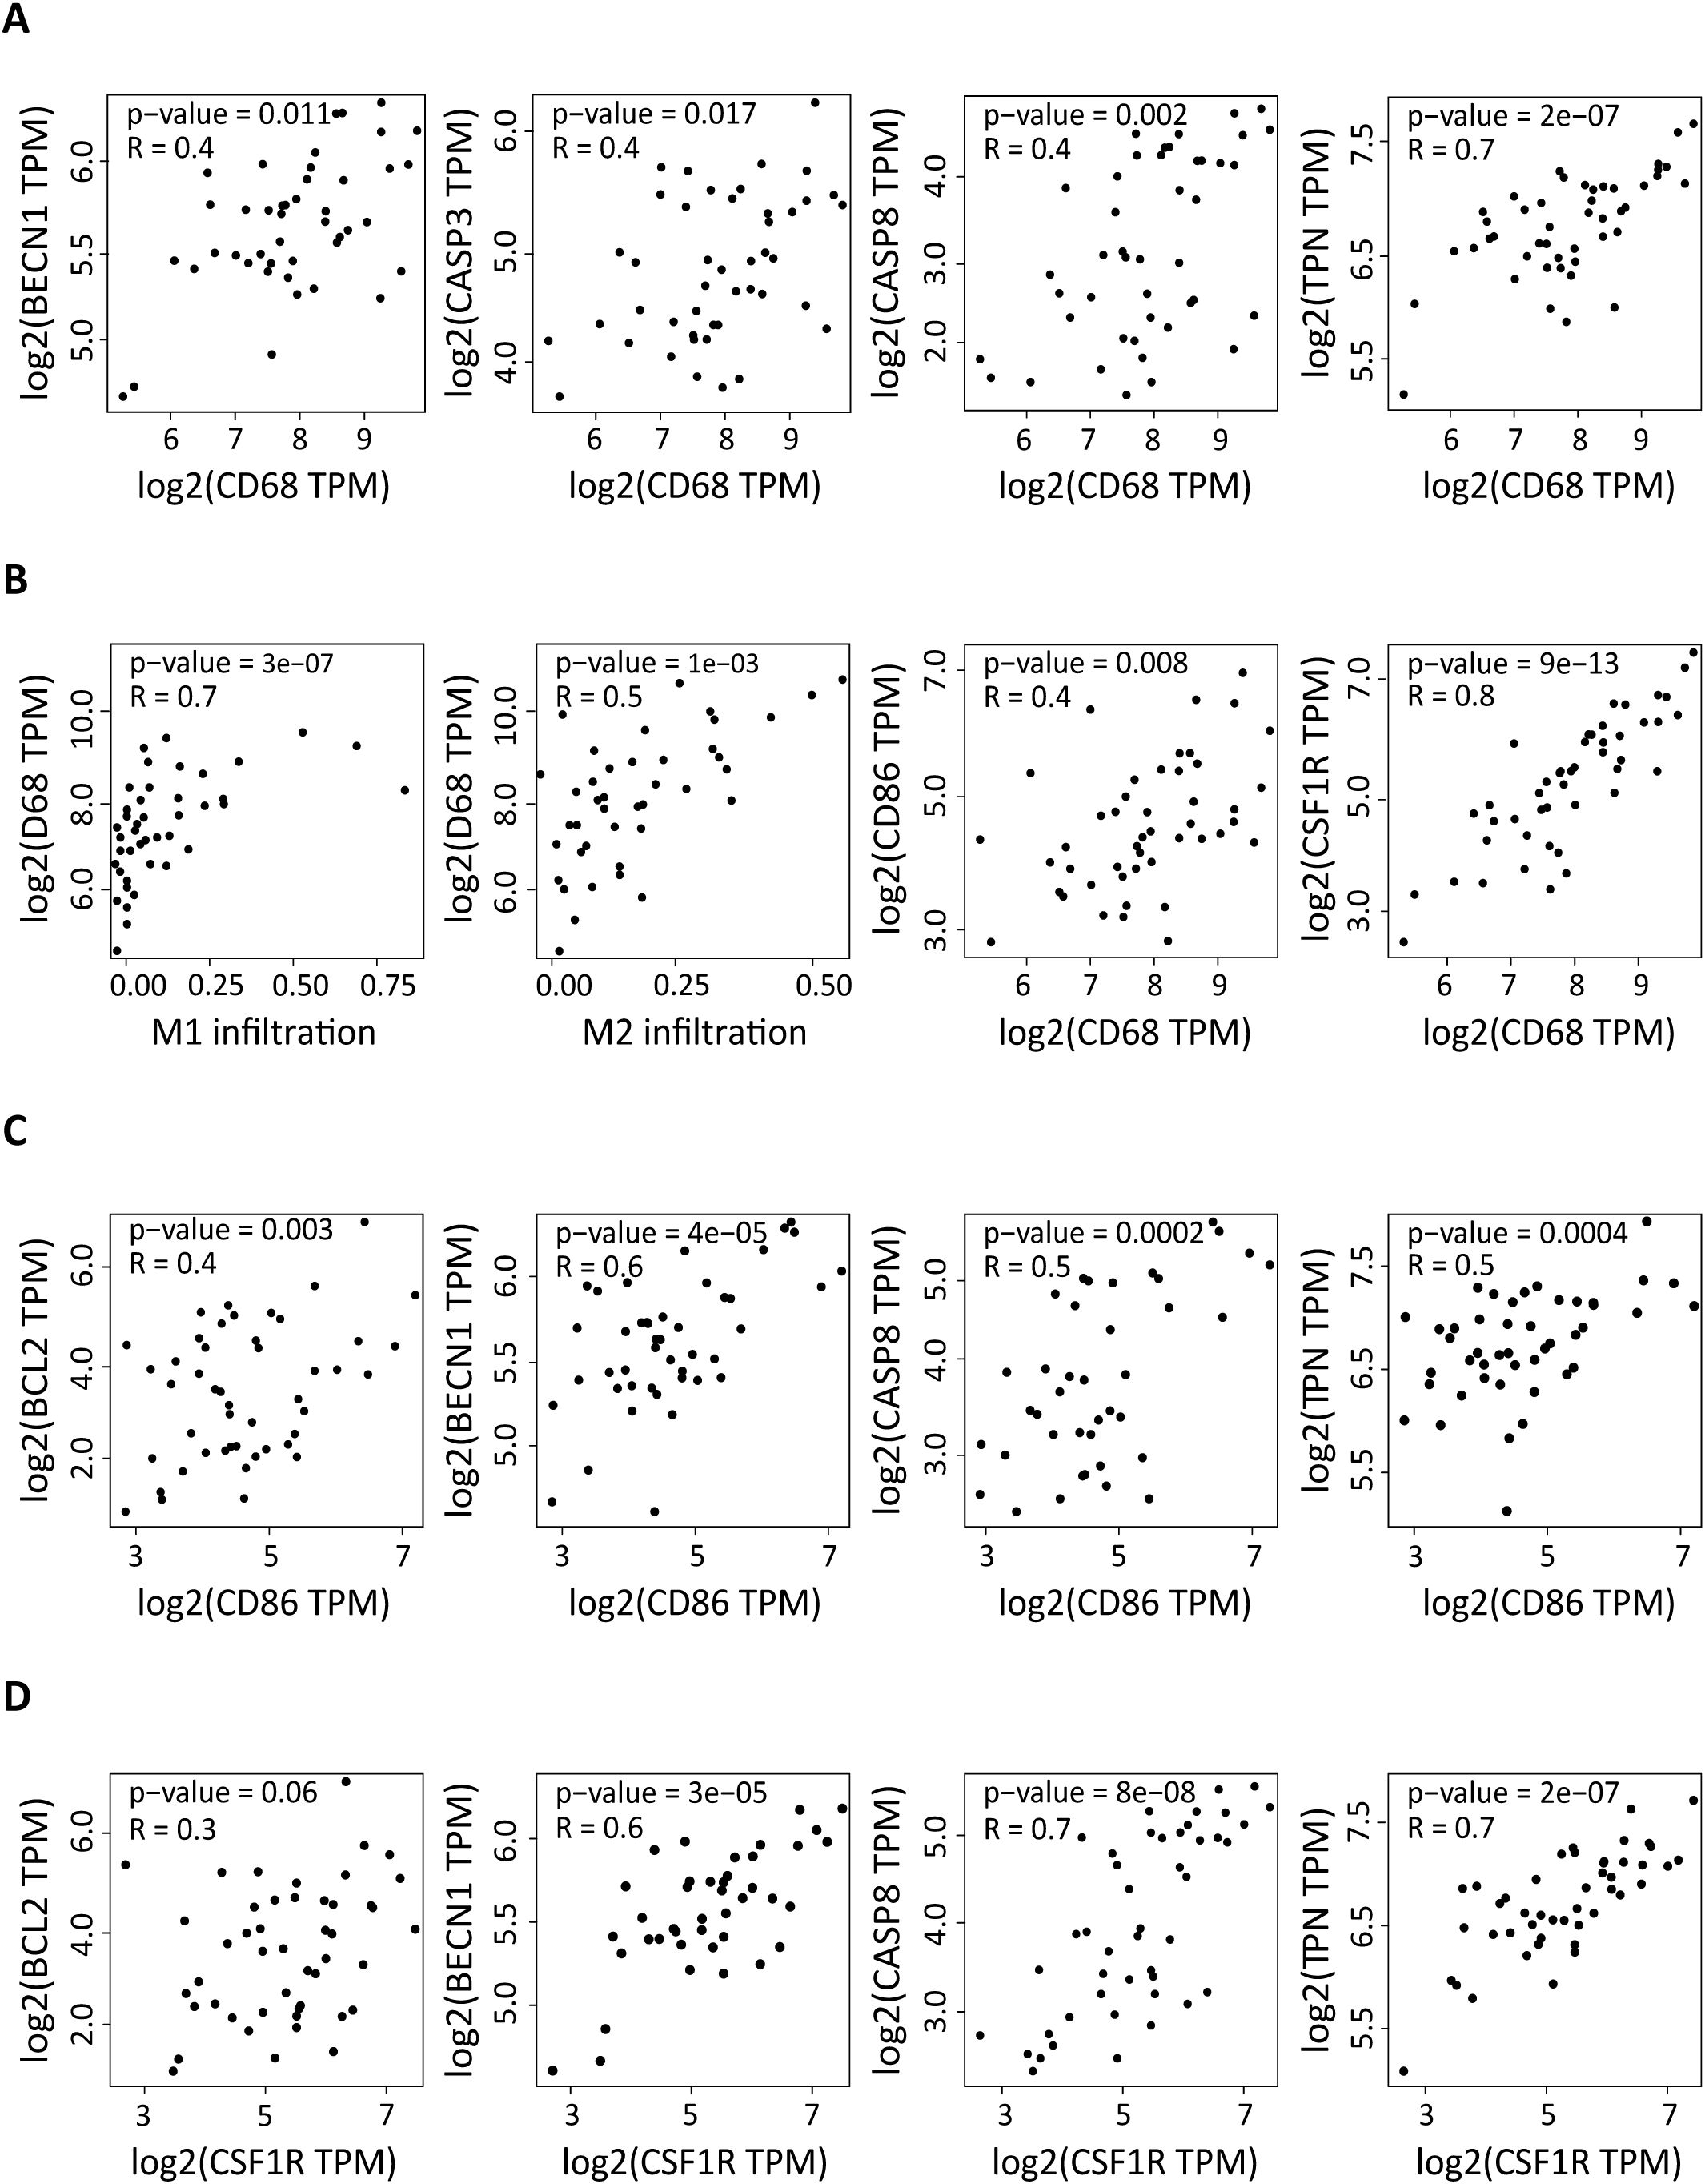
Figure 2. Correlation of the expression of autophagy and apoptosis factors in DLBCL with macrophage infiltration and with the CD86 and CSF1R pro- and anti-inflammatory markers. (A) Correlation between the expression levels of CD68 (pan-macrophage marker) and of BECN1 and TPN (autophagy factors) and CASP3 and CASP8 (apoptosis components) in 47 DLBCL samples (TCGA database). (B) Correlation between M1 and M2 macrophage infiltration and CD68 expression level, and correlation of the expression levels of CD68 and CD86 and CSF1R. (C) Correlation between the expression levels of CD86 (pro-inflammatory marker) and of BECN1 and TPN (autophagy factors) and of BCL2 and CASP8 (apoptosis components). (D) Correlation between the expression levels of CSF1R (anti-inflammation marker) and of BECN1 and TPN (autophagy factors) and of BCL2 and CASP8 (apoptosis components). Quantitative comparisons and measures of the strength and direction of the relationship between genes were based on the Pearson’s correlation coefficient (r). Y-axis: log2 (TPM), X-axis: log2 (TPM) of the indicated gene expression levels. TPM: transcript count per million reads.
Altogether, these results show that in the DLBCL microenvironment, the increased expression of autophagy and apoptosis genes is correlated with macrophage infiltration. In addition, the expression levels of autophagy and apoptosis genes (except for BCL2) are also correlated with CD86 and CSF1R expression. However, BCL2 expression correlates with CD86, but not with CSF1R expression.
In the DLBCL microenvironment, the expression levels of autophagy and of apoptosis genes are increased in M0 and M1 macrophages, and are correlated with mammalian target of rapamycin expression
Next, using deconvolution analysis, we investigated the expression of these autophagy and apoptosis factors specifically in the M0, M1 and M2 macrophage subtypes in DLBCL samples and in non-tumor controls. In line with the previous results (Figure 2), we found that key autophagy genes (BECN1, NADPH, PARG and TPN) were significantly upregulated in M0 and M1 macrophages in DLBCL compared with control samples (tumor/control fold change: 2.3e+01 to 7.7e+01, p ≤6.0e-14 for M0; 1.3e+02 to 2.1e+03, p ≤4.0e-14 for M1, respectively), but not in M2 macrophages (tumor/control fold change: 2.4e-01 to 6.7e-01, p ≤1.e-15) (Figure 3A, Table 1). Similarly, key apoptosis genes (BCL2, CASP3, CASP8 and CASP9) were upregulated in M0 and M1 macrophages in DLBCL compared with control samples (tumor/control fold change: 3.7e+01 to 6.0e+01, p ≤2.0e-15 for M0; 4.5e+02 to 1.4e+03, p ≤1.0e-15 for M1, respectively), but not in M2 macrophages (tumor/control fold change: 3.2e-01 to 5.3e-01, p ≤1.e-15) (Figure 3B, Table 1). These deconvolution results suggest that in DLBCL, key autophagy and apoptosis factors are mainly upregulated in resting (M0) and pro-inflammatory (M1) macrophages.
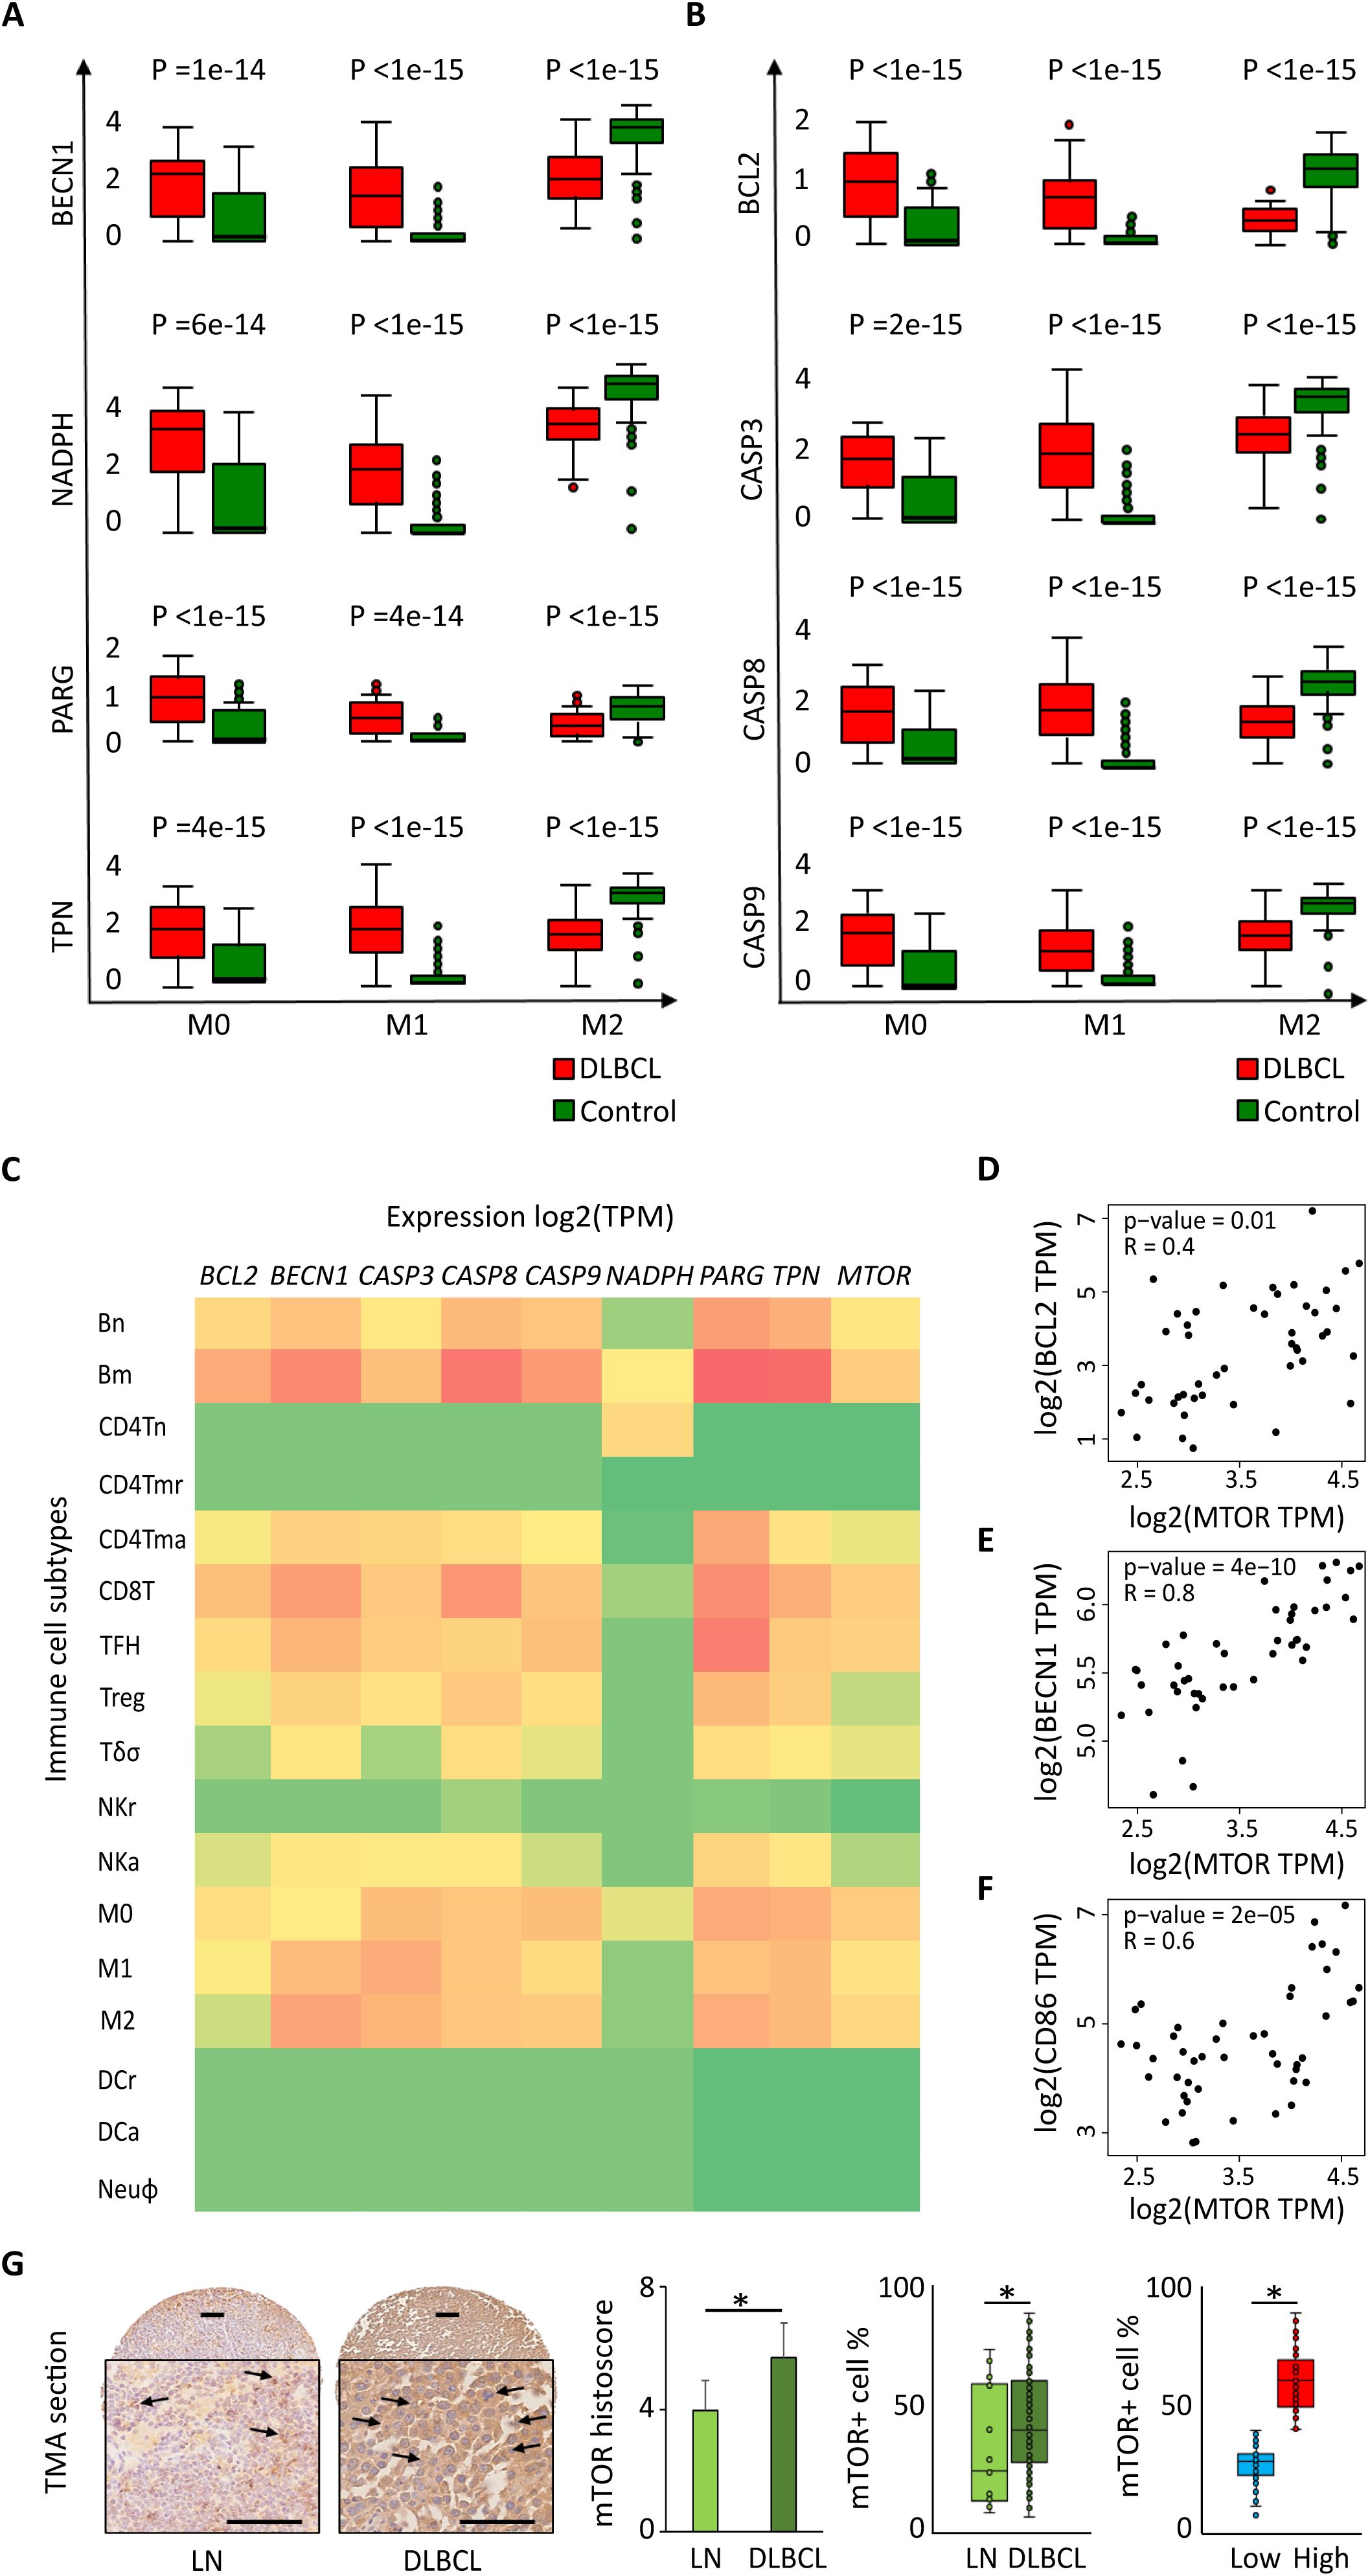
Figure 3. Differential expression of autophagy and apoptotic factors in the DLBCL immune microenvironment and their link with MTOR expression. Comparison (one-way ANOVA) of the expression of BECN1, NADPH, PARG and TPN (autophagy factors) (A) and BCL2, CASP3, CASP8 and CASP9 (apoptosis factors) (B) in M0, M1 and M2 macrophages in 47 DLBCL samples (TCGA database) and 337 control samples (normal secondary lymphoid organ tissues; GTEx database). Y-axis: log (TPM + 1) of the gene expression levels. TPM: transcript count per million reads. This figure displays the results of the deconvolution analyses according to the tissue type: DLBCL (red) and control (green). (C) Comparison of the log2(TPM) expression levels of BECN1, NADPH, PARG, TPN (autophagy factors) and BCL2, CASP3, CASP8, CASP9 (apoptosis factors) and MTOR in different immune cell subtypes of 47 DLBCL samples (TCGA database) and 337 control samples (normal secondary lymphoid organ tissue; GTEx database): naive B cells (Bn), mature B cells (Bm), naive CD4+ T cells (CD4Tn), CD4+ memory resting T cells (CD4Tmr), CD4+ memory activated T cells (CD4Tma), CD8+ T cells (CD8T), T follicular helper cells (TFH), regulatory T cells (Treg), gamma delta T cells (Tγδ), resting natural killer cells (NKr), activated natural killer cells (NKa), M0, M1 and M2 macrophages, resting dendritic cells (DCr), activated dendritic cells (DCa), and neutrophils (Neuφ). (D-F) Correlation between the expression levels of MTOR and BCL2 (D), BECN1 (E), and CD86 (F). Quantitative comparisons and measures of the strength and direction of the relationship between genes were based on the Pearson’s correlation coefficient (r). (G) Representative images of mTOR protein expression in normal lymph nodes (LN) and DLBCL. Quantitative analysis of the mTOR histoscore in LN and DLBCL samples (left panel), of the mTOR+ cell percentage in LN and DLBCL samples (middle panel), and of mTOR+ low and high cell percentage in DLBCL samples (right panel). *p ≤0.05 (two-tailed unpaired Student’s t-test).
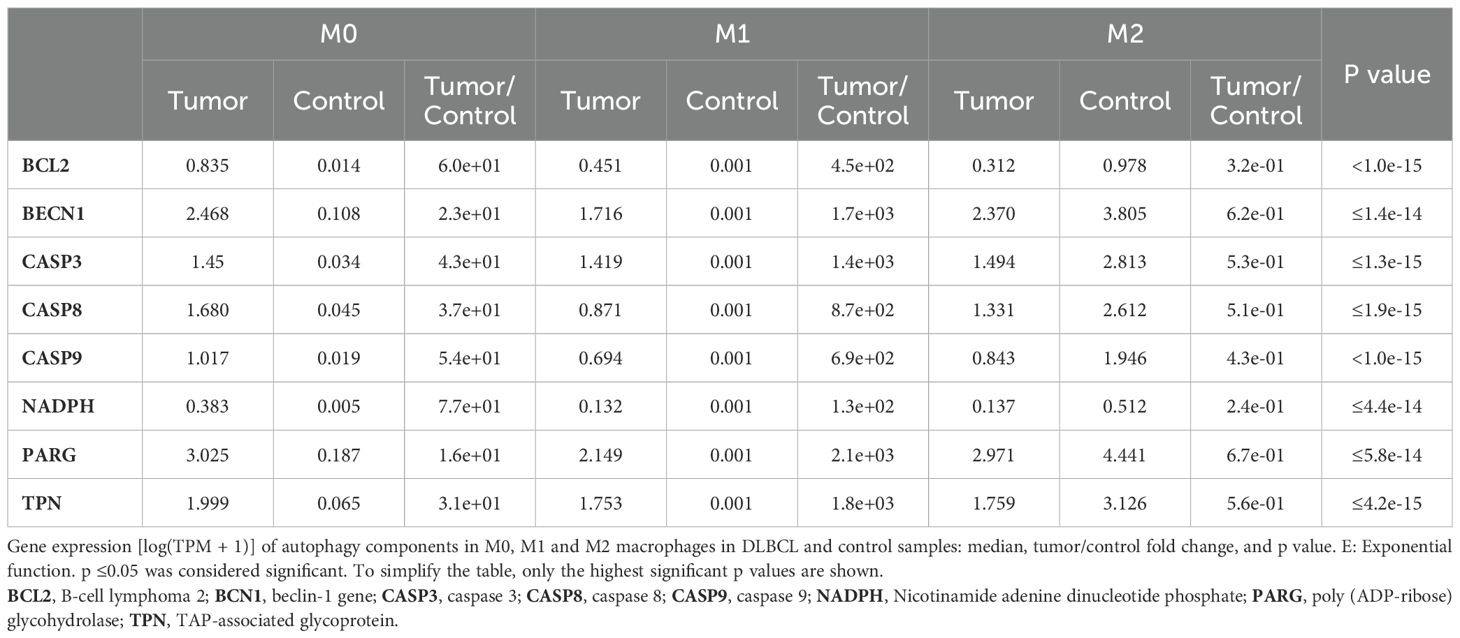
Table 1. Differentially expressed autophagy and apoptosis factors in the three macrophage subtypes in DLBCL.
Then, to confirm these results and to compare the expression of autophagy and apoptosis factors in the immune DLBCL microenvironment, we analyzed their expression in several immune cell subtypes: naive B cells (Bn), mature B cells (Bm), CD4+ naive T (CD4Tn) cells, CD4+ memory resting T (CD4Tmr) cells, CD4+ memory activated T (CD4Tma) cells, CD8+ T cells, natural killer (NK) cells, T follicular helper (TFH) cells, regulatory T cells (Treg), T gamma delta cells (Tγδ), natural killer resting (NKr) cells, natural killer activated (NKa) cells, M0, M1 and M2 macrophages, resting dendritic cells (DCr), activated dendritic cells (DCa), and neutrophils (Neuφ). Compared with most of the immune cell types under study, autophagy and apoptotic factors were upregulated specifically in M0 and M1 macrophages (except for NADPH in M1 and M2 macrophages) (p ≤0.05). We found a similar profile also for CD8+ T cells and memory B cells, which should be mostly tumor B cells (Figure 3C).
We also compared the expression levels of genes that encode factors implicated in different signaling pathways in different cancer types (from the TCGA database). In NHL samples, we found that MTOR was upregulated only in DLBCL samples (Supplementary Figure S2C). The same analysis in different immune cell subtypes (listed above) showed that MTOR was specifically upregulated in M0 and M1 macrophages and also in B cells and CD8+ T cells (p ≤0.05) (Figure 3C). Moreover, MTOR expression correlated with the expression level of BECN1 (autophagy), BCL2 (apoptosis) and CD86 (M1 macrophage marker) (r = 0.8, p = 4e-10; r =0.4, p = 0.01; r = 0.6, p = 2e-05) (Figures 3D–F, respectively). We confirmed that also the expression of mTOR protein was increased in 128 DLBCL samples compared with 20 lymph node controls (TMA sections) (histoscore: 5.7 ± 0.9 vs 4.0 ± 0.8, p =0.05; mTOR+ cells: 64.3% ± 14.2 vs 32.6% ± 4.9, p =0.04). In addition, when we evaluated mTOR expression level (low vs high; median value used as threshold) in DLBCL samples, we found a higher percentage of mTORhigh cells than mTORlow cells (67.3% ± 9.0 vs 27.6% ± 8.2, p =2e-03) (Figure 3G).
We also investigated whether the expression levels of some of the genes of interest (BCL2, BECN1, CD86, CSF1R and MTOR) varied in function of the DLBCL stage (I, II, II and IV), but we did not find any significant difference (Supplementary Figure S3).
Then, to determine whether the survival of patients with DLBCL (n=48) was influenced by the expression level of these autophagy and apoptosis components, we generated Kaplan Meier survival curves and compared them with the log rank test (survival contribution of each individual gene) and also created survival maps (survival contribution of different genes). We found that the expression level of the tested autophagy and apoptosis factors did not affect survival (Supplementary Figures S4A-D). This negative result could be explained by the small size of the cohort (n=48). Therefore, a study in larger cohort of patients with the possibility of functional validation should be carried to confirm/invalidate this negative result.
Altogether, these data suggest that autophagy and apoptosis components as well as MTOR are overexpressed in the M0 and M1 macrophage populations of the DLBCL immune microenvironment.
In the DLBCL microenvironment, the percentage of CD86-positive cells is increased and is accompanied by overexpression of beclin-1 and Bcl-2
To validate some of the in silico results, we performed IHC using TMAs (n=128 DLBCL and n=20 normal lymph node samples) (Supplementary Table S2). The mean histoscore for CD86 (M1 macrophage marker) was significantly higher in DLBCL samples than in non-tumor controls (5.4 ± 1.1 vs 3.4 ± 1.0, p = 9.0e-08) as well as the mean CD86+ cell percentage (74.6% ± 17.8 vs 27.9% ± 7.8, p = 4.0e-24) (Figure 4A).
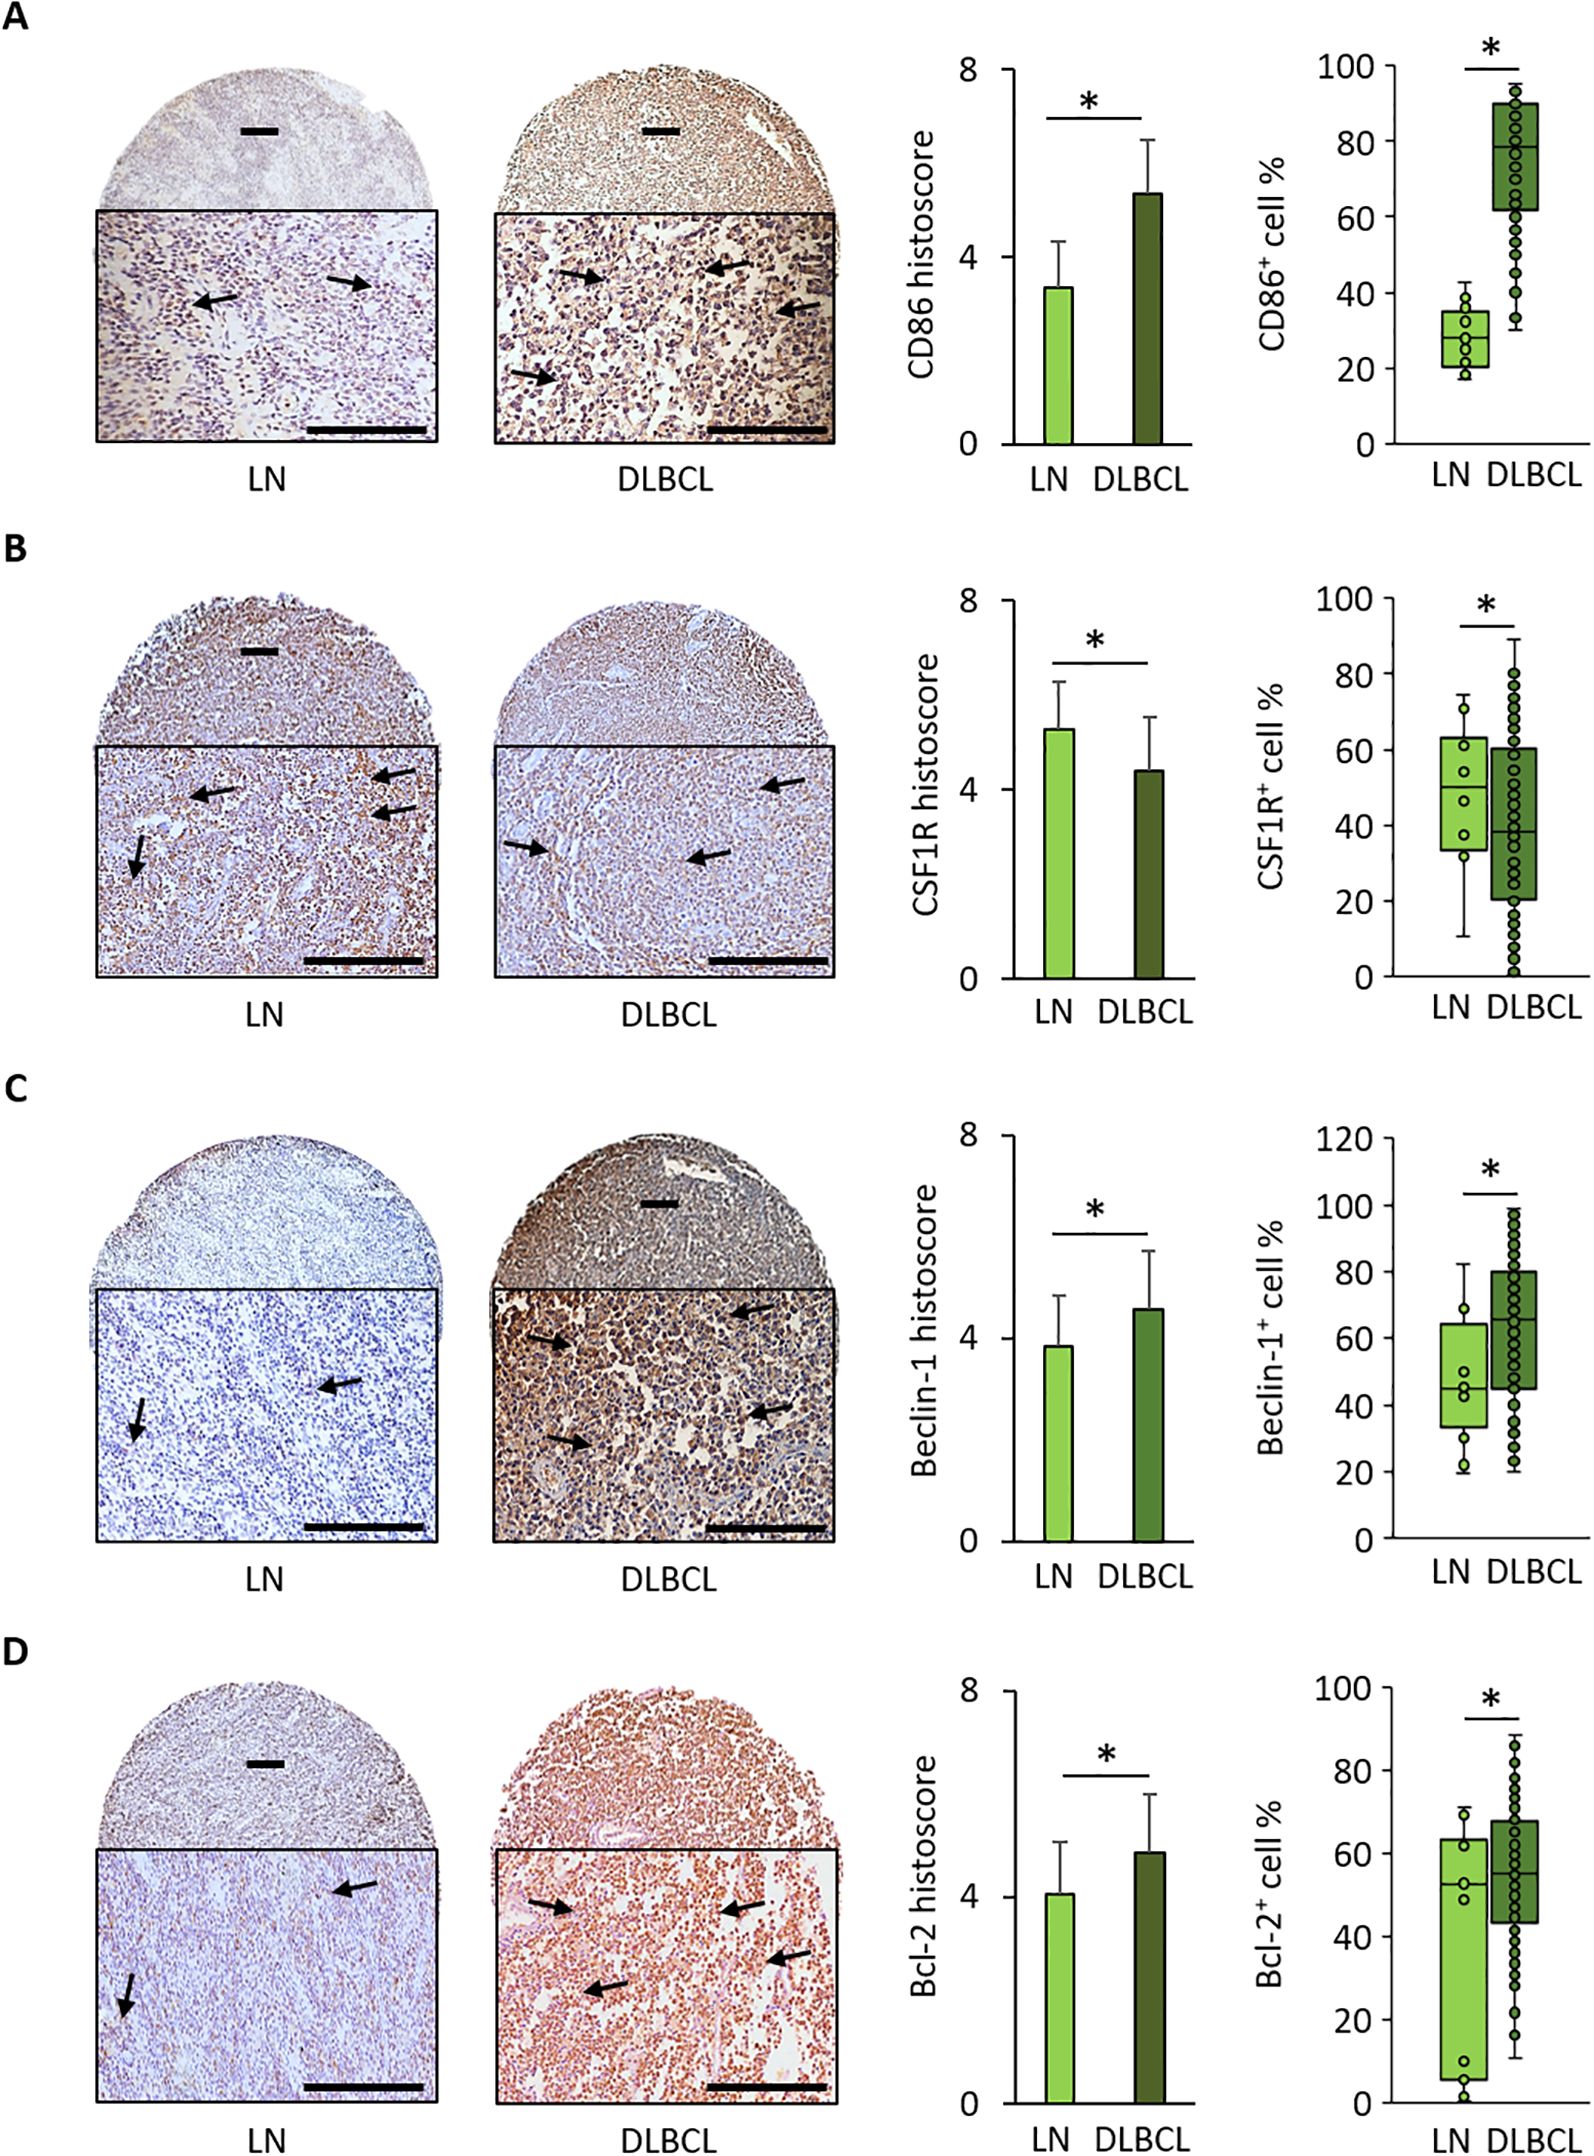
Figure 4. Immunohistochemical analysis of CD86, CSF1-R, Beclin-1, and Bcl-2 expression in 128 DLBCL and 20 normal lymph node samples. (A) Representative images of CD86 expression in normal lymph nodes (LN) and DLBCL samples. Quantitative analysis of the CD86 histoscore (left panel) and percentage of CD86+ cells (right panel) in DLBCL and LN samples. (B) Representative images of CSF1-R expression in LN and DLBCL samples. Quantitative analysis of the CSF1-R histoscore (left panel) and percentage of CSF1-R+ cells (right panel) in DLBCL and LN samples. (C) Representative images of beclin-1 expression in LN and DLBCL samples. Quantitative analysis of the beclin-1 histoscore (left panel) and percentage of beclin-1+ cells (right panel) in DLBCL and LN samples. (D) Representative images of Bcl-2 expression in LN and DLBCL samples. Quantitative analysis of the Bcl-2 histoscore (left panel) and percentage of Bcl-2+ cells (right panel) in DLBCL and LN samples. Scale bars, 100 µm. *p ≤0.05 (two-tailed unpaired Student’s t-test).
Conversely, the mean histoscore for CSF1-R (M2 macrophage marker) (4.4 ± 1.3 vs 5.3 ± 0.9, p = 0.01) and the mean CSF1-R+ cell percentage (40.6% ± 23.3 vs 51.8% ± 15.2, p = 0.05) were significantly lower in DLBCL samples than in controls (Figure 4B).
The mean beclin-1 and Bcl-2 histoscore values and beclin-1+ and Bcl-2+ cell percentages were significantly higher in DLBCL than in non-tumor control samples (beclin-1: 4.6 ± 1.3 vs 3.8 ± 1.0, p = 2.0e-02; and 62.9% ± 21.7 vs 47% ± 19, p = 4.0e-02, respectively; Bcl-2: 4.9 ± 1.2 vs 4.1 ± 2.1, p = 3.0e-01; and 55.8% ± 13.5 vs 39.0% ± 7.3, p = 0.05, respectively) (Figures 4C, D).
The IHC results obtained in an independent DLBCL cohort confirmed the bioinformatics findings: increased expression of beclin-1 (autophagy factor) and Bcl-2 (anti-apoptosis factor), and higher infiltration of CD86+ cells than CSF1-R+ cells in the DLBCL microenvironment.
The pro-inflammatory M1 macrophages are enriched in the peri-tumoral microenvironment and they strongly express Bcl-2 and mTOR
To investigate the intra-T and peri-T topography and the link of macrophages (CD68+) and tumor B cells (CD20+) with CD86 and CSF1-R expression, we performed IF staining of DLBCL and non-tumor control samples in the same TMAs. We found that the intra-T/peri-T ratio of CD86+ cells was significantly lower in CD68+ (pan-macrophage marker) cells than CD20+ tumor B cells (0.4 ± 0.1 vs 1.4 ± 0.4, p = 3e-13) (Figure 5A). In agreement, CD86+ cell count was significantly higher in the macrophage (CD68+) than in the tumor cell (CD20+) compartment (282.0 ± 63.4 vs 238.1 ± 64.3, p = 0.02) (Figure 5A).
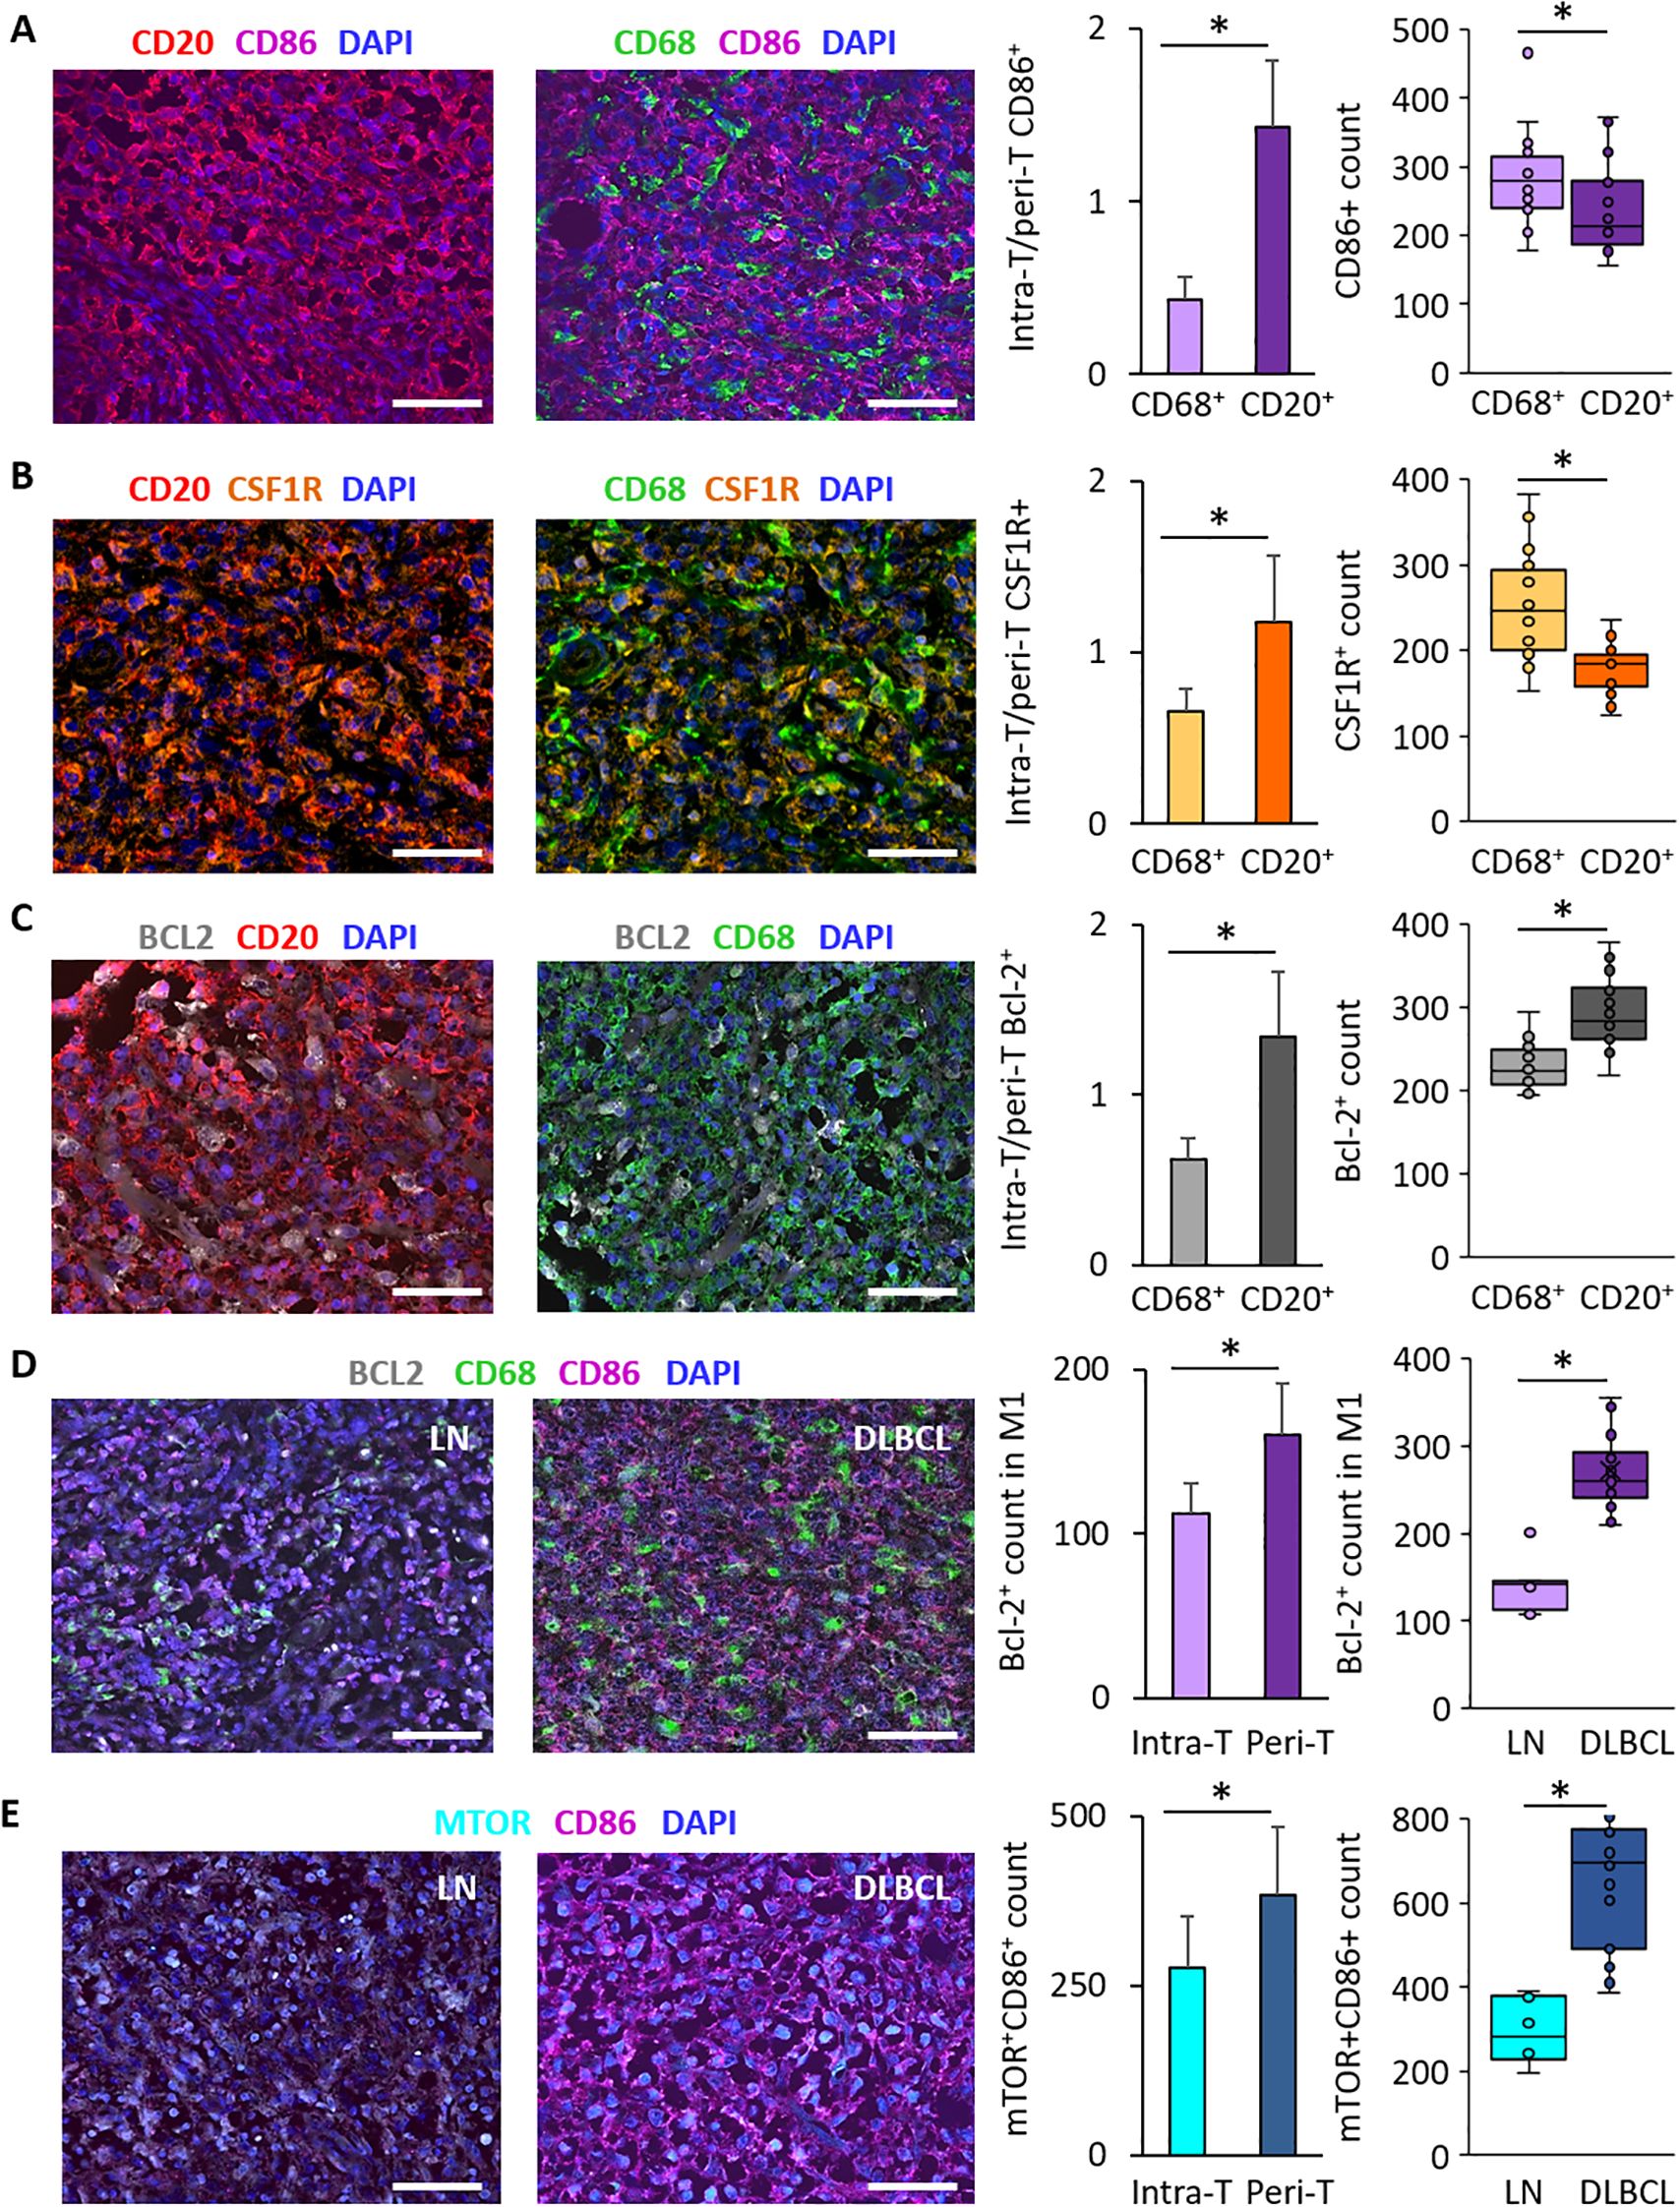
Figure 5. Immunofluorescence analysis of CD86, CSF1-R and Bcl-2 distribution in DLBCL samples and of Bcl-2 and mTOR expression in the DLBCL macrophage microenvironment. (A) Representative images of CD86 expression in CD20+ tumor cells and CD68+ macrophages and its distribution in the DLBCL microenvironment. Quantification of the intra-T/peri-T CD86+ cell ratio (left panel) and of CD86+ cell numbers (right panel) in the macrophage (CD68+) and DLBCL (CD20+) compartments. (B) Representative images of CSF1-R expression in CD20+ tumor cells and CD68+ macrophages and its distribution in the DLBCL microenvironment. Quantification of the intra-T/peri-T CSF1-R+ cell ratio (left panel) and of the CSF1-R+ cell numbers (right panel) in the macrophage (CD68+) and DLBCL (CD20+) compartments. (C) Representative images of Bcl-2 expression in CD20+ tumor cells and CD68+ macrophages and its distribution in the DLBCL microenvironment. Quantification of the intra-T/peri-T Bcl-2+ cell ratio (left panel) and of the Bcl-2+ cell numbers (right panel) in the macrophage (CD68+) and DLBCL (CD20+) compartments. (D) Representative images of Bcl-2 expression in M1 macrophages in non-tumor lymph node (LN) controls (left) and DLBCL samples (right). Quantification of Bcl-2+ cells in M1 macrophages in the intra- and peri-T areas (left panel) and in LN vs DLBCL samples (right panel). (E) Representative images of mTOR expression in CD86+ cells in LN (left) and DLBCL samples (right). Quantification of mTOR+/CD86+ cells in the intra-T and peri-T areas (left panel) and in LN vs DLBCL samples (right panel). Scale bars, 100 µm. *p ≤0.05 (two-tailed unpaired Student’s t-test).
Similarly, the intra-T/peri-T CSF1-R+ cell ratio was significantly lower in the CD68+ macrophage than CD20+ tumor cell compartment (0.7 ± 0.1 vs 1.2 ± 0.3, p = 4e-08) (Figure 5B) and CSF1-R+ cell count was higher in the macrophage than tumor cell compartment (252.2 ± 61.3 vs 177.6 ± 28.7, p = 8e-06) (Figure 5B).
Moreover, the intra-T/peri-T Bcl-2+ cell ratio was significantly lower in the CD68+ than CD20+ cell compartment (0.6 ± 0.2 vs 1.3 ± 0.3, p = 1e-13) (Figure 5C) and Bcl-2+ cell count was lower in the macrophage than tumor cell compartment (292.9 ± 40.7 vs 228.7 ± 26.5, p = 4e-07) (Figure 5C).
Bcl-2 expression was significantly lower in the CD68+ macrophage compartment compared with the CD20+ tumor cell compartment, but was correlated with M1 (CD86+) macrophage infiltration. Therefore, we investigated Bcl-2 expression in CD68+CD86+ M1 macrophages in DLBCL samples (intra-T vs peri-T) and in DLBCL vs non-tumor control lymph node samples. In line with the bioinformatics results, Bcl-2 expression in M1 macrophages was significantly lower in the intra-T than peri-T area (112.2 ± 18.9 vs 160.3 ± 31.1, p = 4e-07) (Figure 5D). In addition, the number of Bcl-2+ M1 macrophages was higher in DLBCL samples than controls (272.5 ± 42.6 vs 138.5 ± 30.0, p = 7e-09) (Figure 5D).
Lastly, as mTOR was overexpressed in DLBCL compared with control samples (Figure 3G), we investigated its expression in CD86+ cells in DLBCL samples (intra-T vs peri-T) and in DLBCL vs non-tumor control (lymph nodes) samples. In line with the in silico results, the number of mTOR+ CD86+ cells was significantly lower in the intra-T than peri-T area (276.2 ± 75.0 vs 383.8 ± 100.4, p = 4e-04) and was higher in DLBCL than control samples (660.1 ± 154.7 vs 2 94.5 ± 78.3, p = 8e-06) (Figure 5E).
These IF results validated and complemented our in silico and IHC findings. They suggest that tumor-infiltrating M1 (CD86+) and M2 (CSF1-R+) macrophages have a peri-T location and that more macrophages (CD68+) than DLBCL cells (CD20+) express these two markers. In addition, Bcl-2 expression was higher in CD20+ tumor cells (a lymphoma feature) than in CD68+ macrophages. Specifically, in the macrophage compartment, Bcl-2+ macrophages were located in the peri-T area and predominantly belonged to the M1 subpopulation. Lastly, mTOR was mainly expressed in CD86+ cells in the peri-T area and its expression level was higher in DLBCL than control samples.
Discussion
DLBCL is characterized by an important immune microenvironment that influences its prognosis and outcome (20, 34–36). This aggressive blood cancer needs a substantial amount of energy to highjack the immune cell microenvironment and deregulate vital physiological processes (inflammation, autophagy and apoptosis) in favor of tumor growth and progression. Physiologically, autophagy is an important source of energy for basic cellular processes and for the activation/regulation of the innate immune response (37). In tumor cells, autophagy deregulation could hinder the antitumor immune response induction, due to insufficient ATP release to attract immune cells (38). One study reported an autophagy signature that is related to DLBCL resistance to drugs (39). Hence, the relationship between autophagy and immune cell response is crucial particularly in cancer.
This study is the last part of a project that exploited publicly available datasets that contain 48 DLBCL tumors and 337 non-tumor control samples and then used a substantial independent cohort of 128 DLBCL tumors and 38 control samples (including 20 lymph nodes) in TMAs to validate the in silico results by IHC and IF. The first part of this project highlighted a significant and high enrichment in macrophages, specifically pro-inflammatory M1 macrophages, and a strong inflammatory signature in the DLBCL microenvironment (20). In the second part of the project, we hypothesized that DLBCL would require a high amount of energy to maintain this strong inflammatory signature. By investigating the expression of several metabolic components, we found that the metabolic regulator SIRT1 is upregulated in the DLBCL microenvironment. Moreover, SIRT1 expression was correlated with M1 pro-inflammatory macrophages and was linked to important metabolic pathways, such as autophagy. This suggested a specific relation between metabolic targets and inflammation in the DLBCL (manuscript under revision).
Here, in the last part of this project, we investigated the autophagy gene expression profile and its potential link with inflammation in the DLBCL microenvironment and in non-tumor controls. As expected, autophagy genes were upregulated in the DLBCL microenvironment, including BECN1 that is involved in autophagy initiation (17). Moreover, BCL2 (an anti-apoptotic factor overexpressed and often mutated in DLBCL) (40) was also upregulated in our DLBCL cohort and its expression was correlated with that of CASP3 and CASP8 (two apoptosis regulators). BCL2 expression was also positively correlated with that of BECN1, suggesting a strong relationship between these factors in DLBCL. This is in line with what described in a physiological context (17, 41) where their interaction is crucial for autophagy regulation and cellular homeostasis. Moreover, BECN1 expression was correlated specifically with the CD68+ macrophage compartment and with both M1 (CD86+) and M2 (CSF1-R+) macrophage subtypes. Conversely, BCL2 expression was only positively correlated with M1 pro-inflammatory macrophages. When we verified BECN1 and BCL2 expression levels in the M0, M1 and M2 macrophage subtypes in DLBCL and non-tumor control samples, we found that they were overexpressed in M0 and M1 but not in M2 macrophages. In addition, the comparison with other immune cell types showed an overall upregulation of the studied autophagy and apoptosis components only in the rich DLBCL macrophage compartment (and also in tumor B cells and CD8+ T cells). Altogether, this suggests a link between autophagy and inflammation. Moreover, in DLBCL, the autophagy machinery might decrease the sensitivity of macrophages to death by apoptosis (42–44), specifically in M1 pro-inflammatory macrophages, to support their anti-tumor inflammatory response. The validation of these results by IHC and IF in a substantial independent cohort of 128 DLBCL and 38 non-tumor control samples on TMAs allowed confirming the significantly higher proportion of pro-inflammatory (CD86+) cells than suppressive (CSF1-R+) cells in DLBCL compared with controls, and also the overexpression of beclin-1 and Bcl-2 in DLBCL. Moreover, using IF, we determined the specific topography of CD20+ tumor cells (intra-T area) and of CD68+CD86+ M1 and CD68+CSF1-R+ M2 macrophages (peri-T area) in DLBCL samples. We also showed that Bcl-2 is overexpressed in tumor B cells and in the peri-T M1 macrophage compartment.
Lastly, we previously reported that the mTOR signaling pathway, a central regulator of metabolism (45), is enriched in the DLBCL microenvironment (manuscript under revision). Here, we found that MTOR expression correlates with CD68+ macrophage infiltration and with both BECN1 and BCL2 expression. In addition, mTOR expression was higher in DLBCL than non-tumor control samples, and in tumors, mTOR expression was higher in CD86+ cells in the peri-T area. Based on the literature and our previous results, we hypothesize that overexpression of mTOR in tumor cells and in M1 macrophages could be an adaptation induced by tumor cells (20, 46, 47) to limit inflammation and to negatively regulate autophagy, which is implicated in generating enough energy to activate these innate immune cells and to support the inflammatory reaction. Furthermore, this extra energy could be exploited by tumor cells for their own metabolism and growth. It would be important to perform functional studies and phosphorylation-specific assays to verify/confirm whether mTOR overexpression pattern reflects its activation status.
Altogether, our gene and protein expression results describe for the first time in DLBCL a specific autophagy gene profile in the M1 pro-inflammatory macrophage compartment that is positively correlated with upregulation of the BCL2 anti-apoptotic factor (Figure 6).
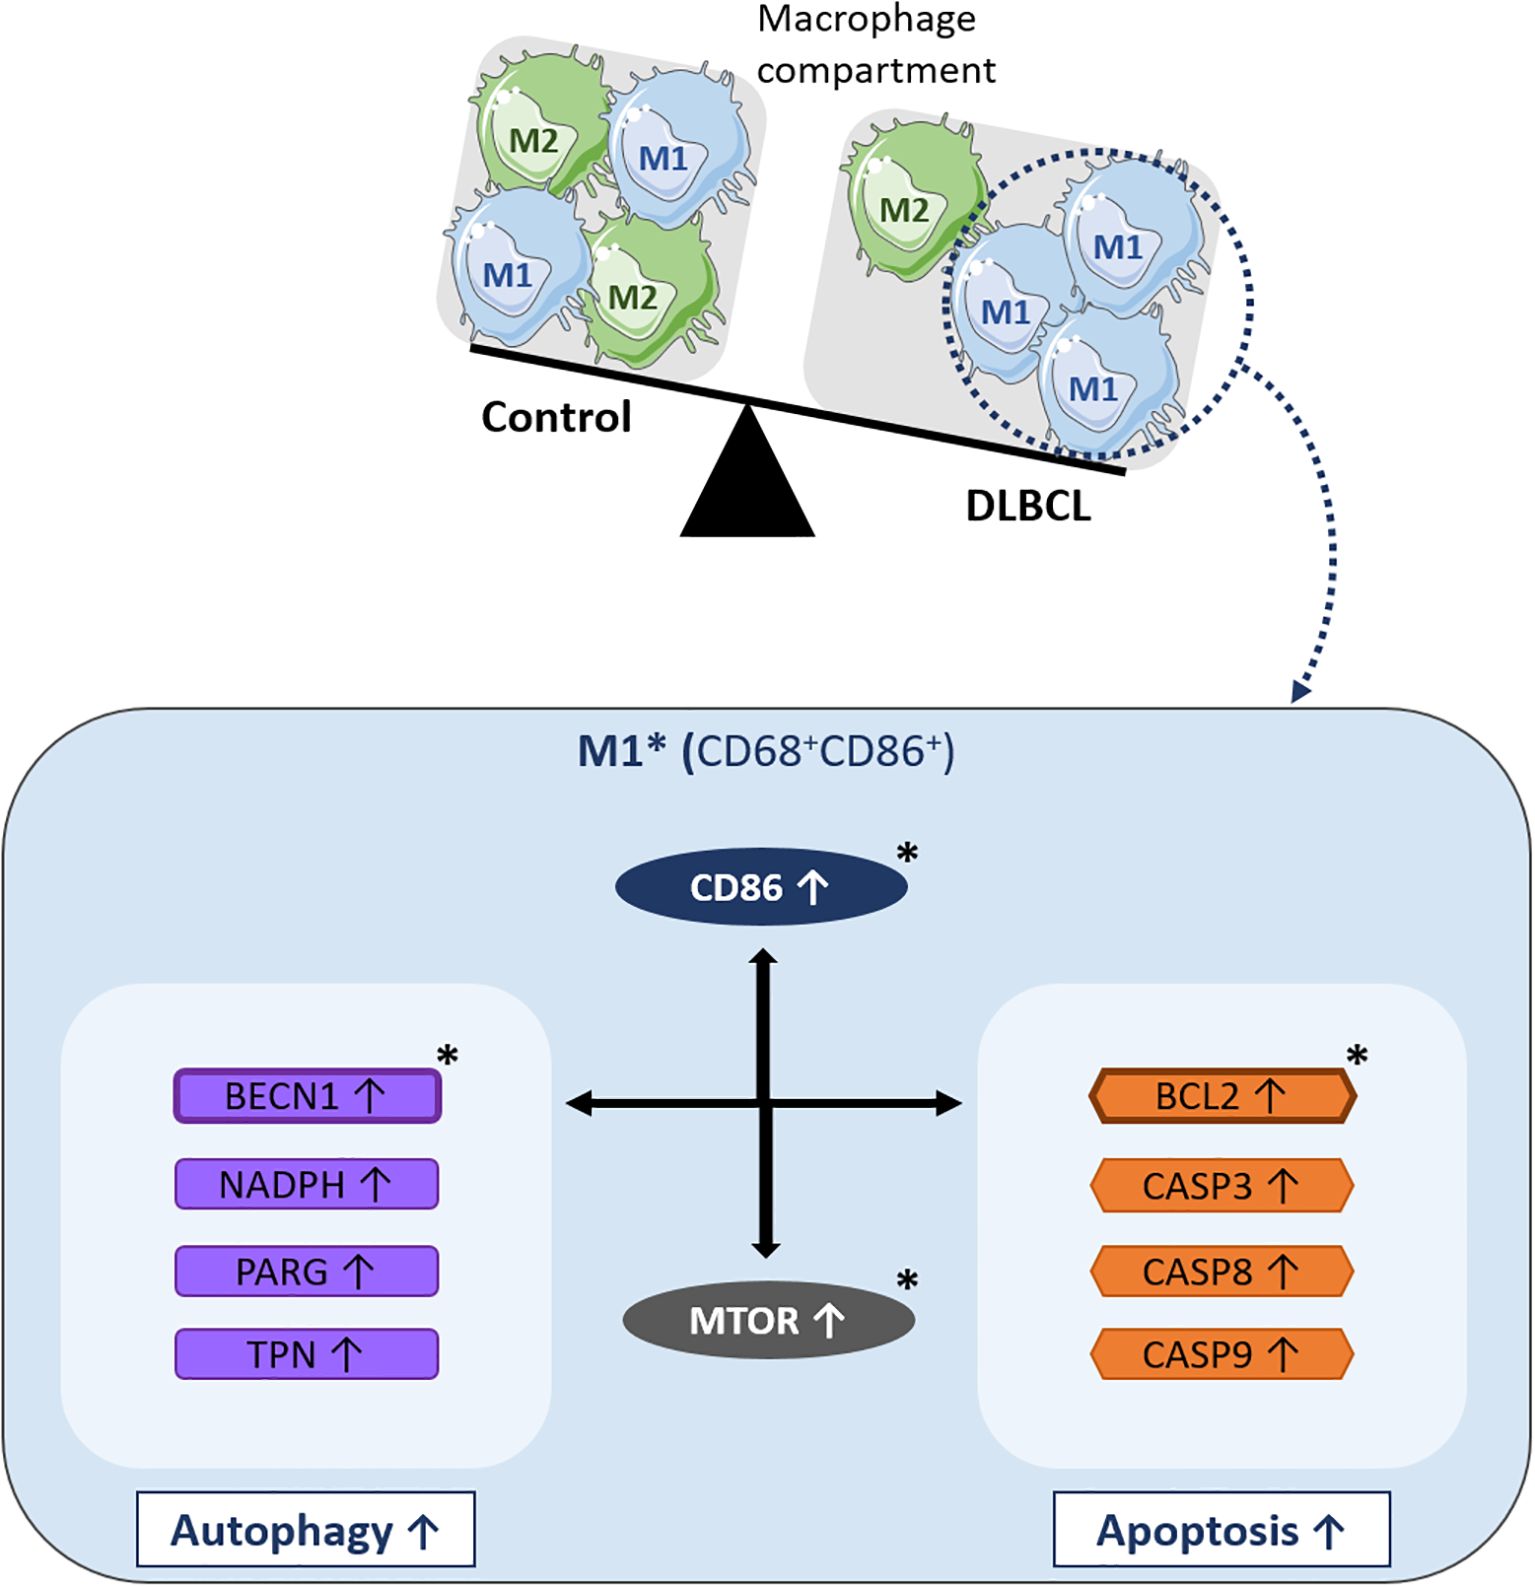
Figure 6. Schematic model of the molecular events underlying BCL2-related autophagy gene upregulation in M1 macrophages of the DLBCL microenvironment. In the macrophage compartment, the proportion of pro-inflammatory M1 macrophages is increased in DLBCL compared with non-tumor controls. Many key autophagy (BECN1, NADPH, PARG, and TPN) and apoptosis genes (BCL2, CASP3, CASP8, and CASP9) are upregulated in M1 (CD68+ CD86+) macrophages in the DLBCL microenvironment. Among these autophagy genes, BECN1 expression is correlated with that of most of the autophagy and apoptosis genes analyzed in this study. Among the apoptosis genes, BCL2 expression is correlated with that of several autophagy and apoptosis factors. Particularly, BECN1 and BCL2 expression levels are strongly correlated and both are correlated with MTOR expression (a key factor involved in important biological processes, such as inflammation and autophagy). BCL2, BECN1 and MTOR expression levels are also correlated with the expression of CD86, a main pro-inflammatory factor and one of the most important markers of M1 macrophages and inflammatory states. *indicates key factors validated at the protein level by immunohistochemistry and/or immunofluorescence analyses.
Zhou et al. developed a new autophagy-related gene signature to predict the prognosis and resistance to treatment in patients with DLBCL (39). They selected 309 autophagy-related genes from the Human Autophagy Database and GenCards database. Their final autophagy signature contained five genes: TP53INP2, identified as a risk gene, and PRKCQ, TUSC1, PRKAB1 and HIF1A as protective genes. Their expression level in patients allows determining their risk score and classifying them in two groups: high-risk (with poorer overall survival) and low-risk (with better overall survival). The authors showed that this gene signature offers a better prognostic stratification compared with classical methods (such as the International Prognostic Index scoring system). In addition, they found higher immune cell infiltration and immune activation in the low-risk group. Unlike in our survival analysis, the autophagy-related gene signature described by Zhou at al. can predict patient survival (likely due to the different size of the two patient cohorts: n=48 in our study vs n=412 in the study by Zhou et al). However, they did not investigate the immune cell type in which autophagy gene expression was upregulated and the correlation with other key physiological process, such inflammation and apoptosis. Therefore, both studies bring independent and additional findings on the importance of autophagy gene expression in DLBCL.
Although TMAs are one of the most powerful ways to investigate in situ protein expression (IHC) and interaction/co-localization (IF), the first limitations of our study is the lack of a substantial cohort of fresh patient samples to confirm our hypotheses at the single-cell and functional level. Indeed, functional studies are now needed to confirm the link between autophagy (beclin-1), apoptosis (Bcl-2) and macrophages as well as functional overexpression assays in polarized macrophages. The second important limitation is the reliance on in silico analyses, although we believe that this is a powerful and useful tool that allows the exploitation/interpretation of tremendous data amounts. In future work, we want to understand the multifaceted roles of autophagy in inflammation in the context of DLBC and clarify its involvement in cell death. As autophagy seems to play an important role in this aggressive blood cancer, it would be interesting to test/develop therapeutics to target this process, for instance nano-targeting and/or modulation of key autophagy and apoptosis components (such as beclin-1 and Bcl-2) in M1 macrophages. This approach might open new avenues for DLBCL treatment, while reducing drug toxicity (48–50).
Data availability statement
The original contributions presented in the study are included in the article/Supplementary Material. Further inquiries can be directed to the corresponding author.
Ethics statement
Ethical approval was not required for the studies on humans in accordance with the local legislation and institutional requirements because only commercially available tissue microarrays were used.
Author contributions
MR: Writing – review & editing, Software, Formal analysis. AD: Formal analysis, Writing – review & editing, Visualization. CR: Visualization, Writing – review & editing, Formal analysis. MV: Visualization, Formal analysis, Writing – review & editing. AA: Writing – review & editing, Software. MB: Visualization, Writing – review & editing, Formal analysis, Resources, Validation, Methodology, Writing – original draft, Data curation, Project administration, Supervision, Investigation, Conceptualization, Funding acquisition.
Funding
The author(s) declare that financial support was received for the research and/or publication of this article. This work was supported by Ikerbasque Basque Research Foundation, by the Spanish Ministry of Science and Innovation -ISCIII (PI21/01403, PI24/01691), and by the European Union.
Acknowledgments
Some panels of Figure 6 were adapted from Servier Medical Art (http://smart.servier.com ) and used under a Creative Commons Attribution 3.0 Unported License (CC BY 3.0) current version 4.0 published on November 2013. We thank the Biogipuzkoa histology platform for their services and help.
Conflict of interest
The authors declare that the research was conducted in the absence of any commercial or financial relationships that could be construed as a potential conflict of interest.
Generative AI statement
The author(s) declare that no Generative AI was used in the creation of this manuscript.
Any alternative text (alt text) provided alongside figures in this article has been generated by Frontiers with the support of artificial intelligence and reasonable efforts have been made to ensure accuracy, including review by the authors wherever possible. If you identify any issues, please contact us.
Publisher’s note
All claims expressed in this article are solely those of the authors and do not necessarily represent those of their affiliated organizations, or those of the publisher, the editors and the reviewers. Any product that may be evaluated in this article, or claim that may be made by its manufacturer, is not guaranteed or endorsed by the publisher.
Supplementary material
The Supplementary Material for this article can be found online at: https://www.frontiersin.org/articles/10.3389/fimmu.2025.1676563/full#supplementary-material
Supplementary Figure 1 | Circular charts summarizing the patients’ characteristics (TGCA samples): survival (A), tumor type (B), age range (C), sex (D), and treatments (E).
Supplementary Figure 2 | Expression levels of BCL2 (A), BECN1 (B) and MTOR (C) (from the TCGA database) in different cancer types (ACC: Adrenocortical carcinoma, BLCA, Bladder Urothelial Carcinoma; BRCA, Breast invasive carcinoma; CESC, Cervical squamous cell carcinoma and endocervical adenocarcinoma; CHOL, Cholangiocarcinoma; COAD, Colon adenocarcinoma; DLBC, Diffuse Large B-cell Lymphoma; ESCA, Esophageal carcinoma; GBM, Glioblastoma multiforme; HNSC, Head and neck squamous cell carcinoma; KICH, Chromophobe renal cell carcinoma; KIRC, Clear cell renal cell carcinoma; KIRP, Papillary renal cell carcinoma; LAML, Acute Myeloid Leukemia; LGG, Lower Grade Glioma; LIHC, Hepatocellular carcinoma; LUAD, Lung adenocarcinoma; LUSC, Lung squamous cell carcinoma; MESO; Mesothelioma; OV, Ovarian serous cystadenocarcinoma; PAAD, Pancreatic adenocarcinoma; PCPG, Pheochromocytoma and paraganglioma; PRAD, Prostate adenocarcinoma; READ, Rectum adenocarcinoma; SARC; Sarcoma; SKCM, Cutaneous melanoma; STAD, Stomach adenocarcinoma; TGCT, Testicular germ cell tumors; THCA, Thyroid carcinoma; THYM; Thymoma; UCEC, Uterine corpus endometrial carcinoma; UCS, Uterine carcinosarcoma; UVM, Uveal melanoma). p ≤0.05 was considered significant.
Supplementary Figure 3 | Violin plots displaying the expression profiles of BCL2 (A), BECN1 (B), CD86 (C), CSF1R (D) and MTOR (E) in the 48 DLBCL samples (TCGA dataset) classified in function of their stage. p ≤0.05 was considered significant.
Supplementary Figure 4 | Kaplan-Meier survival curves based on the expression levels (high vs low) of BECN1, NADPH, PARG and TPN (autophagy genes) (A) and of BCL2, CASP3, CASP8 and CASP9 (apoptosis genes) (B) in 48 DLBCL samples (TCGA dataset) (Supplementary Table S4). (C) Survival maps based on the comparison of the survival contribution of BECN1, NADPH, PARG and TPN, estimated using the Mantel–Cox test. (D). Survival maps based on the comparison of the survival contribution of BCL2, CASP3, CASP8 and CASP9, estimated using the Mantel–Cox test.
Supplementary Table 1 | List of the characteristics of patients with DLBCL from the TCGA dataset.
Supplementary Table 2 | List of the characteristics of the patients with DLBCL included in the TMAs used for the IHC and IF analyses.
Supplementary Table 3 | List of the characteristics of the control samples included in the TMAs used for the IHC and IF analyses.
Supplementary Table 4 | List of the differentially expressed autophagy- and apoptosis-related genes in DLBCL and control samples with their respective fold change and p values. P ≤0.05 was considered significant.
Abbreviations
BECN1, Beclin-1 gene; BCL2, B-cell lymphoma 2; CASP3, 8 and 9, caspase 3, 8 and 9, CD68 and CD86, cluster of differentiation 68 and 86, CSF1-R, colony stimulating factor 1 receptor; DC, dendritic cells; DLBCL, diffuse large B cell lymphoma; MO; monocytes, MФ; macrophages, Neuφ; neutrophils; MTOR, mammalian target of rapamycin; NADPH, Nicotinamide adenine dinucleotide phosphate; NHL, non-Hodgkin lymphoma; NK, natural killer cells; PARG, poly (ADP-ribose) glycohydrolase, TAPBP/TPN, TAP-associated glycoprotein; TME, tumor microenvironment; Treg, natural regulatory T cells.
References
1. Armitage JO, Gascoyne RD, Lunning MA, and Cavalli F. Non-hodgkin lymphoma. Lancet. (2017) 390:298–310. doi: 10.1016/S0140-6736(16)32407-2
2. Amin R and Braza MS. The follicular lymphoma epigenome regulates its microenvironment. J Exp Clin Cancer Res. (2022) 41:21. doi: 10.1186/s13046-021-02234-9
3. Ochando J and Braza MS. T follicular helper cells: a potential therapeutic target in follicular lymphoma. Oncotarget. (2017) 8:112116–31. doi: 10.18632/oncotarget.22788
4. Basso K and Dalla-Favera R. Germinal centres and B cell lymphomagenesis. Nat Rev Immunol. (2015) 15:172–84. doi: 10.1038/nri3814
5. de Leval L and Harris NL. Variability in immunophenotype in diffuse large B-cell lymphoma and its clinical relevance. Histopathology. (2003) 43:509–28. doi: 10.1111/j.1365-2559.2003.01758.x
6. Intlekofer AM and Younes A. Precision therapy for lymphoma–current state and future directions. Nat Rev. (2014) 11:585–96. doi: 10.1038/nrclinonc.2014.137
7. Miao Y, Medeiros LJ, Li Y, Li J, and Young KH. Genetic alterations and their clinical implications in DLBCL. Nat Rev. (2019) 16:634–52. doi: 10.1038/s41571-019-0225-1
8. Caro P, Kishan AU, Norberg E, Stanley IA, Chapuy B, Ficarro SB, et al. Metabolic signatures uncover distinct targets in molecular subsets of diffuse large B cell lymphoma. Cancer Cell. (2012) 22:547–60. doi: 10.1016/j.ccr.2012.08.014
9. Le A, Lane AN, Hamaker M, Bose S, Gouw A, Barbi J, et al. Glucose-independent glutamine metabolism via TCA cycling for proliferation and survival in B cells. Cell Metab. (2012) 15:110–21. doi: 10.1016/j.cmet.2011.12.009
10. Kobayashi S. Choose delicately and reuse adequately: the newly revealed process of autophagy. Biol Pharm bulletin. (2015) 38:1098–103. doi: 10.1248/bpb.b15-00096
11. Jia L, Dourmashkin RR, Allen PD, Gray AB, Newland AC, and Kelsey SM. Inhibition of autophagy abrogates tumour necrosis factor alpha induced apoptosis in human T-lymphoblastic leukaemic cells. Br J haematology. (1997) 98:673–85. doi: 10.1046/j.1365-2141.1997.2623081.x
12. Mizushima N, Levine B, Cuervo AM, and Klionsky DJ. Autophagy fights disease through cellular self-digestion. Nature. (2008) 451:1069–75. doi: 10.1038/nature06639
13. Rao S, Tortola L, Perlot T, Wirnsberger G, Novatchkova M, Nitsch R, et al. A dual role for autophagy in a murine model of lung cancer. Nat Commun. (2014) 5:3056. doi: 10.1038/ncomms4056
14. Jia L, Gopinathan G, Sukumar JT, and Gribben JG. Blocking autophagy prevents bortezomib-induced NF-kappaB activation by reducing I-kappaBalpha degradation in lymphoma cells. PloS One. (2012) 7:e32584. doi: 10.1371/journal.pone.0032584
15. Mathew R, Karp CM, Beaudoin B, Vuong N, Chen G, Chen HY, et al. Autophagy suppresses tumorigenesis through elimination of p62. Cell. (2009) 137:1062–75. doi: 10.1016/j.cell.2009.03.048
16. Wu WK, Coffelt SB, Cho CH, Wang XJ, Lee CW, Chan FK, et al. The autophagic paradox in cancer therapy. Oncogene. (2012) 31:939–53. doi: 10.1038/onc.2011.295
17. Xu HD and Qin ZH. Beclin 1, bcl-2 and autophagy. Adv Exp Med Biol. (2019) 1206:109–26. doi: 10.1007/978-981-15-0602-4_5
18. Zhong Y, Wang QJ, Li X, Yan Y, Backer JM, Chait BT, et al. Distinct regulation of autophagic activity by Atg14L and Rubicon associated with Beclin 1-phosphatidylinositol-3-kinase complex. Nat Cell Biol. (2009) 11:468–76. doi: 10.1038/ncb1854
19. Hoppe MM, Jaynes P, Shuangyi F, Peng Y, Sridhar S, Hoang PM, et al. Patterns of oncogene coexpression at single-cell resolution influence survival in lymphoma. Cancer Discov. (2023) 13:1144–63. doi: 10.1158/2159-8290.CD-22-0998
20. Serna L, Azcoaga P, Brahmachary M, Caffarel MM, and Braza MS. Diffuse large B-cell lymphoma microenvironment displays a predominant macrophage infiltrate marked by a strong inflammatory signature. Front Immunol. (2023) 14:1048567. doi: 10.3389/fimmu.2023.1048567
21. Tang Z, Li C, Kang B, Gao G, Li C, and Zhang Z. GEPIA: a web server for cancer and normal gene expression profiling and interactive analyses. Nucleic Acids Res. (2017) 45:W98–W102. doi: 10.1093/nar/gkx247
22. Tang Z, Kang B, Li C, Chen T, and Zhang Z. GEPIA2: an enhanced web server for large-scale expression profiling and interactive analysis. Nucleic Acids Res. (2019) 47:W556–W60. doi: 10.1093/nar/gkz430
23. Li C, Tang Z, Zhang W, Ye Z, and Liu F. GEPIA2021: integrating multiple deconvolution-based analysis into GEPIA. Nucleic Acids Res. (2021) 49:W242–W6. doi: 10.1093/nar/gkab418
24. Cerami E, Gao J, Dogrusoz U, Gross BE, Sumer SO, Aksoy BA, et al. The cBio cancer genomics portal: an open platform for exploring multidimensional cancer genomics data. Cancer Discov. (2012) 2:401–4. doi: 10.1158/2159-8290.CD-12-0095
25. Gao J, Aksoy BA, Dogrusoz U, Dresdner G, Gross B, Sumer SO, et al. Integrative analysis of complex cancer genomics and clinical profiles using the cBioPortal. Sci Signal. (2013) 6:pl1. doi: 10.1126/scisignal.2004088
26. de Bruijn I, Kundra R, Mastrogiacomo B, Tran TN, Sikina L, Mazor T, et al. Analysis and visualization of longitudinal genomic and clinical data from the AACR project GENIE biopharma collaborative in cBioPortal. Cancer Res. (2023) 83:3861–7. doi: 10.1158/0008-5472.CAN-23-0816
27. Li T, Fu J, Zeng Z, Cohen D, Li J, Chen Q, et al. TIMER2.0 for analysis of tumor-infiltrating immune cells. Nucleic Acids Res. (2020) 48:W509–W14. doi: 10.1093/nar/gkaa407
28. Li T, Fan J, Wang B, Traugh N, Chen Q, Liu JS, et al. TIMER: A web server for comprehensive analysis of tumor-infiltrating immune cells. Cancer Res. (2017) 77:e108–e10. doi: 10.1158/0008-5472.CAN-17-0307
29. Li B, Severson E, Pignon JC, Zhao H, Li T, Novak J, et al. Comprehensive analyses of tumor immunity: implications for cancer immunotherapy. Genome Biol. (2016) 17:174. doi: 10.1186/s13059-016-1028-7
30. Ceron R, Martinez A, Ramos C, de la Cruz A, Garcia A, Mendoza I, et al. Overexpression of BCL2, BCL6, VEGFR1 and TWIST1 in circulating tumor cells derived from patients with DLBCL decreases event-free survival. Onco Targets Ther. (2022) 15:1583–95. doi: 10.2147/OTT.S386562
31. Tremble LF, McCabe M, Walker SP, McCarthy S, Tynan RF, Beecher S, et al. Differential association of CD68(+) and CD163(+) macrophages with macrophage enzymes, whole tumour gene expression and overall survival in advanced melanoma. Br J Cancer. (2020) 123:1553–61. doi: 10.1038/s41416-020-01037-7
32. Bianconi S, Leppik L, Oppermann E, Marzi I, and Henrich D. Direct current electrical stimulation shifts THP-1-derived macrophage polarization towards pro-regenerative M2 phenotype. Int J Mol Sci. (2024) 25:1-17. doi: 10.3390/ijms25137272
33. Ispirjan M, Marx S, Freund E, Fleck SK, Baldauf J, Roessler K, et al. Markers of tumor-associated macrophages and microglia exhibit high intratumoral heterogeneity in human glioblastoma tissue. Oncoimmunology. (2024) 13:2425124. doi: 10.1080/2162402X.2024.2425124
34. Caffarel MM and Braza MS. Microglia and metastases to the central nervous system: victim, ravager, or something else? J Exp Clin Cancer Res. (2022) 41:327. doi: 10.1186/s13046-022-02535-7
35. Cioroianu AI, Stinga PI, Sticlaru L, Cioplea MD, Nichita L, Popp C, et al. Tumor microenvironment in diffuse large B-cell lymphoma: role and prognosis. Analytical Cell Pathol (Amsterdam). (2019) 2019:8586354. doi: 10.1155/2019/8586354
36. Zhou H, Zheng C, and Huang DS. A prognostic gene model of immune cell infiltration in diffuse large B-cell lymphoma. PeerJ. (2020) 8:e9658. doi: 10.7717/peerj.9658
37. Oh JE and Lee HK. Pattern recognition receptors and autophagy. Front Immunol. (2017) 5:300. doi: 10.3389/fimmu.2014.00300
38. Cui B, Lin H, Yu J, Yu J, and Hu Z. Autophagy and the immune response. Adv Exp Med Biol. (2019) 1206:595–634. doi: 10.1007/978-981-15-0602-4_27
39. Zhou X, He YZ, Liu D, Lin CR, Liang D, Huang R, et al. An autophagy-related gene signature can better predict prognosis and resistance in diffuse large B-cell lymphoma. Front Genet. (2022) 13:862179. doi: 10.3389/fgene.2022.862179
40. McCarthy A, Marzec J, Clear A, Petty RD, Coutinho R, Matthews J, et al. Dysregulation of autophagy in human follicular lymphoma is independent of overexpression of BCL-2. Oncotarget. (2014) 5:11653–68. doi: 10.18632/oncotarget.2605
41. Decuypere JP, Parys JB, and Bultynck G. Regulation of the autophagic bcl-2/beclin 1 interaction. Cells. (2012) 1:284–312. doi: 10.3390/cells1030284
42. Yan X, Zhou R, and Ma Z. Autophagy-cell survival and death. Adv Exp Med Biol. (2019) 1206:667–96. doi: 10.1007/978-981-15-0602-4_29
43. Liu S, Yao S, Yang H, Liu S, and Wang Y. Autophagy: Regulator of cell death. Cell Death Dis. (2023) 14:648. doi: 10.1038/s41419-023-06154-8
44. Noguchi M, Hirata N, Tanaka T, Suizu F, Nakajima H, and Chiorini JA. Autophagy as a modulator of cell death machinery. Cell Death Dis. (2020) 11:517. doi: 10.1038/s41419-020-2724-5
45. Wang Y and Zhang H. Regulation of autophagy by mTOR signaling pathway. Adv Exp Med Biol. (2019) 1206:67–83. doi: 10.1007/978-981-15-0602-4_3
46. Liu GY and Sabatini DM. mTOR at the nexus of nutrition, growth, ageing and disease. Nat Rev Mol Cell Biol. (2020) 21:183–203. doi: 10.1038/s41580-019-0199-y
47. Saxton RA and Sabatini DM. mTOR signaling in growth, metabolism, and disease. Cell. (2017) 168:960–76. doi: 10.1016/j.cell.2017.02.004
48. Braza MS, van Leent MMT, Lameijer M, Sanchez-Gaytan BL, Arts RJW, Perez-Medina C, et al. Inhibiting inflammation with myeloid cell-specific nanobiologics promotes organ transplant acceptance. Immunity. (2018) 49:819–28 e6. doi: 10.1016/j.immuni.2018.09.008
49. Ochando J and Braza MS. Nanoparticle-based modulation and monitoring of antigen-presenting cells in organ transplantation. Front Immunol. (2017) 8:1888. doi: 10.3389/fimmu.2017.01888
Keywords: lymphoma, macrophages, inflammation, autophagy, BCL2
Citation: Resanoa M, Delgado A, Rodiño C, Villar M, Aiastui A and Braza MS (2025) In the diffuse large B-cell lymphoma microenvironment, autophagy genes are upregulated in pro-inflammatory macrophages and linked to BCL2 overexpression. Front. Immunol. 16:1676563. doi: 10.3389/fimmu.2025.1676563
Received: 30 July 2025; Accepted: 11 November 2025; Revised: 05 October 2025;
Published: 03 December 2025.
Edited by:
Cyrus Khandanpour, Klinik für Hämatologie und Onkologie, GermanyCopyright © 2025 Resanoa, Delgado, Rodiño, Villar, Aiastui and Braza. This is an open-access article distributed under the terms of the Creative Commons Attribution License (CC BY). The use, distribution or reproduction in other forums is permitted, provided the original author(s) and the copyright owner(s) are credited and that the original publication in this journal is cited, in accordance with accepted academic practice. No use, distribution or reproduction is permitted which does not comply with these terms.
*Correspondence: Mounia S. Braza, aW5mbGFtbWF0aW9uRExCQ0wyNUBwcm90b25tYWlsLmNvbQ==