 Xin Chai1†Hongli Wang2,3†Boxiang Wang2†Yanchun Ma3Xiaoyan Zhang3Jing Guo3Shuping Luo3Yan Wang3Jinpeng Hong3Qiang Ma3Jiayu Chen3Biaomeng Wang3*
 Yixuan Wang3*
- 1Department of Emergency, An Ning Attached Medical Area, The 940th Hospital of Joint Logistics Support Force of Chinese People's Liberation Army (PLA), Lanzhou, China
- 2Graduate School of Gansu University of Traditional Chinese Medicine, Lanzhou, China
- 3Department of Gastroenterology, The 940th Hospital of Joint Logistics Support Force of Chinese People's Liberation Army (PLA), Lanzhou, China
Background: Dysbiosis of the gut microbiota (GM) has been linked to inflammatory bowel disease (IBD), yet its associated molecular mechanisms remain poorly defined. Identifying causal host genes mediating GM-IBD interactions is therefore of great importance.
Objective: To identify GM-associated causal genes for IBD and to prioritize key targets and cell types underlying GM-host crosstalk.
Methods: We integrated GWAS datasets of GM, UC, and CD using a two-sample Mendelian randomization (MR) framework with IVW as the primary estimator. Causal SNPs were mapped to genes for enrichment analyses. Candidate genes were refined by intersecting MR-derived genes with bulk RNA-seq DEGs (training: GSE87473, validation: GSE75214) and prioritized using nested cross-validated machine-learning models. Single-cell RNA-seq (GSE116222) was used to localize key genes to specific cell types. The functional role of TNIK was validated in IL-10-/- IBD mice via AAV9-mediated overexpression. Immunohistochemical staining of Ki67 and Cleaved caspase 3 was conducted to evaluate epithelial proliferation and apoptosis in colonic tissues.
Results: MR analysis identified 307 and 360 GM-associated causal genes for UC and CD, respectively. TNIK (TRAF2 and NCK-interacting kinase) was highlighted as a key candidate gene. Seven TNIK-associated immune cell subsets showed altered infiltration in UC. Single-cell transcriptomics revealed TNIK dysregulation in colonocytes, goblet cells. T/NK cells in UC. TNIK overexpression in IL-10-/- mice reduced disease severity and downregulated IL-1β, IL-6, and TNF-α. Immunohistochemistry confirmed that TNIK overexpression enhanced Ki67 expression and reduced Cleaved caspase 3 expression.
Conclusion: By integrating MR with transcriptomics and single-cell seq results, we identified TNIK as a potential GM-associated host kinase linking dysbiosis to epithelial and immune dysfunction in IBD. TNIK emerges as a promising node for IBD prognosis through barrier maintenance and immune regulation.
Introduction
Inflammatory bowel disease (IBD) is recognized as a chronic, relapsing inflammatory disorder of the gastrointestinal tract, encompassing primarily ulcerative colitis (UC) and Crohn’s disease (CD) (1). Previous researches indicated that the pathogenesis of IBD involves genetic predisposition, dysregulated intestinal immune responses, and environmental factors (2, 3). Current therapies aim mainly to control inflammation and induce remission, but no curative therapy is available (4–7). Existing treatments exhibit limited success rates and notable drawbacks (8).
Recent studies have suggested that imbalances in gut microbiota (GM) disrupt mucosal homeostasis and promote aberrant inflammatory responses, leading to the initiation and progression of IBD (9–11). Patients with IBD consistently show GM dysbiosis, characterized by disrupted microbial composition and diversity (12–14). Typical features include reduced microbial richness, depletion of health-promoting microbes (e.g., short-chain fatty acid-producing bacteria), and overgrowth of potentially pathogenic species (15). For instance, CD patients exhibit significantly reduced abundance of the anti-inflammatory commensal bacterium Faecalibacterium prausnitzii, while opportunistic pathogens showed abnormal proliferation within the intestinal environment of IBD gut (16–18). Accordingly, therapeutic strategies targeting GM modulation have gained attention for IBD intervention, including probiotic administration and fecal microbiota transplantation (FMT) (19). Nevertheless, the molecular pathways through which gut microbes modulate the intestinal milieu of IBD patients are far from fully elucidated.
Mendelian randomization (MR) is a genetic approach for causal inference that uses genetic variants associated with an exposure as instrumental variables (IVs) to evaluate the causal relationship between the exposure and disease outcomes, thereby reducing the influence of confounding factors and reverse causation to some extent. Previous studies have applied MR to investigate inflammatory bowel disease (IBD) in relation to periodontitis (20), atrial fibrillation (21), and plasma caffeine concentration (22). In recent years, several studies have applied MR to investigate the causal relationship between the GM and IBD, but most have focused on the microbial level (23–25). However, the molecular regulatory mechanisms linking GM and the host remain unclear.
Based on this background, we performed a two-sample MR analysis and integrated bulk RNA-seq data with machine-learning approaches to identify potential key nodes. We then conducted immune infiltration analysis and single-cell RNA-seq to characterize their cellular heterogeneity. Finally, vivo experiments were performed to validate the candidate nodes. By uncovering key microbial–host molecular pathways, this study may provide novel targets for more effective and personalized therapeutic strategies in IBD.
Materials and methods
Study design
The experimental design of this study is shown in Figure 1.
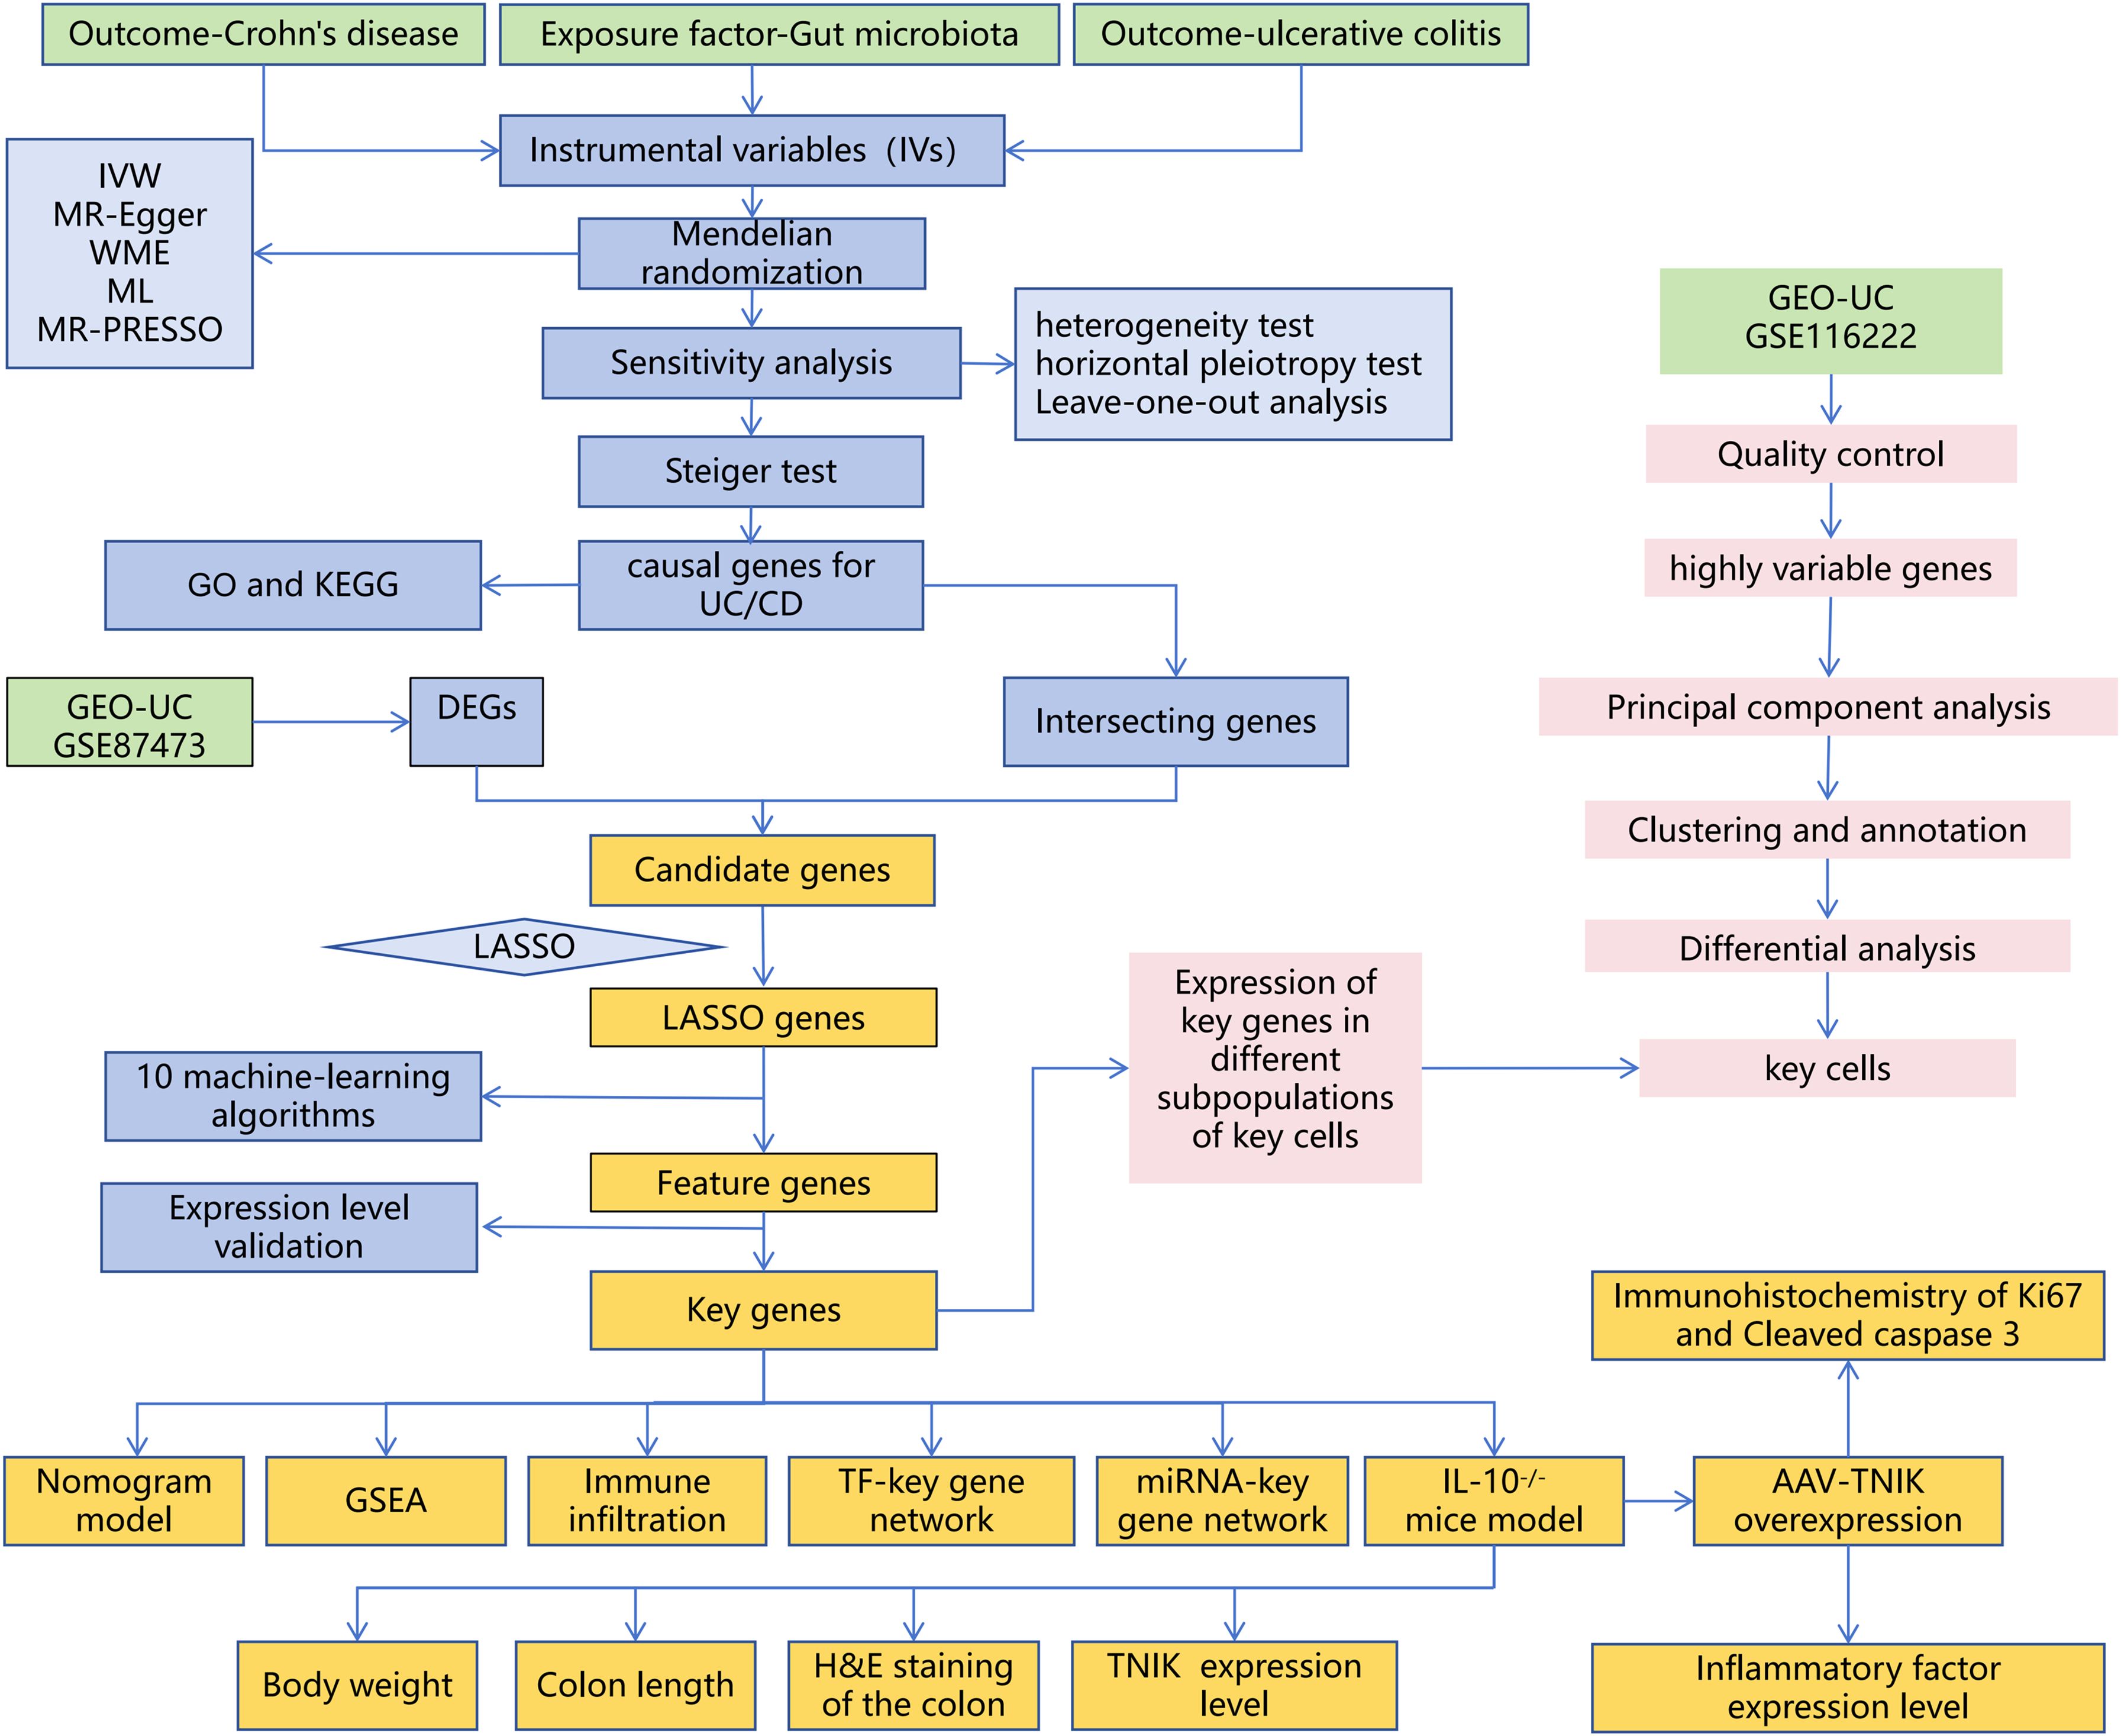
Figure 1. Overall workflow of the study. The study integrates MR, bulk RNA-seq, sc RNA-seq, and animal experiments.
Data acquisition
GM data were retrieved from the MiBioGen consortium database (26), comprising 211 microbial classifications with 14, 587 associated single nucleotide polymorphisms (SNPs). The genome-wide association study (GWAS) data for UC and Crohn’s disease (CD) were sourced from the IEU OpenGWAS database (27). The UC data were obtained from the “EBI-A-GCST90018933” dataset (European population, 5, 371 cases and 412, 561 controls, 24, 187, 301 SNPs). The CD data were obtained from the “IEU-A-30” dataset (5, 956 cases and 14, 927 controls, 12, 276, 506 SNPs). The bulk RNA-seq datasets included GSE87473 (28) (UC = 106, controls = 21, used as the training set) and GSE75214 (29) (UC = 74, controls = 11, used as the validation set). GSE92415 (30) (placebo-treated UC patients = 53, controls = 21) was used for correlation analysis with the Mayo score. The scRNA-seq dataset selected was GSE116222 (31) (UC = 3, controls = 3).
Mendelian randomization
GM was treated as the exposure factor, while UC and CD served as outcome variables. The MR analysis was based on three principal assumptions: (1) The selected IVs are closely linked to the exposure variable. (2) IVs exert their effect on the endpoint uniquely through the exposure mechanism. (3) The IVs are not confounded by external factors. Five MR methods were applied: Inverse Variance Weighted (IVW), weighted median, MR-Egger, weighted mode, and simple mode. Among these, IVW was adopted as the primary method to identify causal microbial associations (P < 0.05) (32). Cochran’s Q test was used to evaluate heterogeneity (33), while the Egger intercept and MR-PRESSO were employed to evaluate horizontal pleiotropy (34). The leave-one-out (LOO) method was applied to verify the stability of MR estimates, and the Steiger’s approach for directional causality assessment was implemented to verify the cause-effect relationship. Finally, the identified SNPs were mapped to their corresponding genes, followed by biological functional enrichment analysis (GO and KEGG pathway).
Selection of IVs
To identify IVs associated with the exposure factor, SNPs related to five taxonomic levels of gut bacterial traits were extracted from the GWAS database extraction of IVs was performed with the extract_instruments function from TwoSampleMR (v0.6.8). Independent SNPs linked to the exposure factor were determined according to the following filtering thresholds: (1) P < 1×10⁻⁵ (35, 36). (2) R2 < 0.001, kb = 10 (to avoid bias from LD). (3) SNPs exhibiting p-value significance with the endpoint were filtered out (proxies = TRUE, rsq = 0.8). (4) Weak Instrument Filtering (F < 10), the F-statistic was calculated as: F=R2(N-K-1)/[K(1-R)2)], with R² being the sum of variance explained by the chosen SNPs, K representing SNP quantity, and N referring to the GWAS population size. (5) Palindromic SNPs and exposure factors with fewer than 3 SNPs were excluded. Finally, we mapped the selected SNPs to their corresponding genes using the gprofiler2 (v0.2.3) package for downstream functional analyses.
Identification of differentially expressed genes and screening of candidate genes
DEG analysis in the GSE87473 dataset was conducted with the R package limma (v3.62.0). Thresholds of |log2FC| > 0.5 and adjusted p-value < 0.05 were applied, and the results were visualized using ggplot2 (v3.5.1) and pheatmap (v1.0.12). Subsequently, overlapping genes were identified by intersecting the DEGs with UC causal genes and CD causal genes. The candidate genes were further refined using LASSO regression implemented in the R package glmnet (v4.1.8), with 10-fold cross-validation applied to select the most predictive candidates.
Screening of key genes
The mlr3 (v0.22.1.9000) R package was employed to construct an ensemble machine learning model, in which ten distinct algorithms were integrated for training and evaluation. Subsequently, the pROC (v1.18.5) package was used to generate ROC curves and compute area under the curve (AUC) values, enabling the identification of optimal-performing models for candidate gene analysis and key gene selection. To assess model stability, 10 repetitions of 10-fold cross-validation were performed. ROC curves were plotted for each model, and the mean AUC values from repeated cross-validation were reported. For each model, the AUC, sensitivity, and specificity values were recorded. Models with all metrics > 0.8 and AUC ≠ 1 were considered stable and well-performing and were designated as “optimal models.”. Genes retained in the optimal models were defined as feature genes. To assess the clinical relevance of the key genes, Spearman correlation analysis was performed using the psych (v2.4.12) package on the GSE92415 dataset, evaluating their relationship with the Mayo score. Correlations with |cor| > 0.3 and P < 0.05 were considered statistically meaningful. Finally, the key genes expressions were validated across the GSE87473 and GSE75214 datasets using the Wilcoxon rank-sum test to ensure consistent differential expression trends.
Construction and evaluation of the nomogram model
To estimate the probability of key genes predicting IBD risk, a nomogram model was developed using the rms (v7.0.0) R package in the training set GSE87473. The model assigned scores according to expression levels of selected genes. The aggregated score was utilized to estimate diagnostic probability. The final model was formulated as follows: Logit(P)=15.9996+(1.0108×TMEM163) + (−2.7965×TNIK). Where P represents the predicted probability of UC. Subsequently, the calibrate function from the rms (v7.0.0) package was employed to plot calibration curves in the training set GSE87473, assessing the predictive accuracy of the nomogram for IBD occurrence. To assess the clinical applicability of the nomogram model, decision curve analysis (DCA) was conducted via the ggDCA (v1.2) package in the training set GSE87473, illustrating the net benefit (Net Benefit) of different models under varying gene combinations. Finally, the pROC package applied to generate ROC curves for both the nomogram and individual genes, with the AUC computed to assess predictive effectiveness.
Immune infiltration analysis
To profile the immunological microenvironment in IBD, immune cell infiltration proportions in UC and normal control samples from the training set GSE87473 were calculated using CIBERSORT (P < 0.05). Immune cells exhibiting significant alterations were identified using the Wilcoxon rank-sum test (P < 0.05). Subsequently, Spearman correlations between key genes and differentially infiltrated immune cells in GSE87473 were analyzed using the psych (v2.4.12) package, with statistical significance defined as |cor| > 0.3 and P < 0.05.
Single-cell transcriptome processing and identification of key cell types
To elucidate the distribution and functional significance of key genes across cellular subpopulations, the GSE116222 dataset was processed using the Seurat (v5.1.0) package’s CreateSeuratObject function. The analysis incorporated these quality assurance parameters: (1) Number of genes detected per cell (nFeature_RNA): 200–8, 000. (2) Total UMI counts per cell (nCount_RNA): 200–30, 000. (3) Mitochondrial gene proportion (percent.mt): < 20%. (4) Gene inclusion threshold: detected in ≥ 3 cells. The top 2, 000 highly variable genes (HVGs) were selected for principal component analysis (PCA). Cell clustering was performed using the top 30 PCs through the FindClusters function, with subsequent visualization via UMAP (RunUMAP). Cluster - specific marker genes were identified via the FindMarkers function (Seurat v5.1.0), with thresholds of log2FC > 1 and adjusted P-value ≤ 0.05. Cell type annotation was carried out based on the CellMarker database and relevant literature references. Differentially enriched cell populations were identified by calculating the odds ratio (OR) across samples. Gene ontology enrichment of these cell types was carried out employing the analyze_sc_clusters function provided by the ReactomeGSA (v1.20.0) package. Finally, key cell populations were identified by analyzing the expression profiles of key genes across differentially enriched clusters using the Seurat package.
Animals
Sixteen-week-old male BALB/cAnCya and IL-10-/- (BALB/c-Il10 KO) mice were purchased from Cyagen Biosciences Inc. (USA). All mice were acclimatized for 1–2 weeks and housed under standardized conditions (23 ± 2 °C, 55 ± 5% humidity, 12-hour light/dark cycle) (37). All animal experiments were carried out under approved guidelines with oversight from the Ethics Committee of the 940th Hospital of Joint Logistics Support Force of Chinese PLA (approval number: 2023KYLL028). Since body weight change serves as a key indicator of intestinal health, we monitored the mice’s body weight during the experimental period (20–22 weeks of age). Upon study completion, mice were euthanized by cervical dislocation performed by trained personnel and complete colon tissues were collected for length measurement.
Construction of recombinant virus
AAV9, widely utilized in intestinal research for its high transduction efficiency, was employed to construct recombinant viruses in this study (38). Since AAV-mediated gene expression typically begins 1–2 weeks after injection and IL-10−/− mice develop severe phenotypes by 22 weeks of age, the mice were divided into two groups at 20 weeks of age (n = 8 per group) and were administered AAV-EGFP or AAV-TNIK via tail vein injection.
Hematoxylin and eosin staining
H&E staining was performed in accordance with the manufacturer’s instructions (Beyotime, China). The isolated distal colon was first fixed in 4% paraformaldehyde, followed by stepwise dehydration in ethanol solutions of progressively higher concentrations (70%, 80%, 90%, and 100%), with 1-hour treatment durations, followed by xylene clearing (three changes, 1 hour each), and subsequently embedded in paraffin. Paraffin-embedded tissues were sliced into 7 μm sections, processed with H&E staining, and examined under bright-field microscopy. The scoring criteria included inflammatory cell infiltration, mucosal edema, crypt swelling and disruption, and epithelial cell damage (39). Each parameter was graded on a scale of 0–3 according to the extent and severity of pathological changes, and the total histological score was calculated as the sum of all parameters.
qRT-PCR
Total RNA was isolated from colon tissues using the TRIzol reagent (Invitrogen, USA). GAPDH served as the internal control gene. All reactions were conducted in triplicate. We analyzed the comparative expression of selected genes using the 2-ΔΔCt method. The primer sequences were as follows: TNIK, F-5’-CTGCTCGTTGACCTCACAGT-3’, R-5’-CCTGGTGGTCTCTTAAAATGCAA-3’. GAPDH, F-5’-TGTGTCCGTCGTGGaTCTGA-3’, R-5’-TTGCTGTTGAAGTCGCAGGAG-3’.
Western blot
Proteins from colon tissues were extracted using RIPA lysis buffer (Beyotime, China), and quantification of protein levels was performed via the BCA method (Servicebio, China). After SDS-PAGE separation, proteins were transferred via semi-dry transfer and subsequently blocked with blocking solution (Beyotime, China) for 1 hour. Membranes were incubated overnight at 4 °C with primary antibodies: anti-TNIK (ab308194, Abcam), anti-IL-1β (ab2105, Abcam), anti-IL-6 (ab9324, Abcam), anti-TNFα (ab1793, Abcam), and anti-GAPDH (ab9485, Abcam). Then, Goat Anti-Rabbit IgG H&L (HRP) (ab6721, Abcam) or Goat Anti-Mouse IgG H&L (HRP) (ab205719, Abcam) were incubated at room temperature for 1 hour. ECL reagent was applied for immunoblot signal detection (Solarbio, China).
Immunohistochemistry
Colon tissues were fixed in 4% paraformaldehyde (PFA, Servicebio, China), dehydrated, embedded in paraffin, and sectioned at a thickness of 4 μm. The sections were deparaffinized in xylene and rehydrated through graded ethanol solutions. Antigen retrieval was performed by boiling the sections in 10 mM sodium citrate buffer (pH 6.0, Servicebio, China) for 15 min. Endogenous peroxidase activity was quenched with 3% hydrogen peroxide (Sinopharm Chemical Reagent, China), followed by blocking with 5% bovine serum albumin (BSA, Sigma–Aldrich, USA) for 30 min at room temperature. The sections were then incubated overnight at 4 °C with the following primary antibodies: Ki67 (ab15580, Abcam, UK) and Cleaved caspase 3 (#9661, Cell Signaling Technology, USA). After washing with PBS, the sections were incubated with an HRP-conjugated goat anti-rabbit secondary antibody (Servicebio, China) for 1 h at room temperature. Immunoreactivity was visualized using a DAB detection kit (Servicebio, China), and nuclei were counterstained with hematoxylin (Solarbio, China). Finally, the slides were dehydrated, mounted with neutral resin (Solarbio, China), and examined under a Leica DM2000 light microscope (Leica Microsystems, Germany).
Statistical analysis
Statistical computations were performed with R (v4.2.0) and GraphPad Prism 9.0. For MR analysis, multiple testing correction was performed using the Hochberg method. For experimental data analysis, continuous variables were expressed as the mean ± standard deviation (SD). Normality of data distribution was assessed using the Shapiro–Wilk test. For comparisons between two groups, an unpaired two-tailed Student’s t-test was used for normally distributed data, whereas the Wilcoxon rank-sum test was applied for nonparametric data. For comparisons among multiple groups, a two-way ANOVA followed by Tukey’s post hoc test was conducted. All statistical tests were two-tailed, and results were considered statistically significant at *P < 0.05, **P < 0.01, and ***P < 0.001.
Results
Selection and validation of instrumental SNPs for MR
In accordance with the methodology described above, a total of 965 SNPs were obtained, all of which showed F-statistics > 10, indicating no weak instrument bias. These selected SNPs met the relevance assumption required for MR analysis. Only the top 10 SNPs, ranked by F-statistics, are presented in Table 1, while the full list is provided in Supplementary Table 1.
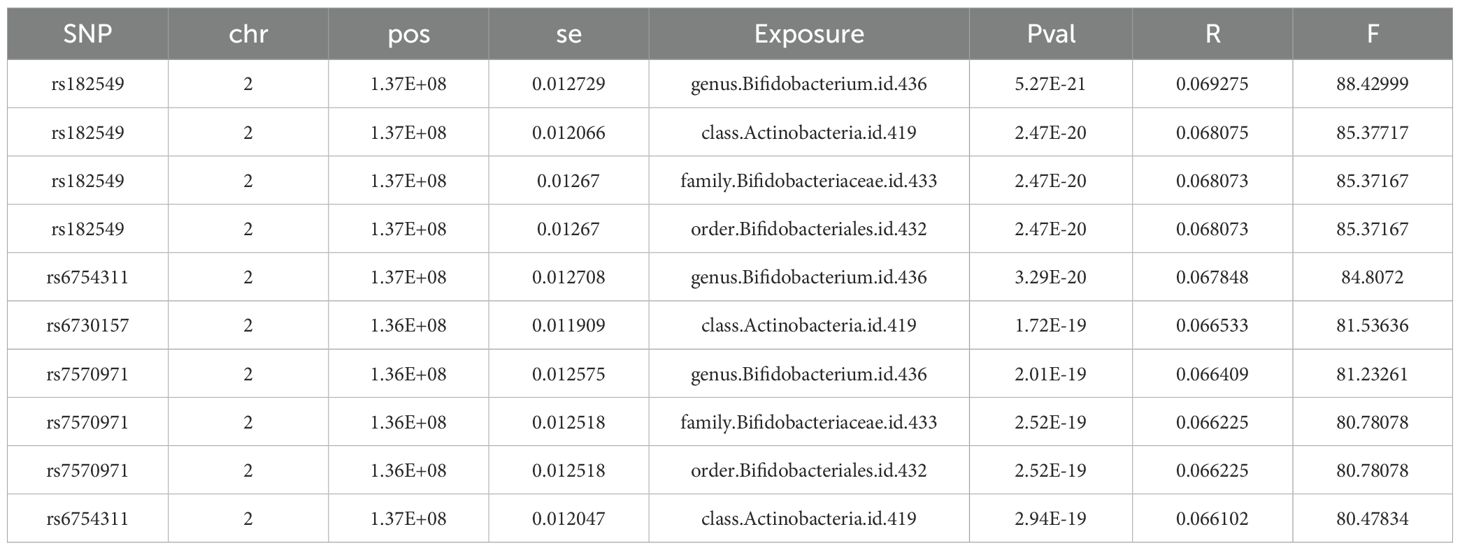
Table 1. SNPs obtained by screening.
Causal relationships between GM and IBD
By MR analysis, based on the IVW method, 22 gut microbial taxa significantly linked to UC (P < 0.05, Figure 2A), including 8 risk factors (OR > 1, 95% confidence interval [CI] > 1) and 14 protective factors (OR < 1, 95% CI < 1). Meanwhile, 26 intestinal flora were found to be significantly causally associated with CD (P < 0.05), including 12 risk factors and 14 protective factors (Figure 2B). Detailed causal effect estimates between specific gut microbial taxa and IBD types were shown in Supplementary Figure 1.
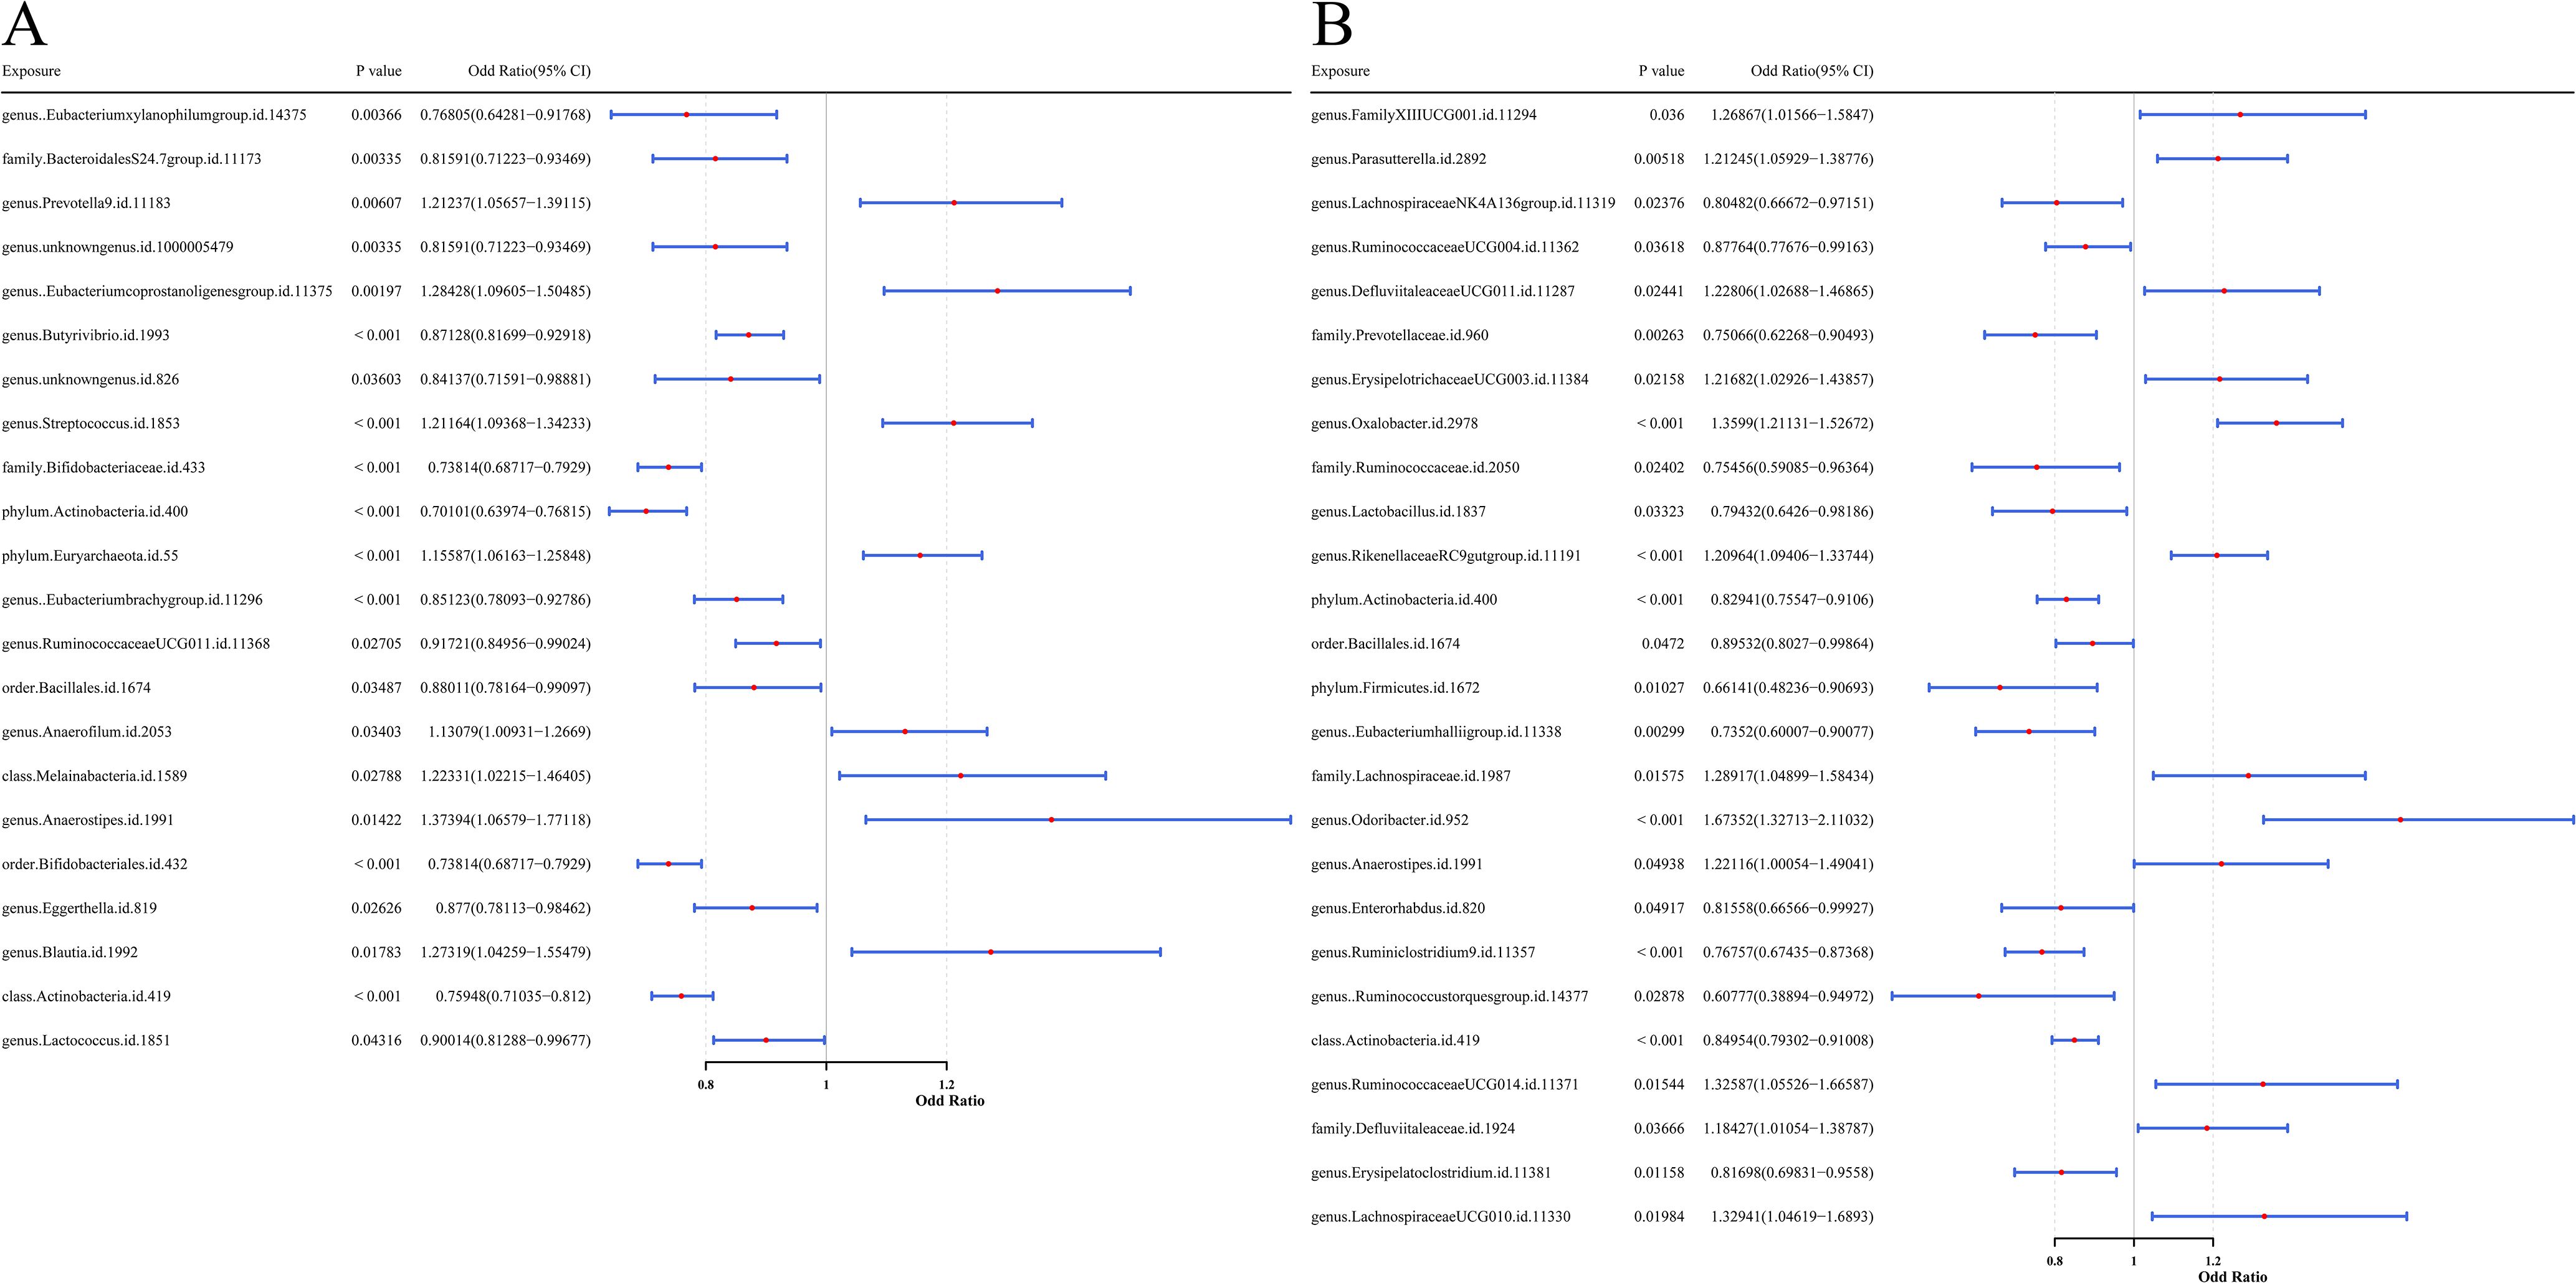
Figure 2. Forest plots presenting the predictive results of causal relationships from MR analysis. (A) Results with GM as the exposure factor and UC as the outcome variable. (B) Results with GM as the exposure factor and CD as the outcome variable. Each plot illustrates the OR with 95% CI, providing evidence for potential causal associations between microbial features and disease outcomes.
For protective factors, the SNP effect estimates were less than 0, whereas for risk factors, the effect estimates were greater than 0 (Supplementary Figure 2). The SNP distribution of gut microbial taxa was symmetrical and evenly distributed, indicating that the MR analysis complied with Mendel’s second law (Supplementary Figure 3). The Cochran’s Q test analysis showed that heterogeneity (P < 0.05) was observed in seven UC-associated microbial taxa (family Bifidobacteriaceae, order Bifidobacteriales, genus Anaerostipes, class Melainabacteria, class Actinobacteria, phylum Actinobacteria, and order Bacillales) and two CD-associated taxa (genus Ruminococcustorquesgroup and phylum Firmicutes). These variables were modeled accounting for random heterogeneity effects, while the remaining taxa were analyzed using a fixed-effects model (Supplementary Table 2).
In addition, P-values from pleiotropy tests were all above 0.05, suggesting the absence of horizontal pleiotropy and thereby reinforcing the validity of the MR analysis (Supplementary Table 3). The results of LOO analysis showed that individual SNPs did not exert a dominant effect on the outcome variables, confirming the robustness of the causal inference (Supplementary Figure 4). The Steiger directionality test also confirmed that the MR analyses were not disturbed by reverse causality (P < 0.05, Supplementary Table 4).
In summary, 22 gut microbial taxa were significantly causally associated with UC. Mapping their corresponding SNPs to genes, a total of 307 UC-related microbial causal genes were obtained. Similarly, 26 taxa showed significant causal relationship with CD, and a total of 360 flora causal genes related to CD were obtained after SNP mapping. All SNPs met criteria (2) and (3) of the MR analysis.
Functional and pathway enrichment analysis of GM-associated causal genes
GO enrichment analysis of the 307 UC-related microbial causal genes identified 237 significant pathways (P < 0.05, Supplementary Table 5), mainly involving dendritic development, neurotransmitter transport, and synaptic vesicle function (Figure 3A). KEGG pathways were significantly enriched in glutamatergic synapse, circadian rhythm, and metabolic processes (Figure 3B).
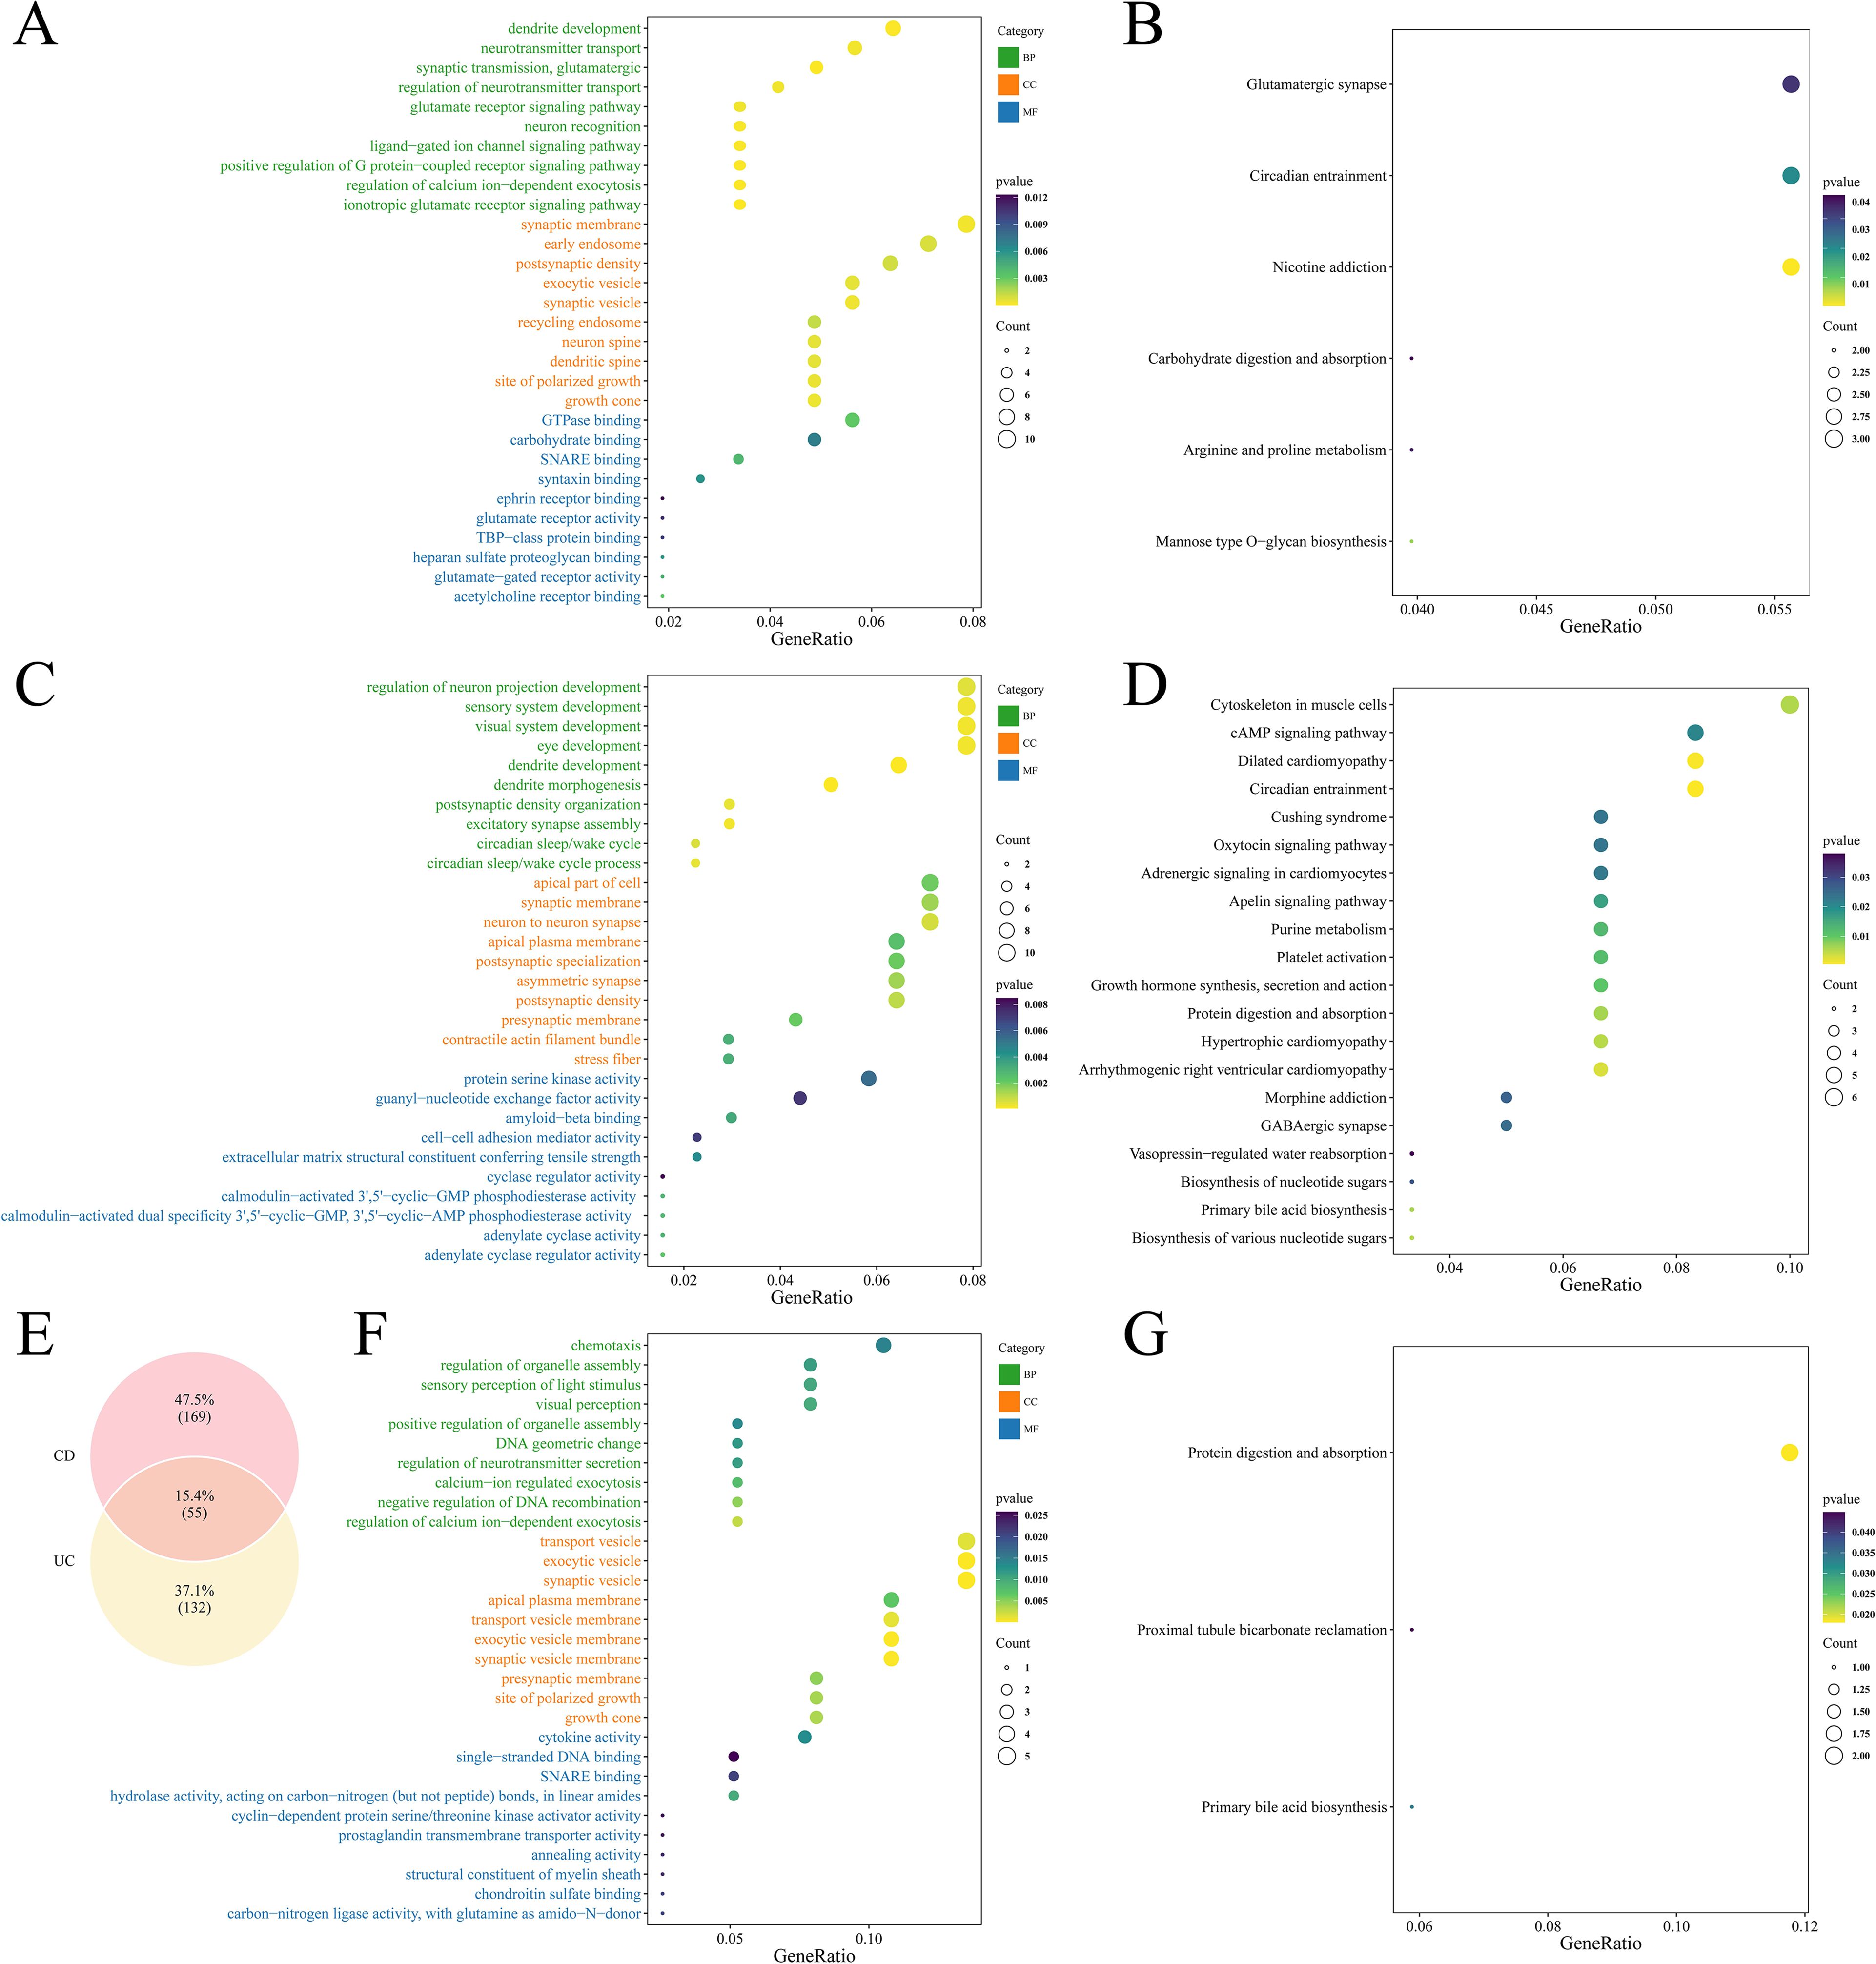
Figure 3. Functional enrichment result plots of causal genes. (A) GO enrichment plot of GM associated with UC causal genes. (B) KEGG enrichment plot of GM associated with UC causal genes. (C) GO enrichment plot of GM associated with CD causal genes. (D) KEGG enrichment plot of GM associated with CD causal genes. (E) Venn diagram showing overlapping genes between UC- and CD-associated microbial causal genes. (F) GO enrichment plot of intersecting genes. (G) KEGG enrichment plot of intersecting genes.
The 360 CD-related genes were enriched to 278 GO terms (P < 0.05, Supplementary Table 5), highlighting neural projection development, sensory system regulation, and kinase activity (Figure 3C). KEGG pathways were significantly enriched in cytoskeletal organization and the cAMP signaling pathway (Figure 3D).
Intersections were taken for causal genes of UC and CD, yielding a total of 55 intersecting genes (Figure 3E). GO enrichment involved a total of 179 terms (Supplementary Table 6), of which BP included cell chemotaxis, regulation of organelle assembly, visual perception, etc., CC included transport vesicles, synaptic vesicles, apical plasma membrane, etc., and MF included cytokine activity, DNA binding, etc. (Figure 3F). KEGG was enriched to three pathways: protein digestion and absorption, renal tubular bicarbonate recycling and primary bile acid synthesis (Figure 3G).
TMEM163 and TNIK were identified as characterized genes
Differential expression analysis of the GSE87473 dataset identified 4, 446 DEGs, including 1, 482 upregulated and 2, 964 downregulated genes (Figure 4A). A volcano plot labeled the top 10 most significant DEGs, and a heatmap depicted the expression profiles of the top 20 DEGs (Figure 4B). By intersecting these DEGs with GM-associated causal genes for UC and CD, six overlapping candidate genes were identified (Figure 4C). LASSO regression minimized error at an optimal Lambda of 0.0201, resulting in the selection of four candidate genes: TNIK, TMEM163, MCTP2, and NADSYN1 (Figures 4D, E). Evaluation across ten machine learning algorithms showed that the RF and QDA models yielded the highest performance in ROC analysis (Figures 4F, G; Table 2), leading to the identification of TMEM163 and TNIK as key featured genes (Supplementary Table 7). All four genes were significantly correlated with Mayo score (|cor| > 0.3, P < 0.05), with TNIK showing a negative and TMEM163 a positive correlation (Figures 4H, I). The Wilcoxon rank-sum test validated consistent differential expression trends in both GSE87473 and GSE75214 datasets (P < 0.05). TMEM163 was significantly upregulated, while TNIK was significantly downregulated in UC samples (Figures 4J, K).
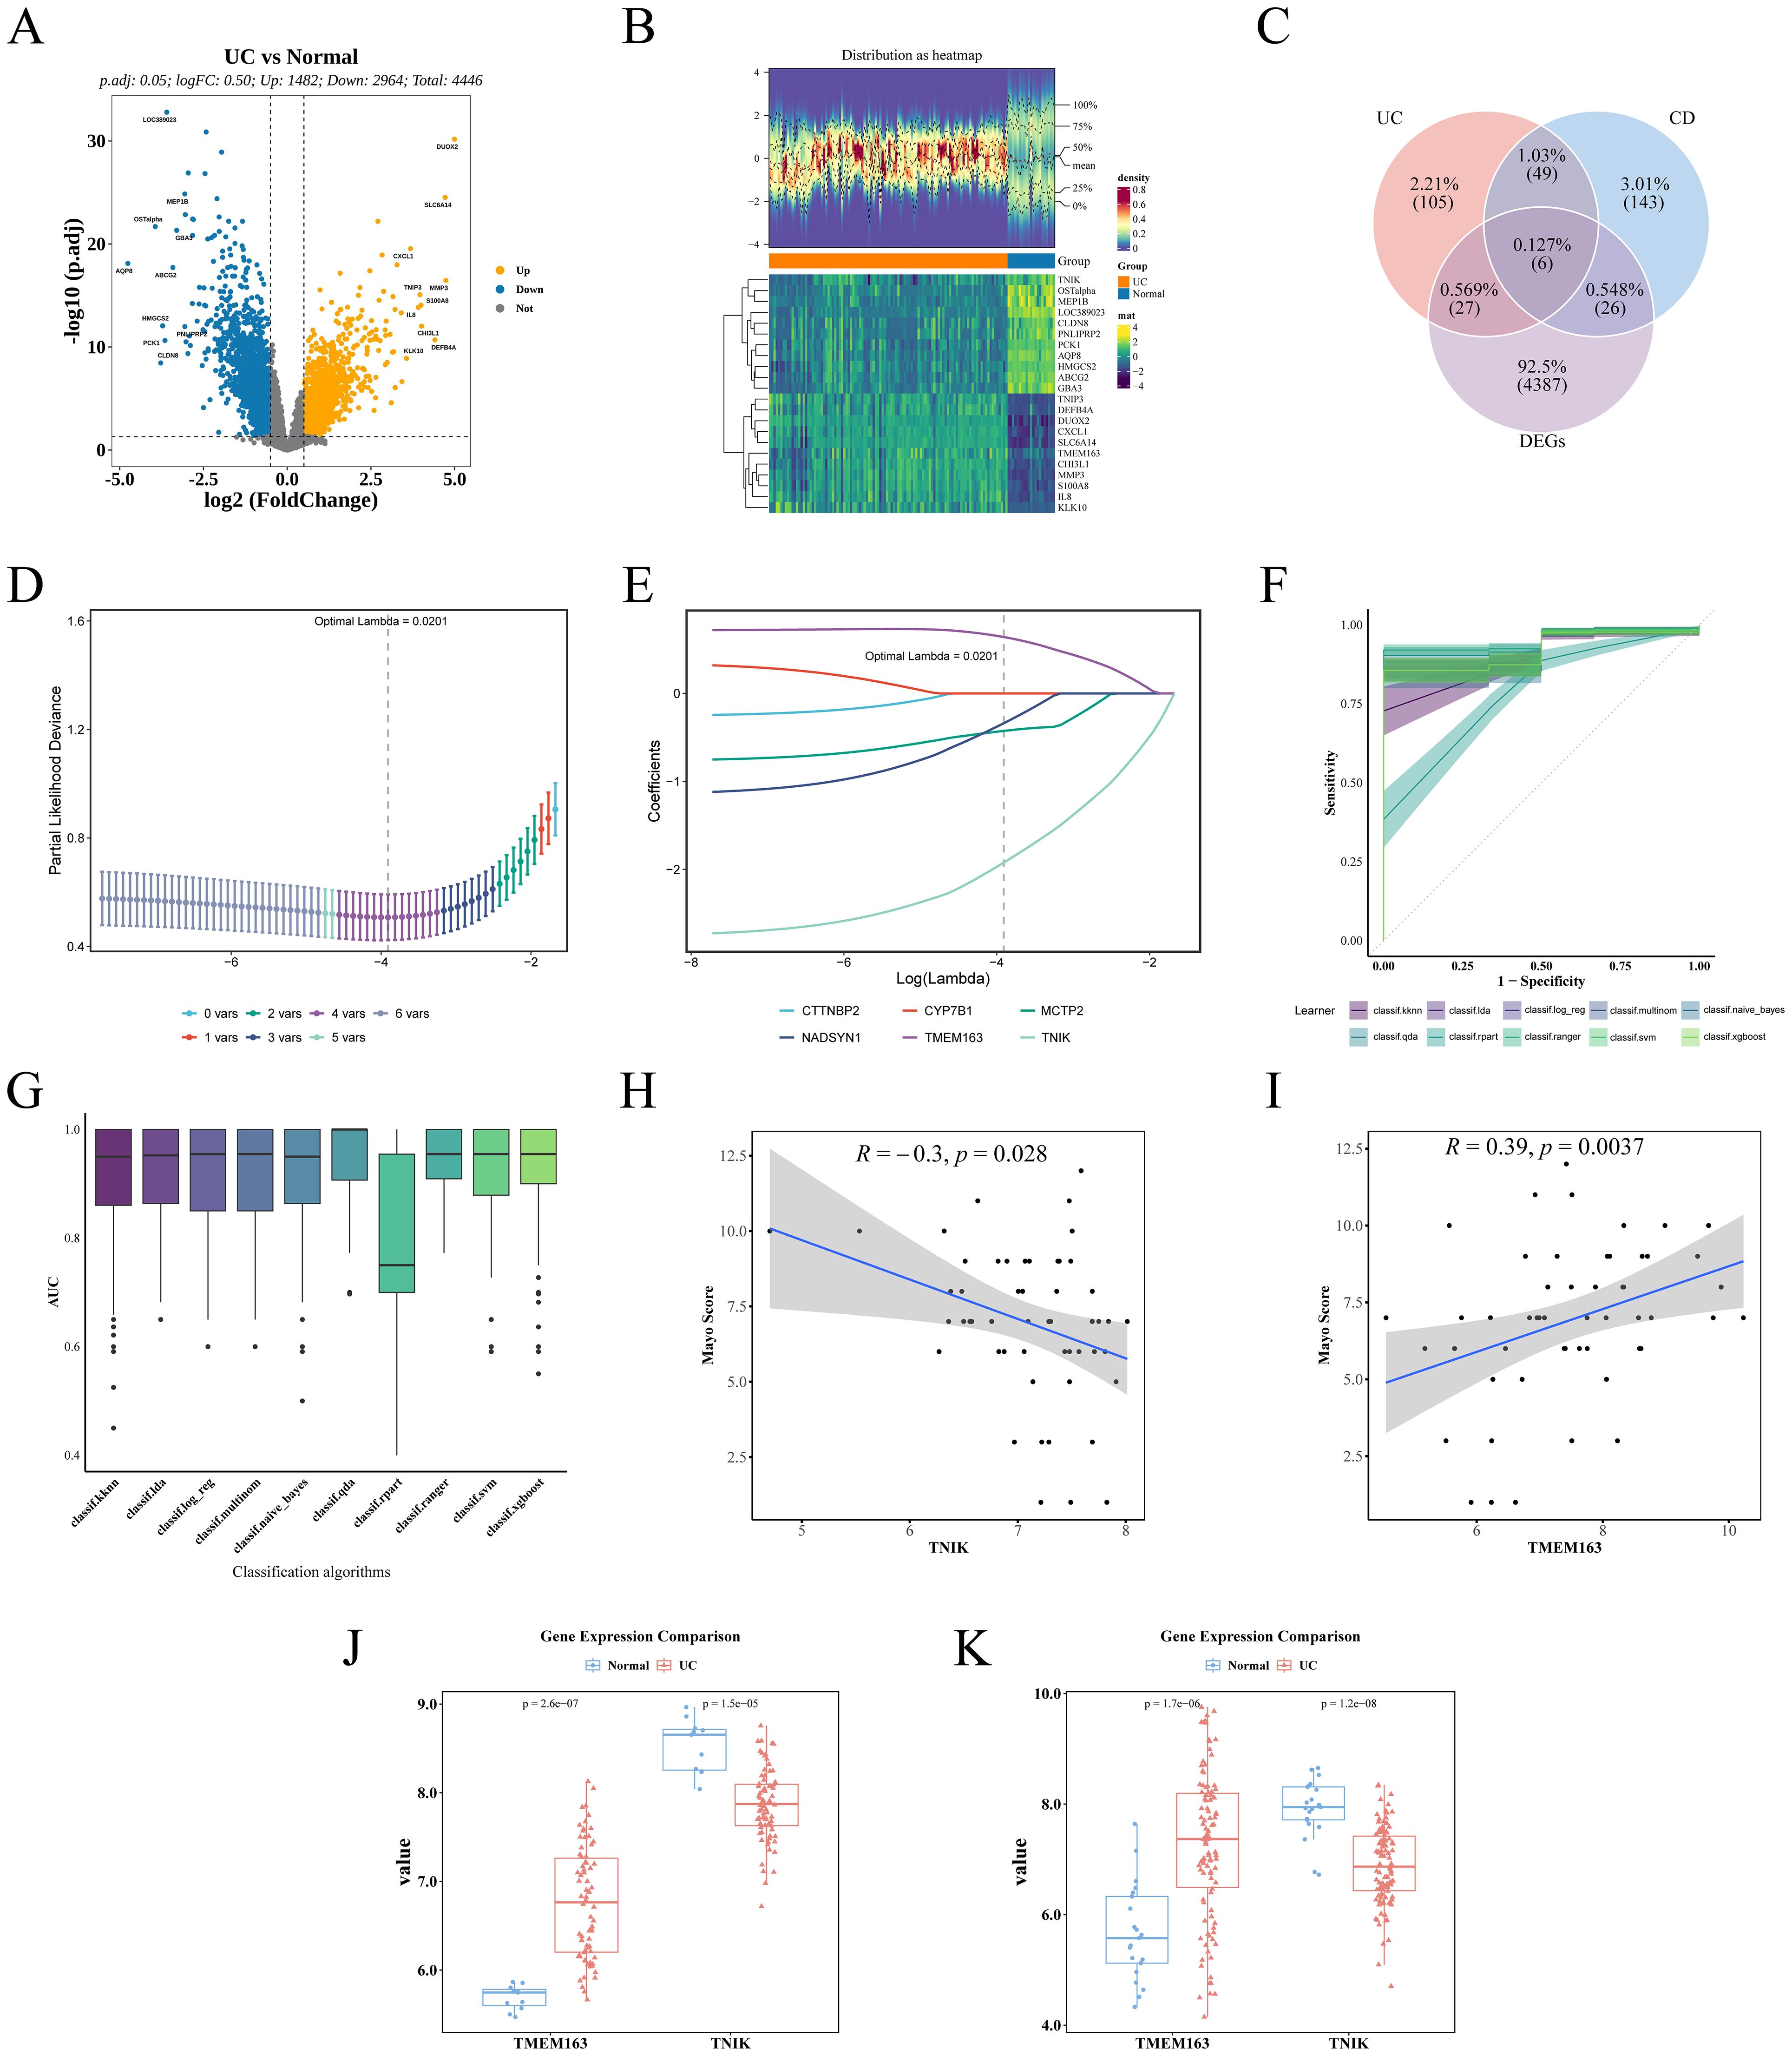
Figure 4. Identification of key genes and validation of dataset results. (A) Volcano plot demonstrating DEGs. (B) Heat map demonstrating the expression distribution of DEGs. (C) Venn plot of intersecting genes of causal genes and DEGs. (D) Lasso coefficient path diagram. (E) Partial likelihood deviation coefficient plot was used to evaluate model fit. (F) ROC curves for the 10 machine learning models, with the shaded areas of the curves indicating the standard errors of the curves. (G) AUC box plot. (H) Spearman correlation between TNIK and Mayo score. (I) Spearman correlation between TMEM163 and Mayo score. (J) Expression trends of TMEM163 and TNIK in the training set GSE87473 (UC vs Control). (K) Expression trends of TMEM163 and TNIK in the validation set GSE75214 (UC vs Control).
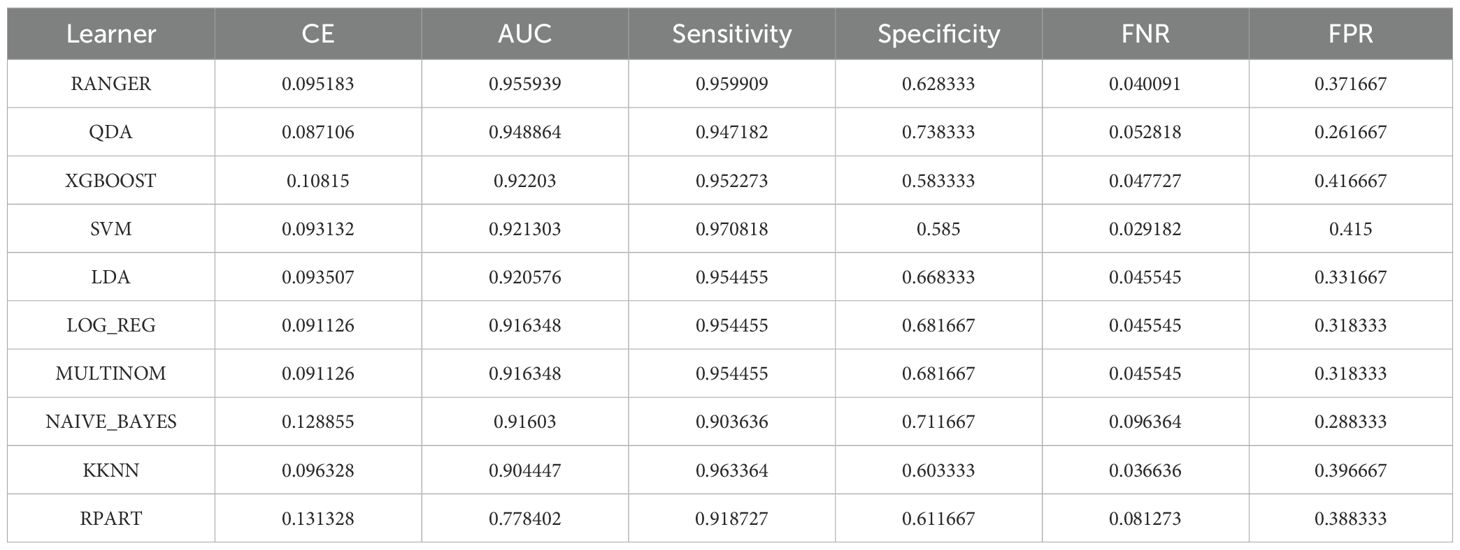
Table 2. Evaluation results of machine learning model performance.
Construction of nomogram model and selection of key genes
To further evaluate the clinical predictive value of the identified feature genes, a nomogram model was constructed in the training dataset GSE87473 based on TMEM163 and TNIK (Figure 5A). The results indicated that, based on the combined expression levels of the two genes, the total score was 103, corresponding to an estimated probability of approximately 99.7% for developing IBD. Moreover, TNIK expression exerted a greater impact on the prediction, with lower expression levels associated with higher risk. TMEM163 also contributed significantly to the prediction, although its effect was less pronounced than that of TNIK.
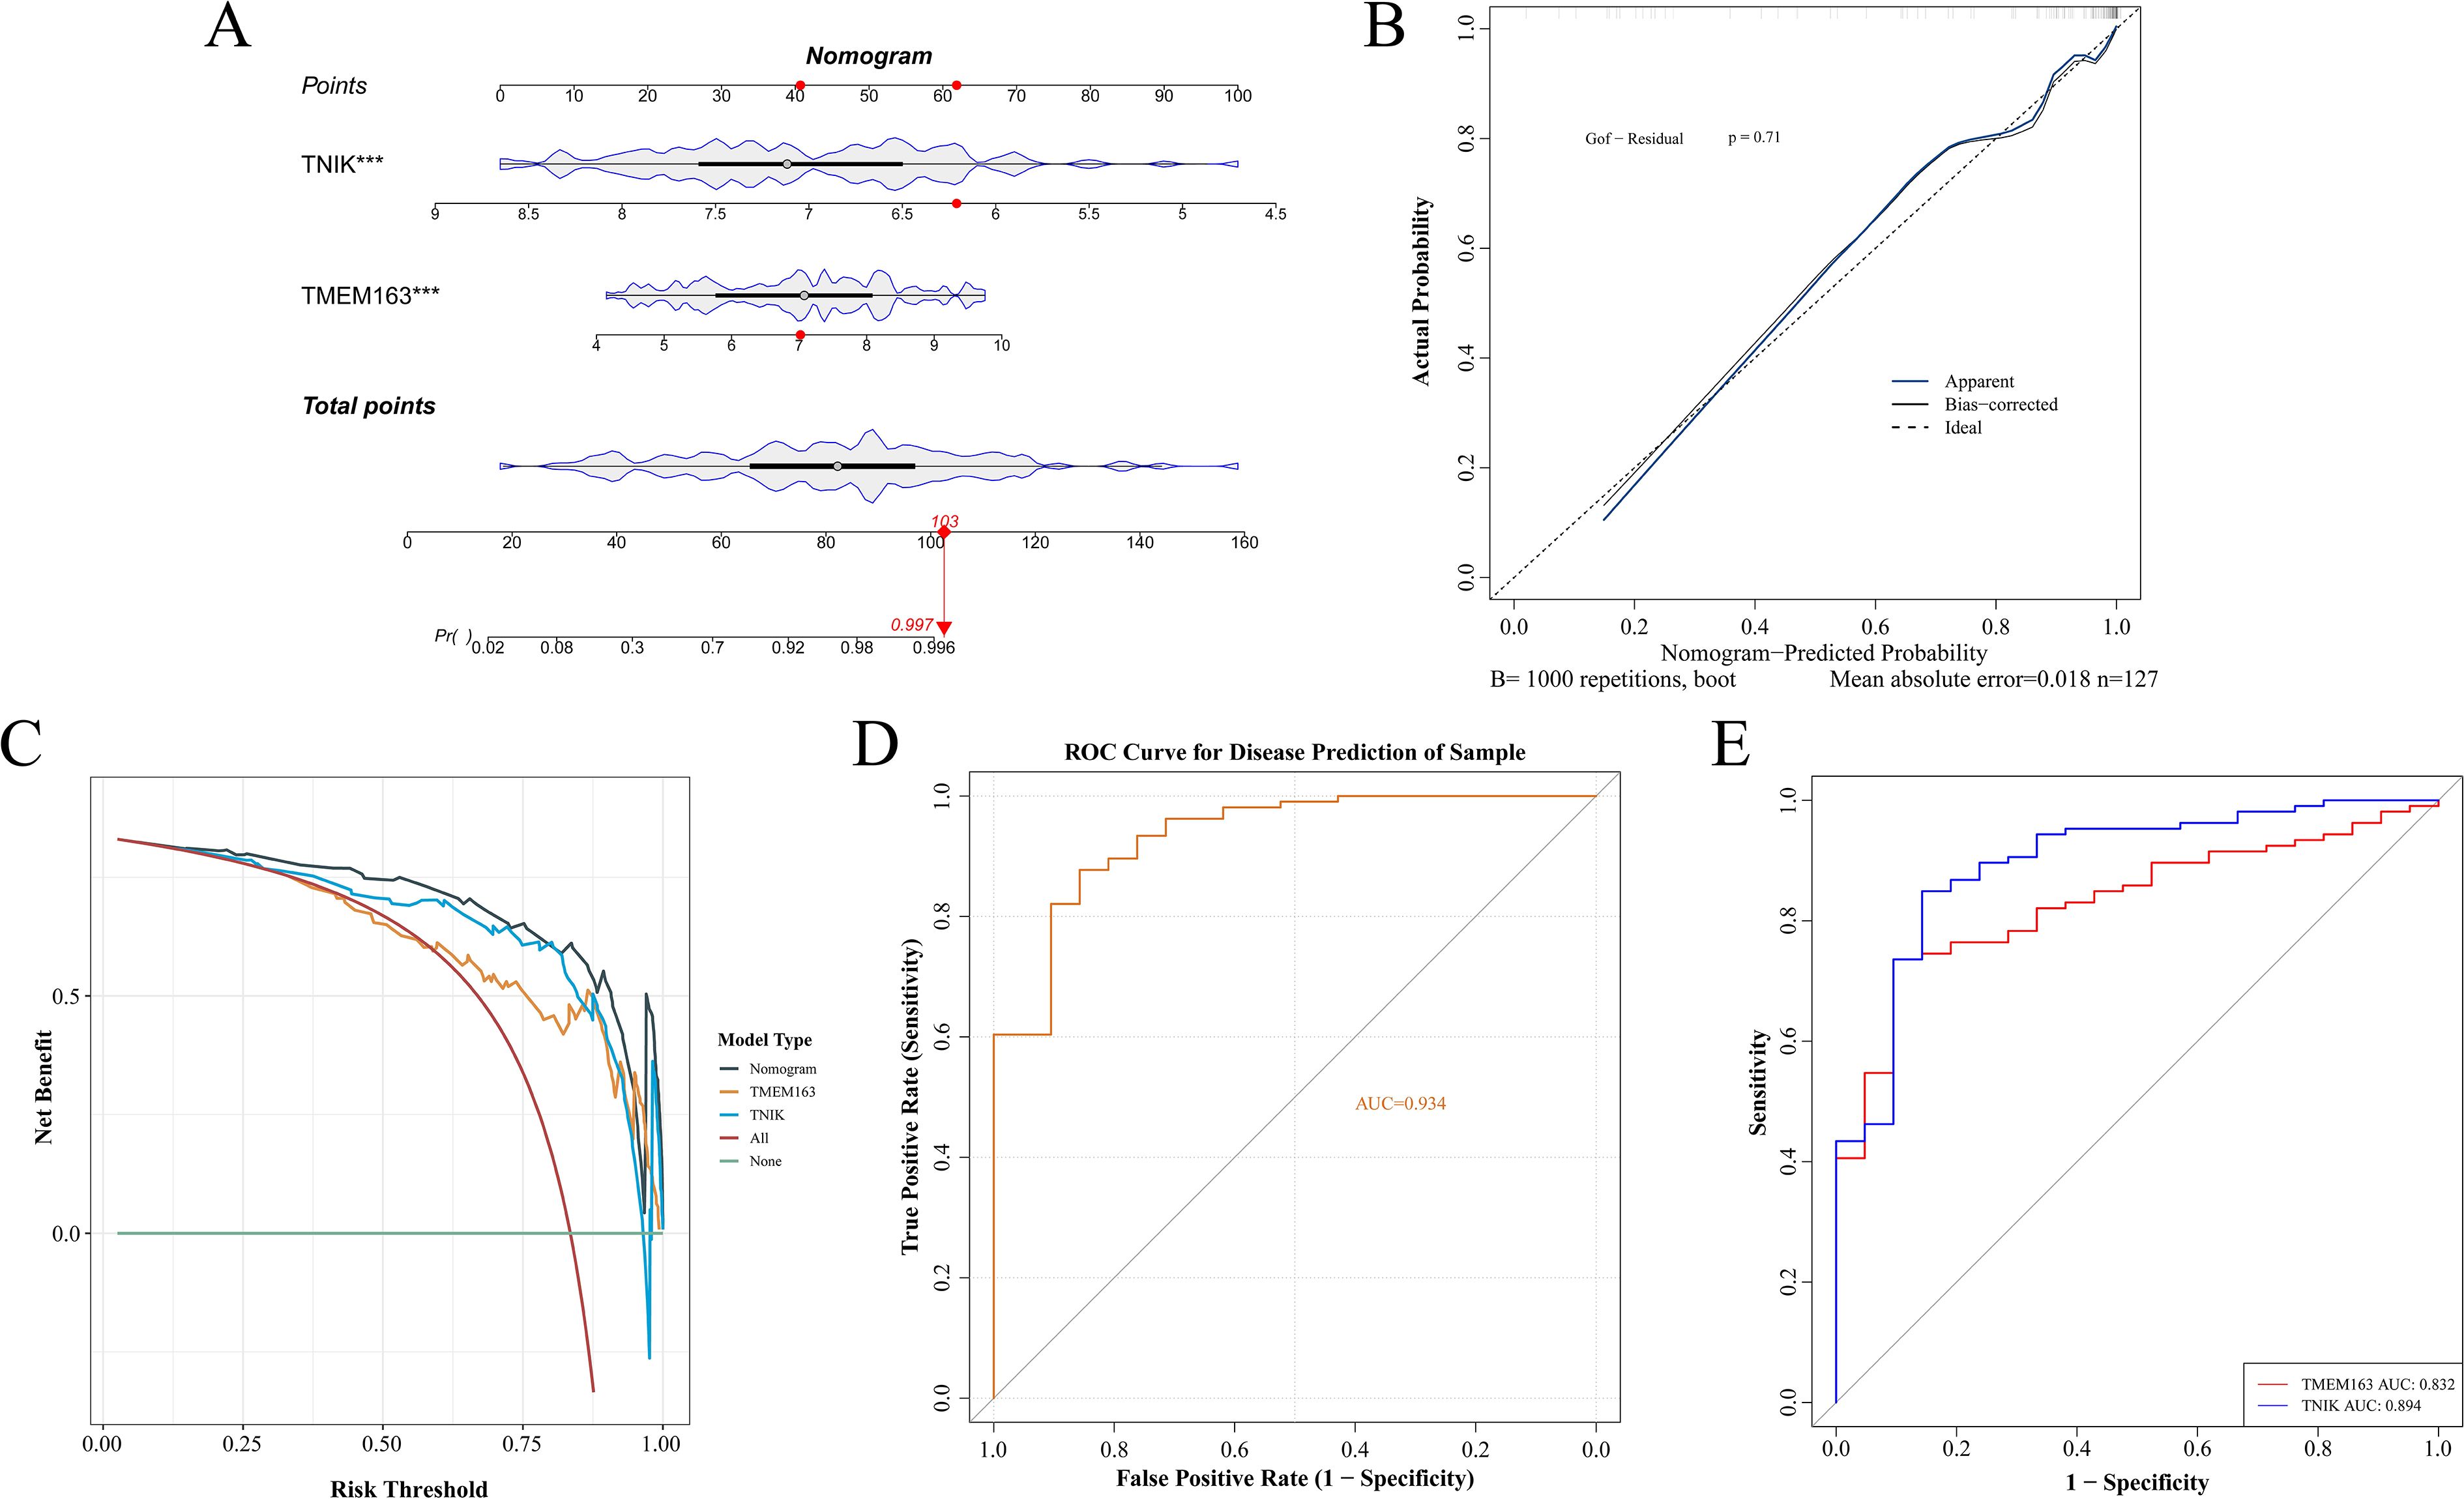
Figure 5. Construction of a nomogram for risk prediction. (A) Nomogram-based prediction model. (B) Calibration curve evaluating the nomogram’s predictive performance. (C) DCA curves of TMEM163 and TNIK. (D) ROC curves of the nomogram model. (E) ROC curves of TMEM163 and TNIK. This figure demonstrated the translational potential of incorporating molecular markers into clinical risk prediction.
The calibration curve indicated a small prediction error (P = 0.71) and demonstrated good model fit (Figure 5B). The DCA curve indicated that the net clinical benefit of the model exceeded that of single-gene predictors (Figure 5C), supporting its potential for clinical application. The AUC of the model reached 0.934, while AUCs of individual key genes exceeded 0.8 (Figures 5D, E).
Although both TNIK and TMEM163 demonstrated satisfactory predictive performance (AUC > 0.8), TNIK exhibited the highest diagnostic accuracy (AUC = 0.894). Notably, TNIK is a serine/threonine kinase implicated in immune signaling and epithelial barrier regulation, two essential processes in IBD pathogenesis. Given its mechanistic relevance and feasibility for in vivo validation, TNIK was selected as the primary target gene for subsequent functional studies.
Immune infiltration analysis and regulatory network analysis
Immune infiltration analysis identified notable differences between UC and healthy across 13 immune cell types, including CD8+ T cells, activated memory CD4+ T cells, T follicular helper cells, and M1 macrophages (Figures 6A–C). TNIK was significantly correlated with 7 types of cells: significantly correlated with follicular helper T cells, neutrophils, M0 macrophages negatively, and positively with resting mast cells, resting CD4+ T cells, M2 macrophages, and activated NK cells (Figure 6D; Supplementary Table 8). Transcription factor network analysis revealed that TNIK (TRAF2 and NCK-interacting kinase) was positioned at the regulatory core of several key transcription factors, which played important roles in inflammatory responses and immune regulation (Figure 6E). Furthermore, miRNA–TNIK interaction predictions indicated that TNIK may also be regulated by a series of microRNAs (Figure 6F).
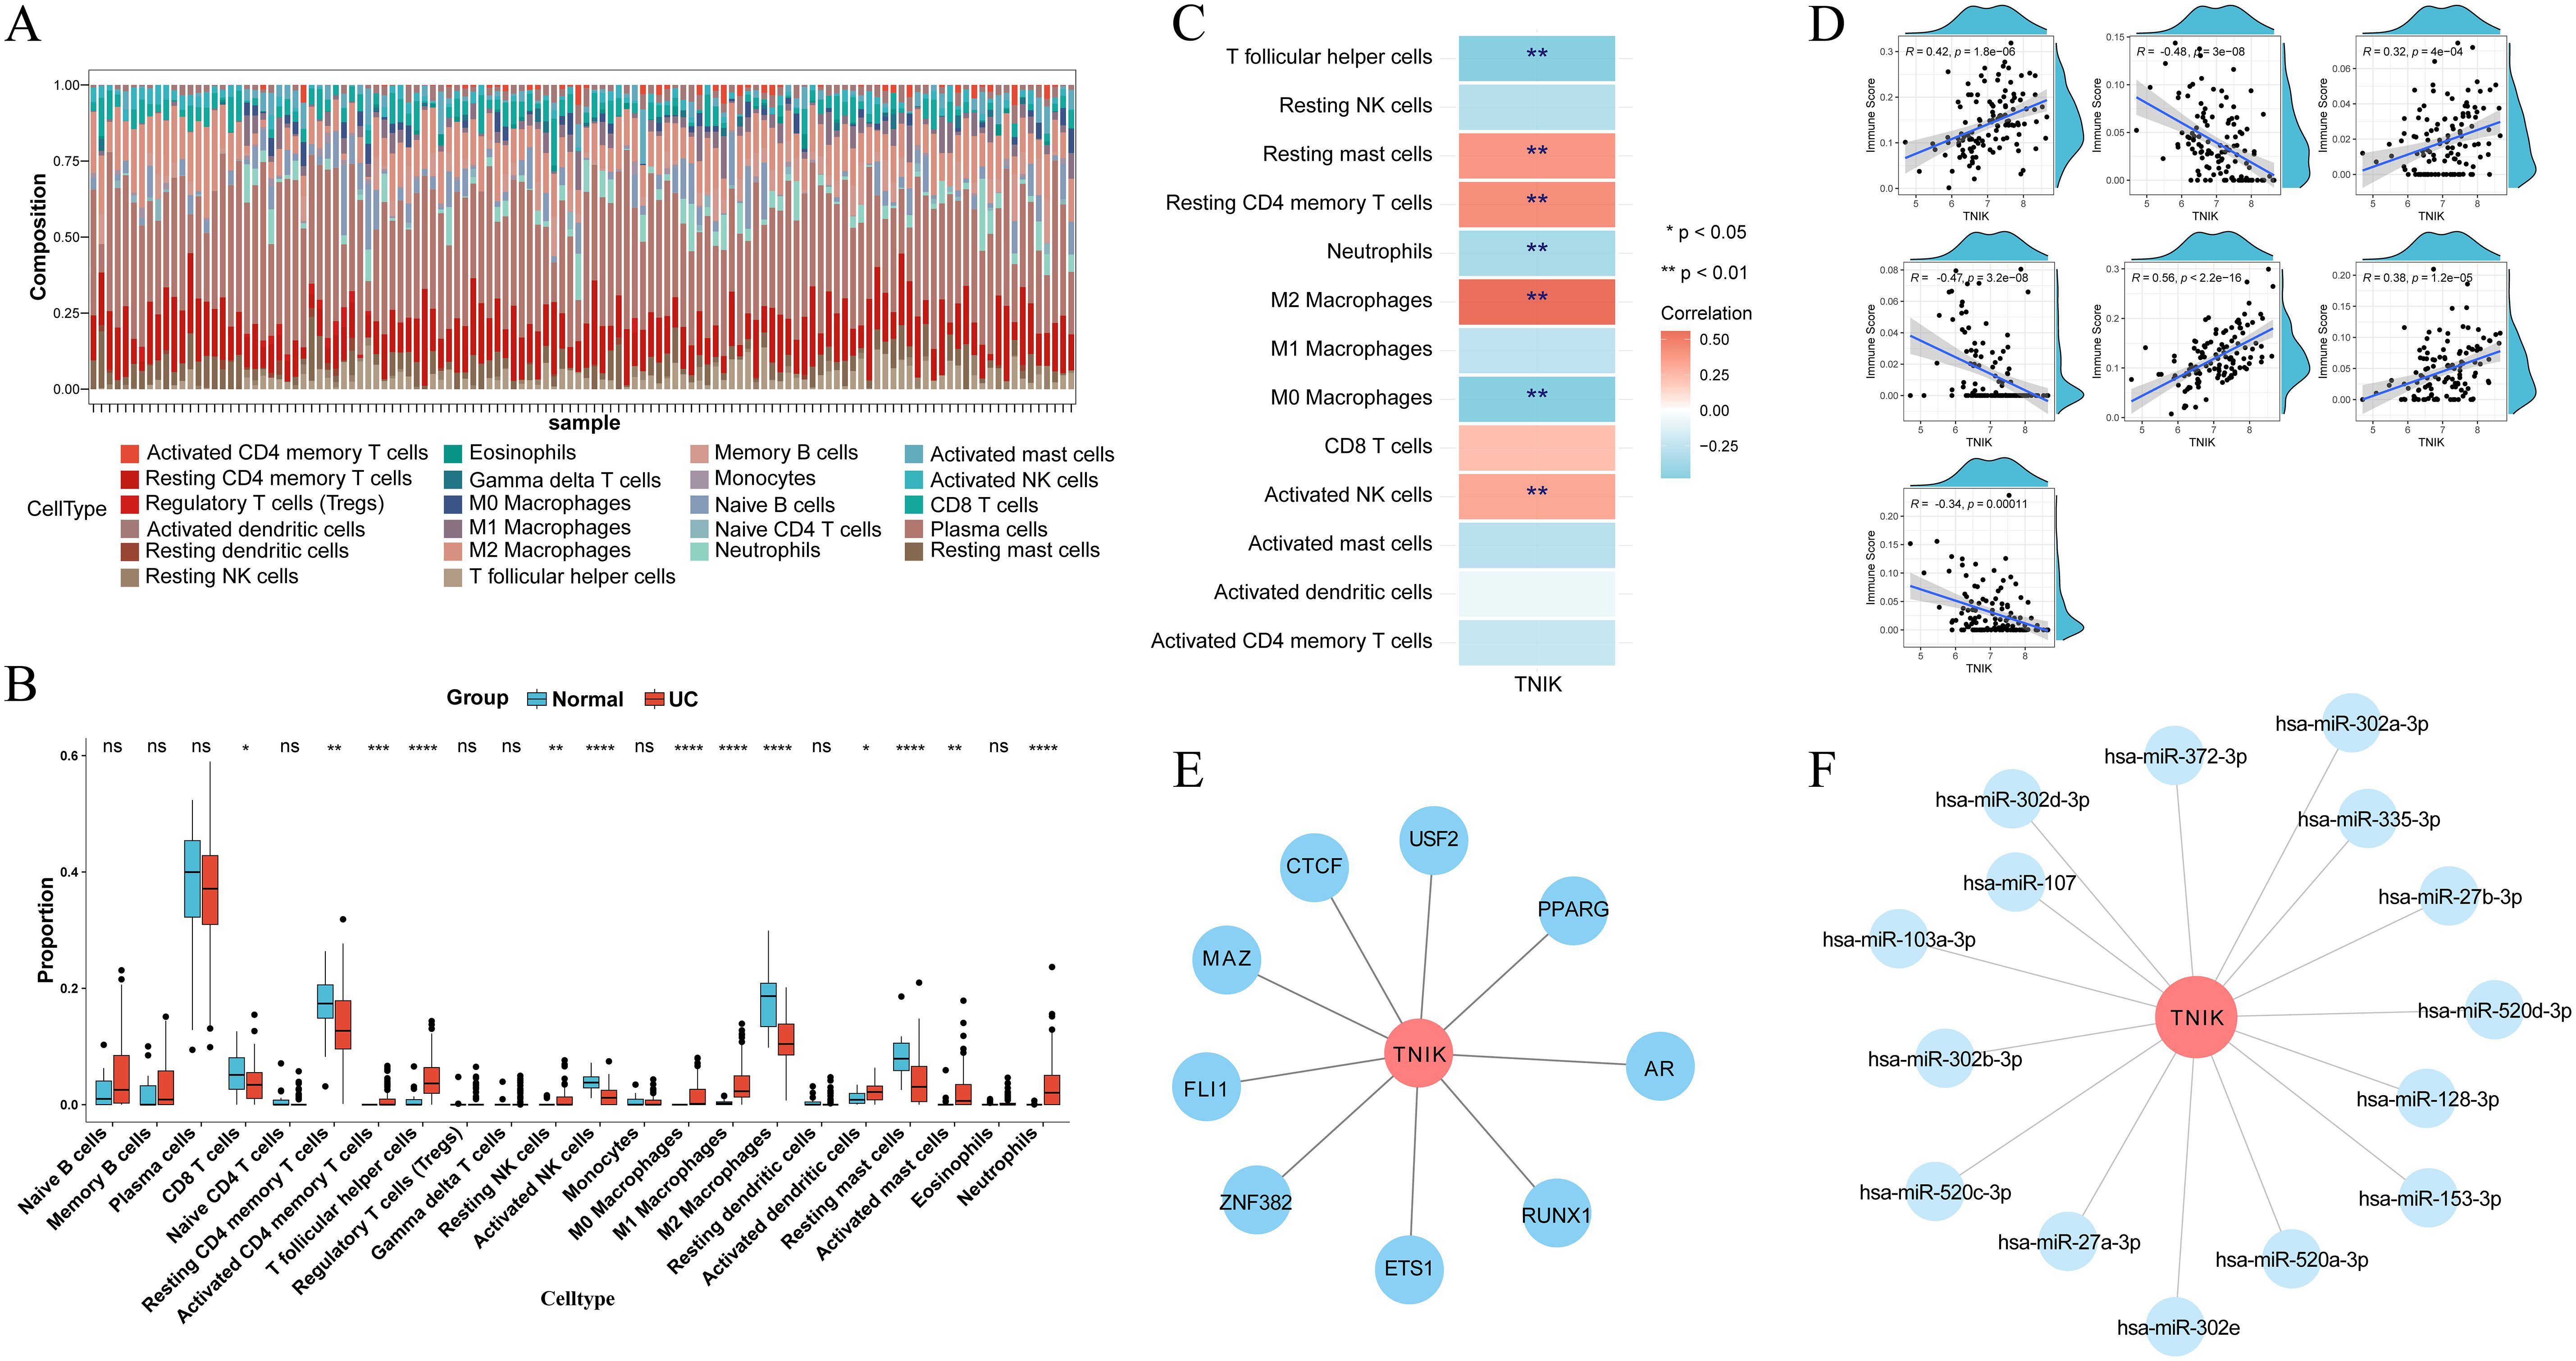
Figure 6. Results of immune cell infiltration analysis and regulatory network analysis. (A) CIBERSORT algorithm to get the percentage of immune cell infiltration. (B) Wilcoxon rank sum test to get the immune cell differences. (C) Heat map of correlation between TNIK and immune cells. (D) Scatter plot of correlation between TNIK and immune cells. These analyses linked molecular findings to immune dysregulation in UC. Statistical significance: *P < 0.05, **P < 0.01, ***P < 0.001 and ****P < 0.0001.
Screening of key TNIK-related cells in UC
To delineate the expression characteristics and cellular heterogeneity of TNIK, we next analyzed scRNA-seq data. The raw data of the single-cell dataset GSE116222 were first processed for quality control for subsequent analysis. A total of 10, 661 cells and 27, 522 genes were screened after QC analysis (Supplementary Figure 5). The top 2, 000 HVGs with high coefficients of variation were screened (Figure 7A). The ElbowPlot showed a plateau at 30 principal components (PCs), which were then selected for downstream dimensionality reduction and clustering analysis (Figure 7B). Subsequently, 12 distinct cell clusters were identified (Figure 7C). Based on reference marker gene expression, the 12 clusters were annotated into 12 cell types, categorized into six major cell classes: T/NK cells, B cells, myeloid cells, plasma cells, mast cells, and colonic epithelial cells (including BEST4+/OTOP2+ cells, CCSER1+/IRAG2+ cells, enteroendocrine cells, SOX4+/H3C12+ cells, LEFTY1+/EBPL+ cells, and colonocytes) (Figure 7D). The expression of marker genes in various types of cells was also confirmed (Supplementary Figure 6). Canonical marker genes exhibited consistent expression patterns for each cell type. A marked difference in cell type distribution between UC and control samples was observed (Figure 7E), with notable enrichment of T/NK cells, myeloid cells, B cells, plasma cells, and CCSER1+/IRAG2+ cells in the UC group (Supplementary Figure 7). These cells were enriched in 15 biological pathways, including thyroid hormone activity regulation, oleoylphenylalanine metabolism, ATP-sensitive potassium channels, vitamin pathways, FGFR1c, and Klotho ligand binding and activation (Figure 7F). TNIK expression levels were compared across the 12 annotated cell types between UC and control samples (Figures 7G, H). Notably, TNIK expression was significantly reduced in colonocytes and goblet cells, but elevated in T/NK cells.
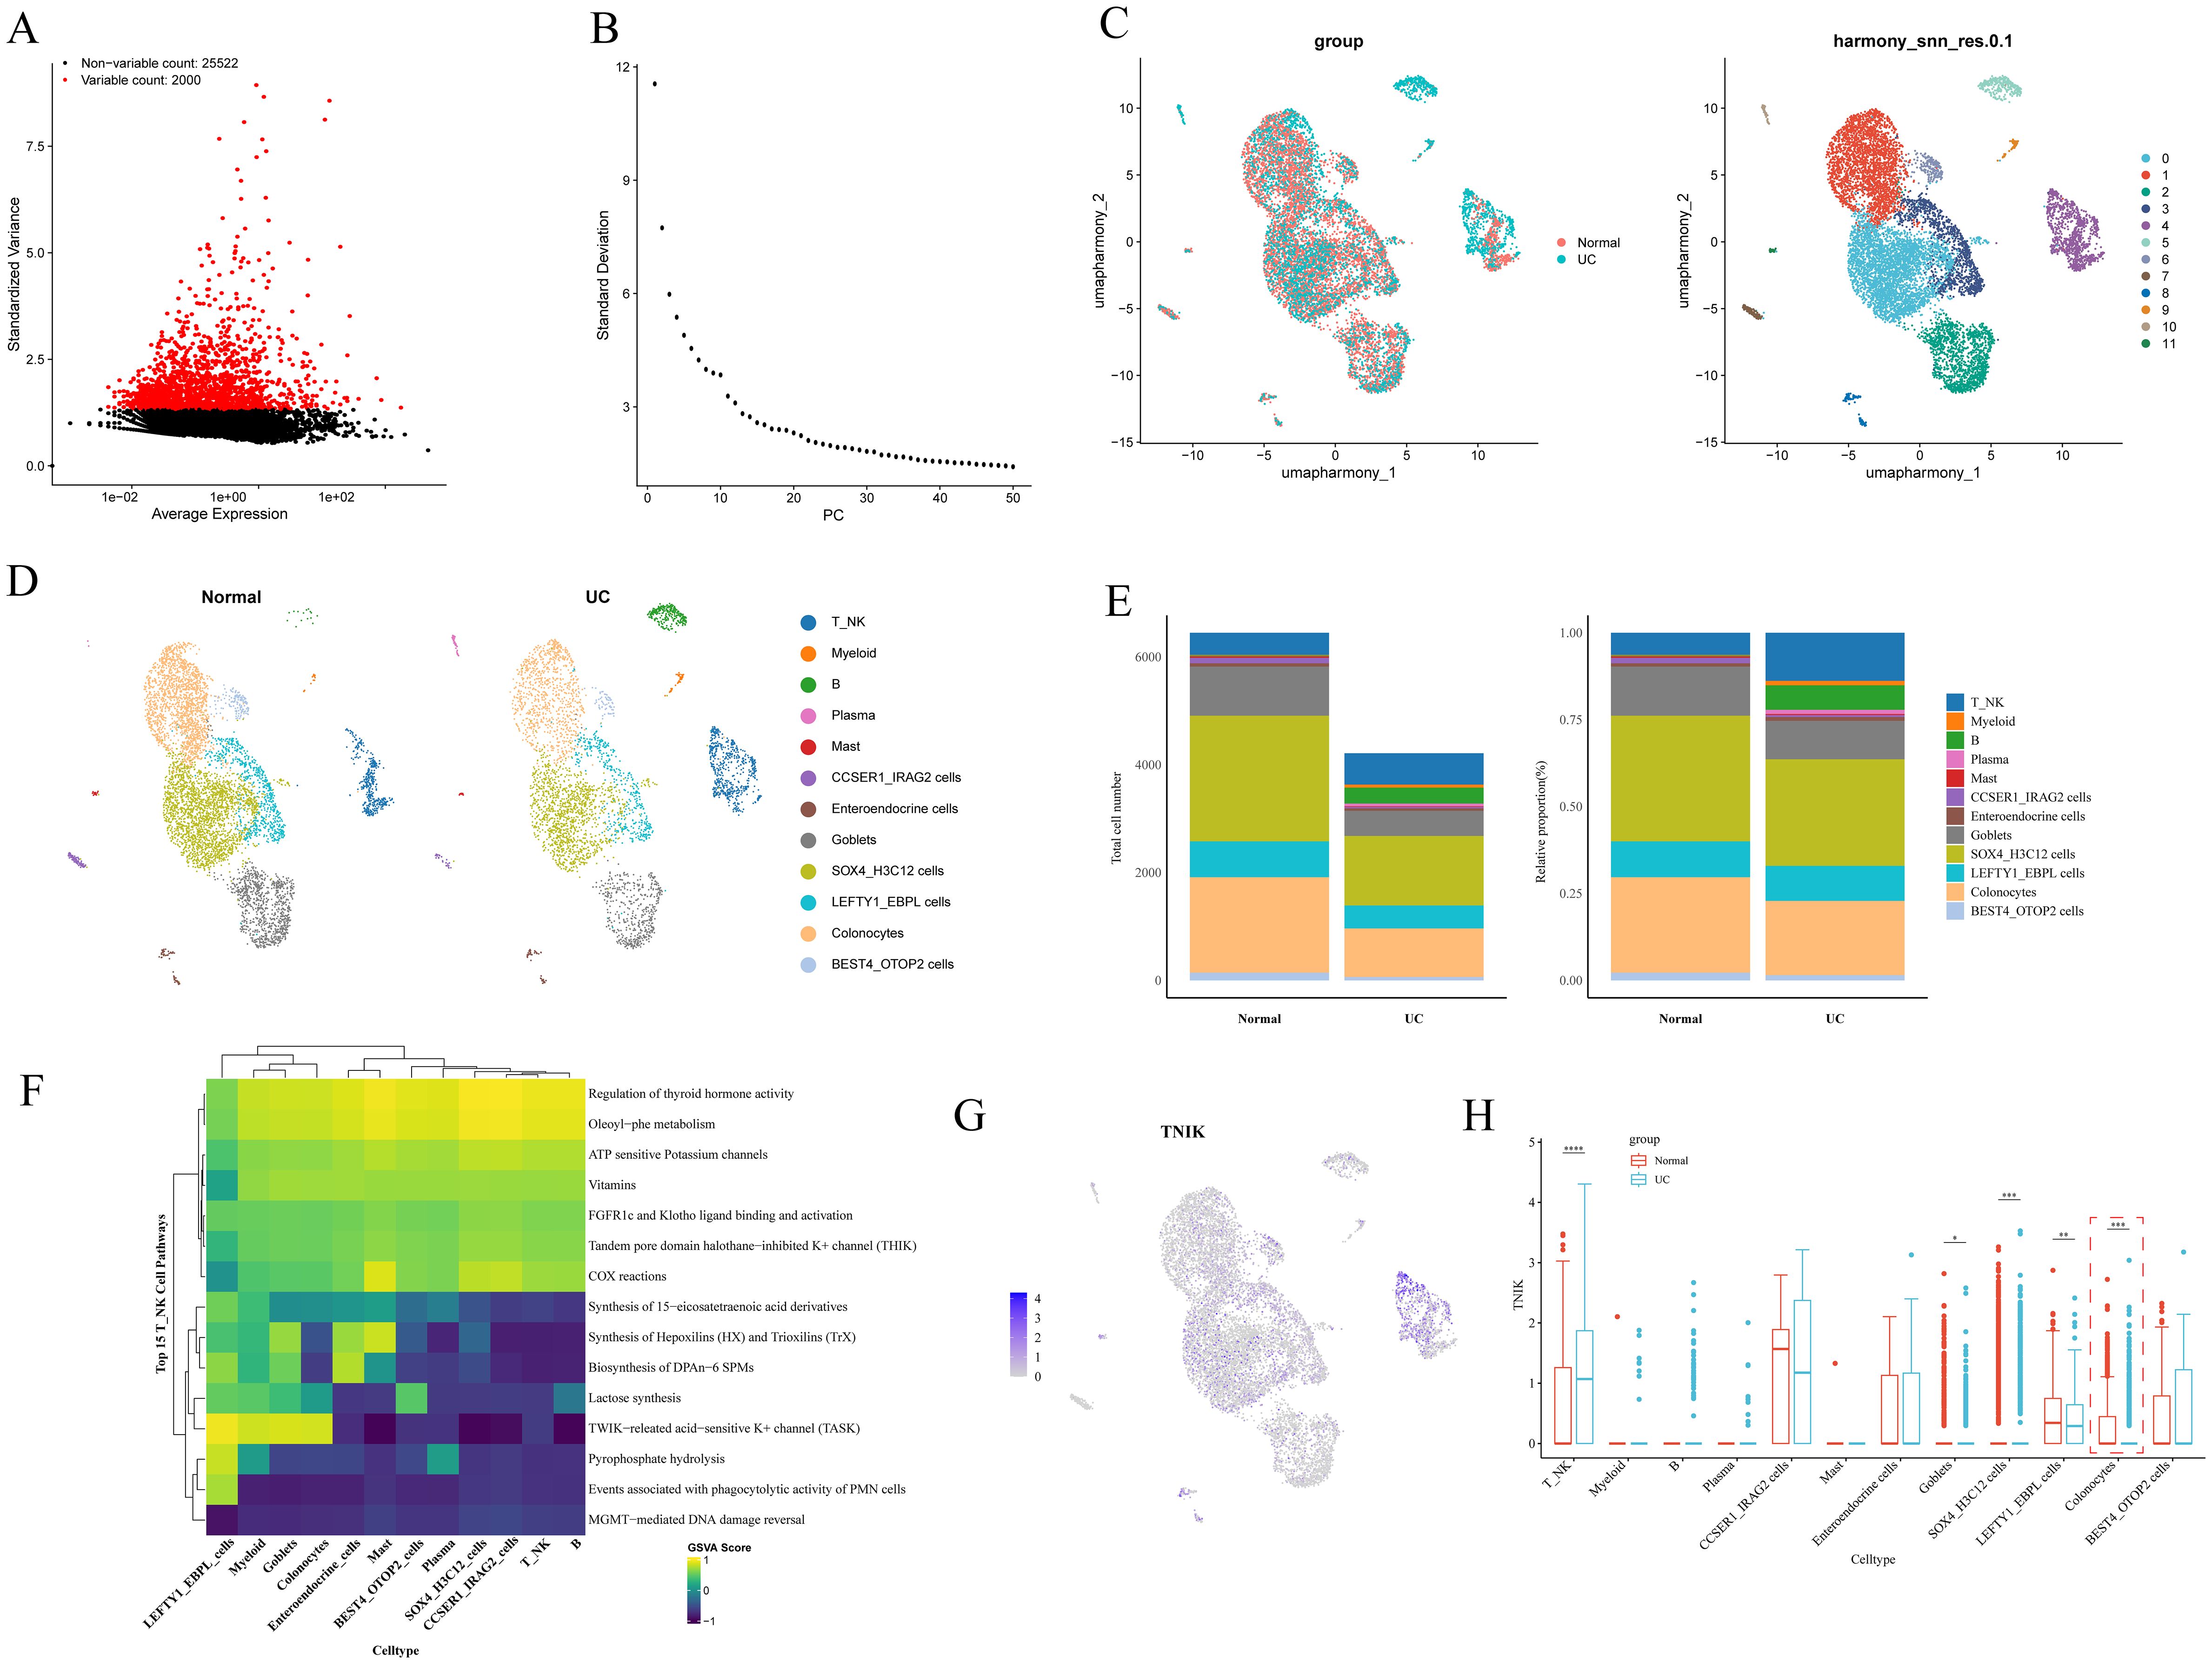
Figure 7. Key cell screening results. (A) Graph of screening results for highly variable genes. Highly variable genes are shown in red. (B) Principal component ElbowPlot. (C) Cell clustering and annotation UMAP plot. (D) Plot of cell type distribution in each subgroup. (E) Differential results plot of the proportion of cell types. (F) Differential cell function enrichment analysis plot. (G) The UMAP plot of TNIK expression in differential cells. (H) Plot of the results of differential expression of TNIK between groups in each differential cell. This figure highlighted the specific cell subsets contributing to TNIK dysregulation in IBD. Statistical significance: *P < 0.05, **P < 0.01, ***P < 0.001 and ****P < 0.0001.
The key gene TNIK was significantly underexpressed in IBD
In summary, the key gene TNIK was identified and selected as a target for validation and functional investigation. To verify the trend of TNIK expression in IBD, its expression was assessed in both control and IL-10−/−/−/− groups. First, IBD lesion assessment was performed based on weight change, colon length, and H&E staining. The results (Figures 8A, B) showed that mice from the IL-10-/- group displayed a marked reduction in body weight and colon length compared to controls (P < 0.01). H&E staining (Figures 8C, D) revealed features characteristic of IBD in IL-10−/−/−/− mice, including disorganized intestinal structure, disrupted glands, and loss of crypts. Subsequently, qRT-PCR and Western blot (WB) analyses were performed on intestinal tissues from both groups (Figures 9A, B). The results demonstrated a significant decrease in TNIK expression in IL-10−/−/−/− mice compared to controls.
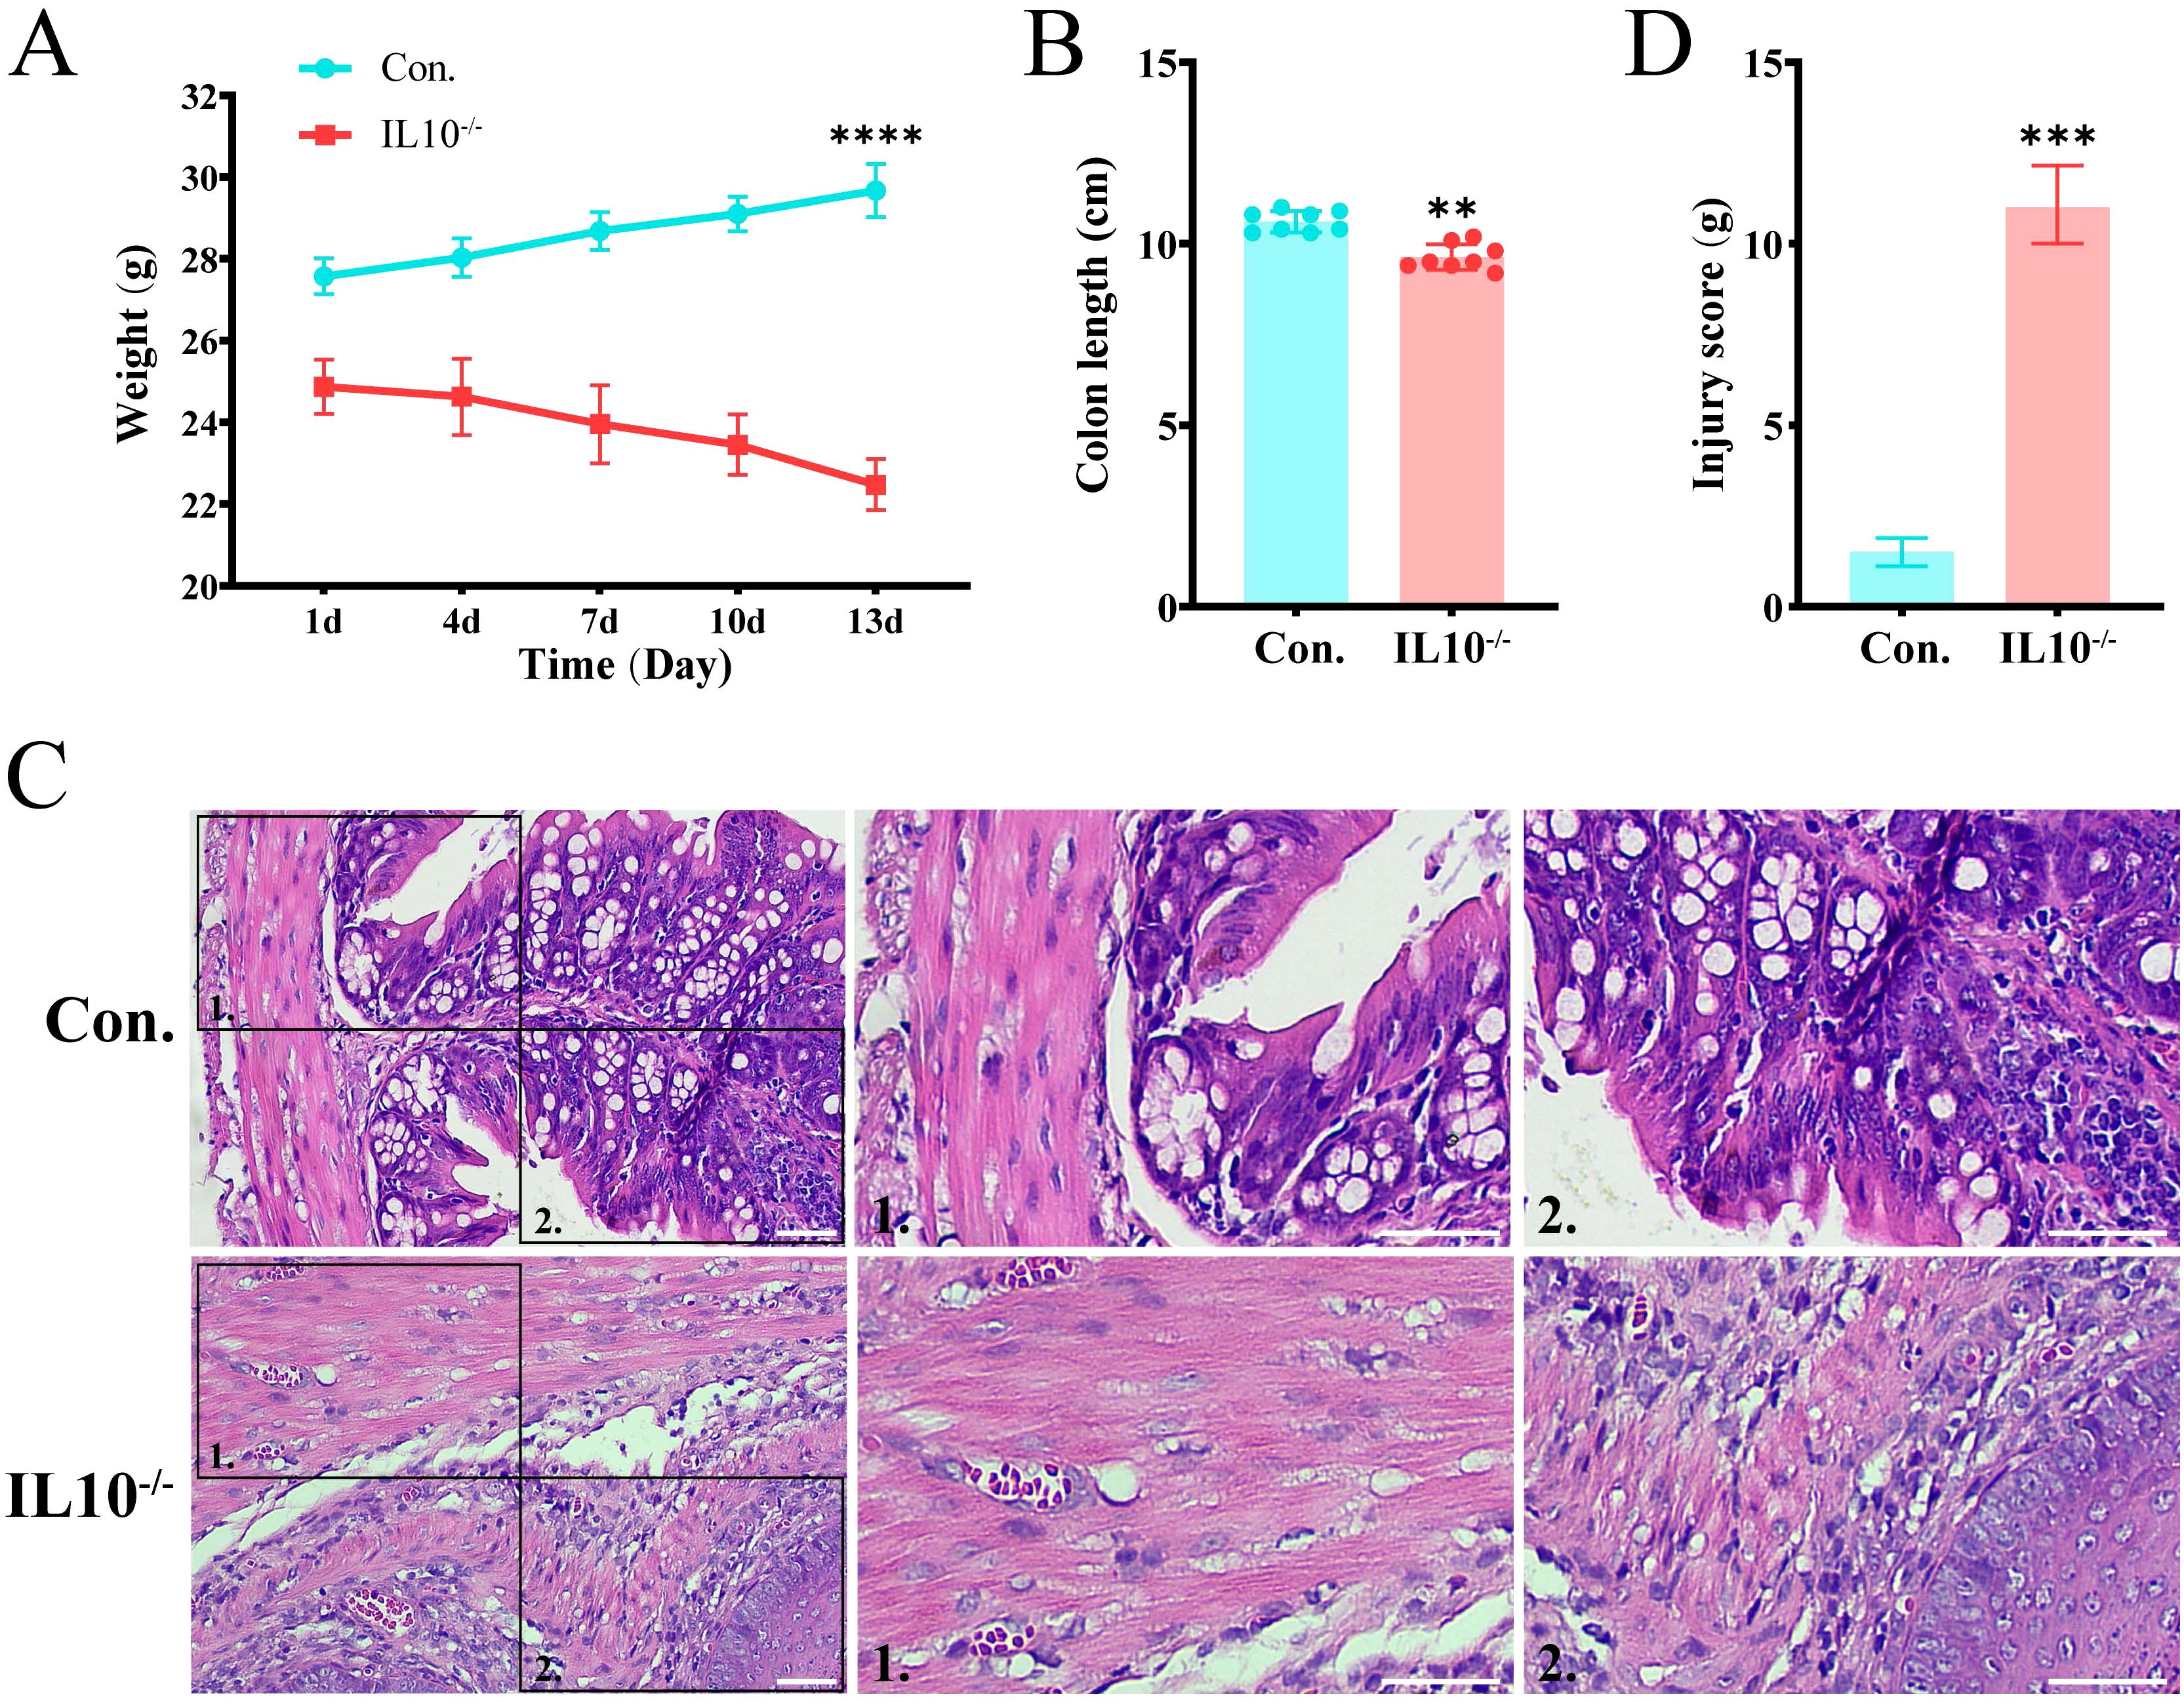
Figure 8. IBD symptoms in IL-10-/- mice. (A) Body weight changes of mice. (B) Comparison of colon lengths in different groups. (C) H&E staining of mouse colon sections. Scale bars, 50 µm. (D) The quantitative histological scoring results of H&E staining. Data are presented as mean ± SD. Statistical significance was determined by unpaired t-test. These results confirmed that IL-10-/- mice develop IBD-like symptoms. Statistical significance: **P < 0.01, ***P < 0.001 and ****P < 0.0001.
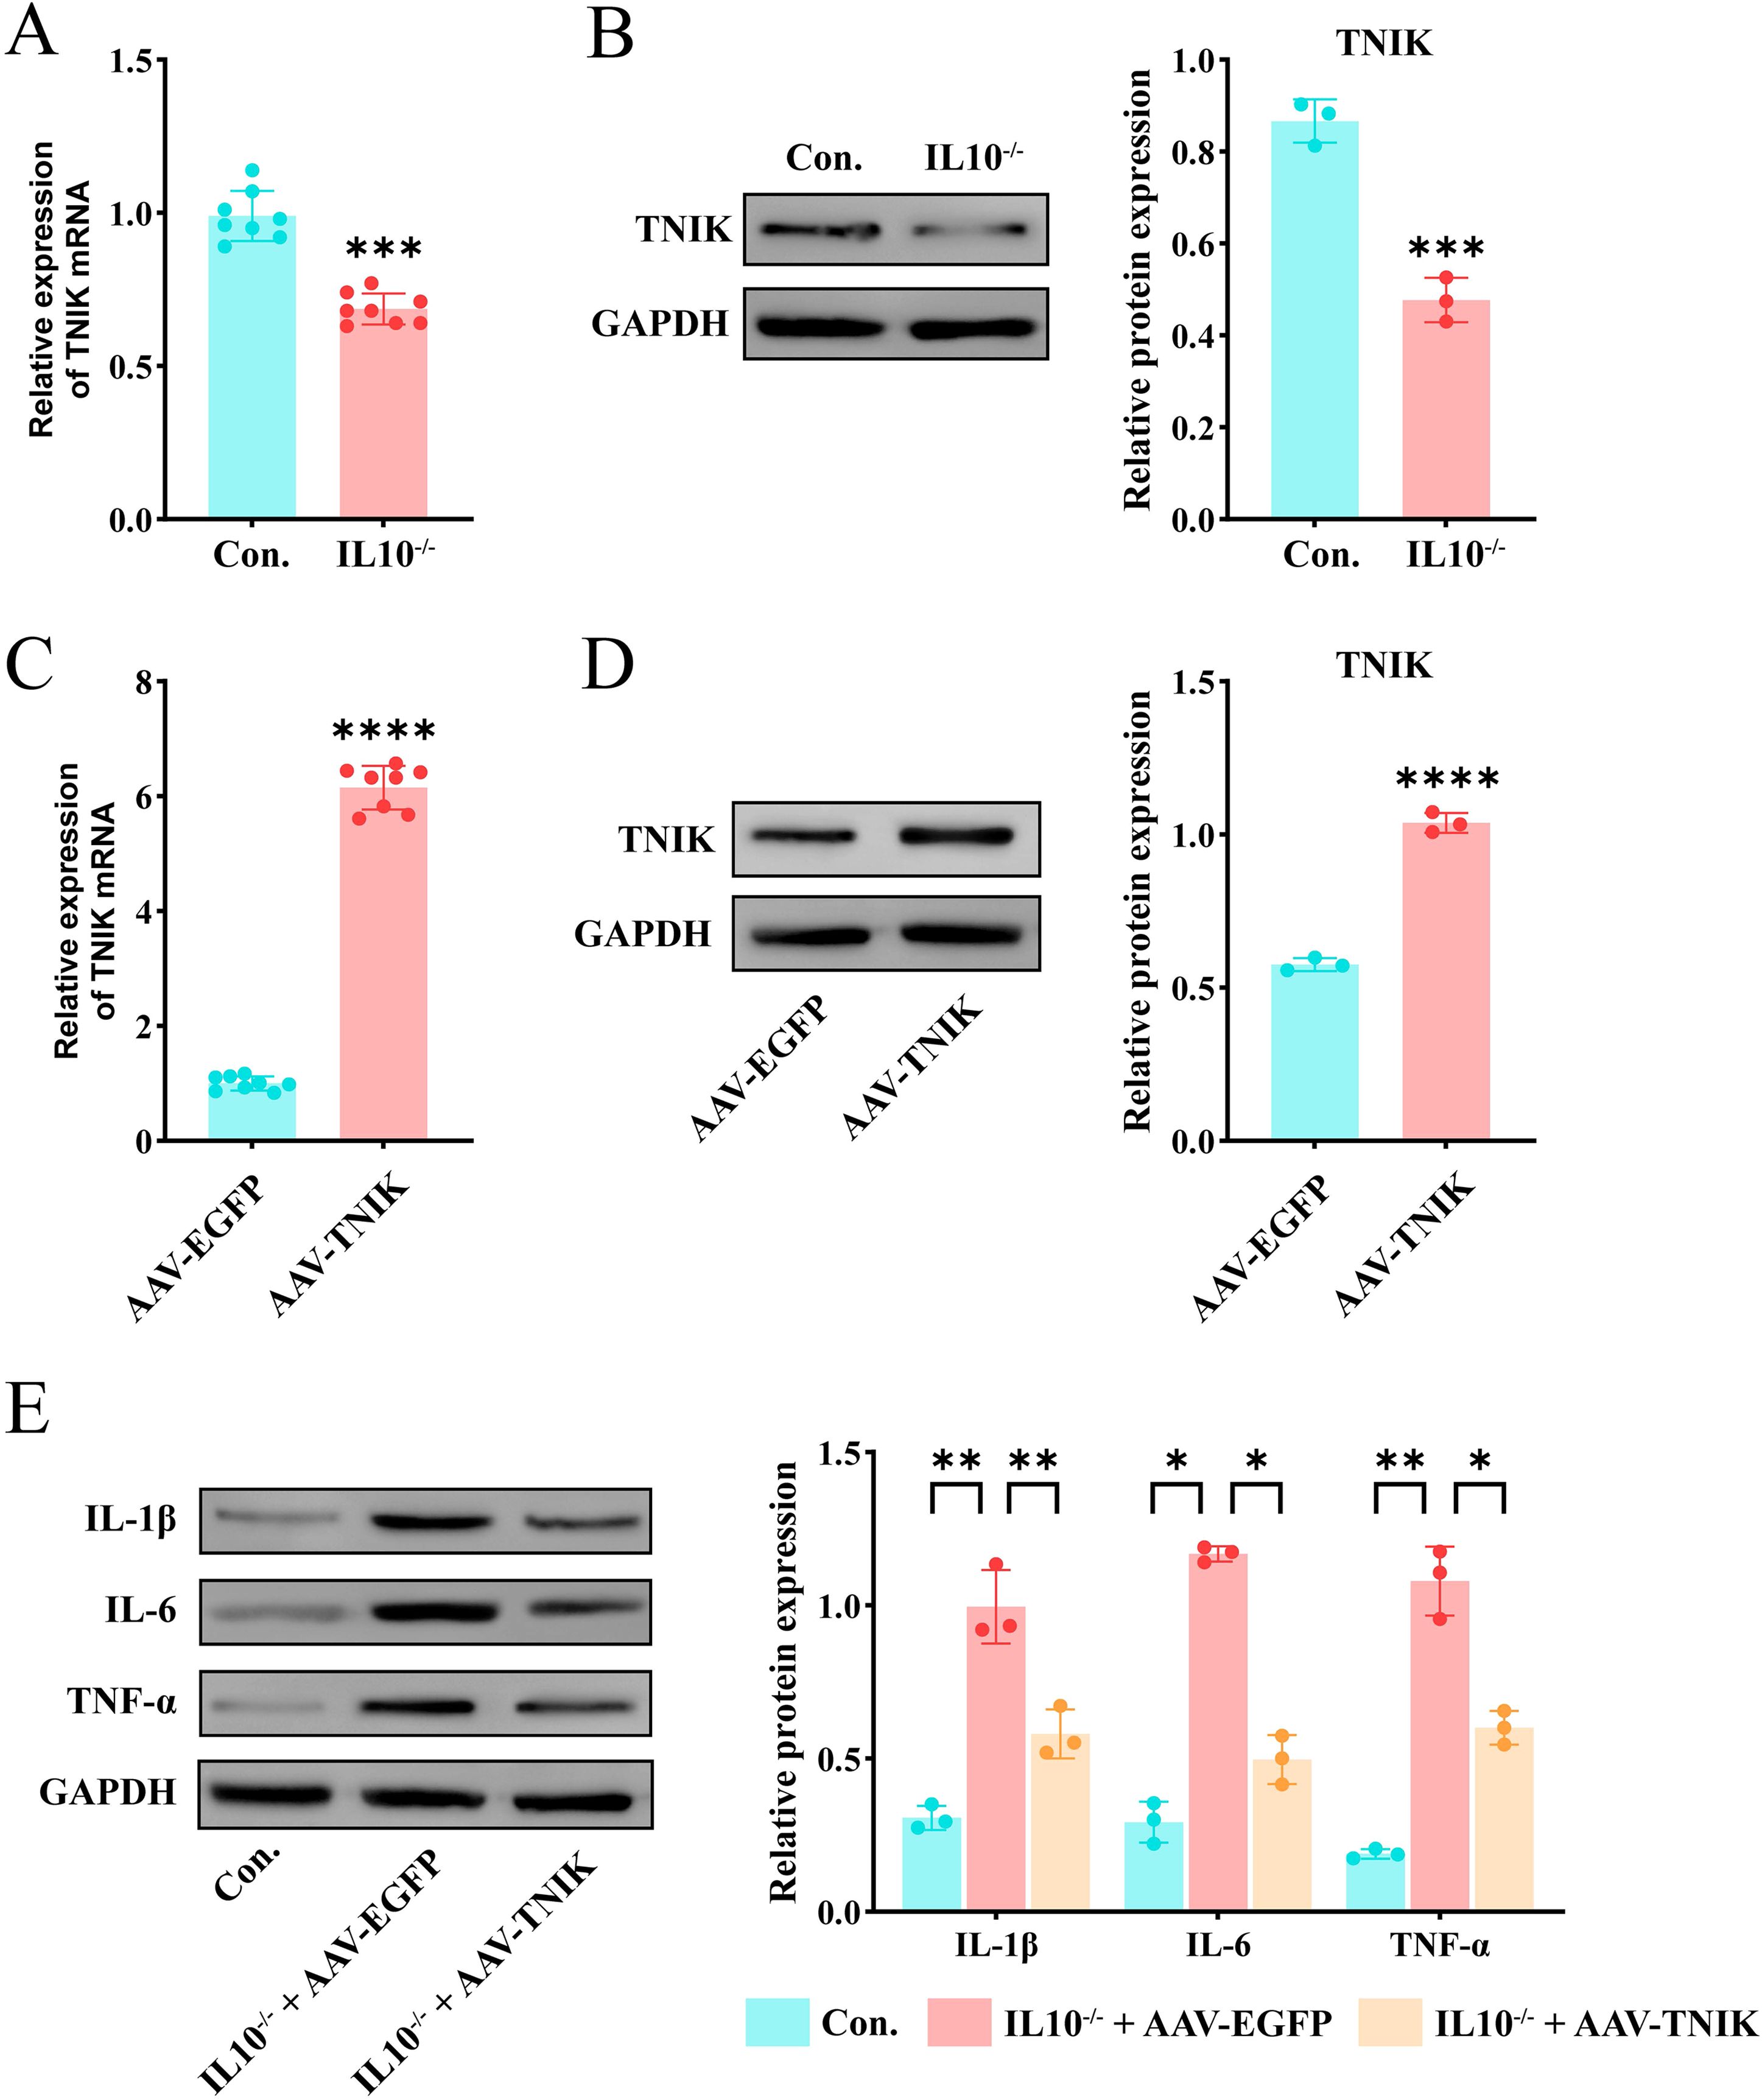
Figure 9. Up-regulation of TNIK alleviates inflammatory response in IL-10-/- mediated IBD. (A) Comparison of mRNA expression level of TNIK gene in IBD and Control groups(n=8). (B) Comparison of TNIK protein expression levels between IBD and Control groups. (C) Results of AAV-TNIK overexpression efficiency (mRNA level) (n=8). (D) Results of AAV-TNIK overexpression efficiency (protein level). (E) Changes in protein levels of inflammatory factors in IBD after AAV-TNIK overexpression. Data are presented as mean ± SD. Statistical significance in (A–D) was determined by unpaired t-test. In (E), two-way ANOVA followed by Tukey’s post hoc test was used for multiple comparisons. Collectively, these findings demonstrated that TNIK up-regulation exerts protective effects by attenuating inflammatory responses in IBD. Statistical significance: *P < 0.05, **P < 0.01, ***P < 0.001 and ****P < 0.0001.
AAV9-mediated TNIK overexpression alleviated the colonic inflammatory response in IL-10-/- mice
To further investigate the biological function of TNIK’s cellular functions, BALB/cAnCya mice were randomly assigned to two groups: AAV-TNIK and AAV-EGFP. Each group received a tail vein injection of the respective recombinant AAV9 vector. AAV-EGFP served as the negative control. Changes in TNIK expression were detected 2 weeks after injection. qRT-PCR and Western blotting (WB) analyses confirmed efficient AAV9-mediated overexpression, as evidenced by markedly elevated TNIK expression in the AAV-TNIK group compared to AAV-EGFP (P < 0.001, Figures 9C, D). Afterwards, mice were allocated into Control (untreated BALB/cAnCya mice), IL-10-/- + AAV-EGFP, and IL-10-/- + AAV-TNIK group. The WB analysis (Figure 9E) showed that, compared to the Control group, the IBD group exhibited markedly elevated levels of inflammatory cytokines IL-1β, IL-6, and TNF-α (P < 0.05). In contrast, these cytokines were significantly downregulated in the IL-10-/- + AAV-TNIK group.
TNIK promoted colonic epithelial cell proliferation, suppresses apoptosis, and alleviates IL-10-/- -mediated tissue injury
To investigate the role of TNIK in maintaining colonic epithelial homeostasis, immunohistochemical staining for Ki67 and Cleaved caspase3 was performed on mouse colonic tissues (Figure 10). In IL-10-/- mice, evident colonic tissue damage was observed, accompanied by increased expression of Cleaved caspase3 and Ki67, indicating enhanced epithelial apoptosis and proliferation. This finding reflects the pathological process of IBD, in which the colon undergoes continuous injury and repair. Notably, AAV-mediated overexpression of TNIK significantly reduced Cleaved caspase 3 expression while further increasing Ki67 levels. Consequently, the extent of colonic tissue injury was markedly alleviated, suggesting that TNIK may restore epithelial homeostasis by promoting epithelial proliferation and suppressing apoptosis, thereby mitigating IBD severity.
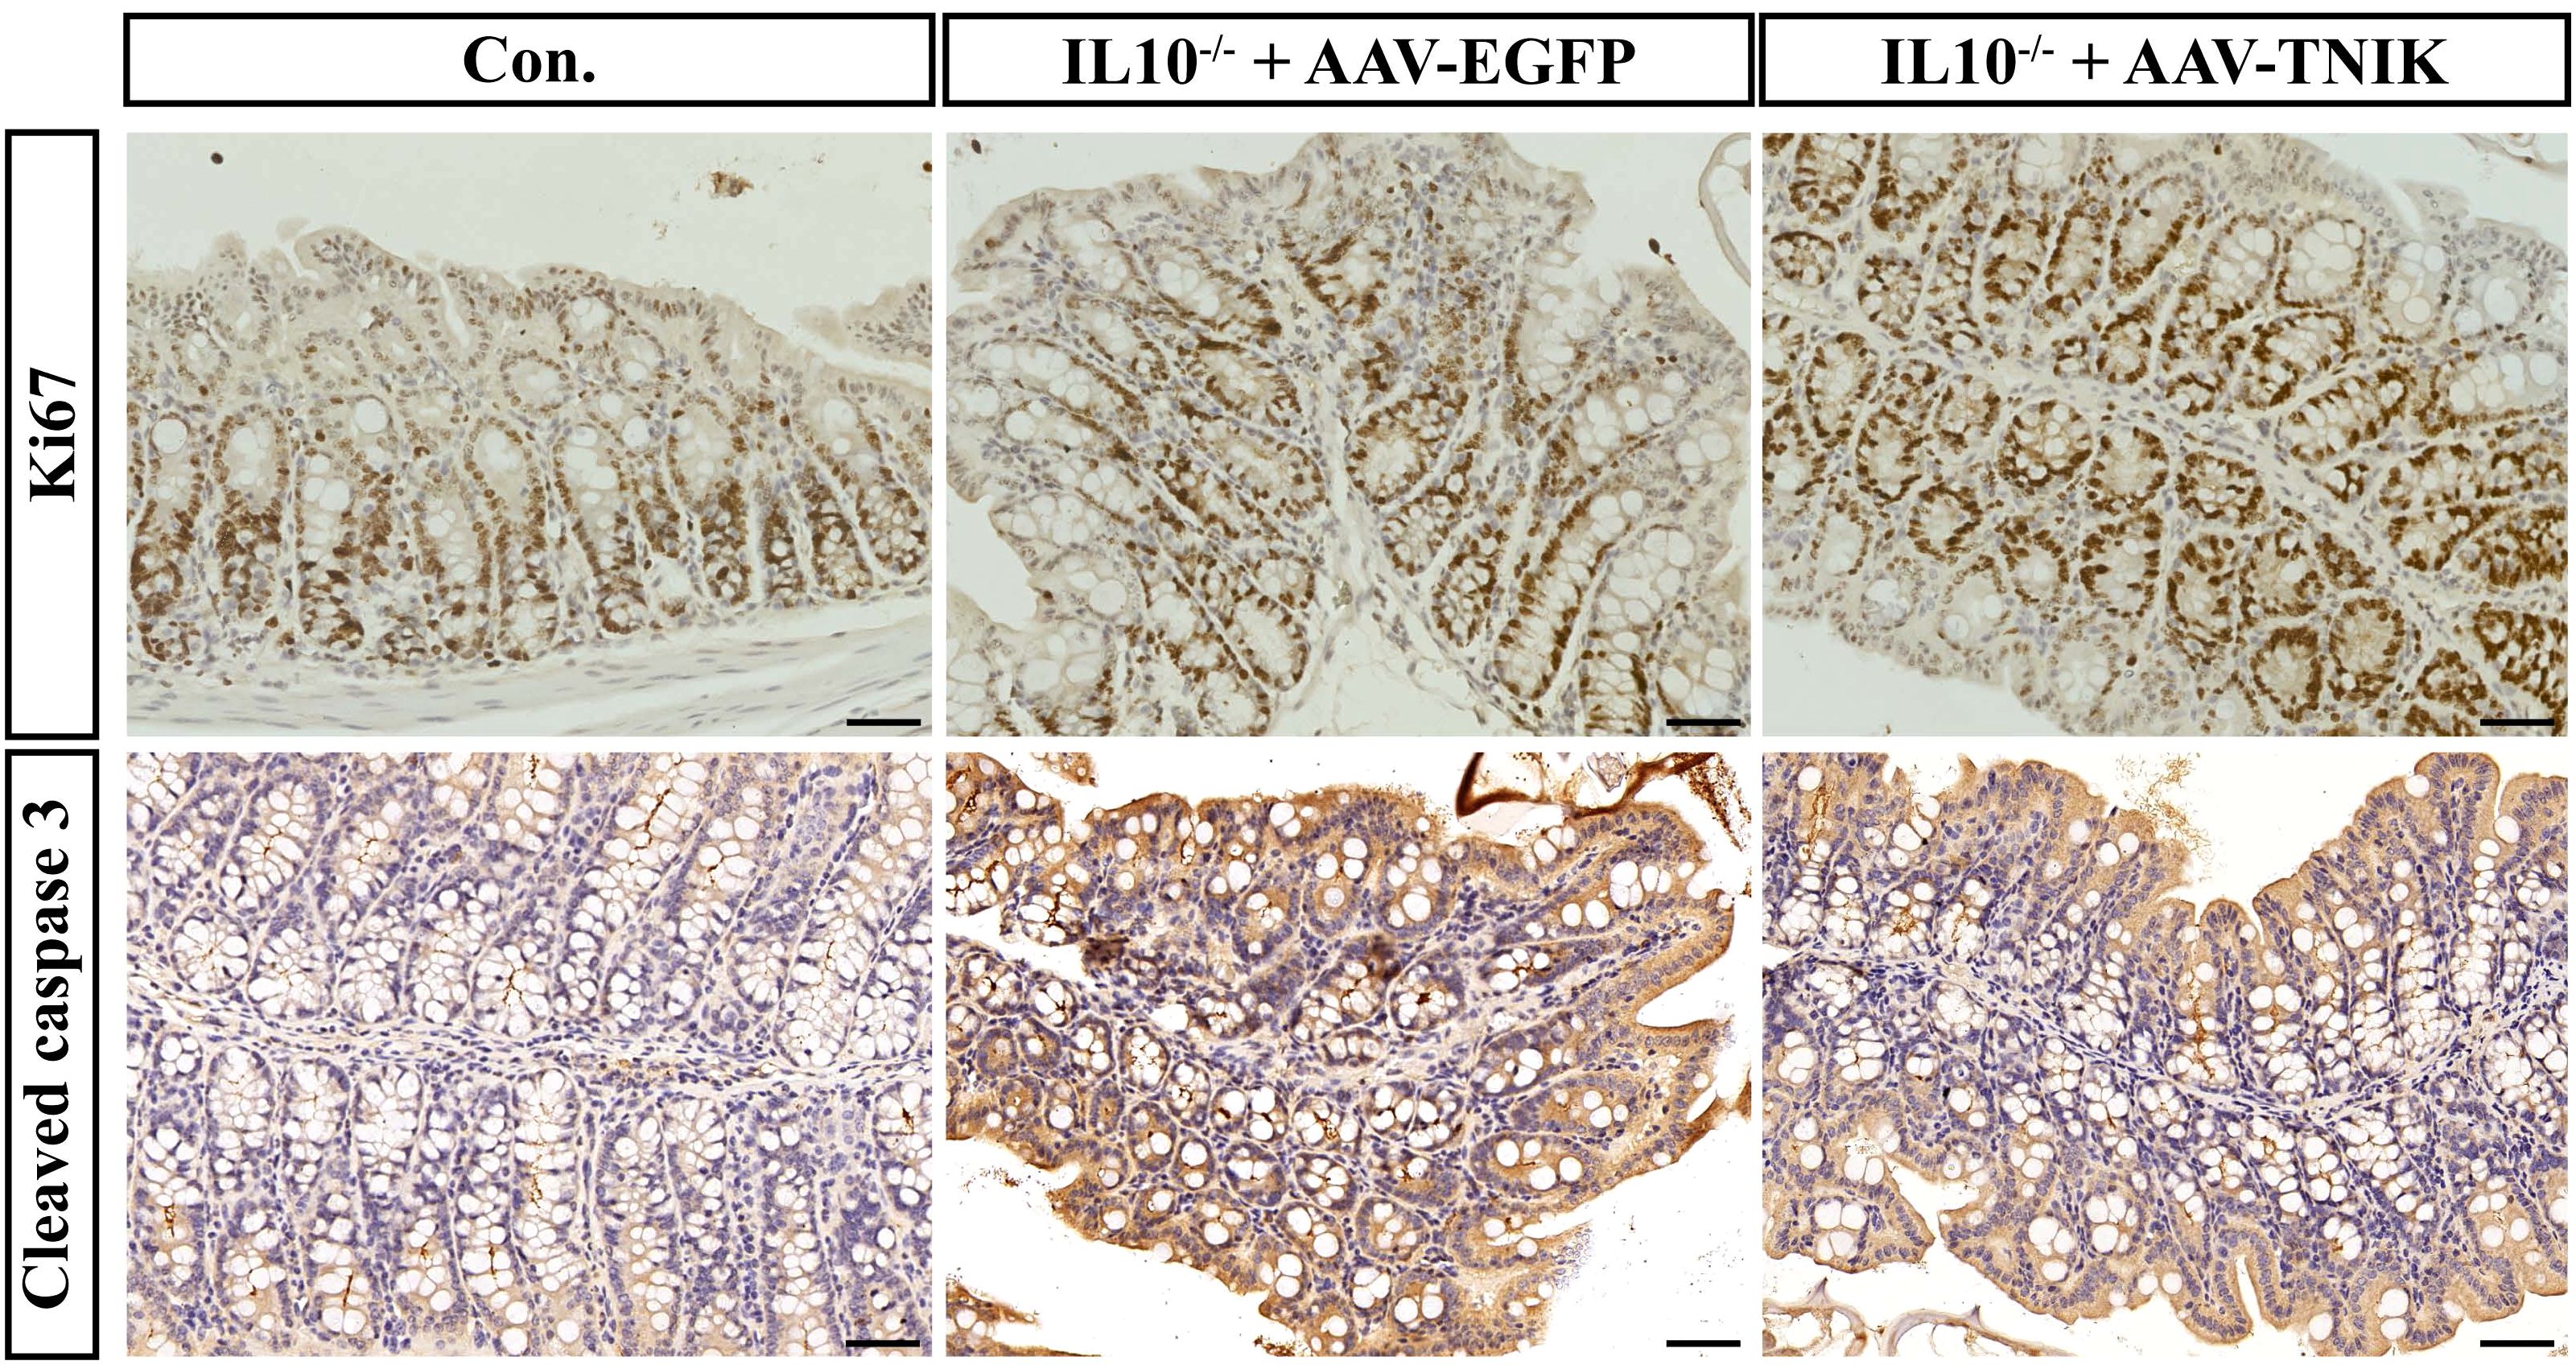
Figure 10. TNIK promotes colonic epithelial cell proliferation and ameliorates apoptosis imbalance. The IHC staining results of mouse colonic tissues showing the expression of Ki67 (top row) and Cleaved caspase-3 (bottom row). Scale bars, 50 µm.
Discussion
Although previous MR studies have established a causal relationship between the GM and IBD, the molecular mechanisms by which GM influences host intestinal pathogenesis remain unclear. In this study, we identified TNIK as a key mediator linking gut microbiota dysbiosis to IBD pathogenesis, with cell type–specific expression patterns and functional validation in vivo. It is noteworthy that our study is not the first to recognize the importance of TNIK in IBD. A previous MR analysis identified TNIK as a GM-associated gene significantly related to IBD, predicting that higher TNIK expression exerts a protective effect in patients with IBD (OR = 0.935, 95% CI = 0.915–0.957, P < 0.0001), but this observation was not further explored (40). Building on this finding, we provided in vivo validation, thereby reinforcing the evidence for the pivotal role of TNIK in IBD.
TNIK encodes a serine/threonine kinase interacting with TRAF2/NCK, known to regulate the Wnt/β-catenin signaling axis and thereby maintain epithelial homeostasis. Previous studies have shown that insufficient Wnt activity in the mucosa of patients with chronic IBD impairs epithelial healing, while exogenous activation of Wnt signaling through R-spondin analogs accelerates epithelial regeneration and ameliorates inflammatory markers of colitis (41). Thus, downregulation of TNIK in colonic epithelial cells may reduce barrier repair capacity, facilitating the translocation of bacteria and their products into the lamina propria and triggering excessive inflammation (42). Although further experimental evidence is required to confirm the role of TNIK in epithelial barrier restoration, our findings demonstrate that TNIK overexpression significantly attenuates colonic inflammation in IL-10-/- mice.
In addition, TNIK also participates in the regulation of inflammatory signaling pathways, further underscoring its multifaceted role in IBD pathogenesis. It has been shown that TNIK deficiency results in an excessive bias of T lymphocytes toward the effector cell lineage, a significant upregulation of inflammatory signaling pathways in damaged epithelial cells, and an increase in apoptosis (43, 44). This suggests that TNIK has a role in the intestinal mucosa in suppressing abnormal inflammatory responses and maintaining immune and barrier homeostasis. Moreover, our single-cell transcriptomic analysis revealed cell type–specific differences in TNIK expression. In colonic epithelial cells (including colonocytes and goblet cells), TNIK expression was markedly downregulated, whereas in T/NK cells, it was upregulated. This suggests that TNIK may exert distinct biological functions in different cellular contexts: reduced expression in epithelial cells could compromise mucosal repair and barrier integrity, thereby facilitating bacterial translocation and triggering inflammation, while elevated expression in immune cells may represent a compensatory mechanism aimed at restraining excessive immune activation (44). Such bidirectional regulation underscores the complexity of TNIK’s role in IBD pathogenesis and highlights the importance of considering cell type–specific contexts when dissecting its precise biological functions.
The strengths of this study are the following. (1) Compared with previous studies, we focused more specifically on identifying key nodal genes mediating the effects of GM on IBD, and further validated their importance using an in vivo animal model. (2) We constructed a nomogram model based on the key nodes TMEM163 and TNIK, and demonstrated its favorable predictive performance in the training cohort GSE87473. These findings suggest that our results also possess potential clinical predictive value.
However, several limitations of this study should be acknowledged. (1) We employed a unidirectional MR analysis, which has certain inherent limitations. Nevertheless, multiple sensitivity tests were performed, which to some extent strengthened the robustness of the causal inference between GM and IBD. (2) We did not directly demonstrate whether GM influences IBD by modulating TNIK expression, an important question that warrants broader investigation. (3) Our validation was restricted to the IL-10-/- mouse model, which limits the generalizability of the findings. Future studies should incorporate additional models as well as in vitro cellular experiments for further validation. (4) As this work was primarily based on inference and animal experiments, further clinical validation will be of great value to substantiate these findings.
In summary, we combined MR analysis, multi-omics data and animal experimental results, and found that TNIK is a potential target of the intestinal flora to influence the development of IBD, and may be involved in the disease process through the modulation of immune cell function, cytokine secretion and intestinal barrier stability, and other mechanisms together. This finding offers novel insights into the pathogenesis of IBD and may serve as a foundation for future studies exploring its underlying mechanisms. However, more clinical trials and data are still needed to support how to use TNIK to treat or predict IBD.
Data availability statement
The datasets presented in this study can be found in online repositories. The names of the repository/repositories and accession number(s) can be found in the article/Supplementary Material.
Ethics statement
The animal studies were approved by the Ethics Committee of the 940th Hospital of Joint Logistics Support Force of Chinese PLA (approval number: 2023KYLL028). The studies were conducted in accordance with the local legislation and institutional requirements. Written informed consent was obtained from the owners for the participation of their animals in this study.
Author contributions
XC: Conceptualization, Data curation, Formal Analysis, Methodology, Writing – original draft, Writing – review & editing. HW: Conceptualization, Formal Analysis, Investigation, Software, Supervision, Writing – original draft, Writing – review & editing. BoW: Conceptualization, Data curation, Formal Analysis, Investigation, Resources, Writing – original draft, Writing – review & editing. YM: Conceptualization, Formal Analysis, Software, Supervision, Visualization, Writing – review & editing. XZ: Conceptualization, Formal Analysis, Investigation, Software, Supervision, Validation, Writing – review & editing. JG: Data curation, Formal Analysis, Resources, Software, Supervision, Visualization, Writing – review & editing. SL: Data curation, Formal Analysis, Software, Supervision, Visualization, Writing – review & editing. YW: Data curation, Formal Analysis, Resources, Software, Supervision, Visualization, Writing – review & editing. JH: Conceptualization, Data curation, Formal Analysis, Methodology, Resources, Supervision, Visualization, Writing – review & editing. QM: Conceptualization, Data curation, Formal Analysis, Methodology, Resources, Supervision, Visualization, Writing – review & editing. JC: Conceptualization, Formal Analysis, Software, Supervision, Visualization, Writing – review & editing. BiW: Conceptualization, Data curation, Formal Analysis, Investigation, Methodology, Supervision, Writing – review & editing. YW: Conceptualization, Data curation, Formal Analysis, Funding acquisition, Investigation, Project administration, Writing – review & editing.
Funding
The author(s) declare financial support was received for the research and/or publication of this article. This work was supported by the National Natural Science Foundation of China (82302112), the Youth Science and Technology Foundation of Gansu Province (23JRRA320), the Science and Technology Foundation of Gansu Province (25JRRA421) and the Science and Technology Program of Lanzhou (2023-4-5).
Conflict of interest
The authors declare that the research was conducted in the absence of any commercial or financial relationships that could be construed as a potential conflict of interest.
Generative AI statement
The author(s) declare that no Generative AI was used in the creation of this manuscript.
Any alternative text (alt text) provided alongside figures in this article has been generated by Frontiers with the support of artificial intelligence and reasonable efforts have been made to ensure accuracy, including review by the authors wherever possible. If you identify any issues, please contact us.
Publisher’s note
All claims expressed in this article are solely those of the authors and do not necessarily represent those of their affiliated organizations, or those of the publisher, the editors and the reviewers. Any product that may be evaluated in this article, or claim that may be made by its manufacturer, is not guaranteed or endorsed by the publisher.
Supplementary material
The Supplementary Material for this article can be found online at: https://www.frontiersin.org/articles/10.3389/fimmu.2025.1678444/full#supplementary-material
References
1. Park SK, Kim S, Lee GY, Kim SY, Kim W, Lee CW, et al. Development of a machine learning model to distinguish between ulcerative colitis and Crohn’s disease using RNA sequencing data. Diagnostics (Basel Switzerland). (2021) 11:2365. doi: 10.3390/diagnostics11122365
2. Dipasquale V and Romano C. Genes vs environment in inflammatory bowel disease: an update. Expert Rev Clin Immunol. (2022) 18:1005–13. doi: 10.1080/1744666x.2022.2108407
3. Neuman MG and Nanau RM. Single-nucleotide polymorphisms in inflammatory bowel disease. Trans Res. (2012) 160:45–64. doi: 10.1016/j.trsl.2011.10.006
4. Veloso PM, MaChado R, and Nobre C. Mesalazine and inflammatory bowel disease - from well-established therapies to progress beyond the state of the art. Eur J pharmaceutics biopharmaceutics. (2021) 167:89–103. doi: 10.1016/j.ejpb.2021.07.014
5. Xu R, Weber MC, Hu X, Neumann PA, and Kamaly N. Annexin A1 Based Inflammation Resolving Mediators and Nanomedicines for Inflammatory Bowel Disease Therapy. Semin Immunol. (2022) 61-64:101664. doi: 10.1016/j.smim.2022.101664
6. Ahmed A, Schmidt C, and Brunner T. Extra-adrenal glucocorticoid synthesis in the intestinal mucosa: between immune homeostasis and immune escape. Front Immunol. (2019) 10:1438. doi: 10.3389/fimmu.2019.01438
7. Heller C, Moss AC, and Rubin DT. Overview to challenges in ibd 2024-2029. Inflammatory bowel Dis. (2024) 30:S1–s4. doi: 10.1093/ibd/izae092
8. Yeshi K, Ruscher R, Hunter L, Daly NL, Loukas A, and Wangchuk P. Revisiting inflammatory bowel disease: pathology, treatments, challenges and emerging therapeutics including drug leads from natural products. J Clin Med. (2020) 9:1273. doi: 10.3390/jcm9051273
9. Santana PT, Rosas SLB, Ribeiro BE, Marinho Y, and de Souza HSP. Dysbiosis in inflammatory bowel disease: pathogenic role and potential therapeutic targets. Int J Mol Sci. (2022) 23:3464. doi: 10.3390/ijms23073464
10. Taurog JD, Richardson JA, Croft JT, Simmons WA, Zhou M, Fernández-Sueiro JL, et al. The germfree state prevents development of gut and joint inflammatory disease in HLA-B27 transgenic rats. J Exp Med. (1994) 180:2359–64. doi: 10.1084/jem.180.6.2359
11. Ahmed I, Roy BC, Khan SA, Septer S, and Umar S. Microbiome, metabolome and inflammatory bowel disease. Microorganisms. (2016) 4:20. doi: 10.3390/microorganisms4020020
12. Chang C and Lin H. Dysbiosis in gastrointestinal disorders. Best Pract Res Clin Gastroenterol. (2016) 30:3–15. doi: 10.1016/j.bpg.2016.02.001
13. Rao VL, Micic D, and Kim KE. Primary care evaluation and management of gastroenterologic issues in women. Obstetrics gynecology Clinics North America. (2016) 43:347–66. doi: 10.1016/j.ogc.2016.01.006
14. Korada SK, Yarla NS, Bishayee A, Aliev G, Aruna Lakshmi K, Arunasree MK, et al. Can probiotics cure inflammatory bowel diseases? Curr Pharm design. (2016) 22:904–17. doi: 10.2174/1381612822666151209153249
15. Ventura I, Chomon-García M, Tomás-Aguirre F, Palau-Ferré A, Legidos-García ME, Murillo-Llorente MT, et al. Therapeutic and immunologic effects of short-chain fatty acids in inflammatory bowel disease: A systematic review. Int J Mol Sci. (2024) 25:10879. doi: 10.3390/ijms252010879
16. Sokol H, Pigneur B, Watterlot L, Lakhdari O, Bermúdez-Humarán LG, Gratadoux JJ, et al. Faecalibacterium prausnitzii is an anti-inflammatory commensal bacterium identified by gut microbiota analysis of Crohn disease patients. Proc Natl Acad Sci United States America. (2008) 105:16731–6. doi: 10.1073/pnas.0804812105
17. Lopez-Siles M, Martinez-Medina M, Surís-Valls R, Aldeguer X, Sabat-Mir M, Duncan SH, et al. Changes in the abundance of faecalibacterium prausnitzii phylogroups I and II in the intestinal mucosa of inflammatory bowel disease and patients with colorectal cancer. Inflammatory bowel Dis. (2016) 22:28–41. doi: 10.1097/mib.0000000000000590
18. Hoarau G, Mukherjee PK, Gower-Rousseau C, Hager C, Chandra J, Retuerto MA, et al. Bacteriome and mycobiome interactions underscore microbial dysbiosis in familial Crohn’s Disease. mBio. (2016) 7:e01250-16. doi: 10.1128/mBio.01250-16
19. Wang AY, Popov J, and Pai N. Fecal microbial transplant for the treatment of pediatric inflammatory bowel disease. World J Gastroenterol. (2016) 22:10304–15. doi: 10.3748/wjg.v22.i47.10304
20. Yu F, Yang Y, Wu D, Chang M, Han C, Wang Q, et al. Deciphering genetic causality between inflammatory bowel disease and periodontitis through bi-directional two-sample mendelian randomization. Sci Rep. (2023) 13:18620. doi: 10.1038/s41598-023-45527-z
21. Chen L, Fu G, and Jiang C. Mendelian randomization as an approach to assess causal effects of inflammatory bowel disease on atrial fibrillation. Aging. (2021) 13:12016–30. doi: 10.18632/aging.202906
22. Dong H, Xu F, and Linghu E. Unraveling the link between plasma caffeine concentrations and inflammatory bowel disease risk through mendelian randomization. Am J Clin Nutr. (2024) 119:711–5. doi: 10.1016/j.ajcnut.2024.01.003
23. Liu B, Ye D, Yang H, Song J, Sun X, Mao Y, et al. Two-sample mendelian randomization analysis investigates causal associations between gut microbial genera and inflammatory bowel disease, and specificity causal associations in ulcerative colitis or Crohn’s Disease. Front Immunol. (2022) 13:921546. doi: 10.3389/fimmu.2022.921546
24. Xiao S, Su K, Gao H, Qiao C, Sha S, Liu X, et al. Association of inflammatory factors and calcium metabolism with arthritis in patients with inflammatory bowel disease: evidence from mediated mendelian randomization. Mediators Inflammation. (2025) 2025:1675577. doi: 10.1155/mi/1675577
25. Huang YL, Zheng JM, Shi ZY, Chen HH, Wang XT, and Kong FB. Inflammatory proteins may mediate the causal relationship between gut microbiota and inflammatory bowel disease: A mediation and multivariable mendelian randomization study. Medicine. (2024) 103:e38551. doi: 10.1097/md.0000000000038551
26. Zeng C, Zhang C, He C, and Song H. Investigating the causal impact of gut microbiota on glioblastoma: A bidirectional mendelian randomization study. BMC Genomics. (2023) 24:784. doi: 10.1186/s12864-023-09885-2
27. Wang N, Liu J, Chai B, Yao J, Du X, Mei Q, et al. Bidirectional two-sample mendelian randomization analysis investigates causal associations between cathepsins and inflammatory bowel disease. Front Genet. (2024) 15:1436407. doi: 10.3389/fgene.2024.1436407
28. Xu M, Kong Y, Chen N, Peng W, Zi R, Jiang M, et al. Identification of immune-related gene signature and prediction of CeRNA network in active ulcerative colitis. Front Immunol. (2022) 13:855645. doi: 10.3389/fimmu.2022.855645
29. Hua R, Qiao G, Chen G, Sun Z, Jia H, Li P, et al. Single-cell RNA-sequencing analysis of colonic lamina propria immune cells reveals the key immune cell-related genes of ulcerative colitis. J Inflammation Res. (2023) 16:5171–88. doi: 10.2147/jir.S440076
30. Tan Z, Liu C, He P, Wu Y, Li J, Zhang J, et al. Based on weighted gene co-expression network analysis reveals the hub immune infiltration-related genes associated with ulcerative colitis. J Inflammation Res. (2024) 17:357–70. doi: 10.2147/jir.S428503
31. Yang L, Chen H, Yang Y, Deng Y, Chen Q, Luo B, et al. Single-cell and microarray chip analysis revealed the underlying pathogenesis of ulcerative colitis and validated model genes in diagnosis and drug response. Hum Cell. (2023) 36:132–45. doi: 10.1007/s13577-022-00801-6
32. Mao R, Yu Q, and Li J. The causal relationship between gut microbiota and inflammatory dermatoses: A mendelian randomization study. Front Immunol. (2023) 14:1231848. doi: 10.3389/fimmu.2023.1231848
33. Qin Q, Zhao L, Ren A, Li W, Ma R, Peng Q, et al. Systemic lupus erythematosus is causally associated with hypothyroidism, but not hyperthyroidism: A mendelian randomization study. Front Immunol. (2023) 14:1125415. doi: 10.3389/fimmu.2023.1125415
34. Lu Y, Cai X, Shi B, and Gong H. Gut microbiota, plasma metabolites, and osteoporosis: unraveling links via mendelian randomization. Front Microbiol. (2024) 15:1433892. doi: 10.3389/fmicb.2024.1433892
35. Yang S, Guo J, Kong Z, Deng M, Da J, Lin X, et al. Causal effects of gut microbiota on sepsis and sepsis-related death: insights from genome-wide mendelian randomization, single-cell RNA, bulk RNA sequencing, and network pharmacology. J Trans Med. (2024) 22:10. doi: 10.1186/s12967-023-04835-8
36. Zhou X, Shen S, and Wang Z. Genetic evidence of bidirectional mendelian randomization study on the causality between gut microbiome and respiratory diseases contributes to gut-lung axis. Sci Rep. (2024) 14:25550. doi: 10.1038/s41598-024-77273-1
37. Lan L, Huang C, Liu D, Cheng Y, Tang R, Gu J, et al. WNT2B activates macrophages via NF-κB signaling pathway in inflammatory bowel disease. FASEB J. (2024) 38:e23551. doi: 10.1096/fj.202302213R
38. Sargent D, Bétemps D, Drouyer M, Verchere J, Gaillard D, Arsac JN, et al. Investigating the neuroprotective effect of AAV-mediated β-synuclein overexpression in a transgenic model of synucleinopathy. Sci Rep. (2018) 8:17563. doi: 10.1038/s41598-018-35825-2
39. Ji ZH, He S, Xie WY, Zhao PS, Ren WZ, Gao W, et al. Agaricus blazei polysaccharide alleviates DSS-induced colitis in mice by modulating intestinal barrier and remodeling metabolism. Nutrients. (2023) 15:4877. doi: 10.3390/nu15234877
40. Bi GW, Wu ZG, Li Y, Wang JB, Yao ZW, Yang XY, et al. Intestinal flora and inflammatory bowel disease: causal relationships and predictive models. Heliyon. (2024) 10:e38101. doi: 10.1016/j.heliyon.2024.e38101
41. Xie L, Fletcher RB, Bhatia D, Shah D, Phipps J, Deshmukh S, et al. Robust colonic epithelial regeneration and amelioration of colitis via FZD-specific activation of Wnt signaling. Cell Mol Gastroenterol Hepatol. (2022) 14:435–64. doi: 10.1016/j.jcmgh.2022.05.003
42. Martini E, Krug SM, Siegmund B, Neurath MF, and Becker C. Mend your fences: the epithelial barrier and its relationship with mucosal immunity in inflammatory bowel disease. Cell Mol Gastroenterol Hepatol. (2017) 4:33–46. doi: 10.1016/j.jcmgh.2017.03.007
43. Jaeger-Ruckstuhl CA, Hinterbrandner M, Höpner S, Correnti CE, Lüthi U, Friedli O, et al. TNIK signaling imprints CD8(+) T cell memory formation early after priming. Nat Commun. (2020) 11:1632. doi: 10.1038/s41467-020-15413-7
Keywords: inflammatory bowel disease, gut microbiota, mendelian randomization, TNIK, multi-omics integration, immune-epithelial crosstalk
Citation: Chai X, Wang H, Wang B, Ma Y, Zhang X, Guo J, Luo S, Wang Y, Hong J, Ma Q, Chen J, Wang B and Wang Y (2025) Mendelian randomization integrated with multi-omics analysis identifies TNIK as a key gene in gut microbiota-induced IBD development. Front. Immunol. 16:1678444. doi: 10.3389/fimmu.2025.1678444
Received: 04 August 2025; Accepted: 30 October 2025;
Published: 18 November 2025.
Edited by:
Ivan Monteleone, University of Rome Tor Vergata, ItalyCopyright © 2025 Chai, Wang, Wang, Ma, Zhang, Guo, Luo, Wang, Hong, Ma, Chen, Wang and Wang. This is an open-access article distributed under the terms of the Creative Commons Attribution License (CC BY). The use, distribution or reproduction in other forums is permitted, provided the original author(s) and the copyright owner(s) are credited and that the original publication in this journal is cited, in accordance with accepted academic practice. No use, distribution or reproduction is permitted which does not comply with these terms.
*Correspondence: Yixuan Wang, d2FuZ3l4MTk5MkAxMjYuY29t; Biaomeng Wang, d2FuZ2JtMTk3MkAxNjMuY29t
†These authors have contributed equally to this work