 Qiongyan Chen1†
 Yifeng Mao2†Shangwen Cai3,4†Xijiang Zhang2Chenghao Zeng5Qingqing Chen6,7,8*
 Cheng Zheng2*
- 1Department of Respiratory and Critical Care Medicine, Wenzhou Hospital of Integrated Traditional Chinese and Western Medicine, Wenzhou, China
- 2Department of Critical Care Medicine, Taizhou Municipal Hospital (Taizhou University Affiliated Municipal Hospital), School of Medicine, Taizhou University, Taizhou, China
- 3Department of Gastroenterology, The Second Affiliated Hospital of Zhejiang University School of Medicine, Hangzhou, China
- 4Institute of Gastroenterology, Zhejiang University, Hangzhou, China
- 5Department of Anesthesiology, Second Affiliated Hospital of Zhejiang University School of Medicine, Hangzhou, China
- 6Rehabilitation Center, Taizhou Hospital of Zhejiang Province Affiliated to Wenzhou Medical University, Taizhou, China
- 7Neurorehabilitation Center, Taizhou Rehabilitation Hospital, Taizhou, China
- 8Taizhou Enze Medical Center (Group), Taizhou Rehabilitation Hospital, Taizhou, China
Background: Sepsis-associated acute lung injury (SA-ALI) is a severe complication of sepsis with high mortality. This study aimed to identify key diagnostic genes and potential therapeutic drugs for SA-ALI.
Methods: Transcriptomic data from GSE10474 and GSE32707 were integrated for differential expression and WGCNA analysis. Hub genes were screened using PPI network construction and three machine learning algorithms, and validated by Western blot. Functional enrichment, immune infiltration, and drug prediction (DSigDB) were performed, followed by molecular docking.
Results: Six hub genes (PGM3, GDF15, GART, GFOD2, E2F2, ATP1B2) were identified and validated with elevated expression in SA-ALI. These genes were enriched in inflammation, immune regulation, oxidative stress, and tissue remodeling pathways, and showed significant correlations with specific immune cell subsets. Five candidate small molecules were predicted; molecular docking revealed Celastrol had the strongest binding to all six proteins, particularly GDF15 (-9.988 kcal/mol), while Thiostrepton showed strong binding to PGM3, GFOD2, and GDF15.
Conclusion: Six diagnostic hub genes and two priority candidate drugs, Celastrol and Thiostrepton, were identified for SA-ALI, providing potential biomarkers and therapeutic targets.
1 Introduction
Sepsis is a common disease in the field of critical care medicine (1, 2). Sepsis impacts at least 30 million individuals worldwide annually, with a mortality rate reaching up to 20%, according to a World Health Organization report (3). When sepsis progresses to sepsis-associated acute lung injury (SA-ALI), the mortality rate can reach 34% to 45% (4, 5), posing a serious threat to patients’ life and health. The known causes of SA-ALI include various biochemical injuries, severe trauma and post-traumatic infection, shock, and poisoning (6), as well as various infectious diseases targeting the lungs, especially the COVID-19 pandemic that erupted at the end of 2019. Some patients can rapidly progress to SA-ALI, experience respiratory failure, and even death (7). Due to the lack of early diagnostic methods, only about 50% of SA-ALI cases can be identified by clinicians (8). Therefore, the study of early identification of SA-ALI, as well as the research on biomarkers for reducing its mortality rate and improving prognosis, is extremely important.
In recent years, basic and clinical research on biomarkers has not only deepened our understanding of the pathophysiological mechanisms of SA-ALI but has also provided a wealth of biological information, offering greater value for the prediction, diagnosis, and prognosis of the disease (9). Currently, research on SA-ALI biomarkers mainly involves non-protein indicators such as endothelial progenitor cells and exhaled breath condensate (10, 11). Despite some progress in biomarker studies over the past two decades, their clinical application value remains low. The reasons for this may include: (1) an overreliance on single indicators for early warning, diagnosis, or prediction of SA-ALI, which have limited diagnostic value, whereas a combined biomarker approach may improve accuracy; (2) low tissue and disease specificity of some markers, making them easily influenced by other factors; (3) limited understanding of the involvement of certain biomarkers in SA-ALI development; and (4) lack of validation in large-sample clinical studies (12). As a result, there is a pressing need to identify novel biomarkers for the early detection of SA-ALI.
To address these challenges, this study applied bioinformatics analysis to uncover key genes potentially involved in the pathogenesis of SA-ALI and used molecular docking to screen candidate therapeutic compounds targeting these genes. Unlike previous work that has primarily focused on isolated markers, our approach integrates computational biology and drug–target prediction, aiming not only to reveal novel biomarkers for early detection but also to provide innovative strategies for precision diagnosis and targeted therapy in SA-ALI. By bridging the gap between mechanistic insights and translational application, this study offers a new framework to improve the early identification of high-risk patients and to guide the development of effective therapeutic interventions.
2 Methods
2.1 Original data
In this research, we utilized the microarray datasets GSE10474 and GSE32707, accessible from the Gene Expression Omnibus (GEO) repository (www.ncbi.nlm.nih.gov/geo/). GSE10474, built on the GPL571 platform, comprises 13 blood samples from individuals with ALI and 21 samples from patients diagnosed solely with sepsis. GSE32707, based on the GPL10558 platform, contains 144 blood samples, from which we selected 58 cases of isolated sepsis and 31 cases of SA-ALI for additional analysis. The brief research procedure is illustrated in Figure 1.
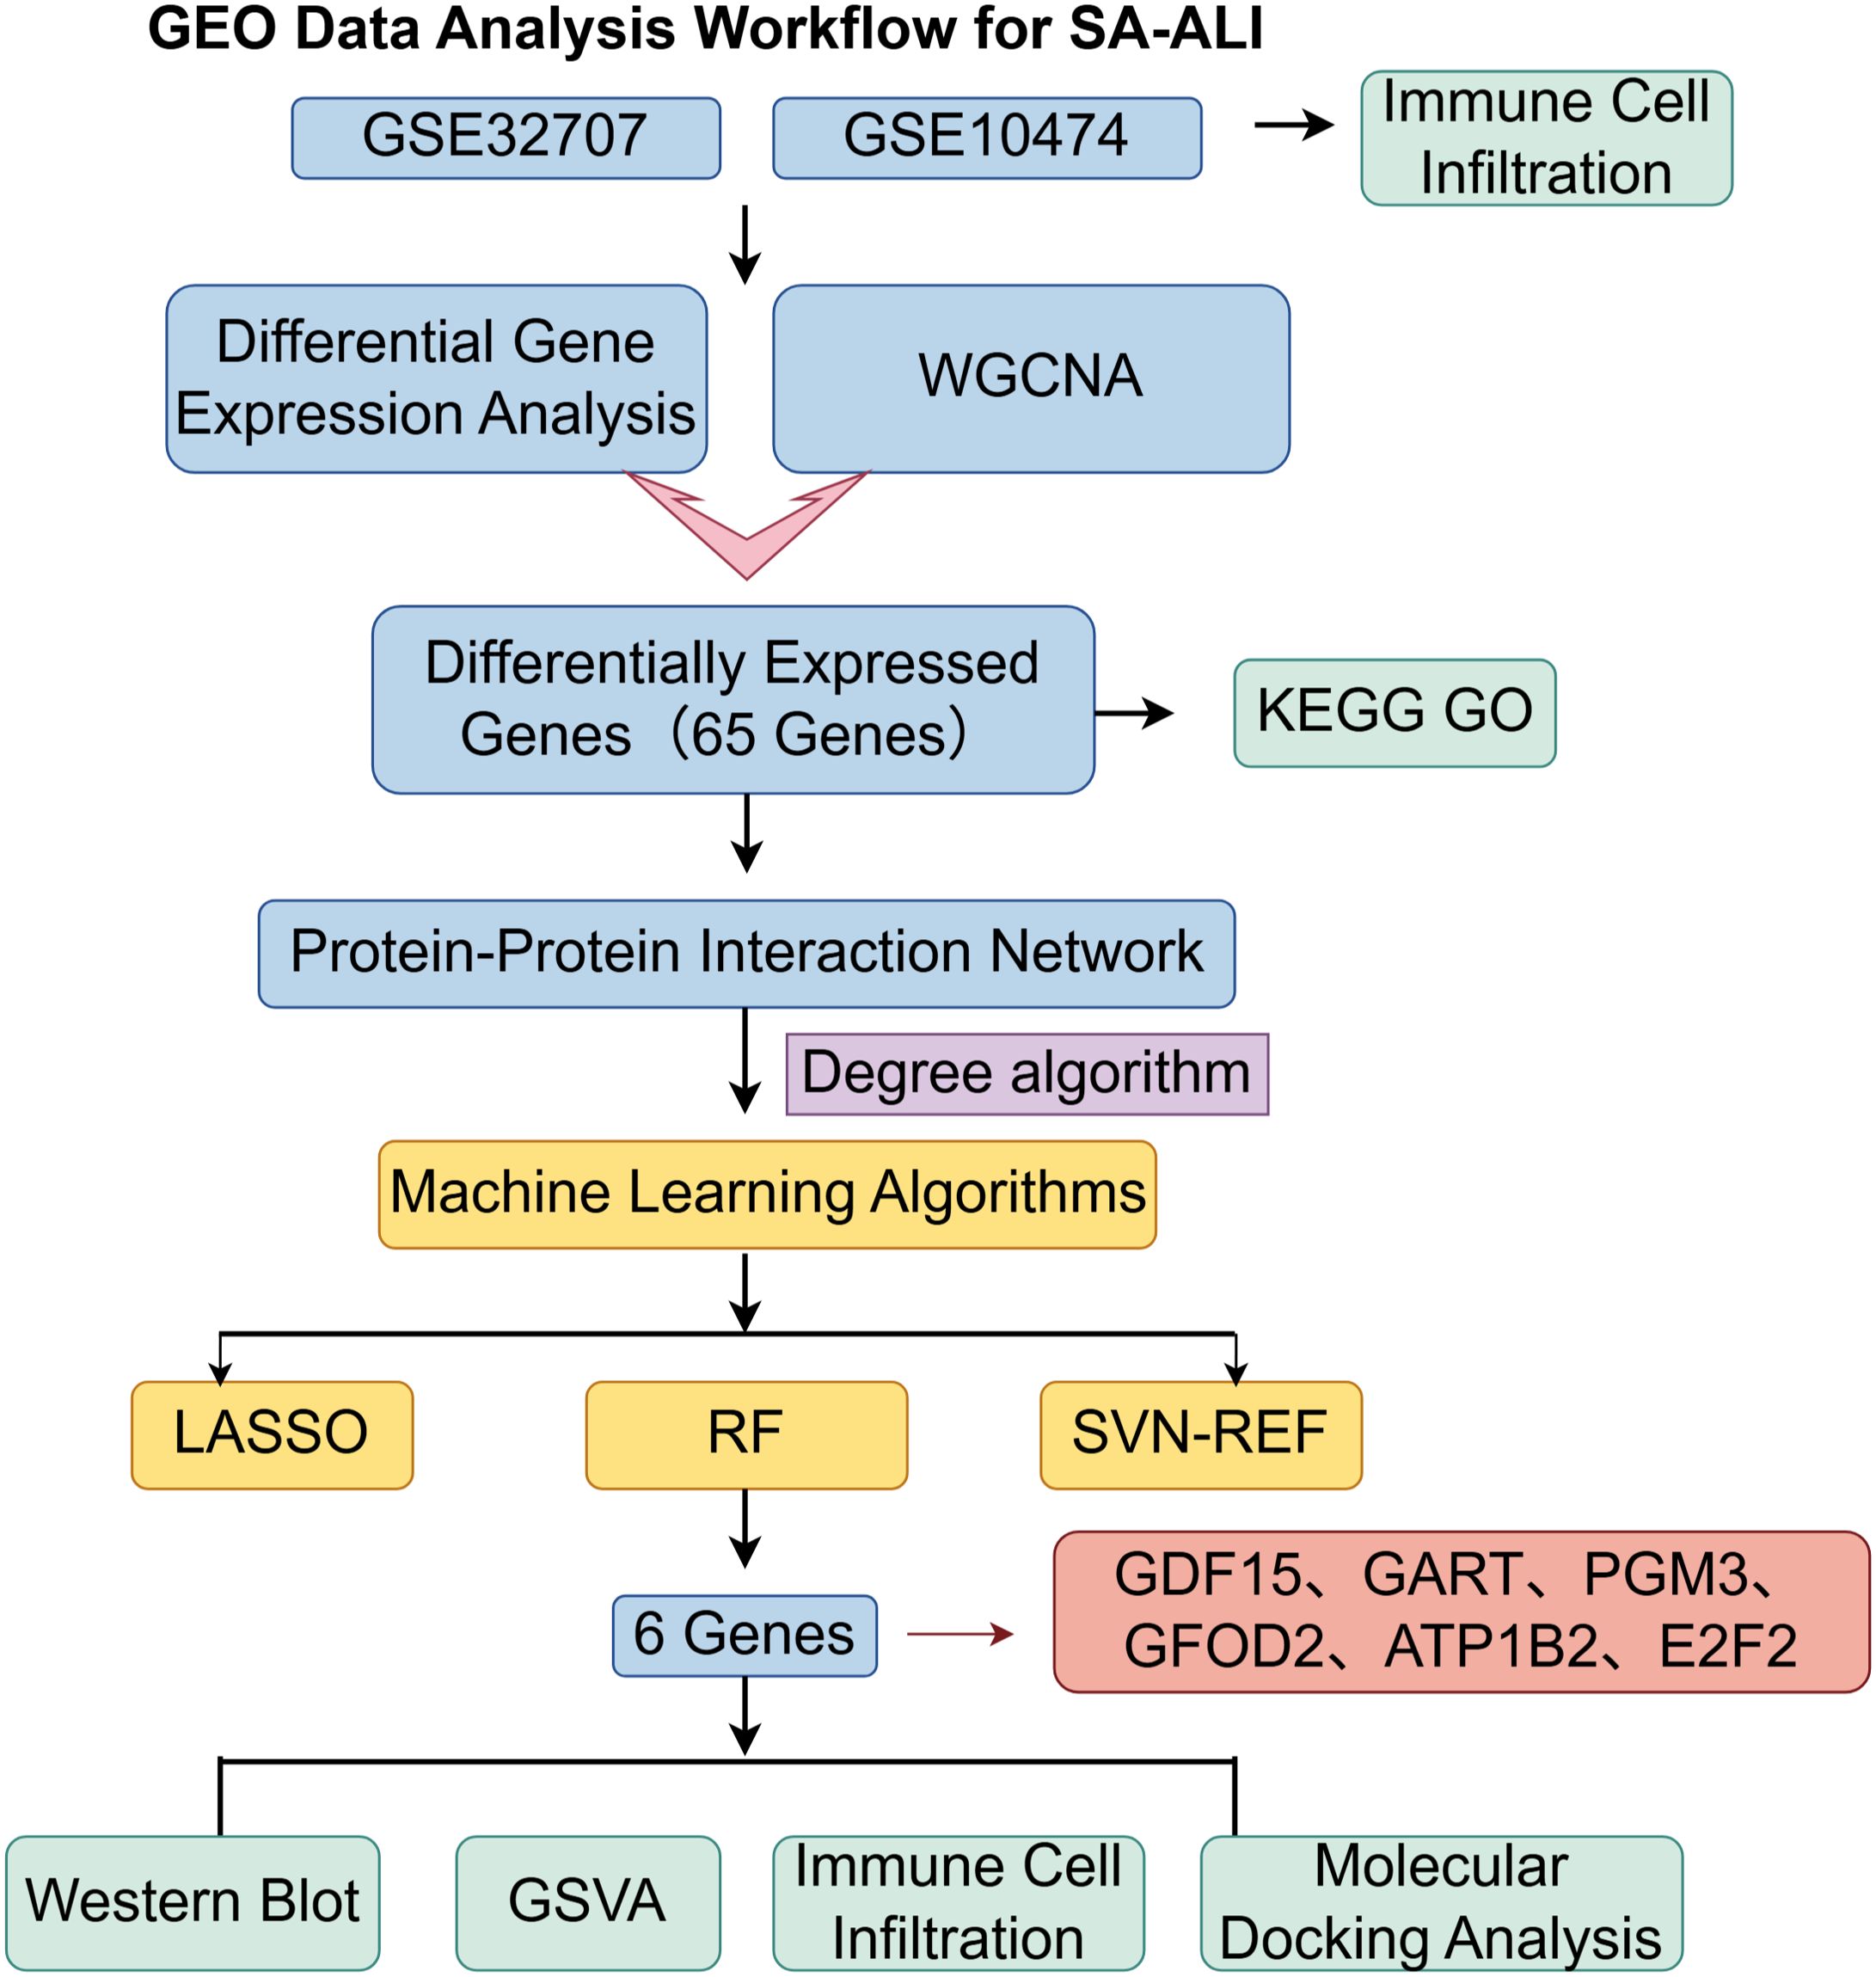
Figure 1. The working flow chart of this study.
2.2 Differential gene expression analysis
Raw microarray data were log2-transformed and quantile-normalized using the preprocessCore package in R (v4.3.3). Probe IDs were mapped to gene symbols based on platform annotation files; probes mapping to multiple genes were removed, and for genes with multiple probes, the mean expression value was calculated. Batch effects were corrected using the removeBatchEffect function in the “limma” package. For cross-platform analyses, only common genes were retained, and datasets were treated as separate batches before batch correction. Principal component analysis (PCA) plots were generated to evaluate sample distribution before and after correction.
2.3 WGCNA network construction and module identification
Co-expression networks were constructed using the Weighted Gene Co-expression Network Analysis (WGCNA) package in R. Samples were first hierarchically clustered to detect and remove outliers. The soft-thresholding power (β) was determined using the pickSoftThreshold function to ensure a scale-free topology. A topological overlap matrix (TOM) was calculated to assess gene interconnectedness, and modules were identified via dynamic tree cutting. Module–trait relationships were evaluated by correlating module eigengenes with clinical traits. Genes from key modules were selected for subsequent analyses, and the eigengene network was visualized to explore inter-module relationships.
2.4 Identification of common DEGs
To identify Differentially Expressed Genes (DEGs), we applied the Linear Models for Microarray (LIMMA) package in R (version 4.3.3) to carry out a comparative analysis between the sepsis-only group and the sepsis-induced ALI group. DEGs were identified using a strict threshold of p-values less than 0.05. Additionally, genes from the WGCNA modules that exhibited the strongest negative correlation with sepsis-induced ALI were also selected. By intersecting the two sets of genes, we were able to pinpoint the DEGs that were common to both, thus satisfying the defined selection criteria.
2.5 Enrichment analysis of common DEGs
To further explore the biological functions of the identified shared DEGs, we utilized the Gene Ontology (GO) and Kyoto Encyclopedia of Genes and Genomes (KEGG) pathway enrichment analyses. This was conducted using the “clusterProfiler” package in combination with the “org.Hs.eg.db” database for annotating genes. The species of reference for the analysis was Homo sapiens, and enrichment significance was defined as having an adjusted p-value of less than 0.05.
2.6 Construction of protein-protein interaction network
The STRING database (https://string-db.org/) was used to create the PPI network, applying a confidence score threshold of at least 0.4. Cytoscape v3.7.2, along with the CytoHubba plugin (version 0.1), was used to visualize and analyze the network. Hub genes were determined using the Degree algorithm, and the ten genes with the highest rankings were selected for further examination.
2.7 Feature selection using three established machine learning algorithms
Candidate hub genes were refined using three machine learning algorithms—Least Absolute Shrinkage and Selection Operator (LASSO), Support Vector Machine–Recursive Feature Elimination (SVM-RFE), and Random Forest (RF)—with a fixed random seed of 123 to ensure reproducibility. LASSO regression was performed using the “glmnet” package in R with 10-fold cross-validation to select the optimal lambda value (“lambda.1min”), while SVM-RFE was conducted with the “e1071” and “MSVM-RFE” packages to identify the subset with the highest classification accuracy. RF analysis was implemented via the “randomForest” package with 500 trees, ranking genes by importance and applying a significance threshold of 0.9. The final hub genes were obtained by intersecting the results from all three algorithms.
2.8 Clinical sample collection
This study was conducted in accordance with the Declaration of Helsinki and approved by the Ethics Committee of Wenzhou Hospital of Integrated Traditional Chinese and Western Medicine (No. 2024-L076) and the Ethics Committee of Taizhou Municipal Hospital, School of Medicine, Taizhou University (LWYJ2025276). Peripheral blood samples were collected from three patients meeting the diagnostic criteria for SA-ALI and one healthy volunteer confirmed by the hospital’s health examination center as a control. Inclusion criteria were age ≥18 years, provision of informed consent, and, for the study group, fulfillment of ALI diagnostic criteria; exclusion criteria included age <18 years, incomplete clinical data, death during hospitalization or transfer, presence of organic heart disease (e.g., ischemic cardiomyopathy, congenital heart disease, myocarditis), end-stage malignancy, psychiatric disorders or cognitive impairment, or refusal to participate. All samples were centrifuged at 2,000 rpm for 10 min at 4 °C, and the resulting supernatants were immediately stored at −80 °C for subsequent analysis.
2.9 Validation of hub gene expression by western blot
To validate the expression levels of hub genes in sepsis-associated acute SA-ALI, WB analysis was performed on serum samples to detect the corresponding protein levels. Total protein was extracted using RIPA lysis buffer containing PMSF (G2008, Servicebio, China) and quantified with a BCA protein assay kit (G3522, Guangzhou Jiebai Biotechnology Co., Ltd., China). Equal amounts of protein were separated by SDS-PAGE and transferred to PVDF membranes, which were then incubated overnight at 4°C with the following primary antibodies (all from Abcam, UK): Glucose-fructose oxidoreductase domain-containing protein 2 (GFOD2) and E2F transcription factor 2 (E2F2) (1:500), Phosphoglucomutase 3 (PGM3) and Trifunctional purine biosynthetic protein adenosine-3 (GART) (1:2000), ATPase subunit beta-2 (ATP1B2) (1:1000), Growth/differentiation factor 15 (GDF15) (1:10000), and Transferrin (1:2000, as loading control). Secondary antibodies were diluted at 1:2000 and incubated at room temperature for 1 h. Immunoreactive bands were visualized using an ECL chemiluminescence detection kit (SB-WB011, Share-Bio, China), and band intensities were quantified using ImageJ software (NIH, USA) to evaluate relative protein expression levels.
2.10 Gene set variation analysis
GSVA is a nonparametric and unsupervised algorithm that computes a composite score for gene sets to assess transcriptomic enrichment. This method evaluates functional pathway changes at the gene set level across different samples. The GSVA_1.30.0 package in R was used to calculate t-scores and determine pathway activity states.
2.11 Analysis of immune cell abundance
CIBERSORT, based on support vector regression, was used to deconvolute transcriptomic data and estimate the relative abundance of 22 immune cell subtypes defined by the LM22 signature matrix (547 genes). This included various T cells, B cells, plasma cells, and myeloid cells. The algorithm was applied to patient samples to quantify immune infiltration, and correlation analyses were conducted to assess associations between hub gene expression and immune cell composition, thereby exploring potential regulatory roles in the immune microenvironment.
2.12 Molecular docking analysis for potential therapeutic drug prediction
Molecular docking was performed to predict potential therapeutic agents targeting the identified hub genes. Candidate compounds were obtained from the DSigDB database via the Enrichr platform (https://maayanlab.cloud/Enrichr/). Three-dimensional structures of target proteins were downloaded from UniProt (https://www.uniprot.org/), and chemical structures of small molecules from PubChem (https://pubchem.ncbi.nlm.nih.gov/).
Docking simulations were carried out using AutoDock (https://ccsb.scripps.edu/mgltools/downloads/) to calculate binding affinities. Each compound was docked 50 times independently, and the top 20 poses from each run were collected. Binding energies were analyzed by calculating the mean, median, standard deviation, interquartile range (IQR), minimum, and maximum to evaluate distribution and reproducibility.Visualization and interaction analysis were performed with PyMOL (https://pymol.org/) and Discovery Studio (BIOVIA, Dassault Systèmes) to identify key ligand–residue interactions, including hydrogen bonds, hydrophobic contacts, and π–π stacking, thereby supporting the reliability of the docking results.
2.13 Cell culture and treatments
The human alveolar epithelial cell line A549 (Procell Life Science & Technology Co., Ltd.) was cultured in RPMI-1640 medium supplemented with 10% fetal bovine serum and 1% penicillin–streptomycin. Cells were maintained in a humidified incubator at 37 °C with 5% CO2, and the medium was replaced every 2–3 days. When the cells reached the logarithmic growth phase with good viability, they were subjected to subsequent treatments. The cells were divided into four groups: Control, LPS (1 µg/mL for 12 h), LPS+Celastrol (1 µg/mL LPS for 12 h followed by 100 nM Celastrol for 24 h), and LPS+Thiostrepton (1 µg/mL LPS for 12 h followed by 2 µM Thiostrepton for 24 h).
2.14 Cell plate clone formation assay
A total of 800 cells per well were seeded into 6-well plates and cultured for 2 weeks at 37°C in a humidified atmosphere containing 5% CO2. At the endpoint, the cells were fixed with 4% paraformaldehyde for 20 min and subsequently stained with 0.05% crystal violet (Sigma, USA) for 30 min. The results were evaluated by counting the number of stained viable cells and by measuring the absorbance of the eluted dye at 570 nm.
2.15 Cell apoptosis assay
Cell apoptosis was assessed using Annexin V-FITC/PI double staining followed by flow cytometry. Briefly, cells were harvested into centrifuge tubes and washed twice with pre-cooled PBS. The procedure was performed according to the manufacturer’s instructions of the Annexin V-FITC/PI apoptosis detection kit, and apoptotic cells were then analyzed using a flow cytometer.
2.16 Statistical analysis
All experiments were performed in triplicate, and data are expressed as the mean ± SEM. Statistical analyses were conducted using GraphPad Prism 10.2.0 (GraphPad Software, Inc.). Comparisons among multiple groups were performed by one-way ANOVA followed by Tukey’s post hoc test. A value of p < 0.05 was considered statistically significant.
3 Results
3.1 DEG screening and WGCNA module analysis
Integrated analysis of the GSE10474 and GSE32707 datasets from the GEO database was performed. PCA revealed pronounced batch effects, which were corrected using the sva package, markedly improving data consistency and reducing inter-sample variability (Figure 2A). Differential expression analysis with the limma package, applying thresholds of |log2FC| > 0.25 and p < 0.05, identified 376 DEGs, including 166 upregulated and 98 downregulated genes (Figure 2B).
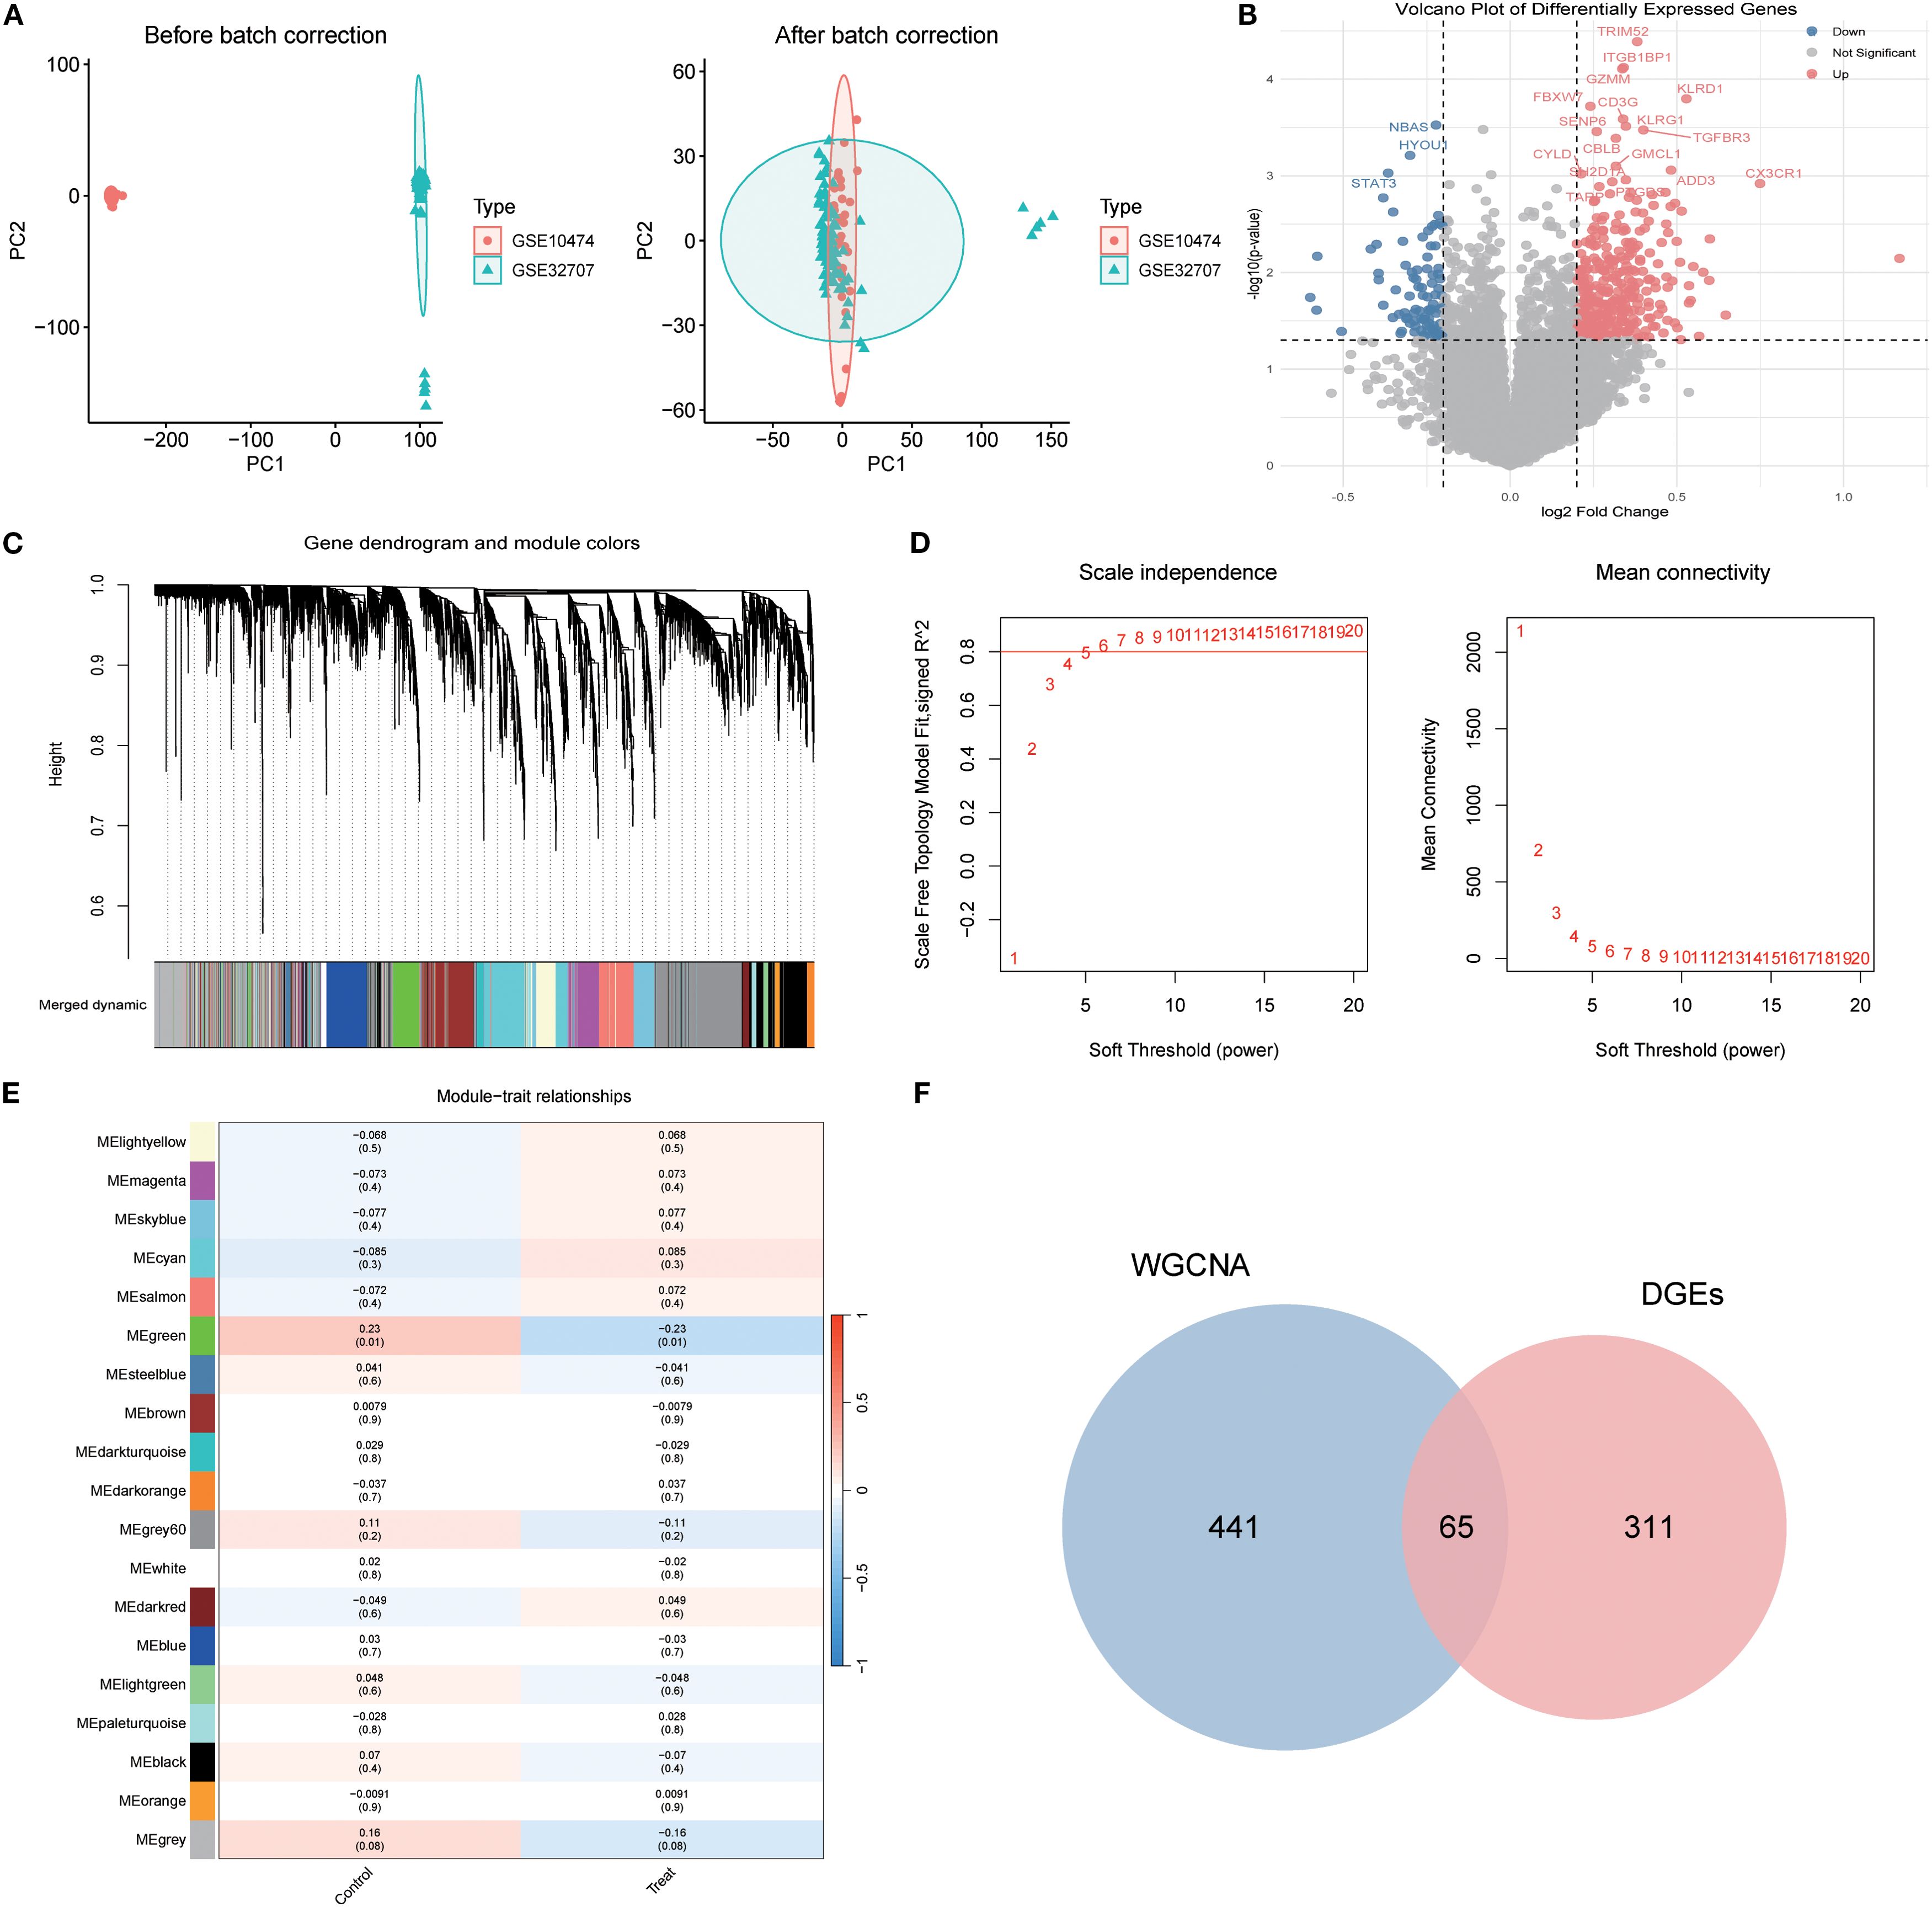
Figure 2. Identification of Differentially Expressed Genes in Sepsis-Associated Acute Lung Injury (SA-ALI). (A) PCA of GSE10474 and GSE32707 before (left) and after (right) batch correction; (B) Volcano plot of DEGs between SA-ALI and controls (red: upregulated, blue: downregulated, grey: non-significant); (C) WGCNA gene clustering dendrogram with module colors; (D) Scale-free topology and mean connectivity plots; soft-threshold power = 4 was selected; (E) Heatmap of module–trait correlations (Sepsis vs. SA-ALI); (F) Venn diagram showing 65 overlapping genes between WGCNA modules and DEGs.
WGCNA was then employed to delineate disease-associated gene networks. Sample clustering and the selection of a soft-threshold power of 6 ensured a scale-free topology (Figures 2C, D). Multiple color-coded co-expression modules were identified, with the blue module showing a significant positive correlation with disease status (p < 0.01; Figure 2E). Intersection of genes from this module with the DEGs yielded 65 overlapping genes, which were designated as core candidates for subsequent functional enrichment and drug–target prediction analyses (Figure 2F).
3.2 GO and KEGG enrichment analyses of core genes
GO enrichment analysis identified key biological processes relevant to SA-ALI, including negative regulation of protein complex assembly, cell–cell electrical coupling, heme transport, and porphyrin-containing compound metabolism, suggesting potential involvement in oxygen metabolism, intercellular signaling, and cardiopulmonary coupling. CC terms such as presynaptic membrane, cytoplasmic microtubule, and ATPase-dependent transmembrane transport complex indicated possible roles in maintaining pulmonary barrier integrity and facilitating intracellular transport. For MF, enrichment in heme binding and structural molecule activity suggested contributions to oxygen delivery and cytoskeletal stability (Figure 3A).
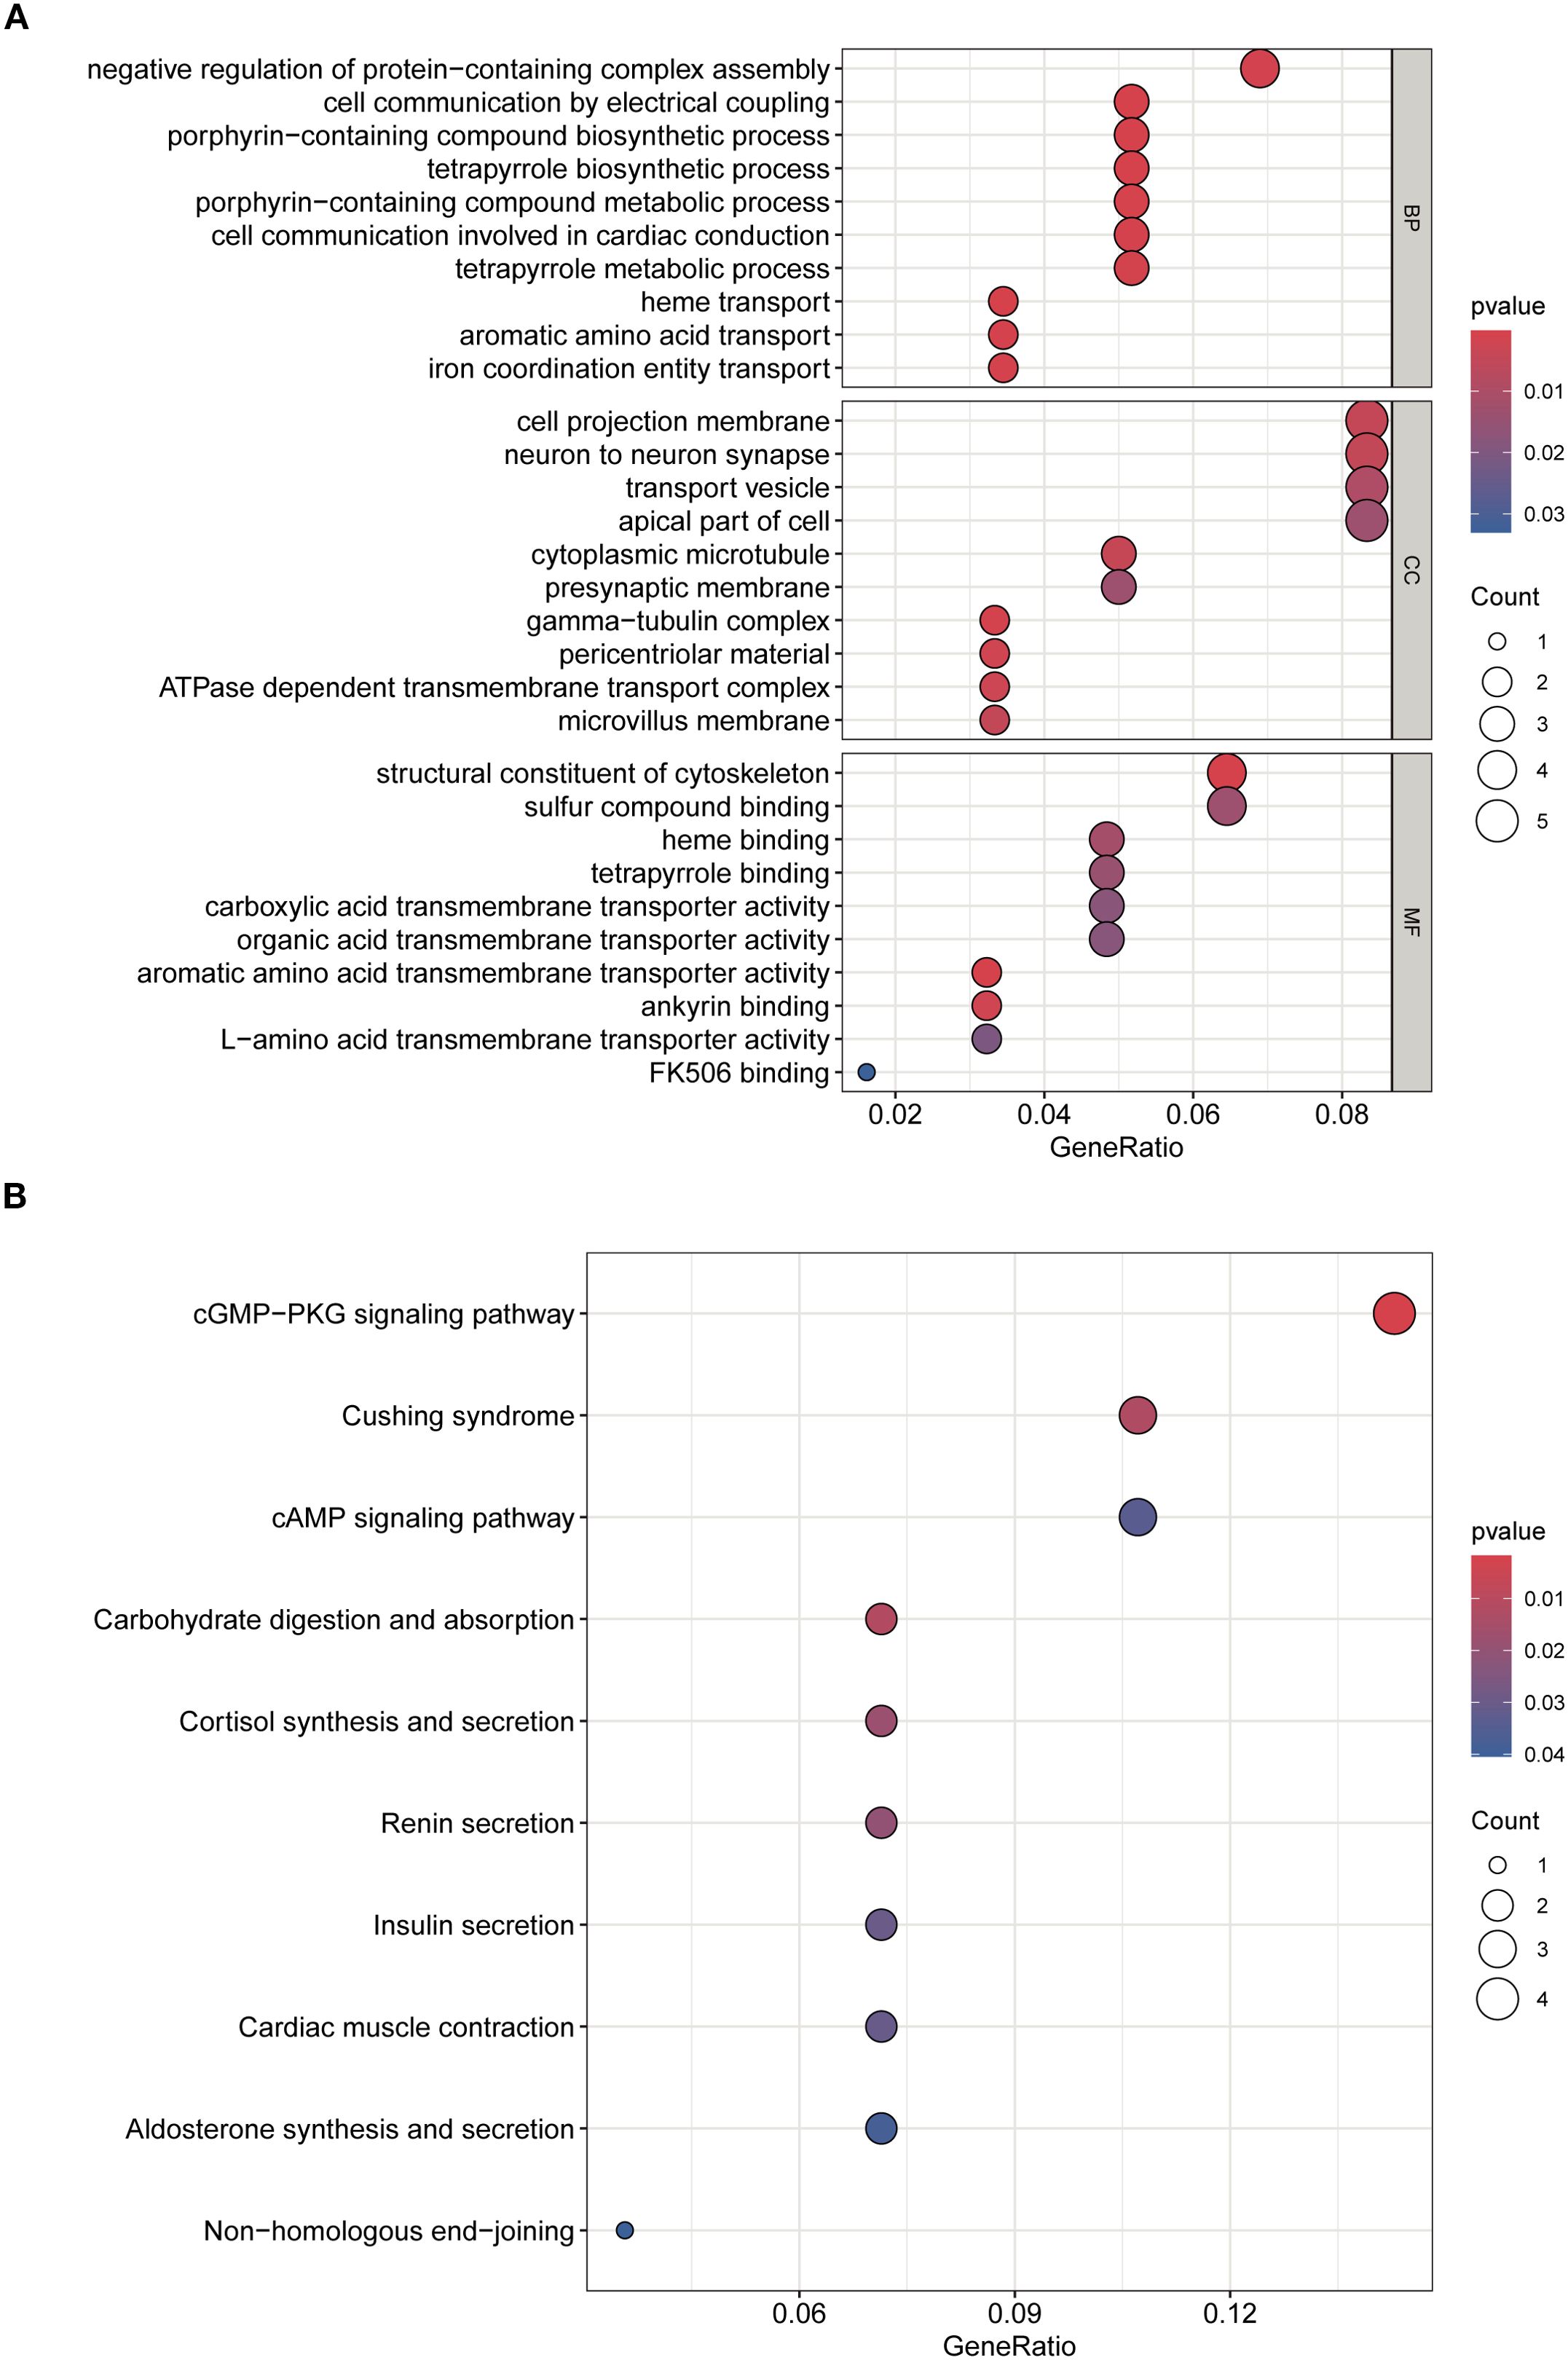
Figure 3. GO and KEGG enrichment analyses of overlapping genes. (A) GO analysis of biological processes (BP), cellular components (CC), and molecular functions (MF). (B) KEGG pathway enrichment analysis. Dot size indicates gene count, color represents adjusted p-value.
KEGG analysis further revealed enrichment in cGMP–PKG and cAMP signaling pathways, cortisol synthesis and secretion, and cardiac muscle contraction, highlighting their potential involvement in vascular tone regulation, stress hormone response, and cardiopulmonary function during SA-ALI. Collectively, these results suggest that the core genes may promote SA-ALI progression by modulating oxygen metabolism, inflammatory signaling, vascular permeability, and cytoskeletal remodeling (Figure 3B).
3.3 Identification of hub genes and machine learning-based diagnostic biomarkers
A PPI network of SA-ALI–related genes was constructed using the STRING database (minimum interaction score 0.4) and visualized in Cytoscape with CytoHubba, whereby the top 10 hub genes were identified using the Degree algorithm (Figures 4A, B). To further screen potential diagnostic markers, three machine learning approaches-LASSO regression, RF, and SVM-RFE-were employed. LASSO regression identified seven genes at the optimal λ of 0.0685, RF ranked the top 10 genes by feature importance, and SVM-RFE selected eight genes with the highest classification accuracy under five-fold cross-validation (Figures 4C–E). The intersection of the three methods yielded six candidate biomarkers-PGM3, GDF15, GART, GFOD2, E2F2, and ATP1B2-which may serve as potential diagnostic and therapeutic targets for SA-ALI (Figure 4F).
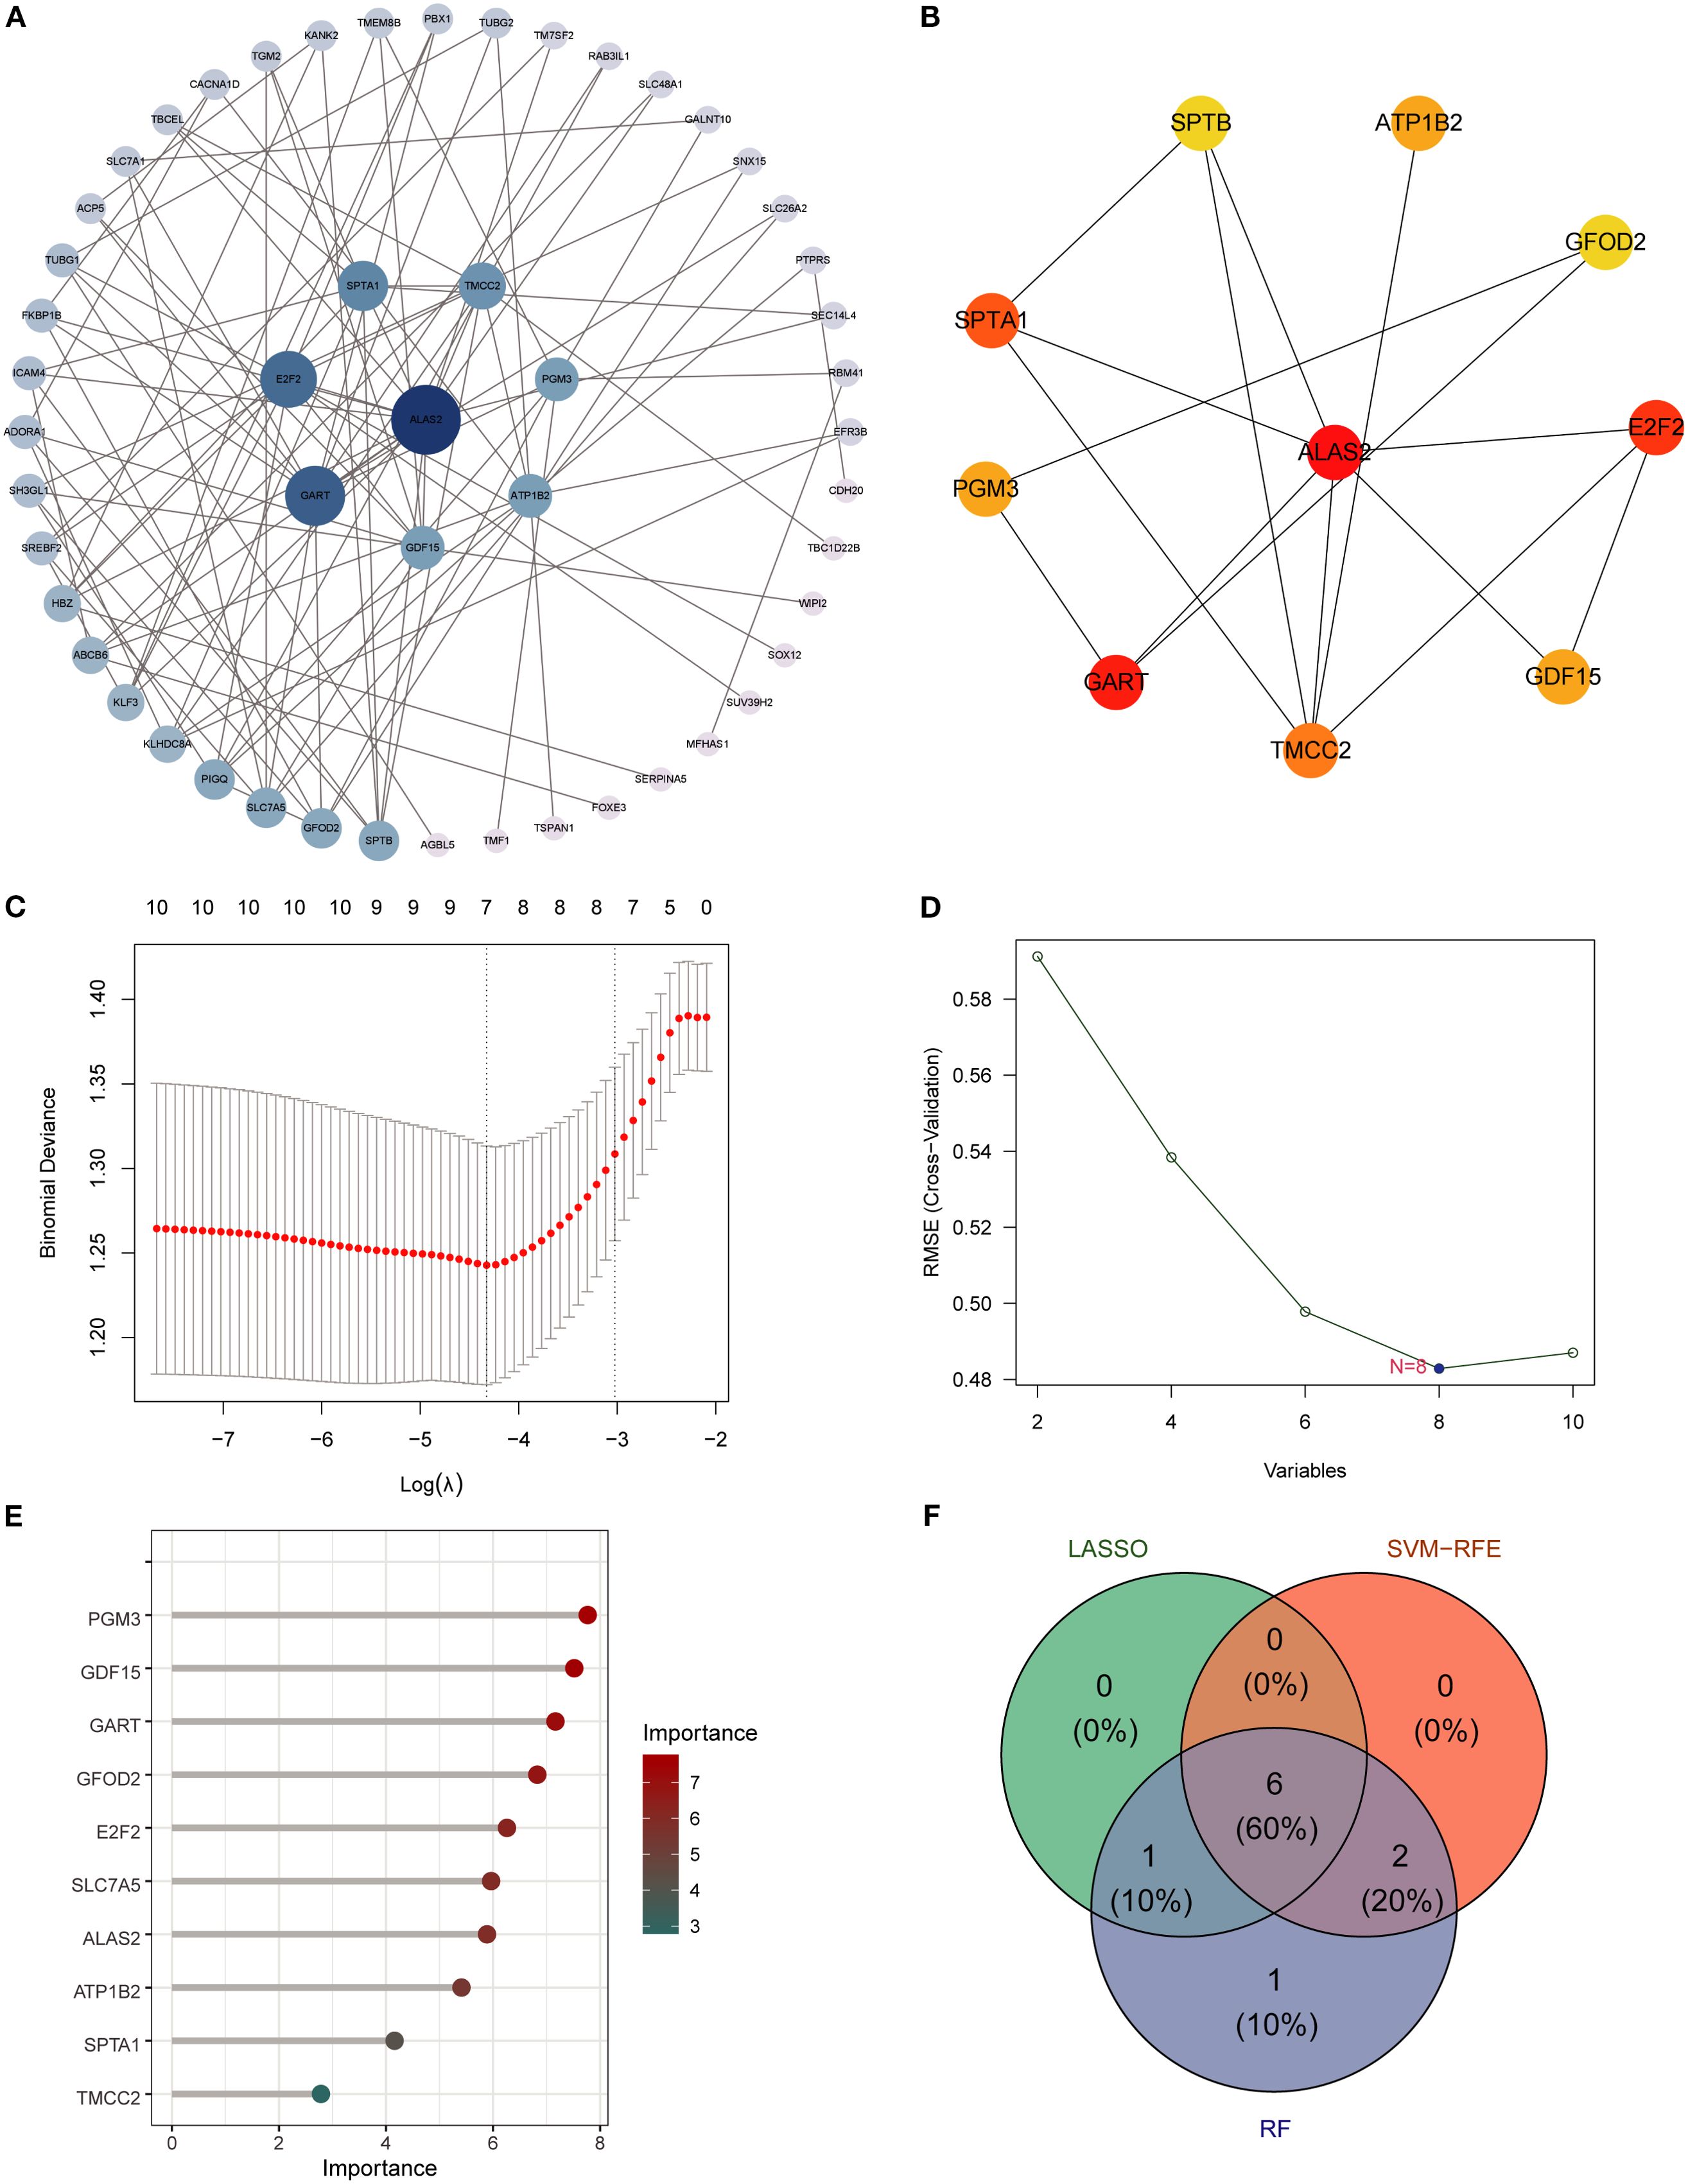
Figure 4. Identification of hub genes using PPI network and machine learning. (A) PPI network of overlapping genes, with node size indicating connectivity. (B) Top hub genes ranked by cytoHubba MCC algorithm. (C) LASSO regression for feature selection. (D) SVM-RFE analysis showing minimal RMSE at 8 variables. (E) Random Forest ranking of gene importance. (F) Venn diagram showing six overlapping hub genes identified by all three algorithms (RF, SVM, LASSO).
3.4 Validation of candidate diagnostic genes by western blot
WB analysis was conducted to validate the expression of the six candidate diagnostic genes in clinical serum samples from SA-ALI patients. All six proteins-GDF15, GART, PGM3, GFOD2, ATP1B2, and E2F2-exhibited markedly higher expression levels in SA-ALI patients compared with healthy controls, with Transferrin serving as the loading control (Figures 5A, B). Densitometric quantification confirmed significantly elevated expression of each protein in the SA-ALI group (p < 0.05) (Figures 5C–H), supporting their potential roles as diagnostic biomarkers in SA-ALI.
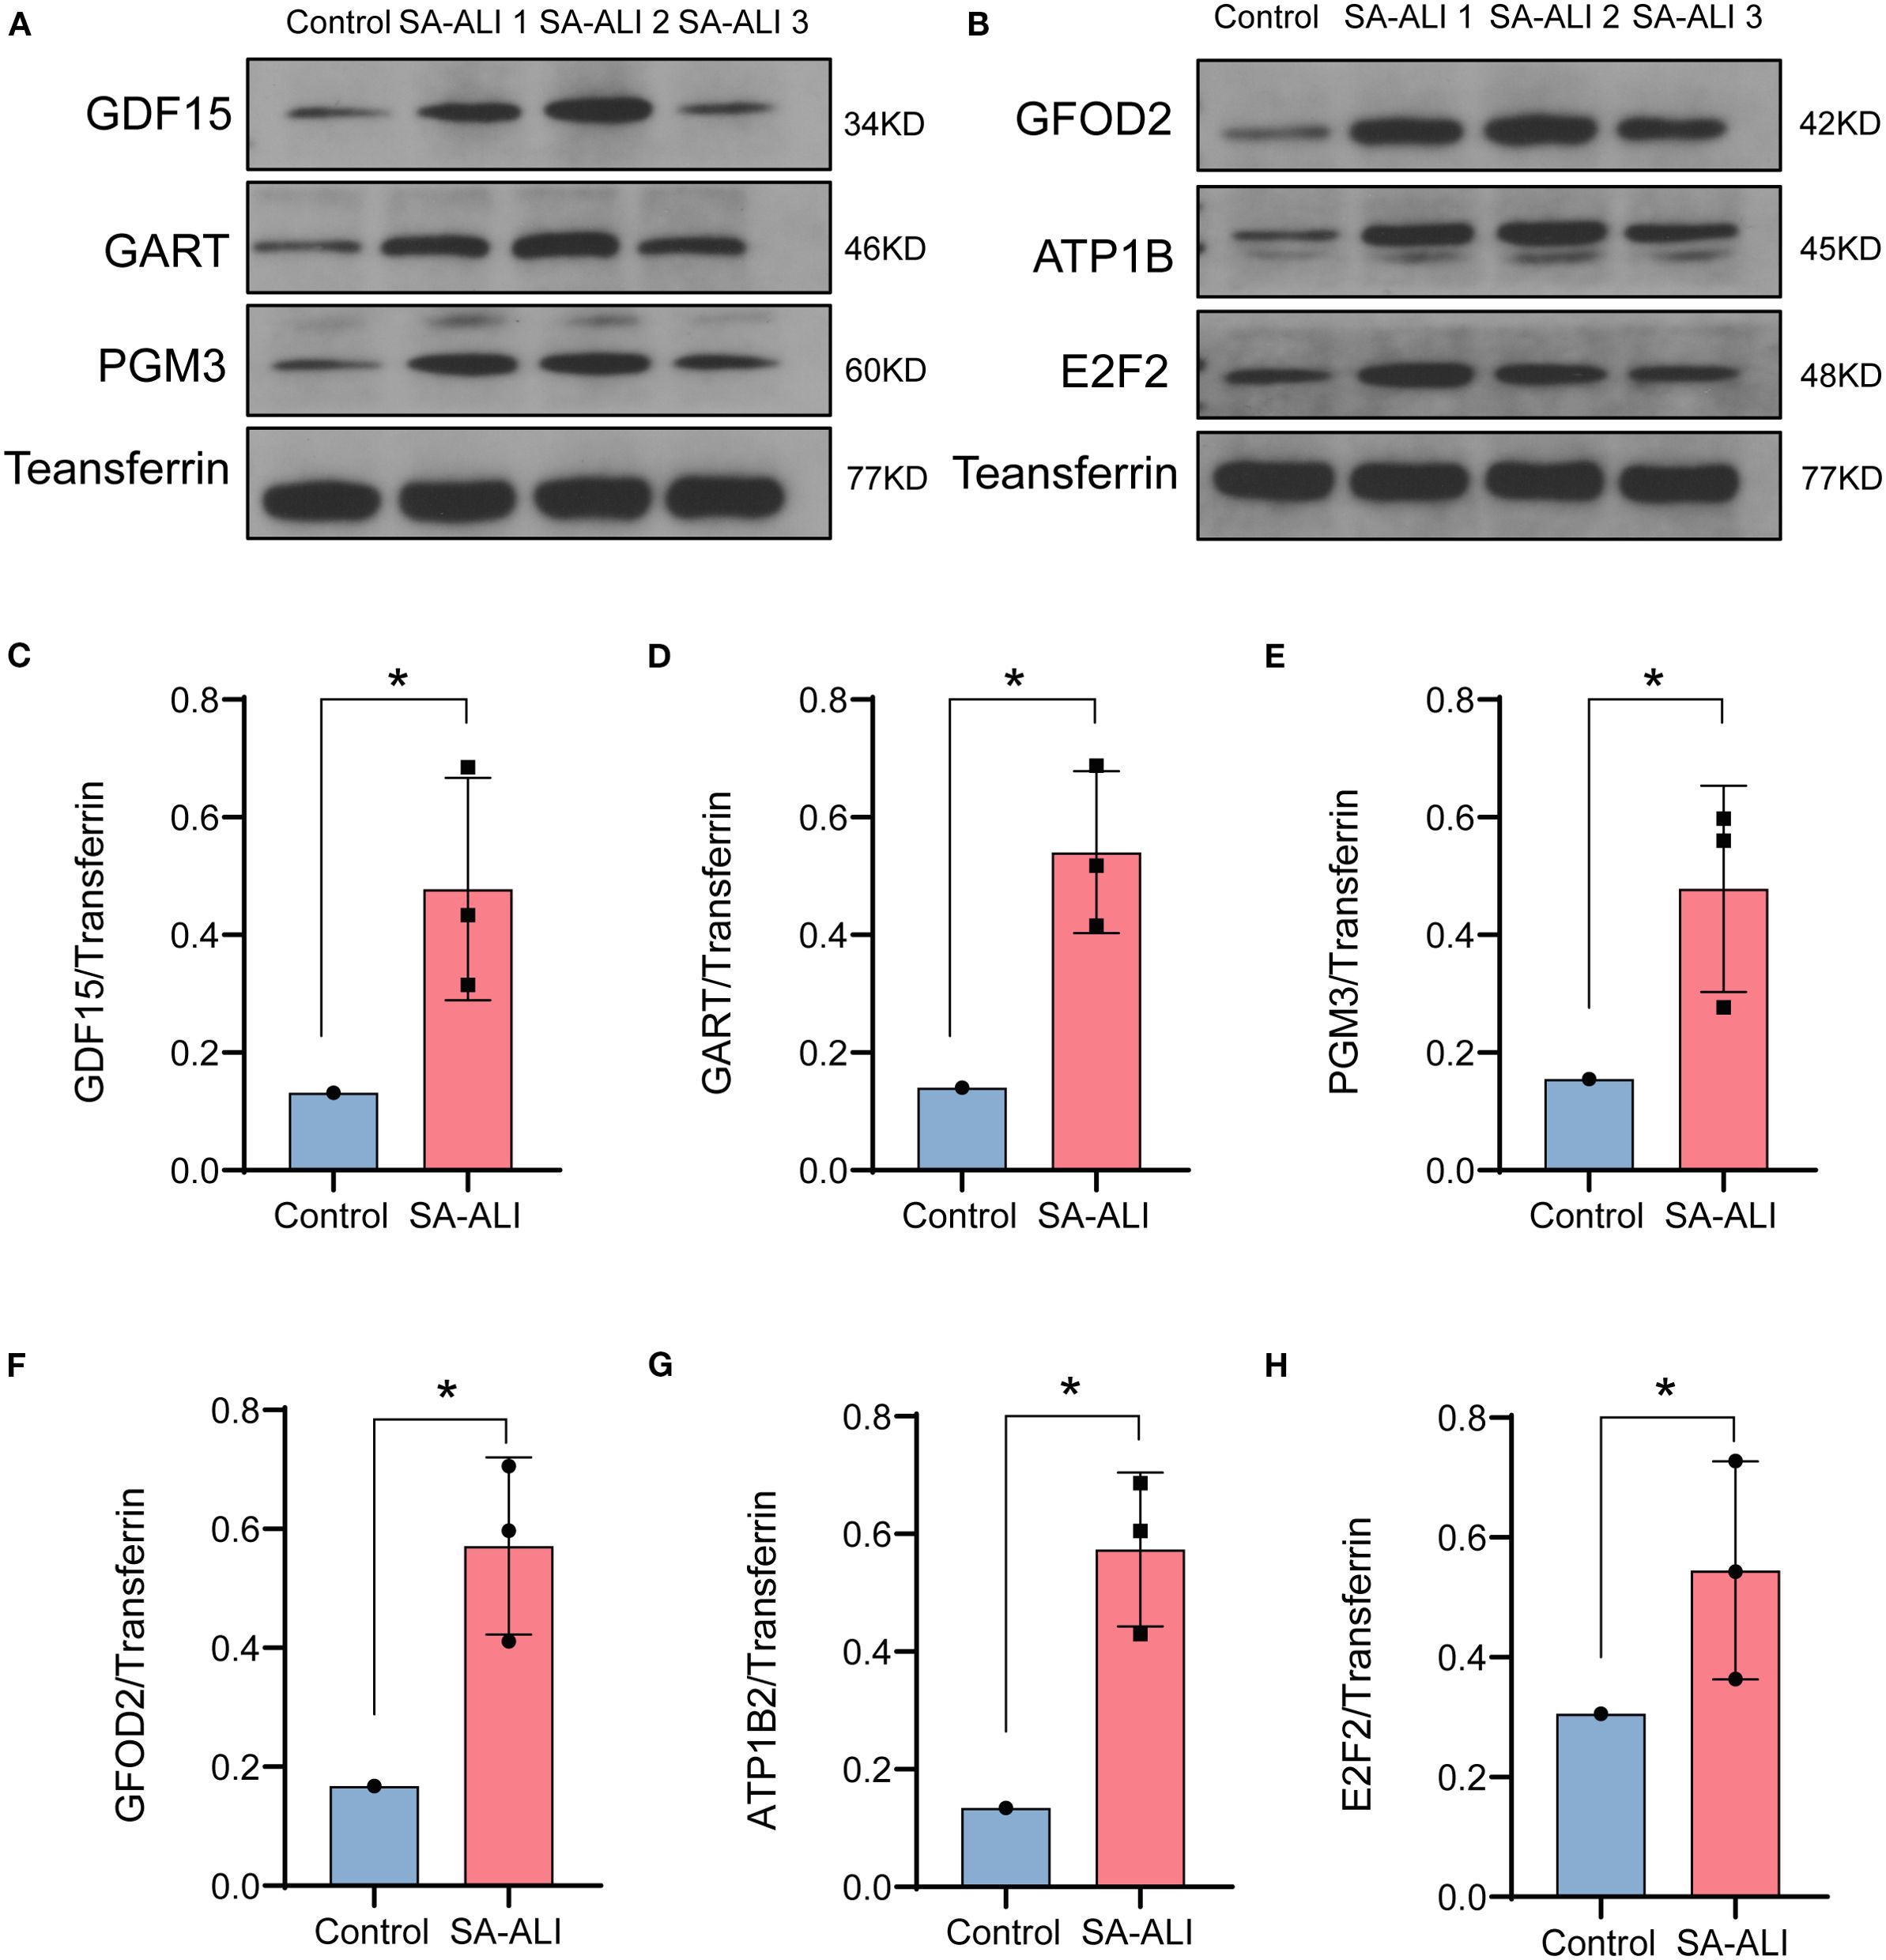
Figure 5. Validation of hub gene expression in SA-ALI by Western blot. (A, B) Representative Western blots showing GDF15, GART, PGM3, GFOD2, ATP1B2, and E2F2 protein levels in control and SA-ALI patient serum, with transferrin as the loading control. (C–H) Quantification of protein expression normalized to transferrin, indicating significant upregulation of all six hub genes in SA-ALI compared with controls (*p < 0.05).
3.5 GSVA reveals pathways associated with key diagnostic genes
To investigate potential functional pathways of the six candidate biomarkers, single-gene pathway enrichment was performed using GSVA (Figures 6A–F). ATP1B2 high expression was associated with intestinal immune network for IgA production, peroxisome, and cytochrome P450 drug metabolism. E2F2 was enriched in complement and coagulation cascades, Toll-like receptor signaling, and arginine-proline metabolism. GART correlated with cytoskeletal remodeling, neuroactive ligand–receptor interaction, and ECM-receptor interaction. GDF15 was linked to cytokine–receptor interaction, tight junction, and JAK-STAT signaling. GFOD2 was enriched in nucleotide excision repair, mismatch repair, and cysteine metabolism, whereas PGM3 was associated with glutathione metabolism, ECM–receptor interaction, and the renin–angiotensin system. These results suggest that the six genes participate in diverse inflammation-, immunity-, metabolism-, and repair-related pathways in SA-ALI.
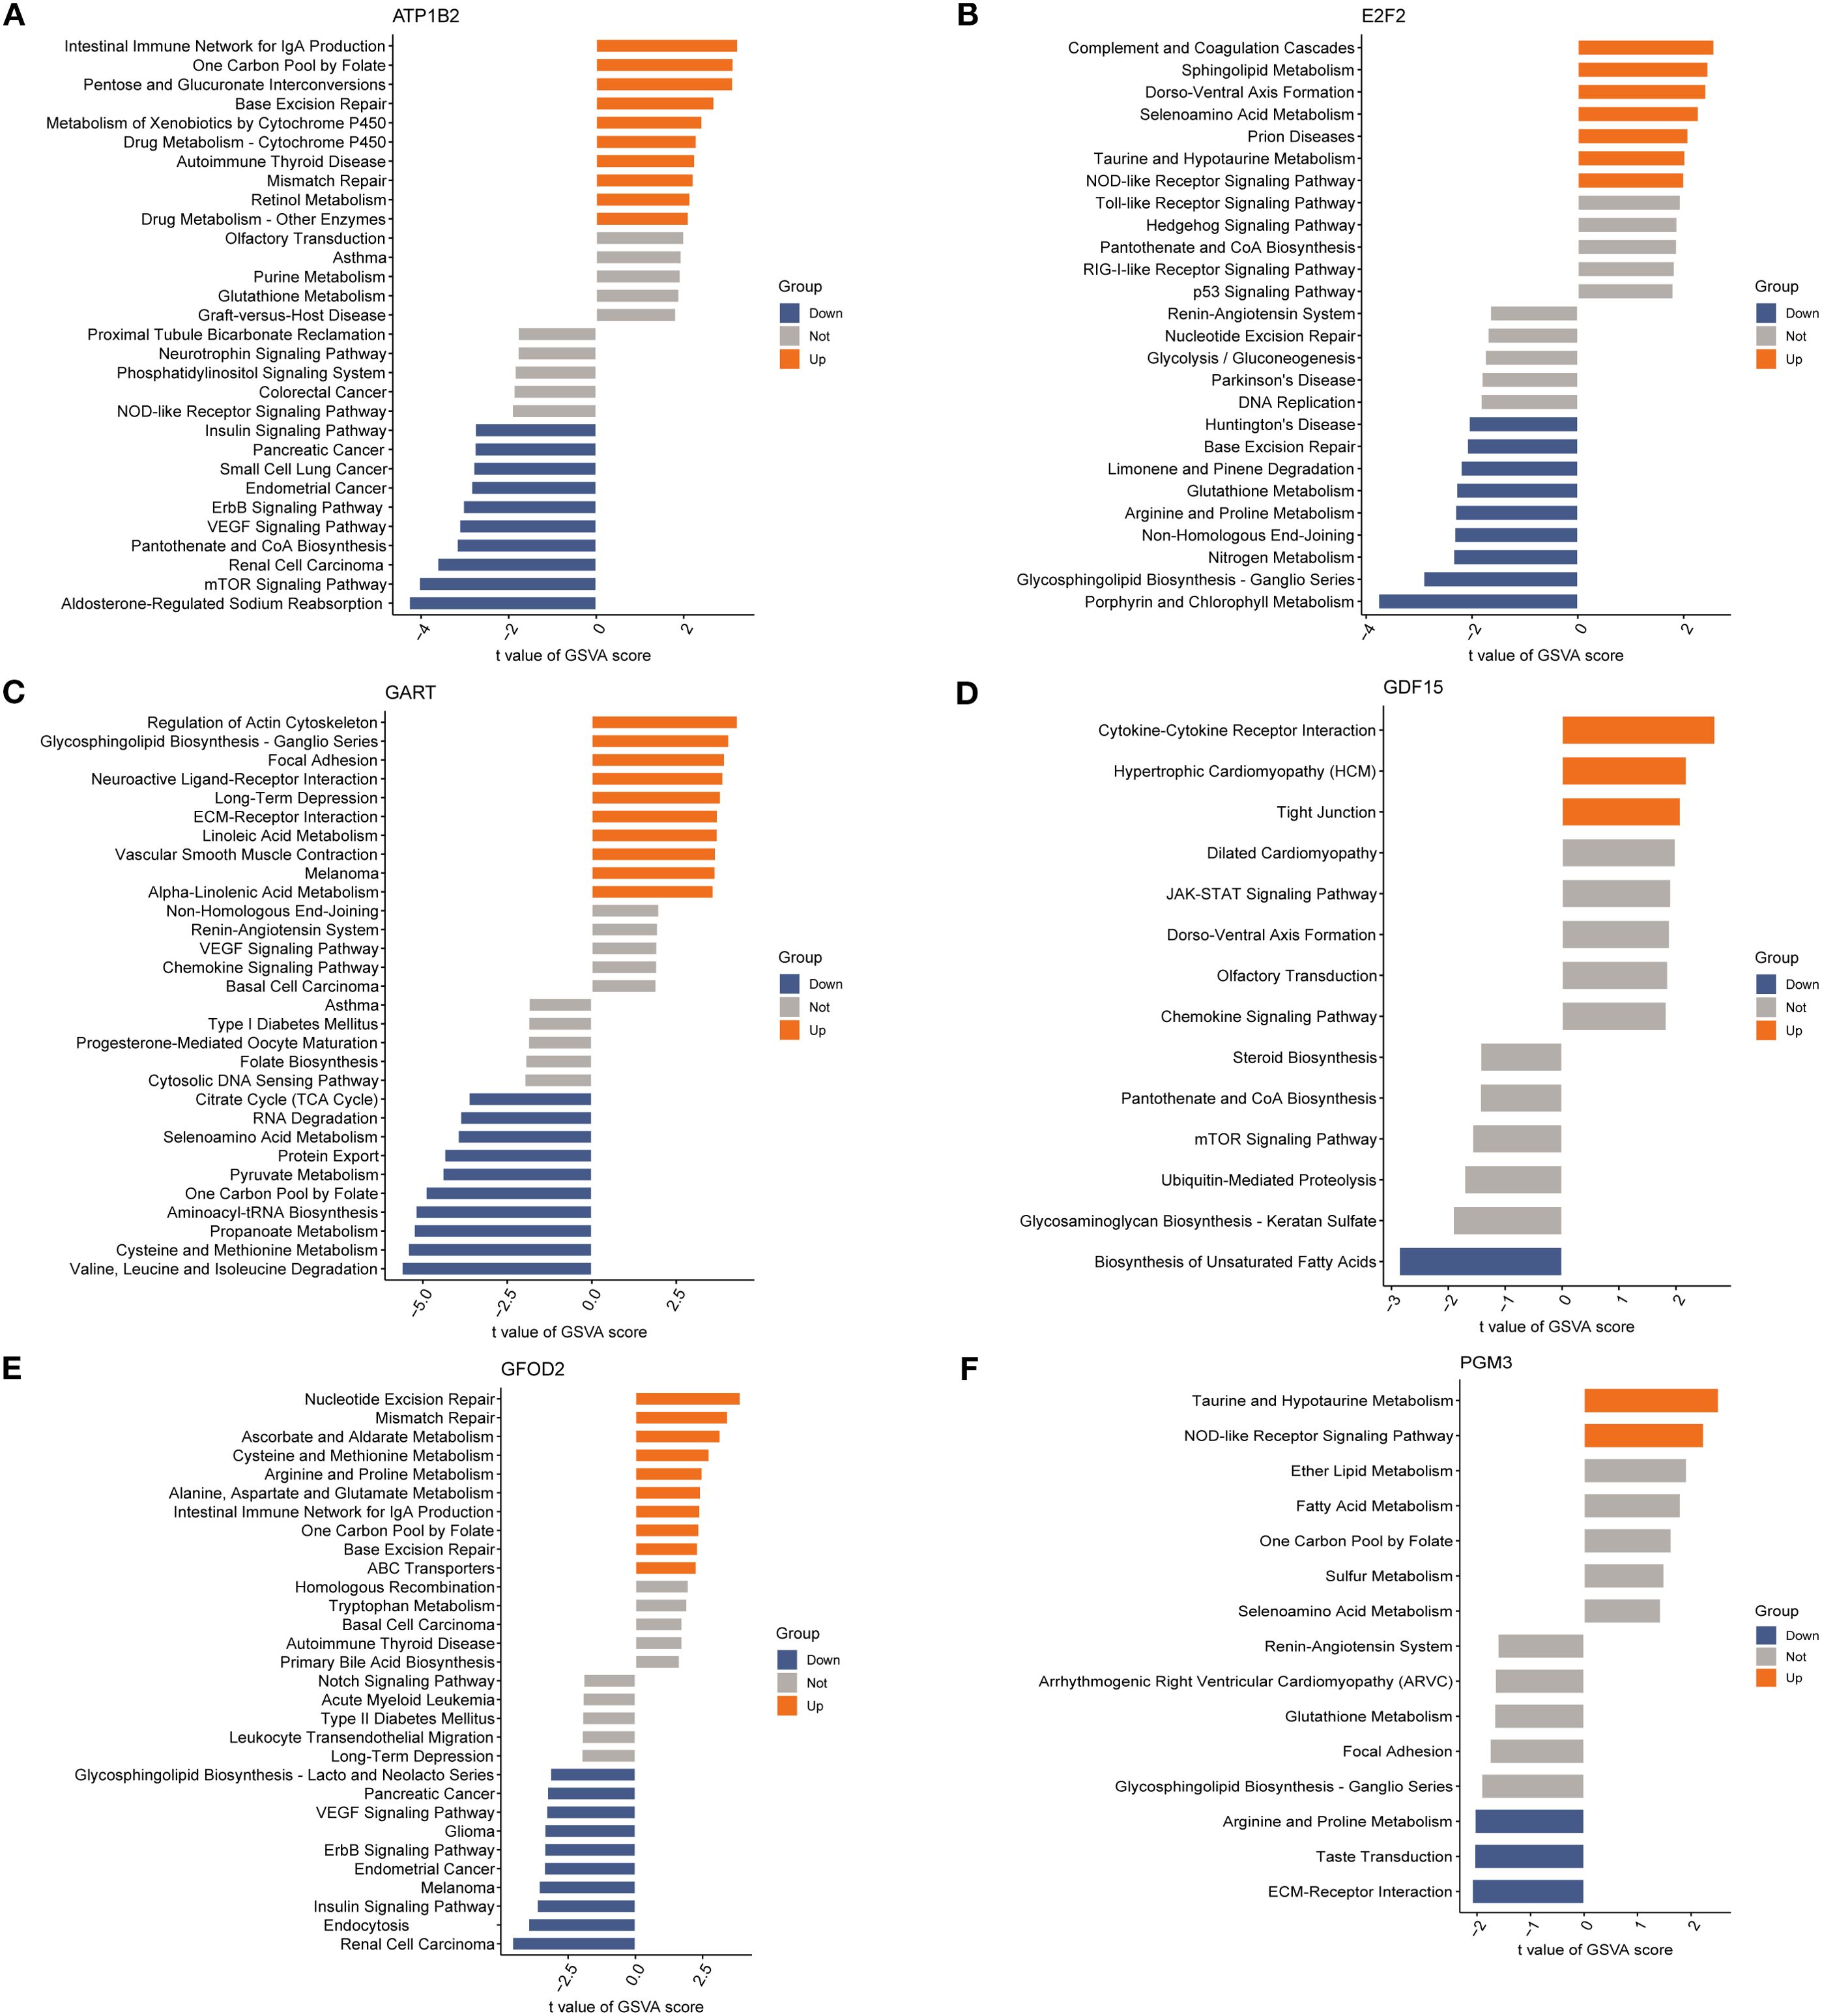
Figure 6. Gene set variation analysis (GSVA) of diagnosis genes: (A) GSVA bar chart of ATP1B2; (B) GSVA bar chart of E2F2; (C) GSVA bar chart of GART; (D) GSVA bar chart of GDF15; (E) GSVA bar chart of GFOD2; (F) GSVA bar chart of PGM3.
3.6 Immune cell infiltration and association with key genes
To explore the immune landscape associated with SA-ALI, we performed immune cell infiltration analysis using the CIBERSORT algorithm. The stacked bar plot revealed substantial heterogeneity in the relative abundance of 22 immune cell types between the control and SA-ALI groups (Figure 7A). Violin plot comparison indicated that naive CD4+ T cells were significantly reduced in SA-ALI samples compared with controls (p = 0.033), while the proportions of other immune cell types showed no significant differences (Figure 7B). Correlation analysis (Figure 7C) showed GDF15 positively associated with naïve CD4+ T cells and naïve B cells, while other hub genes displayed distinct links to macrophage subsets, NK cells, and dendritic cells. These findings suggest that hub genes, particularly GDF15, may contribute to SA-ALI progression through immune regulation centered on naive CD4+ T cell–mediated responses.
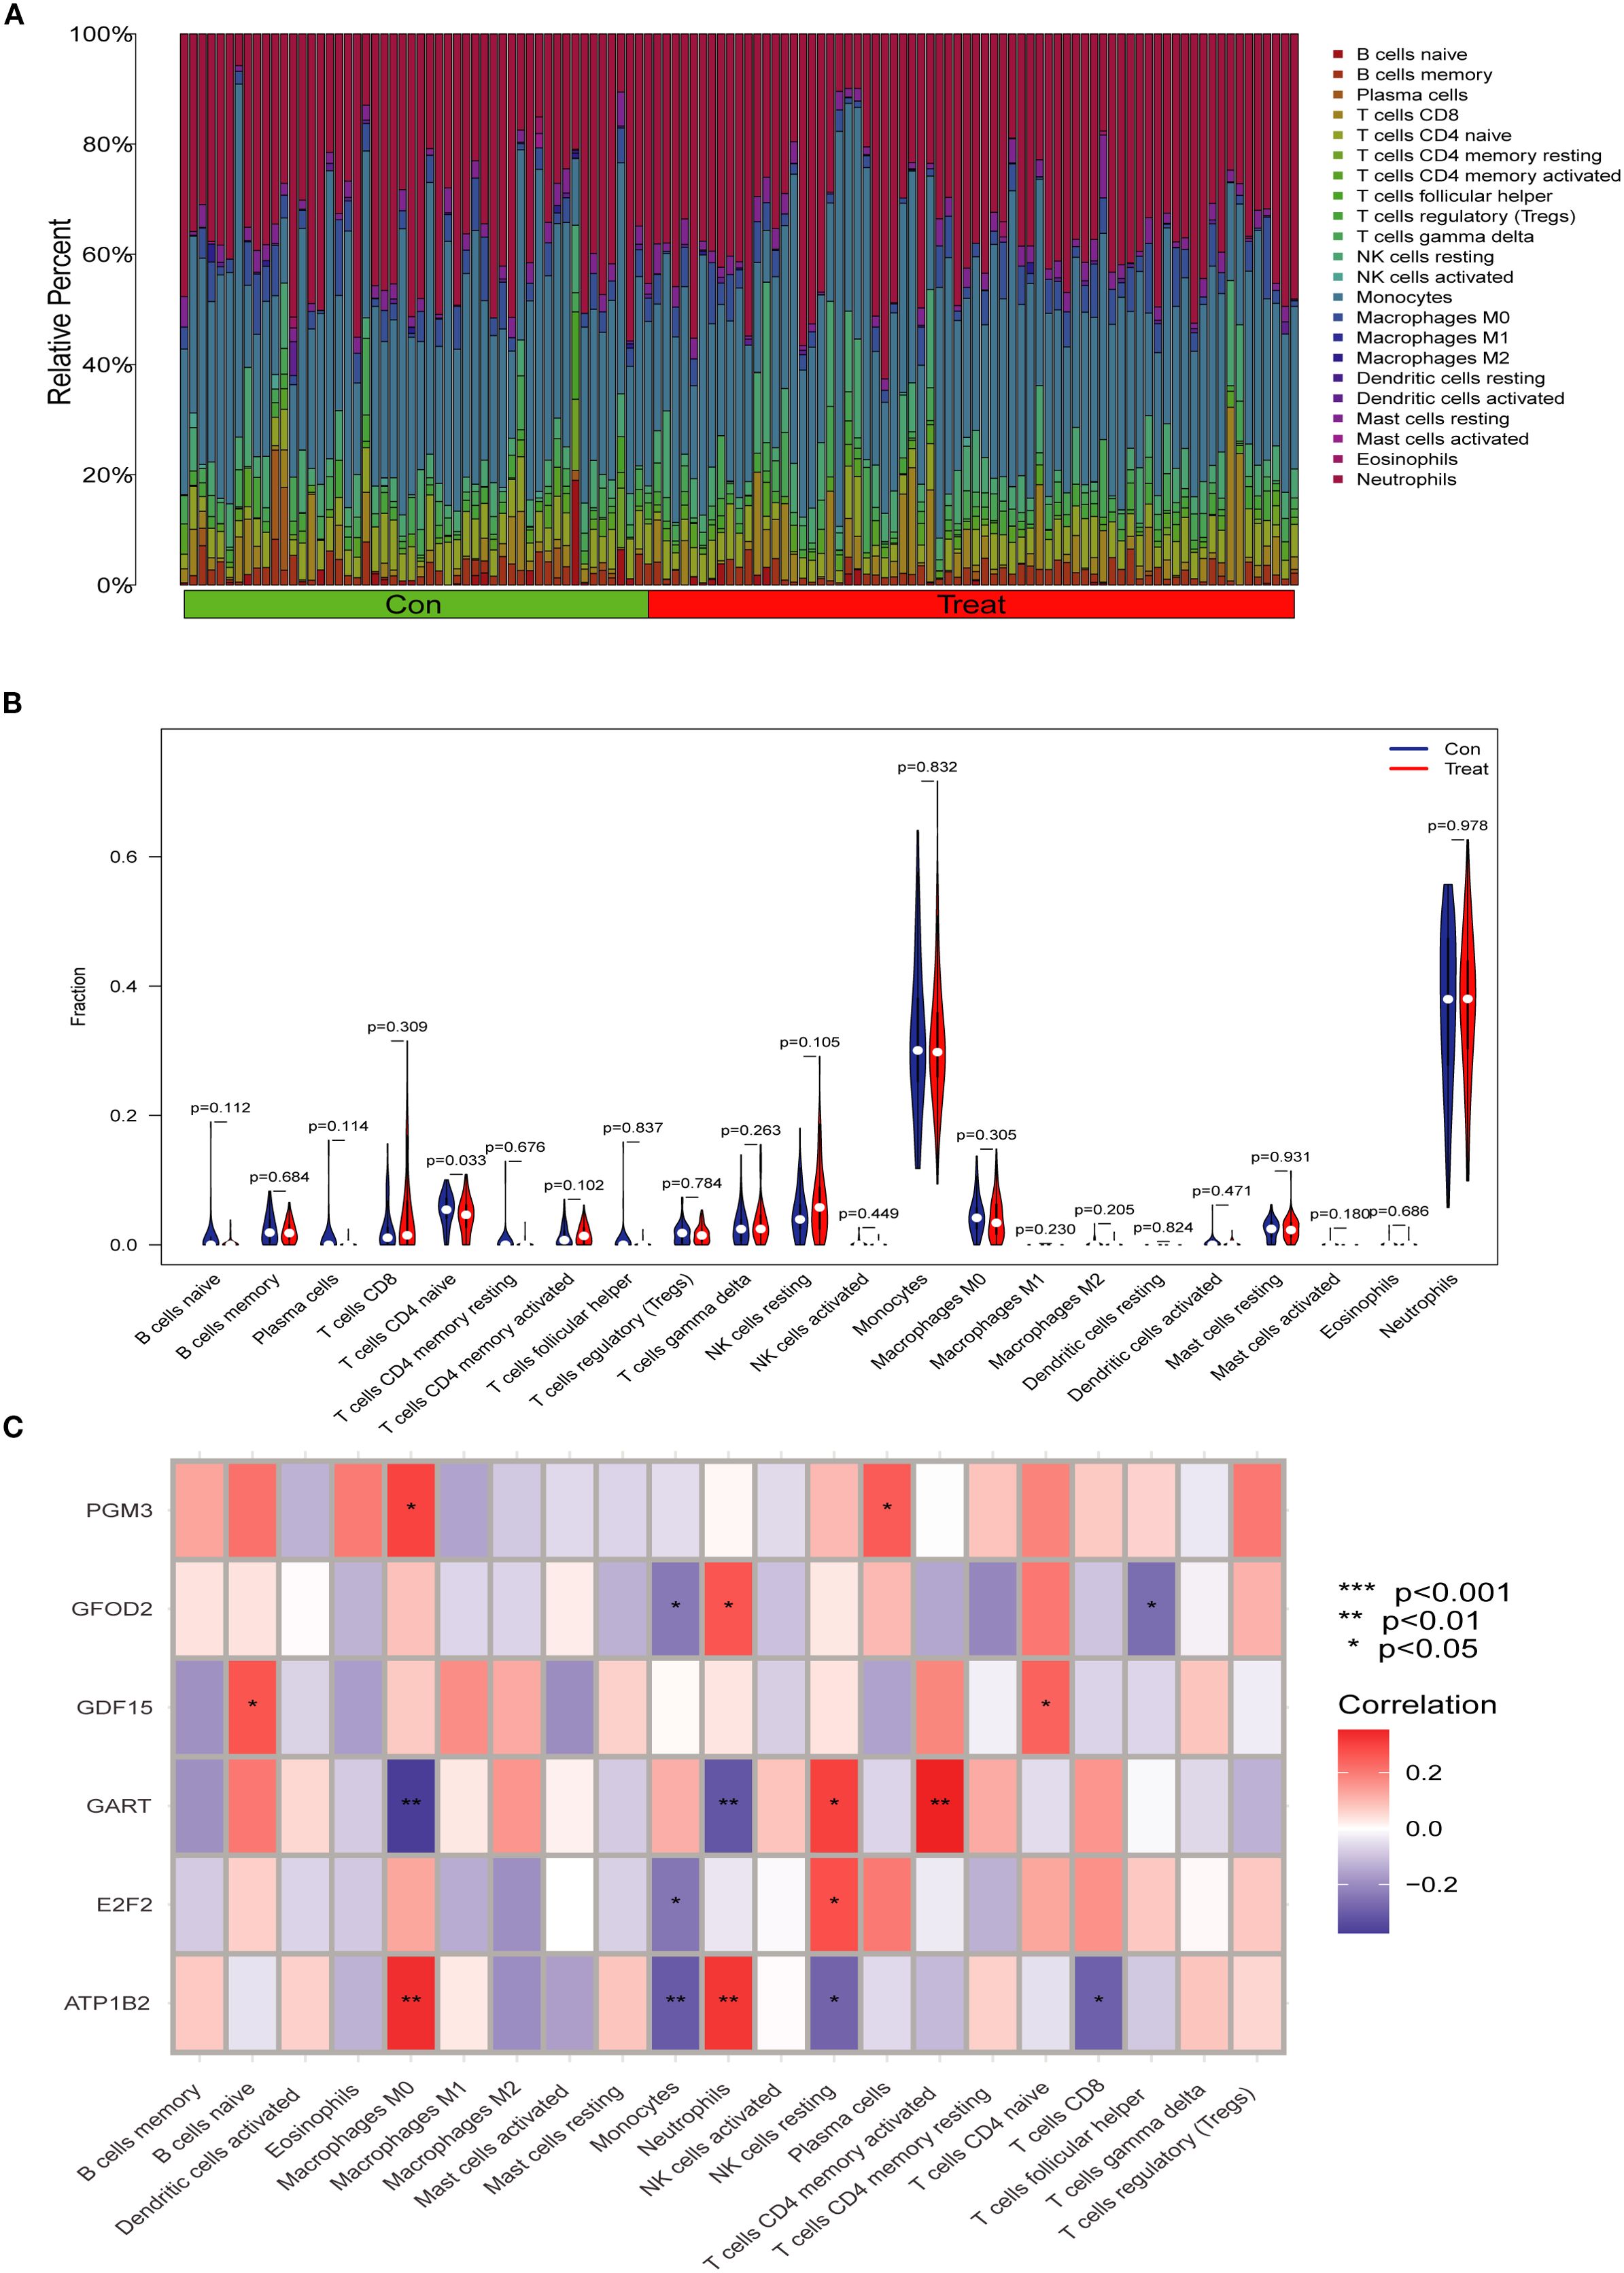
Figure 7. Immune cell infiltration analysis in SA-ALI. (A) Stacked bar plot showing the relative proportions of 22 immune cell types in control (Con) and SA-ALI (Treat) samples as estimated by CIBERSORT. (B) Violin plots comparing immune cell fractions between groups; significant differences were observed in naïve CD4+ T cells (p=0.033). (C) Heatmap showing Spearman correlations between hub gene expression and immune cell infiltration levels. Red indicates positive correlation, blue indicates negative correlation; significance levels are marked (*p < 0.05, **p < 0.01, ***p < 0.001).
3.7 Molecular docking analysis of candidate compounds
Based on DSigDB database screening and literature evaluation, five candidate compounds—thiostrepton, thapsigargin, piperlongumine, parthenolide, and celastrol—were selected for docking with the six core proteins (PGM3, GFOD2, GDF15, GART, E2F2, and ATP1B2) (Figure 8A). Binding affinities ranged from -5.0 to -10.0 kcal/mol, with values below -9.0 kcal/mol indicating strong binding (Figures 8B–F). Celastrol exhibited high affinity with PGM3 (-9.086 kcal/mol), GDF15 (-9.988 kcal/mol), GFOD2 (-9.185 kcal/mol), and E2F2 (-9.796 kcal/mol), as well as favorable interactions with GART (-8.206 kcal/mol) and ATP1B2 (-8.093 kcal/mol). Thiostrepton also demonstrated strong binding with PGM3 (-8.957 kcal/mol), GFOD2 (-9.156 kcal/mol), and GDF15 (-8.345 kcal/mol). Based on these results, celastrol and thiostrepton were prioritized for further in vitro functional and mechanistic studies.
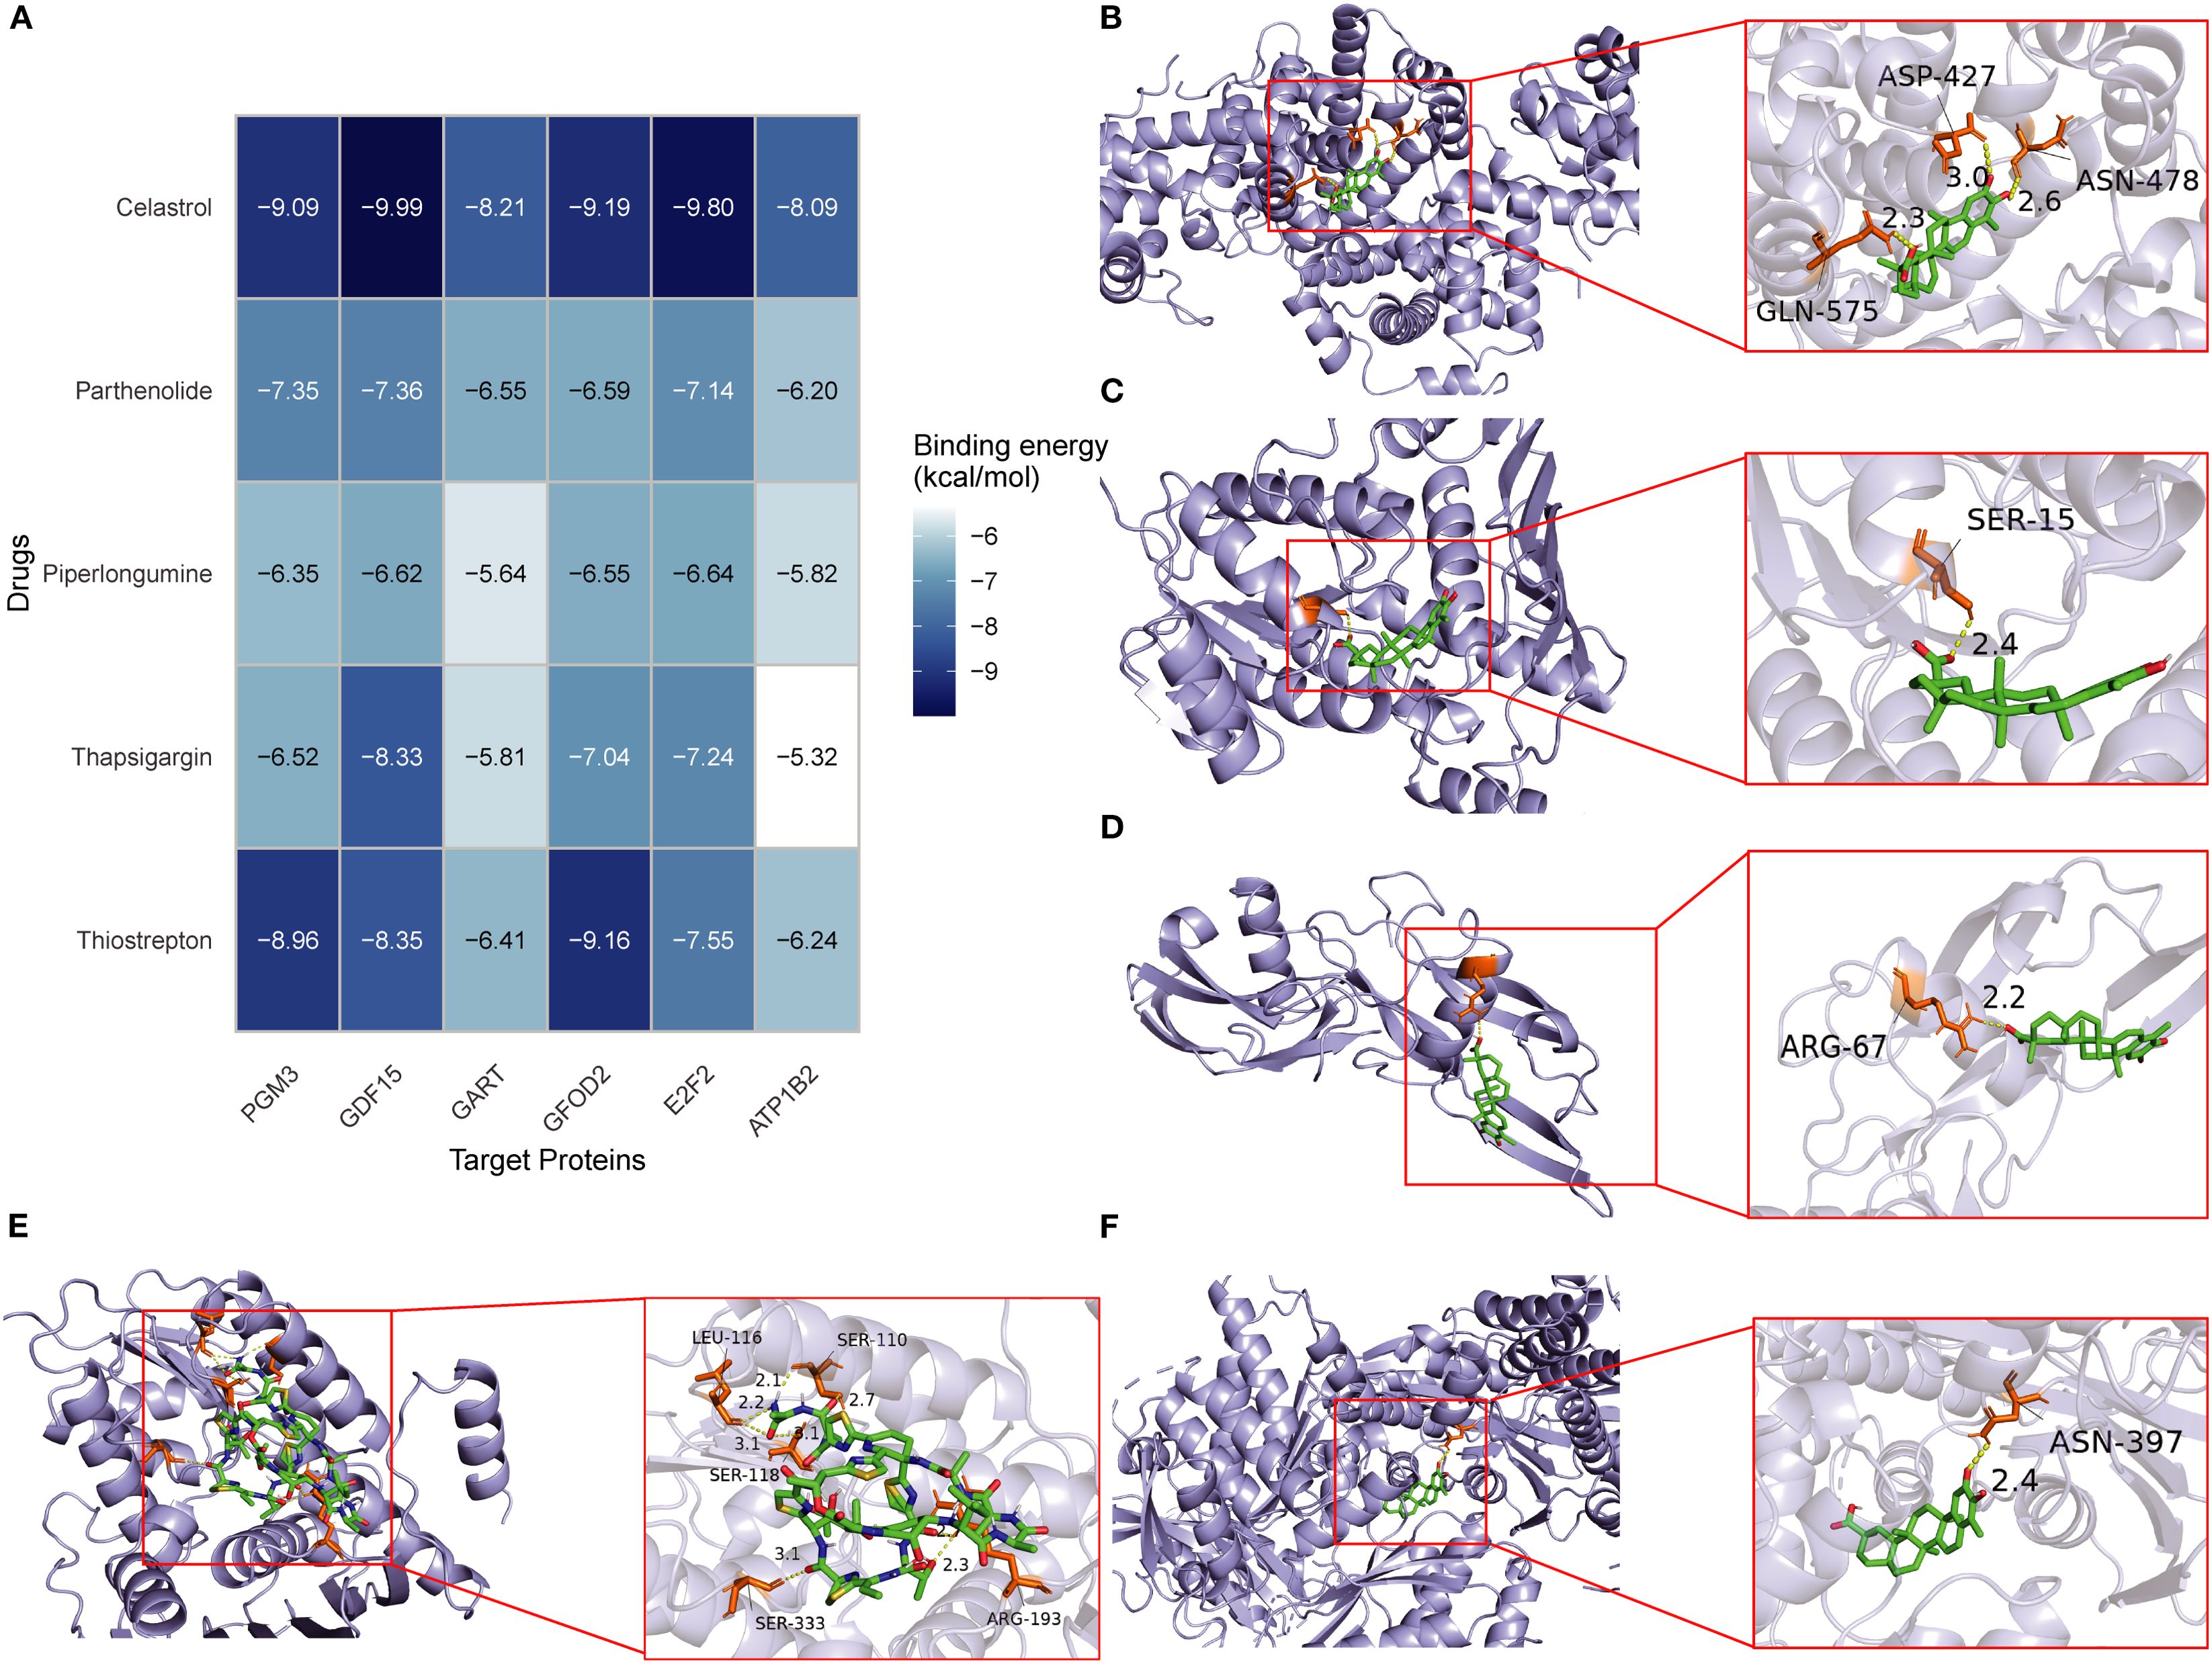
Figure 8. Molecular docking of candidate drugs with hub proteins in SA-ALI. (A) Heatmap showing binding energies (kcal/mol) between five candidate compounds (Celastrol, Parthenolide, Piperlongumine, Thapsigargin, and Thiostrepton) and six hub proteins (PGM3, GDF15, GART, GFOD2, E2F2, ATP1B2). Darker blue indicates stronger binding affinity. (B–F) Representative docking models of Celastrol with GDF15 (B), Parthenolide with PGM3 (C), Piperlongumine with GART (D), Thapsigargin with GFOD2 (E), and Thiostrepton with E2F2 (F). Green sticks represent ligands; orange sticks represent interacting residues.
Statistical analysis of repeated docking runs showed that the binding energy distributions were concentrated, with low standard deviations and narrow interquartile ranges, indicating good stability and reproducibility(Tab S1). Visualization with PyMOL and Discovery Studio further showed that celastrol and thiostrepton formed hydrogen bonds, hydrophobic contacts, and π–π stacking with key amino acid residues, supporting the reliability of the docking results (Supplementary Figure S1).
3.8 Celastrol and Thiostrepton attenuate LPS-induced apoptosis in A549 alveolar epithelial cells
Our results showed that LPS stimulation markedly impaired the clonogenic capacity of A549 alveolar epithelial cells, whereas treatment with Celastrol or Thiostrepton partially restored cell growth (Figures 9A, B). Flow cytometry analysis further demonstrated that LPS induced a significant increase in both early and late apoptotic populations, while administration of Celastrol or Thiostrepton reduced apoptotic cells and overall apoptosis rates (Figures 9C, D). Quantitative analysis confirmed that these differences were statistically significant compared with the LPS group (p < 0.05). Collectively, these findings indicate that Celastrol and Thiostrepton protect A549 alveolar epithelial cells against LPS-induced apoptosis.
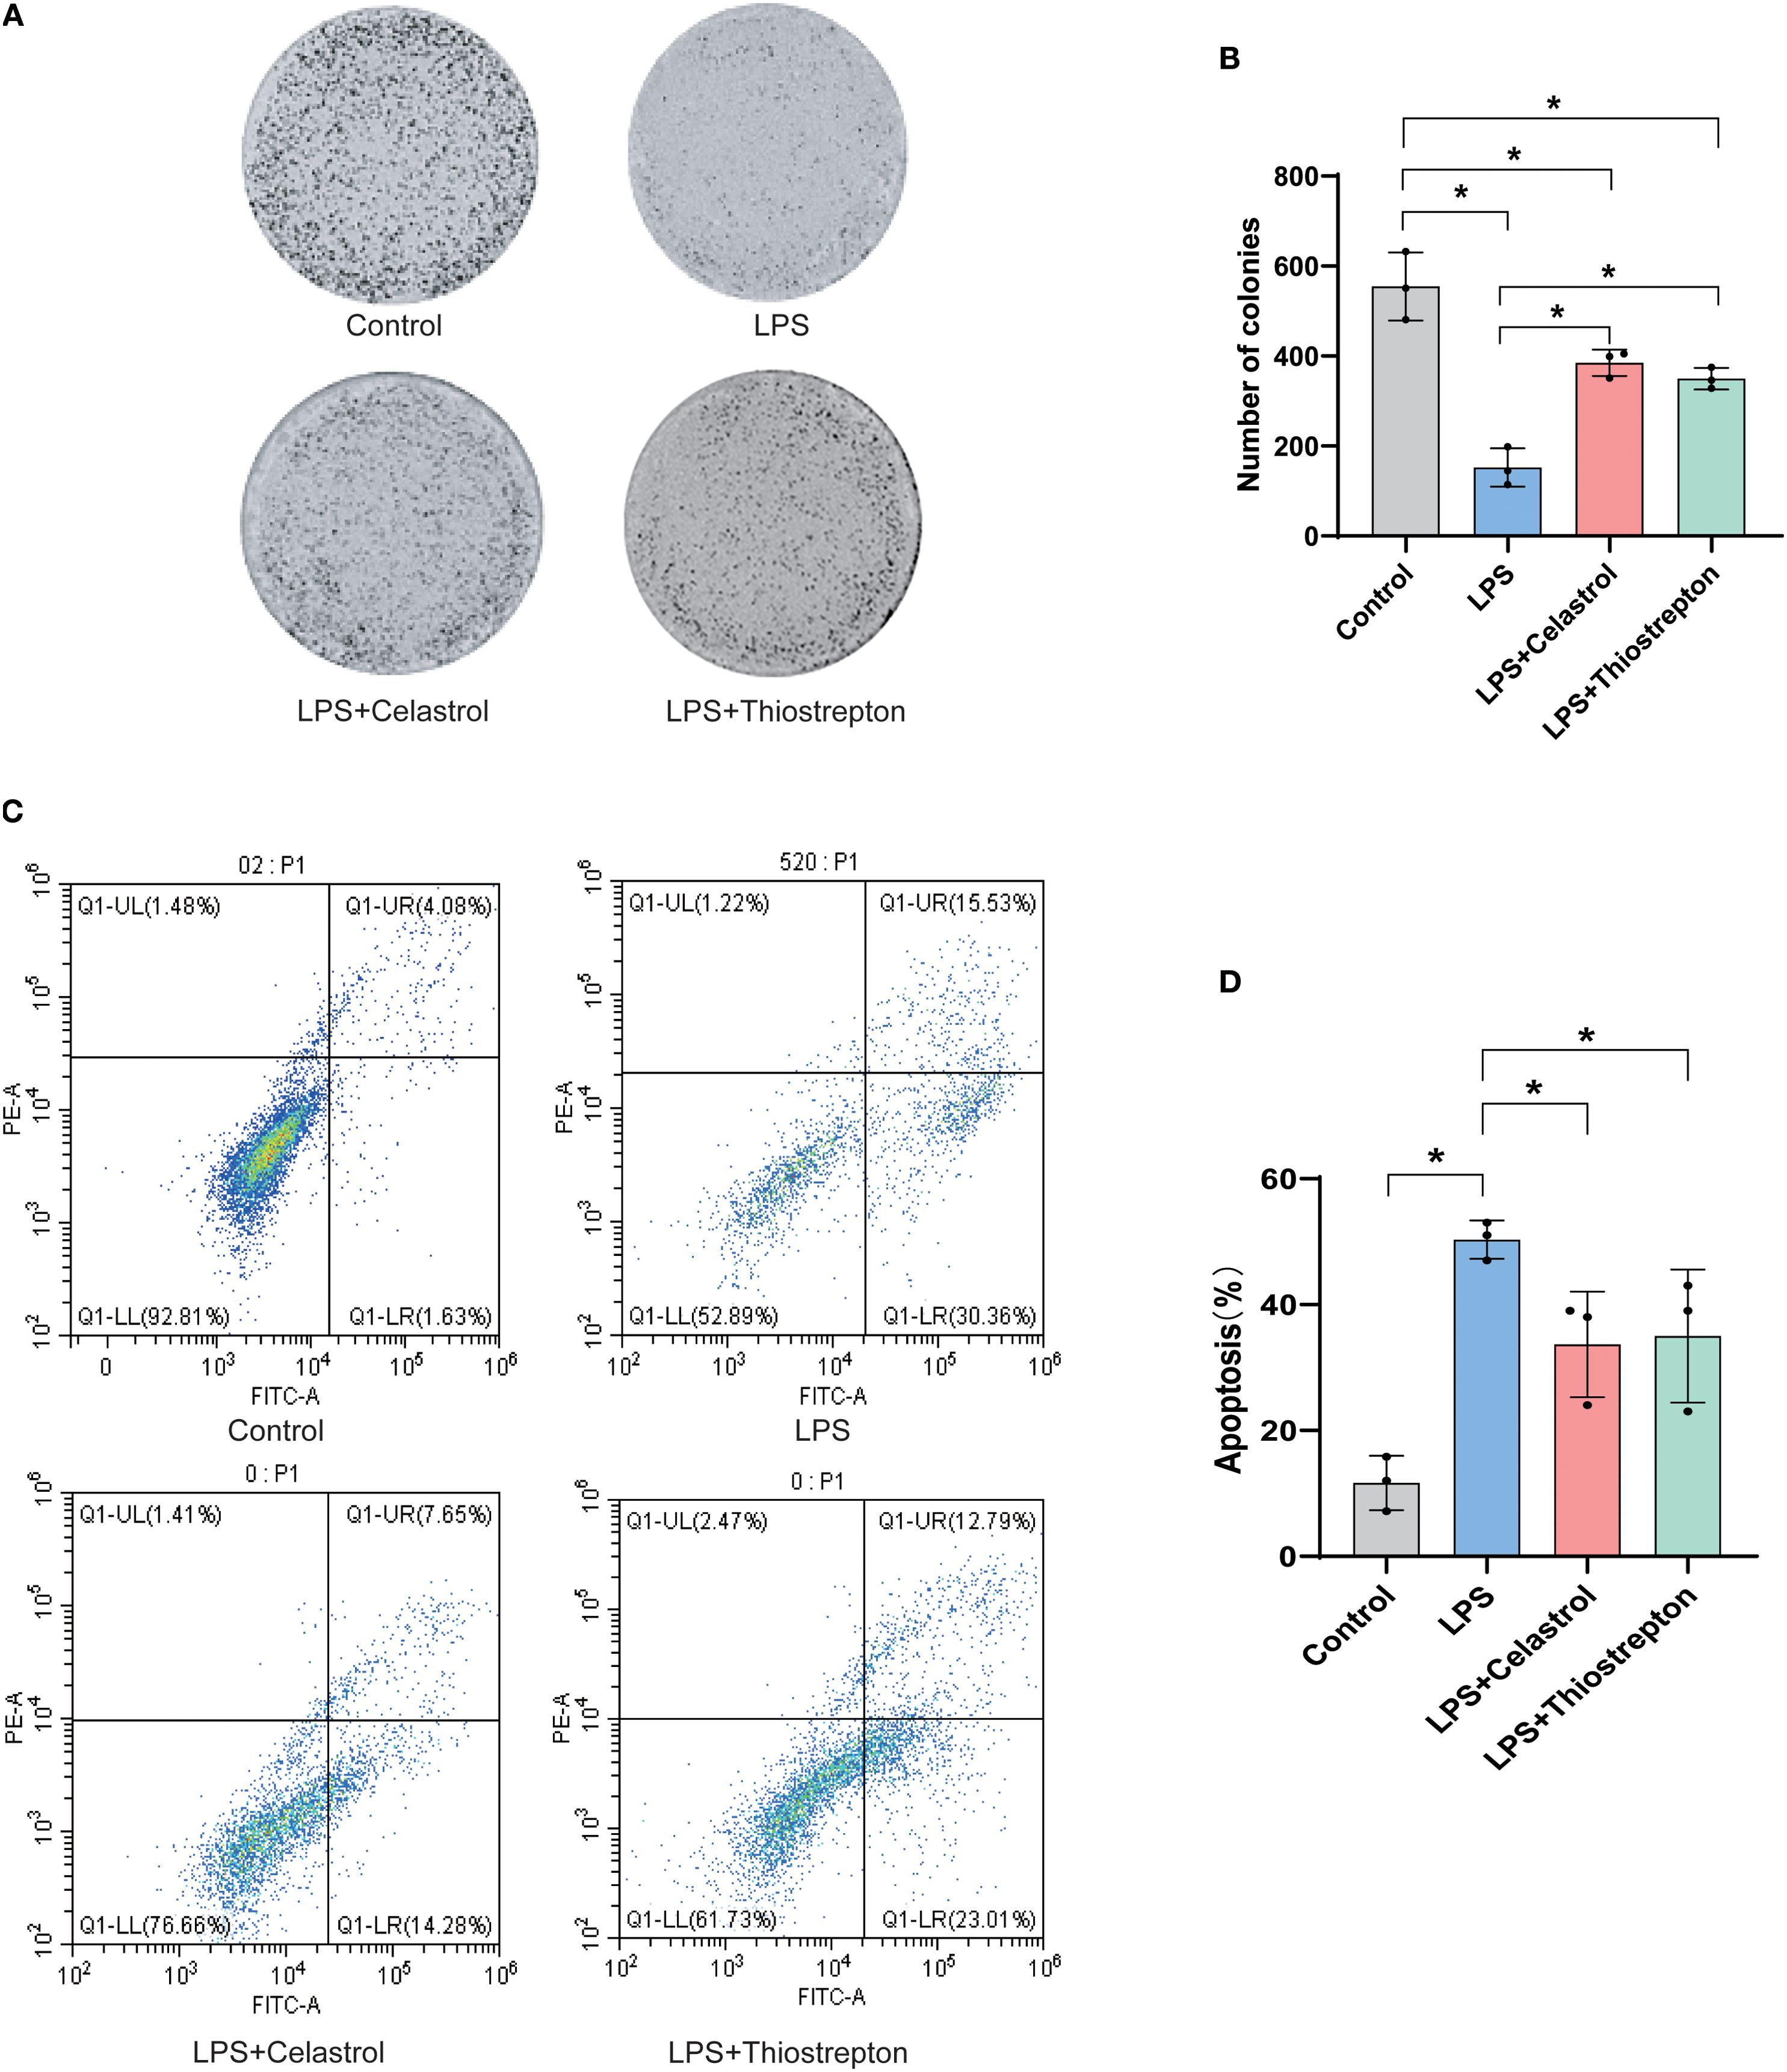
Figure 9. Celastrol and Thiostrepton attenuate LPS-induced apoptosis in alveolar epithelial cells (A549). (A) Representative images of cell colony formation assay in Control, LPS, LPS+Celastrol, and LPS+Thiostrepton groups. (B) Quantification showing that LPS markedly reduced the clonogenic capacity of alveolar epithelial cells, which was partially restored by Celastrol or Thiostrepton. (C) Representative Annexin V-FITC/PI flow cytometry plots displaying early and late apoptotic populations. (D) Quantification of apoptosis rates demonstrating that Celastrol and Thiostrepton reduced LPS-induced apoptosis. Data are presented as mean ± SD; *p < 0.05.
4 Discussion
During sepsis, the lung is among the most severely affected organs, and SA-ALI can progress to ARDS with high mortality (8, 13, 14). To identify potential biomarkers and therapeutic targets, we analyzed datasets GSE10474 and GSE32707, yielding 376 differentially expressed genes. Integrating WGCNA with three machine learning algorithms, we identified six diagnostic genes—PGM3, GDF15, GART, GFOD2, E2F2, and ATP1B2—associated with sepsis-induced ALI, which were validated in clinical samples by Western blotting. These genes are implicated in immune regulation, inflammation, and cellular stress, with CD4+ T cell reduction potentially contributing to lung injury. Drug enrichment and molecular docking further identified Thiostrepton and Celastrol as promising multi-target candidates for SA-ALI intervention. Our findings provide novel biomarkers for early diagnosis and potential agents for targeted therapy.
WB analysis demonstrated that all six key genes were significantly upregulated in SA-ALI patients compared with healthy controls, suggesting their involvement in disease onset and progression. Among them, GDF15 and E2F2 have been previously implicated in SA-ALI. GDF15, a stress-induced immunomodulatory hormone, is essential for survival during bacterial and viral infections as well as sepsis (15, 16), and may exert protective effects in SA-ALI through multiple mechanisms: (i) activating the AMPK pathway to suppress glycolysis and NF-κB/MAPK signaling, thereby attenuating alveolar macrophage–mediated inflammation; (ii) enhancing its own expression via the eIF2α–ATF4 pathway to establish an anti-inflammatory feedback loop; (iii) inhibiting the HIF-1α/LDHA axis to correct immunometabolic imbalance; and (iv) upregulating SIRT1 to protect alveolar epithelial cells (17–20). Similarly, recent evidence indicates that E2F2 may also participate in sepsis-related tissue protection by promoting M2 macrophage polarization and suppressing NF-κB signaling (21). In a rat CLP model, activation of the ghrelin/GHSR axis enhanced E2F2 expression, reduced inflammation, and mitigated intestinal barrier injury, suggesting that E2F2-mediated immunomodulation could have broader relevance in SA-ALI (22).
Although no direct evidence currently links PGM3, GART, GFOD2, or ATP1B2 to SA-ALI, their known biological functions suggest potential involvement in disease pathogenesis. PGM3, encoding phosphoglucomutase 3, is a key enzyme in the hexosamine biosynthetic pathway, regulating protein glycosylation, immune cell differentiation, and cytokine production; dysregulation of this pathway can impair immune homeostasis and barrier integrity—critical processes in ALI progression (23, 24). GART encodes a trifunctional enzyme in the de novo purine biosynthesis pathway, essential for nucleic acid synthesis, cell proliferation, and energy metabolism; enhanced purine metabolism may sustain hyperactivated immune cell proliferation and inflammatory mediator production, exacerbating the septic inflammatory respons (25, 26). GFOD2, a glutamate-rich protein with incompletely defined functions, has been implicated in oxidative stress regulation and mitochondrial homeostasis, processes closely related to alveolar epithelial cell survival under inflammatory injury (27). ATP1B2 encodes the β2 subunit of Na+/K+-ATPase, a crucial ion pump that maintains transmembrane electrochemical gradients, facilitates alveolar fluid clearance, and preserves epithelial barrier integrity; Na+/K+-ATPase dysfunction is a recognized mechanism of pulmonary edema in ALI (28, 29). In this study, all four genes were significantly upregulated in SA-ALI patient samples compared with healthy controls, suggesting that they may contribute to disease progression through coordinated effects on immune activation, metabolic reprogramming, oxidative stress regulation, and epithelial barrier function. These findings provide new leads for elucidating their mechanistic roles in SA-ALI and evaluating their potential as therapeutic targets.
Furthermore, we performed immune cell infiltration analysis and found that naïve CD4+ T cells play a central role in ALI immunity, differentiating into Th1, Th2, Th17, and Treg subsets that modulate disease progression and resolution (30, 31). In our cohort, GDF15 expression showed a strong positive correlation with naïve CD4+ T cell abundance. Previous studies have demonstrated that GDF15 promotes FOXP3+ induced Treg differentiation, enhances the anti-inflammatory activity of natural Tregs, and suppresses dendritic cell activation, thereby fostering immune tolerance (32). Collectively, these mechanisms may account for the protective role of GDF15 in SA-ALI through the expansion of immunosuppressive T cell populations and the attenuation of excessive inflammation.
Molecular docking identified two potential therapeutic compounds for SA-ALI—Celastrol and Thiostrepton. Celastrol demonstrated strong binding affinities with all six hub proteins, with the lowest binding energies observed for PGM3, GDF15, GFOD2, and E2F2, suggesting multi-target cooperative regulation. As a triterpenoid, Celastrol has been reported to suppress NF-κB/MAPK inflammatory signaling and activate the Nrf2/HO-1 antioxidant pathway in sepsis-induced lung injury, thereby reducing inflammation, inhibiting apoptosis, and improving lung function (33–35). The mechanism of GDF15, which activates AMPK to inhibit NF-κB/MAPK signaling in alveolar macrophages, and that of E2F2, which amplifies inflammatory responses via the TLR4/MyD88/NF-κB axis, align closely with Celastrol’s anti-inflammatory actions, suggesting potential synergistic effects (17, 18, 22). Furthermore, Celastrol’s ability to activate Nrf2/HO-1 may complement GFOD2-mediated oxidative stress regulation, enhancing antioxidant defenses and reducing oxidative damage (35, 36). Although the precise roles of PGM3, GART, and ATP1B2 in SA-ALI remain unclear, their favorable binding to Celastrol implies potential indirect benefits through metabolic homeostasis and membrane function regulation.
Thiostrepton, a thiazole-containing macrolide antibiotic, possesses both antimicrobial and immunomodulatory properties. It can inhibit the NF-κB pathway, reduce pro-inflammatory cytokines such as TNF-α and IL-6, and activate FOXO3 and antioxidant pathways to mitigate inflammation and oxidative stress (37–39). Thiostrepton exhibited strong binding with PGM3, GDF15, and GFOD2 (binding energies of –8.957, –8.345, and –9.156 kcal/mol, respectively), supporting its multi-target potential. While direct evidence is currently lacking, the strong molecular docking affinities observed between Thiostrepton and PGM3, GDF15, and GFOD2 suggest potential mechanistic interactions. It is plausible that Thiostrepton may modulate immune receptor glycosylation via PGM3, synergize with GDF15 to suppress inflammatory signaling, and enhance GFOD2-mediated antioxidant defenses to reduce ROS-induced lung injury. However, these hypotheses require experimental validation in future studies. Collectively, these findings highlight Celastrol and Thiostrepton as promising agents with complementary and synergistic anti-inflammatory, antioxidant, and immunoregulatory properties. Their therapeutic potential in SA-ALI warrants further mechanistic investigation and preclinical validation.
Taken together, our identification of six hub genes and their associated pathways not only elucidates the molecular mechanisms underlying SA-ALI but also provides novel opportunities for clinical translation. These biomarkers hold promise for improving the sensitivity and specificity of early diagnosis, enabling clinicians to stratify high-risk patients and initiate timely interventions before progression to ARDS. In addition, the discovery of Celastrol and Thiostrepton as potential multi-target therapeutic agents underscores the feasibility of drug repurposing strategies for SA-ALI. These compounds not only offer mechanistic insights into immunomodulation and oxidative stress regulation but also represent tangible candidates for preclinical and translational evaluation.
Future studies should focus on validating these biomarkers in large, multicenter clinical cohorts, integrating them into predictive models alongside conventional clinical parameters, and assessing their dynamic changes during disease progression. Moreover, systematic preclinical investigations of Celastrol and Thiostrepton—including pharmacokinetic, safety, and efficacy evaluations in animal models, followed by early-phase clinical trials—will be critical to establish their therapeutic potential. By bridging bioinformatics-driven discovery with clinical application, our findings lay the groundwork for precision medicine strategies aimed at improving outcomes in patients with sepsis-associated acute lung injury.
4.1 Limitations
Several limitations should be acknowledged. First, the transcriptomic analyses were derived from publicly available datasets with relatively small sample sizes, which may restrict statistical power and generalizability. Second, although the integration of WGCNA, multiple machine learning algorithms, and molecular docking provided a robust strategy for identifying key genes and candidate therapeutics, the findings remain correlative and predictive. Third, our clonogenic and flow cytometric apoptosis assays demonstrated that Celastrol and Thiostrepton exert protective effects on LPS-treated A549 cells; however, their interactions with putative targets were only suggested by molecular docking, and their efficacy and mechanisms require further validation in relevant in vitro and in vivo SA-ALI models. Fourth, the observed association between GDF15 and naïve CD4+ T cells warrants mechanistic studies to establish causality. Finally, the clinical validation was limited to a small cohort, and larger multicenter studies are needed to confirm the diagnostic and therapeutic potential of the identified biomarkers and compounds.
5 Conclusion
We identified six key genes—PGM3, GDF15, GART, GFOD2, E2F2, and ATP1B2—closely associated with the pathogenesis of SA-ALI, involving immune regulation, inflammatory signaling, oxidative stress, and epithelial barrier maintenance. Celastrol and Thiostrepton emerged as potential multi-target agents with complementary protective effects. Together, these findings not only provide novel biomarkers for disease monitoring and mechanistic insight into SA-ALI, but also point to promising therapeutic candidates that may inform the development of more effective treatment strategies.
Data availability statement
The datasets analyzed in this study are publicly available in the NCBI Gene Expression Omnibus (GEO) repository under accession numbers GSE10474 and GSE32707 (https://www.ncbi.nlm.nih.gov/geo/query/acc.cgi).
Ethics statement
The studies involving humans were approved by the Wenzhou Hospital of Integrated Traditional Chinese and Western Medicine in accordance with the Declaration of Helsinki (No. 2024-L076), and the Ethics Committee of Taizhou Municipal Hospital (Taizhou University Affiliated Municipal Hospital), School of Medicine, Taizhou University (LWYJ2025276). The studies were conducted in accordance with the local legislation and institutional requirements. The participants provided their written informed consent to participate in this study.
Author contributions
QyC: Writing – original draft. YM: Writing – original draft, Writing – review & editing. SC: Formal Analysis, Methodology, Writing – review & editing. XZ: Formal Analysis, Funding acquisition, Methodology, Data curation, Writing – review & editing. ChZ: Data curation, Methodology, Writing – review & editing. QqC: Writing – review & editing. CZ: Data curation, Formal Analysis, Methodology, Writing – review & editing.
Funding
The author(s) declare financial support was received for the research and/or publication of this article. This work was supported in part by grants from the Medical Health Science and Technology Project of Zhejiang Provincial Health Commission [No. 2024KY1824, QC; No. 2025KY1871, CZ]; The Science and Technology Project of Taizhou [No. 23ywb70, QC; No.24ywa44, CZ; The Science and Technology Project of Wenzhou [No. Y2023802, QC].
Conflict of interest
The authors declare that the research was conducted in the absence of any commercial or financial relationships that could be construed as a potential conflict of interest.
Generative AI statement
The author(s) declare that no Generative AI was used in the creation of this manuscript.
Any alternative text (alt text) provided alongside figures in this article has been generated by Frontiers with the support of artificial intelligence and reasonable efforts have been made to ensure accuracy, including review by the authors wherever possible. If you identify any issues, please contact us.
Publisher’s note
All claims expressed in this article are solely those of the authors and do not necessarily represent those of their affiliated organizations, or those of the publisher, the editors and the reviewers. Any product that may be evaluated in this article, or claim that may be made by its manufacturer, is not guaranteed or endorsed by the publisher.
Supplementary material
The Supplementary Material for this article can be found online at: https://www.frontiersin.org/articles/10.3389/fimmu.2025.1684774/full#supplementary-material
Abbreviations
SA-ALI, Sepsis-associated acute lung injury; GEO, Gene Expression Omnibus; PCA, Principal component analysis; TOM, topological overlap matrix; WGCNA, Weighted Gene Co-expression Network Analysis; DEGs, Differentially Expressed Genes, LIMMA, Linear Models for Microarray; GO, Gene Ontology; KEGG, Kyoto Encyclopedia of Genes and Genomes; PPI, Protein-Protein Interaction; LASSO, Least Absolute Shrinkage and Selection Operator; SVM-RFE, Support Vector Machine–Recursive Feature Elimination; RF, Random Forest; WB, Western Blot, GSVA, Gene Set Variation Analysis; DSigDB, Drug Signatures Database; ARDS, acute respiratory distress syndrome.
References
1. Singer M, Deutschman CS, Seymour CW, Shankar-Hari M, Annane D, Bauer M, et al. The third international consensus definitions for sepsis and septic shock (Sepsis-3). JAMA. (2016) 315:801–10. doi: 10.1001/jama.2016.0287
2. Nedeva C. Inflammation and cell death of the innate and adaptive immune system during sepsis. Biomolecules. (2021) 11(7). doi: 10.3390/biom11071011
3. Kumar S, Tripathy S, Jyoti A, and Singh SG. Recent advances in biosensors for diagnosis and detection of sepsis: A comprehensive review. Biosens Bioelectron. (2019) 124-125:205–15. doi: 10.1016/j.bios.2018.10.034
4. Fowler AA, Truwit JD, Hite RD, Morris PE, and DeWilde C. Effect of vitamin C infusion on organ failure and biomarkers of inflammation and vascular injury in patients with sepsis and severe acute respiratory failure: the CITRIS-ALI randomized clinical trial. JAMA. (2019) 322:1261–70. doi: 10.1001/jama.2019.11825
5. Johnson RF Jr. and Gustin J. Acute lung injury and acute respiratory distress syndrome requiring tracheal intubation and mechanical ventilation in the intensive care unit: impact on managing uncertainty for patient-centered communication. Am J Hosp Palliat Care. (2013) 30:569–75. doi: 10.1177/1049909112460566
6. Liu C, Xiao K, and Xie L. Advances in the use of exosomes for the treatment of ALI/ARDS. Front Immunol. (2022) 13:971189. doi: 10.3389/fimmu.2022.971189
7. Long ME, Mallampalli RK, and Horowitz JC. Pathogenesis of pneumonia and acute lung injury. Clin Sci (Lond). (2022) 136:747–69. doi: 10.1042/cs20210879
8. Bellani G, Laffey JG, Pham T, Fan E, Brochard L, Esteban A, et al. Epidemiology, patterns of care, and mortality for patients with acute respiratory distress syndrome in intensive care units in 50 countries. JAMA. (2016) 315:788–800. doi: 10.1001/jama.2016.0291
9. Janz DR and Ware LB. Biomarkers of ALI/ARDS: pathogenesis, discovery, and relevance to clinical trials. Semin Respir Crit Care Med Aug. (2013) 34:537–48. doi: 10.1055/s-0033-1351124
10. Spragg RG, Bernard GR, Checkley W, Curtis JR, Gajic O, Guyatt G, et al. Beyond mortality: future clinical research in acute lung injury. Am J Respir Crit Care Med. (2010) 181:1121–7. doi: 10.1164/rccm.201001-0024WS
11. Zheng L, Zhang Z, Song K, Xu X, Tong Y, Wei J, et al. Potential biomarkers for inflammatory response in acute lung injury. Open Med (Wars). (2022) 17:1066–76. doi: 10.1515/med-2022-0491
12. Mokra D and Kosutova P. Biomarkers in acute lung injury. Respir Physiol Neurobiol. (2015) 209:52–8. doi: 10.1016/j.resp.2014.10.006
13. Islam MN, Das SR, Emin MT, Wei M, Sun L, Westphalen K, et al. Mitochondrial transfer from bone-marrow-derived stromal cells to pulmonary alveoli protects against acute lung injury. Nat Med. (2012) 18:759–65. doi: 10.1038/nm.2736
14. Santacruz CA, Pereira AJ, Celis E, and Vincent JL. Which multicenter randomized controlled trials in critical care medicine have shown reduced mortality? A systematic review. Crit Care Med. (2019) 47:1680–91. doi: 10.1097/ccm.0000000000004000
15. Li Z, Liu Y, Li X, Wu Y, Yang F, Mo Q, et al. Association between circulating growth differentiation factor 15 and cirrhotic primary biliary cholangitis. BioMed Res Int. (2020) 2020:5162541. doi: 10.1155/2020/5162541
16. Wang D, Day EA, Townsend LK, Djordjevic D, Jørgensen SB, and Steinberg GR. GDF15: emerging biology and therapeutic applications for obesity and cardiometabolic disease. Nat Rev Endocrinol. (2021) 17:592–607. doi: 10.1038/s41574-021-00529-7
17. Wan Y and Fu J. GDF15 as a key disease target and biomarker: linking chronic lung diseases and ageing. Mol Cell Biochem Mar. (2024) 479:453–66. doi: 10.1007/s11010-023-04743-x
18. Song H, Chen Q, Xie S, Huang J, and Kang G. GDF-15 prevents lipopolysaccharide-mediated acute lung injury via upregulating SIRT1. Biochem Biophys Res Commun. (2020) 526:439–46. doi: 10.1016/j.bbrc.2020.03.103
19. Kuang X, Niu Z, Huang Z, Cai X, Wang L, Zhang Y, et al. GDF15 attenuates sepsis-induced acute lung injury by suppressing the HIF-1α/LDHA pathway. Int Immunopharmacol. (2025) 163:115198. doi: 10.1016/j.intimp.2025.115198
20. Li X, Sun H, Zhang L, Liang H, Zhang B, Yang J, et al. GDF15 attenuates sepsis-induced myocardial dysfunction by inhibiting cardiomyocytes ferroptosis via the SOCS1/GPX4 signaling pathway. Eur J Pharmacol. (2024) 982:176894. doi: 10.1016/j.ejphar.2024.176894
21. Denechaud PD, Fajas L, and Giralt A. E2F1, a novel regulator of metabolism. Front Endocrinol. (2017) 8:311. doi: 10.3389/fendo.2017.00311
22. Zhu L, Dou Z, Wu W, Hou Q, Wang S, Yuan Z, et al. Ghrelin/GHSR axis induced M2 macrophage and alleviated intestinal barrier dysfunction in a sepsis rat model by inactivating E2F1/NF-κB signaling. Can J Gastroenterol Hepatol. (2023) 2023:1629777. doi: 10.1155/2023/1629777
23. Yang L, Zerbato B, Pessina A, Brambilla L, Andreani V, Frey-Jakobs S, et al. PGM3 insufficiency: a glycosylation disorder causing a notable T cell defect. Front Immunol. (2024) 15:1500381. doi: 10.3389/fimmu.2024.1500381
24. Zhang Y, Yu X, Ichikawa M, Lyons JJ, Datta S, Lamborn IT, et al. Autosomal recessive phosphoglucomutase 3 (PGM3) mutations link glycosylation defects to atopy, immune deficiency, autoimmunity, and neurocognitive impairment. J Allergy Clin Immunol. (2014) 133:1400–1409.e14095. doi: 10.1016/j.jaci.2014.02.013
25. Welin M, Grossmann JG, Flodin S, Nyman T, Stenmark P, Trésaugues L, et al. Structural studies of tri-functional human GART. Nucleic Acids Res. (2010) 38:7308–19. doi: 10.1093/nar/gkq595
26. Huang Z, Xie N, Illes P, Di Virgilio F, Ulrich H, Semyanov A, et al. From purines to purinergic signalling: molecular functions and human diseases. Signal Transduct Target Ther. (2021) 6:162. doi: 10.1038/s41392-021-00553-z
27. Xu X, Pang Y, and Fan X. Mitochondria in oxidative stress, inflammation and aging: from mechanisms to therapeutic advances. Signal Transduct Target Ther. (2025) 10:190. doi: 10.1038/s41392-025-02253-4
28. Zemans RL and Matthay MA. Bench-to-bedside review: the role of the alveolar epithelium in the resolution of pulmonary edema in acute lung injury. Crit Care. (2004) 8:469–77. doi: 10.1186/cc2906
29. Tokhtaeva E, Sachs G, and Vagin O. Assembly with the Na,K-ATPase alpha (1) subunit is required for export of beta (1) and beta (2) subunits from the endoplasmic reticulum. Biochemistry. (2009) 48:11421–31. doi: 10.1021/bi901438z
30. Guan T, Zhou X, Zhou W, and Lin H. Regulatory T cell and macrophage crosstalk in acute lung injury: future perspectives. Cell Death Discov. (2023) 9:9. doi: 10.1038/s41420-023-01310-7
31. Chai YS, Chen YQ, Lin SH, Xie K, Wang CJ, Yang YZ, et al. Curcumin regulates the differentiation of naïve CD4+T cells and activates IL-10 immune modulation against acute lung injury in mice. BioMed Pharmacother. (2020) 125:109946. doi: 10.1016/j.biopha.2020.109946
32. Wischhusen J, Melero I, and Fridman WH. Growth/differentiation factor-15 (GDF-15): from biomarker to novel targetable immune checkpoint. Front Immunol. (2020) 11:951. doi: 10.3389/fimmu.2020.00951
33. Fu X, Wu C, Jiang W, Jiao Y, Wang J, Zhang B, et al. Design, synthesis, and biological evaluation of heterocycle-fused celastrol derivatives as potent antiosteoporosis agents by blocking RANKL-induced activation of the NF-κB and MAPK signaling pathways. J Med Chem. (2025) 68(16):17678–704. doi: 10.1021/acs.jmedchem.5c01380
34. Meng Z, Liu Q, Chen H, She C, and Huang Y. Therapeutic potential of celastrol in bacterial infections: Current research advancements and future perspectives. Pharmacol Res. (2025) 216:107774. doi: 10.1016/j.phrs.2025.107774
35. Qing TL, Yan L, Wang SK, Dai XY, Ren LJ, Zhang JQ, et al. Celastrol alleviates oxidative stress induced by multi-walled carbon nanotubes through the Keap1/Nrf2/HO-1 signaling pathway. Ecotoxicol Environ Saf. (2023) 252:114623. doi: 10.1016/j.ecoenv.2023.114623
36. Zheng ML, Yang ZH, He B, Sun X, Zhan YT, Shao AQ, et al. GFOD1 regulates oxidative stress-induced damage in ADHD via NF-κB signaling pathway. Brain Res. (2025) 1858:149605. doi: 10.1016/j.brainres.2025.149605
37. Asikaer A, Sun C, and Shen Y. Thiostrepton: multifaceted biological activities and its applications in treatment of inflammatory diseases. Inflammopharmacology. (2025) 33:183–94. doi: 10.1007/s10787-024-01587-9
38. Esparza K, Oliveira SD, Castellon M, Minshall RD, and Onyuksel H. Thiostrepton-nanomedicine, a TLR9 inhibitor, attenuates sepsis-induced inflammation in mice. Mediators Inflamm. (2023) 2023:4035516. doi: 10.1155/2023/4035516
Keywords: sepsis-associated acute lung injury (SA-ALI), hub genes, machine learning, molecular docking, small-molecule drugs
Citation: Chen Q, Mao Y, Cai S, Zhang X, Zeng C, Chen Q and Zheng C (2025) Integrated bioinformatics and molecular docking analysis reveal potential hub genes and targeted therapeutics in sepsis-associated acute lung injury. Front. Immunol. 16:1684774. doi: 10.3389/fimmu.2025.1684774
Received: 13 August 2025; Accepted: 24 September 2025;
Published: 10 October 2025.
Edited by:
Cassiano Felippe Gonçalves-de-Albuquerque, Rio de Janeiro State Federal University, BrazilReviewed by:
Saul Oswaldo Lugo Reyes, National Institute of Pediatrics, MexicoUzma Saqib, Devi Ahilya University, India
Copyright © 2025 Chen, Mao, Cai, Zhang, Zeng, Chen and Zheng. This is an open-access article distributed under the terms of the Creative Commons Attribution License (CC BY). The use, distribution or reproduction in other forums is permitted, provided the original author(s) and the copyright owner(s) are credited and that the original publication in this journal is cited, in accordance with accepted academic practice. No use, distribution or reproduction is permitted which does not comply with these terms.
*Correspondence: Cheng Zheng, ZHIuemhlbmdjaGVuZ0Bmb3htYWlsLmNvbQ==; Qingqing Chen, Y2hlbnFxMzQ3MUBlbnplbWVkLmNvbQ==
†These authors have contributed equally to this work