 Huizi Xiong
 Zengyang Yu
- 1Department of Dermatology, The Fourth Affiliated Hospital of Soochow University, Suzhou Medical College, Soochow University, Suzhou, China
- 2Department of Dermatology, Shanghai Tenth People’s Hospital, Tongji University School of Medicine, Shanghai, China
- 3Institute of Psoriasis, Tongji University School of Medicine, Shanghai, China
A Correction on
Association between systemic inflammation indicators and psoriasis: a cross-sectional study from NHANES
By Xiong H and Yu Z (2025) Front. Immunol. 16:1556487. doi: 10.3389/fimmu.2025.1556487
In the published article, there was an error in affiliation 1. Instead of “Department of Dermatology, The Fourth Affiliated Hospital of Soochow University/Suzhou DushuLake Hospital/Medical Center of Soochow University, Suzhou, Jiangsu, China”, it should be “Department of Dermatology, The Fourth Affiliated Hospital of Soochow University, Suzhou Medical College, Soochow University, Suzhou, China”.
In the published article, there was an error in the caption for Figure 1. The caption for the Figure 1 was displayed as “Selection flowchart for this study”. The corrected caption appears below.
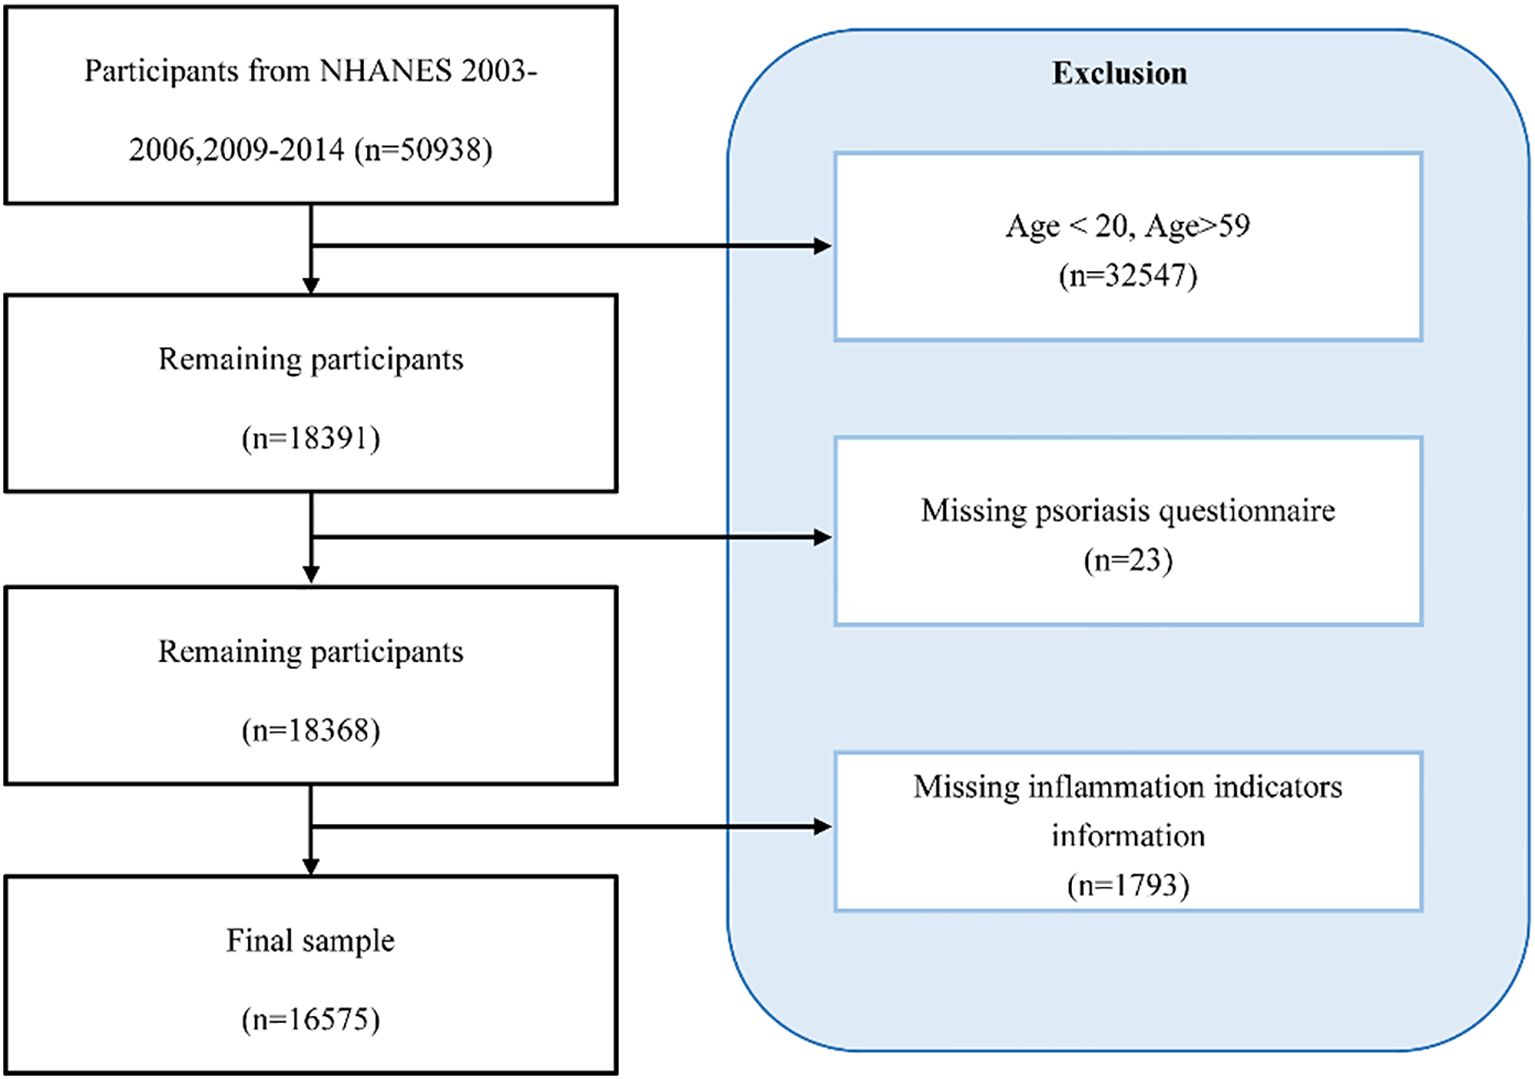
Figure 1. Participant selection flowchart for this study.
“Participant selection flowchart for this study.”
In the published article, the legend for Table 1 was erroneously excluded. The corrected legend appears below.
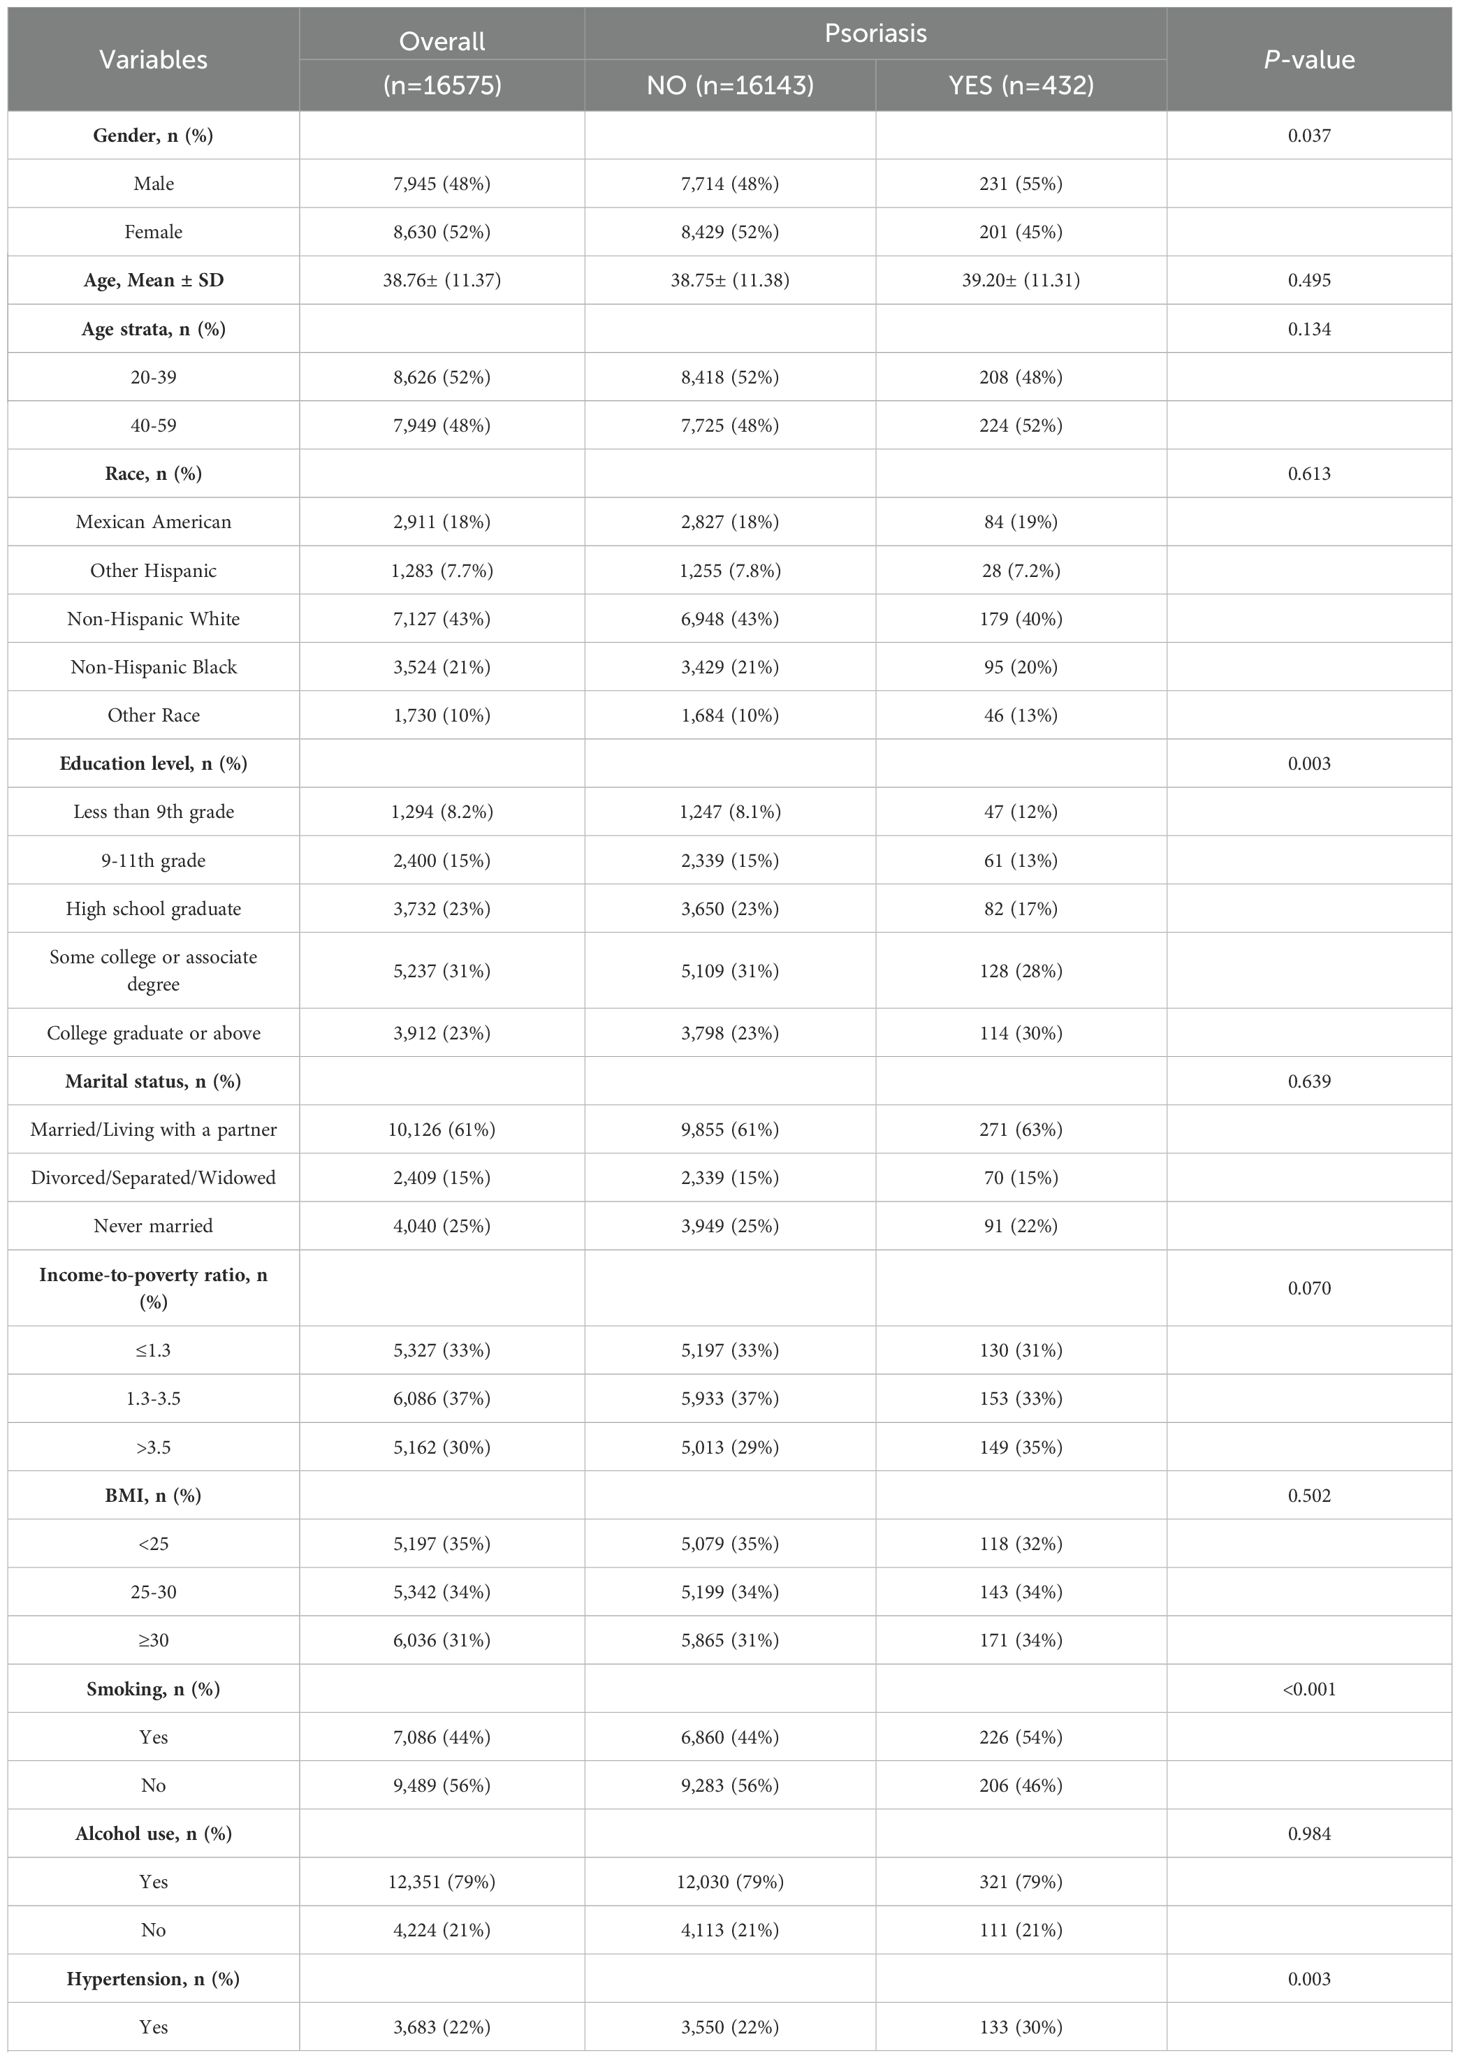
Table 1. The baseline characteristics of participants enrolled in the NHANES cycles spanning from 2003–2006 and 2009-2014.
“p < 0.05 was deemed statistically significant; NHANES: National Health and Nutrition Examination Survey; Abbreviations: BMI: body mass index; HDL-C: high-density lipoprotein cholesterol; NPAR: neutrophil-percentage-to-albumin ratio; NLR: neutrophil-to-lymphocyte ratio; NHR: neutrophil-to-high-density lipoprotein cholesterol ratio; LHR: lymphocyte-to-high-density lipoprotein cholesterol ratio; PHR: platelet-to-high-density lipoprotein cholesterol ratio; MHR: Monocyte-to-high-density lipoprotein cholesterol ratio.”
In the published article, there was an error in the caption for Table 2. The caption for Table 2 was displayed as “Associations between systemic inflammatory indicators and psoriasis in NHANES 2003-2006, 2009–2014 used multivariable logistic regression models”. The corrected caption appears below.
“Associations between systemic inflammatory indicators and psoriasis: Multivariable logistic regression analysis of NHANES 2003–2006 and 2009-2014.“
In the published article, there was an error in Table 1. There were mistakes in the description of the “HDL” and “Mean+ SD”, the correct descriptions were “HDL-C” and “Mean ± SD”. The corrected Table 1 and its caption “The baseline characteristics of participants enrolled in the NHANES cycles spanning from 2003–2006 and 2009-2014” appears below.
In the published article, there was an error in Table 2. The column headings “Model 1 OR (95% CI)” “Model 2 OR (95% CI)” and “Model 3 OR (95% CI)” should be written instead as “Model 1 OR1 (95% CI2)” “Model 2 OR1 (95% CI2)” and “Model 3 OR1 (95% CI2)” respectively. The corrected Table 2 appears below.
In the published article, there was an error in Table 3. There was a mistake in the description of inflection point of “NPAR/100K”, the correct description is inflection point of “NPAR/10K”. Furthermore, the second column heading “Psoriasis OR (95%CI) P-value” should be corrected to read “Psoriasis OR1 (95%CI2) P-value”. The corrected Table 3 and its caption “Threshold effect analysis of systemic inflammatory indicators on psoriasis using a two-stage linear regression model in Model 3” appears below.
In the published article, there was an error in Table 4. The fourth column heading “95%Cl up” should be corrected to “95%Cl2 up”. The corrected Table 4 appears below.
In the published article, there was an error in Figure 4 as published. There was a mistake in the description of “NPAR10”, the correct description is “NPAR/10”. The corrected Figure 4 and its caption “ROC curve for psoriasis diagnoses” appears below.
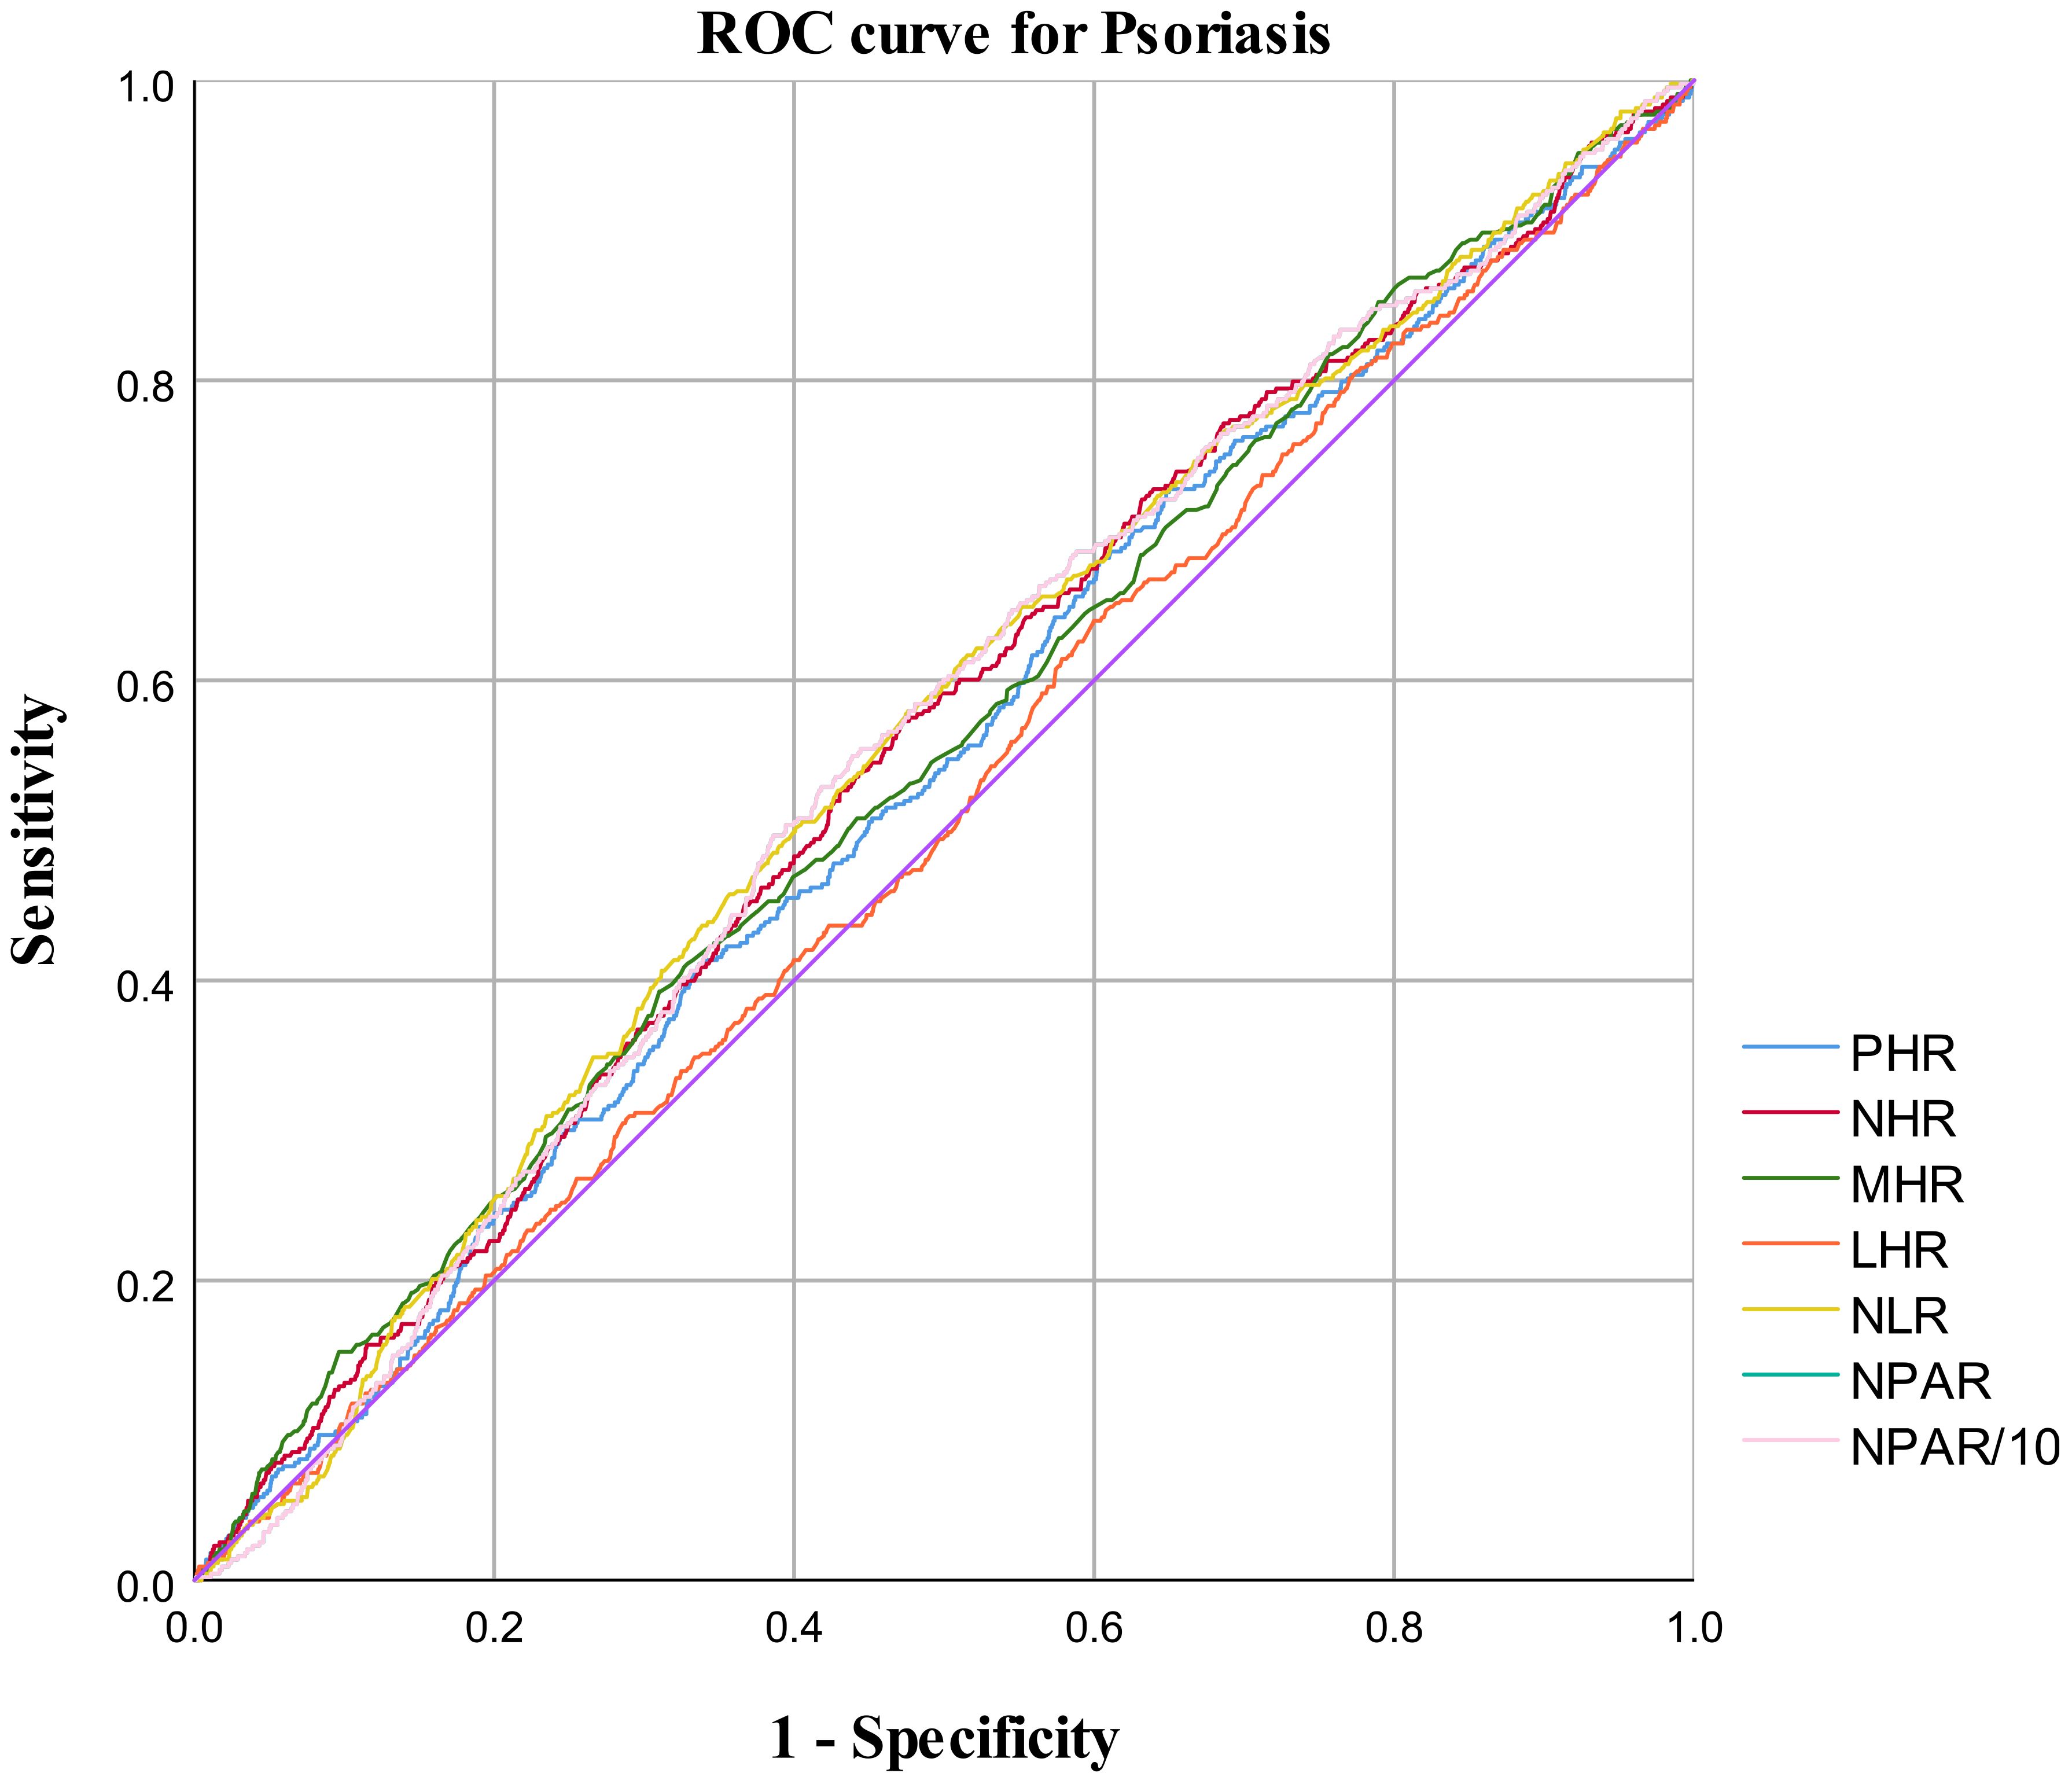
Figure 4. ROC curve for psoriasis diagnoses.
Reference “Zhao J, Zheng Q, Ying Y, Luo S, Liu N, Wang L, et al. Association between high-density lipoprotein-related inflammation index and periodontitis: Insights from nhanes 2009-2014. Lipids Health Dis (2024), 23(1): 321.doi:10.1186/s12944-024-02312-9” was not cited in the article. The citation has now been inserted in the section Introduction, paragraph 3 and should read:
“Similarly, other ratios such as NHR (neutrophil-to-hemoglobin ratio), LHR (lymphocyte-to-hemoglobin ratio), MHR (monocyte-to-hemoglobin ratio), and PHR (platelet-to-hemoglobin ratio) have also been identified as potential markers of inflammatory factors that play a critical role in many diseases (10, 11).”
Reference “Zhang Y, Qian H, Kuang Y H, Wang Y, Chen W Q, Zhu W, et al. Evaluation of the inflammatory parameters as potential biomarkers of systemic inflammation extent and the disease severity in psoriasis patients. Arch Dermatol Res.2024, 316(6): 229.doi:10.1007/s00403-024-02972-8.” was not cited in the article. The citation has now been inserted in the section Introduction, paragraph 4 and should read:
“The recent findings that psoriasis patients have higher levels of CRP (C-reactive protein), MHR (monocyte-to-hemoglobin ratio), NLR (neutrophil-to-lymphocyte ratio), and MLR (monocyte-to-lymphocyte ratio), and that these levels are positively correlated with the severity of the psoriasis condition, are significant (12).”
A correction has been made to Abstract, Methods, This sentence previously stated:
“We analyzed data from 16,575 adult participants in the National Health and Nutrition Examination Survey (NHANES) conducted between the years 2003–2004 and 2009-2014. We employed multivariable logistic regression and nonlinear curve fitting methods, which allowed us to evaluate the associations between psoriasis and systemic inflammation indicators such as NPAR, NLR, NHR, LHR, PHR (platelet-to-high-density lipoprotein cholesterol ratio), and MHR”
The corrected sentence appears below:
“We analyzed data from 16,575 adults in the National Health and Nutrition Examination Survey (NHANES) from 2003–2006 and 2009–2014. Six inflammatory ratios—neutrophil percentage-to-albumin ratio (NPAR), neutrophil-to-lymphocyte ratio (NLR), neutrophil-to-high-density lipoprotein cholesterol ratio (NHR), lymphocyte-to-high-density lipoprotein cholesterol ratio (LHR), platelet-to-high-density lipoprotein cholesterol ratio (PHR), and monocyte-to-high-density lipoprotein cholesterol ratio (MHR”
A correction has been made to Introduction, Paragraph 3. This sentence previously stated:
“The NPAR (neutrophil-to-albumin ratio), NHR (neutrophil-to-hemoglobin ratio), LHR (lymphocyte-to-hemoglobin ratio), MHR (monocyte-to-hemoglobin ratio), and PHR (platelet-to-hemoglobin ratio)”
The corrected sentence appears below:
“The neutrophil-percentage-to-albumin ratio (NPAR), the neutrophil-to-high-density lipoprotein cholesterol ratio (NHR), lymphocyte-to-high-density lipoprotein cholesterol ratio (LHR), monocyte-to-high-density lipoprotein cholesterol ratio (MHR), and platelet-to-high-density lipoprotein cholesterol ratio (PHR)”
In the published article, there was a lack of HDL-C description.
A correction has been made to Introduction, Paragraph 3. The additional sentence to be added to the end of the paragraph appears below:
“High-density lipoprotein cholesterol (HDL-C) is known for its anti-inflammatory properties. However, both its levels and function are compromised during inflammatory states. Furthermore, HDL-C engages in complex regulatory interactions with various immune cell types”
A correction has been made to Methods, 2.1 Population under investigation. This sentence previously stated:
“A total of 16,424 individuals participated in both the “complete blood count, high-density lipoprotein cholesterol, albumin” examination and the “Psoriasis” questionnaire.”
The corrected sentence appears below:
“A total of 16,575 individuals participated in both the “complete blood count, high-density lipoprotein cholesterol, albumin” examination and the “Psoriasis” questionnaire.”
A correction has been made to Methods, 2.2 Measurement of systemic inflammation indicators NPAR, NHR, LHR, PHR and MHR, Paragraph 1.
This sentence previously stated:
“The Beckman Coulter DxH 900 Automated Hematology Analyzer (Beckman Coulter, Brea, CA, USA) and NHANES derived CBC curves are used for hematological measurements, including hemoglobin levels, hemoglobin level, erythrocyte indices, and red and white blood cells” and “NPAR: (Percent neutrophils of total leukocyte count [%]) × 100/Albumin (g/CL);NHR: Neutrophil counts (10^9/L)/HDL (mmol/L); LHR: Lymphocyte counts (10^9/L)/HDL (mmol/L); PHR: Platelet counts (10^9/L)/HDL (mmol/L); MHR: Monocyte counts (10^9/L)/HDL (mg/dL)”
The corrected sentence appears below:
“The relevant laboratory measures were obtained from the NHANES database. HDL-C levels were assessed using an automatic device, with venous blood samples collected after an 8-hour fast. The standard reference range for HDL-C is 1.3–1.5 mmol/L for females and 1.0–1.5 mmol/L for males.” and “NPAR: (Percent neutrophils of total leukocyte count [%]) × 100/Albumin (g/dL);NHR: Neutrophil counts (10^9/L)/HDL (mmol/L);LHR: Lymphocyte counts (10^9/L)/HDL (mmol/L); PHR: Platelet counts (10^9/L)/HDL (mmol/L); MHR: Monocyte counts (10^9/L)/HDL (mmol/L); NLR: Neutrophil counts (10^9/L)/Lymphocyte counts (10^9/L)”
A correction has been made to Methods, 2.4 Covariates. This sentence previously stated:
“Hyperlipidemia was defined using National Cholesterol Education Program criteria, incorporating LDL cholesterol levels ≥130 mg/dL, HDL cholesterol levels ≤40 mg/dL for males and ≤50 mg/dL for females, triglycerides levels ≥150 mg/dL, cholesterol levels ≥200 mg/dL, and the use of cholesterol-lowering medications.”
The corrected sentence appears below:
“Hyperlipidemia was defined using National Cholesterol Education Program criteria, incorporating LDL cholesterol ≥ 4.1 mmol/L, HDL-C ≤ 1.0 mmol/L in men or ≤ 1.3 mmol/L in women, triglycerides ≥ 2.3 mmol/L, total cholesterol ≥ 6.2 mmol/L, or current use of cholesterol-lowering medication.”
In the published article, there was an error in the legends for Tables 2–4 as published. The following information was excluded from the legend of Tables 2–4: “OR1: Odd ratio. 95% CI2: 95% confidence interval”
The corrected Tables 2–4, and their legends, appear below.
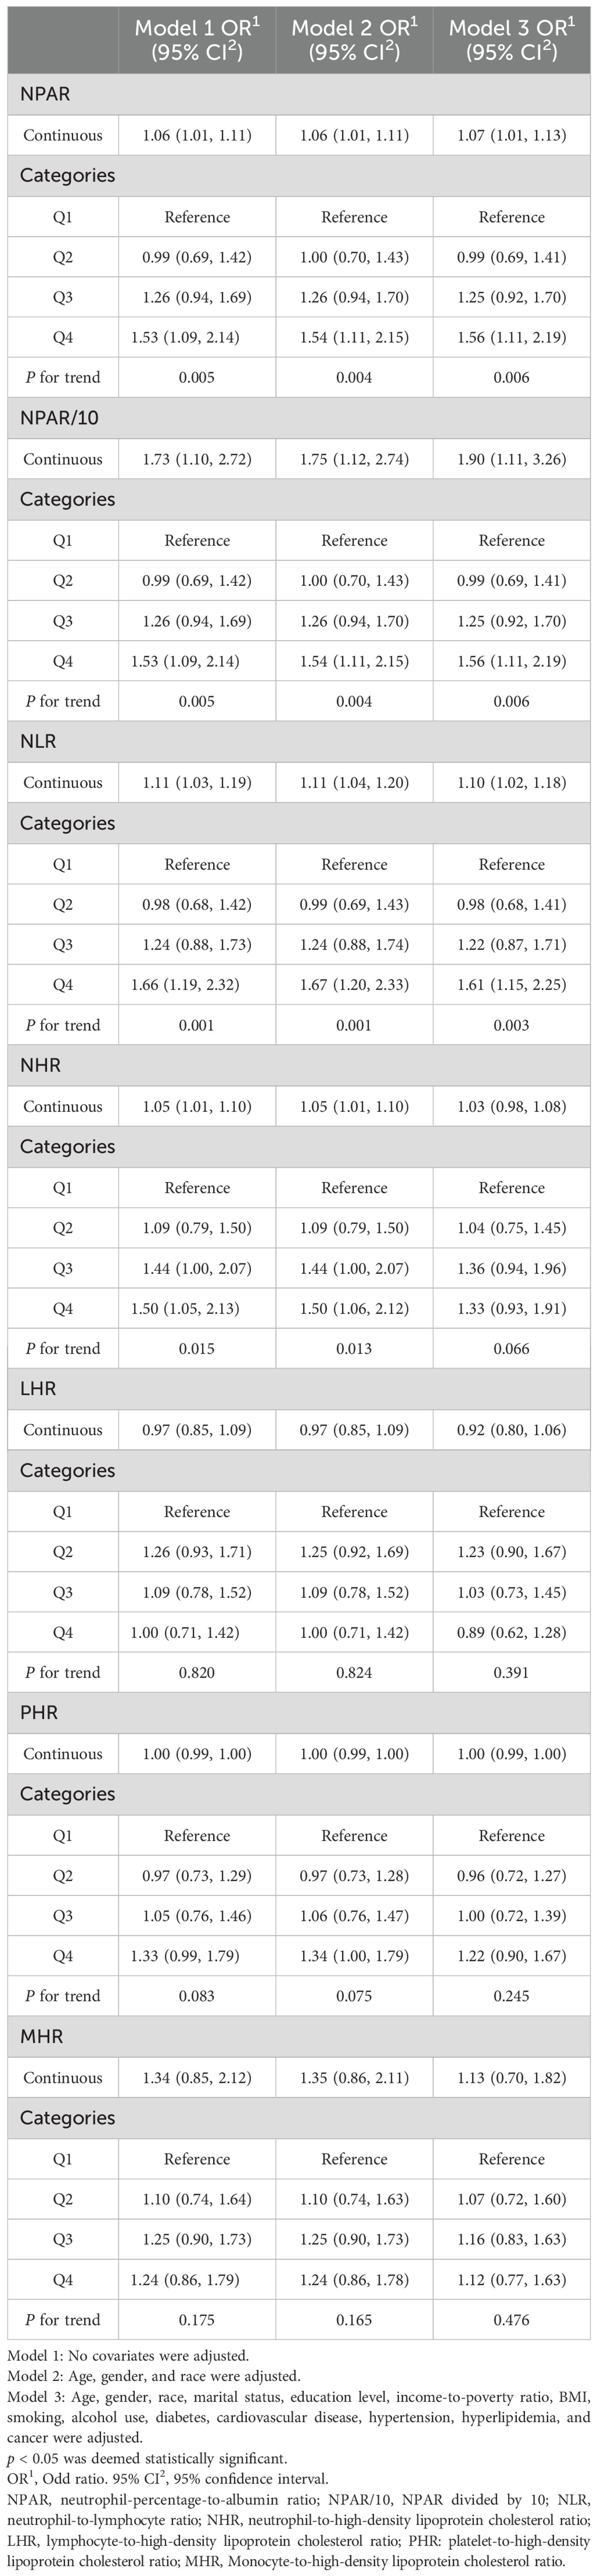
Table 2. Associations between systemic inflammatory indicators and psoriasis: multivariable logistic regression analysis of NHANES 2003–2006 and 2009-2014.
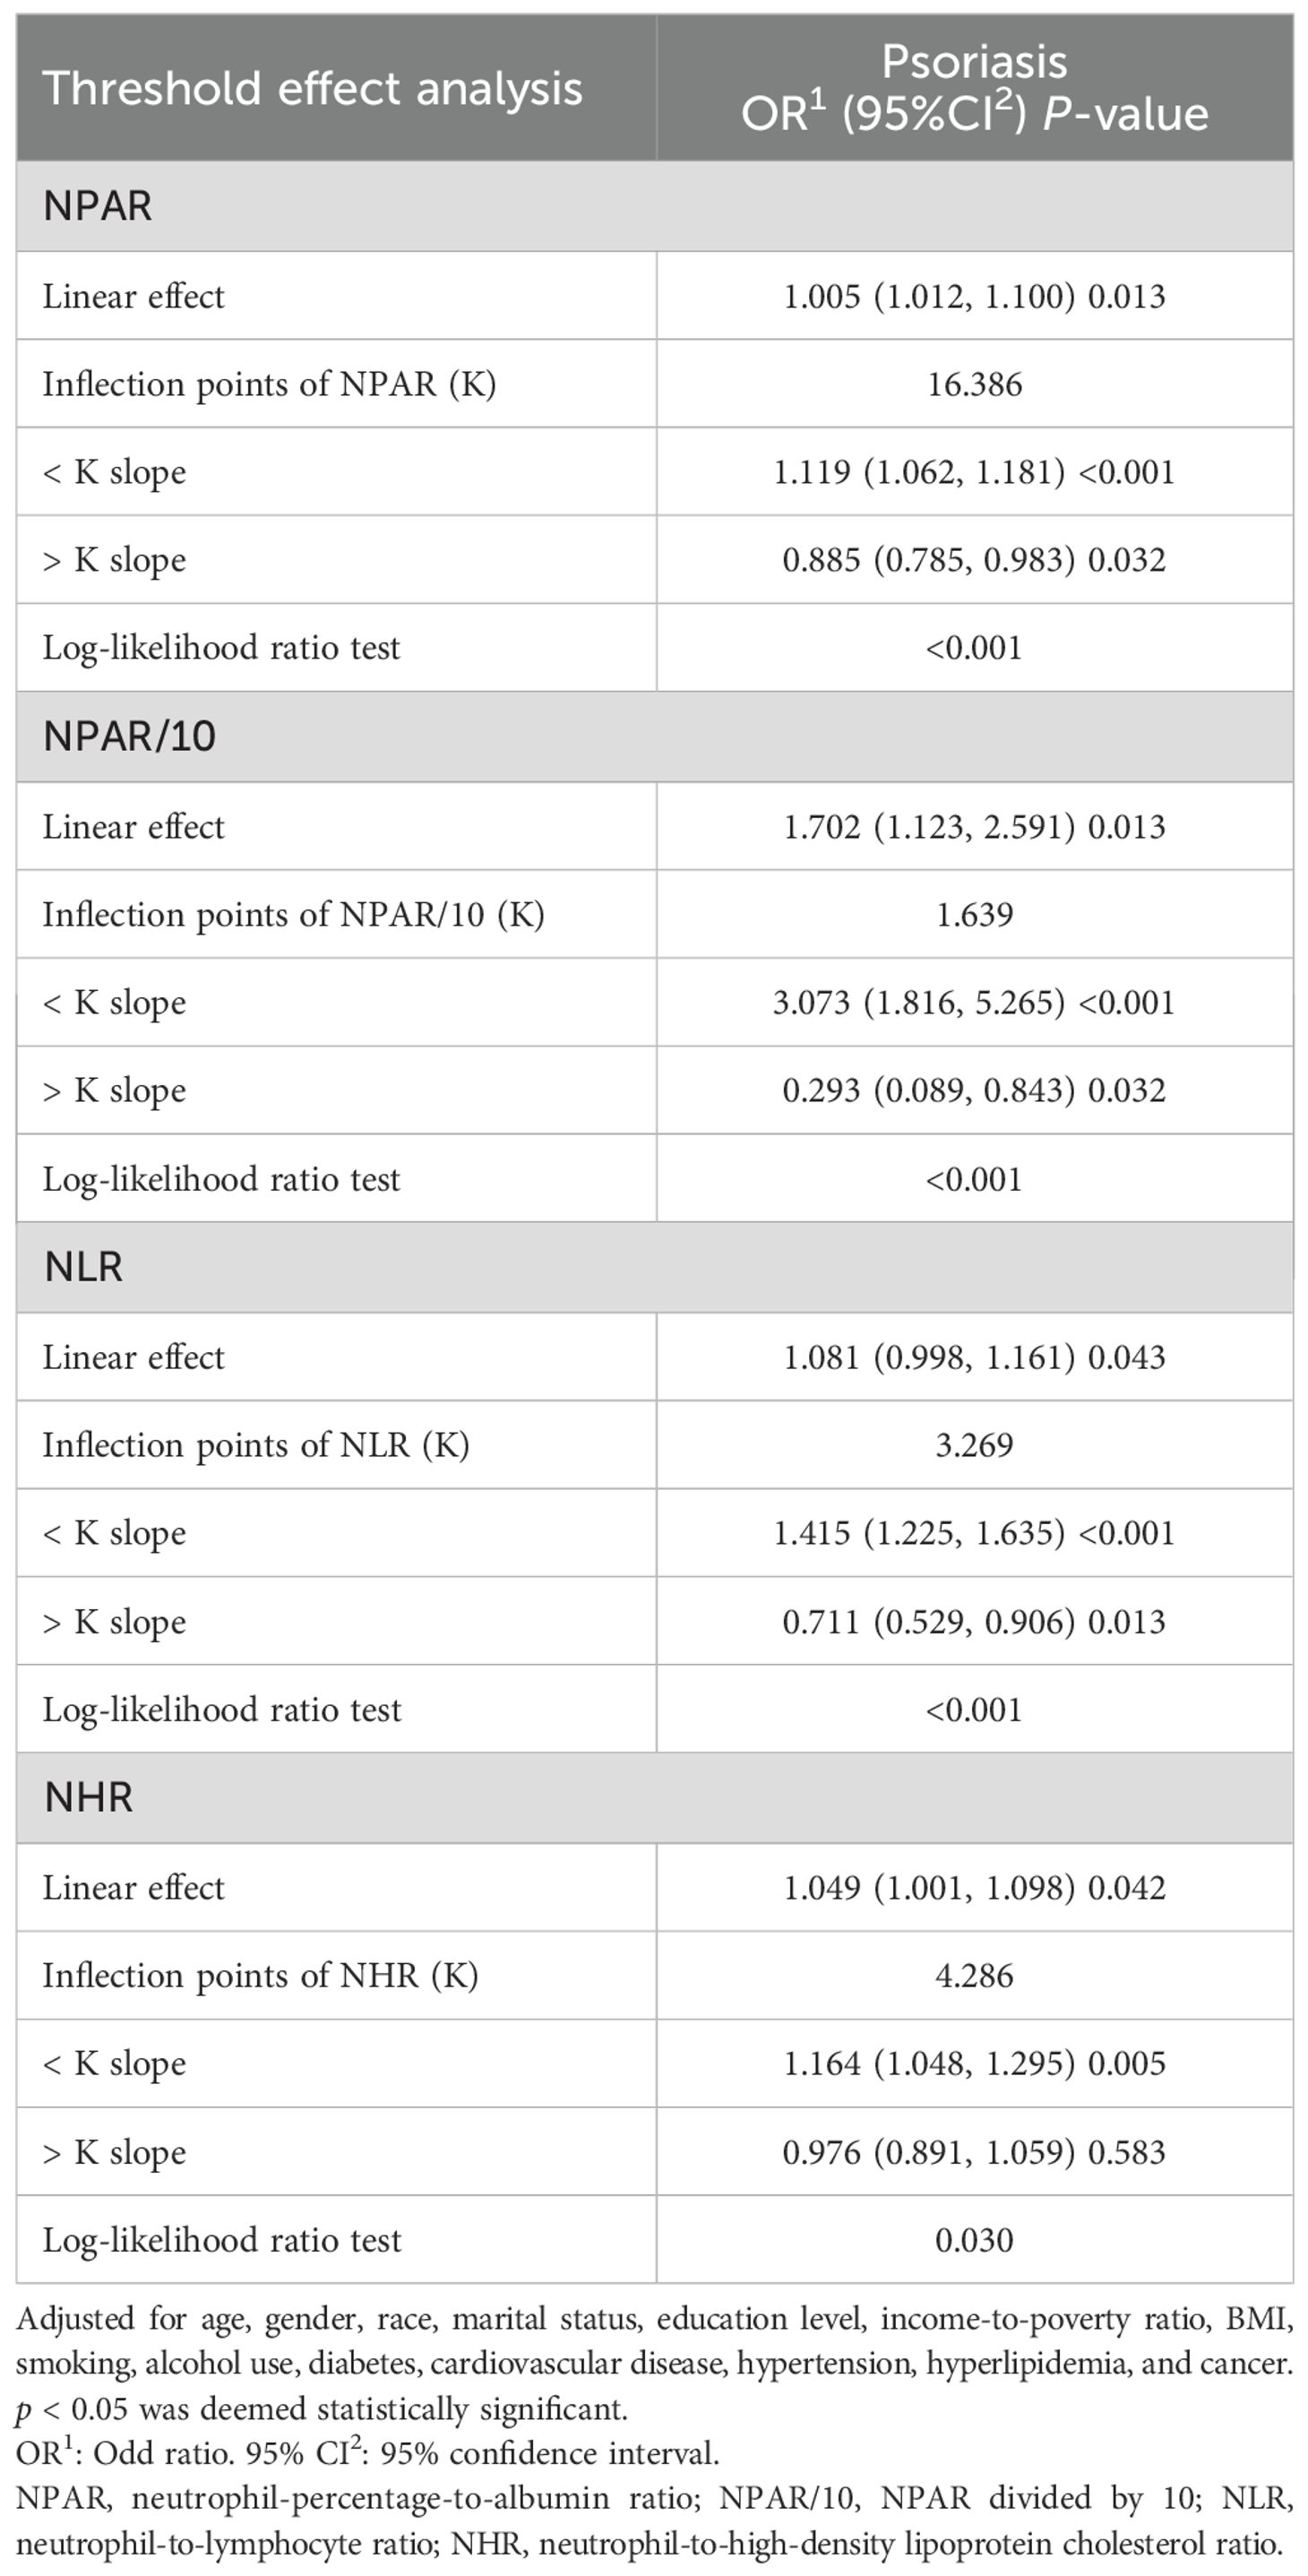
Table 3. Threshold effect analysis of systemic inflammatory indicators on psoriasis using a two-stage linear regression model in Model 3.
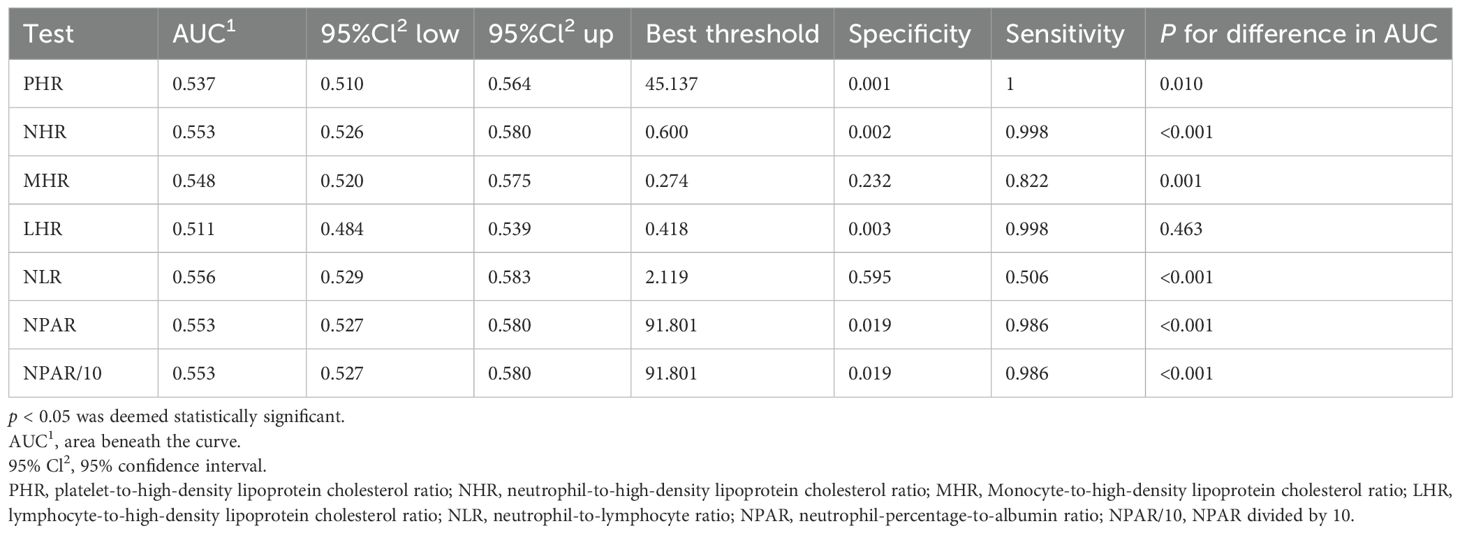
Table 4. AUC values of systemic inflammatory indicators.
Publisher’s note
All claims expressed in this article are solely those of the authors and do not necessarily represent those of their affiliated organizations, or those of the publisher, the editors and the reviewers. Any product that may be evaluated in this article, or claim that may be made by its manufacturer, is not guaranteed or endorsed by the publisher.
Keywords: NHANES, psoriasis, NPAR, NHR, NLR
Citation: Xiong H and Yu Z (2025) Correction: Association between systemic inflammation indicators and psoriasis: a cross-sectional study from NHANES. Front. Immunol. 16:1690809. doi: 10.3389/fimmu.2025.1690809
Received: 22 August 2025; Accepted: 15 October 2025;
Published: 06 November 2025.
Edited and reviewed by:
Manoj Kumar Tembhre, All India Institute of Medical Sciences, IndiaCopyright © 2025 Xiong and Yu. This is an open-access article distributed under the terms of the Creative Commons Attribution License (CC BY). The use, distribution or reproduction in other forums is permitted, provided the original author(s) and the copyright owner(s) are credited and that the original publication in this journal is cited, in accordance with accepted academic practice. No use, distribution or reproduction is permitted which does not comply with these terms.
*Correspondence: Zengyang Yu, eXV6ZW5neWFuZ0B0b25namkuZWR1LmNu