 Lin Yang1†
 Tianhui He1†
 Jing Wang2
 Xiaolan Zhang1
 Lin Zeng1Qinkun Sun1
 Yuelin Song1
 Yufei Nie1Xinran Gao1Chunliang Shang1*
 Hongyan Guo1*
- 1Department of Obstetrics and Gynecology, Peking University Third Hospital, Beijing, China
- 2Mass General Cancer Center, Massachusetts General Hospital, Harvard Medical School, MA, United States
Background: Malignant ascites in high-grade serous ovarian cancer (HGSOC) represent a fluid extension of the tumor microenvironment, embedding immune programs that may inform prognosis and treatment response. We investigated whether ascitic T-cell phenotypes, integrated with clinical variables, improve prediction of overall survival (OS), progression-free survival (PFS), progression-free interval (PFI), and platinum-based drug chemotherapy resistance (P-DCR).
Methods: We retrospectively analyzed 87 patients with FIGO III/IV HGSOC with treatment-naïve ascites treated at Peking University Third Hospital (May 2019–Mar 2024; median follow-up, 33 months). Ascites (>1,000 mL) underwent standardized processing and multiparametric flow cytometry to quantify T-cell subsets. To prevent information leakage, we used repeated nested cross-validation with event-stratified folds: inner folds performed endpoint-specific screening with Benjamini–Hochberg FDR control, redundancy reduction, and multicollinearity checks; clinical covariates were added by incremental contribution testing. Cox proportional hazards, Random Survival Forests (RSFs), and DeepSurv modeled survival endpoints; a random-forest classifier modeled P-DCR. Performance was summarized on outer folds [C-index for survival; receiver operating characteristic–area under the curve (ROC-AUC) for P-DCR]. Model interpretability used Shapley Additive Explanations (SHAP).
Results: Across endpoints, combined clinical + ascites features outperformed single-source features, with RSF consistently best. Outer-fold testing C-indices for RSF with combined features were 0.72 (OS), 0.70 (PFS), and 0.74 (PFI). The P-DCR classifier achieved a mean AUC of 0.69 with combined features (accuracy, 0.66; sensitivity, 0.70; specificity, 0.62). Feature-count sensitivity analyses showed performance gains plateauing at modest k (≈5–7). Kaplan–Meier curves derived from combined-feature risk scores demonstrated clear stratification. SHAP analyses indicated protective effects of poly(ADP-ribose) polymerase (PARP) inhibitor maintenance across endpoints, while ascitic T-cell subsets, including PD-1+CD57+CD4+ and CCR7-CD45RA+CD4+ populations, were repeatedly associated with higher risk; age contributed strongly to PFI.
Conclusions: Integrating ascitic immunophenotyping with clinical factors improves risk prediction in HGSOC, with RSF offering robust performance under rigorous, leakage-safe validation. Ascites-resident T-cell states provide complementary, reproducible prognostic signals for survival and platinum response, supporting their potential utility for patient stratification and hypothesis generation for immunomodulatory strategies.
Introduction
Epithelial ovarian cancer (EOC) is recognized as the most lethal gynecologic malignancy due to its frequent late-stage diagnosis (stages III/IV), abundant ascitic fluid, and extensive pelvic and abdominal metastases (1, 2). Cytoreductive surgery combined with chemotherapy remains the first-line treatment (3, 4). However, most patients face poor prognosis due to chemotherapy resistance. This underscores an urgent need to explore the composition of the tumor microenvironment (TME) to identify new strategies for immunotherapy (5). We all agree that postoperative survival and recurrence are closely associated with the diameter of residual tumor after surgery; the larger the postoperative residual lesion, the shorter the postoperative recurrence interval and the shorter the overall survival (OS) (27, 28). Ascitic fluid is considered a diluted form of the TME (6), containing tumor cell clusters, immune cells, and soluble cytokines. Solid tumors establish dynamic immunological niches shaped by local immune reprogramming, metabolic stress, and stromal remodeling. In ovarian cancer, ascitic fluid provides a unique window into this niche, reflecting immune subset shifts and their functional states. While tumor-infiltrating lymphocytes have been extensively studied, the niche-specific relevance of ascitic immune cells in shaping prognosis and therapy resistance remains poorly characterized (7). Previous studies have shown that the phenotype and frequency of T cells in ovarian cancer ascitic fluid fall between those in tumors and peripheral blood, reflecting the immune state of the TME (8–10). The immune characteristics of ascites also influence patients’ disease status, tumor size, and postoperative residual tumor status (R0/R1/R2 classification). Recent studies have demonstrated that immune cell subsets, including CD8+ T cells and Programmed Death 1 (PD-1)+ T cells, are closely associated with tumor progression and resistance to chemotherapy in patients with high-grade serous ovarian cancer (HGSOC). Zhang et al. (2023) (26) showed that high levels of CD8+ T-cell infiltration in ascitic fluid correlated with better survival outcomes in patients with HGSOC, while elevated PD-1+ T cells were linked to chemotherapy resistance. Therefore, investigating the impact of T-cell subsets in the tumor and ascitic fluid of patients with HGSOC on prognosis is of significant value.
The Cox proportional hazards (CPH) model is a classic method for survival analysis. However, its linear and proportional hazard assumptions limit its ability to handle complex, nonlinear, and dynamic relationships (11), especially in multimodal, high-dimensional data (12–15). In recent years, deep learning methods and machine learning models [such as Random Survival Forests (RSFs)] have provided new solutions for survival analysis. Through neural network architectures, deep survival models can capture complex nonlinear relationships, integrate multimodal data, and improve predictive performance (16–18). Furthermore, machine learning methods have been widely applied in related studies, enabling the extraction of latent patterns and rules in data and the effective selection and modeling of various features (19).
Moreover, with the incorporation of interpretability tools (20) such as Shapley Additive Explanations (SHAP), deep learning can not only reveal the impact of key features but also enhance the clinical applicability of the models. RSF, in particular, naturally inherits interpretability from its tree-based structure, allowing researchers to assess how individual features (e.g., ascitic immune cell characteristics) influence survival outcomes and treatment resistance through aggregated tree predictions.
In this study, we developed a deep survival model for predicting OS and progression-free survival (PFS) while utilizing a machine learning model to evaluate platinum-based drug chemotherapy resistance (P-DCR). By incorporating interpretability tools such as SHAP (21–23), we analyzed the associations between ascitic immune cell characteristics and HGSOC patient survival and P-DCR. This provides theoretical support and practical guidance for optimizing individualized treatment strategies.
Methods
Data source
This study included patients with HGSOC at FIGO stage III/IV with ascites. These patients were newly diagnosed and completed first-line treatment at Peking University Third Hospital from May 2019 to March 2024. Patients with other ovarian diseases, infectious/blood/kidney/liver diseases, other tumors, prior anti-tumor treatments (surgery, chemotherapy, radiotherapy, and immunotherapy) within 5 years, or lost to follow-up were excluded. Patients who had received anti-tumor treatments such as surgery, chemotherapy, radiotherapy, and immunotherapy within 5 years before enrollment, as well as those who were lost to follow-up during the follow-up process, were also excluded. Finally, 87 patients met the criteria and were enrolled. The basic characteristics of all patients with HGSOC were collected, including age, stage, lymph node metastasis (LNM), surgical method, surgical satisfaction, treatment regimen, treatment efficacy, chemotherapy sensitivity, and maintenance treatment. OS refers to the time from diagnosis to death from any cause, with patients remaining alive at the end of follow-up censored; PFS is the time from diagnosis to the first occurrence of disease progression or death, with patients having no such events censored at the end of follow-up; and PFI (post-chemotherapy progression-free interval) denotes the time from the end of initial treatment to the occurrence of tumor progression. The results of resection surgery were defined as no grossly visible residual tumor (R0), residual tumor lesions ≤ 1 cm (R1), or residual tumor lesions > 1 cm (R2). R1 and R2 were collectively referred to as NR0. The best efficacy of first-line treatment, complete remission (CR), was defined as normal serum CA125 level, normal physical examination, and no signs of recurrence on computed tomography (CT) scan. Patients who did not achieve CR, including those with partial remission, stable disease, and progressive disease, were generally referred to as non-CR (NCR). PFI (in months) referred to the time from the end of first-line treatment to the determination of cancer progression (including CA125 elevation and imaging evidence) by clinicians. Patients with PFI < 6 months were called platinum-resistant to chemotherapy, and patients with PFI > 6 months were called platinum-sensitive to chemotherapy. PFS referred to the time from diagnosis to recurrence (in months). OS referred to the time from diagnosis to death (in months). The follow-up ended on March 2024. The median follow-up time was 33.00 (6.00–56.00) months.
Sample collection, processing, and flow cytometry detection
To ensure flow cytometry accuracy, immune cell detection was only performed on ascites with a volume > 1,000 mL. Ascites samples were collected during the surgical procedure. All samples were processed within 1 h after collection. The ascites was centrifuged at 2,000 g for 10 min at 4°C. Density gradient centrifugation was performed using Ficoll (1.077, GE Healthcare, USA) and phosphate-buffered saline (PBS) in a ratio of 1:1.5 to obtain mononuclear cells. The cells were collected and washed twice with PBS, followed by centrifugation at 500 g for 5 min. Then, the cells were manually counted and temporarily stored at 0°C to complete staining as soon as possible. At room temperature, the cells (1 × 10⁶) were stained with specific monoclonal antibodies (mAbs) in the dark for 15 min. Then, the cells were fixed with 1% paraformaldehyde. Flow cytometry analysis was performed using a CytoFLEX S (Beckman Coulter). The data were analyzed using Cytoexpert v. 2.3 software.
Data preprocessing
To prevent information leakage, feature screening was conducted exclusively within training folds of a nested cross-validation framework, with held-out folds used only for evaluation. Clinically plausible covariates were pre-specified and, where alternatives existed, adjudicated by incremental contribution testing within the inner folds; variables showing consistent improvement in discrimination were retained. Immune-cell candidates were screened per inner fold using the following: (i) endpoint-appropriate univariate tests—CPH for OS/PFS/PFI and Mann–Whitney U test for PDCR—with Benjamini–Hochberg false discovery rate (FDR) adjustment [reporting hazard ratios (HRs) with 95% confidence intervals (CIs)]; (ii) redundancy reduction by pairwise correlation; and (iii) multicollinearity assessment via variance inflation factors (VIFs). Correlation heatmaps and VIF summaries are provided in the Supplementary Materials.
Feature group selection for survival outcomes
After the first-stage nested screening, an endpoint-specific immune feature subset was fixed as the baseline model. Clinical covariates were then evaluated by incremental contribution testing under the same nested cross-validation framework: within inner folds, each clinical variable was added one at a time to the baseline immune set and then cumulatively in a pre-specified order, with models refit at each step and performance compared on held-out data. A covariate was retained if it produced a consistent improvement in discrimination (C-index) across inner folds; the minimal clinical augmentation achieving the highest mean performance defined the final feature group for that endpoint. Outer-fold results were summarized as mean C-index.
Construction and training of the deep survival model and random forest P-DCR prediction model
CPH, RSF, and DeepSurv were evaluated for survival outcomes, and a random-forest classifier was used for PDCR. All models were trained under a repeated nested cross-validation scheme with stratified sampling based on survival outcomes (event vs. non-event) to mitigate overfitting in a small, high-dimensional setting and balance the event ratio across folds. Feature screening and hyperparameter tuning were confined to inner folds, and outer folds were reserved for evaluation. The CPH model was fitted by ridge-penalized partial likelihood (λ = 0.10) under proportional-hazards assumptions, with multicollinearity addressed during inner-fold screening. The RSF configuration (Figure 1B) employed log-rank splitting with 200 trees, max_depth = 8, and min_samples_leaf = 5 after inner-loop optimization. The DeepSurv architecture (Figure 1A) consisted of a compact multilayer perceptron with two hidden layers (64, 32; ReLU) producing a single linear log-risk output and trained by the negative Cox partial likelihood (i.e., not direct survival-time prediction); optimization used Adam with Reduce-on-Plateau scheduling (initial learning rate 1 × 10-³), dropout = 0.20, weight decay = 1 × 10⁻⁴, batch size = 16, and early stopping based on inner-fold validation loss. For PDCR, a random-forest classifier (Figure 1C) with 300 trees, max_depth = 8, min_samples_leaf = 3, and class_weight = “balanced” was adopted to address class imbalance. Performance across outer folds is summarized as mean ± SD of C-index (survival) and area under the curve (AUC) (PDCR) with bootstrap 95% CIs; precision–recall curves, confusion matrices, and paired between-model comparisons are reported in Results. To characterize model behavior and potential overfitting, training-versus-validation learning curves were recorded (partial-likelihood/C-index trajectories for CPH and DeepSurv; out-of-bag plus inner-fold validation curves for RSF and the PDCR classifier) and used to verify optimization convergence and quantify the train–validation generalization gap.
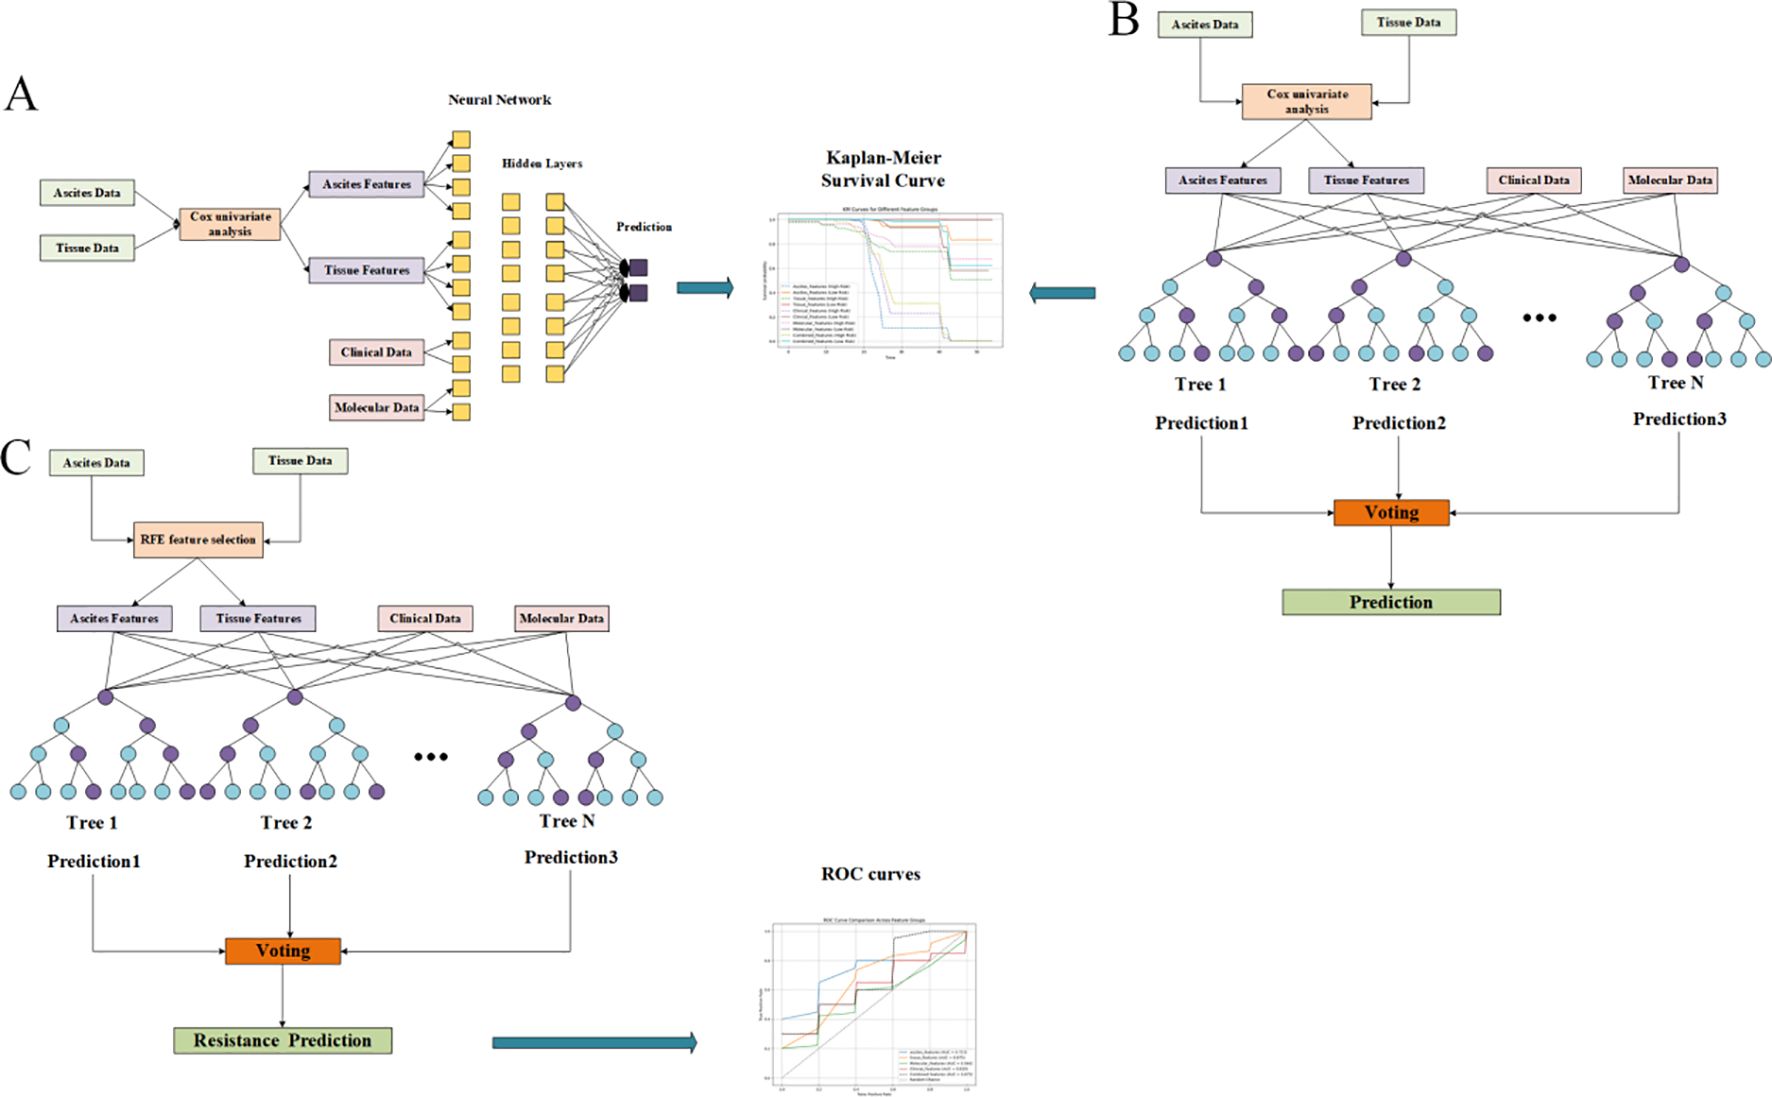
Figure 1. Feature screening diagrams (Display mode 1). (A) Overall survival (OS) related to ascites indicators. (B) Progression-free survival (PFS) of ascites indicators. (C) Progression-free interval (PFI) related to ascites indicators.
Interpretability analysis
Continuous variables were summarized as mean ± SD; 95% CIs were obtained via percentile bootstrap. Distributional assumptions were assessed with the Shapiro–Wilk test. Two-group comparisons used the Wilcoxon rank-sum test. For survival endpoints, univariate associations were estimated with CPH models (robust variance), reporting HRs with 95% CIs; multiplicity across immune markers was controlled using the Benjamini–Hochberg FDR, with adjusted q-values tabulated. Redundancy and multicollinearity were examined using Spearman pairwise correlation matrices/heatmaps and VIFs, with details provided in the Supplementary Materials. Predictive performance was estimated using repeated nested cross-validation with event-stratified folds to preclude information leakage; survival models were evaluated by Harrell’s concordance index and classification models by ROC AUC and average precision. Outer-fold metrics are presented as mean ± SD with bootstrap 95% CIs.
Results
We enrolled 87 patients, of whom 45 (51.72%) were in stage III and 42 (48.28%) were in stage IV. The average preoperative serum CA125 of the above patients was 1,136 U/mL. The median age of the patients was 56 years. A total of 41 patients received primary debulking surgery (PDS), and 46 patients received ascites biopsy/biopsy surgery and two to four cycles of NACT, followed by IDS. R0 was achieved in 48 patients, and NR0 was achieved in 39 patients. All patients received chemotherapy after debulking surgery, and CR was achieved in 78 patients (89.66%). After first-line treatment, 51 (58.62%) patients were treated with poly(ADP-ribose polymerase) inhibitors (PARPi). By the end of the follow-up, 46 (52.87%) patients had relapsed, of which 17 were chemotherapy-resistant relapses and 29 were chemotherapy-sensitive relapses. A total of 23 patients died after relapse. The clinical characteristics of the included patients are summarized in Table 1.
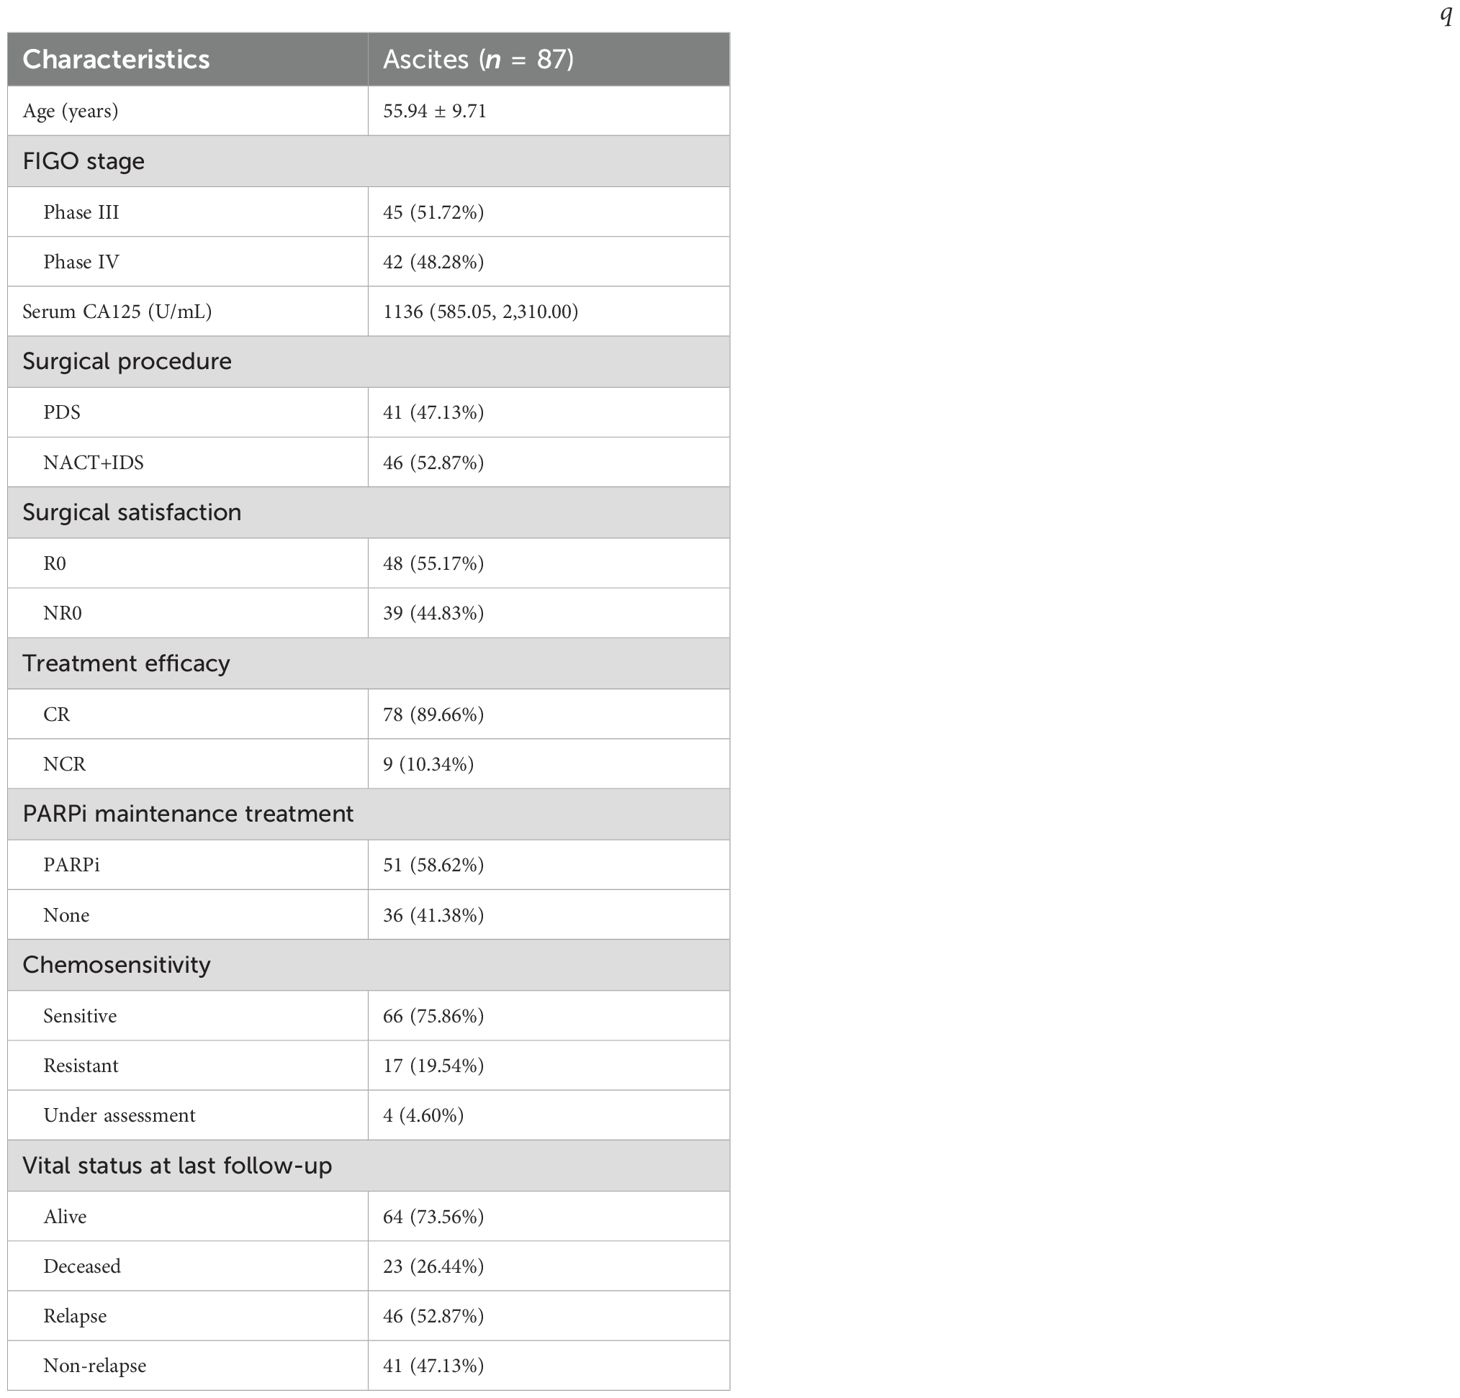
Table 1. Characteristics of the enrolled patients.
Statistical analysis results of ascites characteristics
Within the nested, within-fold screening framework, several ascites-derived immune phenotypes showed reproducible associations with survival endpoints after Benjamini–Hochberg FDR control. Screening stability across outer folds is summarized by selection frequency (Figures 2A–D; A = OS, B = PFS, C = PFI, and D = PDCR), and evidence–stability concordance is visualized as selection frequency vs. −log10(median q) (Figures 3A–D), with dashed lines denoting the a priori consensus thresholds (frequency ≥ 0.50; median q ≤ 0.25). Features in the upper-right quadrant and explicitly labeled in Figure 4 constitute the consensus set carried forward to multivariable modeling.
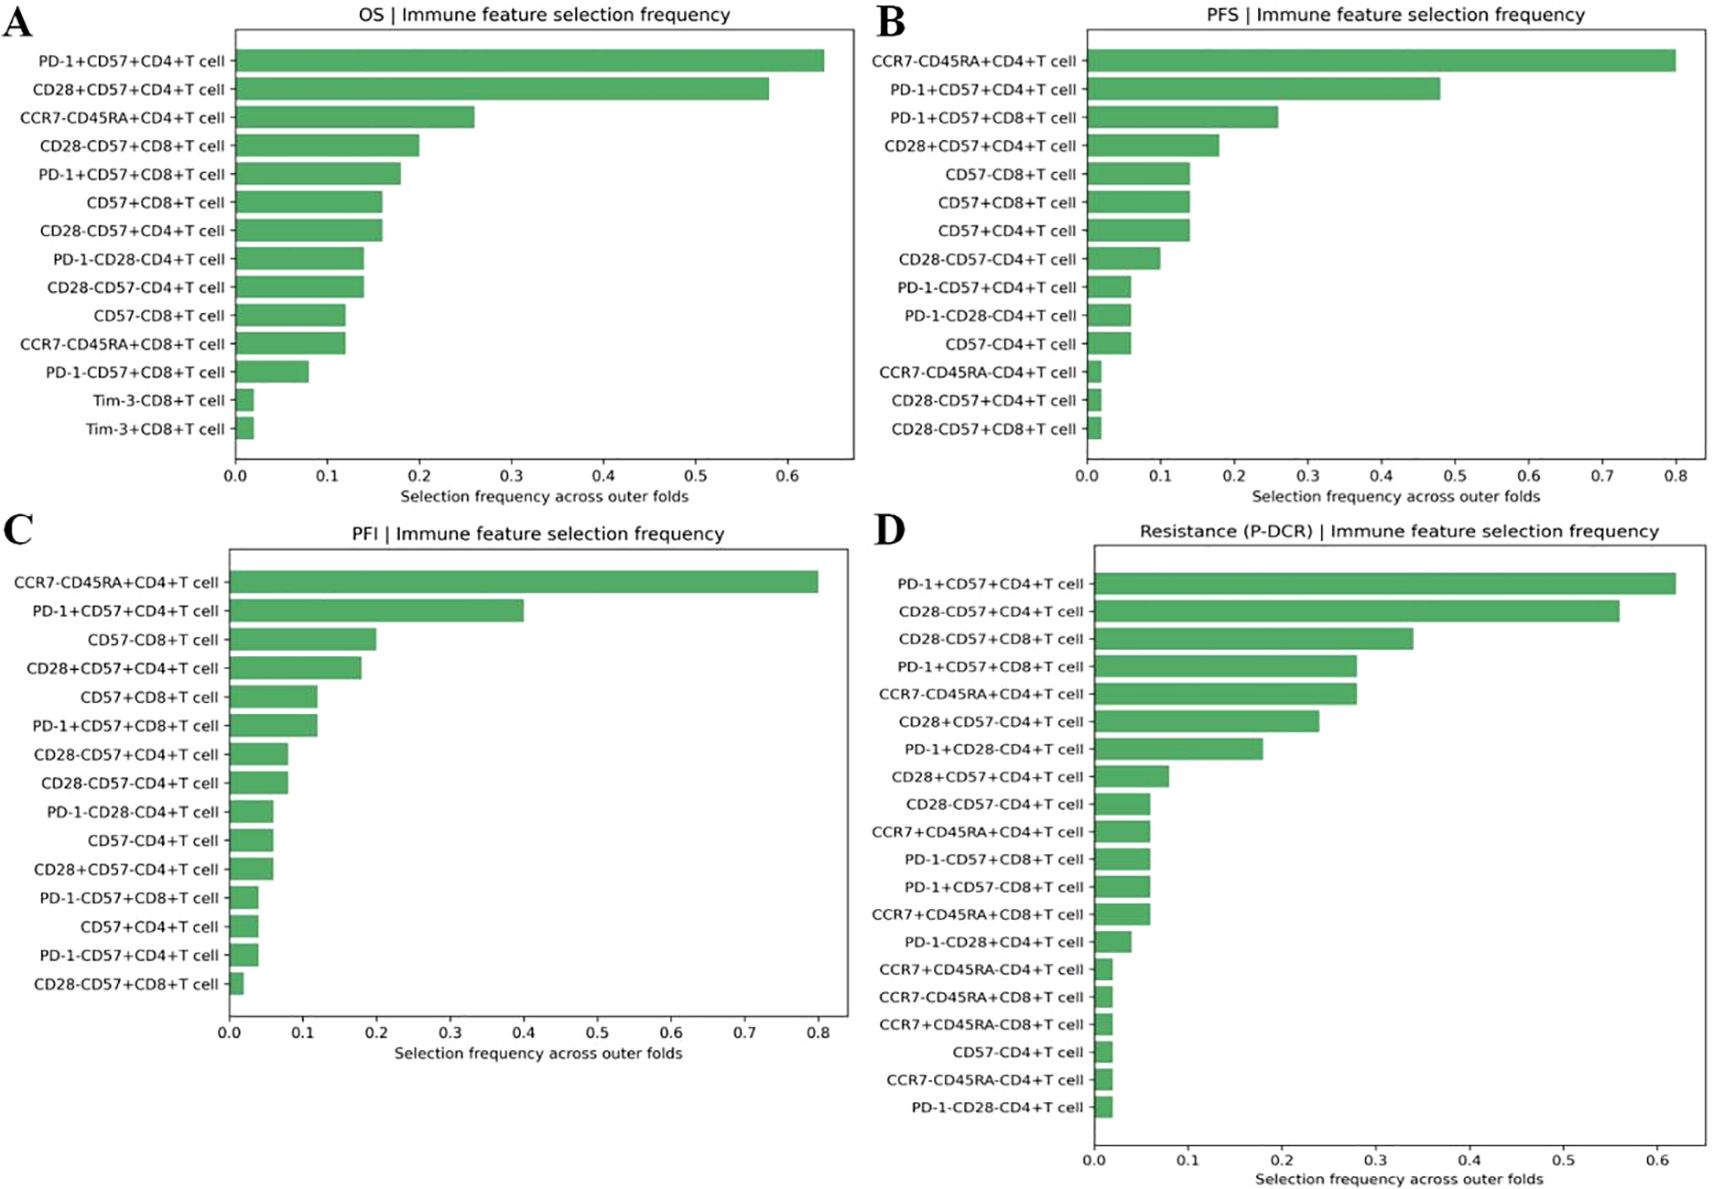
Figure 2. (A–D) Selection frequency of ascites immune features across outer folds: selection frequency bar plots for immune features associated with A: OS, B: PFS, C: PFI, and D: PDCR.
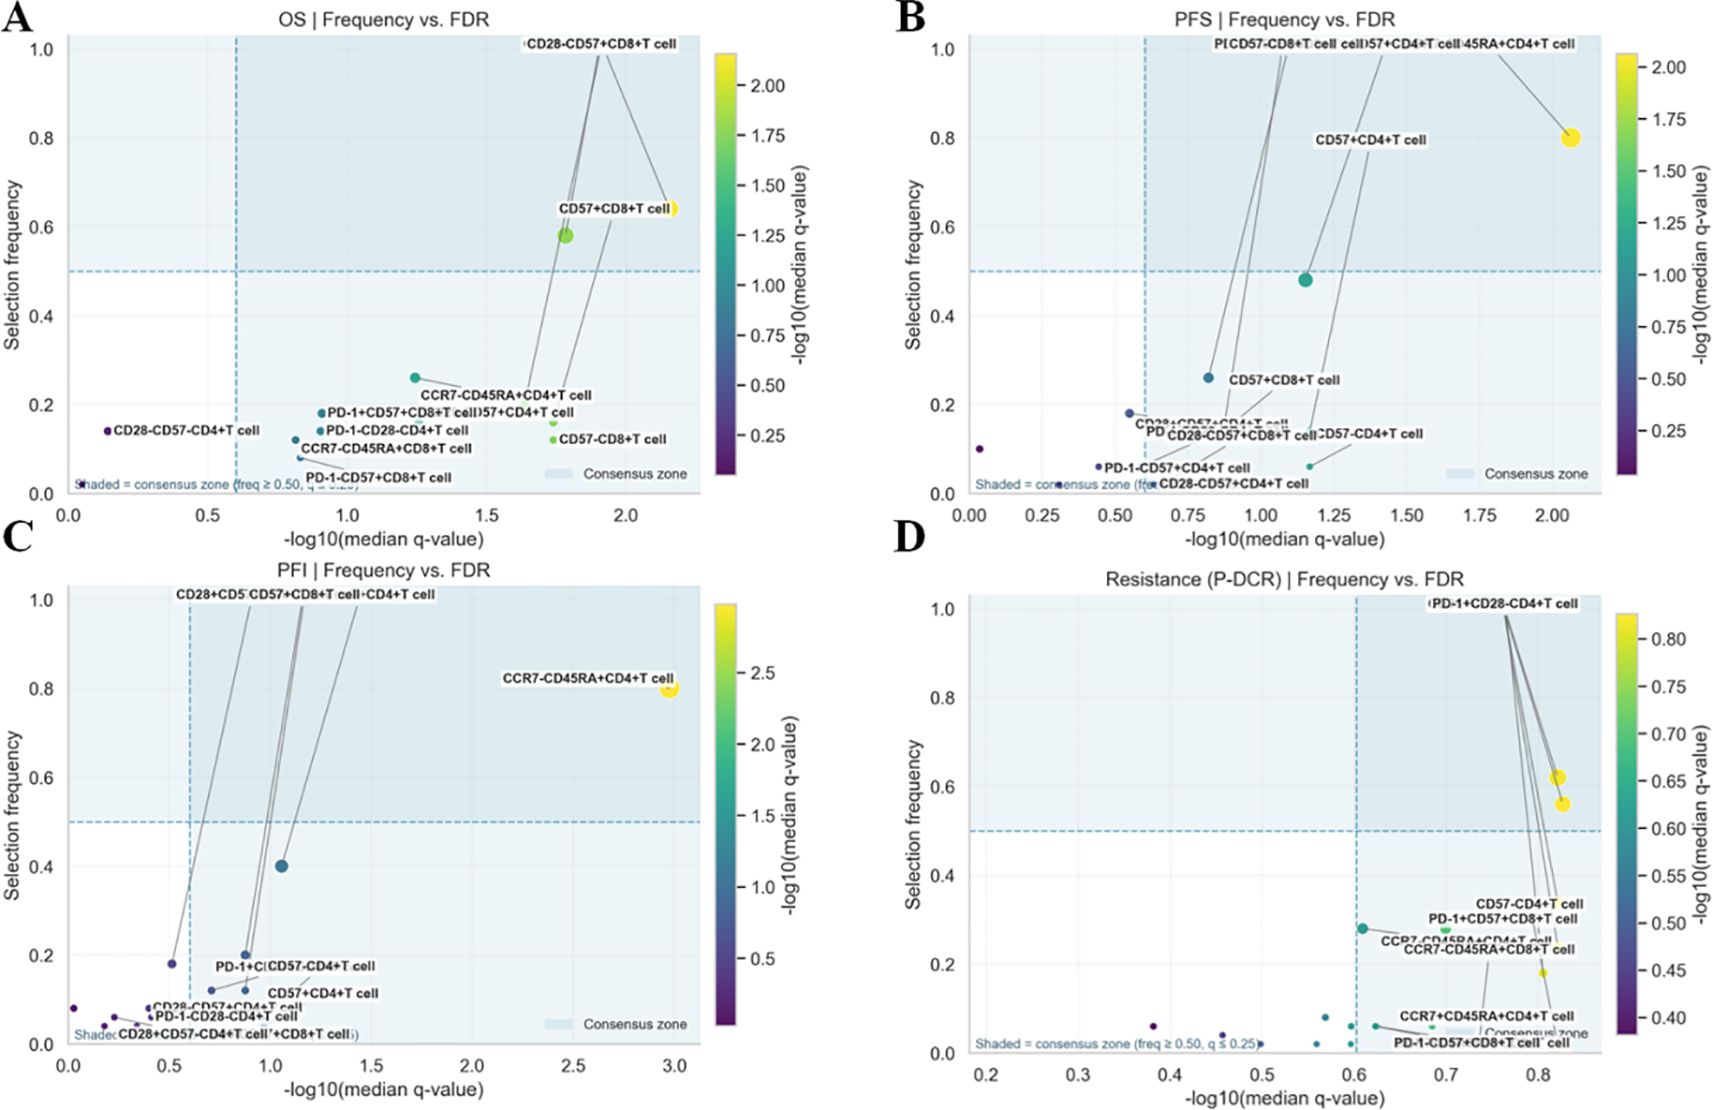
Figure 3. (A–D) Evidence–stability plots for ascites immune features: frequency vs. −log10(median q) scatter plots for each endpoint (A: OS, B: PFS, C: PFI, and D: PDCR).
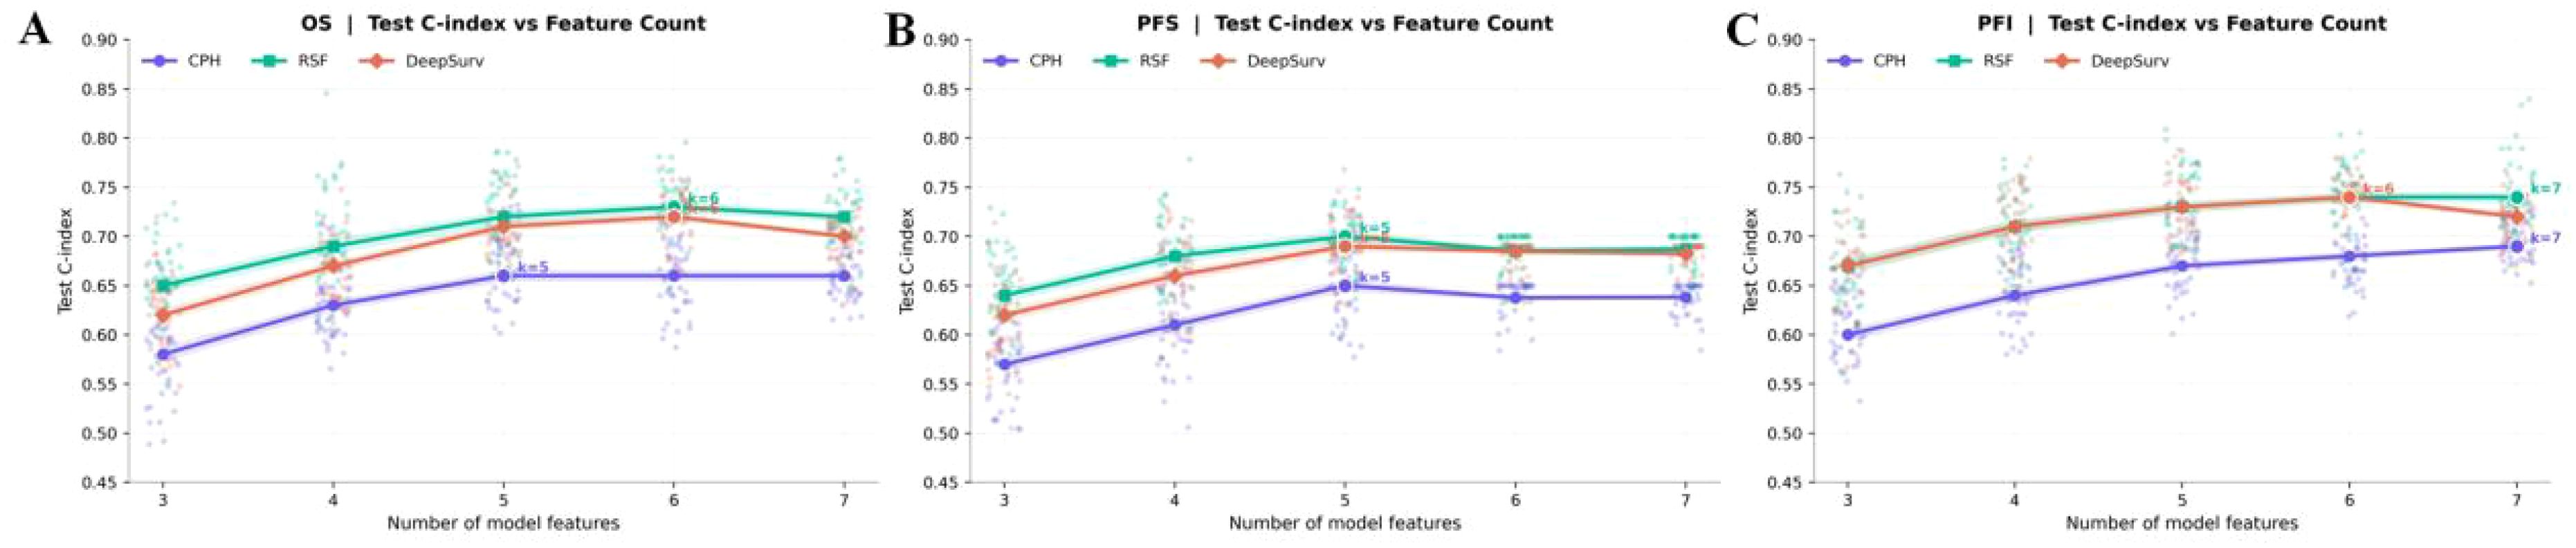
Figure 4. (A–C) Feature count sensitivity for survival outcomes (A: OS, B: PFS, C: PFI). Lines show test C-index means for CPH, RSF, and DeepSurv across k = 3–7.
Consistent patterns emerged across endpoints and are enumerated in Table 2. For OS, PD-1+CD57+CD4+ T cells were stably retained (frequency = 0.64) with a univariate Cox estimate HR = 2.12 (95% CI, 1.34–3.36); CD28+CD57+CD4+ T cells also showed stability (0.58) with HR = 1.83 (1.16–2.88), while CD28-CD57+CD8+ T cells appeared less frequently [0.20; HR = 1.61 (1.05–2.46)]. For PFS and PFI, CCR7-CD45RA+CD4+ T cells led the rankings (both frequency = 0.80) with HR = 1.96 (1.28–3.00) for PFS and HR = 2.24 (1.50–3.34) for PFI; PD-1+CD57+CD4+ T cells showed intermediate stability (PFS, 0.48; PFI, 0.40) with effect sizes consistent with risk increase (Table 2). For the PDCR endpoint (platinum resistance vs. sensitivity), discriminatory phenotypes are summarized by selection frequency and median q (no HR is reported because PDCR is binary); PD-1+CD57+CD4+ T cells (0.62), CD28-CD57+CD4+ T cells (0.56), and CD28-CD57+CD8+ T cells (0.34) ranked highest (Figure 2D, Table 2). Diagnostic assessments addressing redundancy and multicollinearity are provided in the Supplementary Materials (Supplementary Figures S1–S3).
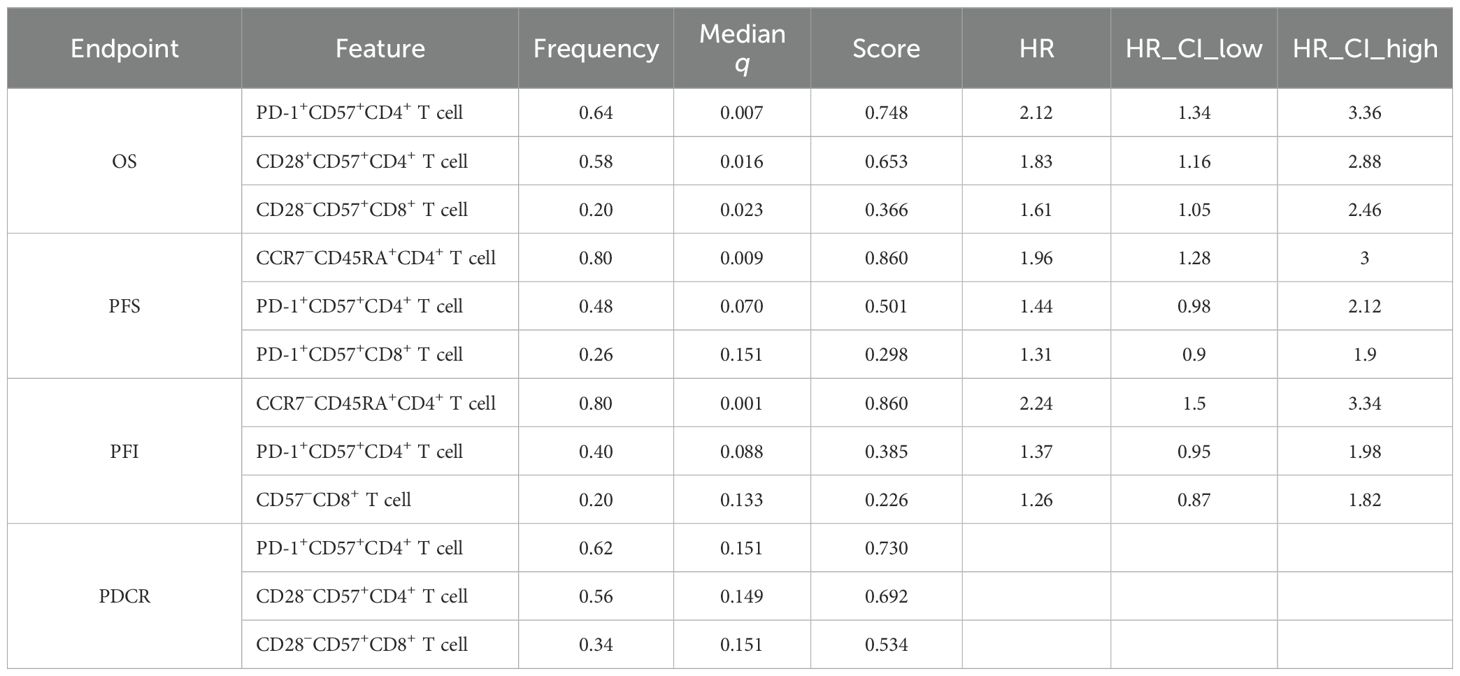
Table 2. Ascites immune phenotypes prioritized by nested, within-fold screening.
Results of the feature group selection for survival outcomes
Shown in Figure 4; Table 3, across OS, PFS, and PFI, test C-index rose from smaller sets (k ≈3–4) and then plateaued; the optimal k varied by endpoint. For OS, RSF peaked at k = 6 (0.73), DeepSurv at k = 6 (0.72), and CPH at k = 5 (0.66). For PFI, RSF and DeepSurv co-peaked at k = 6 (0.74), while CPH peaked at k = 7 (0.69). For PFS, all models peaked at k = 5 (RSF 0.70; DeepSurv 0.69; CPH 0.65). Final clinical features: OS—age, stage, and PARPi; PFI—age, stage, serum CA125, and PARPi; PFS—stage and PARPi.
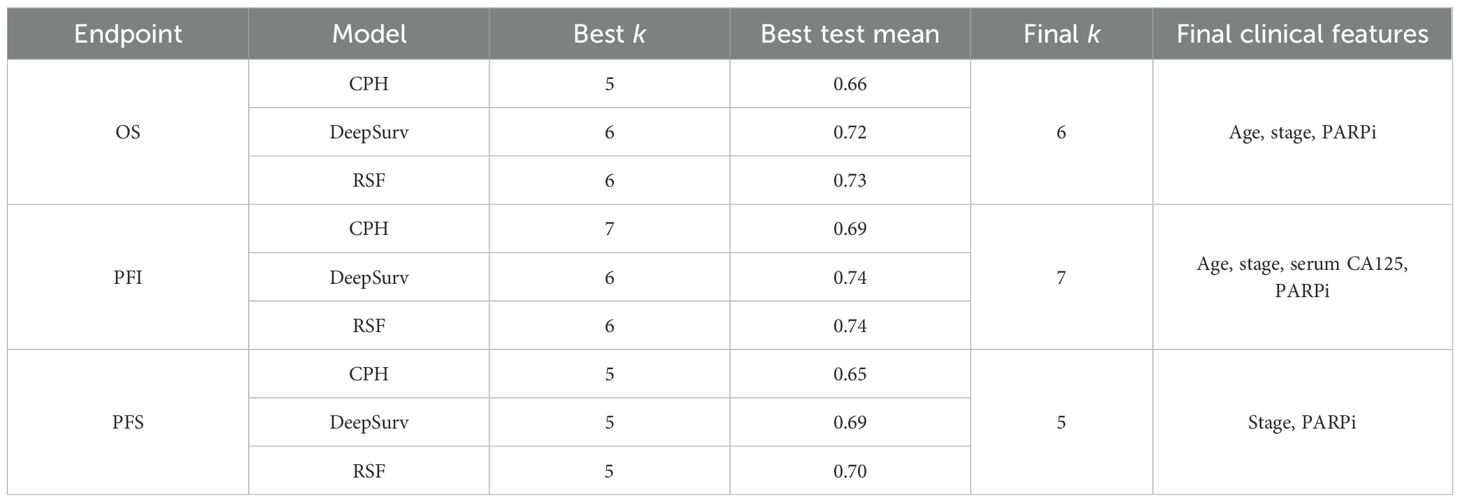
Table 3. Best k by model and endpoint with final clinical features.
Results of the survival models
After feature selection, three survival models—CPH, RSF, and DeepSurv—were established to predict OS, PFS, and PFI using three feature groups: Clinical_features (clinical-only), Ascites_features (ascites-only), and Combined_features (clinical-ascites combined); model performance was quantified by the concordance index, with detailed results in Table 4. For OS prediction, the Combined_features group outperformed the two single-feature groups across all models, and RSF exhibited the best performance: its training and testing C-indexes for Combined_features were 0.74 ± 0.04 and 0.72 ± 0.05, respectively, surpassing CPH (training: 0.68 ± 0.05; testing: 0.66 ± 0.06) and DeepSurv (training: 0.75 ± 0.03; testing: 0.70 ± 0.06), while in single-feature groups, RSF also led (Clinical_features: testing C-index 0.64 ± 0.10; Ascites_features: 0.69 ± 0.09) over CPH and DeepSurv. A similar trend was observed for PFS: the Combined_features group improved performance for all models, with RSF achieving the highest testing C-index (0.70 ± 0.04) in this group (training: 0.73 ± 0.04), outperforming CPH (testing: 0.65 ± 0.05) and DeepSurv (testing: 0.69 ± 0.06), and RSF also maintained advantages in single-feature groups (Clinical_features: testing 0.64 ± 0.11; Ascites_features: 0.67 ± 0.08). For PFI prediction, the Combined_features group remained superior, and RSF again delivered the highest testing C-index (0.74 ± 0.06) among all model-feature combinations (training: 0.76 ± 0.05), exceeding CPH (testing: 0.69 ± 0.06) and DeepSurv (testing: 0.72 ± 0.05); in single-feature groups, RSF’s testing C-indexes were 0.69 ± 0.09 (Clinical_features) and 0.72 ± 0.09 (Ascites_features), which were higher than those of CPH and DeepSurv. Collectively, the Combined_features group significantly enhanced predictive performance across all three endpoints compared to single-feature groups, and RSF consistently outperformed CPH and DeepSurv in the testing set. The training and validation loss curve are shown in the Supplementary Materials (Supplementary Figure S4).
Kaplan–Meier curves (Figure 5) visually validated these findings, showing distinct survival stratification by risk groups derived from the combined feature models. Despite these improvements, DeepSurv consistently underperformed compared to RSF across all endpoints (Table 4), highlighting the latter’s superior ability to handle complex feature interactions.
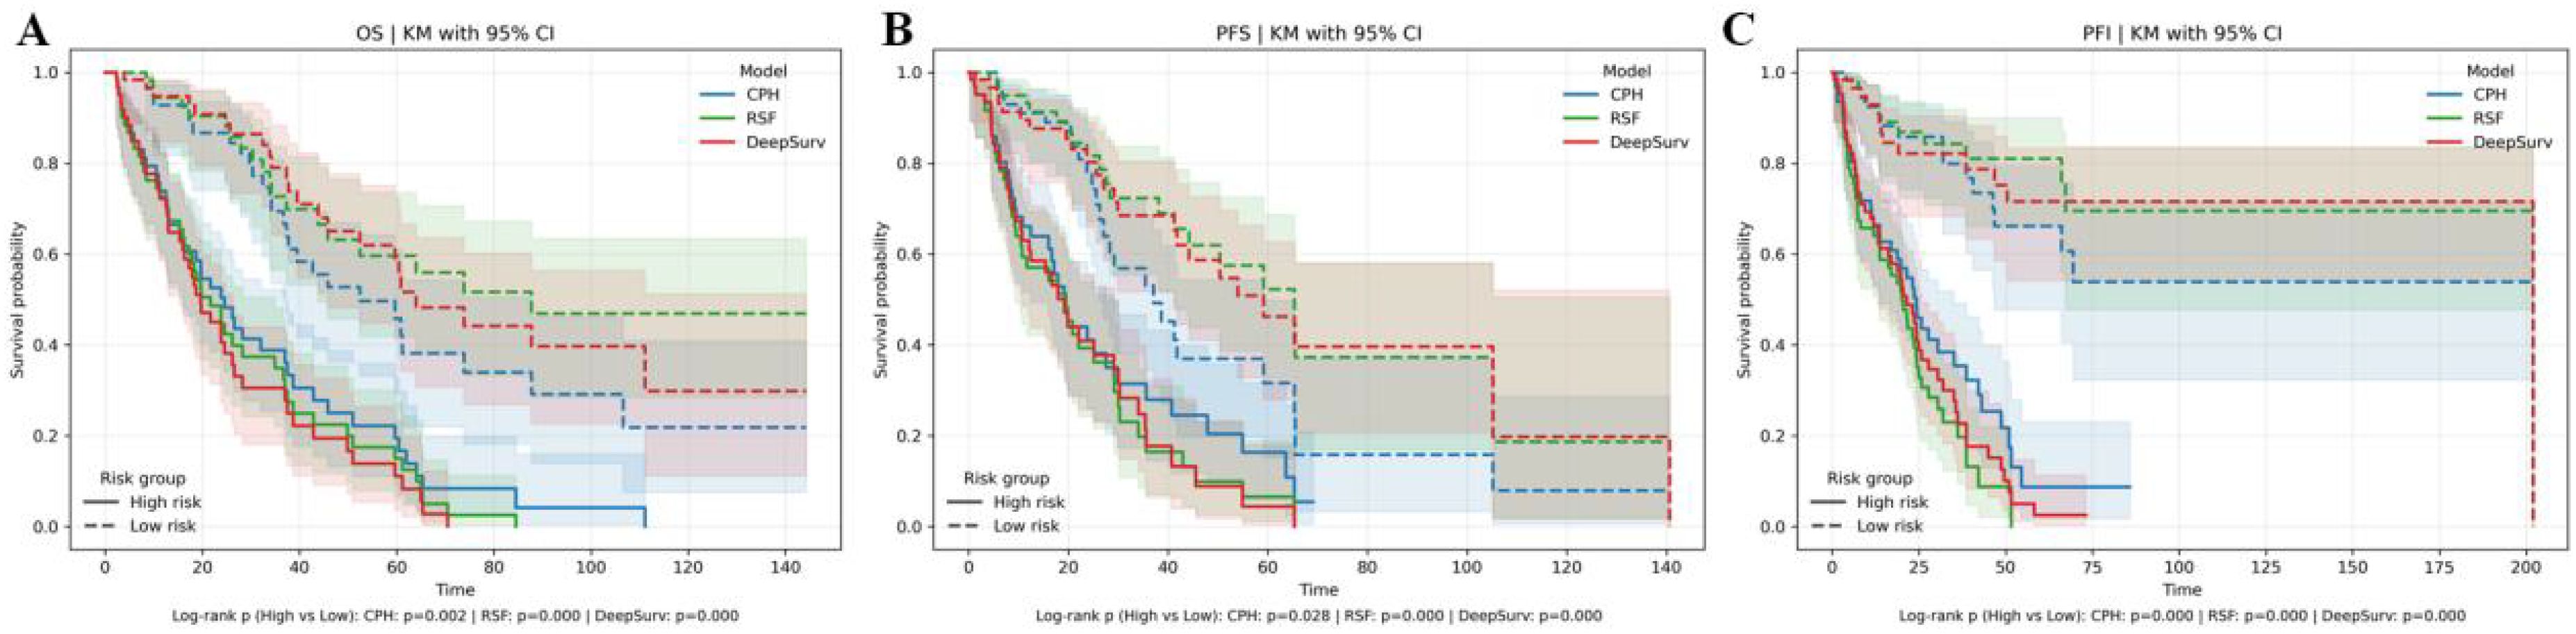
Figure 5. Kaplan–Meier (KM) curves for three models. (A) KM curves depicting overall survival (OS). (B) KM curves representing progression-free survival (PFS). (C) KM curves illustrating progression-free interval (PFI).
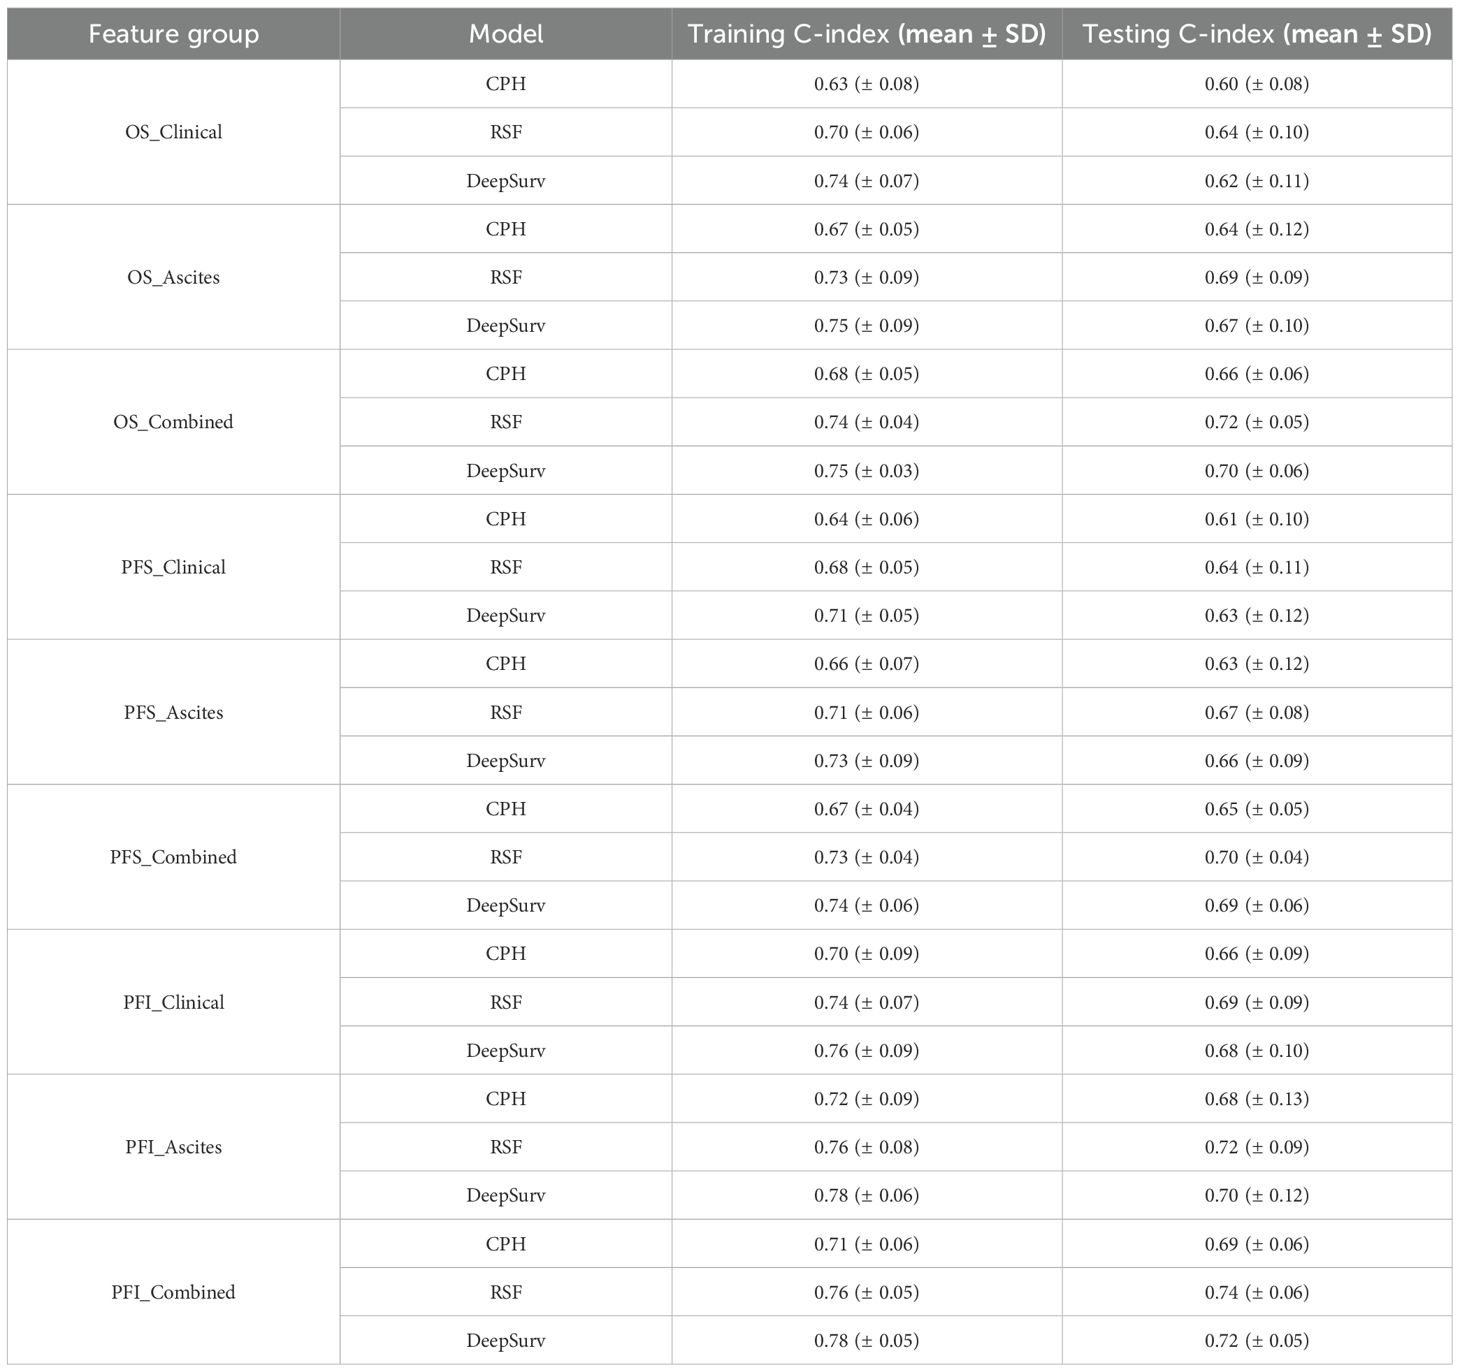
Table 4. Performance comparison between models and feature groups.
P-DCR prediction results
In P-DCR prediction (Table 5), models were constructed based on the selected feature set. Classification performance metrics were compared using ROC curves (Figure 6). Table 5 shows the performance metrics for different feature groups. The Ascites_features group had a mean AUC of 0.64 (± 0.05), a mean accuracy of 0.63 (± 0.07), a mean sensitivity of 0.54 (± 0.09), and a mean specificity of 0.71 (± 0.11). The Clinical_features group had a mean AUC of 0.60 (± 0.06), a mean accuracy of 0.62 (± 0.08), a mean sensitivity of 0.52 (± 0.10), and a mean specificity of 0.69 (± 0.12). The Combined_features group outperformed the others, with a mean AUC of 0.69 (± 0.04), a mean accuracy of 0.66 (± 0.09), a mean sensitivity of 0.70 (± 0.13), and a mean specificity of 0.62 (± 0.14). Training and validation loss are presented in the Supplementary Materials (Supplementary Figure S5).
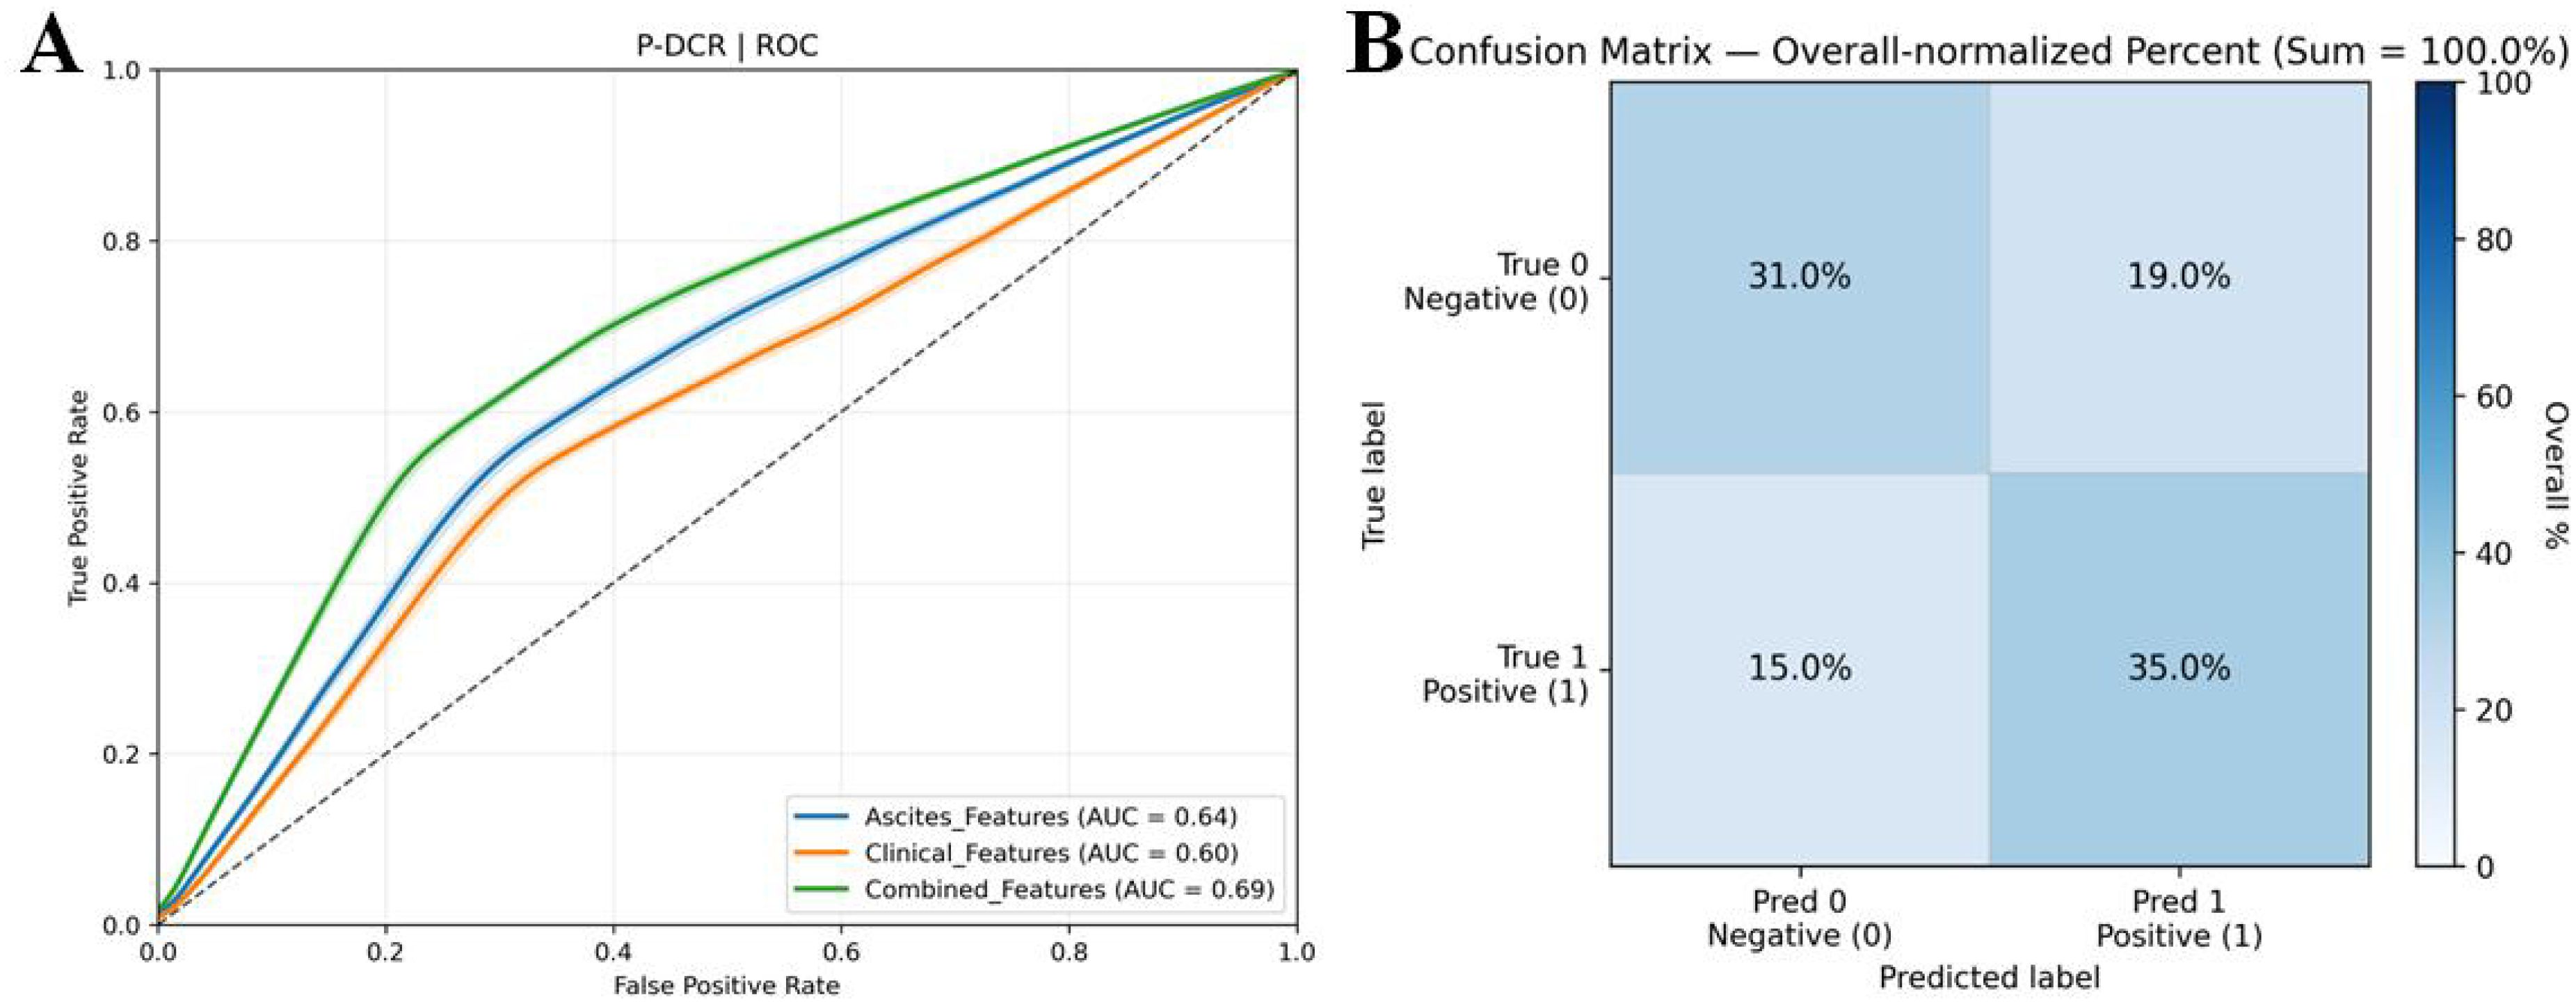
Figure 6. (A) ROC curves for comparison of multiple P-DCR prediction models. ROC curves illustrating the discriminative performance of diverse models in predicting P-DCR. (B) Confusion matrix derived from 3,000 bootstrap iterations, showing the trade-off between true positive rate and false positive rate for model evaluation.
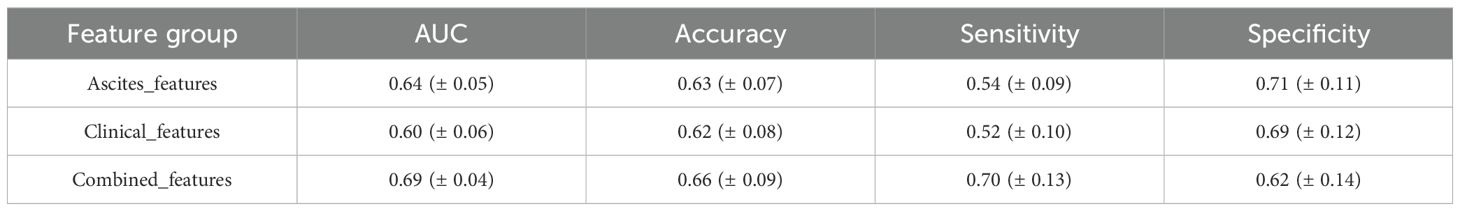
Table 5. The performance for P-DCR prediction with different feature groups.
Feature interpretability results
Figure 7; Tables 6–9 showcase the feature contributions and their respective importance rankings within diverse models, as determined by SHAP analysis. A positive SHAP value indicates a higher likelihood of poor prognosis and platinum resistance to chemotherapy, while a negative SHAP value indicates a better prognosis and platinum sensitivity to chemotherapy. The influence of key features on predictive outcomes was not uniform across all models.
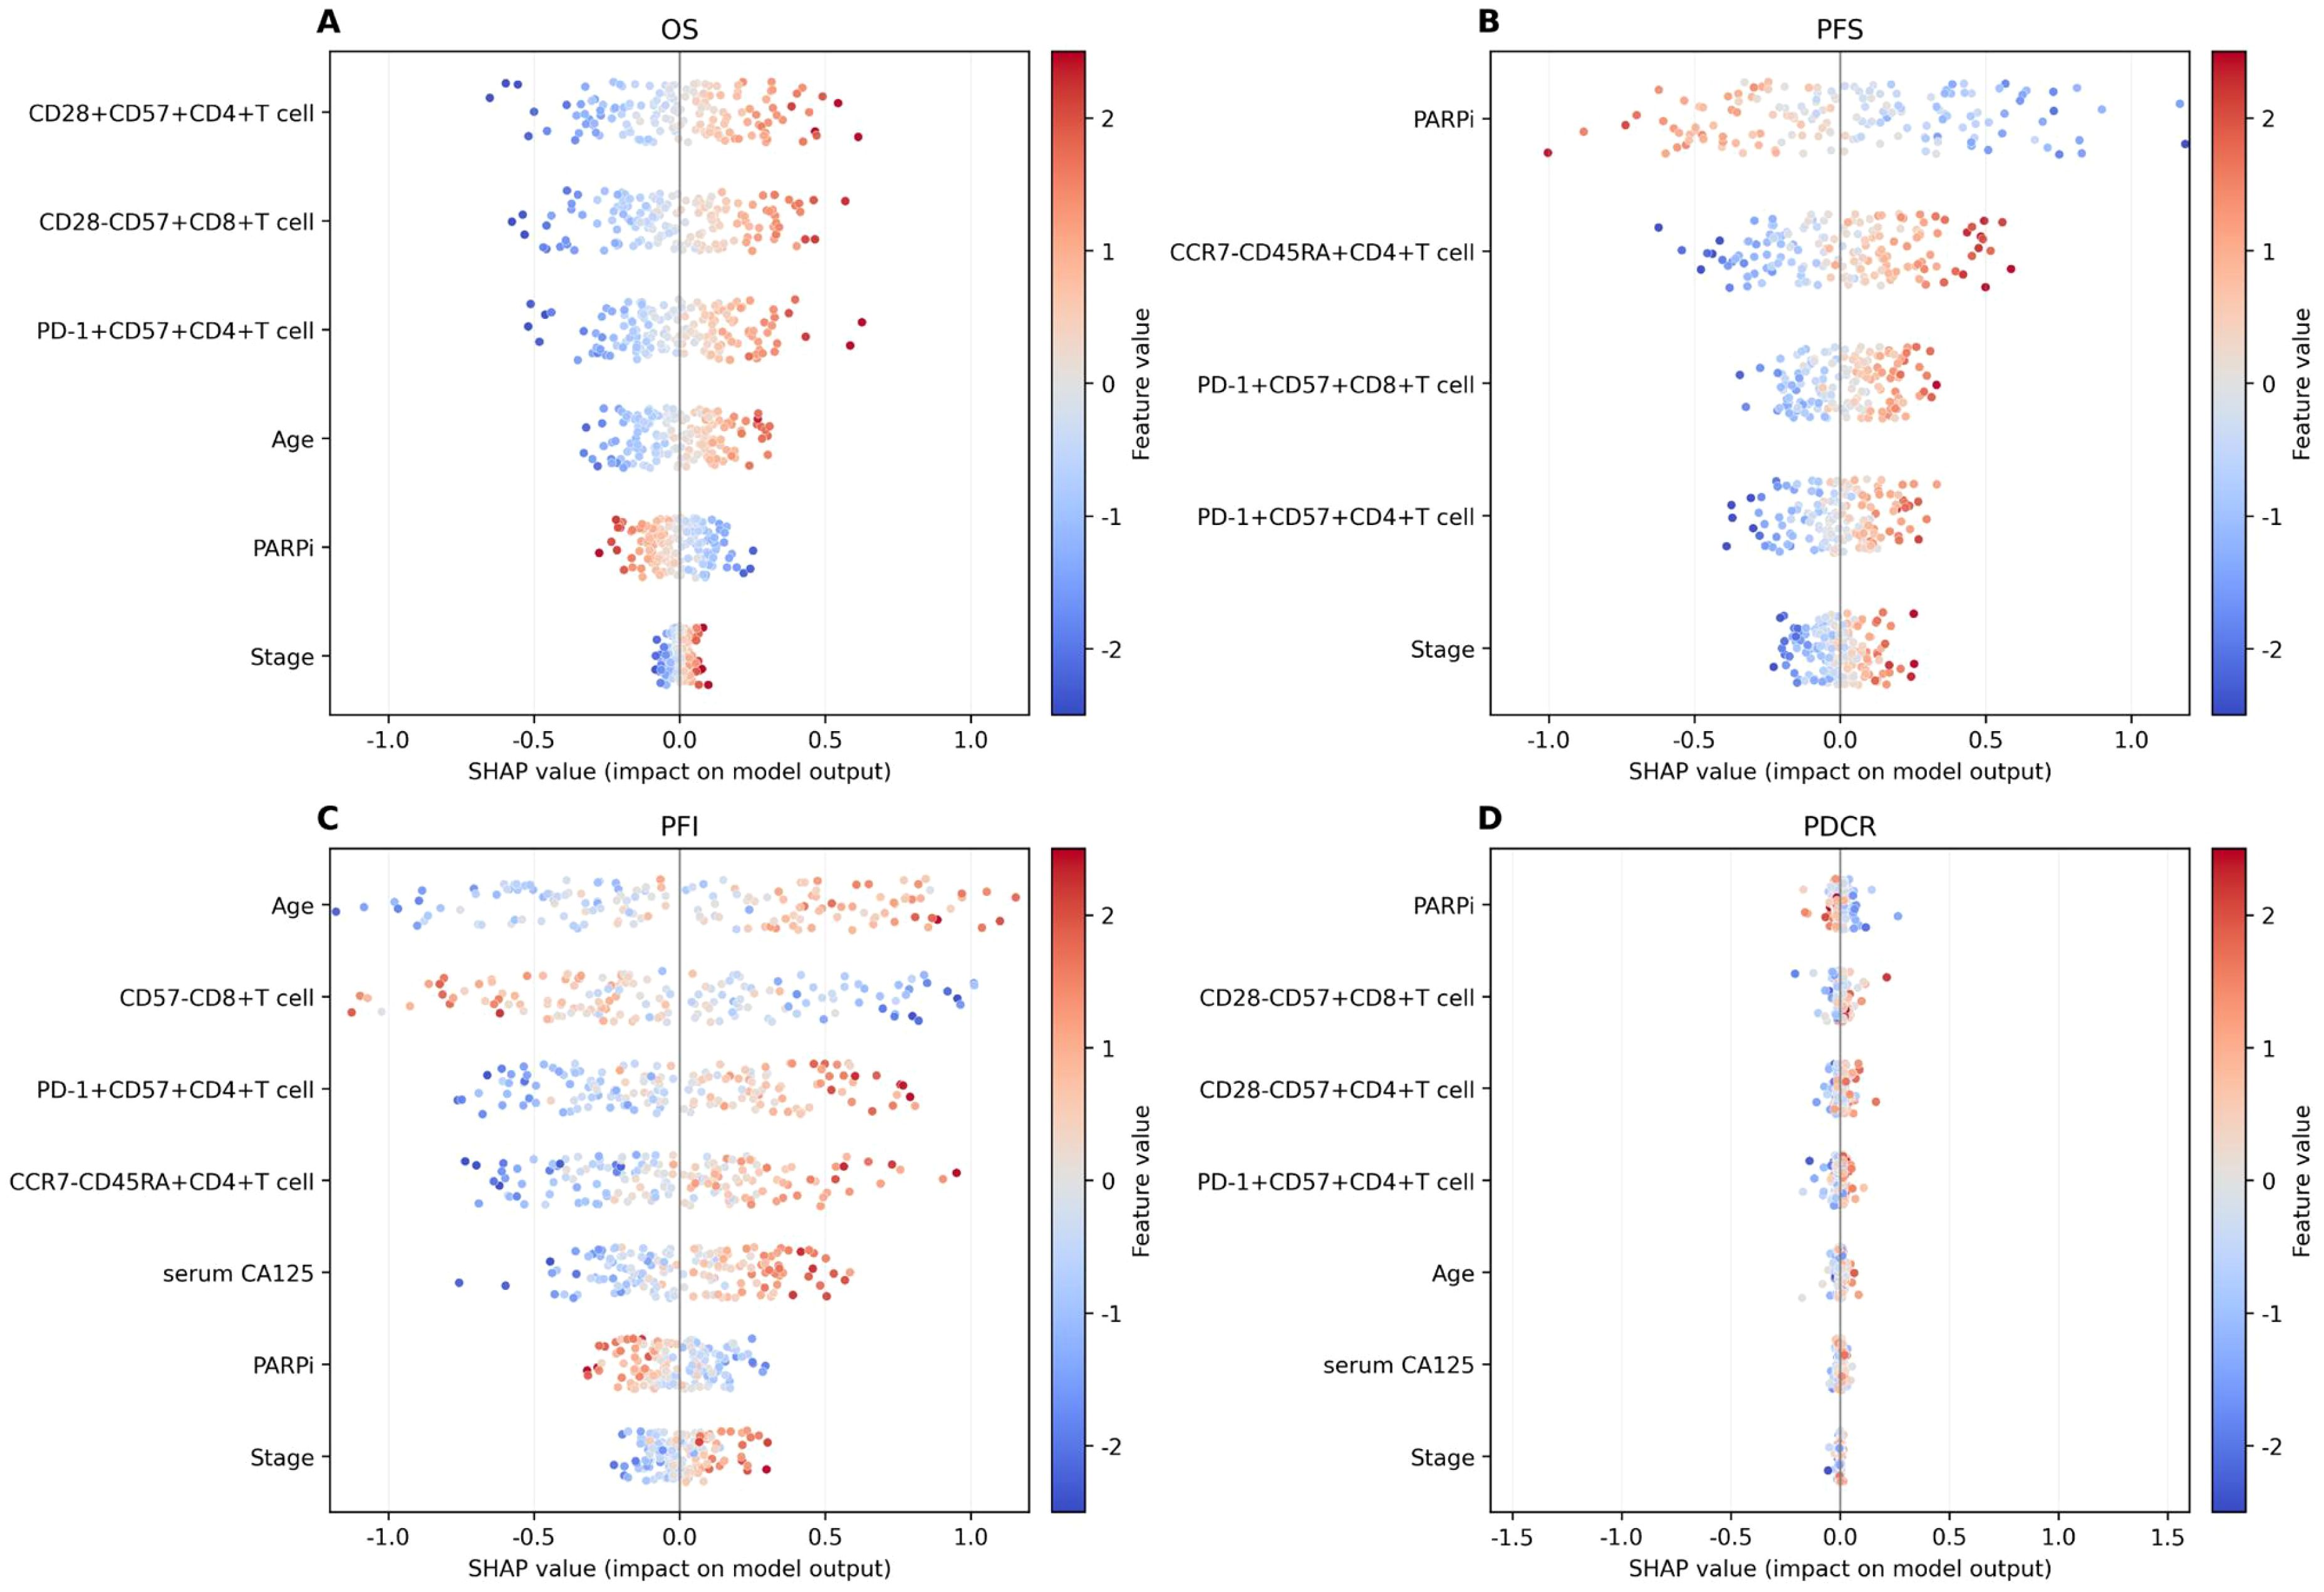
Figure 7. SHAP value for interpretability value visualization. (A) Overall survival (OS). (B) Progression-free survival (PFS). (C) Progression-free interval (PFI). (D) P-DCR.
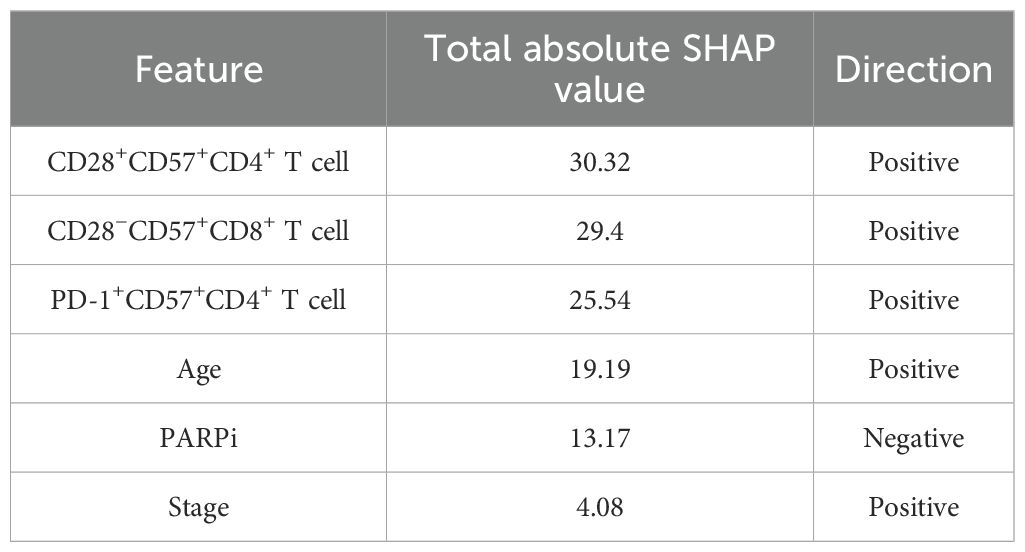
Table 6. The SHAP value for OS prediction.
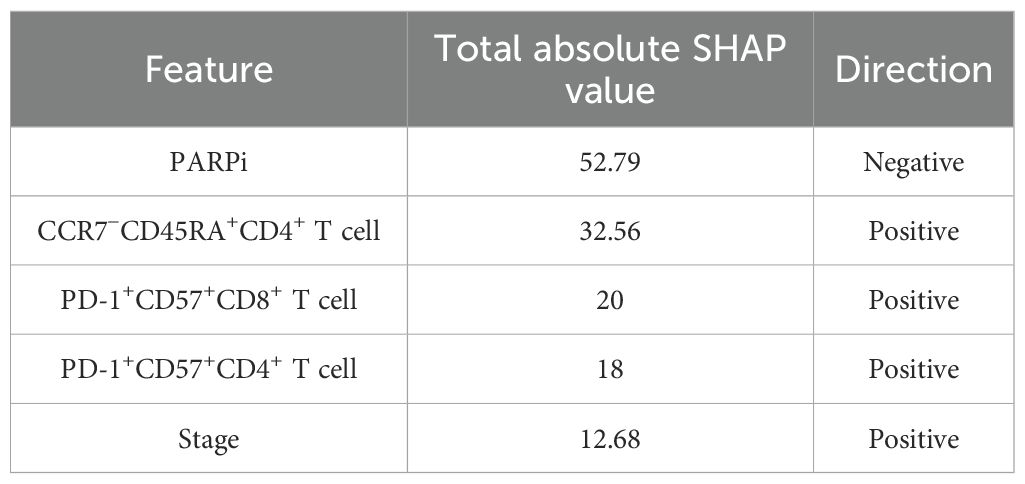
Table 7. The SHAP value for PFS prediction.
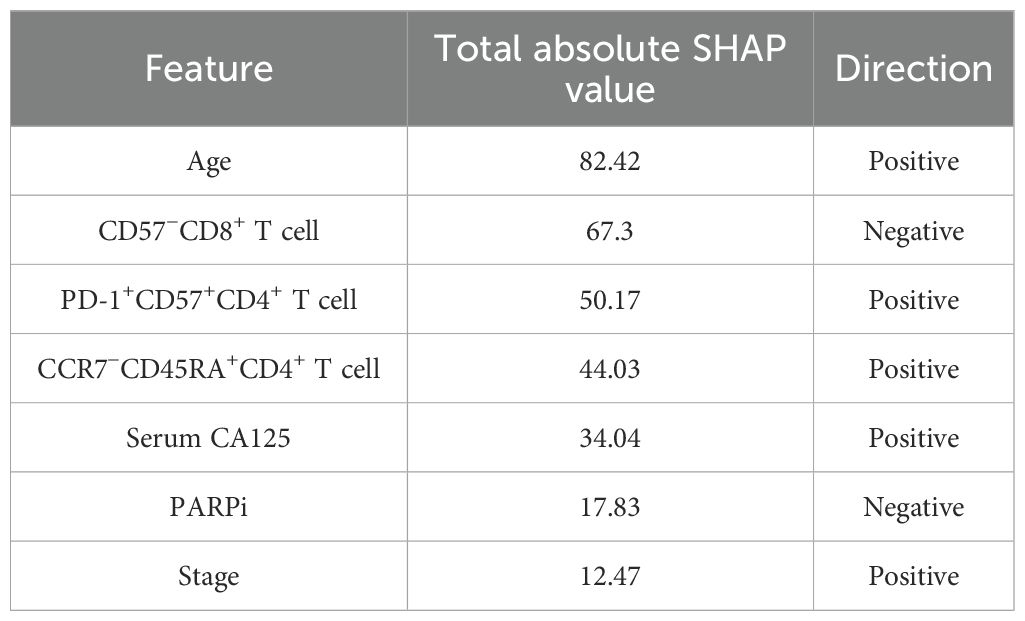
Table 8. The SHAP value for PFI prediction.
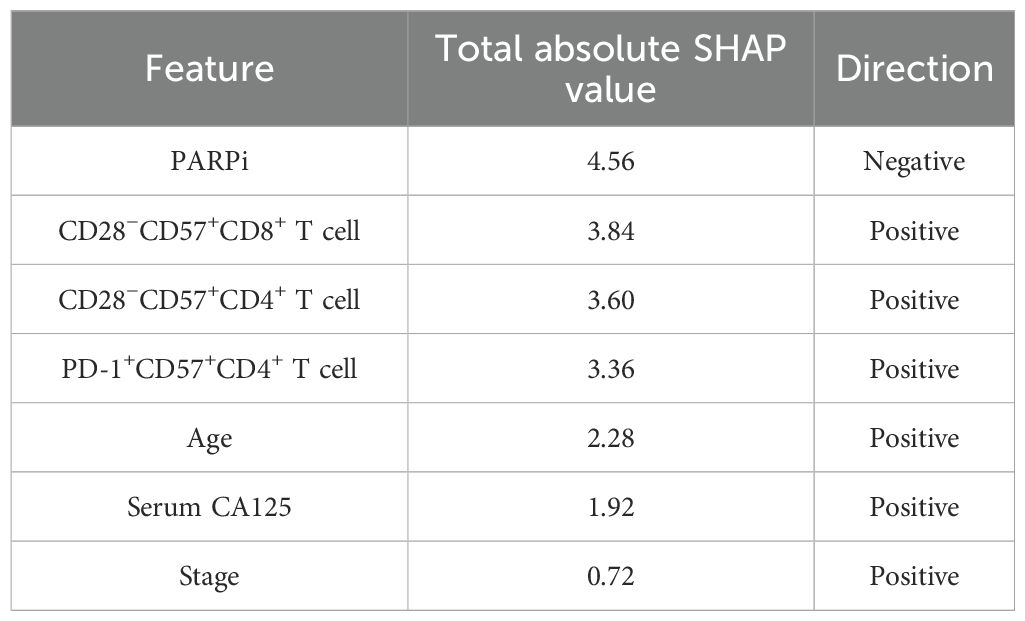
Table 9. The SHAP value for P-DCR prediction.
In the SHAP analysis of the deep survival model, the feature with the most significant impact on OS risk scores was CD28+CD57+CD4+ T cell, with the highest total absolute SHAP value (32.56) in Table 6. For PFS prediction, PARPi showed the most prominent influence, with the highest total absolute SHAP value (52.79) in Table 7. In PFI prediction, age emerged as the most impactful feature, with a total absolute SHAP value of 82.42 (Table 8). For platinum-based drug chemotherapy disease control rate (P-DCR) prediction, PARPi had the highest total absolute SHAP value (4.56) in Table 9.
Additionally, PARPi exerted a consistent negative effect on OS, PFS, PFI, and P-DCR, as indicated by negative direction values in Tables 6–9. Other notable features included CD28−CD57+CD8+ T cell (positive direction, total absolute SHAP value = 29.4) in OS prediction, CCR7−CD45RA+CD4+ T cell (positive direction, 32.56) in PFS prediction, CD57−CD8+ T cell (negative direction, 67.3) in PFI prediction, and CD28−CD57+CD8+ T cell (positive direction, 3.84) in P-DCR prediction.
Discussion
Recent advances in spatial immunology and machine learning enable high-resolution decoding of immune microenvironments. By combining flow cytometric profiling of ascitic T-cell subsets with interpretable ensemble modeling, we aimed to explore the potential relationships between survival, recurrence, and P-DCR in patients with ovarian cancer and to construct deep learning models to improve the predictive performance of survival analysis. By integrating multi-omics and machine and deep learning methods, we sought to enhance the current prognosis evaluation for ovarian cancer, thereby supporting individualized treatment strategies.
In this study, a comprehensive comparative analysis was carried out to assess the influence of different feature sets on model performance in predicting OS, PFS, PFI, and P-DCR.
In survival predictions, the RSF model with combined clinical-ascites features outperformed single feature sets across all endpoints: OS (C-index = 0.72 ± 0.05), PFS (C-index = 0.70 ± 0.04), and PFI (C-index = 0.74 ± 0.06)—significantly higher than clinical-only (OS: 0.66 ± 0.06, PFS: 0.64 ± 0.10, PFI: 0.69 ± 0.06) or ascites-only (OS: 0.69 ± 0.09, PFS: 0.67 ± 0.08, PFI: 0.72 ± 0.09) subsets. This highlights the critical role of integrating multi-dimensional data to capture complex feature interactions influencing survival outcomes.
RSF consistently outperformed DeepSurv, leveraging its tree-based architecture to model non-linear relationships effectively. Single feature sets, particularly ascites-only, showed limited discriminatory power, underscoring their inability to fully characterize disease dynamics alone. These findings emphasize the value of combined features and algorithm selection in robust survival modeling, with RSF offering a superior approach for identifying heterogeneous risk subgroups in translational research.
The observed superiority of combined clinical-ascites features across all survival endpoints underscores the importance of integrative feature selection in capturing multi-dimensional prognostic signals. While single feature groups provided moderate predictive value (e.g., ascites features for OS and clinical features for PFI), their limitations were evident in failing to achieve top performance in any endpoint. This suggests that survival outcomes are influenced by complex interactions between clinical phenotypes and immune microenvironments, which require integrated analysis to fully resolve. Prior work (24, 25) used clinical or imaging data alone and missed immune determinants of survival and therapy resistance. Unlike the NLP model of Laios et al., which relies on operative-report text and cannot reflect pre-operative immune dynamics, our inclusion of markers (e.g., PD-1+CD8+ T cells) flags immune-exhausted patients prone to R2 residual disease. Compared with the ultrasound model of Moro et al., which is operator-dependent and largely morphologic, our approach links pre-operative immune status to residual tumor diameter, thereby improving survival prediction.
Model comparisons further highlighted the robustness of RSF over parametric CPH and neural network DeepSurv approaches. RSF’s ability to handle non-linear relationships and automatically select informative features contributed to its dominance, particularly in combined feature sets where interactions were most pronounced. In contrast, CPH’s reliance on proportional hazards assumptions and linearity likely constrained its performance, especially in high-dimensional immune features. DeepSurv, despite showing promise in ascites-only models, struggled with overfitting in combined groups, possibly due to insufficient regularization or limited training data. These findings align with recent studies demonstrating ensemble methods’ superiority in survival analysis with heterogeneous data.
For P-DCR, the main message is that fusing information beats any single source. The combined feature set consistently delivered better discrimination (highest mean AUC of 0.69) and a distinct performance profile, suggesting complementary signals between clinical factors and ascites-derived markers. Practically, this favors a combined-features classifier when the goal is to enrich responders while keeping false positives in check. Thresholds should be tuned to the intended use (screening vs. confirmatory), and calibration plus external validation is needed to ensure transportability and avoid optimism from internal resampling. However, similar to the situation in survival prediction, the average sensitivity across all feature sets varied, with the Combined_features group showing the highest mean sensitivity (0.70) while the other groups remained relatively low (0.52–0.54), indicating that even the best-performing model may still miss some resistant samples. This could be due to the heterogeneity of P-DCR features and the model’s limitations in handling complex relationships. In terms of average specificity, the Ascites_features group had a mean specificity of 0.71, outperforming the Combined_features group (0.62) and Clinical_features group (0.69), showing that ascites-derived markers alone have a relatively stronger ability to identify non-resistant samples and reduce false-positive rates.
The SHAP analysis has yielded valuable insights into the significance of diverse features for predicting clinical outcomes in HGSOC. Mechanistically, the presence of PD-1+CD57+CD8+ T cells in ascites indicates terminal differentiation/senescence with features of exhaustion; studies have linked expansion of this lineage to adverse outcomes in HGSOC, consistent with its unfavorable contribution in our models. Moreover, datasets that distinguish PD-1 single-positive CD8 T cells (which may include activated states) from PD-1 and CD57 double-positive cells (more senescent/terminal) show divergent prognostic directions, supporting our interpretation of PD-1+CD57+ as the more risk-oriented phenotype (29, 30). CCR7-CD45RA+CD4+ (CD4 TEMRA) denotes terminal effector differentiation, generally accompanied by reduced proliferative reserve and immunosenescence; the biological meaning of the CCR7/CD45RA stratification is well established and aligns with the risk direction we observed (31). Tregs (CD25+CD127-) are recruited to ovarian tumors/ascites via CCL22 and are associated with inferior survival, suggesting an immunologic barrier to chemotherapy response (32). Although CD56dim NK cells are the principal cytotoxic subset, they are often functionally impaired in ascites by soluble factors such as TGF-β1; such dysfunction correlates with poorer outcomes and further supports including NK phenotypes in prediction (33). Among clinical covariates, CA125 reflects tumor burden and is used for relapse monitoring, but initiating chemotherapy solely on the basis of rising CA125 does not improve overall survival, indicating that it functions better as a disease-activity marker than as a stand-alone treatment trigger (34). FIGO stage and residual disease have long been among the most important prognostic factors, in accordance with their directions in our models (35). PARPi exposure was treated as a treatment covariate rather than an outcome; its association with reduced risk is biologically plausible—PARPi can remodel the tumor immune microenvironment, upregulate PD-L1, and activate innate immune pathways—yet confounding must be considered in nonrandomized analyses (30). Disruptions in these cells could impact prognosis, pointing to potential immunomodulatory therapies. PARPi shows a negative influence on OS, PFS, PFI, and P-DCR, implying a protective effect. Understanding its mechanisms could optimize its use and lead to better combination therapies. Biomarkers like “serum CA125” and “Stage” are relevant for PFS. Their positive associations highlight their importance in monitoring and guiding treatment. Regular assessment can help detect progression early.
As part of ongoing research, deep learning has also been explored for predicting post-operative residual tumor status in patients with ovarian cancer. Preliminary findings suggest that deep learning models can be applied effectively to predict the status of residual tumors, with early results indicating an accuracy of 70.83%, a precision of 71.21%, a recall of 70.83%, and an F1 score of 70.89% on the test set. While these findings are still under investigation, they may provide valuable insights into the potential for integrating tumor status prediction into clinical prognosis of tumors, further supporting personalized treatment approaches.
Limitations and future directions
Despite achieving meaningful results, this study has certain limitations. First, the small dataset size may affect the generalizability of the models, especially for deep learning approaches that require larger datasets for reliable performance. Despite the promising findings in this study, several limitations must be considered. The most significant limitation is the small sample size (n = 87), which can affect the generalizability and robustness of the models. A dataset of this size, while adequate for the proof of concept, may not capture the full heterogeneity of patient populations, particularly in HGSOC, where immune microenvironment features may vary across ethnicities and clinical settings. The lack of external validation is a critical concern, as the generalizability of machine learning models is heavily dependent on the diversity and size of the datasets used for testing. We acknowledge that external validation using multi-center datasets is essential to improve the reliability and applicability of the models to broader populations. Furthermore, multi-center validation would address potential biases due to center-specific variations in clinical procedures and pathological assessments.
To mitigate this limitation, we employed a repeated nested cross-validation approach, which helps reduce overfitting and ensures that the feature selection and model training processes are rigorously tested within the available data. This approach, despite the limited sample size, maximized the utility of the data by ensuring that models were trained and evaluated using different subsets, thus improving the stability of the findings.
While external validation is clearly a priority for future work, our use of advanced techniques such as feature screening, multivariable modeling, and SHAP analyses has ensured that the findings are interpretable and robust within the context of this study. These methods allowed us to capture meaningful relationships between clinical features and ascitic immune cell subsets, which will form a valuable foundation for future investigations with larger and more diverse cohorts. Additionally, the data used in this study mainly originated from a single center, lacking diversity in patient populations from different ethnicities or regions, which may limit the applicability of the model. There is also a lack of targeted analysis regarding center-specific variations in surgical procedures and pathological assessment criteria. This introduces potential bias and variability, further limiting the generalizability of the results. Therefore, future studies should explore multi-center validation to address these concerns and improve the external validity of the models. Moreover, a key limitation not previously discussed is the “timeliness of immune indicator detection”. Ascites samples need to be collected during surgery and processed within 1 h to ensure accurate immune profiling. In clinical practice, particularly in primary hospitals, meeting this tight timeframe may not always be feasible, limiting the model’s applicability in these settings. Future studies could explore the impact of refrigerated sample storage or other methods to preserve the samples during transport, allowing for a more flexible detection timeline and broader model application in clinical practice. Future studies could incorporate additional multimodal features, such as genomic or imaging data, to further enhance model prediction performance and generalizability. In particular, with advancements in deep learning and multimodal integration techniques, combining different data types may provide more comprehensive support for the diagnosis and treatment of ovarian cancer. In terms of model interpretability, future efforts could explore other interpretability techniques, such as attention mechanism-based models, to better uncover the complex relationships and interactions among features. This would deepen our understanding of the mechanisms underlying ovarian cancer and provide new insights for developing individualized treatment strategies.
Conclusion
This study developed a deep survival model and a random forest-based platinum resistance prediction model for ovarian cancer, integrating clinical and immune features. Key findings include the following: (1) The RSF model outperformed deep learning and traditional methods across all survival endpoints; (2) combined clinical-ascites features improved predictive accuracy, validating multi-dimensional data integration; and (3) signature biomarkers were identified for survival and drug resistance. These results provide a novel framework for personalized treatment strategies. Future work includes external validation and multi-omics integration to enhance prognostic precision.
Data availability statement
The datasets presented in this study can be found in online repositories. The names of the repository/repositories and accession number(s) can be found in the article/supplementary material.
Ethics statement
The studies involving humans were approved by Peking University Third Hospital. The studies were conducted in accordance with the local legislation and institutional requirements. Given the retrospective and anonymized characteristics of this study, the requirement for individual informed consent was waived.
Author contributions
LY: Methodology, Writing – review & editing, Formal analysis, Software, Investigation, Writing – original draft, Conceptualization, Validation, Data curation, Resources. TH: Methodology, Writing – review & editing, Investigation, Data curation, Conceptualization, Resources, Formal analysis, Writing – original draft, Software. JW: Writing – original draft, Writing – review & editing, Software, Investigation, Methodology, Formal analysis, Data curation. XZ: Investigation, Software, Writing – review & editing, Data curation, Methodology. LZ: Investigation, Methodology, Writing – original draft. QS: Data curation, Methodology, Writing – original draft, Investigation, Software. YS: Methodology, Investigation, Software, Formal analysis, Writing – original draft. YN: Formal analysis, Software, Methodology, Writing – original draft, Investigation. XG: Methodology, Investigation, Writing – original draft. CS: Validation, Conceptualization, Supervision, Writing – review & editing, Writing – original draft, Funding acquisition. HG: Visualization, Writing – review & editing, Project administration, Supervision, Methodology, Writing – original draft, Validation, Funding acquisition, Software, Investigation, Data curation, Resources, Conceptualization.
Funding
The author(s) declare financial support was received for the research and/or publication of this article. This study was supported by the National Natural Science Foundation of China (No. 82372888), the National Key Research and Development Program of China (No. 2022YFC2704000), the National Natural Science Foundation of China (No. 82273383), the Capital’s Funds for Health Improvement and Research (No. 2020-2-4098), the Youth program of Beijing Municipal Natural Science Foundation (No. 7204328), the Clinical Medicine Plus X — Young Scholars Project, Peking University (No. PKU2022LCXQ020), the Key Clinical Project of Peking University Third Hospital (No. BYSY2022050), the Key Clinical Projects of Peking University Third Hospital (No. BYSYZD2021006), and the Key Clinical Projects of Peking University Third Hospital (No. BYSYZD2019034).
Conflict of interest
The authors declare that the research was conducted in the absence of any commercial or financial relationships that could be construed as a potential conflict of interest.
Generative AI statement
The author(s) declare that no Generative AI was used in the creation of this manuscript.
Any alternative text (alt text) provided alongside figures in this article has been generated by Frontiers with the support of artificial intelligence and reasonable efforts have been made to ensure accuracy, including review by the authors wherever possible. If you identify any issues, please contact us.
Publisher’s note
All claims expressed in this article are solely those of the authors and do not necessarily represent those of their affiliated organizations, or those of the publisher, the editors and the reviewers. Any product that may be evaluated in this article, or claim that may be made by its manufacturer, is not guaranteed or endorsed by the publisher.
Supplementary material
The Supplementary Material for this article can be found online at: https://www.frontiersin.org/articles/10.3389/fimmu.2025.1698793/full#supplementary-material
References
1. Hollis RL. Molecular characteristics and clinical behaviour of epithelial ovarian cancers. Cancer Lett. (2023) 555:216057. doi: 10.1016/j.canlet.2023.216057
2. Lheureux S, Gourley C, Vergote I, and Oza AM. Epithelial ovarian cancer. Lancet. (2019) 393:1240–53. doi: 10.1016/S0140-6736(18)32552-2
3. Yang ST, Hsu HC, Chen CW, Chen YL, Wang YH, Chou CY, et al. Front-line chemo-immunotherapy for treating epithelial ovarian cancer: Part I CA125 and anti-CA125. Taiwanese J Obstetrics Gynecology. (2023) 62:802–8. doi: 10.1016/j.tjog.2023.09.017
4. Yang ST, Hsu HC, Chen CW, Chen YL, Wang YH, Chou CY, et al. Front-line chemoimmunotherapy for treating epithelial ovarian cancer: Part II promising results of phase 2 study of paclitaxel-carboplatin-oregovomab regimen. Taiwanese J Obstetrics Gynecology. (2024) 63:10–6. doi: 10.1016/j.tjog.2023.11.005
5. Monk BJ, Poveda A, Vergote I, Raspagliesi F, Fujiwara K, Bae DS, et al. Chemotherapy with or without avelumab followed by avelumab maintenance versus chemotherapy alone in patients with previously untreated epithelial ovarian cancer (JAVELIN Ovarian 100): an open-label, randomised, phase 3 trial. Lancet Oncol. (2021) 22:1275–89. doi: 10.1016/S1470-2045(21)00342-9
6. Ford CE, Werner B, Hacker NF, and Warton K. The untapped potential of ascites in ovarian cancer research and treatment. Br J Cancer. (2020) 123:9–16. doi: 10.1038/s41416-020-0875-x
7. Zaccherini G, Tufoni M, Iannone G, and Caraceni P. Management of ascites in patients with cirrhosis: An update. J Clin Med. (2021) 10:5226. doi: 10.3390/jcm10225226
8. Cheng X, Tan X, Wang W, Liu Z, Yin Y, Li X, et al. Long-chain acylcarnitines induce senescence of invariant natural killer T cells in hepatocellular carcinoma. Cancer Res. (2023) 83:582–94. doi: 10.1158/0008-5472.CAN-22-2273
9. Tan X, Qi C, Zhao X, Wang X, Cheng X, Liu Z, et al. ERK inhibition promotes engraftment of allografts by reprogramming T-cell metabolism. Adv Sci (Weinh). (2023) 10:e2206768. doi: 10.1002/advs.202206768
10. Tan X, Zhao X, Hu Z, Jiang DS, Ma Z, Sun L, et al. Targeting Setdb1 in T cells induces transplant tolerance without compromising antitumor immunity. Nat Commun. (2025) 16:4534. doi: 10.1038/s41467-025-58841-z
11. Lin DY and Wei L-J. The robust inference for the Cox proportional hazards model. J Am Stat Assoc. (1989) 84:1074–8. doi: 10.1080/01621459.1989.10478874
12. Asghar N, Khalil U, Ahmad B, Alshanbari HM, Hamraz M, Ahmad B, et al. Improved nonparametric survival prediction using CoxPH, Random Survival Forest & DeepHit Neural Network. BMC Med Inf Decision Making. (2024) 24:120. doi: 10.1186/s12911-024-02525-z
13. Germer S, Lang N, Hübner M, Kretschmer A, Schmid S, Jeschke S, et al. Survival analysis for lung cancer patients: A comparison of Cox regression and machine learning models. Int J Med Inf. (2024) 191:105607. doi: 10.1016/j.ijmedinf.2024.105607
14. Tarkhan A and Simon N. An online framework for survival analysis: reframing Cox proportional hazards model for large data sets and neural networks. Biostatistics. (2024) 25:134–53. doi: 10.1093/biostatistics/kxac039
15. Zeng Z, Li Y, Chen J, Wang Y, Zhang Y, Wang Y, et al. Violations of proportional hazard assumption in Cox regression model of transcriptomic data in TCGA pan-cancer cohorts. Comput Struct Biotechnol J. (2022) 20:496–507. doi: 10.1016/j.csbj.2022.01.004
16. Krzyziński M, Spytek M, Baniecki H, and Biecek P. SurvSHAP (t): time-dependent explanations of machine learning survival models. Knowledge-Based Syst. (2023) 262:110234. doi: 10.1016/j.knosys.2022.110234
17. Alinia S, Motevalian SA, Yousefifard M, Hosseini M, Ghelichi L, and Moghaddam AE. Exploring the impact of stage and tumor site on colorectal cancer survival: Bayesian survival modeling. Sci Rep. (2024) 14:4270. doi: 10.1038/s41598-024-54943-8
18. McLernon DJ, Giardiello D, Van Calster B, Wynants L, van Geloven N, van Smeden M, et al. Assessing performance and clinical usefulness in prediction models with survival outcomes: practical guidance for Cox proportional hazards models. Ann Internal Med. (2023) 176:105–14. doi: 10.7326/M22-0844
19. Haug CJ and Drazen JM. Artificial intelligence and machine learning in clinical medicine, 2023. New Engl J Med. (2023) 388:1201–8. doi: 10.1056/NEJMra2302038
20. Gao L and Guan L. Interpretability of machine learning: Recent advances and future prospects. IEEE MultiMedia. (2023) 30:105–18. doi: 10.1109/MMUL.2023.3272513
21. Lundberg SM and Lee SI. Quantifying noncovariance of quantum channels with respect to groups. Physica Scripta. (2024) 99:105132. doi: 10.1088/1402-4896/ad7a2b
22. Wang H, Hou J, Liu Y, Zhang Q, Li Y, Chen K, et al. Feature selection strategies: a comparative analysis of SHAP-value and importance-based methods. J Big Data. (2024) 11:44. doi: 10.1186/s40537-024-00905-w
23. Prendin F, Vettoretti M, Facchinetti A, Sparacino G, Cobelli C, Del Favero S, et al. The importance of interpreting machine learning models for blood glucose prediction in diabetes: an analysis using SHAP. Sci Rep. (2023) 13:16865. doi: 10.1038/s41598-023-44155-x
24. Laios A, Zakhour M, Otify M, Theophilou G, Giannopoulos V, Ahmed AS, et al. RoBERTa-assisted outcome prediction in ovarian cancer cytoreductive surgery using operative notes. Cancer Control. (2023) 30:10732748231209892. doi: 10.1177/10732748231209892
25. Moro F, Zannoni GF, Golia D, Scambia G, Testa AC, Mascilini F, et al. Prediction of nonresectability using the updated Predictive Index value model assessed by imaging and surgery in tubo-ovarian cancer: a prospective multicenter ISAAC study. Am J Obstetrics Gynecology. (2024) 231:632.e1–632.e14. doi: 10.1016/j.ajog.2024.06.047
26. Yoshida-Court K, Karpinets TV, Mitra A, Solley TN, Dorta-Estremera S, Sims TT, et al. The role of immune cell subsets in ascitic fluid and their relationship with prognosis in high-grade serous ovarian cancer. J Immunol. (2023) 215:1425–34. doi: 10.1371/journal.pone.0279590
27. Chang SJ, Bristow RE, and Ryu HS. Impact of residual lesion size on postoperative recurrence and overall survival: A multicenter retrospective analysis. J Clin Oncol. (2024) 42:1987–95. doi: 10.1245/s10434-012-2446-8
28. Chang SJ, Bristow RE, and Ryu HS. Correlation between postoperative residual tumor diameter and survival outcomes in solid tumor patients. Ann Surg Oncol. (2023) 30:2215–24. doi: 10.1245/s10434-012-2446-8
29. He T, Zhang J, Zeng L, Yin Z, Yu B, Zhang X, et al. Composite score of PD-1+CD8+ tumor-infiltrating lymphocytes and CD57+CD8+ tumor ascites lymphocytes is associated with prognosis and tumor immune microenvironment of patients with advanced high-grade serous ovarian cancer. Chin J Cancer Res. (2025) 37:73–89. doi: 10.21147/j.issn.1000-9604.2025.01.06
30. Zheng X, Wang X, Cheng X, Liu Z, Yin Y, Li X, et al. Single-cell analyses implicate ascites in remodeling the ecosystems of primary and metastatic tumors in ovarian cancer. Nat Cancer. (2023) 4:1138–56. doi: 10.1038/s43018-023-00599-8
31. Tian Y, Babor M, Lane J, Schulten V, Patil VS, Seumois G, et al. Unique phenotypes and clonal expansions of human CD4 effector memory T cells re-expressing CD45RA. Nat Commun. (2017) 8:1473. doi: 10.1038/s41467-017-01728-5
32. Curiel TJ, Coukos G, Zou L, Alvarez X, Cheng P, Mottram P, et al. Specific recruitment of regulatory T cells in ovarian carcinoma fosters immune privilege and predicts reduced survival. Nat Med. (2004) 10:942–9. doi: 10.1038/nm1093
33. Maas RJA, Hoogstad-Van Evert JS, Hagemans IM, Brummelman J, Van Ens D, De Jonge PKJD, et al. Increased peritoneal TGF-β1 is associated with ascites-induced NK-cell dysfunction and reduced survival in high-grade epithelial ovarian cancer. Front Immunol. (2024) 15:1448041. doi: 10.3389/fimmu.2024.1448041
34. Rustin GJS, Van Der Burg MEL, Griffin CL, Guthrie D, Lamont A, Jayson GC, et al. MRC OV05; EORTC 55955 investigators. Early versus delayed treatment of relapsed ovarian cancer (MRC OV05/EORTC 55955): a randomised trial. Lancet. (2010) 376:1155–63. doi: 10.1016/S0140-6736(10)61268-8
35. Du Bois A, Reuss A, Pujade-Lauraine E, Harter P, Ray-Coquard I, and Pfisterer J. Role of surgical outcome as prognostic factor in advanced epithelial ovarian cancer: a combined exploratory analysis of 3 prospectively randomized phase 3 multicenter trials: by the AGO-OVAR and GINECO groups. Cancer. (2009) 115:1234–44. doi: 10.1002/cncr.24149
Keywords: epithelial ovarian cancer, survival analysis, immunological niches, deep learning, platinum-based drug chemotherapy resistance prediction
Citation: Yang L, He T, Wang J, Zhang X, Zeng L, Sun Q, Song Y, Nie Y, Gao X, Shang C and Guo H (2025) Decoding ascitic immunological niches with multi-modal machine learning reveals prognostic and chemoresistant determinants in ovarian cancer. Front. Immunol. 16:1698793. doi: 10.3389/fimmu.2025.1698793
Received: 04 September 2025; Accepted: 03 November 2025;
Published: 03 December 2025.
Edited by:
Xiaosheng Tan, Rutgers, The State University of New Jersey, United StatesReviewed by:
Zhen Zhang, Maastro Clinic, NetherlandsHeli Li, Huazhong University of Science and Technology, China
Copyright © 2025 Yang, He, Wang, Zhang, Zeng, Sun, Song, Nie, Gao, Shang and Guo. This is an open-access article distributed under the terms of the Creative Commons Attribution License (CC BY). The use, distribution or reproduction in other forums is permitted, provided the original author(s) and the copyright owner(s) are credited and that the original publication in this journal is cited, in accordance with accepted academic practice. No use, distribution or reproduction is permitted which does not comply with these terms.
*Correspondence: Hongyan Guo, YnlzeWdoeUAxNjMuY29t; Chunliang Shang, c2hhbmdjaGxAYmptdS5lZHUuY24=
†These authors have contributed equally to this work