 Logeeshan Velmanickam
 Dharmakeerthi Nawarathna
- 1Department of Electrical Engineering, University of Moratuwa, Moratuwa, Sri Lanka
- 2Department of Electrical and Computer Engineering, Old Dominion University, Norfolk, VA, United States
Low-cost, highly-sensitivity, and minimally invasive tests for the detection and monitoring of life-threatening diseases and disorders can reduce the worldwide disease burden. Despite a number of interdisciplinary research efforts, there are still challenges remaining to be addressed, so clinically significant amounts of relevant biomarkers in body fluids can be detected with low assay cost, high sensitivity, and speed at point-of-care settings. Although the conventional proteomic technologies have shown promise, their ability to detect all levels of disease progression from early to advanced stages is limited to a limited number of diseases. One potential avenue for early diagnosis is microRNA (miRNA). Due to their upstream positions in regulatory cascades, blood-based miRNAs are sensitive biomarkers that are detectable earlier than those targeted by other methods. Therefore, miRNA is a promising diagnostic biomarker for many diseases, including those lacking optimal diagnostic tools. Electric fields have been utilized to develop various biomedical assays including cell separation, molecules detection and analysis. Recently, there has been a great interest in the utility of electric fields with optical detection methods, including fluorescence and surface plasmons toward biomarker detection. This mini review first summarizes the recent development of miRNA as a biomarker. Second, the utility of electric fields and their integration with fluorescence detection methods will be discussed. Next, recent studies that utilized electric fields and optical detection methods will be discussed. Finally, in conclusion, technology gaps and improvements needed to enable low-cost and sensitive biomarker detection in point-of-care settings will be discussed.
1 MicroRNA as a biomarker for disease detection
Cancer, obesity and opioid abuse together pose a great threat to worldwide health. In the United States (US), it affects over 70% of the population and cost over $250 billion per year in medical expenses (American Cancer Society, 2008; Birnbaum et al., 2011; Wang et al., 2011; Florence et al., 2016; Hayba et al., 2018). A critical roadblock to combating these diseases/disorders is the lack of sensing technologies that could detect fundamental molecular changes at the cellular level related to initiation, progression of those diseases/disorders and reaction to therapeutic interventions (Poruk et al., 2013; Chalana et al., 2016; Parr et al., 2016; McGraw, 2024). Pancreatic cancer (PC) is one of the most lethal cancers and a major unsolved health problem worldwide (Poruk et al., 2013). About 6% of PC patients live less than 5 years after initial diagnosis (Poruk et al., 2013). This is in part due to the lack of a standard diagnostic tool for early detection of PC (Poruk et al., 2013). However, if this cancer was detected early and treated with existing therapy, the five-year survival rate could be 60%–100% (that is, an over ten-fold improvement). Therefore, there is an urgent need for an early detection test (Poruk et al., 2013; Ji et al., 2014; Goonetilleke and Siriwardena, 2007). Early detection of PC involves first-use clinical risk factors (e.g., family history, age, and smoking) for identifying at-risk individuals (Poruk et al., 2013). The next step is the screening to monitor the development of PC and to determine the starting point of diagnosis and treatments (Poruk et al., 2013). There are multiple diagnostic options available for PC, including CT, MRI, and endoscopic ultrasound (Poruk et al., 2013). These modalities do not have sufficient resolution or sensitivity to be useful in the screening stage as they produce very high false-positive rates (>90%) in screening (Poruk et al., 2013; Ganepola et al., 2014). They, therefore are not recommended for frequent use in screening (Poruk et al., 2013; Ganepola et al., 2014). Due to the lack of sensitivity and specificity, usage of current biomarkers (e.g., CA-19-9) is limited only to the prognosis analysis. A growing body of knowledge suggests that a potential microRNA (miRNA) biomarker panel in serum (e.g., miR-642b, miR-885-5p, and miR-22) can differentiate healthy individuals, PC patients, and individuals in the early stage of PC development (Ganepola et al., 2014). These biomarkers, in combination, represent a new avenue for the development of a clinically useful screening test.
According to the recent report from the United Nations Office of Drugs and Crime, there were about 90000 opioid related overdose deaths in North America in 2021. Every day, more than 100 people in the US die after overdosing on opioids (OUD) — a class of drugs that include the illicit drug heroin as well as licit prescription pain relievers as oxycodone, morphine and fentanyl (Florence et al., 2016). Overdoses directly related to the misuse of and addiction to opioids, is a serious national crisis that affects public health as well as social and economic welfare (Goonetilleke and Siriwardena, 2007; Poruk et al., 2013; Ganepola et al., 2014; Ji et al., 2014; Chalana et al., 2016; Florence et al., 2016; Parr et al., 2016; Hayba et al., 2018; McGraw, 2024). One of the most critical issues with OUD treatment is the high relapse rate (>60%) related to non-patient-centered models that lack robust clinical tests for monitoring the efficacy of the treatments at individual level (Goonetilleke and Siriwardena, 2007; Poruk et al., 2013; Ji et al., 2014; Chalana et al., 2016; Florence et al., 2016; Parr et al., 2016; Hayba et al., 2018; McGraw, 2024; Understanding the Epidemic Understanding the Epidemic, 2023). Therefore, there is an urgent need for clinical tests for monitoring individual responses to treatments. The Micro-Opioid receptors (MOR) neuronal cells mediate most of the pharmacological effects of opioid drugs. Recent studies have shown that opioid drugs repress the production of MOR epigenetically through miR-23b and miR-339 (Wu et al., 2009; Wu et al., 2013; Barbierato et al., 2015; Toyama et al., 2017). The expression levels of these miRNAs in serum depend on the dose of opioid and time (after taking opioids). In contrast, the drugs (opioid antagonist) used to treat the OUD (e.g., naloxone) do not alter the miR-23b and miR-339 levels in a dose and time-dependent manner. Therefore miR-23b and 339 could be used as biomarkers for monitoring the detoxification at a personal level (Wu et al., 2009; Wu et al., 2013; Barbierato et al., 2015; Toyama et al., 2017). One potential avenue to introduce miRNA for personalizing treatments is the monitoring of miRNA levels over time (during treatments) and find the time that miRNA levels no longer alter with time. Once that time point is determined, behavioral therapy and dosage of the drug (naloxone) can be gradually decreased and the effects on relapse can be studied (Toyama et al., 2017).
According to the World Health Organization (WHO), about 38% of the world population who are older than 5 years are obese (Wang et al., 2011). Obesity is skyrocketing in the US, and over 160 million Americans are either overweight or obese (Wang et al., 2011). Current options for defeating obesity are weight loss interventions: mainly diet and exercise or bariatric surgery. Bariatric surgery is expensive, carries significant long- and short-term side effects and often requires stringent pre-qualifications to be covered by health insurance (WEIGHT LOSS SURGERY INSURANCE COVERAGE AND COSTS, 2024; Völgyi et al., 2008). A combined diet and exercise program is a cheaper alternative for weight management, but there is a considerable inter-individual variability in losing weight via this method (Parr et al., 2016). Therefore, the inability to identify the individuals who will likely succeed with diet and exercise for weight management is a critical roadblock to treating obesity (Parr et al., 2016; WEIGHT LOSS SURGERY INSURANCE COVERAGE AND COSTS, 2024; Völgyi et al., 2008). The percentage of weight loss varies between +10.5% and −.5% for diet and exercise, and patients who cannot lose more than 5% of weight are considered non-responders (Parr et al., 2016; Miller et al., 1997). Dual-energy absorptiometry (DXA) is commonly used to measure body composition during weight-loss interventions but there is no clinical predictability for the success of this intervention (Völgyi et al., 2008). Recent studies have shown that the expression of miR-140 and 935 in serum at two time points about 12 weeks (pre-to post-intervention) apart produces a unique expression pattern in individuals who will likely lose weight and attain a healthy body weight through diet/exercise (Parr et al., 2016). Therefore, miR-140 and 935 can potentially be used to develop diagnostics test to profile patients who can lose weight through diet/exercise.
Cellular responses to lifestyle, stress, drugs, physiopathological conditions and pharmacological interventions have an impact on the epigenetic code, often resulting in modulation in methylome, miRNA expression, and covalent histone modifications (Godfrey et al., 2007; Tang and Ho, 2007; Stöger, 2008; Hanson et al., 2011; Thoms and Jeffrey, 2014). Since epigenetic changes are taking place first in the biochemical cascade, epigenetic biomarkers could provide reliable and clinically important information, earlier than, and superior to, the downstream proteomic biomarkers (Mercer and Mattick, 2013). It has been shown that miRNA― small non-coding RNA molecules, involve in many major cellular functions such as development, differentiation, growth, and metabolism (Arroyo et al., 2011). In addition, miRNA is stably expressed in circulating blood and therefore potential candidates for health monitoring and diagnostics/screening tests (Arroyo et al., 2011). As stated above, recent studies have identified unique miRNA signatures produced during the early stages of PC and treatment of OUD, as well as in response to obesity interventions (Parr et al., 2016; Ganepola et al., 2014; Toyama et al., 2017). These signatures therefore could be utilized as potential biomarkers for combating those diseases/disorders. Despite great progress in miRNA research, miRNAs have not yet been translated or used in the clinical diagnosis of any disease.
This lack of progress is partially due to the differences among and limitations of various detection technologies, which produce inconsistent results (Moldovan et al., 2014). The current methods available for miRNA detection, such as Quantitative Reverse Transcription Polymerase Chain Reaction (RT-qPCR), next-generation sequencing (NGS), microarray-, electrochemical-, plasmonic-, and hybridization-based miRNA sensors are not suitable for clinical screening applications. These methods do not provide absolute molarity of target miRNAs (e.g., RT-qPCR, LAMP, microarray), are inefficient for short miRNAs (e.g., NGS, RT-qPCR), have longer pre-processing times (e.g., microarray, electrochemical, hybridization methods), insufficient sensitivity (e.g., RT-qPCR, microarray), and low dynamic range (plasmonic, electrochemical), as well as being expensive (all) (Moldovan et al., 2014; El-Khoury et al., 2016; Sohel, 2016; Mumford et al., 2018).
Fundamentally, nearly all-current detection methods rely on non-specific, time-dependent, and unsteady molecular diffusion for critical target-probe hybridization, causing significant variation in results (Roy et al., 2011; Kumar et al., 2013; Degliangeli et al., 2014). Additionally, molecular crowding near detection electrodes or substrates produces steric hindrance (Roy et al., 2011). These issues affect the sensitivity, limit of detection, and speed of detection, especially, in the detection of minute amounts (<1%) of target miRNAs from a larger background (Roy et al., 2011). To minimize molecular crowding, a significant dilution of serum is needed. However, a diluted serum sample (from μLs serum) is insufficient to identify miRNA signatures that are clinically important (Zubakov et al., 2010; Roy et al., 2011; Pritchard et al., 2012; Cheng et al., 2013; Dong et al., 2013; Kumar et al., 2013; Degliangeli et al., 2014). Another critical issue to overcome is the hemolysis―lysis of red blood cells during the long pre-processing time. Since some of the disease-related miRNAs are involved in the normal function of circulatory and immune systems, hemolysis could artificially increase the miRNA levels and produce inaccurate results. For example, according to reports in the literature, in tumor-associated circulating miRNAs, 58% are highly expressed in blood cells, and hemolysis alters circulating miRNA levels by about 50-fold. To minimize the hemolysis, it has been shown that a sample needs to be analyzed within 30 min after collection, but current pre-processing time >4 h. Since screening or diagnosis generally depends on a single sample, this critical issue needs to be solved immediately. One way to address this issue is to introduce a rapid miRNA analysis, ideally, at point-of-care settings (Teunissen et al., 2009; Tuck et al., 2009; Tiberio et al., 2015). If these critical technical issues are solved miRNA, will be the newest pillar of medical diagnostics. Electric fields have been used in many biomedical applications including cell isolation, cell separation, and biomarker molecule (e.g., DNA, and antigens) detection. The electric fields provide ways of developing biomedical assays label-free manner. Additionally, optical detection methods, including fluorescence, surface plasmons and localized plasmons have also been utilized in the detection of biomarker molecules. Fluorescence has been the method of choice for many biomarker detection methods.
2 Fluorescence spectroscopy for biomarker detection
Fluorescence is an optical phenomenon in which some molecules (fluorophores or fluorochromes) absorbed light energy and excited to a higher energy state, called excited energy. Since these molecules cannot sustain the excited energy state for very long, they decay to a lower energy state by emitting light energy; this process is called fluorescence. Fluorescence spectroscopy or fluorometry or spectro-fluorometry is a category of electromagnetic spectroscopy that examines the fluorescence emission of a sample (Rho, 1972; Steiner, 1984; Sharma and Schulman, 1999; Gooijer, 2000; Lakowicz and Masters, 2008; Sauer et al., 2011). Fluorescence spectroscopy is a popular research tool that is commonly used in biochemistry, molecular biology, and biomedical applications for medical diagnosis. Moreover, fluorescence spectroscopy has been used in applications such as DNA sequencing, single bio-molecule sensing, mineralogy, and genomics (Sharma and Schulman, 1999; Gooijer, 2000; Sauer et al., 2011; Rho, 1972). Almost all characteristic features of the fluorescence, including spectral offsets, quantum yields, lifetimes, fluorescence quenching and anisotropies, have been utilized in fundamental and applied research and detection assays (Rho, 1972; Steiner, 1984).
The inclusion of fluorescence as a part of biosensing has led to tremendous growth in both biosensing and fundamental fluorescence studies. As a result, optical bio-sensors have paved the path toward the advancement of highly sensitive, strong, and facile detection of target biomarkers (Borisov and Wolfbeis, 2008; Morales-Narváez et al., 2015). To use fluorescence in the detection, labeling of target molecules with fluorophore tags is needed, and then fluorescence intensity is measured. Later, the fluorescence intensity is converted to molarity values (Borisov and Wolfbeis, 2008; Patel et al., 2010; Damborský et al., 2016; Shtenberg and Segal, 2018). In sensing applications of biomolecules, there are three fundamental parameters used to determine the applicability of the sensing method to a specific application. These are sensitivity, specificity, and limit of detection (Carrara, 2011). Although sensitivity and specificity of fluorescence-based detection are very high, the limit of detection could be further improved to be applicable in many medical applications. For example, studies have reported that the current detection limit of fluorescence-based detection is not sufficient to detect many disease-related biomarkers, particularly for detecting early-stage disease development (Kim et al., 2009; Rusling et al., 2010; Velmanickam et al., 2017).
To further improve the detection limit of the fluorescence-based assays, near-field metal-fluorophore interactions could be used (Figure 1). For example, many studies including Fu et al. (Fu et al., 2010), White et al., (White et al., 2012), Choudhury et al. (Dutta Choudhury et al., 2012), and others have used near-field metal-fluorophore interactions to enhance the fluorescence intensity. Moreover, studies have reported that metal (e.g., silver and gold) could alter the characteristic features of properties of fluorophore molecules; these changes have led to increased fluorescence intensity and stability of fluorophore molecules. We will briefly discuss some of these properties below.
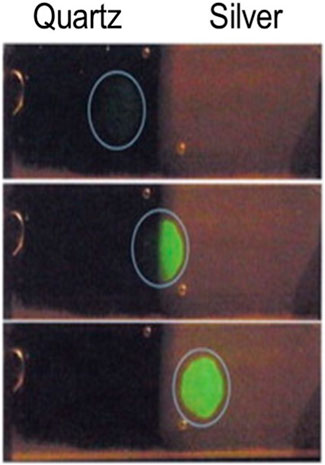
Figure 1. Fluorescence enhancement from silver nanostructures. Photographs of fluorescein-labeled human serum albumin (molar ratio of fluorescein/human serum albumin = 7) on quartz and on Silver fractal-like structures. Fluoroscence was observed with 430 nm excitation and 480 nm long-pass filter. The excitation was progressively moved from the quartz side to the silver side. This figure was extracted from ref (Lakowicz et al., 2003; Aslan et al., 2005) with permission.
The quantum yield of a fluorophore is an important parameter in fluorescence measurements, which gives the efficiency of the fluorescence process (Lakowicz, 2001; Geddes and Lakowicz, 2002a; Lakowicz, 2005). This can then be simply expressed as the ratio between the numbers of photons emitted to the numbers of photons absorbed. The highest quantum yield of a fluorophore is 1 (100%) when the photon absorbed is equal to the photon emitted (Lakowicz, 2001; Geddes and Lakowicz, 2002a; Lakowicz, 2005).
We can demonstrate the quantum yield through the Jablonski diagram (Figure 2). Moreover, the quantum yield and lifetime of a fluorophore are dominated by the magnitudes of the radiative rate (Γ) and the sum of the non-radiative decay rate (
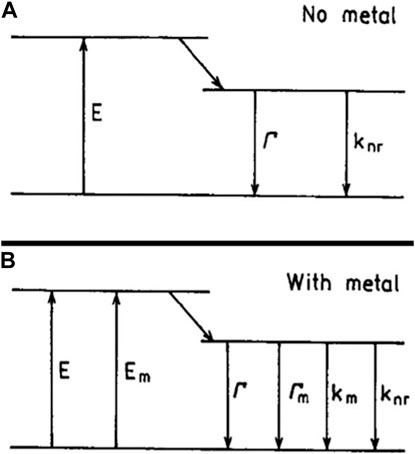
Figure 2. Jablonski diagram without (A) and with (B) the effects of a nearby metal surface. For metal-fluorophore distances over 5 nm, the effect of quenching by the metal (
The lifetime of a fluorophore (
where
The presence of metal could alter the apparent quantum yield (
where
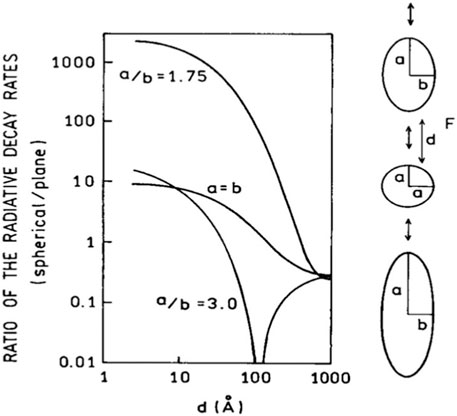
Figure 3. The effects metallic nanostructures on the radiative decay rate of a fluorophore. The volume of each spheroid is equal to a sphere with 40 nm diameter. This figure was adapted from ref (Lakowicz, 2001) with permission.
As stated above, the presence of metal can have detrimental effects, such as fluorescence quenching on fluorophores. Quenching refers to any process that results in a decrease in the fluorescence emission intensity (Lakowicz, 2001; Lakowicz, 1983; Dulkeith et al., 2002; Albani, 2004). During the quenching process, the fluorophore returns to the ground state, without emitting energy or a photon. The quantum yield
where the
As we discussed above, the fundamental mechanisms responsible for the fluorescence enhancement are:
(a) Decreasing fluorophore quenching by reducing the energy transfer from fluorophore molecules to the metal or increase the metal-fluorophore distance,
(b) Increasing the radiative decay rate of fluorophore molecules by aligning the fluorophore dipole with the plasmonic axis and placing the fluorophores in the high surface plasmonic region, and
(c) Concentrating the fluorophore molecules in an area where a local electric field is produced from light scattered by plasmonic structures (Aslan et al., 2005; Lakowicz, 2001; Geddes and Lakowicz, 2002b).
Under optimized conditions, mechanism (a) eliminates the fluorophore quenching, mechanism (b) contributes about 105 times (maximum), and mechanism (c) contributes about 104 times (maximum) to the fluorescence enhancement (Aslan et al., 2005; Lakowicz, 2001; Geddes and Lakowicz, 2002b). Therefore, if mechanisms (a), (b) and (c) are integrated, a maximum of one-billion-fold fluorescence enhancement is possible to achieve. Billion-fold enhancement will easily produce the detection of few fluorophore molecules. Unfortunately, there were no studies that focused on developing strategies to integrate these mechanisms with solutions that are easily implemented in point-of-care settings (Lakowicz, 2001). In the upcoming sections, we will discuss the avenues of using electric fields (<10 MHz) to enhance the fluorescence intensity. One of the potential avenues associated with electric field is the dielectrophoresis of molecules which can potentially be used to optimize the effects of the fluorescence enhancement mechanisms indicated above and achieve significantly large fluorescence enhancement.
In addition to fluorescence spectroscopy, Surface-Enhanced Raman Spectroscopy, Surface Plasmon Resonance and Localized Surface Plasmon Resonance techniques offer promising avenues for biomarker detection.
Surface-enhanced Raman scattering (SERS) is a phenomenon that significantly enhances the Raman signal of molecules when they are in close proximity to nanostructured metallic substrates (Choi et al., 2020; Arabi et al., 2021; Geka et al., 2023). This enhancement arises from two main mechanisms: electromagnetic and chemical effects. The electromagnetic enhancement (
The electromagnetic enhancement arises from two main mechanisms: local field enhancement and re-radiation enhancement. The local field enhancement is quantified by the square of the ratio of the local electric field to the incident electric field at both the excitation laser frequency and the Raman frequency (Geka et al., 2023).
For SERS to effectively utilize these enhancements, it is essential to grasp the maximal potentials. Studies have outlined approximate maximal values fo
These maximal values underscore the transformative potential of SERS in highly sensitive molecular detection and analysis, providing invaluable insights into molecular interactions and surface phenomena.
Surface Plasmon Resonance (SPR) and Localized Surface Plasmon Resonance (LSPR) techniques operate based on the principles of exciting and detecting surface plasmons, which are collective oscillations of free electrons at the interface between a metal and a dielectric medium, typically a prism or a glass substrate coated with a thin metal film (usually gold or silver) (Jazayeri et al., 2020; Azzouz et al., 2022).
In SPR, a collimated beam of monochromatic light, typically from a laser, is directed onto the metal-dielectric interface at a specific angle known as the resonance angle (Azzouz et al., 2022). When the incident light matches the resonance angle, it couples with the surface plasmons, leading to a reduction in reflectivity of the light. This reduction is detected as a dip in the reflectance curve, which is highly sensitive to changes in the refractive index of the medium adjacent to the metal surface (Rezabakhsh et al., 2020; Azzouz et al., 2022). When biomolecules bind to receptors immobilized on the metal surface, they induce changes in the refractive index, causing a shift in the resonance angle or a change in the shape of the reflectance curve. By monitoring these changes, SPR can provide real-time information about biomolecular interactions, including binding kinetics, affinity constants, and analyte concentrations (Azzouz et al., 2022).
LSPR, on the other hand, relies on the interaction of light with metallic nanoparticles, such as gold or silver nanoparticles (Jazayeri et al., 2020). When nanoparticles are illuminated with light of a specific wavelength, the collective oscillations of free electrons in the nanoparticles result in a resonance phenomenon known as LSPR (Jazayeri et al., 2020). This localized resonance leads to enhanced electromagnetic fields in the vicinity of the nanoparticles, which can be exploited for sensing applications.
In both SPR and LSPR, the sensitivity of the technique depends on factors such as the refractive index of the medium near the metal surface, the size, shape, and material properties of the nanoparticles (in the case of LSPR), and the quality of the immobilized receptors on the sensor surface (Rezabakhsh et al., 2020). By optimizing these parameters and employing signal amplification strategies, such as nanoparticle functionalization or secondary detection with labeled molecules, the sensitivity and specificity of SPR and LSPR techniques can be further enhanced (Jazayeri et al., 2020; Azzouz et al., 2022).
3 Dielectrophoresis: utility of electric fields to detect circulating biomarkers
The term dielectrophoresis (DEP) was first used by Phol in 1951, derived from the Greek word “phorein,” an effect where a particle is carried as a result of its dielectric properties (Pohl, 1951). First, Phol defined this effect as “the motion of suspensoid particles relative to that of the solvent resulting from polarization forces produced by an inhomogeneous electric field” (Pohl, 1951; Pethig, 2010). Any material, which can be polarizable when its subject to an exterior electric field is known as dielectric (Gupta, 2009). When a dielectric material is placed in an applied exterior electric field, electric charges do not pass through them due to the electrical insulator characteristic; only the electric charges deviate slightly from their average equilibrium positions, which cause a dielectric polarization in the dielectric materials (Pethig, 2010; Sihvola, 2007; Pethig et al., 2017). Due to the polarization of the dielectric material, electric dipoles are produced in the dielectric materials (Belkin et al., 2017; Thoms et al., 2017). DEP is produced on a suspended dielectric particle in a buffer solution when an exterior non-uniform electric field polarizes the particle; the polarized dielectric particles experience a force called dielectrophoretic force (DEP force). The time-average magnitude of the DEP force on a spherical isentropic homogeneous dielectric particle located in a non-uniform electric field region can be represented by the Eq. 6.
where α is the polarizability of the dielectric particle, ∇ is the vector operator, and E is the RMS value of the electric field. The
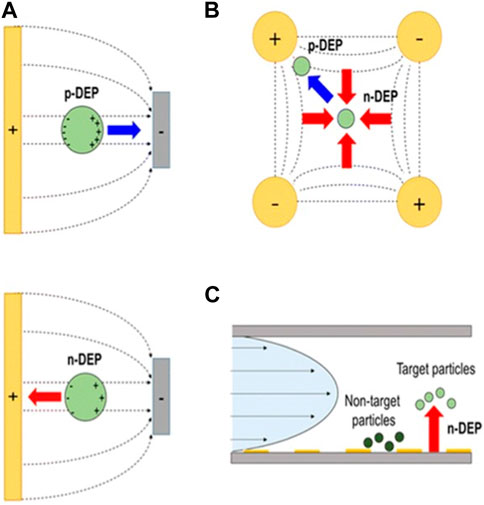
Figure 4. (A) Traditional DEP force can be used to concentrate particles near electrodes using positive or negative DEP force, (B) another electrode configuration to concentrate particles either on electrodes, or away from electrodes, (C) integration of DEP force with viscous drag force for continuous separation of particles. This figure was adapted from ref (Lee et al., 2016) with permission.
The polarizability of a spherical particle can be derived given in the Eq. 7:
where is the radius of the spherical dielectric particle,
where
Variations in the CM factor alter the value of
where
where
DEP force has been used in sensing, trapping, transporting, and sorting different type of dielectric particles (Figure 5) (Pethig, 2010; Pethig and Markx, 1997). In Figure 5C, the electrode design plays an crucial role in creating a non-uniform electric field within microfluidic systems. This electric field is engineered to selectively manipulate particles based on their dielectric properties. By employing electrodes strategically positioned along the microfluidic channel, the design facilitates the trapping and separation of particles. Target particles, responsive to positive DEP, are drawn towards the electrodes and effectively trapped, while non-target particles, experiencing negative DEP or minimal DEP, continue their flow through the channel. Since the biological samples, such as cells, proteins, DNAs, RNAs, and miRNAs are considered as dielectric particles, they can use in DEP studies. The earliest dielectrophoretic studies were largely conducted with the aim of understanding how cells produce DEP forces, and how to use DEP and dielectric properties of cells to better understanding their physicochemical properties (Pethig, 2010; Pohl and Crane, 1971; Pethig and Markx, 1997; Kim et al., 2008). Currently, DEP has made it possible to achieve: separation of cancer cells from healthy cells (Pethig, 2010; Pethig and Markx, 1997; Mulhall et al., 2011; Borchers et al., 2024); separation dead cells from live cells (Patel et al., 2012; Markx et al., 1994); high speed cell sorting (Pethig and Markx, 1997; Kim et al., 2008); cell patterning (Pethig and Markx, 1997; Pohl and Crane, 1971; Velmanickam and Nawarathna, 2017; Velmanickam and Nawarathna, 2016; Wu Y. et al., 2024); rotation of cells (Zhao et al., 2018; Huang et al., 2019; Wu Yupan et al., 2024), and electroporation (Pethig, 2010; Jones, 2003; Pethig and Markx, 1997).
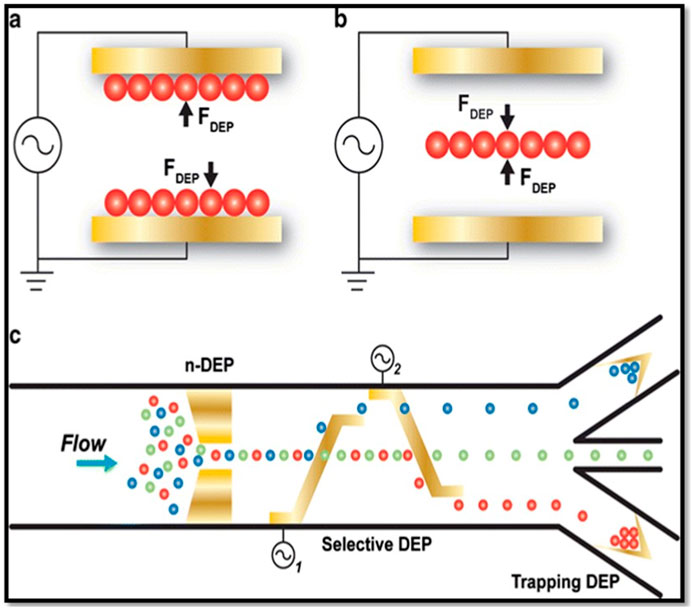
Figure 5. (A) Trapping particles with positive DEP force. (B) Trapping particles using negative DEP force and (C) Use DEP force (positive and/or negative) of particles in microfluidic systems for separating particles. This figure was adapted from ref (Gossett et al., 2010) with permission.
Positive and negative dielectrophoretic phenomenon utilized in the separation of cells or particles. A selected frequency of the signal will be applied to the particle sorting device, where the target particles will feel the positive DEP and become trapped at the electrodes; at the same time nontarget particles experience negative DEP (or repulsive DEP from electrodes) or zero DEP force, and flow out without trapping (Figure 5). Finally, the trapped target particles were released from the electrodes by switching off the field and collected separately. In addition, there are other methods that combine DEP trapping with viscous drag force used to separate materials continuous fashion (Urdaneta and Smela, 2007; Pethig and Markx, 1997; Kim et al., 2008; Qian et al., 2014). In addition to cells, biomarker molecules (such as DNAs, proteins, and RNAs) were trapped on the electrodes using DEP force for calculation of expression levels or molarities (Chou et al., 2002; Asbury et al., 2002; Velmanickam et al., 2019a). In addition, high-speed hybridization of DNAs and RNAs was also successfully conducted using the DEP force, and this might drastically improve the biological assay time (Swami et al., 2009; Gagnon et al., 2010); these developments collectively advanced the biosensing techniques involved in the detection of rare biomarkers in biological, environmental, and other samples (Pethig, 2010; Velmanickam et al., 2019a). Studies have also focused on using DEP in biomarker sensing applications (Demircan et al., 2013). With the introduction of DEP in biosensing, critical sensing parameters such as sensitivity, specificity, and detection limit have significantly improved (Velmanickam et al., 2017; Velmanickam et al., 2019a). For example, the miRNA molecules, which are short in size (∼8 nm) and represent a biomarker for early-stage cancers, have been successfully detected using DEP and proved to be superior to the other current detection techniques available in the medical industry (Velmanickam et al., 2019a).
In addition to the medical applications, DEP has also been widely used in other industrial applications, such as separating minerals (Ballantyne and Holtham, 2010; Ballantyne and Holtham, 2014; Olariu et al., 2017), self-recovering current limiting fuse (Ohtsuka et al., 2006), depositing a patterned coating of a nanostructure material onto a substrate (Pethig, 2010; Froude and Zhu, 2009), collecting of micron-scale particles (granular, threadlike, sheets, or microelectronic parts) (Pethig, 2010; Allahrabbi et al., 2015), polishing local areas of 3D surfaces using abrasive powders (Pethig, 2010; Kim et al., 2004), biodegradation of organic pollutants in soil (Pethig, 2010; Luo et al., 2005), and in water treatments systems (Pethig, 2010; Abbasi Monfared et al., 2018). During the separating of minerals, DEP is applied at different frequencies and based on the frequency, the polarizability of the mineral particles’ changes. Because of these polarizability changes, the minerals are separated from each other using the DEP force (Ballantyne and Holtham, 2014; Ballantyne and Holtham, 2010; Thwar et al., 2007). In self-recovering current limiting fuse, the current-limiting operation was attained by frequently switching between a conducting position, collection of conductive particles between two electrodes brought by DEP, and evaporation or spreading state of the conductive particles due to Brownian motion or diffusion (Pethig, 2010).
In the process of coating a nanostructure material onto a substrate, an AC potential applied between two electrodes for a time limit period. The applied AC potential create a DEP force on the nanostructure materials suspended in the solution and them to the electrodes (Pethig, 2010; Ohtsuka et al., 2006). The polishing of 3D surfaces was achieved by abrasive powders, such as Al2O3, diamond or SiC, dispersed in silicone oil and agitated by DEP forces similar to the coating process (Pohl, 1951; Allahrabbi et al., 2015). In the water treatment systems, the live bacteria and microbes in water were selectively concentrated and separated by the nature of the polarizability of the particle due to the DEP force in different frequencies (Pohl, 1951; Luo et al., 2005). Advances in the use of DEP for manipulation of nanoparticles are also opening up new applications, including the fabrication of a new generation of electronic devices and sensors (Pethig, 2010). In addition to the traditional metal electrode-based DEP studies, the electrode-less DEP has also been developed and used in multiple studies (Chou et al., 2002; Chou and Zenhausern, 2003; Thwar et al., 2007; Regtmeier et al., 2011). The electrode-less DEP could be produced on the molecules that are suspended in the physiological buffers, such as blood, serum, and urine (Chou et al., 2002; Regtmeier et al., 2011); it could further simplify the assays.
When fluorescence enhancement can potentially integrate with electric fields and DEP, the fluorescence enhancement could be increased well beyond the current limits. Traditional fluorescence enhancement studies use the diffusion of molecules or a combination of diffusion and sample flow to concentrate fluorophore molecules in hotspots (Sharma et al., 2014). Diffusion is not a selective or steady state process for selectively concentrating target biomarker molecules. Since the diffusion is not a steady state process, it produces results with a large degree of inter-sample variability. The introduction of DEP could provide a selective method for concentrating biomarker molecules in hotspots for detection. In addition, below, we will discuss a potential avenue for electric fields and DEP force to be used to integrate fluorescence enhancement mechanisms (a), (b) and (c) (indicated above) as well as to eliminate or minimize fluorophore quenching.
4 Utility of electric fields to enhance the near-field fluorescence enhancement mechanisms
Studies have shown that energy transfer from fluorophores to metal quench the fluorescence (mechanism (a) discussed under the title Fluorescence spectroscopy for biomarker detection), which is effective for the fluorophores that are located within about 5 nm from the metal edges of hotspots (Geddes and Lakowicz, 2002b; Seprödi et al., 1969). When dielectrophoresis is used to concentrate molecules in hotspots, fluorophore-labeled biomarker molecules (e.g., miRNA) are fully stretched by the high-electric fields in the hotspots. Therefore, for example, miRNA molecules will form rod-like shapes that are about 8 nm long (each base pair is about 4 Å long) and 2 nm in diameter. When the biomarker molecule experiences dielectrophoresis, it rotates such that the dipole along the longest non-dispersed axis aligns with the field (Seprödi et al., 1969; Morgan et al., 1999). Therefore, the long axis of the rod will be aligned with the field (Seprödi et al., 1969).
The dipole moment of biomarker molecules is larger than the fluorophore molecules at low frequency. For example, dipole moment of miRNA molecules are about 10 times larger than typical fluorophores (e.g., fluorescein and cyanine 3 (Cy3)) (Seprödi et al., 1969; Iqbal et al., 2008). Therefore, miRNA molecules have about 10-times larger polarizability (α) than fluorophores (Nawarathna et al., 2009). Since the polarizability is directly proportional to the dielectrophoretic force, miRNA molecules experience larger DEP force than fluorophore molecules. Therefore, the miRNA portion is attracted to the region with the largest electric field gradient (
The fluorescence enhancement expected from increasing the radiative decay rate (mechanism (b)) is highly dependent on the ability to orient the fluorophore dipole with the plasmonic axis of the hotspots and subsequently place the molecules in the area that has large amount of surface plasmons (Lakowicz, 2005; Geddes and Lakowicz, 2002b). When dielectrophoresis is used to concentrate the fluorophore-labeled biomarker molecules (e.g., fluorophore labeled miRNA molecules), the electric field gradient and electric polarization produced by the external electric potential on the molecules is used (Nawarathna et al., 2009). Metal nanostructures can be approximated as a dipole (Jain and El-Sayed, 2010). Therefore, the highest electric field and the field gradient will be produced along the dipole axis (Pethig, 1996). Typically, this dipole is formed in the sharp edges of the nanostructures (Nawarathna et al., 2009). As a result, fluorophore-labeled biomarker molecules will be aligned along the electric dipole axis. When fluorophore molecules are excited with the appropriate wavelength of light, even though the frequency values are different, if the surface plasmon dipoles is also produced in the same locations as the electric dipole, fluorophore molecules can be aligned with plasmon dipole axis. Therefore, when dielectrophoresis is used to concentrate fluorophore molecules, fluorophore dipole of each molecule could be aligned with the plasmonic dipole axis of the hotspots. This is critically important in enhancing fluorescence because studies have shown that well-aligned fluorophores with the plasmonic axis could enhance the fluorescence by up to a few thousand times. In addition, dielectrophoresis can be used to vary the fluorophore-metal distance to concentrate the fluorophores in the high surface plasmonic region. Briefly, first, attractive dielectrophoresis concentrate molecules near the metal edges of the electrodes and apply repulsive dielectrophoresis to push the concentrated molecules away from the electrode-edges to the lowest field gradient region (Velmanickam et al., 2016; Pethig et al., 1992). One can record fluorescence intensity of the sample as the molecules are being pushed from metals edges. Finally, the distance that produces the largest fluorescence intensity can be found. The two effects that are related to mechanism (b) combine to produce about 105 times enhancement of fluorescence.
The contribution from mechanism (c) depends on the ability to concentrate the fluorophores in an area where there is a large electric field produced by scattered light near the hotspots (Lakowicz, 2001; Sharma et al., 2014). Since sizes of the nanostructures are below 100 nm, significantly large electric field distribution is expected in the hotspots. Moreover, fluorescence enhancement is proportional to the square of the electric field enhancement. To enhance the fluorescence, fluorophore labeled biomarker molecules must be placed in the region that has the largest electric field enhancement (Lakowicz, 2001). The dielectrophoresis of fluorophore labeled biomarker molecules can be used to concentrate the molecules in the high electric field regions. As stated above, the distance between the fluorophore-metal edges will be altered using a combination of attractive and repulsive dielectrophoresis. This effect will have a maximum of 10 4 fold enhancement of fluorescence. For these reasons, the introduction of dielectrophoresis could potentially approach the theoretical limit of about one billion-fold (104+5) enhancement. In theory, billion-fold enhancement translates to increasing fluorescence intensity of one fluorophore molecule to the fluorescence intensity of billion fluorophore molecules. Therefore, the detection of just a few fluorescently labeled molecules without complicated machinery, cost, or capital will be possible. This would be ideal for the detection of early-stage diseases in point-of-care settings. Next, we will discuss recent studies and devices that utilized integrated electric fields and optical detection methods, including fluorescence enhancement to detect biomarker molecules in clinical samples. We have surveyed the recent published studies that utilized electric fields and optical detection methods, including enhanced fluorescence and discussed the few studies to highlight the utility of electric fields with optical detection methods.
5 Integrated electric fields and optical detection methods for biomarker molecular detection
Velmanickam Logeeshan et al. reported on a miRNA detection device (iLluminate-miRNA platform) for point-of-care applications. iLluminate-miRNA platform utilizes microscale and nanoscale metallic structures to achieve rapid and sensitive miRNA detection (Asbury et al., 2002). The fabrication of the device involved the creation of a T-shaped interdigitated array of microelectrodes (TIAMs) with nanoscale plasmonic hotspots (Figures 6A–C). The nanoscale hotspots produced large electric field gradients of approximately 1017 V2/m3 (Asbury et al., 2002). Large electric field gradient produced strong DEP force on the fluorophore labeled target miRNAs or fluorophore labeled miRNA-DNA duplexes and concentrated them on the electrodes. The study used the fluorescence enhancement mechanisms discussed and detected very low levels of miRNA levels. Experimental results demonstrated the detection of miRNA in serum samples (Figure 6D). Importantly, iLluminate-miRNA platform demonstrated superior sensitivity when compared to conventional methods. The detection limit of the iLluminate-miRNA was few fM (Asbury et al., 2002). This technique holds a promise for future clinical applications and warrants further investigation to optimize specificity and explore its potential in measuring miRNA cancer biomarkers.
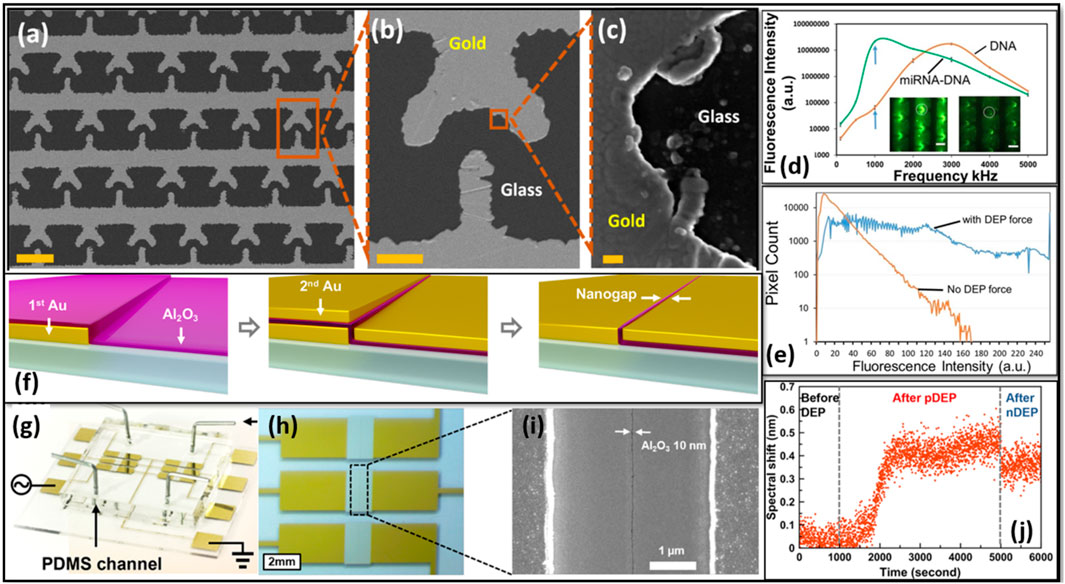
Figure 6. (A) Scanning Electron Microscope (SEM) image of TIAM electrodes, (B) SEM image of a single T-electrode, and (C) SEM images of hotspots. (D) Fluorescence intensity variation with the frequency of applied external potential for miRNA-DNA and DNA molecules. Blue arrows indicate fluorescence intensities at 1 MHz, with insects showing fluorescence images with miRNA-DNA (bright) and without miRNA (dark) molecules (scale bars: 50 μm). (E) Fluorescence intensity of the sample with and without DEP force. (F) Device fabrication via atomic layer lithography, including batch fabrication of trench resonators. (G) A picture of six-device chip with Polydimethylsiloxane (PDMS) microfluidics. (H) Optical-microscope image of the chip, and (I) top-down SEM of trench resonator. (J) Spectral shift as bovine serum albumin molecules (10 pM concentration) are trapped with positive DEP bias of 5 V and 1 kHz frequency, followed by a 0 MHz frequency application after 5,000 s, leading to negative DEP. With permissions from publishers, images labeled (A–C) were extracted from (Velmanickam et al., 2019b), (D) was extracted from (Asbury et al., 2002), (E) was extracted from (Velmanickam et al., 2020), and (F–J) were obtained from (Yoo et al., 2021).
Velmanickam et al. (2020) presented an extension of their previous study, introducing a method to amplify the fluorescence intensity of fluorophore molecules using AC electric fields. This study emphasizes the technique’s potential in developing highly sensitive biosensors for clinical applications. This study addressed the challenge of detecting weak fluorescence intensities from a few target biomarker molecules by enhancing the fluorescence intensity using low-frequency electric fields. The electric fields were utilized to minimize fluorophore quenching, increasing the radiative decay rate (RDR), and concentrating molecules with DEP force in the local plasmonic hotspots and harnessing energy from the excitation source (Figure 6E). Additionally, the authors draw from Nitzan and Gerten’s initial studies to develop an electromagnetic model predicting enhancement based on hotspot properties and distance (Gersten and Nitzan, 1981). Their calculations indicate an approximate 50-fold enhancement. As RDR increases, fluorophores become more stable, allowing for an additional 50-fold increase in illumination intensity, resulting in a total enhancement of 2,500-fold (Velmanickam et al., 2020). Therefore, by combining all the mechanisms provided, the research results in about
Yoo et al. (2021) reported on a study on the integration of plasmonics and electronics using a split-trench resonator platform. This platform combines high-quality-factor resonant plasmonic biosensors with radio frequency (RF) nanogap tweezers, enabling dielectrophoretic trapping of analytes. These researchers utilized a scalable fabrication process, involving photolithography and atomic layer deposition, to create centimeter-long trench resonators with sub-10 nm gaps. To fabricate the device, photolithography was used to transfer rectangular patterns onto a photoresist-coated wafer followed by metal deposition and lift-off to form the first Au rectangular hole patterns (Yoo et al., 2021). Subsequently, a conformal coating of Al2O3 was applied using atomic layer deposition. Directional evaporation was utilized to deposit a second Au film, filling the rectangular hole patterns. The excess second Au film was then removed, resulting in vertically oriented Al2O3 gaps along the perimeter of the patterns. This process was followed by additional lithography steps to create nanogap patterns and a trench structure (Figures 6F–I). Finally, a 1 μm thick Ag layer was deposited using electron-beam evaporation to create a trench along the gap. The key highlight of this study was the successful integration of DEP with nano-plasmonic sensing. By applying an RF electrical bias across the 10 nm gap, strong electric field gradients were generated for efficient trapping of nanoparticles and proteins (Yoo et al., 2021). The trapped analytes were then detected using refractive-index sensing by leveraging the interference between surface-plasmon standing waves and transmitted light through the nanogap. The platform demonstrated remarkable sensitivity and detected the analytes as low as 10 pM (Figure 6J) (Yoo et al., 2021). The integration of DEP in the split-trench resonator platform offers numerous advantages, including enhanced analyte transport and rapid detection capabilities. Compared to traditional diffusion-limited methods, this platform significantly reduces detection times.
A study reported by Cao et al. (2018) explored the integration of insulator-based dielectrophoresis (iDEP) with nanostructured sawtooth and castellated electrode arrays with the nanorods (NDs) for protein enrichment and the development of highly sensitive immunoassays (Figures 7A, B). The authors described the fabrication process of the devices, which involves the deposition of SiO2 and Ag NDs using a customized e-beam evaporator. The ND arrays were designed to create a strong electric field and a high electric field gradient needed to efficiently enrich proteins. This study highlighted the effectiveness of the DEP integrated with ND arrays for protein binding and enrichment. The authors demonstrated a significant acceleration of binding kinetics through fast DEP trapping near the NDs, leading to a shorter incubation time compared to traditional methods (Cao et al., 2018). The signal level reached a steady state within a minute, enabling fast detection of biomarkers. The validation of the concept was carried out using fluorescence-labeled beads and BSA protein, and the corresponding results are presented in Figures 7C–F. The specificity of the detection was evaluated by employing streptavidin proteins as a negative control, which showed a significantly smaller fluorescent signal compared to the positive response of mouse IgG. The incorporation of repeated washing steps during the assay helped to reduce nonspecific binding and eliminated the false-negative results. The accuracy of the assay system was assessed by examining the recovery rate of spiked mouse IgG in human serum. The percent recovery rates fall within the acceptable range of 80%–120%, indicating the high accuracy of the platform for immunoassays (Cao et al., 2018). The authors also demonstrated the clinical utility of their device by detecting prostate-specific antigen (PSA) in human serum, achieving a detection limit of 2.6 ng/mL (Cao et al., 2018).
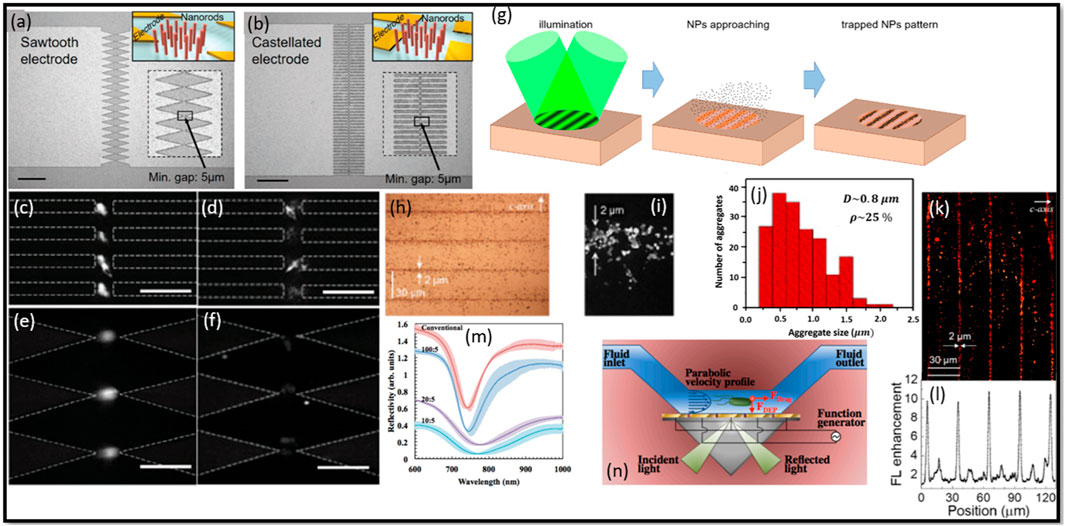
Figure 7. Illustration of two types of electrode arrays used in the experiments: (A) sawtooth and (B) castellated electrode array, where the insets provide schematic representations of microelectrodes integrated with nanorods (NDs). Scale bars: 200 µm. Fluorescent images demonstrate the DEP behavior of bovine serum albumin (BSA) in the castellated electrode device at (C) 5Vp-p, 1 MHz and (D) 5Vp-p, 10 MHz, as well as the sawtooth electrode device at (E) 5Vp-p, 1 MHz and (F) 5Vp-p, 10 MHz, both incorporating oxide nanorods (NDs). (G) PVOT operation scheme using the sequential method involving sinusoidal light profile illumination on a z-cut PV substrate. (H) Microphotographs, (I) SEM images, and (J) histograms of fringes patterns (Pattern III) cluster sizes. (K) FL images and corresponding averages, (L) FL enhancement profiles along the perpendicular direction to the fringes for three Au 170 nm fringe patterns. (M) Contrast the reflectivity of conventional chips with iSPR chips (EG = 5.5 µm). IDEs are perpendicular to SP propagation for EW values of 10 μm, 20 μm, and 100 µm. (N) The DEP-SPR device employs DEP-active interdigitated electrodes (IDEs), replacing the traditional Au sensing surface in the Kretschmann SPR setup. Alternating IDEs, connected to a function generator, generate an AC potential for DEP, enabling the transportation of bacterial mass to the IDE sensing surface by overcoming fluid drag. Panels (A–N) extracted with explicit permission from (Cao et al., 2018; Elvira et al., 2022; Galvan et al., 2018), respectively.
Elvira et al. (2022) conducted a study on the fabrication of a novel device combining DEP and plasmonic-based detection for enhanced molecular detection. Authors employed DEP as a powerful technique for manipulating and trapping molecules, while harnessing the plasmonic properties of metallic nanostructures to enhance the detection sensitivity (Figure 7G). The device fabrication process involved the assembly of gold nanoparticles (Au NPs) into periodic micro-patterns using photovoltaic optoelectronic tweezers (PVOT). Two different sizes of Au NPs, 170 nm and 3.5 nm, were utilized to explore their respective performance (Elvira et al., 2022). The Au patterns fabricated through PVOT exhibited high homogeneity at the microscale and controlled spatial distribution of aggregates with micrometric accuracy (Figures 7H–J). The plasmonic response of the patterns was characterized by reflectance spectroscopy, revealing broad plasmonic bands extending into the visible and near-infrared range. For fluorescence enhancement, the patterns were tested with molecules such as Rhodamine B (RB) dye and DNA biomolecules tagged with RB. The results demonstrated significant fluorescence enhancement factors, reaching up to 10-fold for RB dye and 3-fold for DNA biomolecules, when compared to control samples (Figures 7K, L) (Elvira et al., 2022). This remarkable enhancement was attributed to the synergistic combination of DEP trapping and plasmonic effects, which led to increased excitation rates and quantum efficiencies of the molecules. The integration of DEP and plasmonic in the fabricated device showcases its potential for highly sensitive molecular detection. By leveraging the precise manipulation capabilities of DEP and the enhanced optical properties of plasmonic structures, the device offers a promising platform for various applications such as bio-imaging and biosensing. The fluorescence enhancement of DNA biomolecules tagged with RB further demonstrates the versatility of the device for molecular detection in biological systems.
Velmanickam et al. (2017) presented a study on the integration of dielectrophoresis and fluorescence enhancement to enhance the detection of biomarker molecules using Pearl-shaped Interdigitated Electrodes (PIDEs) (Figures 8A–C). The study focused on the use of fluorescently labeled Avidin molecules as the target biomarkers, with the objective of quantifying low concentrations of Avidin using the integrated DEP and fluorescence enhancement. The authors employed PIDEs, which allows precise patterning and control of the electrode geometry. The device fabrication technique ensures the formation of well-defined electrode structures, crucial for efficient DEP and fluorescence enhancement. To determine the optimum frequency of the electric field, the authors varied the frequency from 50 kHz to 500 kHz and measured the fluorescence intensity near the electrodes. Based on their results, a frequency of 120 kHz was identified as generating the highest fluorescence intensity, indicating efficient concentration of Avidin molecules in the hotspots (Velmanickam et al., 2017). The authors employed fluorescently labeled Avidin molecules with an excitation wavelength around 500 nm and an emission wavelength around 515 nm, enabling specific targeting and detection of the biomarkers (Velmanickam et al., 2017). Furthermore, the authors investigated the fluorescence decay curves of tetramethylrhodamine (TRITC) labeled streptavidin molecules using time-correlated single photon counting (TCSPC) to measure the fluorescence lifetime (Figure 8E). The results demonstrated a reduction in the fluorescence lifetime of molecules placed in the electrodes, providing evidence of the interaction between biomarkers and enhanced electric fields or surface plasmon polaritons (SPPs). The authors reported that their technique was capable of detecting about 1.5 pM of Avidin molecules (Velmanickam et al., 2017). This represents a significant improvement compared to the standard fluorescence technique, which could only detect Avidin at a concentration of 1.5 μM (Figure 8D). Therefore, the integrated technique enhances the detection of Avidin molecules by approximately 1,000,000-fold (Velmanickam et al., 2017). The research presented in this work reported an advancement in the field of biomarker detection by successfully integrating DEP and plasmonic effects. The novelty of this work lies in the fabrication of PIDEs using photolithography and their integration with fluorescence enhancement, enabling efficient concentration of biomarkers and their subsequent interaction with enhanced electric fields. The improvement in detection sensitivity, coupled with the remarkable detection limit improvement, highlights the potential of this integrated approach for the sensitive detection and quantification of biomarker molecules (Velmanickam et al., 2021).
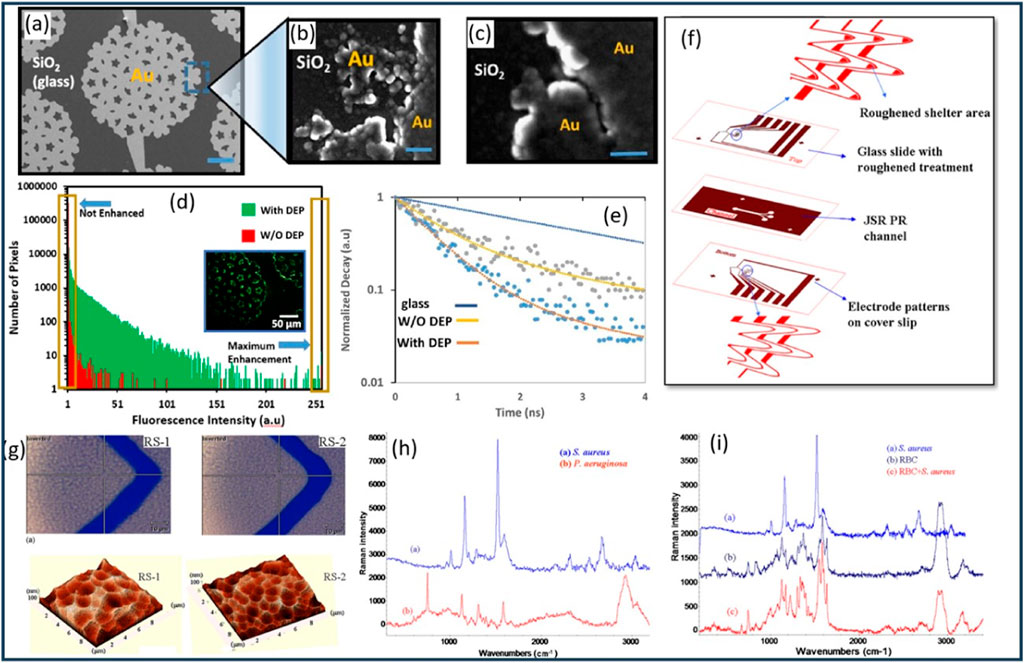
Figure 8. (A) Fabrication and characterization of PIDEs and hotspots. (B, C) Characterization of the hotspots of various sizes and shapes using SEM. (D) Comparison of the fluorescence measured from a sample with and without DEP. The inset shows the picture of the sample with DEP used to generate the histogram plot. (E) Fluorescence decay curves for the TRITC labeled biotin molecules in glass coverslip, on electrodes with DEP and on electrodes without DEP. (F) Chip design and Construction. The chip design included bottom-layer electrodes on a cover slip and top-layer electrodes on treated glass. A metal shelter in front of the top-layer trapping electrode minimized fluorescence noise and boosted Raman signals. (G) Bright field microscope image (top) and Atomic Force Microscope (AFM) image (bottom) of two types of roughened Au surface. (H) The measurement results of S. aureus and P. aeruginosa show distinct SERS spectra that are promising for fingerprint discrimination. (I) SERS signatures of S. aureus, Red Blood Cells (RBC), and RBCs/bacteria mixture (RBCs: bacteria= 1: 10). Figures (A–E) have been extracted from (Velmanickam et al., 2017), while figures (F–I) have been obtained from (Cheng et al., 2010), all reused with explicit permission.
The integration of DEP force and surface-enhanced Raman scattering (SERS) offers several advantages, including rapid and sensitive analysis, label-free detection, and the ability to monitor molecules in real-time. Akinobu Yamaguchi et al. reported a technique for the detection of biomarkers at low concentrations by integrating dielectrophoretic manipulation and SERS (Yamaguchi et al., 2016). This platform enables label-free, real-time monitoring of molecules with exceptional sensitivity. The fabrication of the electrode involves the use of gold electrodes and the manipulation of gold/polystyrene (Au/PS) microparticles. By applying an AC electric field at a frequency of 100 kHz, the attractive van der Waals forces between the Au/PS microparticles were utilized to aggregate and fix them at the middle of the gold electrodes (Yamaguchi et al., 2016). This controlled aggregation creates unique “hot spots” that greatly enhance the SERS signal, allowing for highly sensitive detection of biomarkers. The researchers demonstrated the effectiveness of their platform by detecting and analyzing the Raman spectra of 4,4′-bipyridine (4bpy), a biomarker, in real-time. Notably, they achieved detection at concentrations as low as 100 pM, highlighting the exceptional sensitivity of their platform (Yamaguchi et al., 2016). The fabrication techniques employed in this platform ensure the formation of a tight-knit higher-order structure consisting of the Au/PS microparticles and the biomarker, leading to accurate and reliable detection. This platform holds a promise for various applications, including biomarker detection, environmental pollutant analysis, and investigations of chemical and biological reactions, and opens avenues for its commercial utilization in “lab-on-a-chip” applications and the study of mammalian and plant cell cultures.
Giulia Barzan et al. developed a rapid antibiotic susceptibility test (AST) using a DEP-Raman device to obtain quick results in clinical and microbiological samples. The DEP-Raman device was fabricated using laser lithography, which allows for the creation of intricate and tailored structures with high resolution. The device enabled the characterization of various bacterial strains with high specificity and provided insights into dynamic bacterial interactions with antibiotics. By employing multivariate data analysis, the researchers modeled molecular-level spectral differences within just 1 hour of antibiotic treatment (Barzan et al., 2020). The Raman-based susceptibility test accurately classified bacteria as non-susceptible when treated with sub-minimal inhibitory concentration (MIC) levels of the antibiotic ciprofloxacin (CP), as well as bacteria displaying induced tolerance to the antibiotic due to pre-treatment with triclosan (TCS). Additionally, an environmental E. coli strain naturally resistant to CP was successfully identified as non-susceptible after only 1 hour of treatment at the minimum bactericidal concentration (MBC) of CP (Barzan et al., 2020). These findings underscore the remarkable potential of the DEP-Raman approach as a rapid and reliable method for AST, eliminating the laborious sample preparation and overnight incubation required by conventional microbiological techniques while offering high accuracy and versatility for various applications. The Raman-based susceptibility test exhibited promising performance in predicting bacterial susceptibility to antibiotics. The validation results showed that after 1 h of treatment, the sensitivity in predicting susceptibility was 67%, which increased to 100% at 2 h (Barzan et al., 2020). This result indicates that the DEP-Raman method successfully identified non-susceptible bacteria after a relatively short treatment duration. On the other hand, the specificity of the prediction was 100% after 1 h but decreased to 50% and 33% at 2 h and 3 h, respectively. The classification error in the prediction was 17% at 1 h, which rose to 25% and 33% at 2 h and 3 h, respectively (Barzan et al., 2020). The combined DEP-Raman approach was further validated by standard microbiological assays, which confirmed the significant induction of tolerance over multiple time points after treatment. This method holds great promise for revolutionizing bacterial AST, eliminating the need for time-consuming sample preparation and overnight incubation required by traditional microbiological techniques. With its exceptional accuracy, versatility, and ability to provide rapid results, this approach has the potential to significantly improve patient outcomes and reduce the selection of antibiotic-resistant organisms.
Cheng et al. (2010) developed a DEP-based microfluidic chip with a roughened metal surface for on-chip SERS detection of bacteria (Figure 8F). The chip employed a laser power of approximately 1 mW for SERS signal collection from Staphylococcus aureus (S. aureus). Comparing smooth and roughened electrode surfaces, the researchers observed a significant 30-fold enhancement in the SERS signal due to the greater sharpness and higher electromagnetic tip enhancement provided by the roughened surface. The microfabrication process involved etching glass slides using buffered oxide etchant (BOE) solution to create surface roughness. Two types of roughened surfaces were obtained using controlled etching rates (Figure 8G). After surface roughening, a thin Au/Cr layer was deposited on the glass slide and cover slip. Microelectrode patterning and photolithography techniques were employed to create a microchannel for sample flow. The chip demonstrated effective discrimination between Gram-positive S. aureus and Gram-negative Pseudomonas aeruginosa (P. aeruginosa) bacteria in the detected SERS spectra (Figure 8H). The study focused on the detection and concentration of bacteria using negative DEP force. The DEP behaviors of human red blood cells (RBCs) and S. aureus bacteria were observed to transition from negative to positive as the frequency increased beyond their respective crossover frequencies, which were approximately 700–800 kHz for RBCs and 6–7 MHz for S. aureus (Figure 8I) (Cheng et al., 2010). The researchers prepared the sample by diluting the blood cell solution 1000-fold and resuspending it in an isotonic solution to achieve a final concentration of 106 cells/mL. Similarly, the bacterial solution was prepared at a concentration of
Avijit Barik et al. presented a study on the integration of gold nanohole arrays with a transparent electrode to demonstrate the enhanced surface plasmon resonance (SPR) sensing using dielectrophoresis (Figures 9A–C). In contrast to the suspended flow-through nanohole structure, the authors opt for dead-ended nanohole films, which offer easier fabrication and handling while still generating strong DEP forces for efficient molecular trapping (Barik et al., 2014). By modulating the frequency of the applied alternating current (ac) signal, the authors successfully captured and released 190 nm polystyrene beads on the gold nanohole surface, showcasing the enhanced molecular transport (Barik et al., 2014). Additionally, the biosensor achieves the detection of bovine serum albumin (BSA) molecules at a remarkable concentration of 1 pM in a 5 μL sample droplet (Figure 9D) (Barik et al., 2014). The experimental setup involves large-area gold nanohole arrays prepared through a combination of nanoimprinting and template stripping techniques. Transparent top electrodes composed of ITO-coated glass slides are utilized, and the gap between the ITO-coated slide and the gold nanohole array is defined using 3M Scotch Magic tape as a spacer (Barik et al., 2014). Real-time monitoring of binding events is achieved by tracking the SPR wavelengths in the transmission spectrum. The nanohole array, characterized by a hole diameter of approximately 140 nm and a periodicity of 600 nm, exhibits resonant peaks and dips in the transmission spectrum indicative of SPR (Barik et al., 2014). The spectral features shift towards longer wavelengths as the interfacial refractive index increases due to surface-bound molecules. To measure the resonance shift, a tungsten-halogen lamp illuminates the nanohole array, and the transmitted light is collected and analyzed using an imaging spectrometer coupled with a CCD camera. The study also demonstrates the manipulation of fluorescent polystyrene beads using dielectrophoresis. The absence of applied bias established a baseline measurement, while the application of positive DEP at 1 kHz and negative DEP at 10 MHz provided insights into the behavior of the system under different conditions. Voltage (10 Vp-p) and the specified frequencies ensured effective manipulation of the fluorescent polystyrene beads and enabled the researchers to study their response to the DEP forces (Barik et al., 2014). The fluorescence measurements over the nanohole region reveal an increase in intensity during the positive DEP cycle, indicating successful molecular trapping, while a residual response persists during the subsequent negative DEP cycle due to suspended beads in proximity to the nanoholes.
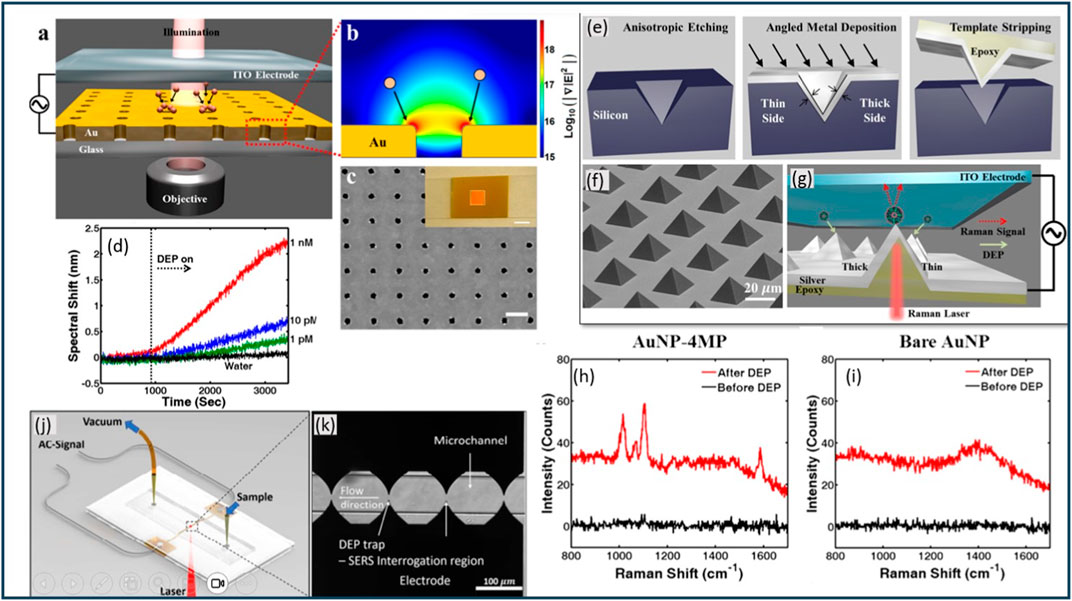
Figure 9. (A) Schematic presentation of the experimental setup for used dielectrophoretic concentration of analyte molecules. (B) Dielectrophoretic forces pull analyte molecules toward hole edges where the electric field intensity gradient is strongest (red color). (C) SEM of a nanohole array reveals a ∼140 nm hole diameter and 600 nm periodicity. Scale bar: 500 nm. Inset: Photo of the template-stripped gold nanohole array. Scale bar: 1 cm. (D) Detection of Low-concentration BSA. Also shows the time-resolved spectral shift from various concentrations of BSA (1 nM, 10 pM, and 1 pM) and control experiment (water). (E) Schematic representation of the template-stripping method used to fabricate an asymmetric pyramid array. (F) SEM image of template-stripped asymmetric pyramids with the base dimension of 20 μm ×20 μm. (G) Illustration of the experimental setup. (H) Raman signal collected before and after DEP trapping of AuNP-4MP on the tip of the pyramid. (I) Negative control experiment with bare AuNP showing disappearance of characteristic Raman peaks from 4MP. (J) PDMS microchannel is sandwiched between an electrode substrate and a glass cover. Yellow pipette tips serve as fluidic reservoirs/connections. Aluminum wires, soldered to contact pads, establish electrical connections between the chip and the AC signal generator. (K) Zoomed in view of the micro channel and the electrodes. Figures (A–K) are extracted from (Barik et al., 2014; Barik et al., 2016; Salemmilani et al., 2018) respectively with explicit permission.
On another study, Velmanickam and Nawarathna (2019) investigated an approach for augmenting the Radiative Decay Rate (RDR) of fluorophore molecules, specifically concentrating on Cy3-labeled miRNA-DNA duplexes. The utility of external electric fields in this context could lead to significant advancements in the realm of fluorescence enhancement and biomolecular detection. The miRNA-DNA duplex molecules were labeled with the low quantum yield fluorophore Cy3 (Quantum yield: 0.04, excitation: 550 nm, emission: 570 nm) and probed how their lifetimes were affected when concentrated in hotspots using dielectrophoresis (Velmanickam and Nawarathna, 2019). The T-shaped Interdigitated Array of Microelectrodes (TIAMs) in conjunction with fractal-like hotspots was used for these experiments. These intricate structures, which are created using a cost-effective method that rivals the traditional E-beam lithography technique, are critical for the successful integration of miRNA-DNA and subsequent fluorescence enhancement. The DEP force was used to concentrate the molecules inside the hotspots to enhance the fluorescence emission (Figures 6A–C). The authors provided a detailed experimental protocol that employs low-quantum yield Cy3 fluorophore molecules and utilizes electric fields to modulate the RDR (Velmanickam and Nawarathna, 2019). Their approach yields evidence for the possibility of RDR enhancement by employing an applied electric field, with the fluorophore’s lifetime dropping from 1.92 ns (without hotspots or electric fields) to 0.35 ns when a 1 MHz, 10 Vpp electric field is applied (Velmanickam and Nawarathna, 2019).
On another study, Barik et al. (2016) presented a study on the integration of Raman spectroscopy and Dielectrophoresis for label-free detection of analyte molecules loaded within small vesicles. The authors emphasized the fabrication technique involving producing a large array of metallic pyramids for DEP-assisted Raman spectroscopy. The fabrication involves the use of standard (100) silicon wafers coated with a 100 nm thick Si3N4 film, followed by photolithography and reactive ion etching to create circular holes of 20 μm diameter. This fabrication method yields approximately 100,000 pyramids on a 4-inch silicon wafer (Figures 9E–G) (Barik et al., 2016). These pyramids possess an asymmetrical metal thickness on opposite facets, creating subwavelength hotspots at the tip when illuminated with linearly polarized light. Through the combination of DEP preconcentration and nano focusing capabilities, the platform enables fast and directed transport of analytes (Barik et al., 2016). The authors successfully trapped 200 nm vesicles and 70 nm gold nanoparticles, highlighting the potential for lab-on-a-chip devices used in studying subcellular structures (Barik et al., 2016). To demonstrate label-free detection using Raman spectroscopy, gold nanoparticles coated with 4MP molecules (AuNP-4MP) are chosen as target particles. The DEP trapping of AuNP-4MP on the pyramid tips is achieved by applying a voltage of 8 Vpp at a frequency of 1 kHz (Figures 9H, I) (Barik et al., 2016). The Raman signal is simultaneously collected, resulting in the appearance of signature Raman peaks from 4MP molecules. The Raman peaks at 1,013, 1,065, 1,099, and 1,584
Salemmilani et al. (2018) presented an integrated microfluidic-dielectrophoresis and surface-enhanced Raman scattering (SERS) platform (Figures 9J, K) for the rapid and specific detection of methamphetamine in saliva under 2 min. The authors successfully addressed challenges related to silver nanoparticle stability, interference from capping agents, and device fouling, resulting in a robust and reusable detection system. By establishing electrical connections and applying AC potentials at specific frequencies, the authors achieved the controlled nanoparticle trapping and agglomeration within the microfluidic device. The experimental setup involves loading 25 μL of saliva samples pre-mixed with freshly prepared iodide-modified silver nanoparticles into the microfluidic device. The flow rate is adjusted to approximately 5 μL/min, and the device is placed on a LabRam Aramis Raman microscope platform with a 633-nm laser as the excitation source (Salemmilani et al., 2018). A 50X objective lens focused the laser onto one of the four trap regions. The fluid flow was then stopped, and a 16Vpp, 2.5 MHz AC potential was applied to the electrodes. The SERS signal intensity increases over time, reaching a maximum intensity after approximately 2 min, demonstrating the successful agglomeration of nanoparticles by dielectrophoresis (Salemmilani et al., 2018). To ensure reusability of the device and minimize fouling, the authors employed passivation techniques such as functionalizing gold electrodes with polyethylene glycol (PEG) and using fluorinated polymers on wet surfaces. After data acquisition, flow was re-established at a higher rate of approximately 20 μL/min, and an AC potential of 12 MHz at 80 Vpp was applied to the electrodes. This combination of high flow rate and secondary electrokinetically-induced flow clears the agglomerated nanoparticles from the microchannels, preparing the device for a new detection run. The authors demonstrated the reusability of the device by performing three consecutive detection-clearance cycles with 500 nM methamphetamine-positive saliva samples and negative controls (Salemmilani et al., 2018). By combining controlled nanoparticle trapping, passivation techniques, and optimized detection-clearance cycles, the authors overcame challenges associated with nanoparticle stability and device fouling. The platform’s ability to detect methamphetamine at physiologically relevant concentrations, its compatibility with complex biological samples like saliva, and its demonstrated reusability make it a promising tool for point-of-care diagnosis.
Schäfer et al. (2015) presented study to introduce an approach for the targeted concentration and capture of biomarker molecules. Through the integration of gold nano-cones into microfluidic channels and the application of an alternating current (AC) voltage, the authors successfully demonstrated the efficient capture of bovine serum albumin (BSA) molecules. The fabrication technique employed by Schäfer et al. involves the transfer of circular etch masks into a gold layer using argon ion milling, resulting in the formation of conical-shaped nanostructures (Figures 10G–J). The nano-cones are then integrated into microfluidic channels using electron beam lithography and polymethyl methacrylate (PMMA) for the preparation of Al2O3 etch masks (Schäfer et al., 2015). This meticulous fabrication process ensures the precise positioning and alignment of the nano-cones within the fluidic channels, enabling effective molecule capture. The experimental results showcase the efficacy of the proposed method, with the collection of BSA molecules observed on the gold nano-cone arrays. The authors varied the channel height to optimize the electric field gradients, and for a channel height of 5 μm, a visibly increased concentration of fluorescently labeled BSA was achieved. An AC voltage of 10 V with a frequency of 2.5 MHz was applied between the nano-cone substrate and the channel cover to produce DEP forces (Schäfer et al., 2015). The combination of plasmonic nanostructures, microfluidic channels, and dielectrophoresis holds significant promise for molecular sensing applications. The authors suggest that this method can be coupled with optical sensing techniques such as surface-enhanced Raman spectroscopy (SERS) or localized surface plasmon resonance (LSPR) sensing, enabling high sensitivity and spatial resolution (Schäfer et al., 2015). Furthermore, the integration of plasmonic nanostructures into microfluidic channels opens doors to incorporating sorting mechanisms, overcoming challenges related to nonspecific binding of different molecules during the sensing process (Figure 10L).
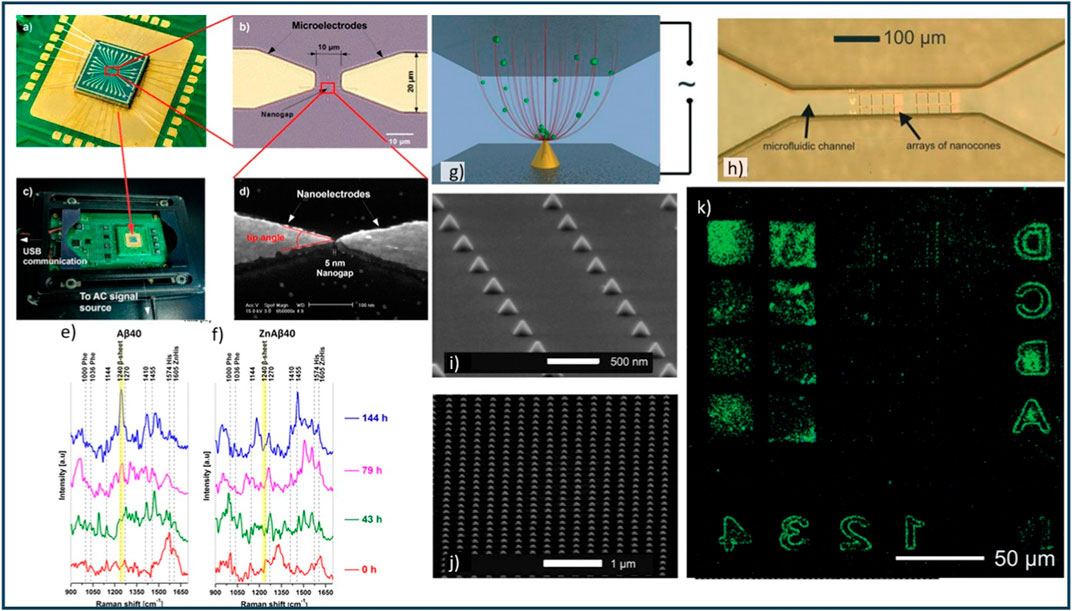
Figure 10. (A) 7 × 7 mm chip with wire-bonded connections featuring 15 pairs of gold (Au) electrodes. (B) Microscopic view of a single pair of microelectrodes and nanoelectrodes. (C) The sensing system integrated onto a specially designed printed circuit board. (D) Electron microscope image showcasing the nanogap between electrodes. Visualization of Aβ40 in solution using the ThT fluorescence assay. (E) SERS spectra captured by the nanogap device without Zn2+, and (F) with Zn2+ at various time points (0, 43, 79, and 144 h). The highlighted yellow bars represent the amide III β-sheet mode at 1,240
Vu et al. (2021) presented a platform that combines dielectrophoresis trapping with SERS for protein conformation studies. The device fabrication involved e-beam lithography and e-gun evaporation with a subsequent lift-off process on a silicon substrate coated with a 1 μm SiO2 layer (Figures 10A–D). The nanostructures, including microwires and nanoelectrodes, were precisely defined using UV lithography and e-beam writing, respectively. Scanning electron microscopy was employed to inspect the fabricated chips, confirming the quality and dimensions of each nanogap. In experiments, Aβ40 peptides and FAM-Aβ42 oligomers were used. Aβ40 peptides were synthesized using Fmoc N-(9-fluorenyl) methoxycarbonyl solid-phase chemistry, purified by reverse-phase high-performance liquid chromatography, and dissolved in Tris-HCl buffer (Vu et al., 2021). The Aβ40 solutions were prepared in the presence or absence of Zn2+ ions to investigate their effects on peptide aggregation. FAM-Aβ42 oligomers, purchased from Biopeptide, were used for fluorescence observations (Vu et al., 2021). Fluorescence microscopy was employed to acquire images using an inverted fluorescence microscope equipped with an LED lamp as the light source. A 100× oil-immersion objective and an EMCCD camera were used to observe the fluorescent signals. Raman spectra were obtained using a confocal Raman microscope with a 640 nm excitation laser. The laser power was controlled to deliver 1–2 mW to the samples, and a 100× air objective was used to focus the laser on the nanoelectrodes (Vu et al., 2021). Raman measurements were taken at different stages of peptide aggregation, and the recorded wavenumber axis was calibrated using the Si phonon peak (Figures 10E, F). By controlling the molecular orientation through DEP trapping, the researchers achieved consistent and enhanced SERS spectra (Vu et al., 2021). The high sensitivity of the device allowed for the detection of low peptide concentrations, which is particularly relevant for studying biomarkers in physiological fluids.
Galvan et al. (2018) and his team conducted a study to improve the performance of surface plasmon resonance (SPR)-based bacterial biosensors. These biosensors often face challenges due to the diffusion-limited mass transport of bacteria to the sensing surface. To overcome this, the team developed a dielectrophoresis (DEP)-enhanced SPR system, modifying conventional SPR chips with micron-sized gaps to generate interdigitated electrodes (IDEs) on interdigitated SPR (iSPR) chips (Figure 7N). The IDEs were patterned into a ∼3 μm SU-8 film on a silicon wafer, with fixed electrode gaps of 5 μm and electrode widths of 10, 20, and 100 μm (Figure 7M) (Galvan et al., 2018). These were then integrated into 50 nm Au films to create iSPR chips. The fabrication process involved several steps, including the creation of a patterned self-assembled monolayer (SAM) of ODT on the SPR chips and an Au etching solution to remove unprotected regions of the Cr/Au film (Galvan et al., 2018). These IDEs produced asymmetrical electric fields that exerted an external force on individual bacterial cells, driving cellular adsorption on the IDE surface for detection. The team investigated the effect of externally applied DEP on the generation of surface plasmons and the influence of the imposed dielectrophoretic force on mass transfer of bacterial cells during SPR-based detection. The iSPR chips with 100 μm electrode widths were found to effectively support SPR, with sensitivity comparable to conventional SPR chips. The team modified the surfaces of these iSPR chips with mannose to target the FimH adhesin of Escherichia coli, thereby increasing cellular adhesion. Authors have achieved a limit of detection (LOD) of approximately 3.0 × 10² CFU/mL E. coli on mannosylated iSPR chips under positive-DEP conditions (Galvan et al., 2018). This represents a nearly five orders of magnitude improvement compared to mannosylated conventional SPR chips without DEP. Furthermore, authors amplified the SPR responses and enabled selective detection using anti-E. coli polyclonal antibodies, demonstrating that dilute suspensions of target bacteria can be selectively detected in the presence of non-target bacteria with iSPR chips.
6 Conclusion
We discussed the recent efforts of integrated electric fields and optical detection techniques toward the detection of biomarkers (Table 1). Fluorescence spectroscopy is one of the widely utilized techniques in biomarker detection. Since fluorescence enhancement play a critical role in detection of weak fluorescence, deep understanding of how each fundamental mechanism exclusively contributes to the fluorescence enhancement is needed to successfully enhance the fluorescence beyond current capabilities. Since all three of the mechanisms are directly related to near-field electromagnetic phenomena, their contribution to fluorescence enhancement is primarily dependent on the metal-fluorophore distance and their orientation (Aslan et al., 2005; Velmanickam et al., 2017; Lakowicz, 2001; Lakowicz, 2005; Geddes and Lakowicz, 2002b). We have discussed the utility of low frequency electric fields (<5 MHz) and DEP force to integrate and optimize the near-field electromagnetic phenomena. Additional investigations are needed for enhance the deep understanding of metal-fluorophore interactions using low electric fields and DEP force. In addition, studies have used the DEP force to separate molecules, e.g., isolate fluorophore-labeled miRNA-DNA duplexes without contamination with non-hybridized fluorophore labeled complementary DNA molecules in hotspots. Utilizing dielectrophoresis successfully requires fundamental understanding on the electric polarization of biomarker molecules (Nawarathna et al., 2009). Dielectrophoresis studies have also focused on studying the long nucleic acid molecules (e.g., mRNA and DNA) and proteins. Unfortunately, the basic understanding of short nucleic acid molecules is still developing, especially for short miRNA, DNA and miRNA-DNA duplex molecules (Asbury et al., 2002; Washizu and Kurosawa, 1990). Therefore, future studies should focus on estimating the frequency dependent electric polarization of miRNA, short DNA, miRNA-DNA duplexes, antigens, and antigen-antibody molecules. These studies will provide new knowledge on how molecular structures (single and double stranded) and types of molecules (miRNA and DNA) interact with electric fields and polarize in a frequency-dependent manner. Overall, based on our review of recent published studies, integrated optical detection and electric fields show a great promise toward detecting biomarkers in clinical samples at point-of-care. We believe that the combination of electric fields and optical detection provides a viable pathway for rapid and sensitive detection of biomarkers at point-of-care. Once fully developed, rapid biomarker detection can be performed at point-of-care eighter to develop diagnostic and prognostics tests or to develop routine screening for cancer and other diseases.
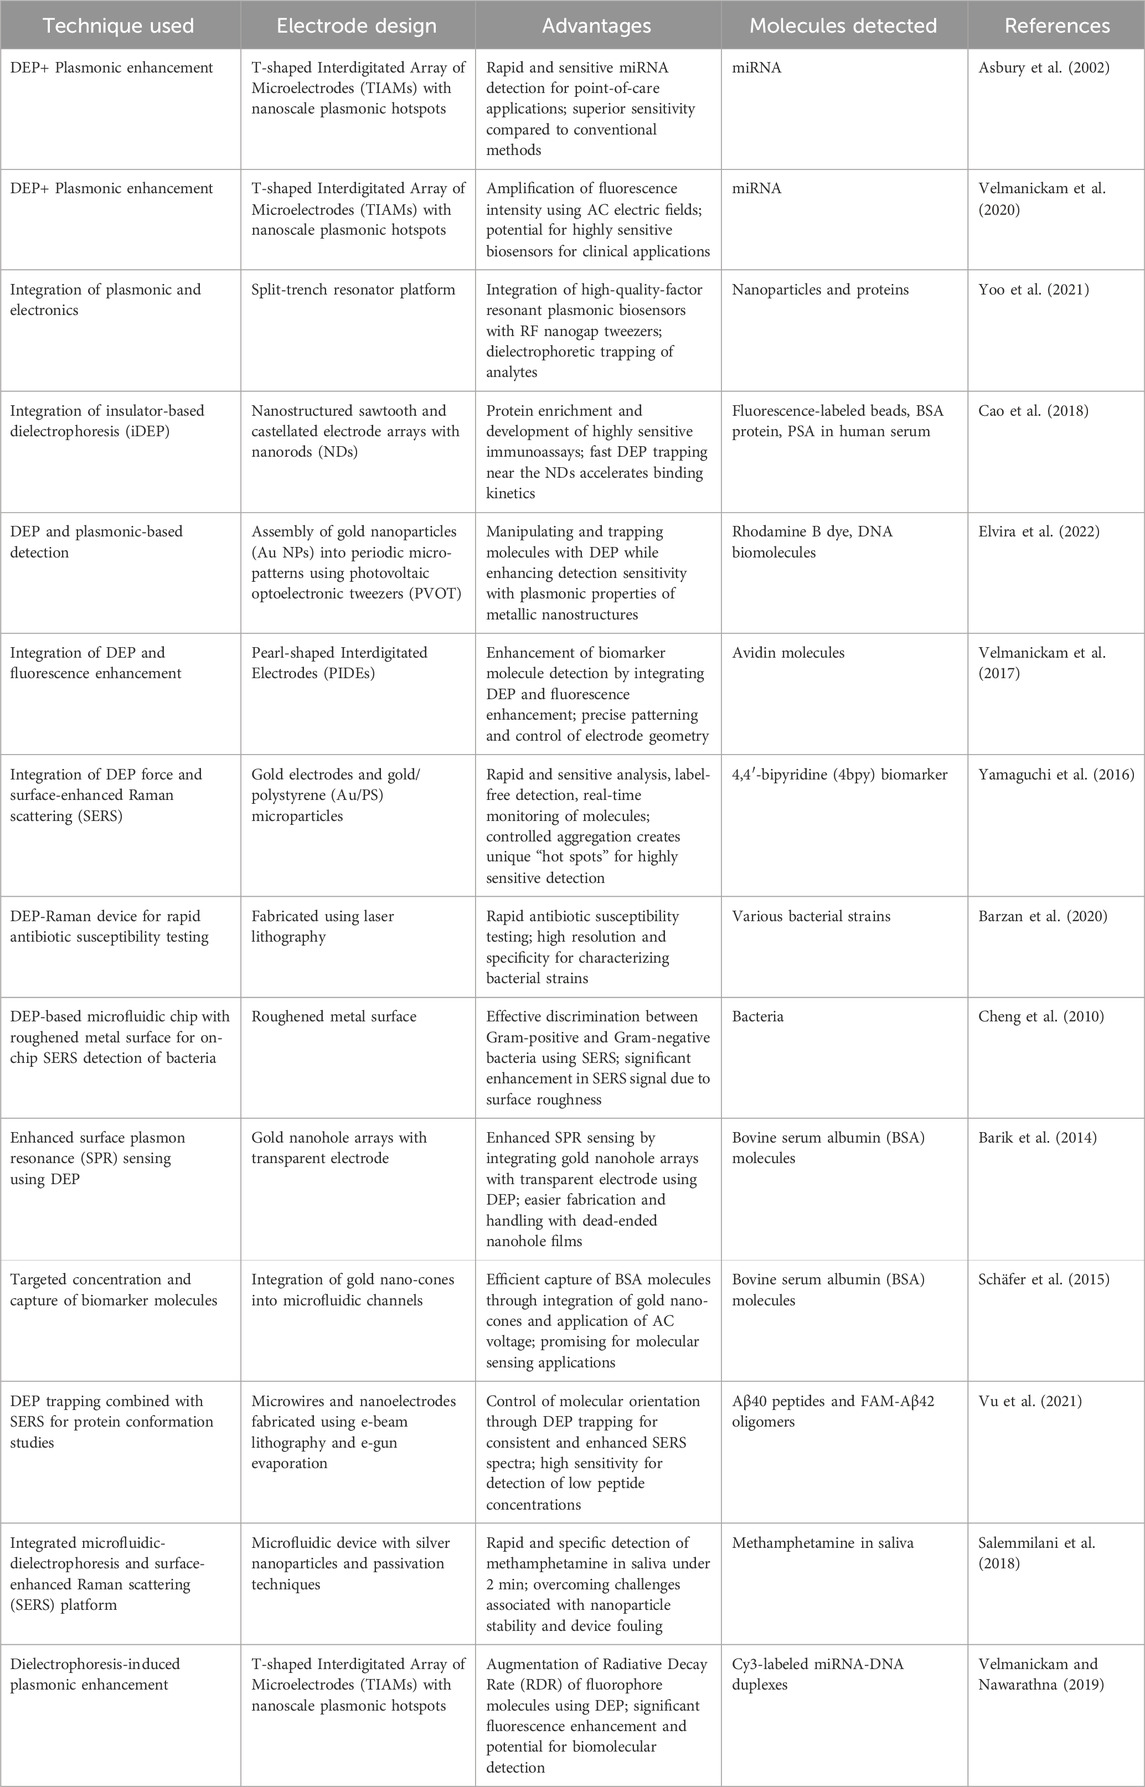
Table 1. Advanced techniques combining dielectrophoresis (DEP) with various sensing modalities for biomolecular detection.
Author contributions
LV: Data curation, Formal Analysis, Writing–original draft, Writing–review and editing. DN: Conceptualization, Data curation, Formal Analysis, Funding acquisition, Writing–original draft, Writing–review and editing.
Funding
The author(s) declare financial support was received for the research, authorship, and/or publication of this article. DN acknowledges the financial support from the National Science Foundation (grant numbers: 2300064 and 2310106).
Conflict of interest
The authors declare that the research was conducted in the absence of any commercial or financial relationships that could be construed as a potential conflict of interest.
Publisher’s note
All claims expressed in this article are solely those of the authors and do not necessarily represent those of their affiliated organizations, or those of the publisher, the editors and the reviewers. Any product that may be evaluated in this article, or claim that may be made by its manufacturer, is not guaranteed or endorsed by the publisher.
References
Abbasi Monfared, M., Sheikhi, M., Kasiri, N., and Mohammadi, T. (2018). Experimental investigation of oil-in-water microfiltration assisted by dielectrophoresis: operational condition optimization. Chem. Eng. Res. Des. 137, 421–433. doi:10.1016/j.cherd.2018.08.002
Albani, J. R. (2004). Fluorescence quenching. Struct. Dyn. Macromol. Absorpt. Fluoresc. Stud., 141–192. doi:10.1016/B978-044451449-3/50004-6
Allahrabbi, N., Chia, Y. S. M., Saifullah, M. S. M., Lim, K. M., and Yung, L. Y. L. (2015). A hybrid dielectrophoretic system for trapping of microorganisms from water. Biomicrofluidics 9, 034110. doi:10.1063/1.4922276
Arabi, M., Ostovan, A., Zhang, Z., Wang, Y., Mei, R., Fu, L., et al. (2021). Label-free SERS detection of Raman-Inactive protein biomarkers by Raman reporter indicator: toward ultrasensitivity and universality. Biosens. Bioelectron. 174, 112825. doi:10.1016/j.bios.2020.112825
Arroyo, J. D., Chevillet, J. R., Kroh, E. M., Ruf, I. K., Pritchard, C. C., Gibson, D. F., et al. (2011). Argonaute2 complexes carry a population of circulating MicroRNAs independent of vesicles in human plasma. Proc. Natl. Acad. Sci. 108 (12), 5003–5008. doi:10.1073/pnas.1019055108
Asbury, C. L., Diercks, A. H., and Van Den Engh, G. (2002). Trapping of DNA by dielectrophoresis. Electrophoresis 23, 2658–2666. doi:10.1002/1522-2683(200208)23:16<2658::AID-ELPS2658>3.0.CO;2-O
Aslan, K., Gryczynski, I., Malicka, J., Matveeva, E., Lakowicz, J. R., and Geddes, C. D. (2005). Metal-enhanced fluorescence: an emerging tool in biotechnology. Curr. Opin. Biotechnol. 16, 55–62. doi:10.1016/j.copbio.2005.01.001
Azzouz, A., Hejji, L., Kim, K.-H., Kukkar, D., Souhail, B., Bhardwaj, N., et al. (2022). Advances in surface plasmon resonance–based biosensor technologies for cancer biomarker detection. Biosens. Bioelectron. 197, 113767. doi:10.1016/j.bios.2021.113767
Ballantyne, G. R., and Holtham, P. N. Application of dielectrophoresis for the separation of minerals. Miner. Eng. 23, 350–358. 2010. doi:10.1016/j.mineng.2009.09.001
Ballantyne, G. R., and Holtham, P. N. (2014). Evaluation of the potential for using dielectrophoresis to separate minerals. Miner. Eng. 55, 75–79. doi:10.1016/j.mineng.2013.09.009
Barbierato, M., Zusso, M., Skaper, S., and Giusti, P. (2015). MicroRNAs: emerging role in the endogenous μ opioid system. CNS Neurological Disord. - Drug Targets 14 (2), 239–250. doi:10.2174/1871527314666150116123932
Barik, A., Cherukulappurath, S., Wittenberg, N. J., Johnson, T. W., and Oh, S.-H. (2016). Dielectrophoresis-assisted Raman spectroscopy of intravesicular analytes on metallic pyramids. Anal. Chem. 88 (3), 1704–1710. doi:10.1021/acs.analchem.5b03719
Barik, A., Otto, L. M., Yoo, D., Jose, J., Johnson, T. W., and Oh, S.-H. (2014). Dielectrophoresis-enhanced plasmonic sensing with gold nanohole arrays. Nano Lett. 14 (4), 2006–2012. doi:10.1021/nl500149h
Barzan, G., Sacco, A., Mandrile, L., Giovannozzi, A. M., Brown, J., Portesi, C., et al. (2020). New frontiers against antibiotic resistance: a Raman-based approach for rapid detection of bacterial susceptibility and biocide-induced antibiotic cross-tolerance. Sensors Actuators B Chem. 309, 127774. doi:10.1016/j.snb.2020.127774
Belkin, A., Bezryadin, A., Hendren, L., and Hubler, A. (2017). Recovery of alumina nanocapacitors after high voltage breakdown. Sci. Rep. 7 (1), 932–938. doi:10.1038/s41598-017-01007-9
Birnbaum, H. G., White, A. G., Schiller, M., Waldman, T., Cleveland, J. M., and Roland, C. L. (2011). Societal costs of prescription opioid abuse, dependence, and misuse in the United States. Pain Med. 12, 657–667. doi:10.1111/j.1526-4637.2011.01075.x
Borchers, J. S., Clark, M. J., Van Scoy, S. B., and Anand, R. K. (2024). Array of interdigitated bipolar electrodes for selective capture and analysis of melanoma cells. ChemElectroChem 11, e202300345. doi:10.1002/celc.202300345
Borisov, S. M., and Wolfbeis, O. S. (2008). Optical biosensors. Chem. Rev. 108, 423–461. doi:10.1021/cr068105t
Cao, Z., Zhu, Y., Liu, Y., Dong, S., Chen, X., Bai, F., et al. (2018). Dielectrophoresis-based protein enrichment for a highly sensitive immunoassay using Ag/SiO2 nanorod arrays. Small 14, 1703265. doi:10.1002/smll.201703265
Çetin, B., and Li, D. (2011). Dielectrophoresis in microfluidics technology. Electrophoresis 32, 2410–2427. doi:10.1002/elps.201100167
Chalana, H., Kundal, T., Gupta, V., and Malhari, A. S. (2016). Predictors of relapse after inpatient opioid detoxification during 1-year follow-up. J. Addict. 2016, 1–7. doi:10.1155/2016/7620860
Cheng, I.-F., Lin, C.-C., Lin, D.-Y., and Chang, H.-C. (2010). A dielectrophoretic chip with a roughened metal surface for on-chip surface-enhanced Raman scattering analysis of bacteria. Biomicrofluidics 4 (3), 034104. doi:10.1063/1.3474638
Cheng, L., Quek, C. Y. J., Sun, X., Bellingham, S. A., and Hill, A. F. (2013). The detection of MicroRNA associated with alzheimer’s disease in biological fluids using next-generation sequencing technologies. Front. Genet. 4, 150. doi:10.3389/fgene.2013.00150
Choi, N., Dang, H., Das, A., Sim, M. S., Chung, I. Y., and Choo, J. (2020). SERS biosensors for ultrasensitive detection of multiple biomarkers expressed in cancer cells. Biosens. Bioelectron. 164, 112326. doi:10.1016/j.bios.2020.112326
Chou, C. F., Tegenfeldt, J. O., Bakajin, O., Chan, S. S., Cox, E. C., Darnton, N., et al. (2002). Electrodeless dielectrophoresis of single- and double-stranded DNA. Biophysical J. 83, 2170–2179. doi:10.1016/S0006-3495(02)73977-5
Chou, C. F., and Zenhausern, F. (2003). Electrodeless dielectrophoresis for micro total analysis systems. IEEE Eng. Med. Biol. Mag. 22, 62–67. doi:10.1109/MEMB.2003.1266048
Cui, L., Holmes, D., and Morgan, H. (2001). The dielectrophoretic levitation and separation of latex beads in microchips. Electrophoresis 22, 3893–3901. doi:10.1002/1522-2683(200110)22:18<3893::AID-ELPS3893>3.0.CO;2-2
Damborský, P., Švitel, J., Katrlík, J., Dey, D., Goswami, T., Liedberg, B., et al. (2016). Optical biosensors. Essays Biochem. 60 (1), 91–100. doi:10.1042/EBC20150010
Degliangeli, F., Pompa, P. P., and Fiammengo, R. (2014). Nanotechnology-based strategies for the detection and quantification of MicroRNA. Chem. - A Eur. J. 20, 9476–9492. doi:10.1002/chem.201402649
Demircan, Y., Özgür, E., and Külah, H. (2013). Dielectrophoresis: applications and future outlook in point of care. Electrophoresis 34, 1008–1027. doi:10.1002/elps.201200446
Dimaki, M., and Bøggild, P. (2004). Dielectrophoresis of carbon nanotubes using microelectrodes: a numerical study. Nanotechnology 15, 1095–1102. doi:10.1088/0957-4484/15/8/039
Dong, H., Lei, J., Ding, L., Wen, Y., Ju, H., and Zhang, X. (2013). MicroRNA: function, detection, and bioanalysis. Chem. Rev. 113, 6207–6233. doi:10.1021/cr300362f
Dulkeith, E., Morteani, A. C., Niedereichholz, T., Klar, T. A., Feldmann, J., Levi, S. A., et al. (2002). Fluorescence quenching of dye molecules near gold nanoparticles: radiative and nonradiative effects. Phys. Rev. Lett. 89, 203002. doi:10.1103/PhysRevLett.89.203002
Dutta Choudhury, S., Badugu, R., Ray, K., and Lakowicz, J. R. (2012). Silver-gold nanocomposite substrates for metal-enhanced fluorescence: ensemble and single-molecule spectroscopic studies. J. Phys. Chem. C 116, 5042–5048. doi:10.1021/jp212242x
Ehrlich, P. (1953). Dielectric properties of teflon from room temperature to 314-degrees-C and from frequencies of 10_2 to 10_5 c/S. J. Res. Natl. Bureau Stand. 51, 185. doi:10.6028/jres.051.024
El-Khoury, V., Pierson, S., Kaoma, T., Bernardin, F., and Berchem, G. (2016). Assessing cellular and circulating MiRNA recovery: the impact of the RNA isolation method and the quantity of input material. Sci. Rep. 6 (December 2015), 19529–19614. doi:10.1038/srep19529
Elvira, I., Puerto, A., Mínguez-Vega, G., Rodríguez-Palomo, A., Gómez-Tornero, A., García-Cabañes, A., et al. (2022). Micro-patterns of gold nanoparticles assembled by photovoltaic optoelectronic tweezers: application to plasmonic fluorescence enhancement. Opt. Express 30, 41541–41553. doi:10.1364/oe.471928
Florence, C. S., Zhou, C., Luo, F., and Xu, L. (2016). The economic burden of prescription opioid overdose, abuse, and dependence in the United States, 2013. Med. Care 54, 901–906. doi:10.1097/MLR.0000000000000625
Froude, V. E., and Zhu, Y. (2009). Dielectrophoresis of functionalized lipid unilamellar vesicles (liposomes) with contrasting surface constructs. J. Phys. Chem. B 113, 1552–1558. doi:10.1021/jp808454w
Fu, C. C., Ossato, G., Long, M., Digman, M. A., Gopinathan, A., Lee, L. P., et al. (2010). Bimetallic nanopetals for thousand-fold fluorescence enhancements. Appl. Phys. Lett. 97 (20), 1–4. doi:10.1063/1.3495773
Gagnon, Z., Senapati, S., and Chang, H. C. (2010). Optimized DNA hybridization detection on nanocolloidal particles by dielectrophoresis. Electrophoresis 31, 666–671. doi:10.1002/elps.200900473
Galvan, D. D., Parekh, V., Liu, E., Liu, E.-L., and Yu, Q. (2018). Sensitive bacterial detection via dielectrophoretic-enhanced mass transport using surface-plasmon-resonance biosensors. Anal. Chem. 90 (24), 14635–14642. doi:10.1021/acs.analchem.8b05137
Ganepola, G. A., Rutledge, J. R., Suman, P., Yiengpruksawan, A., and Chang, D. H. (2014). Novel blood-based MicroRNA biomarker panel for early diagnosis of pancreatic cancer. World J. Gastrointest. Oncol. 6, 22. doi:10.4251/wjgo.v6.i1.22
Gascoyne, P. R. C., and Vykoukal, J. (2002). Particle separation by dielectrophoresis. Electrophoresis 23, 1973. doi:10.1002/1522-2683(200207)23:13<1973::AID-ELPS1973>3.0.CO;2-1
Geddes, C. D., and Lakowicz, J. R. (2002a). Editorial: metal-enhanced fluorescence. J. Fluoresc. 12 (2), 121–129. doi:10.1023/A:1016875709579
Geddes, C. D., and Lakowicz, J. R. (2002b). Metal-enhanced fluorescence. J. Fluoresc. 12, 121–129. doi:10.1023/A:1016875709579
Geka, G., Kanioura, A., Likodimos, V., Gardelis, S., Papanikolaou, N., Kakabakos, S., et al. (2023). SERS immunosensors for cancer markers detection. Mater. (Basel) 16 (10), 3733. doi:10.3390/ma16103733
Gersten, J., and Nitzan, A. (1981). Spectroscopic properties of molecules interacting with small dielectric particles. J. Chem. Phys. 75 (3), 1139–1152. doi:10.1063/1.442161
Gierhart, B. C., Howitt, D. G., Chen, S. J., Smith, R. L., and Collins, S. D. (2007). Frequency dependence of gold nanoparticle superassembly by dielectrophoresis. Langmuir 23, 12450–12456. doi:10.1021/la701472y
Goater, A. D., and Pethig, R. (1999). Electrorotation and dielectrophoresis. Parasitology 117, 177–189. doi:10.1017/S0031182099004114
Godfrey, K. M., Lillycrop, K. A., Burdge, G. C., Gluckman, P. D., and Hanson, M. A. (2007). Epigenetic mechanisms and the mismatch concept of the developmental origins of health and disease. Pediatr. Res. 61, 5R–10R. doi:10.1203/pdr.0b013e318045bedb
Gooijer, C. (2000). Introduction to fluorescence spectroscopy. Anal. Chim. Acta 419, 116–117. doi:10.1016/S0003-2670(00)01086-2
Goonetilleke, K. S., and Siriwardena, A. K. (2007). Systematic review of carbohydrate antigen (CA 19-9) as a biochemical marker in the diagnosis of pancreatic cancer. Eur. J. Surg. Oncol. 33, 266–270. doi:10.1016/j.ejso.2006.10.004
Gossett, D. R., Weaver, W. M., Mach, A. J., Hur, S. C., Tse, H. T. K., Lee, W., et al. (2010). Label-free cell separation and sorting in microfluidic systems. Anal. Bioanal. Chem. 397, 3249–3267. doi:10.1007/s00216-010-3721-9
Gryczynski, I., Malicka, J., Gryczynski, Z., and Lakowicz, J. R. (2004). Radiative decay engineering 4. Experimental studies of surface plasmon-coupled directional emission. Anal. Biochem. 324 (2), 170–182. doi:10.1016/j.ab.2003.09.036
Gupta, T. (2009). Dielectric materials. Copp. Interconnect Technol., 67–110. doi:10.1007/978-1-4419-0076-0_2
Hanson, M., Godfrey, K. M., Lillycrop, K. A., Burdge, G. C., and Gluckman, P. D. (2011). Developmental plasticity and developmental origins of non-communicable disease: theoretical considerations and epigenetic mechanisms. Prog. Biophysics Mol. Biol. 106, 272–280. doi:10.1016/j.pbiomolbio.2010.12.008
Hayba, N., Partridge, S. R., Nour, M. M., Grech, A., and Allman Farinelli, M. (2018). Effectiveness of lifestyle interventions for preventing harmful weight gain among young adults from lower socioeconomic status and ethnically diverse backgrounds: a systematic review. Obes. Rev. 19, 333–346. doi:10.1111/obr.12641
Honegger, T., Berton, K., Picard, E., and Peyrade, D. (2011). Determination of clausius-mossotti factors and surface capacitances for colloidal particles. Appl. Phys. Lett. 98. doi:10.1063/1.3583441
Huang, L., He, W., and Wang, W. (2019). A cell electro-rotation micro-device using polarized cells as electrodes. ELECTROPHORESIS 40, 784–791. doi:10.1002/elps.201800360
Hughes, M. P. (2002). Strategies for dielectrophoretic separation in laboratory-on-a-chip systems. Electrophoresis 23, 2569–2582. doi:10.1002/1522-2683(200208)23:16<2569::AID-ELPS2569>3.0.CO;2-M
Hwang, Y., Sohn, H., Phan, A., Yaghi, O. M., and Candler, R. N. (2013). Dielectrophoresis-assembled zeolitic imidazolate framework nanoparticle-coupled resonators for highly sensitive and selective gas detection. Nano Lett. 13, 5271–5276. doi:10.1021/nl4027692
Iqbal, A., Arslan, S., Okumus, B., Wilson, T. J., Giraud, G., Norman, D. G., et al. (2008). Orientation dependence in fluorescent energy transfer between Cy3 and Cy5 terminally attached to double-stranded nucleic acids. Proc. Natl. Acad. Sci. 105, 11176–11181. doi:10.1073/pnas.0801707105
Jain, P. K., and El-Sayed, M. A. (2010). Plasmonic coupling in noble metal nanostructures. Chem. Phys. Lett. 487, 153–164. doi:10.1016/j.cplett.2010.01.062
Jazayeri, M. H., Aghaie, T., Nedaeinia, R., Manian, M., and Nickho, H. (2020). Rapid noninvasive detection of bladder cancer using survivin antibody-conjugated gold nanoparticles (GNPs) based on localized surface plasmon resonance (LSPR). Cancer Immunol. Immunother. 69, 1833–1840. doi:10.1007/s00262-020-02559-y
Ji, D. L., Li, C. L., and Cui, Y. F. (2014). Early diagnosis of pancreatic cancer. World Chin. J. Dig. 22 (17), 2406–2413. doi:10.11569/wcjd.v22.i17.2406
Jones, T. B. (2003). Basic theory of dielectrophoresis and electrorotation. IEEE Eng. Med. Biol. Mag. 22, 33–42. doi:10.1109/MEMB.2003.1304999
Kadaksham, A. T. J., Singh, P., and Aubry, N. (2004). Dielectrophoresis of nanoparticles. Electrophoresis 25, 3625–3632. doi:10.1002/elps.200406092
Kim, D., Daniel, W. L., and Mirkin, C. A. (2009). Microarray-based multiplexed scanometric immunoassay for protein cancer markers using gold nanoparticle probes. Anal. Chem. 81, 9183–9187. doi:10.1021/ac9018389
Kim, U., Qian, J., Kenrick, S. A., Daugherty, P. S., and Soh, H. T. (2008). Multitarget dielectrophoresis activated cell sorter. Anal. Chem. 80, 8656–8661. doi:10.1021/ac8015938
Kim, W. B., Park, S. J., Min, B. K., and Lee, S. J. (2004). Surface finishing technique for small parts using dielectrophoretic effects of abrasive particles. J. Mater. Process. Technol. 147, 377–384. doi:10.1016/j.jmatprotec.2004.01.010
Kumar, S., Kumar, S., Ali, M. A., Anand, P., Agrawal, V. V., John, R., et al. (2013). Microfluidic-integrated biosensors: prospects for point-of-care diagnostics. Biotechnol. J. 8, 1267–1279. doi:10.1002/biot.201200386
Lakowicz, J. R. (1983). Quenching of fluorescence. Princ. Fluoresc. Spectrosc., 257–301. doi:10.1007/978-1-4615-7658-7_9
Lakowicz, J. R. (2001). Radiative decay engineering: biophysical and biomedical applications. Anal. Biochem. 298 (1), 1–24. doi:10.1006/abio.2001.5377
Lakowicz, J. R. (2005). Radiative decay engineering 5: metal-enhanced fluorescence and plasmon emission. Anal. Biochem. 337 (2), 171–194. doi:10.1016/j.ab.2004.11.026
Lakowicz, J. R., Malicka, J., D’Auria, S., and Gryczynski, I. (2003). Release of the self-quenching of fluorescence near silver metallic surfaces. Anal. Biochem. 320, 13–20. doi:10.1016/S0003-2697(03)00351-8
Lakowicz, J. R., and Masters, B. R. (2008). Principles of fluorescence spectroscopy, third edition. J. Biomed. Opt. 13, 029901. doi:10.1117/1.2904580
Lee, D., Hwang, B., and Kim, B. (2016). The potential of a dielectrophoresis activated cell sorter (DACS) as a next generation cell sorter. Micro Nano Syst. Lett. 4, 2. doi:10.1186/s40486-016-0028-4
Lo, Y. J., Lin, Y. Y., Lei, U., Wu, M. S., and Yang, P. C. (2014). Measurement of the clausius-mossotti factor of generalized dielectrophoresis. Appl. Phys. Lett. 104. doi:10.1063/1.4866344
Luo, Q., Zhang, X., Wang, H., and Qian, Y. (2005). The use of non-uniform electrokinetics to enhance in situ bioremediation of phenol-contaminated soil. J. Hazard. Mater. 121, 187–194. doi:10.1016/j.jhazmat.2005.02.007
Markx, G. H., Talary, M. S., and Pethig, R. (1994). Separation of viable and non-viable yeast using dielectrophoresis. J. Biotechnol. 32, 29–37. doi:10.1016/0168-1656(94)90117-1
McGraw, C. (2024). Why heroin relapse rate is so high. Available at: http://www.theclearingnw.com/blog/why-heroin-relapse-rate-is-so-high. doi:10.1360/zd-2013-43-6-1064
Mercer, T. R., and Mattick, J. S. (2013). Structure and function of long noncoding RNAs in epigenetic regulation. Nat. Struct. Mol. Biol. 20, 300–307. doi:10.1038/nsmb.2480
Miller, W. C., Koceja, D. M., and Hamilton, E. J. (1997). A meta-analysis of the past 25 Years of weight loss research using diet, exercise or diet plus exercise intervention. Int. J. Obes. 21, 941–947. doi:10.1038/sj.ijo.0800499
Moldovan, L., Batte, K. E., Trgovcich, J., Wisler, J., Marsh, C. B., and Piper, M. (2014). Methodological challenges in utilizing MiRNAs as circulating biomarkers. J. Cell. Mol. Med. 18 (3), 371–390. doi:10.1111/jcmm.12236
Morales-Narváez, E., Golmohammadi, H., Naghdi, T., Yousefi, H., Kostiv, U., Horák, D., et al. (2015). Nanopaper as an optical sensing platform. ACS Nano 9, 7296–7305. doi:10.1021/acsnano.5b03097
Morgan, H., Hughes, M. P., and Green, N. G. (1999). Separation of submicron bioparticles by dielectrophoresis. Biophysical J. 77, 516–525. doi:10.1016/S0006-3495(99)76908-0
Mortadi, A., Melouky, A. E., Chahid, E. G., Moznine, R. E., and Cherkaoui, O. (2016). Studies of the clausius–mossotti factor. J. Phys. Stud. 20, 4001. doi:10.30970/jps.20.4001
Mulhall, H. J., Labeed, F. H., Kazmi, B., Costea, D. E., Hughes, M. P., and Lewis, M. P. (2011). Cancer, pre-cancer and normal oral cells distinguished by dielectrophoresis. Anal. Bioanal. Chem. 401, 2455–2463. doi:10.1007/s00216-011-5337-0
Mumford, S. L., Towler, B. P., Pashler, A. L., Gilleard, O., Martin, Y., and Newbury, S. (2018). Circulating MicroRNA biomarkers in melanoma: tools and challenges in personalised medicine. Biomolecules 8, 21. doi:10.3390/biom8020021
Nawarathna, D., Turan, T., and Wickramasinghe, H. K. (2009). Selective probing of MRNA expression levels within a living cell. Appl. Phys. Lett. 95, 83117. doi:10.1063/1.3213343
Ohtsuka, S., Suetomi, H., and Hikita, M. (2006). “Fundamental properties of OFF-ON resistance of a new type self-recovering fuse operated by dielectrophoresis,” in Conference Record of the International Power Modulator Symposium and High Voltage Workshop, Arlington, VA, USA, 14-18 May 2006. doi:10.1109/MODSYM.2006.365287
Olariu, M., Arcire, A., and Plonska-Brzezinska, M. E. (2017). Controlled trapping of onion-like carbon (OLC) via dielectrophoresis. J. Electron. Mater. 46, 443–450. doi:10.1007/s11664-016-4870-1
Parr, E. B., Camera, D. M., Burke, L. M., Phillips, S. M., Coffey, V. G., and Hawley, J. A. (2016). Circulating microrna responses between “high” and “low” responders to a 16-wk diet and exercise weight loss intervention. PLoS One 11, e0152545. doi:10.1371/journal.pone.0152545
Patel, P. N., Mishra, V., and Mandloi, A. S. (2010). Optical biosensors: fundamentals \& trends. J. Eng. Res. Stud. I (I), 15–34.
Patel, S., Showers, D., Vedantam, P., Tzeng, T. R., Qian, S., and Xuan, X. (2012). Microfluidic separation of live and dead yeast cells using reservoir-based dielectrophoresis. Biomicrofluidics 6, 34102. doi:10.1063/1.4732800
Pethig, R. (1996). Dielectrophoresis: using inhomogeneous AC electrical fields to separate and manipulate cells. Crit. Rev. Biotechnol. 16, 331–348. doi:10.3109/07388559609147425
Pethig, R. (2010). Review article-dielectrophoresis: status of the theory, technology, and applications. Biomicrofluidics 4, 022811. doi:10.1063/1.3456626
Pethig, R. (2017). Review—where is dielectrophoresis (DEP) going? J. Electrochem. Soc. 164 (5), B3049–B3055. doi:10.1149/2.0071705jes
Pethig, R., Huang, Y., Wang, X. B., and Burt, J. P. H. (1992). Positive and negative dielectrophoretic collection of colloidal particles using interdigitated castellated microelectrodes. J. Phys. D. Appl. Phys. 25, 881–888. doi:10.1088/0022-3727/25/5/022
Pethig, R., and Markx, G. H. (1997). Applications of dielectrophoresis in biotechnology. Trends Biotechnol. 15 (10), 426–432. doi:10.1016/S0167-7799(97)01096-2
Pethig, R. R., Goethe, J. W. V., and Pethig, R. R. (2017). Dielectrophoresis. doi:10.1007/978-1-4614-5491-5_319
Pohl, H. A. (1951). The motion and precipitation of suspensoids in divergent electric fields. J. Appl. Phys. 22 (7), 869–871. doi:10.1063/1.1700065
Pohl, H. A., and Crane, J. S. (1971). Dielectrophoresis of cells. Biophysical J. 11, 711–727. doi:10.1016/S0006-3495(71)86249-5
Poruk, K. E., Firpo, M. a., Adler, D. G., and Mulvihill, S. J. (2013). Screening for pancreatic cancer: why, how, and who? Ann. Surg. 257 (1), 17–26. doi:10.1097/sla.0b013e31825ffbfb
Pritchard, C. C., Cheng, H. H., Tewari, M., Division, B., Hutchinson, F., Health, P., et al. (2012). MicroRNA profiling: approaches and considerations. Nat. Rev. Genet. 13 (5), 358–369. doi:10.1038/nrg3198
Qian, C., Huang, H., Chen, L., Li, X., Ge, Z., Chen, T., et al. (2014). Dielectrophoresis for bioparticle manipulation. Int. J. Mol. Sci. 15, 18281–18309. doi:10.3390/ijms151018281
Regtmeier, J., Eichhorn, R., Viefhues, M., Bogunovic, L., and Anselmetti, D. (2011). Electrodeless dielectrophoresis for bioanalysis: theory, devices and applications. Electrophoresis 32, 2253–2273. doi:10.1002/elps.201100055
Rezabakhsh, A., Rahbarghazi, R., and Fathi, F. (2020). Surface plasmon resonance biosensors for detection of Alzheimer's biomarkers; an effective step in early and accurate diagnosis. Biosens. Bioelectron. 167, 112511. doi:10.1016/j.bios.2020.112511
Roy, S., Soh, J. H., and Gao, Z. (2011). A microfluidic-assisted microarray for ultrasensitive detection of MiRNA under an optical microscope. Lab. Chip 11, 1886. doi:10.1039/c0lc00638f
Rusling, J. F., Kumar, C. V., Gutkind, J. S., and Patel, V. (2010). Measurement of biomarker proteins for point-of-care early detection and monitoring of cancer. Analyst 135, 2496. doi:10.1039/c0an00204f
Salemmilani, R., Piorek, B. D., Mirsafavi, R. Y., Fountain, A. W., Moskovits, M., and Meinhart, C. D. (2018). Dielectrophoretic nanoparticle aggregation for on-demand surface enhanced Raman spectroscopy analysis. Anal. Chem. 90 (13), 7930–7936. doi:10.1021/acs.analchem.8b00510
Salimi, E., Braasch, K., Butler, M., Thomson, D. J., and Bridges, G. E. (2016). Dielectric model for Chinese hamster ovary cells obtained by dielectrophoresis cytometry. Biomicrofluidics 10, 014111. doi:10.1063/1.4940432
Sauer, M., Hofkens, J., and Enderlein, J. (2011). Basic principles of fluorescence spectroscopy. Handb. Fluoresc. Spectrosc. Imaging Single Mol. Ensebles. doi:10.1385/0-89603-301-5:65
Schäfer, C., Kern, D. P., and Fleischer, M. (2015). Capturing molecules with plasmonic nanotips in microfluidic channels by dielectrophoresis. Lab a Chip 15, 1066–1071. doi:10.1039/C4LC01018C
Seprödi, L., Biczó, G., and Ladik, J. (1969). The effect of electric field on the electronic structure of DNA. I. Calculation of the polarizability and of the permanent dipole moment for the nucleotide bases and base pairs. Int. J. Quantum Chem. 3 (5), 621–634. doi:10.1002/qua.560030509
Sharma, A., and Schulman, S. G. (1999). An introduction to fluorescence spectroscopy. doi:10.1016/S0026-265X(00)00048-5
Sharma, H., Wood, J. B., Lin, S., Corn, R. M., and Khine, M. (2014). Shrink-induced silica multiscale structures for enhanced fluorescence from DNA microarrays. Langmuir 30, 10979–10983. doi:10.1021/la501123b
Shtenberg, G., and Segal, E. (2018). Porous silicon optical biosensors. Handb. Porous Silicon 2, 1263–1273. doi:10.1007/978-3-319-71381-6_87
Sihvola, A. (2007). Dielectric polarization and particle shape effects. J. Nanomater. 2007, 1–9. doi:10.1155/2007/45090
Sohel, M. H. (2016). Extracellular/circulating MicroRNAs: release mechanisms, functions and challenges. Achiev. Life Sci. 10 (2), 175–186. doi:10.1016/j.als.2016.11.007
Steiner, R. F. (1984). Principles of fluorescence spectroscopy. Anal. Biochem. 137, 539. doi:10.1016/0003-2697(84)90125-8
Stöger, R. (2008). The thrifty epigenotype: an acquired and heritable predisposition for obesity and diabetes? BioEssays 30, 156–166. doi:10.1002/bies.20700
Swami, N., Chou, C. F., Ramamurthy, V., and Chaurey, V. (2009). Enhancing DNA hybridization kinetics through constriction-based dielectrophoresis. Lab. Chip 9, 3212. doi:10.1039/b910598k
Tang, W. Y., and Ho, S. M. (2007). Epigenetic reprogramming and imprinting in origins of disease. Rev. Endocr. Metabolic Disord. 8, 173–182. doi:10.1007/s11154-007-9042-4
Teunissen, C. E., Petzold, A., Bennett, J. L., Berven, F. S., Brundin, L., Comabella, M., et al. (2009). A consensus protocol for the standardization of cerebrospinal fluid collection and biobanking. Neurology 73, 1914–1922. doi:10.1212/WNL.0b013e3181c47cc2
Thoms, E., Sippel, P., Reuter, D., Weiß, M., Loidl, A., and Krohns, S. (2017). Dielectric study on mixtures of ionic liquids. Sci. Rep. 7 (1), 7463–7469. doi:10.1038/s41598-017-07982-3
Thoms, M., and Jeffrey, C. (2014). DNA methylation biomarkers: cancer and beyond. Genes (Basel). doi:10.3390/genes5030821
Thwar, P. K., Linderman, J. J., and Burns, M. A. (2007). Electrodeless direct current dielectrophoresis using reconfigurable field-shaping oil barriers. Electrophoresis 28, 4572–4581. doi:10.1002/elps.200700373
Tiberio, P., Callari, M., Angeloni, V., Daidone, M. G., and Appierto, V. (2015). Challenges in using circulating MiRNAs as cancer biomarkers. BioMed Res. Int. 2015, 1–10. doi:10.1155/2015/731479
Toyama, K., Kiyosawa, N., Watanabe, K., and Ishizuka, H. (2017). Identification of circulating MiRNAs differentially regulated by opioid treatment. Int. J. Mol. Sci. 18, 1991. doi:10.3390/ijms18091991
Tuck, M. K., Chan, D. W., Chia, D., Godwin, A. K., Grizzle, W. E., Krueger, K. E., et al. (2009). Standard operating procedures for serum and plasma collection: early detection research network consensus statement standard operating procedure integration working group. J. Proteome Res. 8, 113–117. doi:10.1021/pr800545q
Understanding the Epidemic Understanding the Epidemic (2023). Centersfor Disease Control and Prevention. Natl. Cent. Inj. Prev. Control.
Urdaneta, M., and Smela, E. (2007). Multiple frequency dielectrophoresis. Electrophoresis 28, 3145–3155. doi:10.1002/elps.200600786
Velmanickam, L., Bains, M., and Fondakowski, M. (2019a). ILluminate-MiRNA: paradigm for high-throughput, low-cost, and sensitive MiRNA detection in serum samples at point-of-care.
Velmanickam, L., Chang, D. H., Ganepola, G. A., and Nawarathna, D. (2021). “Low-cost and rapid micro-RNA assay for identification of pancreactic cancer,” in 2021 IEEE Research and Applications of Photonics in Defense Conference, Miramar Beach, FL, USA, 02-04 August 2021 (Institute of Electrical and Electronics Engineers Inc.). doi:10.1109/RAPID51799.2021.9521412
Velmanickam, L., Fondakowski, M., Lima, I. T., and Nawarathna, D. (2017). Integrated dielectrophoretic and surface plasmonic platform for million-fold improvement in the detection of fluorescent events. Biomicrofluidics 11, 044115. doi:10.1063/1.5000008
Velmanickam, L., Laudenbach, D., and Nawarathna, D. (2016). Dielectrophoretic label-free immunoassay for rare-analyte quantification in biological samples. Phys. Rev. E 94, 042408. doi:10.1103/PhysRevE.94.042408
Velmanickam, L., Lima, I. T., and Nawarathna, D. (2019b). “External low frequency electric fields maximize the fluorescence enhancement through light-metal-fluorophore interactions of target biomolecules,” in Proc. SPIE 10881, imaging, manipulation, and analysis of biomolecules, cells, and tissues XVII, 108810S. doi:10.1117/12.2510137
Velmanickam, L., Lima, I. T., and Nawarathna, D. (2020). “Achieving over million-fold fluorescence enhancement for biosensing applications,” in 2020 IEEE Research and Applications of Photonics in Defense Conference (RAPID), Miramar Beach, FL, USA, 10-12 August 2020, 1–2. doi:10.1109/RAPID49481.2020.9195707
Velmanickam, L., and Nawarathna, D. (2017). Design and fabrication of a dielectrophoretic cell trap array. Adv. Sci. Technol. Eng. Syst. J. 2 (1), 84–89. doi:10.25046/aj020110
Velmanickam, L., and Nawarathna, D. (2019). Electric fields assisted fluorescence enhancement for microRNA biomarker detection in serum samples: strategies for combating cancer, obesity and addiction to opioid. Smart Biomed. Physiological Sens. Technol. XVI, 110200G. doi:10.1117/12.2520312
Velmanickam, L., and Nawarathna, K. (2016). Dielectrophoretic cell isolation in microfluidics channels for high-throughput biomedical applications. 2016 IEEE Int. Conf. Electro Inf. Technol. (EIT), 302–306. doi:10.1109/EIT.2016.7535256
Völgyi, E., Tylavsky, F. A., Lyytikäinen, A., Suominen, H., Alén, M., and Cheng, S. (2008). Assessing body composition with DXA and bioimpedance: effects of obesity, physical activity, and age. Obesity 16, 700–705. doi:10.1038/oby.2007.94
Vu, K. H. P., Lee, M. C., Blankenburg, G. H., Chang, Y. J., Chu, M. L., Erbe, A., et al. (2021). Time-evolved SERS signatures of DEP-trapped Aβ and Zn2+Aβ peptides revealed by a sub-10 nm electrode nanogap. Anal. Chem. 93 (49), 16320–16329. doi:10.1021/acs.analchem.1c01521
Wang, Y. C., McPherson, K., Marsh, T., Gortmaker, S. L., and Brown, M. (2011). Health and economic burden of the projected obesity trends in the USA and the UK. Lancet 378, 815–825. doi:10.1016/S0140-6736(11)60814-3
Washizu, M., and Kurosawa, O. (1990). Electrostatic manipulation of DNA in microfabricated structures. IEEE Trans. Industry Appl. 26, 1165–1172. doi:10.1109/28.62403
WEIGHT LOSS SURGERY INSURANCE COVERAGE AND COSTS (2024). Obesitycoverage. Available at https://www.obesitycoverage.com/weight-loss-surgery-insurance-coverage-and-costs/.
White, I. M., Yazdi, S. H., and Yu, W. W. (2012). Optofluidic SERS: synergizing photonics and microfluidics for chemical and biological analysis. Microfluid. Nanofluidics 13, 205–216. doi:10.1007/s10404-012-0962-2
Wu, Q., Hwang, C. K., Zheng, H., Wagley, Y., Lin, H. Y., Kim, D. K., et al. (2013). MicroRNA 339 down-regulates μ-opioid receptor at the post-transcriptional level in response to opioid treatment. FASEB J. 27, 522–535. doi:10.1096/fj.12-213439
Wu, Q., Zhang, L., Law, P.-Y., Wei, L.-N., and Loh, H. H. (2009). Long-term morphine treatment decreases the association of -opioid receptor (MOR1) MRNA with polysomes through MiRNA23b. Mol. Pharmacol. 75, 744–750. doi:10.1124/mol.108.053462
Wu, Y., Yue, Y., Zhang, H., Ma, X., Zhang, Z., Li, K., et al. (2024b). Three-dimensional rotation of deformable cells at a bipolar electrode array using a rotating electric field. Lab a Chip 24, 933–945. doi:10.1039/D3LC00882G
Wu, Y., Zhang, H., Yue, Y., Wang, S., and Meng, Y. (2024a). Controllable and scaffold-free formation of 3D multicellular architectures using a bipolar electrode array. Adv. Mater. Technol., 2301626. doi:10.1002/admt.202301626
Yamaguchi, A., Fukuoka, T., Takahashi, R., Hara, R., and Utsumi, Y. (2016). Dielectrophoresis-enabled surface enhanced Raman scattering on gold-decorated polystyrene microparticle in micro-optofluidic devices for high-sensitive detection. Sensors Actuators B Chem. 230, 94–100. doi:10.1016/j.snb.2016.02.023
Yoo, D., Barik, A., de León-Pérez, F., Mohr, D. A., Pelton, M., Martín-Moreno, L., et al. (2021). Plasmonic split-trench resonator for trapping and sensing. ACS Nano 15 (4), 6669–6677. doi:10.1021/acsnano.0c10014
Zhang, C., Khoshmanesh, K., Mitchell, A., and Kalantar-Zadeh, K. (2010). Dielectrophoresis for manipulation of micro/nano particles in microfluidic systems. Anal. Bioanal. Chem. 396, 401–420. doi:10.1007/s00216-009-2922-6
Zhao, Y., Brcka, J., Faguet, J., and Zhang, G. (2018). Elucidating the mechanism governing cell rotation under DEP using the volumetric polarization and integration method. Biomed. Microdevices 20, 81. doi:10.1007/s10544-018-0327-z
Zhong, K., and Li, B. (2017). Polymer nanocomposites for dielectrics. Polym. Nanocomposites Dielectr. doi:10.1201/9781315364490
Keywords: electric fields, microRNA, metal enhanced fluorescence (MEF), dielectrohoresis, electrodes
Citation: Velmanickam L and Nawarathna D (2024) Recent progress in microRNA detection using integrated electric fields and optical detection methods. Front. Lab. Chip. Technol. 3:1349384. doi: 10.3389/frlct.2024.1349384
Received: 04 December 2023; Accepted: 14 March 2024;
Published: 10 April 2024.
Edited by:
Felismina Moreira, Polytechnic Institute, PortugalReviewed by:
Tomasz R. Szymborski, Polish Academy of Sciences, PolandYupan Wu, Northwestern Polytechnical University, China
Copyright © 2024 Velmanickam and Nawarathna. This is an open-access article distributed under the terms of the Creative Commons Attribution License (CC BY). The use, distribution or reproduction in other forums is permitted, provided the original author(s) and the copyright owner(s) are credited and that the original publication in this journal is cited, in accordance with accepted academic practice. No use, distribution or reproduction is permitted which does not comply with these terms.
*Correspondence: Dharmakeerthi Nawarathna, ZG5hd2FyYXRAb2R1LmVkdQ==