 Houra Mobaleghol Eslam1
 Fatemeh Hataminia1Hamid Asadi-Saghandi2Farzaneh Fayazbakhsh1Nasrollah Tabatabaei1*Hossein Ghanbari1,3,4*
- 1Department of Medical Nanotechnology, School of Advanced Technologies in Medicine, Tehran University of Medical Sciences, Tehran, Iran
- 2School of Chemical Engineering, College of Engineering, University of Tehran, Tehran, Iran
- 3Research Center for Advanced Technologies in Cardiovascular Medicine, Cardiovascular Diseases Research Institute, Tehran University of Medical Sciences, Tehran, Iran
- 4Medical Biomaterials Research Center, Tehran University of Medical Sciences, Tehran, Iran
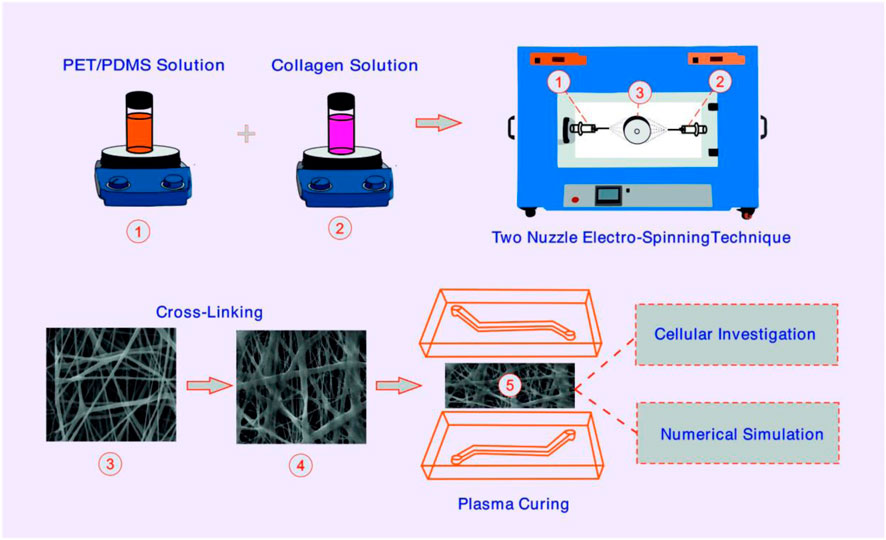
Introduction: Recently, membrane microfluidic chips (MFCs) have become available to study biological basement membranes. The nanofiber (NF) membranes are suitable substrates for cell attachment and trapping, as demonstrated by their surface properties. In this study, a novel microfluidic device based on the electrospun collagen-modified polyethylene terephthalate (PET)/polydimethylsiloxane (PDMS) was designed and fabricated to mimic biological basement membranes.
Methods: Hybrid NF containing PDMS/PET and collagen were successfully fabricated by two-nozzle electrospinning, and then PDMS chips were fabricated by soft lithography. The integrity of the membrane and NFs structure before (BC) and after cross-linking (AC) was evaluated by SEM, AFM, contact angle, FT-IR, BET, and tensile analysis. For further studies, numerical simulations were performed to evaluate the microfluidic flow in the PDMS-based device and demonstrate the fluid flow on top of a membrane. In the simulation, we used COMSOL Multiphysics to study the influence of flow rate and different surface topographies on the velocity and shear rate characteristics.
Results: Cross-linking of NFs increased the diameter of NF (from 391 ± 169 nm to 660 ± 199 nm), hydrophilicity, elongation, and surface roughness (from 66.9 nm to 296.7 nm), but decreased the pore size volume of NFs (0.06 cm3 g−1 to 0.01 cm3 g−1). Bonding of NFs was possible through the use of oxygen plasma activated materials based on PDMS and PET. After bonding the NFs in the channels with oxygenated plasma, human umbilical vein endothelial cells (HUVEC) and glial cell line (C6) were successfully cultured and stained in MFC with dynamic conditions for 24 h at a flow rate of 10 μl/min.
Discussion: The rougher microchannels exhibited a non-uniform shear rate distribution, and the flow rate was a parameter with a significant influence on the shear rate and velocity (roughness=0.3 µm). These results provided reliable evidence that the combination of electrospun NFs and cell culture can closely resemble a cell matrix.
GRAPHICAL ABSTRACT |
1 Introduction
Microfluidic platforms are the most used devices to mimic anatomical, physiological, and pathological conditions compared to traditional cell culture methods. Microfluidics was performed to simulate three-dimensional environments, apply dynamic flow with shear stress, and monitor cell interactions in dynamic conditions (Fayazbakhsh et al., 2023; Stavrou et al., 2023). Membranes were extremely important in microfluidics, and evaluating them in the development of new formulations, drug targeting, permeability, and toxicity was crucial (Rector et al., 2004; Loftsson et al., 2007). Therefore, the application of membrane technology has become widespread with the development of microfluidic systems (Richardson et al., 2020; Li et al., 2022; Sisodia et al., 2023). The porous membranes were evaluated in the microfluidic systems as a permeable substrate for cell culture procedure. The membranes used in Organ-on-Chip were typically made of PDMS, polycarbonate (PC), and polyethylene terephthalate (PET) (Young et al., 2010). The PET and PDMS nanofibers were prepared by the electrospinning method coupled with heat treatment (Li et al., 2020) and were capable of producing breathable and waterproof structures which is crucial for wound dressing. PDMS membranes have the advantage of being biocompatible and can bond well to MFCs. Oxygen plasma activates silane functional groups in MFCs (made from Glass, PDMS or silicone) and PDMS membranes also provide leakage-free bonding (Kim et al., 2019a; Tan and Rodrigue, 2019; Dong et al., 2020). The limitations of applying PDMS membranes in MFCs, including the complexity and cost of lithography method for fabrication, and in membranes made of other polymers, the insertion of them into, the three-dimensional (3D) substrates are needed to precisely surface modifications to increase adhesion of these membranes to substrate (Chen et al., 2012). Electrospun NFs have recently been introduced as membranes in tissue engineering applications. This is due to their high surface-to-volume aspect ratio, 3D topography, adjustable porosity and thickness, and use of biocompatible polymeric materials in these structures (Wang et al., 2013; Moghadas et al., 2017; Abdul Hameed et al., 2023).
Natural, synthetic polymers and composite of them were applied, in the form of nanofiber, by electrospinning techniques. By comparison, nanofibers made from natural polymers display higher levels of biocompatibility and lower immunogenicity and as a result, have higher biological relevance (Zdraveva et al., 2017; Talebi et al., 2023). On the other hand, nanofibers fabricated by synthetic polymers exhibit better mechanical properties (Tjong, 2006). Therefore, nanofibers prepared from a combination of natural and synthetic polymers were useful in cellular tissues with high mechanical properties (Giannelis, 1998), which can be especially essential for biological applications (Garg and Bowlin, 2011). Natural-synthetic composite membranes can simulate more biophysical conditions in the physiological and pathological microenvironment. NFs are a new approach for cellular environments, particularly microfluidics (Wallin et al., 2012; Moghadas et al., 2018; Huang et al., 2023; Liu et al., 2023). In a study (Kim et al., 2019b) collagen-aligned nanofiber membrane enhanced barrier function by expressing different junction proteins. Furthermore, cellular permeability improved compared to the commercial porous membranes. This nanofiber was capable of simulating diseases associated with endothelial barrier dysfunction. However, prolonged biological assays may be limited by membrane degradation. Another study (Li et al., 2020) used a composite membrane containing poly (lactic-co-glycolic acid) (PLGA) nanofiber based PDMS microporous to simulate a lung-on-chip. The NFs were sandwiched into the MFC with the oxygen plasma, then two types of lung cancer cells were cultured on it, and a very low laminar flow was injected to simulate shear stress. Since there is no silane group in PLGA and its bonding is weak, this structure cannot tolerate a higher flow rate. PDMS electrospun fibers were fabricated and irreversibly bonded on a glass slide into MFC (Wallin et al., 2012).
On the other hand, the utilization of advanced computational tools like COMSOL Multiphysics to simulate microfluidic devices can significantly influence the design and optimization of porous membranes for cell culture applications. These simulations have greatly contributed to enhancing understanding and optimizing the performance of NFs membranes in the context of cell culture applications, including the analysis of membrane properties as porous media flow (Wallin et al., 2012) and the roughness of channels (Villegas et al., 2018). Numerical simulations explore the impact of chamber inlet flow rates and hierarchical 3D scaffolds on velocity profile selection (Razavi Bazaz et al., 2019).
In the present study, we used a new composite of PDMS and PET as synthetic agents, and collagen polymer as a natural polymer for better cellular compatibility and cell attachment improvement in nanofiber membranes. The insertion of the membrane in MFCs was applied easily with plasma treatment without any unwanted leakage. After membrane use in the channel, MFC was divided into upper and lower channels that the membrane was between them. In this research, the upper channel in MFC was considered for numerical simulation and the membrane on the bottom was considered as a surface with a certain roughness. The roughness of the membrane was performed in the simulation section for shear stress calculation.
2 Materials and methods
2.1 Materials
PET and PDMS were purchased from (Sky Blue grade, Japan) and (Sylgard 184, Dow Corning, United States), respectively. Tetrahydrofuran (THF), N,N-dimethylformamide (DMF), 1,1,3,3,3-hexafluoro-2-isopropanol (HFIP), Type I collagen, and Alamar Blue were manufactured by Sigma-Aldrich, Germany. Glutaraldehyde solution 25% (ready to use) was purchased from Panreac Applichem, Spain. Human umbilical vein endothelial cells (HUVECs) and C6 were purchased from Iran Biological Resources Center. DMEM/F12, PBS, FBS, and trypsin-EDTA (0.25%) were purchased from Gibco, United States.
2.2 Methods
2.2.1 Fabrication of nanofiber membrane
Electrospinning technique was used to prepare PET/PDMS/collagen nanofiber membranes. The electrospinning device (FNM, Iran) typically consists of two syringe pumps, two high-voltage power sources, and a rotary collector covered with aluminum foil. To construct the proposed nanofibrous membrane, PET was dissolved in DMF/THF (1:1) solvent (22 wt%) at 45°C under continuous stirring. PDMS/curing agent (10:1) was added to DMF/THF (1:1) solvent (10% w/w) on a magnetic stirrer at room temperature. Then, a 5% (w/w) collagen solution was prepared in HFIP solvent. When the PET solvent reached transparency, it was allowed to cool to room temperature and mixed with PDMS on a magnetic stirrer at room temperature. PET/PDMS and collagen were then loaded into two separate 5 mL syringes with 18G blunt needles and placed into the appropriate pump. The distance between the injection needle and the collection tube was kept at 15 cm on each side, and the injection rate was set at 0.4 mL/h. The syringe containing PET/PDMS was connected to a 22 kV power supply and the other syringe containing collagen was connected to a 20 kV power supply. The speed of the roller receiver is set at 90 rpm. To achieve a thickness of about 30 μm, the total electrospinning time was set at about 4 h. The resulting woven nanofiber mat was placed in a vacuum desiccator for 30 min, receiving glutaraldehyde vapor (25%) to Cross-link its surface. Finally, the mat was washed with PBS and deionized water. To remove all toxic glutaraldehyde residue from the fibers, the washing procedure is repeated at least 3–4 times.
2.2.2 Surface characterizations
In using Scanning Electron Microscopy (SEM) the nanofiber samples were coated with gold nanoparticles by an ion sputtering coater (Polaris SCM-200, South Korea). Gold-coated nanofibers were then placed in a high-vacuum chamber, and the images were taken at 20 kV (SNE-4500M, Korea). Nanofibers were evaluated for morphology, size, and size distribution by ImageJ software.
Atomic Force Microscopy (AFM), Nanosurf easy, Switzerland, analysis was carried out to determine the surface roughness and morphology of nanofibers.
2.2.3 The Brunauer, Emmett, and Teller (BET)
The porosity of the nanofiber was evaluated by nitrogen gas adsorption and desorption for samples before (BC) and after Cross-linking (AC). Samples were dried in a clean dry tube for 4 h at 77°C in a degas tube station to eliminate the humidity from the samples (BelSorp, Mini2, Japan).
To examine wettability, the contact angle was measured using water droplets as the desired fluid on the surface of nanofibers. For this purpose, a 5 cm2 nanofiber membrane was placed under a contact angle instrument (MehrTavNegar, Iran) equipped with a camera at 25°C. The images of the droplet and surface of the nanofiber were taken at the interfaces (AC and BC).
2.2.4 Fourier transform infrared spectroscopy analysis
Fourier transform infrared (FT-IR) spectroscopy analysis was conducted by the FT-IR analyzer (WQF-510A, China) to investigate the chemical structure of the prepared PET, PDMS, and collagen nanofiber in the range of 400–4,000 cm−1. KBr was used as a carrier for the sample in the FT-IR analysis.
2.2.5 Cell culture study
Human umbilical vein endothelial cells (HUVECs) and rat glioma cell line (C6) were cultured in DMEM-F12 rich medium containing 10% FBS and 1% penicillin/streptomycin and incubated at 37°C and 5% CO2. The cell viability of HUVECs cultured on top of nanofibers (outside the microfluidic device) was assessed with 10% AlamarBlue solution (Page et al., 1993). The nanofibers were cut into circles of 1 cm in diameter, sterilized with 70% ethanol for 15 min and then exposed to UV irradiation for 30 min. The nanofibers were then placed at the bottom of a 48-well plate and fixed. Then, 5×10³ cells in 250 μL F12-enriched medium with 10% FBS, and 1% penicillin/streptomycin were seeded into each well and on top of the nanofibers. Cell viability was assessed for 1, 3, and 5 days of incubation. To assess viability, the culture medium in each well was replaced by 250 μL of complete culture medium containing 10% AlamarBlue. Then, the cell culture plate was incubated at 37°C and 5% CO2 for 4 h and UV absorbance was obtained using the ELISA microplate reader (BioTek, United States) at 570 and 630 nm for cell viability calculation.
HUVECs were cultured in a 48-well culture plate and placed in an incubator at 37°C and 5% CO2 for 48 h, as explained. Then, the culture medium was discarded, and the wells were rinsed with PBS, after which the cells were fixed by adding a 1:1 solution of 2% glutaraldehyde and 2.5% paraformaldehyde and kept at 4°C for 1 h. The nanofibers were then exposed to 60, 70, 90, and 100% ethanol for 5 min to dehydrate. Finally, the nanofibers were coated with gold for SEM imaging and cell attachment analysis.
2.2.6 Computational fluid dynamic simulation
The numerical simulation section involved the use of COMSOL MULTIPHYSICS 5.5 (Comsol, Inc.), a commercial finite element code, to simulate the microfluidic flow within the PDMS-based device. The COMSOL model was created in a three-dimensional structure with the same dimensions as the experiments. The simulations were conducted in a stationary mode with the assumption that boundary conditions were not slippery. Single-phase laminar flow was also chosen as model physics, with the governing equations within the model being the Navier-Stokes equation (Eq. 1) and the continuity equation (Eq. 2). The parameters considered in the equations included fluid density (ρ), dynamic viscosity (µ), fluid velocity (V), and pressure (P). The simulation included a typical 10 μL/min input flow in laminar input conditions, with the fluid density set to 1.011 g/cm3 and dynamic viscosity to 0.94 mPa·s. Only the flow in the upper microchannel was simulated due to the symmetry existing in the upper and lower channels.
COMSOL Multiphysics® software offers a robust collection of integrated functions and operators designed to create geometric surfaces with a desired roughness. These include functions to generate uniform and Gaussian random distributions, as well as a valuable sum operator, which significantly enhances the flexibility and versatility of the software.
To create the bottom surfaces of the microchannel, the parametric surface module of COMSOL was utilized, resulting in an arithmetical mean height of approximately 0.3 µm for the channel. The equation governing the production of roughness was obtained by the equation of spatial frequencies. To represent the rough surface, the following double sum (Eq. 3) was used (Villegas et al., 2018):
In which, Amn is as Eq. 4:
In these expressions, the spatial coordinates are denoted by x and y, the spatial frequencies are represented by M and N, set to 5. The amplitudes are labeled as Amn, with the phase angles denoted by φ (m, n) being determined using a zero mean uniform random function within the interval of -π/2 to π/2 in COMSOL. The spectral exponent, β, was assigned a value of 0.1. The function g (m, n) corresponded to a zero-mean Gaussian random function. Scaling in the z-direction was applied to the function f (x, y) to achieve the desired roughness values. The following equation (Eq. 5) was utilized to select the amplitude parameter, representing the arithmetical mean height (Sa), serving as an indicator of the surface roughness:
where A represents the mean-plane area.
2.2.7 Fabrication of the microfluidic device
A simple PDMS-based microfluidic device containing an upper and a lower channel was designed (for each channel the dimension was 1.4 mm×18 mm, height 200 µm) to house the nanofiber membrane (Figure 1). Once the masks were designed (Figure 1A), soft lithography was used to fabricate molds. SU8-2050 (Microchem, United States), a negative photoresist, was coated on the silicon wafer by a spin-coater (Microchem, Newton, MA, United States). Then, UV light was lit through the mask over the wafer by a mask aligner (Danesh Equipping System, LSM5, Iran), allowing the SU8 to Cross-link onto the surface of the wafer. Once the unbonded photoresist was washed away from the surface of the wafer, a negative imprint of the microchannel design was created. Two silicon molds (upper and lower panels) were fabricated. To create the microfluidic device, PDMS was mixed with its curing agent (10:1) and de-bubbled inside a vacuum pump. The mixture was then poured inside the silicon molds and placed on a hot plate at 80°C for 1 h. Once cast, designed inlets and outlets were created using a biopsy punch (Figure 1B). Next, the surface of each casted PDMS was washed with isopropyl alcohol and acetone (Merck, Germany). After drying, the nanofiber membrane was fused between the upper and lower sections using an oxygen plasma treatment apparatus (Harrick Plasma, Ithaca, NY, United States), forming a leak-free microfluidic device. To sterilize, the device was rinsed with 70% ethanol and exposed to UV for 30 min.
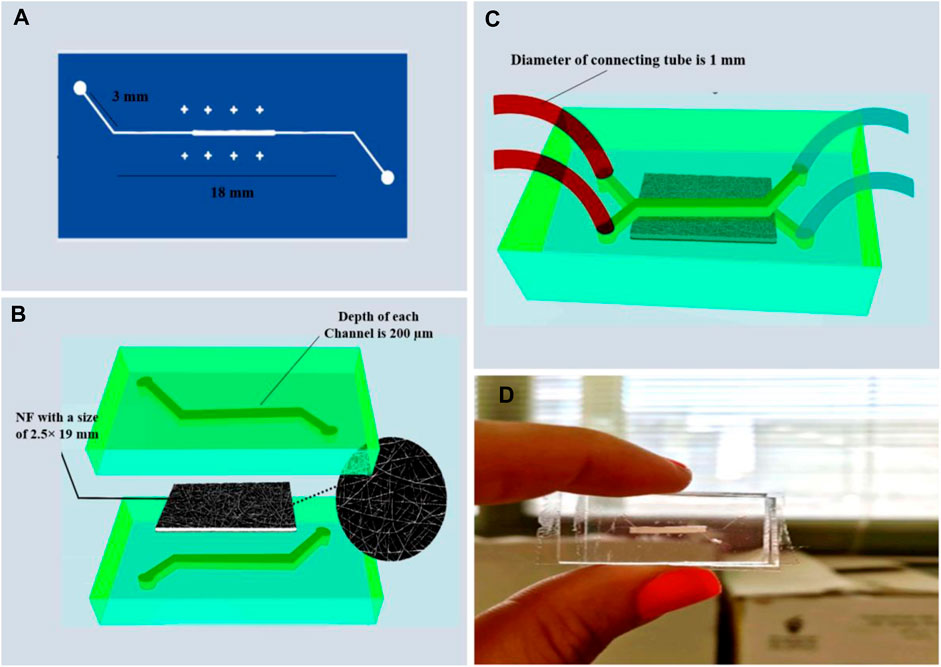
Figure 1. The MFC is based on collagen/PET/PDMS membrane (A) A mask to pattern a photoresist, (B) PDMS chip casting with NF membrane (the porous nanofiber membrane is placed between the upper and the lower PDMS-based microchannels), (C,D) Schematic and real image of the PDMS microfluidic device.
2.2.8 Cell culture inside the microfluidic device and cell staining
First, the laminar flow of cell culture media into the channels removed all air bubbles then the device was placed inside an incubator for 15 min. The number of. 2 × 10⁶ cells (HUVEC) were diluted in 1 mL culture medium and then 100 µL of that solution was carefully injected inside the micropipette tip pinned to the upper channel inlet port, where gravitational and capillary forces allowed the gentle flow of cells inside the channel. Under a light microscope, the flow of cells toward the nanofiber membrane and the outlet port was evaluated. The device was placed in an incubator for 4 h to allow cell sedimentation and proper attachment. Once cells were attached, 1.5 × 10⁶ C6 cells were diluted in 1 mL culture medium and slowly passed into the lower channel. After injection, the device was placed inside an incubator for 4 h. When cells were attached, the fresh culture medium was injected into the upper and lower channels at a rate of 10 μL/min, and the device was kept inside the incubator for 24 h. Fluorescent staining was utilized to determine whether or not cells were present on the nanofiber membrane.
The upper microchannel was washed twice with PBS and then 50 µL of DAPI solution dissolved in deionized water (1 μg/mL) was injected into the inlet port for 1 min. Then, the device was placed under a fluorescence microscope (Optika, IM-3, Italy), where DAPI was excited with ultraviolet light (358 nm) and was detected through the blue/cyan filter. First, staining was performed with DAPI dye within the first 4 h after cell injection and later after 24 h.
Acridine Orange (AO) and Propidium Iodide (PI) staining was used to assess live C6 cell counts in the lower channel, 50 μL of a 1:1 mixture of AO and PI with a concentration of 50 μg/mL was injected into the inlet of the lower channel, with the device placed under the fluorescence microscope. AO emits green fluorescence with the maximum wavelength at 526 nm (excitation 502 nm), while PI is excited at 488 nm and, with emission at a maximum wavelength of 617 nm.
3 Results and discussion
3.1 SEM analysis
A two-nuzzle electrospinning device was used to electrospun a nanofiber membrane consisting of PET (22% w/w), PDMS (10% w/w), and collagen (5% w/w). The SEM micrographs of nanofibers before exposure to glutaraldehyde vapor and AC are depicted in Figures 2A,B, respectively. As illustrated, Cross-linking increased nanofiber diameter, which was shown in size distribution topography. The average mean diameter of the NFs increased by Cross-linking and obtained (mean ± SD) 391 ±169 nm for BC, and 660 ± 199 nm for AC (Figures 2C,D). The cross-sectional SEM images of the nanofiber illustrated in Figure 2 that the thickness was obtained about 25–27 µm (Figure 2F) and 154–156 µm (Figure 2E) in AC mode. In order to test the nanofiber bonding within the PDMS-based microfluidic system, the fiber with a thickness of 154–156 µm was bonded, after which the blue water-soluble dye (Edentown F&B, South Korea) was injected into the inlet and removed from outlet, and, as shown in Figure 2G, the color did not leak out after 10 min. The NFs were strongly bound in AC and BC due to the presence of PDMS and PET in the structure, and the membrane thickness did not affect it.
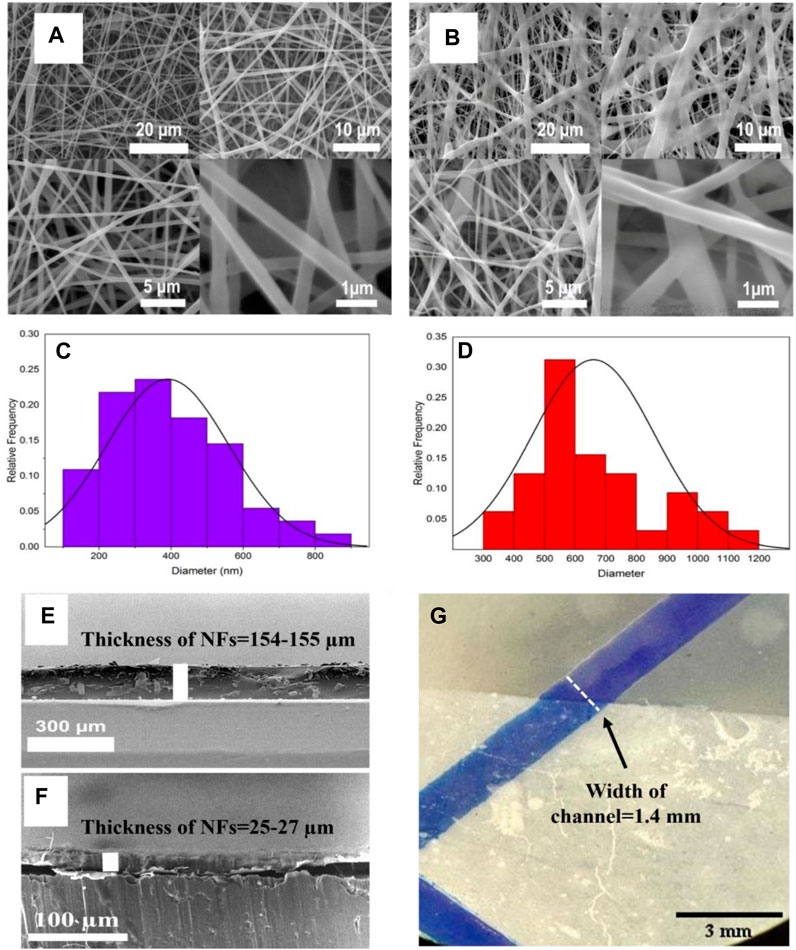
Figure 2. Scanning Electron Microscopy (SEM) images showing morphologies of nanofibers containing 22% w/w PET, 10% w/w PDMS and 5% w/w Collagen in solvent, (A) BC nanofiber and (B) AC nanofiber by glutaraldehyde vapor. The size distribution of nanofibers, (C) BC nanofiber (390.9 ±169.6 nm) and (D) AC nanofiber by glutaraldehyde vapor (660 ± 199.3 nm). Cross-sectional SEM images of a gap between the upper and lower sections in MFC channel bonding at two different thicknesses that are about (E) 154–155 µm and (F) 25–27 µm respectively. (G) leakage testing with 154–155 µm thickness after 10 min of bonding nanofiber by fluid injection in blue color.
3.2 AFM analysis
An overall view of the BC (Figure 3A) and AC (Figure 3B) was obtained from AFM analysis. The results of AFM analysis to evaluate the roughness of the BC and AC showed that the average surface roughness was 66.9 nm and 296.7 nm, respectively and the cross-linking process increases surface roughness. As a result, the main problem is the shear stress created by the increasing roughness that leads to the other challenges related to the cell culture step. Therefore, numerical simulation was performed to calculate the shear stress in this case. However, It has been reported in the references that roughness can be in the nanometer range, which increases cell growth by 50% compared to micro sizes. Ferthermore, fluid flow introduced into the microchannel with roughness in nanosize improves cell adhesion and provides space for cell trapping (Luo et al., 2012; Zamani et al., 2013).
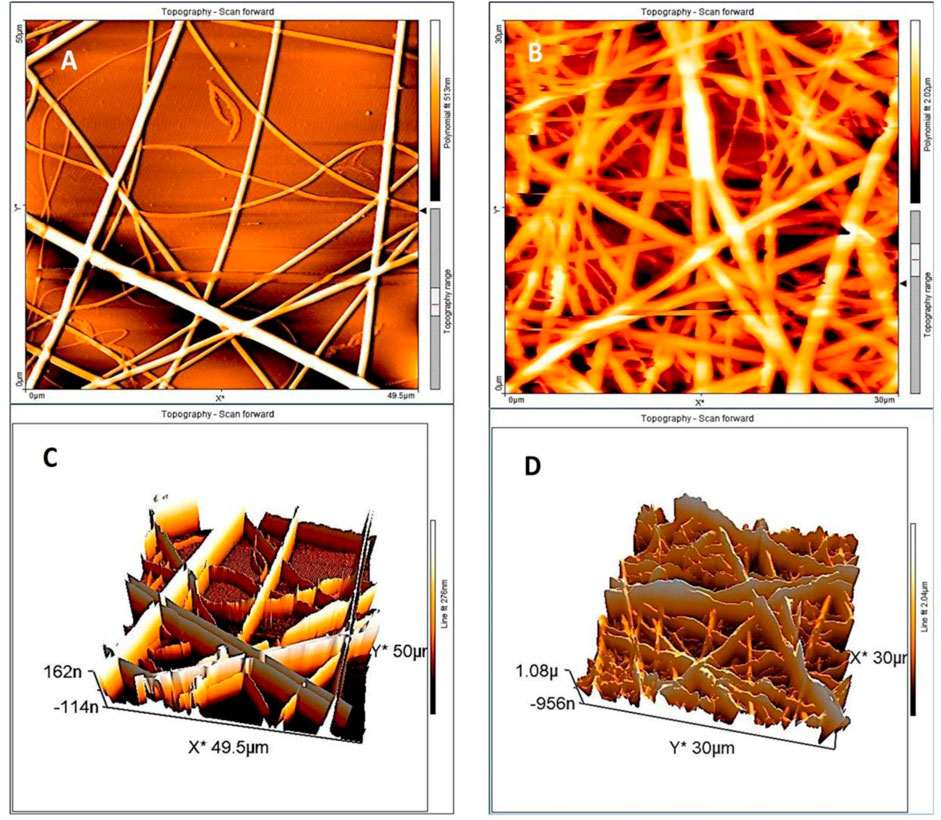
Figure 3. AFM scanning of the NFs sample. The topographical representation of the fibers shows the difference between the height and the orientation of the (A,B) BC nanofiber by glutaraldehyde vapor in 2D and 3D orientation, (C,D) AC nanofiber in 2D and 3D images.
3.3 BET analysis
The nitrogen adsorption-desorption isotherms of NFs exhibiting a hysteresis loop at relative pressure (P/Po), are shown in Figures 4A,C. The hysteresis loop consists of a different adsorption and desorption curve depending on the state BC and AC. BET analysis showed that the specific surface areas of BC and AC nanofiber were 18.94 m2g−1 and 12.18 m2g−1, respectively. The pore size distribution of BJH is shown in Figure 4E. The total pore volume and average pore diameter of the BC state were 0.06 cm3 g−1 and 12.25 nm, respectively. In AC state, the total pore volume decreased nearly 6 times to 0.01 cm3 g−1 and the average pore diameter reached 3.41 nm.
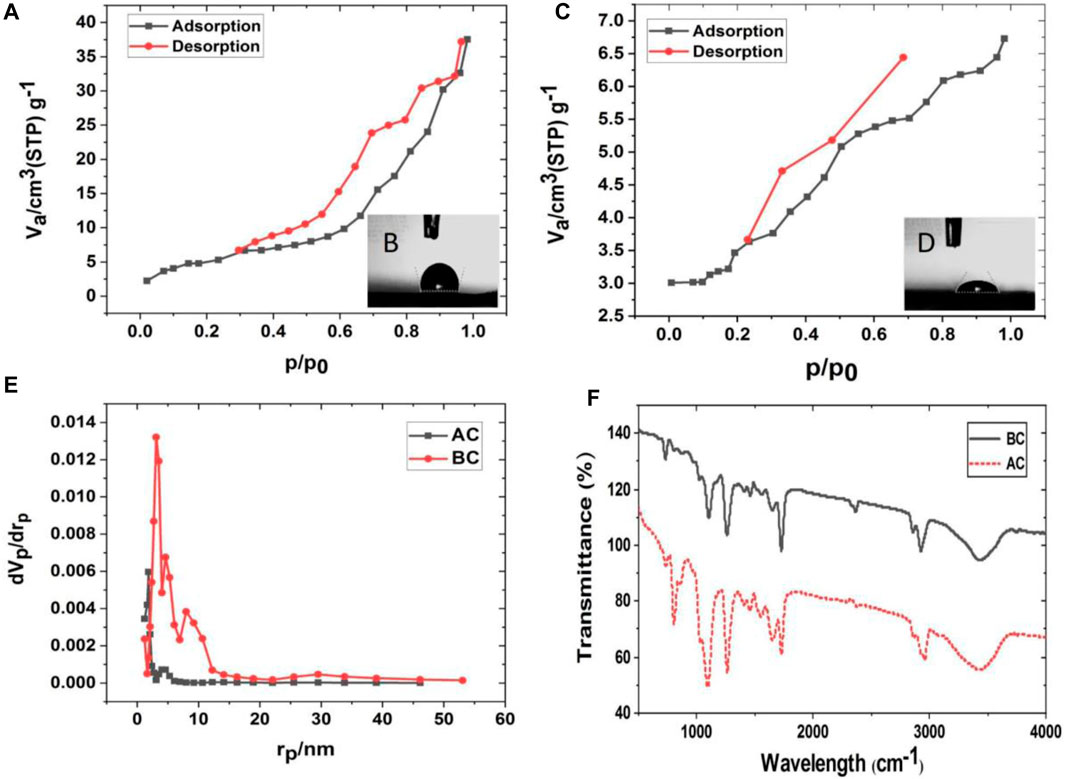
Figure 4. Nanofiber (NF) characterization in Before cross-linking (BC) and After cross-linking (AC), (A) adsorption (ADS) and desorption (DES) isotherms for BC and (B) the contact angle of BC NF, (C) adsorption (ADS) desorption (DES) isotherms for AC and (D) the contact angle of AC, (E) BJH pore size analysis BC and AC nanofiber with glutaraldehyde vapor, (F) FT-IR spectra analyses of BC and AC NFs.
3.4 Contact angle measurements
The contact angles of BC and AC nanofiber are shown in Figures 4B,D, respectively. The contact angle of BC nanofiber is 105° ± 0.5°, while the contact angle of AC nanofiber is 58.8° ± 0.3°. In general, a lower contact angle implies an increase in surface hydrophilicity. A decrease in the measurement angle of about 46° indicates that the cross-linked nanofibers are more hydrophilic and thus more suitable for higher cell adhesion and viability. The addition of collagen to this structure, along with two hydrophobic polymers, provided a better matrix for the cells, in addition to cross-linking making it stable and more hydrophilic. The adsorption-desorption isotherm is influenced by the pore size volume and porosity causing water penetration and contact angle reduction. In this case, the increase in hydrophilic functional groups due to cross-linking leads to a decrease in the AC mode contact angle and a decrease in porosity through cross-linking. Therefore, it can be concluded that functional groups are a more effective factor influencing the contact angle than porosity.
3.5 FT-IR spectral analysis
Another powerful tool for analyzing intermolecular interactions on the surface of the nanofibers is FT-IR spectra. The FT-IR spectra of BC and AC nanofibers after washing with DI water and then dried are presented in Figure 4F. The band at 800 cm−1, corresponding to the vibration of Si-(CH3)2 groups (due to the presence of PDMS) in the sample, has more intensity in AC. The relative intensity of the amide II band at 1,540 cm−1 increases with the degree of cross-linking. The band at 1,650 can be attributed to Amide I of collagen with its higher intensity and higher ability to immobilize collagen on the composite (Chang and Tanaka, 2002; Rahmi, 2015).
3.6 Cytocompatibility and cell attachment
The NFs with special surface topography have previously been used to stimulate cell adhesion and culture (Jeong et al., 2010). Evaluation of the biocompatibility of electrospun PET fibers has been reported previously, and there is convincing evidence that the integration of collagen into the scaffold can facilitate improved cell attachment and reduced in vitro toxicity (Ziaei Amiri et al., 2021). On the other hand, PDMS is a well-known biocompatible and culture-friendly material. In the present study, once characterized, nanofibers were prepared for cell culture evaluation. It is expected that a combination of all three can accommodate cells. An endothelial cell line (HUVECs) was selected for culture on one side of the membrane. To evaluate the cell viability on the proposed membrane, the cell absorbance of Alamar Blue dye, which is proportional to the cell’s metabolic activity and the number of living cells, was read for 5 consecutive days (outside the microfluidic system). Compared with the control, the viability of cells cultured on nanofiber mats decreased slightly compared to the first day. However, this increases as the cells adapt to their environment over the following days. Figure 5A shows the normalized cell viability of HUVEC cells cultured on cross-linked nanofiber mats after 1, 3, and 5 days from seeding. As expected, cell viability increased from the first day to days 3 (p<0.05) and 5 (p<0.01) significantly. Each group normalized with a group without NF in each step. To evaluate adhesion and formation morphology of the nanofibers, SEM images of cultured cells were obtained 72 h after seeding. From Figure 5B the cells were accurately formed and well located on the nanofibers. SEM images of cells grown on nanofibers show their proper expansion and attachment to the surface. Figure 5C shows the excellent adhesion and cytocompatibility of the nanofibers.
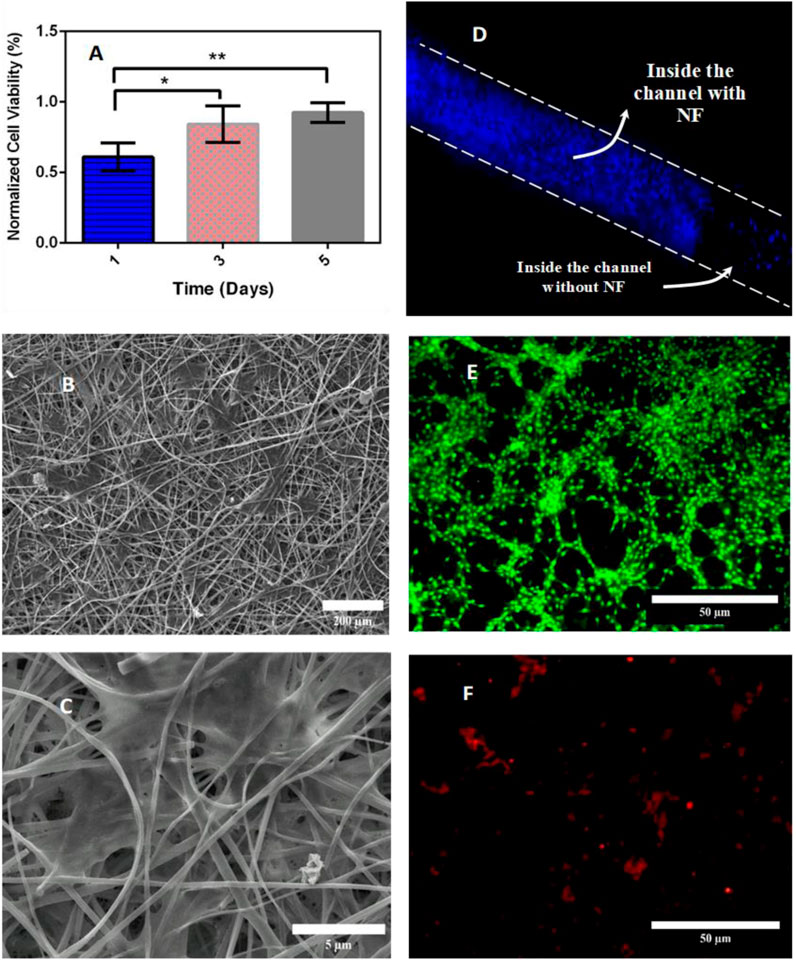
Figure 5. (A) Cell viability cultured on the cross-linked NFs membrane by Alamar Blue assay (each group was normalized to group without NF). (B,C) Cellular attachment and cellular morphology visual assessment by SEM at different scales, (D) DAPI staining of the HUVECs on the nanofiber membrane inside the microfluidic device. (E) PI (green) and (F) OA (reddish orange) staining of living and dead C6 cells on the bottom of the opposite channel, respectively, cell viability data are represented as mean ± SD for n=3 and significancy are presented as * for p<0.05 and ** for p<0.01.
3.7 Cell staining in the microfluidic device
Once the external evaluation of the microfluidic device was complete, the nanofiber sheet was carefully measured, cut, placed, and bonded between the layers of the device. HUVECs were seeded onto the mat to evaluate cell culture inside the device, and then C6 cells were cultured on the opposite side. After sedimentation, a syringe pump was used to deliver culture medium at a flow rate of 10 μL/min into the channels. To ensure cell survival inside the device and cell adhesion, 4′,6-diamidino-2-phenylindole (DAPI) staining was used to localize HUVEC nuclei on a side of the nanofibrous membrane, acridine orange (AO) and propidium iodide (PI Dye) were used for visualization and were used to stain live dead cells of C6 cells at the bottom of the channel. During the first 3 h after cell injection, images of cells attached to the NFs inside the channel were recorded by Dapi staining (Figure 5D). The following image of cells on the NF membrane in a microfluidic channel was taken after 24 h. As shown in Figures 5E,F, approximately 98% of C6 viability inside the microfluidic device were obtained after 24 h. The DAPI staining image shown in Figure 5D shows that HUVECs are indeed residing on the nanofibrous mat. Figures 5E,F show that most C6 cells are alive and located at the bottom of the opposite channel.
3.8 Simulation results
The main microfluidic channel is designed, each channel has dimensions of 6.3 mm length, 1.4 mm width and 0.2 mm height. The width of the input and output branches of the main microchannel is half the width of the main microchannel (0.7 mm). Computational simulations were performed in a cell-free microfluidic device. The numerical mesh (Figure 6A) used for the simulation consists of approximately 9,600,000 finite elements.
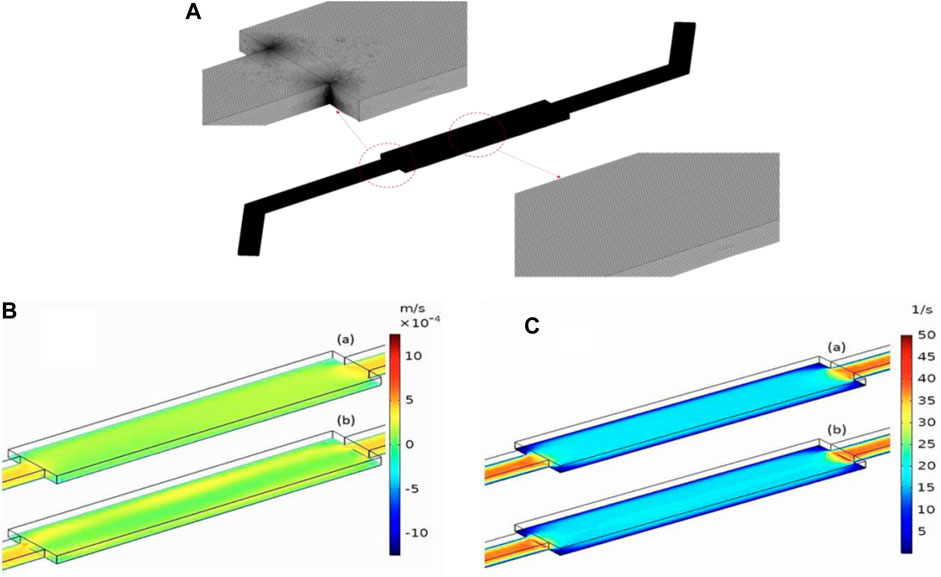
Figure 6. (A) Mesh Visualization for the Microfluidic Device. (B) Velocity distribution across the length of the microchannel with roughness numbers of 0.1 µm (A) and 0.3 µm (B). The height above the rough surface’s mean plane is z = 10 µm. The inlet flow rate is Qin = 10 μL/min. (C) Shear rate distribution across the length of the microchannels with roughness numbers of 0.1 µm (A) and 0.5 µm (B), the height above the rough surface’s mean plane is z = 10 µm. The inlet flow rate is Qin = 10 μL/min.
3.8.1 Influence of roughness on the shear stress and velocity profile
The structure of nanofibrous membranes has a significant impact on the performance of microfluidic devices designed for cell culture applications. Irregularities and variations in the nanofiber structure can significantly affect the velocity characteristics and shear stress distribution of the microchannel. Maintaining uniform shear rates and velocities in microfluidic devices ensures a consistent fluid flow pattern, minimizing variation in the cell culture area. This uniformity promotes uniform exposure of cells to nutrients, oxygen and signaling molecules, leading to more reproducible and reliable experimental results. Additionally, it allows the study of cellular responses under specific flow conditions, such as shear stress-induced cell migration and binding.
The behavior of the fluid in the microchannel was studied with roughness values of 0.1, 0.2, 0.3, 0.4, and 0.5. Figure 6B illustrates the velocity distribution for roughness values of 0.1 (a) and 0.5 (b) µm. As shown in the velocity slice representation shown in Figure 6Bb, the microchannel with a roughness value of 0.5 µm exhibits non-uniform fluid velocity along the entire length of the channel. However, reducing the roughness to 0.1 µm provides a much more stable velocity profile across the channel. The difference in roughness also has a notable impact on the cutting speed distribution, as shown in Figure 6C. The stiffer microchannel (Figure 6C (b)) exhibits a non-uniform shear rate distribution, with higher shear rates near the rough surface. In contrast, the smoother microchannel, Figure 6Ca, exhibits a more uniform shear rate distribution without sharp spikes near the bottom surface.
The velocity profile across the width of the microchannel was investigated for five different surface roughness values (0.1, 0.2, 0.3, 0.4, and 0.5 μm) at a height of 0.1 mm above the bottom of the microchannel (Figure 7A). The graph shows how the velocity profile becomes non-uniform as the surface roughness of the microchannel increases. The effect of surface roughness on the shear rate distribution was studied at a height of 0.01 mm above the bottom of the microchannel. As shown in Figure 7B, the surface roughness has a significant effect on the shear rate. The rougher microchannels exhibited non uniform shear rate distributions. In contrast, smoother microchannels exhibited a more uniform shear rate distribution without sharp peaks near the channel surface.
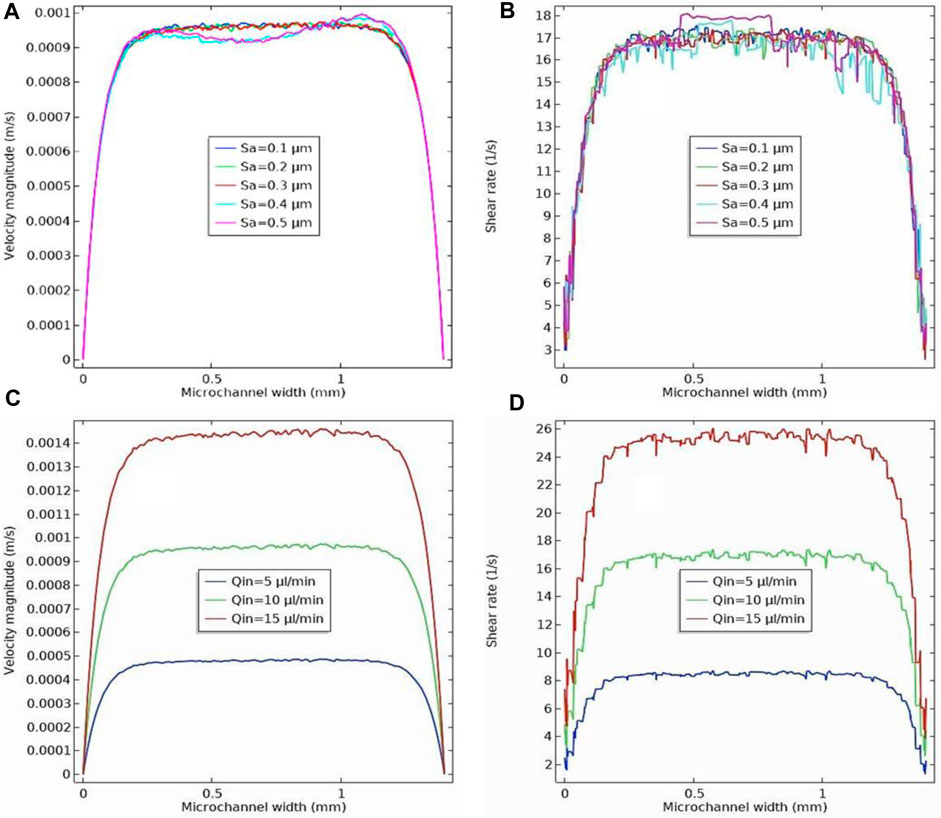
Figure 7. (A) Velocity profile across the width of the microchannel for five different roughness (0.1, 0.2, 0.3, 0.4 and 0.5 µm) at a height of 0.1 mm above the rough surface’s mean plane. The inlet flow rate is Qin = 10 μL/min. (B) Shear rate profile across the width of the microchannel for five different roughness (0.1, 0.2, 0.3, 0.4 and 0.5 µm) at height of 0.01 mm above the rough surface’s mean plane. The inlet flow rate is Qin = 10 μL/min. (C) Velocity profile across the width of the microchannel for three different inlet flow rates (5, 10, and 15 μL/min) at a height of 0.1 mm above the rough surface’s mean plane. The surface roughness is Sa= 0.3 µm. (D) Shear rate profile across the width of the microchannel for three different inlet flow rates (5, 10, and 15 μL/min) at a height of 0.01 mm above the rough surface’s mean plane. The surface roughness is Sa= 0.3 µm.
3.8.2 Influence of inlet flow rate on the shear stress and velocity profile
As mentioned previously, the fluid flow rate entering the microchannel is a critical factor in the performance of microfluidic devices in cell culture applications. This directly affects the velocity profile and shear stress on the nanofibrous membrane, which serves as a substrate for cell adhesion and proliferation. Uniform shear rate and velocity directly impact cell adhesion, proliferation, differentiation, and overall cellular response. Careful control of shear rate and velocity can mimic physiological conditions and provide cells with an environment that closely resembles their natural microenvironment. The effect of inlet flow rate on the velocity profile across the width of the microchannel is shown in Figure 7C for a surface roughness of 0.3 μm. Velocity profiles were examined at a height of 0.1 mm above the rough microchannel bed, accounting for the effect of varying the inlet flow rate into the microchannel from 5 to 15 μL/min. As observed, as the inlet flow rate increased, the velocity magnitude also increased. Additionally, we found that the influence of microchannel roughness on the velocity profile variation becomes more pronounced at higher speeds, as shown in Figure 7C. The variation of shear stress along the width of the microchannel was also studied for different inlet flow rates into the microchannel with a surface roughness of 0.3 μm (Figure 7D). Inlet flow rates ranged from 5 to 15 μL/min. The results showed that the shear stress values showed a significant increase as the input flow rate increased. The presence of microchannel roughness increased the shear stress values, resulting in larger shear stress fluctuations in the region near the rough surface. This effect increased as the input flow rate to the microchannel increased, as shown in Figure 7D (Cukierman et al., 2001).
4 Conclusion
This study presented a simple and low-cost microfluidic cell culture platform that functions as a bio-membrane. Electrospinning was used to fabricate nanofibrous membranes with controllable thickness and cost-effective membrane alternatives based on collagen/PET/PDMS NFs. To design MFC membranes, the main factors to be studied regarding the stable cross-linked NF are:
• Hydrophilicity of the surface, that be improved with cross-linking
• Cytotoxicity
• Mechanical properties (elongation increases with cross-linking)
• Porosity, with cross-linking, has decreased from 0.06 cm3 g−1 to 0.01 cm3 g−1.
• Surface roughness as a parameter that leads to non-uniform shear rate distribution
• Thickness, that affects the adhesion and leakage between the membrane and the MFC device
And the dynamic configuration and key condition coefficient applied in MFC can be considered in the following points:
• Flow rate (Q) that is the most effective factor for shear rate value
• Dimension of the channels
In this study, we investigated most of these parameters to fabricate MFCs with NF membranes.
Various physical and chemical characterizations showed that the cross-linked NFs with a roughness about 0.3 μm had the required hydrophilicity and biocompatibility properties. According to the cell culture stage, they were also appropraite scaffolds with low toxicity for cell culturing. Based on the simulation results, it was important to consider both roughness and flow rate when designing to achieve the desired velocity and shear rate profile. Surface roughness tends to have a significant impact on shear rate nonuniformity at higher flow rates (Q ≥10 μL/min), especially at a roughness higher than NF roughness (Sa ≥0.3 μm). In the simulation section, the maximum shear rate during the actual characterization of this device (Q = 10 μL/min, Sa = 0.3 and z = 0.01 mm) is taken from about 16–17 (1/S). This device could be used as a rapid test for drug screening, permeability, cell viability measurements and disease modeling.
Data availability statement
The original contributions presented in the study are included in the article/Supplementary Material, further inquiries can be directed to the corresponding authors.
Author contributions
HE: Writing–review and editing, Writing–original draft, Visualization, Validation, Supervision, Software, Resources, Project administration, Methodology, Investigation, Funding acquisition, Formal Analysis, Data curation, Conceptualization. FH: Writing–review and editing, Visualization, Validation, Investigation, Formal Analysis, Data curation. HA-S: Writing–review and editing, Visualization, Software, Data curation. FF: Writing–review and editing, Visualization, Project administration, Methodology, Investigation, Conceptualization. NT: Writing–review and editing, Visualization, Supervision, Resources, Project administration, Investigation. HG: Writing–review and editing, Visualization, Supervision, Resources, Project administration, Funding acquisition, Data curation, Conceptualization.
Funding
The author(s) declare that financial support was received for the research, authorship, and/or publication of this article. This work was supported by a research fund from Tehran University of Medical Sciences (Proposal No. 1400-3-148–55163).
Conflict of interest
The authors declare that the research was conducted in the absence of any commercial or financial relationships that could be construed as a potential conflict of interest.
Publisher’s note
All claims expressed in this article are solely those of the authors and do not necessarily represent those of their affiliated organizations, or those of the publisher, the editors and the reviewers. Any product that may be evaluated in this article, or claim that may be made by its manufacturer, is not guaranteed or endorsed by the publisher.
Supplementary material
The Supplementary Material for this article can be found online at: https://www.frontiersin.org/articles/10.3389/frlct.2024.1411171/full#supplementary-material
References
Abdul Hameed, M. M., Mohamed Khan, S. A. P., Thamer, B. M., Rajkumar, N., El-Hamshary, H., and El-Newehy, M. (2023). Electrospun nanofibers for drug delivery applications: methods and mechanism. Polym. Adv. Technol. 34, 6–23. doi:10.1002/pat.5884
Chang, M. C., and Tanaka, J. (2002). FT-IR study for hydroxyapatite/collagen nanocomposite cross-linked by glutaraldehyde. Biomaterials 23, 4811–4818. doi:10.1016/s0142-9612(02)00232-6
Chen, W., Lam, R. H. W., and Fu, J. (2012). Photolithographic surface micromachining of polydimethylsiloxane (PDMS). Lab. Chip 12, 391–395. doi:10.1039/c1lc20721k
Cukierman, E., Pankov, R., Stevens, D. R., and Yamada, K. M. (2001). Taking cell-matrix adhesions to the third dimension. Science 294, 1708–1712. doi:10.1126/science.1064829
Dong, Z., Zhu, H., Hang, Y., Liu, G., and Jin, W. (2020). Polydimethylsiloxane (PDMS) composite membrane fabricated on the inner surface of a ceramic hollow fiber: from single-channel to multi-channel. Engineering 6, 89–99. doi:10.1016/j.eng.2019.10.012
Fayazbakhsh, F., Hataminia, F., Eslam, H. M., Ajoudanian, M., Kharrazi, S., Sharifi, K., et al. (2023). Evaluating the antioxidant potential of resveratrol-gold nanoparticles in preventing oxidative stress in endothelium on a chip. Sci. Rep. 13, 21344–21416. doi:10.1038/s41598-023-47291-6
Garg, K., and Bowlin, G. L. (2011). Electrospinning jets and nanofibrous structures. Biomicrofluidics 5, 13403. doi:10.1063/1.3567097
Giannelis, E. P. (1998). Polymer-layered silicate nanocomposites: synthesis, properties and applications. Appl. Organomet. Chem. 12, 675–680. doi:10.1002/(sici)1099-0739(199810/11)12:10/11<675::aid-aoc779>3.0.co;2-v
Huang, Y., Li, X., Hou, J., Luo, Z., Yang, G., and Zhou, S. (2023). Conductive nanofibers-enhanced microfluidic device for the efficient capture and electrical stimulation-triggered rapid release of circulating tumor cells. Biosensors 13, 497. doi:10.3390/bios13050497
Jeong, S. I., Krebs, M. D., Bonino, C. A., Khan, S. A., and Alsberg, E. (2010). Electrospun alginate nanofibers with controlled cell adhesion for tissue engineeringa. Macromol. Biosci. 10, 934–943. doi:10.1002/mabi.201000046
Kim, D., Eom, S., Park, S. M., Hong, H., and Kim, D. S. (2019b). A collagen gel-coated, aligned nanofiber membrane for enhanced endothelial barrier function. Sci. Rep. 9, 14915–15011. doi:10.1038/s41598-019-51560-8
Kim, D., Kim, S. H., and Park, J. Y. (2019a). Floating-on-water fabrication method for thin polydimethylsiloxane membranes. Polymers 11, 1264. doi:10.3390/polym11081264
Li, H., Raza, A., Yuan, S., AlMarzooqi, F., Fang, N. X., and Zhang, T. (2022). Biomimetic on-chip filtration enabled by direct micro-3D printing on membrane. Sci. Rep. 12, 8178. doi:10.1038/s41598-022-11738-z
Li, W., Sun, X., Ji, B., Yang, X., Zhou, B., Lu, Z., et al. (2020). PLGA nanofiber/PDMS microporous composite membrane-sandwiched microchip for drug testing. Micromachines 11, 1054. doi:10.3390/mi11121054
Liu, J., Cui, T., Xu, X., Du, Y., Wang, L., Chen, S., et al. (2023). Robust alcohol soluble polyurethane/chitosan/silk sericin (APU/CS/SS) nanofiber scaffolds toward artificial skin extracellular matrices via microfluidic blow-spinning. Adv. Fiber Mater. 5, 349–361. doi:10.1007/s42765-022-00227-7
Loftsson, T., Vogensen, S. B., Brewster, M. E., and Konráðsdóttir, F. (2007). Effects of cyclodextrins on drug delivery through biological membranes. J. Pharm. Sci. 96, 2532–2546. doi:10.1002/jps.20992
Luo, C., Li, L., Li, J., Yang, G., Ding, S., Zhi, W., et al. (2012). Modulating cellular behaviors through surface nanoroughness. J. Mater. Chem. 22, 15654–15664. doi:10.1039/c2jm32007j
Moghadas, H., Saidi, M. S., Kashaninejad, N., Kiyoumarsioskouei, A., and Nguyen, N. T. (2017). Fabrication and characterization of low-cost, bead-free, durable and hydrophobic electrospun membrane for 3D cell culture. Biomed. Microdevices 19, 74. doi:10.1007/s10544-017-0215-y
Moghadas, H., Saidi, M. S., Kashaninejad, N., and Nguyen, N.-T. (2018). A high-performance polydimethylsiloxane electrospun membrane for cell culture in lab-on-a-chip. Biomicrofluidics 12, 024117. doi:10.1063/1.5021002
Page, B., Page, M., and Noel, C. (1993). A new fluorometric assay for cytotoxicity measurements in-vitro. Int. J. Oncol. 3, 473–476. doi:10.3892/ijo.3.3.473
Rahmi, R. (2015). Comparative adsorption of Fe (III) and Cd (II) ions on glutaraldehyde crosslinked chitosan–coated cristobalite. Orient. J. Chem. 31, 2071–2076. doi:10.13005/ojc/310427
Razavi Bazaz, S., Kashaninejad, N., Azadi, S., Patel, K., Asadnia, M., Jin, D., et al. (2019). Rapid softlithography using 3D-printed molds. Adv. Mater. Technol. 4. doi:10.1002/admt.201900425
Rector, T., Garland, J., Strayer, R. F., Levine, L., Roberts, M., and Hummerick, M. (2004). Design and preliminary evaluation of a novel gravity independent rotating biological membrane reactor. SAE Trans. 113, 1070–1075. doi:10.4271/2004-01-2463
Richardson, L., Gnecco, J., Ding, T., Osteen, K., Rogers, L. M., Aronoff, D. M., et al. (2020). Fetal membrane organ-on-chip: an innovative approach to study cellular interactions. Reprod. Sci. 27, 1562–1569. doi:10.1007/s43032-020-00184-9
Sisodia, Y., Shah, K., Ali Sayyed, A., Jain, M., Ali, S. A., Gondaliya, P., et al. (2023). Lung-on-chip microdevices to foster pulmonary drug discovery. Biomater. Sci. 11, 777–790. doi:10.1039/d2bm00951j
Stavrou, M., Phung, N., Grimm, J., and Andreou, C. (2023). Organ-on-chip systems as a model for nanomedicine. Nanoscale 15, 9927–9940. doi:10.1039/d3nr01661g
Talebi, N., Lopes, D., Lopes, J., Macário-Soares, A., Dan, A. K., Ghanbari, R., et al. (2023). Natural polymeric nanofibers in transdermal drug delivery. Appl. Mater. Today 30, 101726. doi:10.1016/j.apmt.2022.101726
Tan, X. M., and Rodrigue, D. (2019). A review on porous polymeric membrane preparation. Part II: production techniques with polyethylene, polydimethylsiloxane, polypropylene, polyimide, and polytetrafluoroethylene. Polymers 11, 1310. doi:10.3390/polym11081310
Tjong, S. C. (2006). Structural and mechanical properties of polymer nanocomposites. Mater. Sci. Eng. R Rep. 53, 73–197. doi:10.1016/j.mser.2006.06.001
Villegas, M., Cetinic, Z., Shakeri, A., and Didar, T. F. (2018). Fabricating smooth PDMS microfluidic channels from low-resolution 3D printed molds using an omniphobic lubricant-infused coating. Anal. Chim. Acta 1000, 248–255. doi:10.1016/j.aca.2017.11.063
Wallin, P., Zandén, C., Carlberg, B., Hellström Erkenstam, N., Liu, J., and Gold, J. (2012). A method to integrate patterned electrospun fibers with microfluidic systems to generate complex microenvironments for cell culture applications. Biomicrofluidics 6, 024131. doi:10.1063/1.4729747
Wang, X., Ding, B., and Li, B. (2013). Biomimetic electrospun nanofibrous structures for tissue engineering. Mater. Today 16, 229–241. doi:10.1016/j.mattod.2013.06.005
Young, E. W. K., Watson, M. W. L., Srigunapalan, S., Wheeler, A. R., and Simmons, C. A. (2010). Technique for real-time measurements of endothelial permeability in a microfluidic membrane chip using laser-induced fluorescence detection. Anal. Chem. 82, 808–816. doi:10.1021/ac901560w
Zamani, F., Amani-Tehran, M., Latifi, M., and Shokrgozar, M. A. (2013). The influence of surface nanoroughness of electrospun PLGA nanofibrous scaffold on nerve cell adhesion and proliferation. J. Mater Sci. Mater Med. 24, 1551–1560. doi:10.1007/s10856-013-4905-6
Zdraveva, E., Fang, J., Mijovic, B., and Lin, T. (2017). Electrospun nanofibers structure and properties of high-performance fibers. Elsevier, 267–300.
Keywords: hybrid nanofiber, PDMS microfluidics, COMSOL, basement membrane, Cross-linked collagen
Citation: Eslam HM, Hataminia F, Asadi-Saghandi H, Fayazbakhsh F, Tabatabaei N and Ghanbari H (2024) Characterization and numerical simulation of a new microfluidic device for studying cells-nanofibers interactions based on collagen/PET/PDMS composite. Front. Lab. Chip. Technol. 3:1411171. doi: 10.3389/frlct.2024.1411171
Received: 02 April 2024; Accepted: 03 June 2024;
Published: 01 July 2024.
Edited by:
Natan Barros, Terasaki Institute for Biomedical Innovation, United StatesReviewed by:
Surjendu Maity, Duke University, United StatesYoshitaka Nakanishi, Kumamoto University, Japan
Copyright © 2024 Eslam, Hataminia, Asadi-Saghandi, Fayazbakhsh, Tabatabaei and Ghanbari. This is an open-access article distributed under the terms of the Creative Commons Attribution License (CC BY). The use, distribution or reproduction in other forums is permitted, provided the original author(s) and the copyright owner(s) are credited and that the original publication in this journal is cited, in accordance with accepted academic practice. No use, distribution or reproduction is permitted which does not comply with these terms.
*Correspondence: Hossein Ghanbari, aGdoYW5iYXJpQHR1bXMuYWMuaXI=; Nasrollah Tabatabaei, bnRhYmF0YWJhZWlAdHVtcy5hYy5pcg==