 Keun Woo Kim1†
 Alexander Kamerkar1†Tzu-En Chiu1†Ibrahim Abdi1†Jian Qin2*†Wojciech Suder2*†
 Seemal Asif3*†
- 1Centre for Computational Engineering Sciences, Faculty of Engineering and Applied Sciences, Cranfield University, Cranfield, United Kingdom
- 2Welding and Additive Manufacturing Centre, Faculty of Engineering and Applied Sciences, Cranfield University, Cranfield, United Kingdom
- 3Centre for Robotics and Assembly, Faculty of Engineering and Applied Sciences, Cranfield University, Cranfield, United Kingdom
In the context of Industry 4.0, autonomous and data-driven manufacturing processes are advancing rapidly, with wire arc additive manufacturing (WAAM) emerging as a promising technique for producing large-scale metal components. Ensuring quality control and part traceability in WAAM remains an area of active research, as existing process monitoring systems often require operator intervention and are tailored to specific machine setups and camera configurations, limiting adaptability across industrial environments. This study addresses these challenges by developing an angle-invariant melt pool analysis pipeline capable of recognising bead features in wire-based directed energy deposition from monitoring images captured using various camera qualities, positions, and angles. A new benchmark dataset, WAAM-ViD, is also introduced to support future research. The proposed pipeline integrates two deep learning models: DeepLabv3, fine-tuned through active learning for precise melt pool segmentation (Dice similarity coefficient of 95.90%), and WAAM-ViDNet, a regression-based multimodal model that predicts melt pool width using the segmented images and camera calibration data, achieving 88.71% accuracy. The results demonstrate the pipeline’s effectiveness in enabling real-time process monitoring and control in WAAM, representing a step toward fully autonomous and adaptable additive manufacturing systems.
1 Introduction
With the rise of Industry 4.0 and recent technological advancements, additive manufacturing (AM), commonly referred to as 3D printing, has gained significant attention. This is largely due to its ability to produce customisable and complex parts at a lower cost compared to traditional manufacturing methods (Dilberoglu et al., 2017; Pereira et al., 2019). AM dates back to the 1960s, when it was first introduced as a rapid prototyping technology (Wohlers et al., 2016). Unlike conventional subtractive manufacturing methods, where a product is manufactured by drilling or milling away materials (Esmaeilian et al., 2016), AM builds objects by printing materials layer-by-layer (Wong and Hernandez, 2012; Abdulhameed et al., 2019), allowing for intricate designs and efficient material usage.
Among its various applications, the aerospace industry has been a leading adopter of metal AM due to the ability to manufacture complex, customisable components (Blakey-Milner et al., 2021; Radhika et al., 2024). Metal AM can be categorised as follows (Armstrong et al., 2022): metal extrusion, binder jetting, powder bed fusion, and direct energy deposition, where powder bed fusion (PBF) and direct energy deposition (DED) are most commonly adopted in the aerospace industry (Uriondo et al., 2015). PBF-based metal AM uses a laser as the heat source to selectively melt powdered metal on a powder bed (Ladani and Sadeghilaridjani, 2021). In contrast, DED-based methods typically use an electric arc, laser, or electron beam to melt metal wire or powder, depositing the molten material directly onto a substrate (Svetlizky et al., 2021). PBF-based metal AM is more suitable for manufacturing small, complex components due to its high precision, whereas DED-based approaches are better suited for producing larger components due to higher deposition rates (Uriondo et al., 2015).
In recent years, research on DED-based metal additive manufacturing has grown significantly, particularly in wire arc additive manufacturing (WAAM), formally classified under ISO/ASTM 52900 as DED-Arc (Treutler and Wesling, 2021; ISO/ASTM 52900, 2021). WAAM leverages conventional welding techniques, employing a plasma or electric arc torch as a heat source to melt metal wire feedstock (Chen et al., 2024). This approach enables high deposition rates, making it suitable for fabricating large-scale components layer by layer. However, maintaining consistent bead geometry remains a key challenge, as the deposition process is highly sensitive to variations in process parameters (Srivastava et al., 2023). For structural applications, continuous process monitoring and quality assurance are essential to ensure dimensional accuracy and build integrity, as process instabilities can lead to layer misalignment and residual stress accumulation.
Defects in WAAM can be attributed to three primary factors: material cleanliness, material reactions, and process instability. Material cleanliness relates to the presence of impurities in the feedstock wire, which may promote the formation of porosity and other internal flaws. Material reactions describe the interaction between the wire and the arc, where variations in cooling rate and solidification behaviour can introduce porosity, cracking, and microstructural irregularities. These internal defects are typically challenging to detect during production and often require advanced non-destructive evaluation techniques such as computed tomography imaging (Stavropoulos, 2023). Process instability, in contrast, can often be observed in situ, providing a practical means of monitoring potential defects. Instabilities, including humping, machine suspension, overlapping, collapse, and spatter, can disrupt uniform material deposition, resulting in a lack of fusion and misalignment between successive layers (Stavropoulos et al., 2024; Franke et al., 2025).
To address process instabilities, various real-time monitoring strategies have been developed, utilising electrical (Li et al., 2022), acoustic (Rahman et al., 2024), and thermal (Baier et al., 2022) signals for defect detection. Among these, vision-based monitoring has emerged as a particularly promising approach, as evidenced by the growing number of recent publications. Vision-based monitoring enables efficient, non-invasive continuous observation of the deposition process, ensuring traceability in quality control. However, WAAM presents specific challenges for machine vision-based systems: the intense illumination generated by the electric or plasma arc often causes occlusion and image saturation, reducing visibility of critical features. To address this, researchers have explored the use of optical filters (Xia et al., 2022; Li et al., 2023) and active cameras (Halisch et al., 2020; Franke et al., 2025) to suppress glare and enhance image quality.
A key focus in vision-based WAAM monitoring is the geometrical analysis of the melt pool, as the geometrical properties directly reflect the quality of WAAM (Dong et al., 2024). Real-time analysis of melt pool geometry enables immediate detection of anomalies, reducing response time and improving process control. Despite progress in this area, existing methods often rely on specialised imaging hardware and fixed viewing angles, which limit generalisability and robustness. Moreover, the high cost of such equipment further reduces adaptability in practical settings.
1.1 Related works
Real-time process monitoring is essential for mitigating defects during WAAM, and a variety of sensing modalities have been investigated to enable accurate defect detection. For instance, Li et al. (2022) proposed a defect detection algorithm based on arc current and voltage data, achieving an F1-score of 90%. The study employed an incrementally trained support vector machine (SVM) to detect melt pool shifts, which are indicative of layer misalignment. Similarly, Rahman et al. (2024) utilised acoustic signal analysis to monitor deposition quality continuously, while Baier et al. (2022) demonstrated that interlayer temperature measurements could effectively identify geometrical defects, highlighting the correlation between interlayer temperature dissipation and weld bead geometry. Although thermal sensor-based monitoring can be considered a vision-based approach, it introduces specific challenges. Thermal cameras rely on the assumption of blackbody emission, yet the emissivity of molten metal is uncertain, which complicates accurate temperature measurements. Consequently, thermal cameras are primarily useful for detecting easier boundaries, since arc glare has minimal impact. However, high cost limits industrial applicability.
In contrast to electrical, acoustic, or thermal sensors, which typically measure proxy signals, vision-based process monitoring offers direct insight into process stability, geometrical features, and, indirectly, melt pool temperature, providing a more interpretable and informative sensing method. Tang et al. (2017) proposed a deep learning-based approach for surface defect detection by capturing visual data using a complementary metal-oxide-semiconductor (CMOS) welding camera. The camera was positioned behind the welding torch to minimise arc glare and obtain a clear top-down view of the weld bead. Image features were extracted using a convolutional neural network (CNN) and subsequently classified into defect categories using an SVM model. This method achieved an accuracy of 95.29%, accurately classifying five defect types, including the normal welding state.
A similar camera setup was adopted by Li et al. (2023), where surface defects were detected using YOLOv4 (Bochkovskiy et al., 2020) with a modified DarkNet53 backbone. The authors introduced a novel variation of the original DarkNet53 architecture proposed by Redmon and Farhadi (2018) by incorporating a channel-wise attention mechanism, enhancing feature representation. This modification, dubbed DarkNet53-attention, improved detection accuracy, with the model achieving a mean average precision of 94.5% for defect identification in WAAM. Although this rear-mounted camera configuration demonstrated high performance across both approaches, a key limitation remains: the positioning behind the torch introduces a detection delay, as defects are observed only after deposition.
To mitigate detection delays, several studies focused on visual melt pool analysis. The geometrical characteristics of melt pools are significantly influenced by WAAM process parameters (Srivastava et al., 2023); therefore, analysing the melt pool can serve as an indicator for predicting potential defects during material deposition. However, as the melt pools are located under the arc, glare from the arc light introduces challenges during analysis. Lee et al. (2021) proposed analysing three distinct regions of interest in the WAAM process: (1) the wire feeder region, (2) the melt pool and arc region, and (3) the weld bead immediately following the melt pool. Visual data were acquired using a high dynamic range (HDR) camera mounted on the side of the robotic arm. A pre-trained VGGNet (Simonyan and Zisserman, 2014) was employed for abnormality classification, achieving accuracies of 99.7% and 96.5% for the first and third regions, respectively. However, no evidence of high accuracy was reported for the second region, highlighting the challenges associated with melt pool analysis.
Building on this, Xia et al. (2022) investigated several deep learning models for defect classification by analysing melt pool images captured using an HDR camera equipped with a 650 nm central-wavelength filter. This filtering setup enabled the acquisition of visual data while suppressing the intense arc light. Four deep learning architectures were evaluated: GoogleNet (Szegedy et al., 2015), VGGNet, ResNet (He et al., 2016), and EfficientNet (Tan and Le, 2019). All models achieved classification accuracies above 97%, with ResNet performing the best at 97.62%. The models were fine-tuned to classify four defect types in WAAM: normal, humping, pores, and machine suspend. Similarly, Zhang et al. (2023) examined the application of VGGNet, EfficientNet, ResNet, and ResNeXt (Xie et al., 2017) for classifying defects commonly observed during the material layering process in WAAM, including overlapping, collapse, and spatter. The WAAM process was monitored using a charge-coupled device (CCD) camera equipped with filters in the 850–1,100 nm range. Among the models evaluated, the highest accuracy was achieved by the ResNeXt model (98.56%). Additionally, the output of the classification model was integrated into an early-warning system to support real-time process monitoring.
While these studies demonstrated the effectiveness of deep learning applied to melt pool analysis as a promising approach for process instability detection in WAAM, the investigation of geometrical analysis was not addressed. Zhao et al. (2019) utilised melt pool geometry as input features to monitor the stability of weld speed in the WAAM process. Melt pool images were captured using a CCD camera equipped with an 850 nm high-pass filter and a 10% neutral dimmer film, effectively reducing glare from the arc light. A segmentation algorithm proposed by Otsu (1975) was applied, followed by morphology-based post-processing and the Canny edge detection algorithm (Canny, 1986) to extract the contour of the segmentation mask. Geometrical properties of the melt pool were derived from the contour curve and used as input features for a k-nearest neighbour model to assess weld speed stability. Furthermore, a multi-modal approach was adopted by integrating spectral analysis, which further enhanced the quality monitoring process.
Halisch et al. (2020) performed a dimensional analysis of the melt pool using a high-speed camera and an HDR two-colour pyrometric camera equipped with a laser illumination source. To isolate the melt pool region in the visual data, a thresholding technique was applied. The melt pool dimensions were then quantified by calibrating the pixel resolution to millimetres using a reference ruler placed within the camera’s field of view. The authors acknowledged several limitations in their study. One significant constraint was the use of a fixed threshold value for melt pool detection, which limits the generalisability and adaptability of the method to other WAAM systems with varying lighting conditions and process dynamics. Additionally, the study did not compare the measured melt pool dimensions against a physical ground truth, limiting the ability to assess the absolute accuracy of the melt pool size measurements.
To achieve higher accuracy in dimensional analysis, Xiong et al. (2020) proposed a 3D reconstruction-based method using a single camera. The study introduced a virtual binocular system comprising a single CCD camera equipped with a narrowband filter and a biprism, enabling the capture of 3D geometrical properties in a 2D image. The captured melt pool was then reconstructed into a 3D scene using a novel machine learning-based reconstruction algorithm developed by the authors. Dimensional measurements were obtained by analysing the reconstructed melt pool, achieving a diameter estimation error of 3.02%. While Xiong et al. (2020) focused on precise dimensional reconstruction, Veiga et al. (2022) proposed analysing the symmetry of the melt pool as an alternative, eliminating the need to extract explicit dimensional measurements. The proposed method was integrated into a real-time process monitoring system, highlighting the effectiveness of melt pool analysis.
Dong et al. (2024) achieved an accurate measurement of weld pool dimensions with an error of 0.55%. A CMOS camera equipped with a 670 nm narrowband filter, a 10% transmittance attenuator, and an ultraviolet lens filter was used to capture the melt pool. The segmentation was performed through thresholding, followed by Canny edge detection to extract the contour, a method similar to that introduced by Zhao et al. (2019). The geometrical dimensions were then calculated by calibrating pixel measurements to physical units, resulting in high accuracy in weld dimension estimation.
Despite demonstrated success in applying deep learning and vision-based methods to WAAM process monitoring, several limitations persist in the current body of research. Many studies have concentrated on defect classification, while limited attention has been given to the geometrical analysis of the melt pool during deposition. Where geometry is considered, significant dependence is placed on specialised image acquisition setups, with models typically tested on the same configurations. This introduces bias into the evaluation process and limits the adaptability of the system to different environments. This dependence on hardware configurations reduces the adaptability of such approaches, as replicating exact camera placements across different WAAM systems may not be feasible due to variations in machine design and constraints. In addition, numerous studies have positioned the camera at the rear of the system facing the melt pool, which restricts the observable angle and complicates adaptation or integration into alternative WAAM setups.
Furthermore, most approaches relied on threshold-based segmentation and contour extraction, which are sensitive to environmental variations such as inconsistent lighting and arc interference. This limits the ability to generalise models across systems with different sensor configurations and camera orientations. Overall, a lack of research focusing on developing an adaptable melt pool dimension analysis pipeline is present in current literature, and the absence of publicly available datasets further constrains the progress in process monitoring systems. These challenges highlight the need for a robust, adaptable vision-based analysis pipeline focused on melt pool dimensions, supported by accessible datasets to facilitate reproducibility and broader adoption.
1.2 Aims and objective
This study aims to address a key gap in the current literature: the limited transferability and adaptability of existing process monitoring systems across different machines, camera configurations, and viewing conditions. This is achieved by presenting a novel, angle-invariant vision-based pipeline for accurate melt pool dimensional analysis in WAAM. The main objective is to develop a vision-based pipeline which achieves state-of-the-art performance for melt pool segmentation while achieving relative accuracy for melt pool analysis. In contrast to existing methods, the proposed approach eliminates the need for optical filters or active imaging equipment, improving adaptability in standard WAAM environments. By facilitating practical deployment without the reliance on specialised hardware, the proposed method also contributes to reducing the overall setup cost of WAAM systems.
An additional aim of the study is to improve data availability and address the lack of benchmark datasets in the current literature. The secondary objective of the study is to introduce a new benchmark dataset, featuring melt pool recordings captured from multiple camera orientations, to support the development of more generalised vision-based analysis techniques. The dataset includes recordings from both a passive HDR camera and an active laser illumination camera, enabling broader applicability across varied imaging conditions. The benchmark dataset is intended to support and stimulate further research into more robust and generalisable vision-based melt pool analysis methods.
While the main objective of this study is to develop a vision-based pipeline for angle-invariant melt pool dimension analysis. It is important to note that the objective of this study is not to claim the optimality of the proposed pipeline for process monitoring, nor to benchmark its performance against existing melt pool analysis approaches. Rather, the primary aim is to introduce a potential pipeline for angle-invariant melt pool analysis, thereby encouraging further exploration into enhancing the adaptability of process monitoring systems.
The paper is structured as follows. Section 1 introduced the background of AM systems and reviews the current state-of-the-art in process monitoring for WAAM. In Section 2, a novel benchmark dataset, WAAM-ViD, is presented for angle-invariant melt pool dimension analysis in WAAM. Section 3 details the development of an angle-invariant, vision-based pipeline for accurate melt pool dimensional analysis. A new multi-modal deep learning model, WAAM-ViDNet, is proposed for robust melt pool width prediction and is integrated into the pipeline. In Section 4, a comprehensive investigation is conducted into the impact of various camera orientations on melt pool dimension analysis performance, leading to the identification of the optimal camera configuration. Concluding remarks are provided in Section 5, and a segmentation assessment form for qualitative analysis is included in the supplementary material.
2 WAAM-ViD dataset
This section introduces a new benchmark dataset, dubbed Wire Arc Additive Manufacturing Video Dataset (WAAM-ViD), and outlines the data collection procedures. The dataset comprises 110 videos, each with an average duration of 26.5 s, captured at 25–30 frames per second (FPS). The videos were filmed using two types of cameras at varying orientations with a passive HDR camera (n = 80) and an active laser illumination camera (n = 30). Table 1 lists the number of videos filmed at each orientation. Additionally, the dataset includes detailed metadata, such as the camera matrix, distortion coefficients, rotation matrix, translation vector, presence of external lighting, arc current, travel speed, and weld bead dimensions.
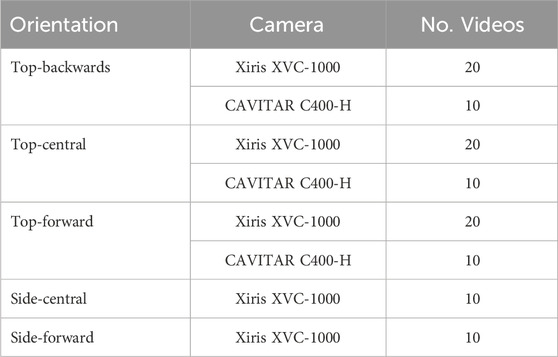
Table 1. List of camera orientations and number of videos in WAAM-ViD.
The WAAM-ViD dataset has been made publicly available to support and encourage further research on angle-invariant, vision-based melt pool analysis in WAAM. It contains manually annotated segmentation masks for each video frame used in the active learning training process (as described in Section 3), formatted in the standard COCO JSON structure for compatibility with widely used computer vision frameworks. The fine-tuned parameters of the deep learning models developed in this study are also included. Metadata is provided in CSV format, and all video files are stored in MP4 format. This dataset is particularly suitable for benchmarking semantic segmentation and angle-invariant melt pool analysis for WAAM. The dataset can be accessed at: https://doi.org/10.57996/cran.ceres-2763.
2.1 System setup
Data were collected using a computer numerical control (CNC)-based WAAM system equipped with two weld pool monitoring cameras: the Xiris XVC-1000 and the CAVITAR C400-H. The experiments were conducted using plasma transferred arc WAAM with ER70S-6 steel wire (
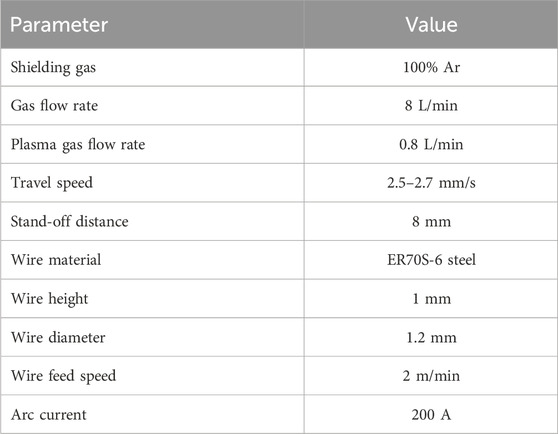
Table 2. WAAM parameters used in the experiment.
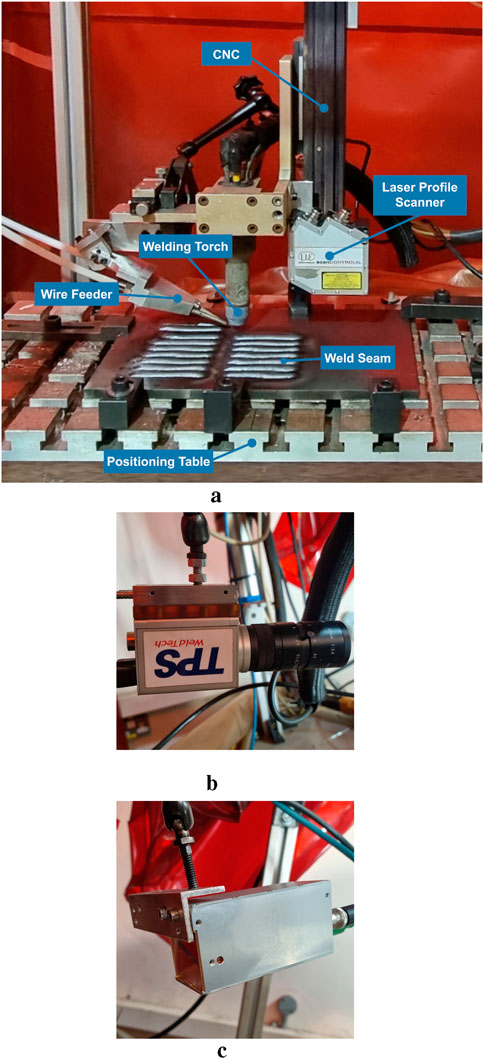
Figure 1. WAAM system setup. (a) Overview of the CNC-based WAAM setup; (b) Xiris XVC-1000 weld pool monitoring camera; (c) CAVITAR C400-H weld pool monitoring camera.
The Xiris XVC-1000 is a mono HDR CMOS camera capable of imaging at 55 FPS with a resolution of
By employing two cameras with different sensing technologies and optical configurations, a dataset for a generalisable monitoring pipeline was developed. This setup enabled the capture of a diverse image dataset under a broad range of viewing angles, illumination conditions, and spatial resolutions. Cameras were positioned at five primary orientations relative to the plasma torch and wire feeder: top-backwards, top-central, top-forward, side-central, and side-forward, as shown in Figure 2. Within each orientation, the camera angle and distance were systematically varied to further enrich the dataset and improve model robustness. In addition, external lighting was introduced to simulate varying ambient conditions and enhance the heterogeneity of the captured scenes, ensuring the models were trained and validated under realistic and challenging conditions.
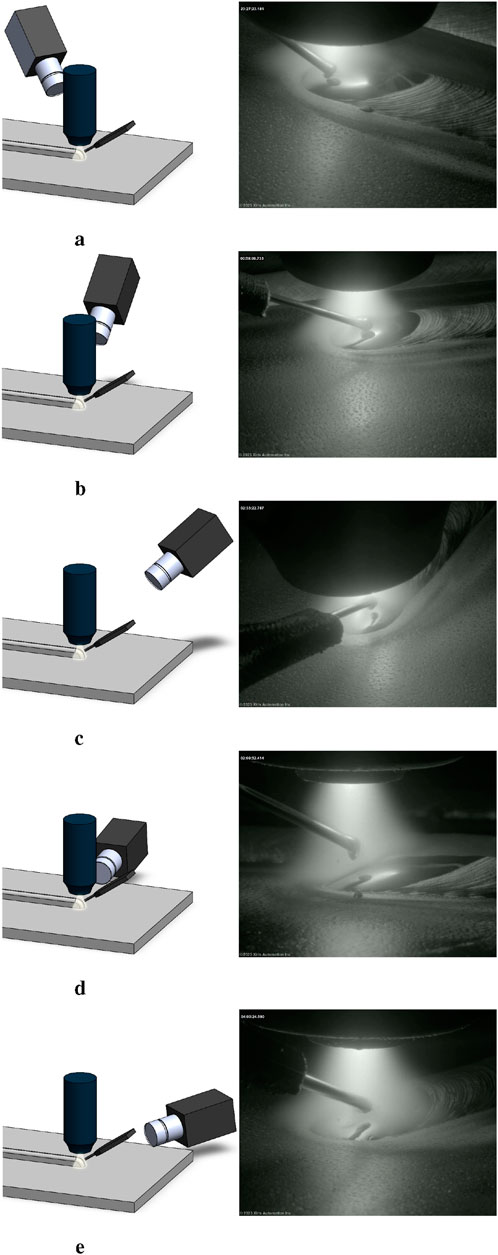
Figure 2. Illustration of camera orientations relative to the plasma torch and wire feeder, along with a sample frame captured using the Xiris XVC-1000. (a) Top-backwards; (b) Top-central; (c) Top-forward; (d) Side-central; (e) Side-forward.
Weld bead dimensions were measured using the Micro-Epsilon optoNCDT 2300-100 laser profile sensor, which captured high-resolution 3D scans of the weld surfaces. The sensor operates with a 670 nm red laser (Class 2) and offers a measuring range of 100 mm, a resolution of 1.5
2.2 Camera calibration data
To ensure consistent spatial measurements and image alignment at varying camera orientations, camera calibration data were extracted for each respective angle to account for perspective variations. Camera calibration is a crucial process during data curation to accurately map the 3D scene to the 2D digital image (Remondino and Fraser, 2006; Qi et al., 2010). A
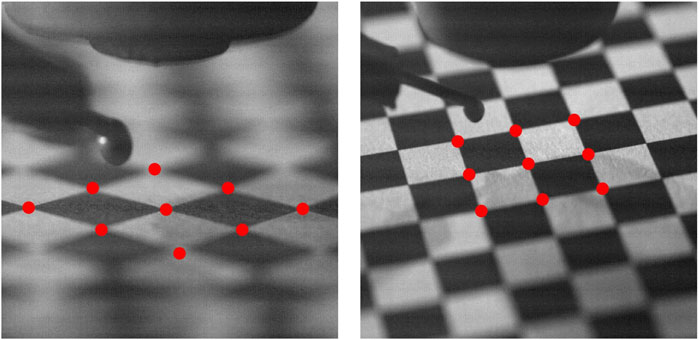
Figure 3. Manual corner selection-based camera calibration approach.
2.3 Data annotation
Training and testing data were annotated independently by two raters, with final confirmation by a senior expert with over 10 years of experience in additive manufacturing and WAAM. Segmentation ground truth was generated using the RoboFlow software (Dwyer et al., 2024), where the RoboFlow-v3 segmentation model (Gallagher, 2023) was employed for initial annotations. The resulting segmentation masks were then reviewed and manually corrected to ensure accuracy. Frame-by-frame annotations were made, where 3024 frames were annotated for training and 1650 frames for the testing dataset.
3 Methodology
The proposed methodology addresses a gap in the current literature by introducing angle-invariant melt pool analysis, designed for easier integration with other WAAM systems and improved adaptability and generalisability. An overview of the methodology is illustrated in Figure 4, where an active learning paradigm was employed to train the segmentation model, mitigating the challenge of limited labelled data.
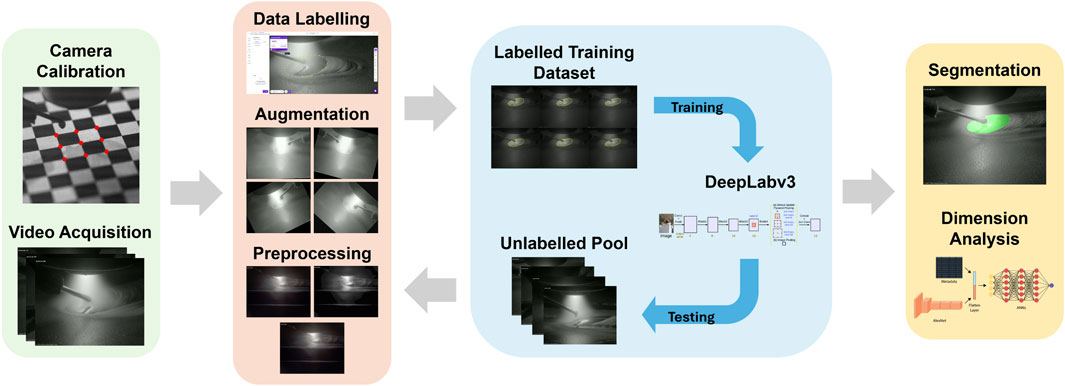
Figure 4. Flow diagram illustrating the automated melt pool dimension analysis methodology pipeline.
Both the segmentation and dimension analysis models were implemented using the Python programming language (Van Rossum and Drake, 2009) and the PyTorch deep learning framework (Paszke et al., 2019), and were trained on Intel Xeon CPU cluster nodes and NVIDIA Tesla V100 GPUs. The Adam optimiser (Kingma and Ba, 2014) was implemented for both models, along with an early stopper mechanism to terminate training once model convergence was detected, increasing computational efficiency. To further enhance training efficiency, a decaying learning rate (You et al., 2019) was implemented, where the learning rate is reduced by a factor of 0.1 when the validation loss does not improve for five epochs. Additionally, to mitigate overfitting, model parameters such as weights and bias were only saved when an improvement in validation loss was observed, discarding any updates that negatively affected performance. Additionally, L2-norm regularisation with a weight decay of
An ablation study revealed that combining gamma correction for image enhancement with Dice + BCE loss yielded the best segmentation performance for the angle-invariant DeepLabv3 model. WAAM-ViDNet was optimised using the mean squared error (MSE) loss function (Yang et al., 2019; Jadon et al., 2024). Initial learning rates of
3.1 Semantic segmentation
A deep learning-based semantic image segmentation approach was implemented to accurately segment the melt pools at varying angle orientations. For this study, the DeepLabv3 model with ResNet-50 as the backbone was trained and deployed for segmentation. Transfer learning and active learning paradigms were adopted.
3.1.1 Data preprocessing
All videos were standardised to the MPEG-4 format (ISO/IEC, 2003) using the H.264 video codec (ITU-T, 2019). Additionally, corrupted frames were identified and discarded during the encoding stage. The videos were resized to
where
3.1.2 Data augmentation
To address the limited amount of labelled training data, data augmentation techniques were employed to increase the dataset size threefold using the RoboFlow software (Dwyer et al., 2024). Data augmentation is commonly used in deep learning to increase the dataset size and variability to tackle overfitting and aid model generalisation (Alomar et al., 2023). Both geometric and photometric transformations were applied to enhance data diversity. These included random horizontal flips, rotations (
3.1.3 DeepLabv3
To achieve accurate semantic segmentation, the DeepLabv3 model (Chen et al., 2017b) was employed, using a ResNet-50 backbone (He et al., 2016) pre-trained on the COCO segmentation dataset (Lin et al., 2014). Introduced by Chen et al. (2017b), DeepLabv3 builds upon earlier iterations of the DeepLab model (Chen et al., 2014; 2017a), enhancing multi-scale feature extraction through further improvements on atrous convolution and the Atrous Spatial Pyramid Pooling (ASPP) module.
Unlike previous versions that relied on post-processing with conditional random fields, DeepLabv3 eliminates this dependency while improving segmentation accuracy. The model initially extracts low-level features using ResNet-50, then refines them with atrous convolution, followed by multi-scale sampling via ASPP. This allows the model to accurately detect and segment regions of interest whilst maintaining high-resolution features.
3.1.3.1 Atrous convolution
Atrous convolution, also known as dilated convolution, was originally introduced by Holschneider et al. (1990) and later adapted in DeepLab models (Chen et al., 2014; Chen et al., 2017a; Chen et al., 2017b) for semantic segmentation tasks. The atrous convolution allows for capturing high-level features without sacrificing the spatial resolution of feature maps at denser layers of the model. For 2D data with spatial dimensions
where
3.1.4 Ablation study
Ablation studies are widely used in deep learning to evaluate the impact of individual components on overall model performance. In this study, an ablation approach was employed to assess the effect of various image enhancement techniques, elastic transformations, and loss functions on the performance of the DeepLabv3 model. The DeepLabv3 model was trained using a subset of labelled data from cycle one, and different preprocessing and training configurations were systematically tested. Based on the results from the ablation study, the combination of gamma reduction and Dice Binary Cross-Entropy loss was selected for integration into the active learning pipeline.
3.1.4.1 Image enhancement and transformation
Four different image enhancement techniques were evaluated: gamma correction (Guan et al., 2009), image sharpening (Schavemaker et al., 2000), HDR filter (Lim et al., 2007), and contrast-limited adaptive histogram equalisation (CLAHE) (Pizer et al., 1990). All enhancements were implemented using the OpenCV library (Bradski, 2000), while elastic transformations were applied using the Albumentations library (Buslaev et al., 2020), both on the original and enhanced images.
3.1.4.2 Loss function
The effect of two loss functions, Dice loss
where
As shown in Equation 4, the Binary Cross-Entropy (BCE) loss compares the predicted and ground truth probability distributions (Jadon, 2020)
The combined loss function, defined in Equation 5, balances region-based and probability-based optimisation:
This combination allows the model to be optimised both for spatial overlap and pixel-level classification accuracy.
3.1.5 Active learning
Active learning is a training paradigm in which a model is initially trained on limited labelled data and evaluated using a pool of unlabelled data. Samples with the highest uncertainty or lowest accuracy are selected for annotation, which is used to retrain the model using the expanded dataset. This cycle is repeated iteratively until the model reaches a satisfactory performance or model convergence. By allowing the model to prioritise the most relevant annotation samples, active learning improves training efficiency and reduces annotation costs, as only a portion of the data requires manual labelling (Wu et al., 2022). In this study, the active learning paradigm was adapted, where the DeepLabv3 model was trained on the initial training dataset and further fine-tuned with samples with low accuracy and high uncertainty.
Videos with the lowest accuracy were selected through rigorous qualitative and quantitative evaluations. For qualitative assessment, segmented melt pools were visually inspected, where a structured assessment form was developed (see Supplementary Material) to conduct consistent visual inspection. The assessment form has five criteria, with each criterion rated on a scale from one (poor) to five (excellent). To mitigate potential bias, four independent raters conducted the assessments, and an average score was computed. Camera orientations corresponding to high average entropy and low qualitative assessment scores were prioritised, and videos captured from these viewpoints were selected for annotation in subsequent training cycles.
Quantitative uncertainty was estimated using the average entropy calculated per video. By adapting the approach proposed by Shaar et al. (2024), Shannon entropy (Shannon, 1948) was used to measure segmentation uncertainty, where higher entropy values indicate greater uncertainty. The Shannon entropy, defined in Equation 6, measures the uncertainty in the predicted mask:
where
The DeepLabv3 model was trained up to the fifth cycle of active learning to ensure that the model’s performance had reached the optimal point. To assess the model’s performance after each cycle, the computed uncertainty in each video was utilised. As training progressed, the model’s uncertainty began to increase in the fifth cycle, indicating that the model may have begun overfitting. Training was terminated, and the model parameters from the fourth cycle, which exhibited the best performance, were selected for final evaluation. These parameters were then integrated into the angle-invariant melt pool dimension analysis pipeline.
3.1.6 Post-processing
To further enhance segmentation accuracy, post-processing was applied to reduce noise in the predicted masks. The primary objective was the suppression of unintended segmentation of other weld beads within the frame whilst retaining the actual melt pool beneath the plasma torch. A method adapted from Kim et al. (2024) is implemented, which retains the largest connected segmentation mask and removes any small, floating masks that are likely to be noise. This noise reduction method is an adaptation of the open-area filter introduced by Salembier et al. (1998), allowing for the production of a clean and accurate melt pool mask.
3.2 Dimension analysis
3.2.1 Data preprocessing
Consistent with common practice in weld geometry analysis (Veiga et al., 2021; Veiga et al., 2022), the start and end regions of the weld beads were excluded from the analysis due to significant variability in weld dimensions. Additionally, since ground truth values were obtained after the WAAM process, measurement errors were introduced due to spatters around the substrate, as illustrated in Figure 5. To prevent potential bias, data affected by these measurement errors were excluded from the analysis. Additionally, input frames were resized to a dimension of
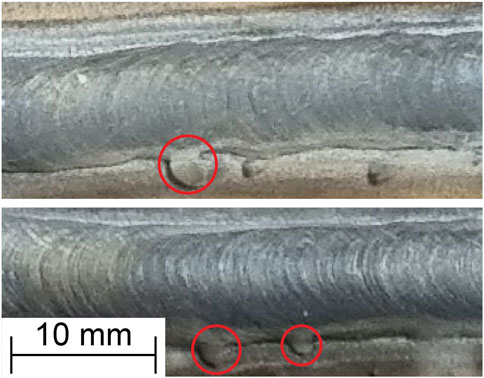
Figure 5. Weld beads with spatter, red circle indicates spatters that introduced errors during width measurement.
3.2.2 Network architecture and design evaluation
A regression-based deep learning model, WAAM-ViDNet, is proposed for angle-invariant melt pool dimension analysis. WAAM-ViDNet integrates AlexNet (Krizhevsky et al., 2012) as its backbone and is designed as a multi-modal architecture that predicts melt pool width based on two input features: (1) a segmented melt pool image, and (2) camera calibration metadata. AlexNet was selected as the feature extractor due to its proven effectiveness and widespread adoption in image analysis tasks (Ding et al., 2018; Barbhuiya et al., 2021; Akbar et al., 2022; Sarkar et al., 2023), as well as its lightweight structure compared to more recent state-of-the-art vision models.
As illustrated in Figure 6, features are extracted from the segmented melt pool via AlexNet and concatenated with calibration metadata obtained in Section 3.2. This combined feature vector is passed through a series of fully connected layers, structured as a regression pipeline, to predict melt pool width. Since the model outputs continuous values, digits beyond the first decimal place are discarded to reduce floating-point inconsistencies and align with the ground truth precision.
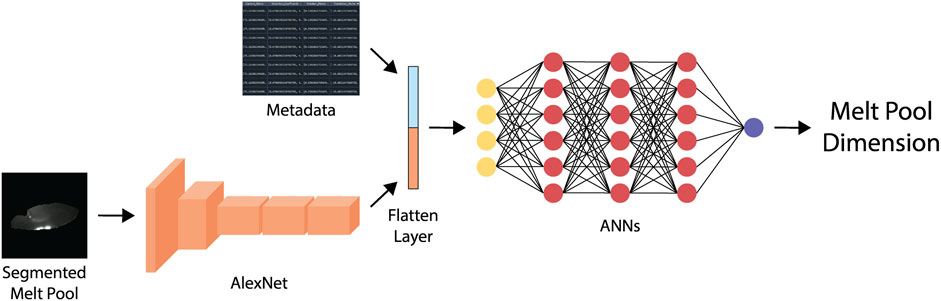
Figure 6. An overview of the WAAM-ViDNet architecture.
To determine the optimal network configuration for dimensional analysis, five different artificial neural network architectures were implemented and evaluated, as shown in Table 3. All candidate models were trained using the same datasets and under identical training procedures to ensure a fair comparison. Based on the evaluation results, the optimal WAAM-ViDNet configuration was selected.
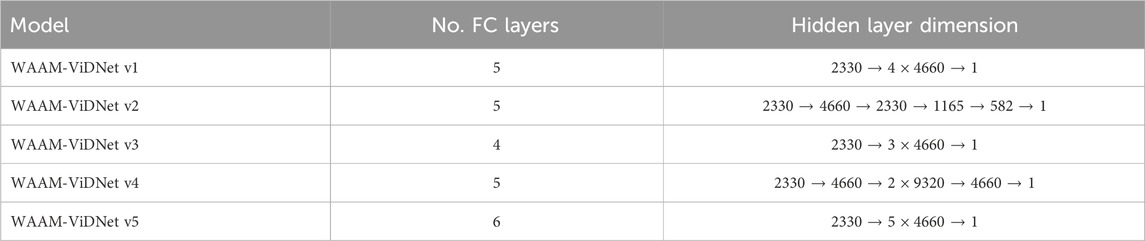
Table 3. Ablation study of WAAM-ViDNet architecture variants.
The final architecture consists of five fully connected (FC) layers following the input layer. The input vector has a dimension of
4 Results and discussion
4.1 Semantic segmentation
The performance of the DeepLabv3 model was computed using three region-based metrics: Dice similarity coefficient (DSC), precision, and recall. The DSC computes the percentage of the overlapping region between the predicted mask and the ground truth (Dice, 1945). The DSC, defined in Equation 7, quantifies the overlap between the predicted and ground truth masks:
where 100% indicates perfect overlap between the predicted mask and ground truth. The rate of over- and under-segmentation was computed using the Precision and Recall metrics (Zhang et al., 2015). The region-based Precision and Recall, defined in Equations 8, 9, quantify the accuracy and quality of the predicted segmentation, respectively:
4.1.1 Ablation study
Table 4 presents a performance comparison of different enhancement methods and loss functions, as described in Section 3.1.4. The configuration combining gamma correction with the Dice BCE loss function achieved the highest DSC and recall, indicating superior segmentation performance and reduced under-segmentation. Although the highest precision was observed with the sharpening and Dice loss combination, its lower DSC and recall suggest overall inferior segmentation performance. Therefore, the gamma correction, combined with the Dice BCE loss, was identified as the most effective configuration. The configuration was implemented and fine-tuned via active learning for melt pool segmentation.
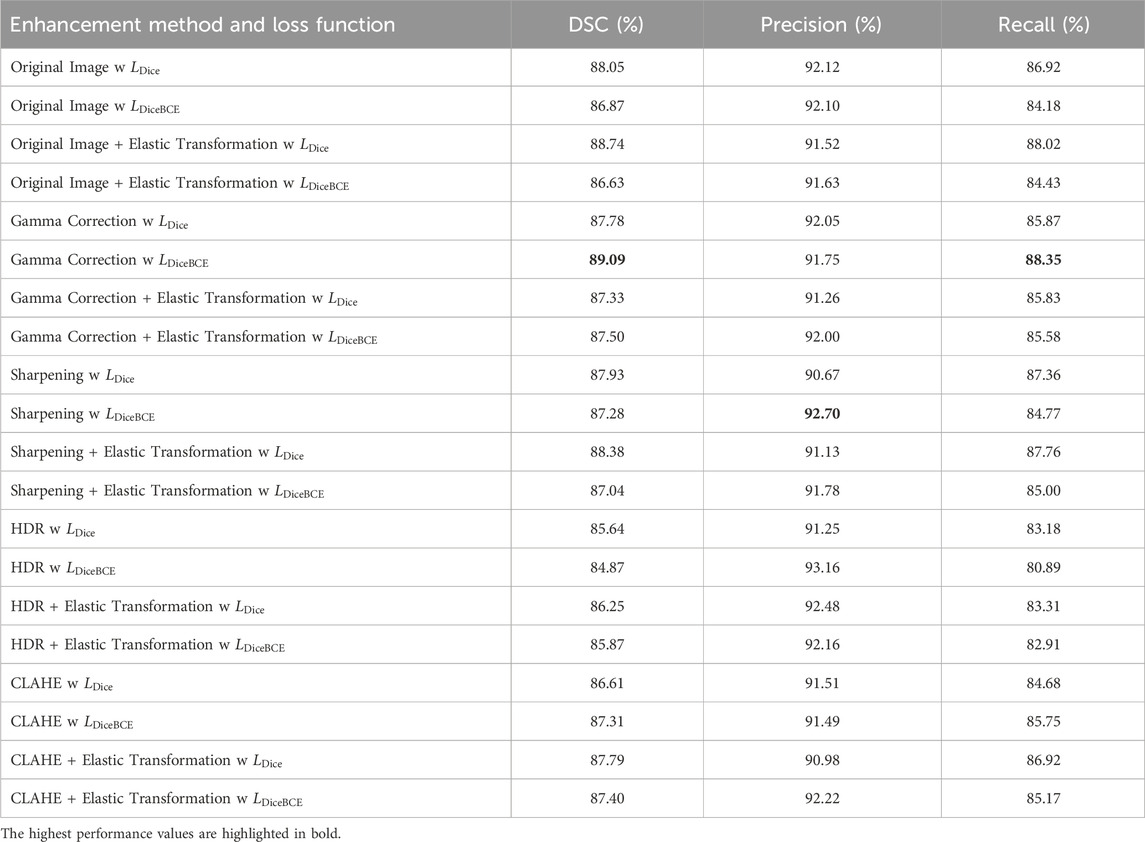
Table 4. Performance comparison of image enhancement methods and loss functions for ablation study.
4.1.2 Model convergence analysis
Model convergence during active learning was monitored through the computation of Shannon entropy (Shannon, 1948), which was used to estimate uncertainty in the predicted segmentation masks, as described in Section 3.1.5. Each active learning cycle was also subject to early termination when no improvement in validation loss was observed, as outlined in Section 3. Figure 7a shows the training and validation loss curves across five active learning cycles. As illustrated, a new cycle was initiated when the validation loss plateaued. At the start of cycle four, both training and validation losses exhibited a sharp increase, and the validation loss plateaued at a higher value than in previous cycles. This behaviour suggests that the newly added data in cycle four introduced novel features or distributions not present in earlier cycles, allowing the model to learn from a more diverse dataset. The sudden decrease in loss after the first epoch may indicate that the initial batch contained particularly novel features or that the model rapidly adapted to the new data by leveraging transfer learning and active learning mechanisms. No further analysis was conducted on this behaviour as it was not the focus of this study.
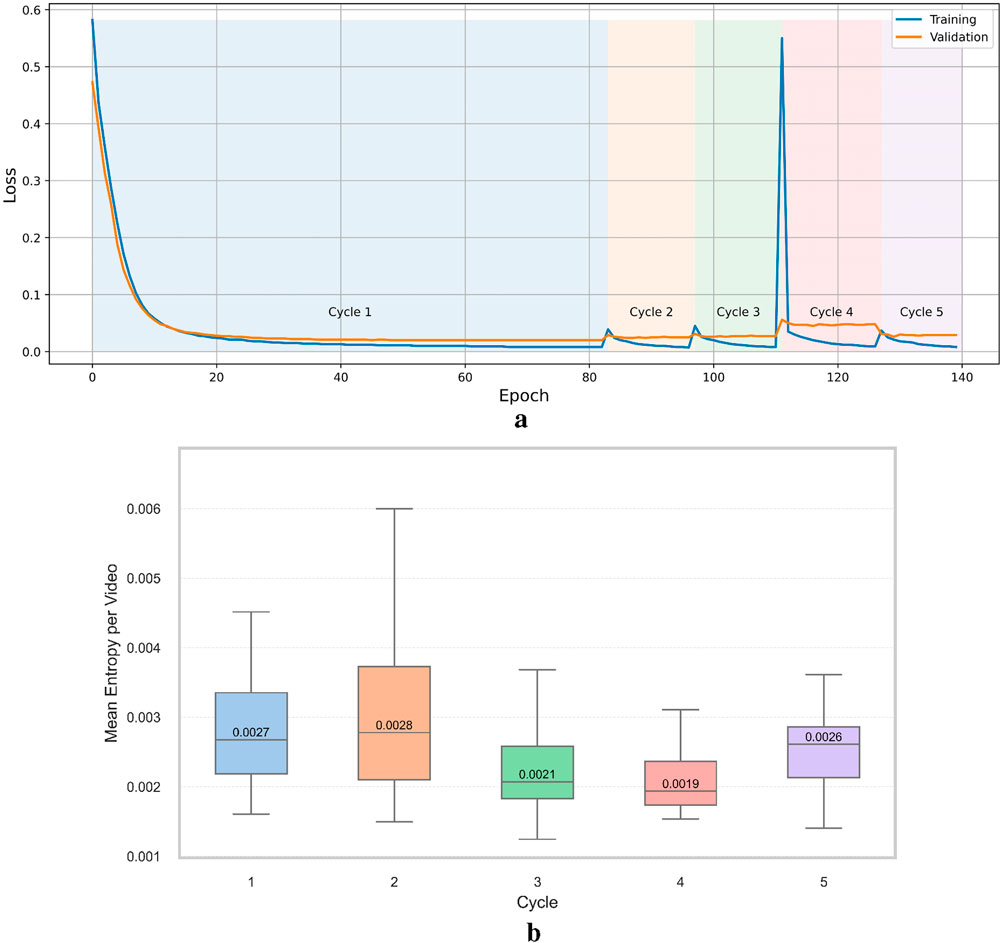
Figure 7. (a) Training loss across active learning cycles. (b) Uncertainty (Shannon entropy) distribution in the unlabelled pool.
To further analyse convergence and model generalisation, the mean Shannon entropy was computed for each unlabelled video and visualised as box plots in Figure 7b. Due to the limited availability of labelled data, uncertainty in the predicted mask was quantified. Although performance could have been evaluated on the test dataset after each cycle, this approach was avoided to prevent bias, as repeated evaluation could lead to fine-tuning the model to a specific subset of data and reduce generalisability. The lowest median entropy was observed in cycle four, suggesting improved model confidence. While the rise in entropy during cycle five implies potential overfitting and reduced generalisation. Based on this observation, the active learning process was terminated after the fifth cycle, and the model parameters from the fourth cycle were selected for integration into the melt pool dimension analysis pipeline.
4.1.3 Performance analysis
The DeepLabv3 model achieved state-of-the-art performance in melt pool segmentation, with a median DSC of 95.90%. Figure 8 presents a box plot illustrating the model’s performance in percentage terms. While post-processing slightly improved the segmentation results, the improvement was not statistically significant, indicating that the model already performs at a high level without additional refinement. In particular, post-processing helped reduce noise in the predicted masks, leading to a 0.09% increase in precision, while recall remained unchanged. This increase in precision suggests a slight tendency toward under-segmentation.
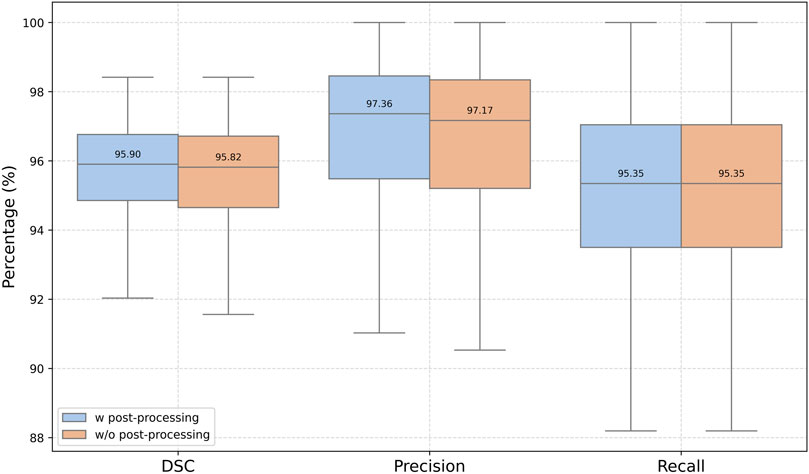
Figure 8. Box plot of the DeepLabv3 performance with and without post-processing.
To further assess the model’s performance, a qualitative analysis was conducted. Figure 9a shows 25 randomly selected frames with the predicted segmentation masks with post-processing overlaid, while the corresponding uncertainty maps of the predicted masks are presented in Figure 9b. Yellow and red arrows indicate regions of over- and under-segmentation, respectively. Although the quantitative analysis suggested a tendency toward under-segmentation based on higher precision, the qualitative evaluation revealed more frequent instances of over-segmentation. This discrepancy may indicate potential bias or inaccuracies in the ground truth segmentation, leading to conflicting interpretations between quantitative metrics and visual observations.
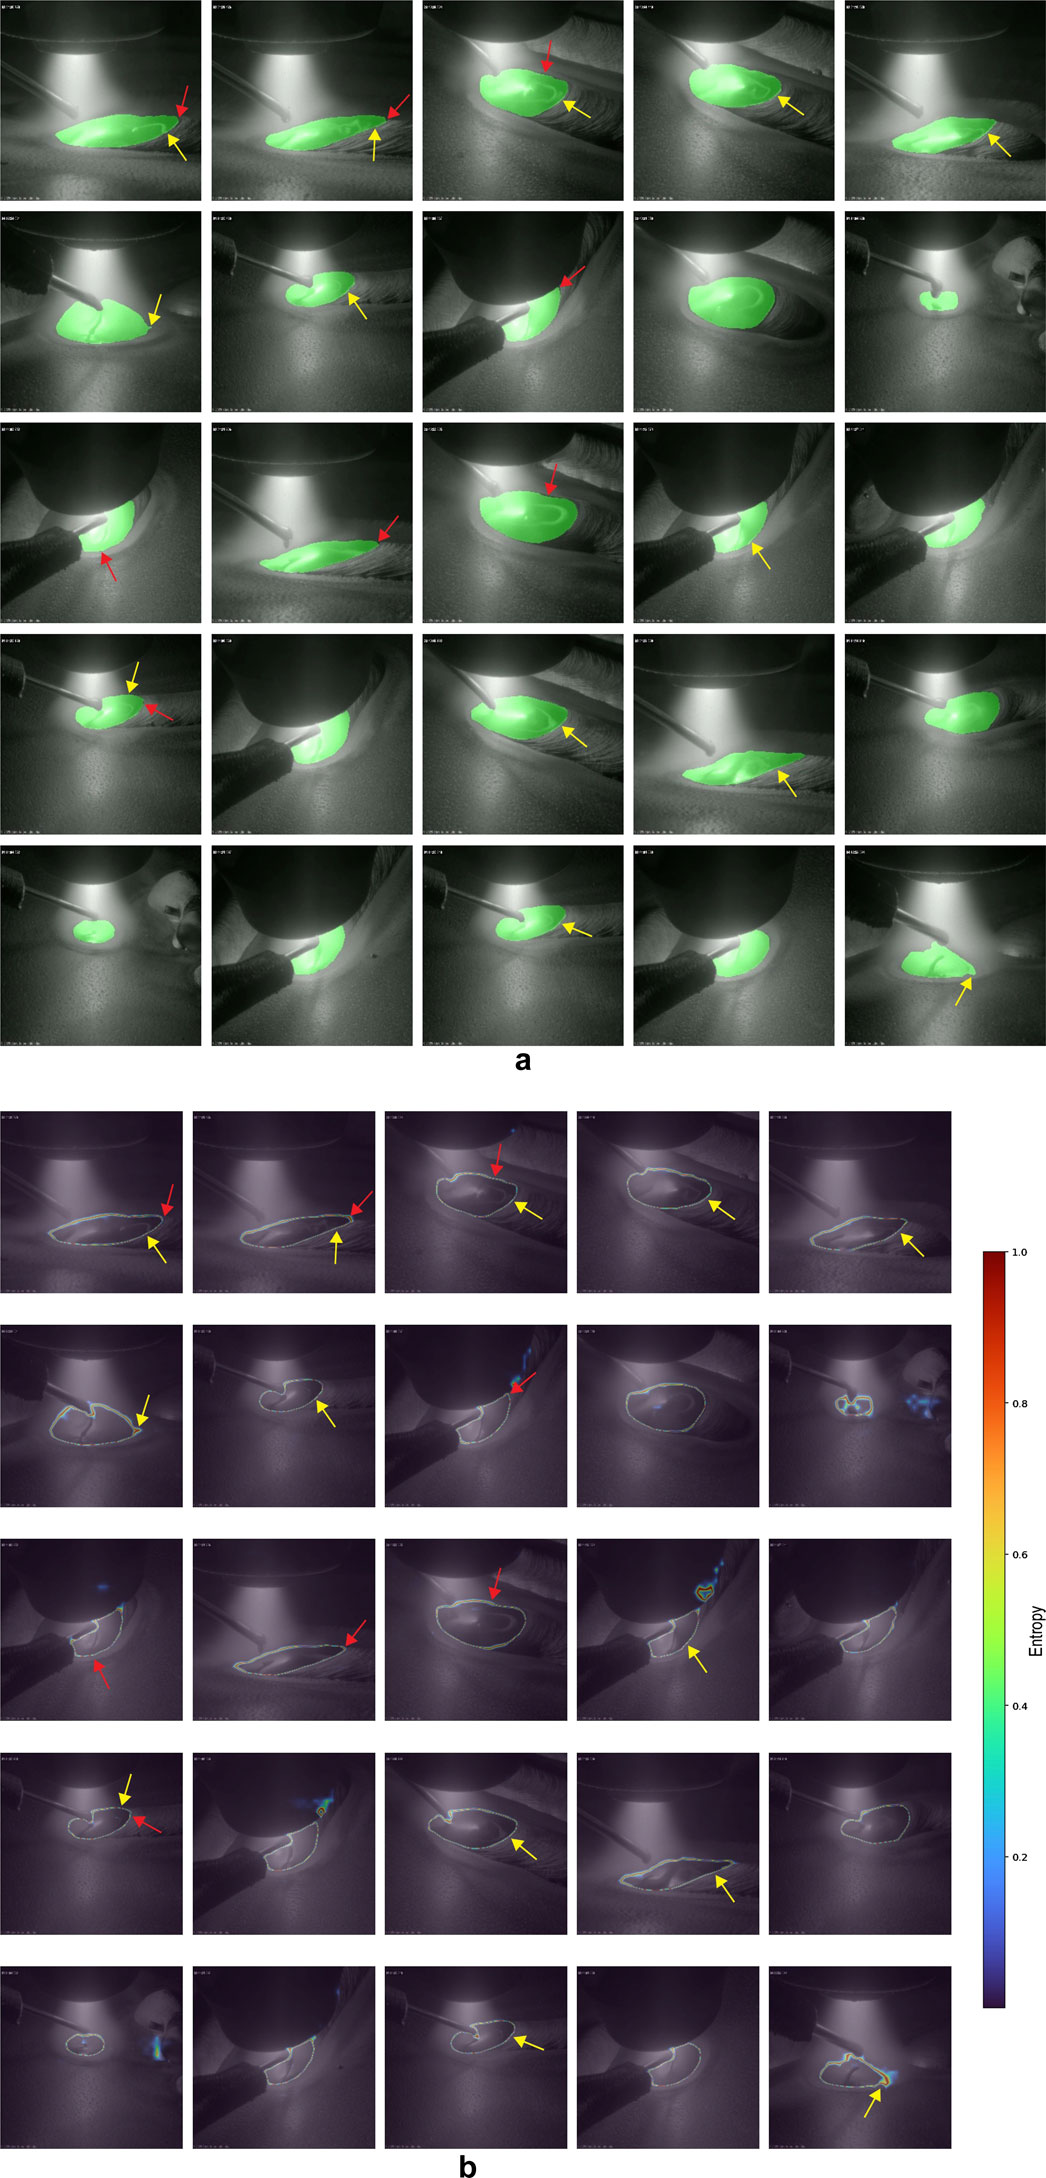
Figure 9. (a) Segmentation results. (b) Uncertainty maps overlaid on the segmentation. Yellow and red arrows indicate regions of over- and under-segmentation.
In this study, manually segmented masks were defined as the ground truth; however, such annotations are inherently prone to inter- and intra-rater variability (Deeley et al., 2011; Cardenas et al., 2019). To mitigate bias, two raters independently annotated the dataset as described in Section 2.3. However, due to the ambiguous boundaries of the melt pool, annotation errors may have occurred from both raters. The discrepancy between the qualitative and quantitative analyses suggests that the ground truth includes instances of over-segmentation. Errors presented in the ground truth have likely contributed to the observed over-segmentation in visual assessments, despite the high precision score reported in the quantitative evaluation. The segmentation errors identified during the visual assessment were minor and often difficult to detect. This further highlights the challenges in annotating melt pool boundaries.
Figure 9b illustrates the correlation between model uncertainty and segmentation errors, showing that all observed segmentation errors occurred in regions of high uncertainty. In contrast, no correlation was observed between model uncertainty and camera position, suggesting that the developed DeepLabv3 model is robust to variations in camera angle. This also indicates that the combination of qualitative and quantitative assessments during the active learning procedure helped mitigate bias in the training data. Such generalisation is critical for the industrial integration of the developed pipeline, as it enables consistent melt pool detection and segmentation regardless of camera configuration.
Notably, high uncertainty is consistently observed around the melt pool boundaries. While some frames exhibited elevated uncertainty in other regions, these potential errors were effectively mitigated through post-processing, which retained only the largest connected component in each mask. This reduced the noise caused by uncertain predictions in irrelevant areas. Additionally, segmentation errors were confined to regions with high intensity of high entropy. This suggests that the intensity and spatial distribution of uncertainty can be analysed to develop a post-processing algorithm to address over- and under-segmentation. For instance, entropy-based region suppression or enhancement could be implemented to selectively refine uncertain regions while preserving accurate segmentations.
Additionally, while obstructions from the wire feeder and plasma torch did not affect the melt pool segmentation quality in this study, previous work has shown the advantages of segmenting multiple components. For example, Feng et al. (2025) successfully segmented the wire, arc, and melt pool in WAAM videos using a visual large model, enabling more detailed analysis of interactions and improved interpretability in complex or occluded scenes. In this study, the focus was solely on melt pool analysis, and the model was deliberately kept simple by performing only binary semantic segmentation. Nonetheless, incorporating multi-component segmentation could provide additional insights and represents a promising direction for future work.
Overall, the deep learning-based approach demonstrated robust segmentation across different camera orientations and lighting conditions, achieving a median DSC of 95.90%, effectively addressing key limitations highlighted in previous studies (Zhao et al., 2019; Halisch et al., 2020; Dong et al., 2024) as discussed in Section 1.1. These results underscore the model’s potential for angle-invariant melt pool analysis, where accurate localisation is critical. The results also highlight the effectiveness of the active learning paradigm for fine-tuning a deep learning model with limited annotated data. Furthermore, the segmented melt pools served as input features for WAAM-ViDNet in subsequent dimension analysis tasks.
4.2 Dimension analysis
The performance of WAAM-ViDNet for dimension analysis was evaluated using root mean square error (RMSE) and the Student’s t-test. RMSE was used to quantify the magnitude of prediction error, as it penalises larger deviations more heavily (Hodson, 2022). This metric was selected because minimising both the average and large individual errors is critical for accurate width prediction. The RMSE and the corresponding percentage error, defined in Equations 10, 11, quantify the prediction accuracy of the melt pool width:
where
where
4.2.1 Model evaluation
A novel multi-modal deep learning model, WAAM-ViDNet, was proposed and evaluated for angle-invariant melt pool analysis. During the evaluation, to reduce bias and errors introduced by the ground truth values, the start and end regions of the melt pools were omitted from the analysis, following the approach used by Veiga et al. (2021) and Veiga et al. (2022). The omission of the start region was due to the difficulty of accurately measuring the melt pool dimensions at the beginning of the process. As Zhao et al. (2019) have noted, it is well known that the melt pool dimension increases at the start of the process. In this study, since the weld bead dimensions were obtained only after the WAAM process, it was not feasible to capture the dynamic changes in melt pool dimensions during the initial phase. As a result, reliable ground truth values for this period were unavailable, and the initial region was excluded from analysis. Additionally, the end region of the weld bead was excluded as the width of the bead tip had no significant effect on the melt pool dimensions, thus introducing bias.
Table 5 presents a performance comparison of different model architectures as defined in Section 3.2.2. The highest performance was exhibited by WAAM-ViDNet v5, with an error rate of 10.60%, while WAAM-ViDNet v2 had the second-lowest error of 11.29%. Despite WAAM-ViDNet v5 showing the best performance, the difference of only 0.69% in error rate between WAAM-ViDNet v5 and v2 is relatively minor. As a result, WAAM-ViDNet v2 was selected for integration into the angle-invariant melt pool analysis pipeline due to the model’s lightweight nature. While high performance is desirable, integrating WAAM-ViDNet v5 into the pipeline would increase the computational burden, reducing its feasibility for real-time process monitoring. Given that the proposed pipeline integrates two deep learning models, optimising the system for computational efficiency is crucial. Therefore, the WAAM-ViDNet v2 architecture was integrated, despite the slight sacrifice in performance.
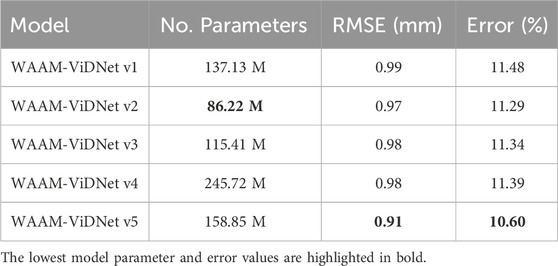
Table 5. Evaluation of WAAM-ViDNet architecture variants.
The performance of the WAAM-ViD v2 model varied across different camera orientations, as presented in Table 6. Although the WAAM-ViD v2 model achieved comparable accuracy across all camera orientations, prediction errors ranged between 9.43% and 13.23%. The most optimal performance was observed with the HDR Xiris XVC-1000 camera in the top-forward orientation, while the worst performance was observed with the HDR Xiris XVC-1000 camera in the side-forward orientation. The variation in performance may be attributed to the imbalanced distribution of data across camera orientations, as shown in Table 1, with the two lowest-performing orientations corresponding to those with the least data.
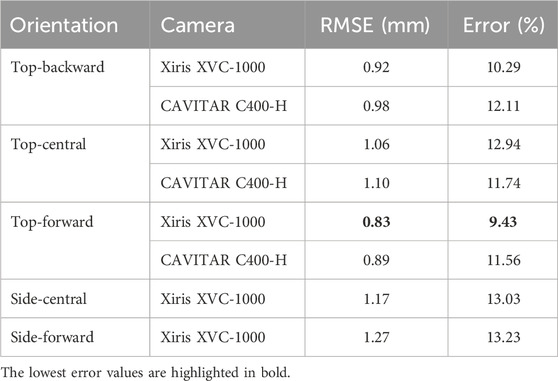
Table 6. List of camera orientations and number of videos in WAAM-ViD.
While the overall accuracy of 88.71% is worse than those reported in the current state-of-the-art, where Xiong et al. (2020) achieved an error of 3.02% and Dong et al. (2024) reported an error of 0.55%. These studies focused on single, optimally positioned camera setups that captured the entire melt pool from a top-down perspective. Such configurations facilitated analysis by providing a complete, unobstructed view of the melt pool geometry. In contrast, the data analysed in this study involved occlusions due to varied camera orientations. Therefore, despite the lower comparative accuracy, the performance remains relatively strong given the increased complexity introduced by multi-angle video input. To the authors’ knowledge, this is the first study to evaluate melt pool analysis using multiple camera viewpoints, which inherently introduces greater variability and presents a more challenging learning task.
4.3 Limitations and future works
While the proposed angle-invariant melt pool analysis pipeline demonstrates relatively high accuracy, several limitations should be acknowledged. One such limitation stems from the segmentation model, where errors such as over- and under-segmentation were identified. These errors could potentially be addressed through an entropy-based post-processing approach, as discussed.
Another limitation lies in the current post-processing approach. In this study, the method implemented by Kim et al. (2024) was used, which incorporates an open-area filter (Salembier et al., 1998). However, the open-area filter retains only the largest connected segmentation mask, which carries the risk of an unintended segmentation having a larger area than the actual melt pool. This could result in the suppression of the desired segmentation mask. Therefore, further investigation into post-processing methods for the model is highly recommended.
Additionally, one of the major limitations of the study is the lack of investigation into real-time process monitoring. While the proposed pipeline demonstrated an overall inference time of 0.014 s per frame for both segmentation and width prediction, this performance was observed when deployed on an Nvidia RTX 4070 Ti Super GPU with 16 GB of video RAM. The inference time is expected to increase when deployed on devices with lower computational power, such as CPUs or embedded systems. Therefore, further research is necessary to improve the computational efficiency of the model. Lightweight segmentation models, such as TinySegformer (Zhang and Lv, 2024) or Lightm-Unet (Liao et al., 2024), could be considered for implementation. Additionally, the WAAM-ViDNet model should be further fine-tuned, with an emphasis on reducing computational cost while maintaining or improving performance.
Finally, the inclusion of additional data simulating WAAM defects, such as humping, would substantially enhance the WAAM-ViD dataset. At present, the dataset comprises only videos of WAAM conducted under normal operating conditions, which restricts variability in melt pool dimensions. Further limitations stem from the single-system, single-alloy configuration employed during data collection; however, this constraint is less consequential for the present study, as the methodology focuses on melt pool segmentation and width prediction, which are largely independent of material or machine specifications. Nevertheless, the incorporation of additional data encompassing varying melt pool dimensions, diverse WAAM systems, and different alloys would serve to increase dataset diversity, mitigate potential data imbalance, and improve the generalisability of models trained on this dataset.
4.4 Industry implications
While the proposed pipeline demonstrates promising results and strong potential for enhancing the generalisability of process monitoring systems, the acknowledged limitations must be addressed. This study introduced a novel monitoring approach designed for adaptability and integration into existing WAAM setups. Although the developed models accurately predict melt pool dimensions, certain camera configurations hinder visual verification by human operators, which may reduce trust and limit practical deployment.
As the industry progresses toward Industry 5.0, explainability and trustworthiness are becoming essential for effective human–machine collaboration, enabling operators to shift their focus to higher-level decision-making tasks. However, these aspects were not fully addressed in the present study. Although uncertainty estimation was explored as part of the active learning process, its broader potential to enhance model confidence and operator trust remains underutilised. A dedicated investigation into uncertainty quantification and explainability in process monitoring systems is urgently needed to advance toward reliable and trustworthy industrial deployment.
In addition, practical challenges such as segmentation errors, computational inefficiency, and the need for further fine-tuning were identified. These issues must be resolved before the pipeline can be deployed in real-time industrial settings. Future work will focus on improving segmentation accuracy, enhancing computational efficiency, and increasing robustness in dynamic environments, with a particular emphasis on transparency, explainability, and trust to support reliable human-machine integration.
5 Conclusion
In this paper, a novel angle-invariant melt pool analysis pipeline was presented, integrating two deep learning models: (1) DeepLabv3 for semantic segmentation of the melt pool and (2) WAAM-ViDNet for predicting melt pool width. The angle-invariant design of the pipeline facilitates seamless integration with existing WAAM systems, addressing key limitations in current process monitoring approaches. The pipeline achieved a prediction accuracy of 88.71% with an inference time of just 0.014 s per frame, demonstrating its suitability for real-time applications. This work represents a significant step toward the development of a universal and automated monitoring system for WAAM.
Additionally, the study introduced a new benchmark dataset for multi-angle WAAM monitoring, addressing the current lack of publicly available data in this domain. This dataset provides a foundation for future research and offers a baseline for evaluating model performance under diverse viewing conditions. The authors highlight the importance of developing a unified monitoring system and its significant potential to enhance the efficiency and adaptability of manufacturing processes.
Data availability statement
The dataset generated for this study can be found in the WAAM-ViD repository (https://doi.org/10.57996/cran.ceres-2763), and the source code developed in this study can be found in GitHub (https://github.com/IFRA-Cranfield/WAAM-ViD).
Author contributions
KWK: Conceptualization, Data curation, Formal Analysis, Investigation, Methodology, Software, Validation, Visualization, Writing – original draft, Writing – review and editing. AK: Data curation, Methodology, Software, Writing – review and editing. T-EC: Methodology, Software, Writing – review and editing. IA: Methodology, Software, Writing – review and editing. JQ: Data curation, Resources, Supervision, Writing – review and editing. WS: Resources, Supervision, Writing – review and editing. SA: Project administration, Resources, Supervision, Writing – review and editing.
Funding
The author(s) declare that no financial support was received for the research and/or publication of this article.
Acknowledgments
The authors express their sincere gratitude to Dr. Shuo Feng, Dr. Alireza Mosalman Haghighi, and the technical staff for their support in setting up and conducting the experiments used for data curation in this study. Special thanks are extended to Dr. Sónia Meco for organising and delivering the health and safety induction. Finally, KWK gratefully acknowledges the support provided by Dr. Aland Escudero.
Conflict of interest
The authors declare that the research was conducted in the absence of any commercial or financial relationships that could be construed as a potential conflict of interest.
Generative AI statement
The author(s) declare that no Generative AI was used in the creation of this manuscript.
Any alternative text (alt text) provided alongside figures in this article has been generated by Frontiers with the support of artificial intelligence and reasonable efforts have been made to ensure accuracy, including review by the authors wherever possible. If you identify any issues, please contact us.
Publisher’s note
All claims expressed in this article are solely those of the authors and do not necessarily represent those of their affiliated organizations, or those of the publisher, the editors and the reviewers. Any product that may be evaluated in this article, or claim that may be made by its manufacturer, is not guaranteed or endorsed by the publisher.
Supplementary material
The Supplementary Material for this article can be found online at: https://www.frontiersin.org/articles/10.3389/fmtec.2025.1676365/full#supplementary-material
References
Abdulhameed, O., Al-Ahmari, A., Ameen, W., and Mian, S. H. (2019). Additive manufacturing: challenges, trends, and applications. Adv. Mech. Eng. 11, 1687814018822880. doi:10.1177/1687814018822880
Akbar, S. B., Thanupillai, K., and Sundararaj, S. (2022). Combining the advantages of AlexNet convolutional deep neural network optimized with anopheles search algorithm based feature extraction and random forest classifier for COVID-19 classification. Concurrency Comput. Pract. Exp. 34, e6958. doi:10.1002/cpe.6958
Alomar, K., Aysel, H. I., and Cai, X. (2023). Data augmentation in classification and segmentation: a survey and new strategies. J. Imaging 9 (2), 46. doi:10.3390/jimaging9020046
Armstrong, M., Mehrabi, H., and Naveed, N. (2022). An overview of modern metal additive manufacturing technology. J. Manuf. Process. 84, 1001–1029. doi:10.1016/j.jmapro.2022.10.060
Baier, D., Wolf, F., Weckenmann, T., Lehmann, M., and Zaeh, M. F. (2022). Thermal process monitoring and control for a near-net-shape wire and arc additive manufacturing. Prod. Eng. 16, 811–822. doi:10.1007/s11740-022-01138-7
Barbhuiya, A. A., Karsh, R. K., and Dutta, S. (2021). “AlexNet-CNN based feature extraction and classification of multiclass ASL hand gestures,” in Proceeding of fifth international conference on microelectronics, computing and communication systems: MCCS 2020 (Springer), 77–89.
Blakey-Milner, B., Gradl, P., Snedden, G., Brooks, M., Pitot, J., Lopez, E., et al. (2021). Metal additive manufacturing in aerospace: a review. Mater. and Des. 209, 110008. doi:10.1016/j.matdes.2021.110008
Bochkovskiy, A., Wang, C.-Y., and Liao, H.-Y. M. (2020). YOLOv4: optimal speed and accuracy of object detection. arXiv Prepr. arXiv:2004.10934. doi:10.48550/arXiv.2004.10934
Buslaev, A., Iglovikov, V. I., Khvedchenya, E., Parinov, A., Druzhinin, M., and Kalinin, A. A. (2020). Albumentations: fast and flexible image augmentations. Information 11, 125. doi:10.3390/info11020125
Canny, J. (1986). A computational approach to edge detection. IEEE Trans. pattern analysis Mach. Intell. 8, 679–698. doi:10.1109/tpami.1986.4767851
Cardenas, C. E., Yang, J., Anderson, B. M., Court, L. E., and Brock, K. B. (2019). Advances in auto-segmentation. Seminars Radiat. Oncol. 29, 185–197. doi:10.1016/j.semradonc.2019.02.001
Chen, L.-C., Papandreou, G., Kokkinos, I., Murphy, K., and Yuille, A. L. (2014). Semantic image segmentation with deep convolutional nets and fully connected CRFs. arXiv Prepr. arXiv:1412.7062. doi:10.48550/arXiv.1412.7062
Chen, L.-C., Papandreou, G., Kokkinos, I., Murphy, K., and Yuille, A. L. (2017a). DeepLab: semantic image segmentation with deep convolutional nets, atrous convolution, and fully connected CRFs. IEEE Trans. pattern analysis Mach. Intell. 40, 834–848. doi:10.1109/tpami.2017.2699184
Chen, L.-C., Papandreou, G., Schroff, F., and Adam, H. (2017b). Rethinking atrous convolution for semantic image segmentation. arXiv Prepr. arXiv:1706.05587. doi:10.48550/arXiv.1706.05587
Chen, Z., Yuan, L., Pan, Z., Zhu, H., Ma, N., Ding, D., et al. (2024). A comprehensive review and future perspectives of simulation approaches in wire arc additive manufacturing (WAAM). Int. J. Extreme Manuf. doi:10.1088/2631-7990/ada099
Cortes, C., Mohri, M., and Rostamizadeh, A. (2012). L2 regularization for learning kernels. arXiv Prepr. arXiv:1205.2653. doi:10.48550/arXiv.1205.2653
Deeley, M., Chen, A., Datteri, R., Noble, J., Cmelak, A., Donnelly, E., et al. (2011). Comparison of manual and automatic segmentation methods for brain structures in the presence of space-occupying lesions: a multi-expert study. Phys. Med. and Biol. 56, 4557–4577. doi:10.1088/0031-9155/56/14/021
Deng, J., Dong, W., Socher, R., Li, L.-J., Li, K., and Fei-Fei, L. (2009). “ImageNet: a large-scale hierarchical image database,” in 2009 IEEE conference on computer vision and pattern recognition (ieee), 248–255.
Dice, L. R. (1945). Measures of the amount of ecologic association between species. Ecology 26, 297–302. doi:10.2307/1932409
Dilberoglu, U. M., Gharehpapagh, B., Yaman, U., and Dolen, M. (2017). The role of additive manufacturing in the era of industry 4.0. Procedia Manuf. 11, 545–554. doi:10.1016/j.promfg.2017.07.148
Ding, L., Li, H., Hu, C., Zhang, W., and Wang, S. (2018). Alexnet feature extraction and multi-kernel learning for object-oriented classification. Int. Archives Photogrammetry, Remote Sens. Spatial Inf. Sci. 42, 277–281. doi:10.5194/isprs-archives-xlii-3-277-2018
Dong, K., Wu, Q., Qin, X., Hu, Z., and Hua, L. (2024). In-situ optical monitoring and analysis of weld pool based on machine vision for wire and arc additive manufacturing. Int. J. Adv. Manuf. Technol. 133, 4865–4878. doi:10.1007/s00170-024-14003-x
Esmaeilian, B., Behdad, S., and Wang, B. (2016). The evolution and future of manufacturing: a review. J. Manuf. Syst. 39, 79–100. doi:10.1016/j.jmsy.2016.03.001
Feng, S., Wainwright, J., Wang, C., Wang, J., Pardal, G. R., Qin, J., et al. (2025). Video segmentation of wire+ arc additive manufacturing (WAAM) using visual large model. Sensors Basel, Switz. 25, 4346. doi:10.3390/s25144346
Franke, J., Heinrich, F., and Reisch, R. T. (2025). Vision based process monitoring in wire arc additive manufacturing (WAAM). J. Intelligent Manuf. 36, 1711–1721. doi:10.1007/s10845-023-02287-x
Guan, X., Jian, S., Hongda, P., Zhiguo, Z., and Haibin, G. (2009). An image enhancement method based on gamma correction. 2009 Second Int. symposium Comput. Intell. Des. 1, 60–63. doi:10.1109/iscid.2009.22
Halisch, C., Radel, T., Tyralla, D., and Seefeld, T. (2020). Measuring the melt pool size in a wire arc additive manufacturing process using a high dynamic range two-colored pyrometric camera. Weld. World 64, 1349–1356. doi:10.1007/s40194-020-00892-5
He, K., Zhang, X., Ren, S., and Sun, J. (2016). “Deep residual learning for image recognition,” in Proceedings of the IEEE conference on computer vision and pattern recognition, 770–778.
Hodson, T. O. (2022). Root mean square error (RMSE) or mean absolute error (MAE): when to use them or not. Geosci. Model Dev. Discuss. 2022, 5481–5487. doi:10.5194/gmd-15-5481-2022
Holschneider, M., Kronland-Martinet, R., Morlet, J., and Tchamitchian, P. (1990). “A real-time algorithm for signal analysis with the help of the wavelet transform,” in Wavelets: time-frequency methods and phase space proceedings of the international conference, marseille, France, December 14–18, 1987 (Springer), 286–297.
ISO/ASTM 52900 (2021). Additive manufacturing — general principles — fundamentals and vocabulary. Standard. Geneva, CH: International Organization for Standardization.
ISO/IEC (2003). Information technology — coding of audio-visual objects — part 14: MP4 file format. Tech. Rep.
ITU-T (2019). Recommendation H.264: advanced video coding for generic audiovisual services. Tech. Rep.
Jadon, S. (2020). “A survey of loss functions for semantic segmentation,” in 2020 IEEE conference on computational intelligence in bioinformatics and computational biology (CIBCB) (IEEE), 1–7.
Jadon, A., Patil, A., and Jadon, S. (2024). “A comprehensive survey of regression based loss functions for time series forecasting,” in International conference on data management, analytics and innovation (Springer), 117–147.
Kim, K. W., Duman, A., and Spezi, E. (2024). RGU-Net: computationally efficient U-Net for automated brain extraction of mpMRI with presence of glioblastoma. In: E. Spezi, and M. Bray (eds.), Proceedings of the Cardiff university school of engineering research conference 2024. 28–32s.
Kingma, D. P., and Ba, J. (2014). Adam: a method for stochastic optimization. arXiv Prepr. arXiv:1412.6980. doi:10.48550/arXiv.1412.6980
Krizhevsky, A., Sutskever, I., and Hinton, G. E. (2012). ImageNet classification with deep convolutional neural networks. Adv. neural Inf. Process. Syst. 25.
Ladani, L., and Sadeghilaridjani, M. (2021). Review of powder bed fusion additive manufacturing for metals. Metals 11, 1391. doi:10.3390/met11091391
Lee, C., Seo, G., Kim, D. B., Kim, M., and Shin, J.-H. (2021). Development of defect detection AI model for wire + arc additive manufacturing using high dynamic range images. Appl. Sci. 11, 7541. doi:10.3390/app11167541
Li, Y., Polden, J., Pan, Z., Cui, J., Xia, C., He, F., et al. (2022). A defect detection system for wire arc additive manufacturing using incremental learning. J. Industrial Inf. Integration 27, 100291. doi:10.1016/j.jii.2021.100291
Li, W., Zhang, H., Wang, G., Xiong, G., Zhao, M., Li, G., et al. (2023). Deep learning based online metallic surface defect detection method for wire and arc additive manufacturing. Robotics Computer-Integrated Manuf. 80, 102470. doi:10.1016/j.rcim.2022.102470
Liao, W., Zhu, Y., Wang, X., Pan, C., Wang, Y., and Ma, L. (2024). LightM-UNet: mamba assists in lightweight UNet for medical image segmentation. arXiv Prepr. arXiv:2403.05246. doi:10.48550/arXiv.2403.05246
Lim, B. R., Park, R.-H., and Kim, S. (2007). High dynamic range for contrast enhancement. IEEE Trans. Consumer Electron. 52, 1454–1462. doi:10.1109/tce.2006.273170
Lin, T.-Y., Maire, M., Belongie, S., Hays, J., Perona, P., Ramanan, D., et al. (2014). “Microsoft COCO: common objects in context,” in Computer vision–ECCV 2014: 13Th European conference, Zurich, Switzerland, September 6-12, 2014, proceedings, part v 13 (Springer), 740–755.
Ma, J., Chen, J., Ng, M., Huang, R., Li, Y., Li, C., et al. (2021). Loss odyssey in medical image segmentation. Med. image Anal. 71, 102035. doi:10.1016/j.media.2021.102035
Paszke, A., Gross, S., Massa, F., Lerer, A., Bradbury, J., Chanan, G., et al. (2019). Pytorch: an imperative style, high-performance deep learning librar. Adv. Neural Inf. Process. Syst. 32.
Pereira, T., Kennedy, J. V., and Potgieter, J. (2019). A comparison of traditional manufacturing vs additive manufacturing, the best method for the job. Procedia Manuf. 30, 11–18. doi:10.1016/j.promfg.2019.02.003
Pizer, S., Johnston, R., Ericksen, J., Yankaskas, B., and Muller, K. (1990). Contrast-limited adaptive histogram equalization: speed and effectiveness. Proceedings of the first conference on visualization in biomedical computing. 337–345. doi:10.1109/VBC.1990.109340
Qi, W., Li, F., and Zhenzhong, L. (2010). “Review on camera calibration,” in 2010 Chinese control and decision conference (IEEE), 3354–3358.
Radhika, C., Shanmugam, R., Ramoni, M., and Gnanavel, B. (2024). A review on additive manufacturing for aerospace application. Mater. Res. Express 11, 022001. doi:10.1088/2053-1591/ad21ad
Rahman, M. A., Jamal, S., Cruz, M. V., Silwal, B., and Taheri, H. (2024). In situ process monitoring of multi-layer deposition in wire arc additive manufacturing (WAAM) process with acoustic data analysis and machine learning. Int. J. Adv. Manuf. Technol. 132, 5087–5101. doi:10.1007/s00170-024-13641-5
Redmon, J., and Farhadi, A. (2018). YOLOv3: an incremental improvement. arXiv Prepr. arXiv:1804.02767. doi:10.48550/arXiv.1804.02767
Remondino, F., and Fraser, C. (2006). Digital camera calibration methods: considerations and comparisons. Int. Archives Photogrammetry, Remote Sens. Spatial Inf. Sci. 36, 266–272. doi:10.3929/ethz-b-000158067
Salembier, P., Oliveras, A., and Garrido, L. (1998). Antiextensive connected operators for image and sequence processing. IEEE Trans. Image Process. 7, 555–570. doi:10.1109/83.663500
Sarkar, A., Maniruzzaman, M., Alahe, M. A., and Ahmad, M. (2023). An effective and novel approach for brain tumor classification using AlexNet CNN feature extractor and multiple eminent machine learning classifiers in MRIs. J. Sensors 2023, 1224619. doi:10.1155/2023/1224619
Schavemaker, J. G., Reinders, M. J., Gerbrands, J. J., and Backer, E. (2000). Image sharpening by morphological filtering. Pattern Recognit. 33, 997–1012. doi:10.1016/s0031-3203(99)00160-0
Shaar, M. A., Ekström, N., Gille, G., Rezvan, R., and Wely, I. (2024). ClaudesLens: uncertainty quantification in computer vision models. arXiv preprint arXiv:2406.13008
Shannon, C. E. (1948). A mathematical theory of communication. Bell Syst. Tech. J. 27, 379–423. doi:10.1002/j.1538-7305.1948.tb01338.x
Simonyan, K., and Zisserman, A. (2014). Very deep convolutional networks for large-scale image recognition. arXiv Prepr. arXiv:1409.1556. doi:10.48550/arXiv.1409.1556
Srivastava, M., Rathee, S., Tiwari, A., and Dongre, M. (2023). Wire arc additive manufacturing of metals: a review on processes, materials and their behaviour. Mater. Chem. Phys. 294, 126988. doi:10.1016/j.matchemphys.2022.126988
Stavropoulos, P. (2023). Additive manufacturing: design, processes and applications. Springer Nature.
Stavropoulos, P., Pastras, G., Tzimanis, K., and Bourlesas, N. (2024). Addressing the challenge of process stability control in wire DED-LB/M process. CIRP Ann. 73, 129–132. doi:10.1016/j.cirp.2024.04.021
Svetlizky, D., Das, M., Zheng, B., Vyatskikh, A. L., Bose, S., Bandyopadhyay, A., et al. (2021). Directed energy deposition (DED) additive manufacturing: physical characteristics, defects, challenges and applications. Mater. Today 49, 271–295. doi:10.1016/j.mattod.2021.03.020
Szegedy, C., Liu, W., Jia, Y., Sermanet, P., Reed, S., Anguelov, D., et al. (2015). “Going deeper with convolutions,” in Proceedings of the IEEE conference on computer vision and pattern recognition, 1–9.
Tan, M., and Le, Q. (2019). “EfficientNet: rethinking model scaling for convolutional neural networks,” in International conference on machine learning (PMLR), 6105–6114.
Tang, S., Wang, G., Zhang, H., and Wang, R. (2017). “An online surface defects detection system for AWAM based on deep learning,” in Proceedings of the 28th annual international solid freeform fabrication symposium – an additive manufacturing conference (Austin, Texas, United States: University of Texas at Austin), 1965–1981.
Treutler, K., and Wesling, V. (2021). The current state of research of wire arc additive manufacturing (WAAM): a review. Appl. Sci. 11, 8619. doi:10.3390/app11188619
Uriondo, A., Esperon-Miguez, M., and Perinpanayagam, S. (2015). The present and future of additive manufacturing in the aerospace sector: a review of important aspects. Proc. Institution Mech. Eng. Part G J. Aerosp. Eng. 229, 2132–2147. doi:10.1177/0954410014568797
Veiga, F., Suárez, A., Aldalur, E., and Bhujangrao, T. (2021). Effect of the metal transfer mode on the symmetry of bead geometry in WAAM aluminum. Symmetry 13, 1245. doi:10.3390/sym13071245
Veiga, F., Suarez, A., Aldalur, E., and Artaza, T. (2022). Wire arc additive manufacturing of invar parts: bead geometry and melt pool monitoring. Measurement 189, 110452. doi:10.1016/j.measurement.2021.110452
Wohlers, T., Gornet, T., Mostow, N., Campbell, I., Diegel, O., Kowen, J., et al. (2016). “History of additive manufacturing,” in Wohlers report.
Wong, K. V., and Hernandez, A. (2012). A review of additive manufacturing. Int. Sch. Res. notices 2012, 1–10. doi:10.5402/2012/208760
Wu, J., Chen, J., and Huang, D. (2022). “Entropy-based active learning for object detection with progressive diversity constraint,” in Proceedings of the IEEE/CVF conference on computer vision and pattern recognition, 9397–9406.
Xia, C., Pan, Z., Li, Y., Chen, J., and Li, H. (2022). Vision-based melt pool monitoring for wire-arc additive manufacturing using deep learning method. Int. J. Adv. Manuf. Technol. 120, 551–562. doi:10.1007/s00170-022-08811-2
Xie, S., Girshick, R., Dollár, P., Tu, Z., and He, K. (2017). “Aggregated residual transformations for deep neural networks,” in Proceedings of the IEEE conference on computer vision and pattern recognition, 1492–1500.
Xiong, J., Liu, Y., and Yin, Z. (2020). Passive vision measurement for robust reconstruction of molten pool in wire and arc additive manufacturing. Measurement 153, 107407. doi:10.1016/j.measurement.2019.107407
Yang, N., Zheng, Z., and Wang, T. (2019). “Model loss and distribution analysis of regression problems in machine learning,” in Proceedings of the 2019 11th international conference on machine learning and computing, 1–5.
You, K., Long, M., Wang, J., and Jordan, M. I. (2019). How does learning rate decay help modern neural networks? arXiv Prepr. arXiv:1908.01878. doi:10.48550/arXiv.1908.01878
Zhang, Y., and Lv, C. (2024). TinySegformer: a lightweight visual segmentation model for real-time agricultural Pest detection. Comput. Electron. Agric. 218, 108740. doi:10.1016/j.compag.2024.108740
Zhang, X., Feng, X., Xiao, P., He, G., and Zhu, L. (2015). Segmentation quality evaluation using region-based precision and recall measures for remote sensing images. ISPRS J. Photogrammetry Remote Sens. 102, 73–84. doi:10.1016/j.isprsjprs.2015.01.009
Zhang, T., Wang, L., Xu, C., Cheng, J., and Wang, K. (2023). Early-warning system for copper alloy abnormal molten pool in wire-arc additive manufacturing via convolutional neural network method. J. Mater. Eng. Perform. 32, 11230–11239. doi:10.1007/s11665-023-07949-8
Keywords: wire arc additive manufacturing, melt pool, vision-based analysis, angle invariance, deep learning
Citation: Kim KW, Kamerkar A, Chiu T-E, Abdi I, Qin J, Suder W and Asif S (2025) WAAM-ViD: towards universal vision-based monitoring for wire arc additive manufacturing. Front. Manuf. Technol. 5:1676365. doi: 10.3389/fmtec.2025.1676365
Received: 31 July 2025; Accepted: 29 September 2025;
Published: 29 October 2025.
Edited by:
Eleonora Atzeni, Polytechnic University of Turin, ItalyReviewed by:
Harry Bikas, University Hospital of Patras, GreeceAdriano Nicola Pilagatti, Polytechnic University of Turin, Italy
Copyright © 2025 Kim, Kamerkar, Chiu, Abdi, Qin, Suder and Asif. This is an open-access article distributed under the terms of the Creative Commons Attribution License (CC BY). The use, distribution or reproduction in other forums is permitted, provided the original author(s) and the copyright owner(s) are credited and that the original publication in this journal is cited, in accordance with accepted academic practice. No use, distribution or reproduction is permitted which does not comply with these terms.
*Correspondence: Seemal Asif, cy5hc2lmQGNyYW5maWVsZC5hYy51aw==; Wojciech Suder, dy5qLnN1ZGVyQGNyYW5maWVsZC5hYy51aw==; Jian Qin, ai5xaW5AY3JhbmZpZWxkLmFjLnVr
†ORCID: Keun Woo Kim, orcid.org/0009-0001-4884-2173; Alexander Kamerkar, orcid.org/0009-0004-2681-5432; Tzu-En Chiu, orcid.org/0009-0005-5683-5263; Ibrahim Abdi, orcid.org/0009-0000-5034-0052; Jian Qin, orcid.org/0000-0002-2692-4952; Wojciech Suder, orcid.org/0000-0003-1280-5431; Seemal Asif, orcid.org/0000-0001-7048-0183;