 Xiaoyan Zhou1†Yue Ning2†Jingyi Xie1Yi Han1Chaonan Tang1Caiyuan Su1Qijuan Wan1Qisheng Wu2Xiang Guo2Jianfei Qi2
 Yizhou Ke1Hui Ge2*
 Mingyi Cai1*
- 1Fisheries College, Jimei University; Key Laboratory of Healthy Mariculture for the East China Sea, Ministry of Agriculture and Rural, Xiamen, Fujian, China
- 2Fisheries Research Institute of Fujian, Keys laboratory of Cultivation and High-value Utilization of Marine Organisms in Fujian, Xiamen, China
A Correction on
Identification of sex-linked markers and genes in Portuguese oyster (Magallana angulata)
By Zhou X, Ning Y, Xie J, Han Y, Tang C, Su C, Wan Q, Wu Q, Guo X, Qi J, Ke Y, Ge H and Cai M (2025) Front. Mar. Sci. 12:1542815. doi: 10.3389/fmars.2025.1542815
There was a mistake in the caption of Figure 7 as published. The Figure 7 caption incorrectly states “five genes”; it should be “four genes”. The corrected caption of Figure 7 appears below.
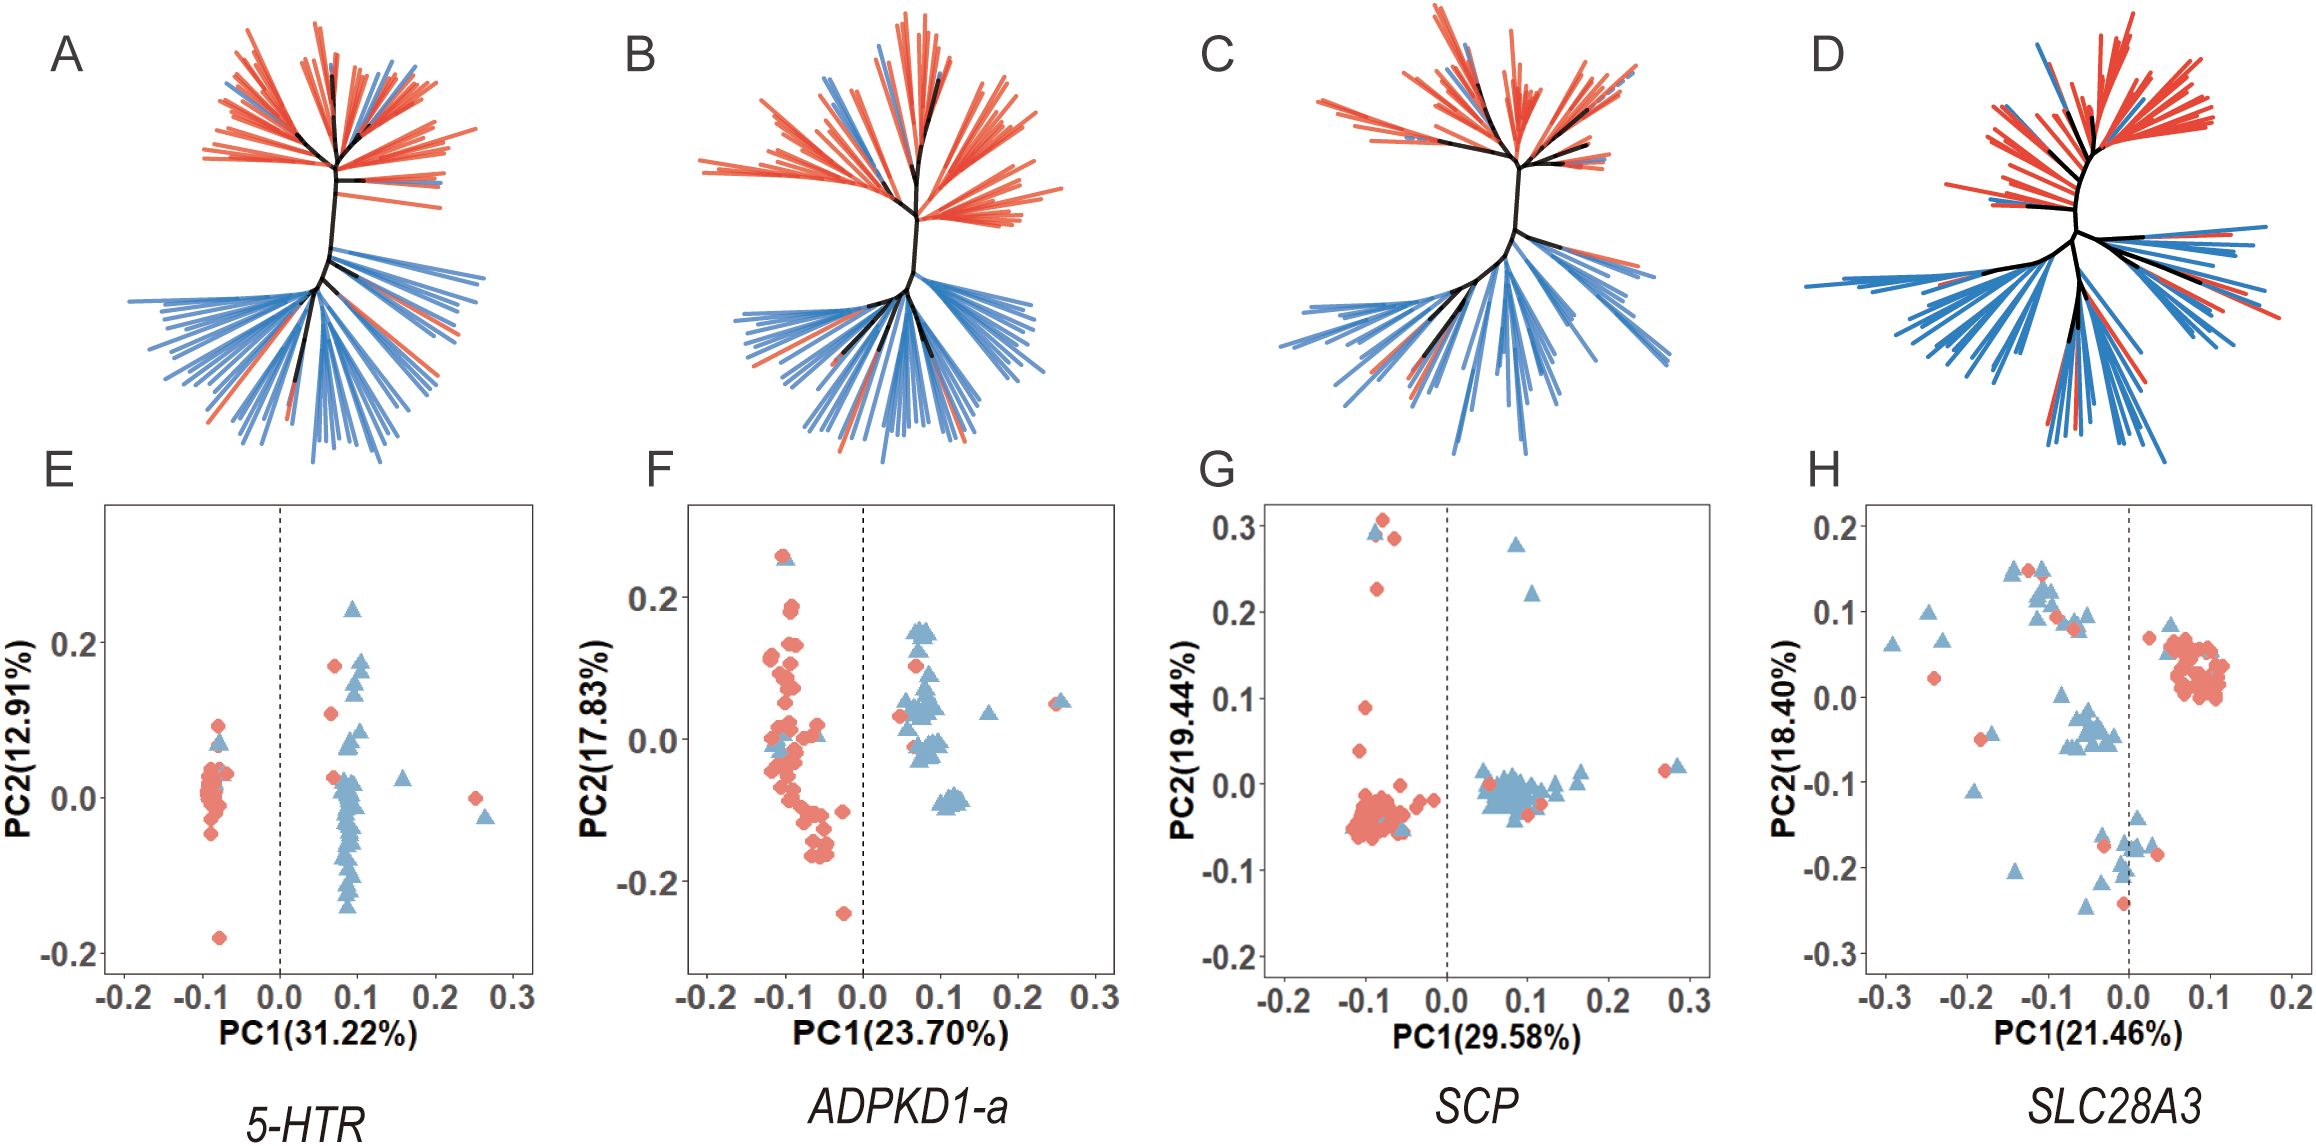
Figure 7. Neighbor-Joining (NJ) trees (A–D) and PCA plots (E–H) for four sex-associated genes, showing the correlation between genetic structure and sex.
“Neighbor-Joining (NJ) trees (A-D) and PCA plots (E-H) for four sex-associated genes, showing the correlation between genetic structure and sex.”
The original version of this article has been updated.
Publisher’s note
All claims expressed in this article are solely those of the authors and do not necessarily represent those of their affiliated organizations, or those of the publisher, the editors and the reviewers. Any product that may be evaluated in this article, or claim that may be made by its manufacturer, is not guaranteed or endorsed by the publisher.
Keywords: Magallana angulata, sex-linked markers, genome-wide association analysis, transcriptomic analysis, sex determination
Citation: Zhou X, Ning Y, Xie J, Han Y, Tang C, Su C, Wan Q, Wu Q, Guo X, Qi J, Ke Y, Ge H and Cai M (2025) Correction: Identification of sex-linked markers and genes in Portuguese oyster (Magallana angulata). Front. Mar. Sci. 12:1643904. doi: 10.3389/fmars.2025.1643904
Received: 09 June 2025; Accepted: 16 June 2025;
Published: 26 June 2025.
Edited and Reviewed by:
Ivana Veneza, Federal University of Western Pará, BrazilCopyright © 2025 Zhou, Ning, Xie, Han, Tang, Su, Wan, Wu, Guo, Qi, Ke, Ge and Cai. This is an open-access article distributed under the terms of the Creative Commons Attribution License (CC BY). The use, distribution or reproduction in other forums is permitted, provided the original author(s) and the copyright owner(s) are credited and that the original publication in this journal is cited, in accordance with accepted academic practice. No use, distribution or reproduction is permitted which does not comply with these terms.
*Correspondence: Mingyi Cai, bXlpY2FpQGptdS5lZHUuY24=; Hui Ge, Z2VodWl6bGpAMTYzLmNvbQ==
†These authors have contributed equally to this work