An incorrect version of the map of the study area was submitted late in the review process. The incorrect version includes only the map of the US East Coast and excludes the more detailed map of Narragansett Bay and our sensor locations. The figure caption, however, is correct as published. The corrected Figure 1 and its caption appear below.
Figure 1
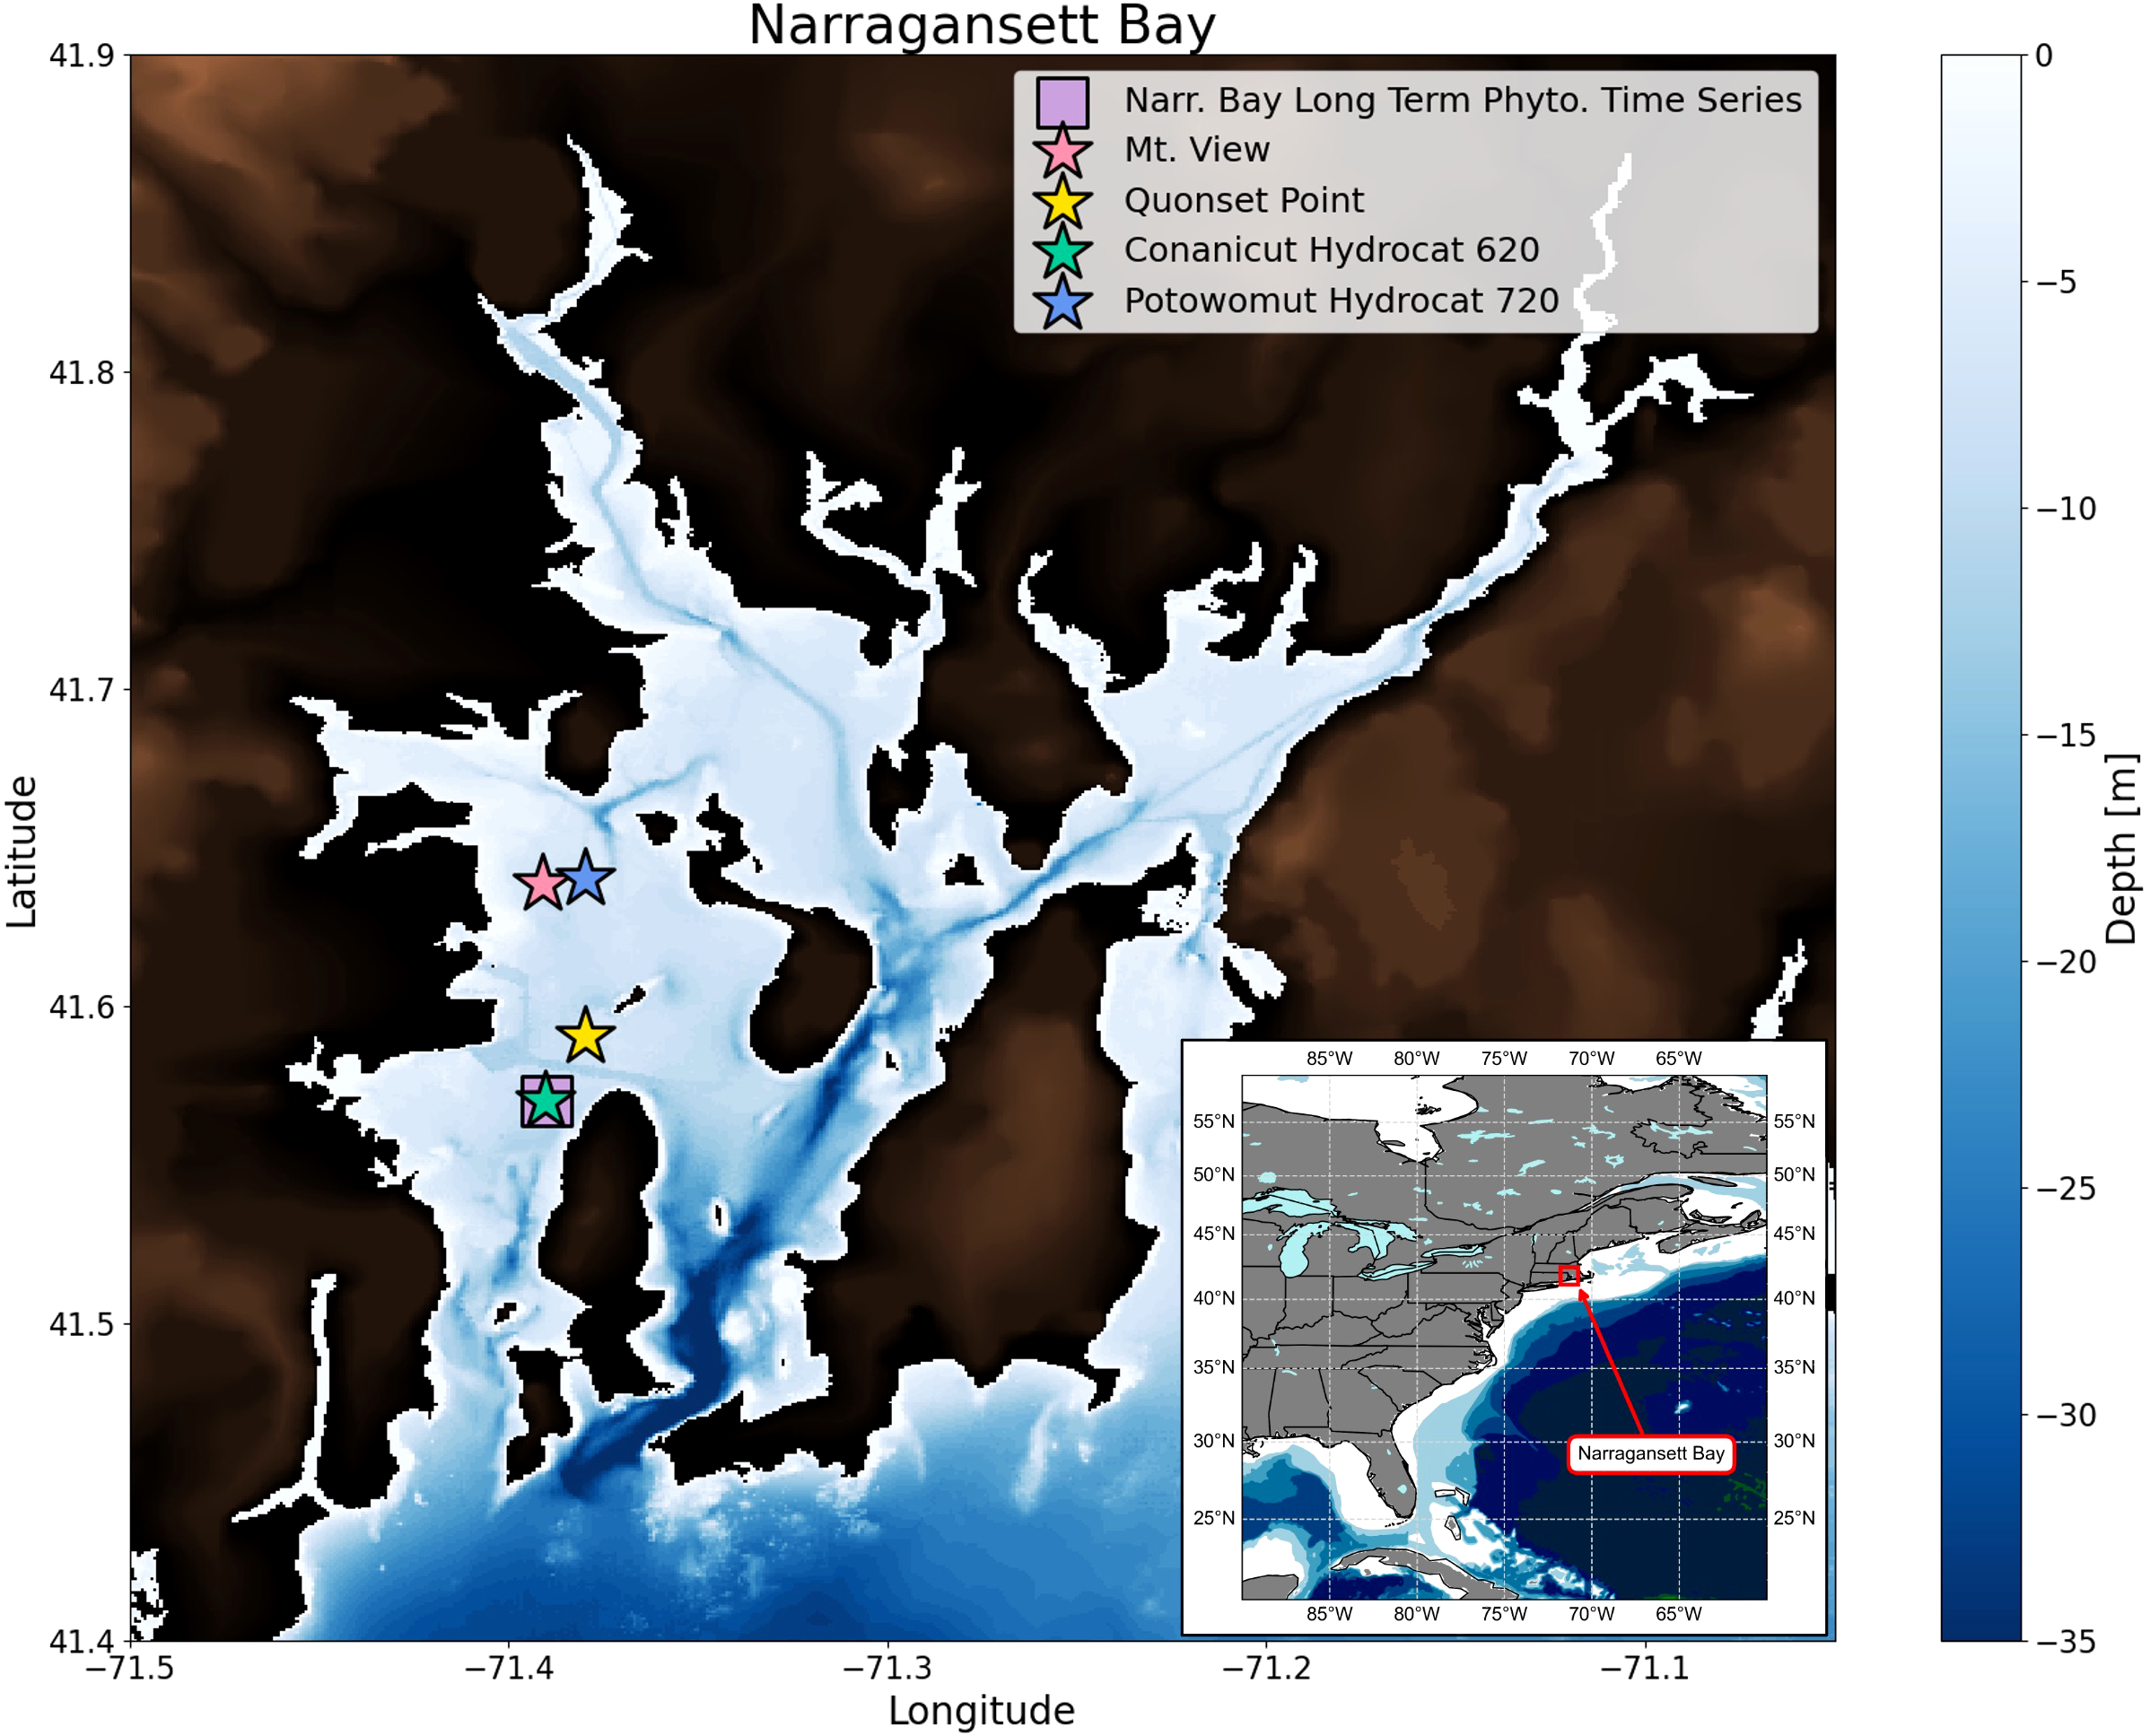
Map of sensor and sample collection sites in Narragansett Bay (NOAA, 1998). Sensor-measured pH measurements were first checked for spurious values and then verified against in situ samples. Conanicut Hydrocat (green star) and Quonset Point (yellow star) were compared to weekly samples collected from the Narragansett Bay Long Term Phytoplankton Time Series site (purple box). Potowomut Hydrocat (blue star) and Mt. View (pink star) were compared to monthly samples collected from the Potowomut site (blue star).
The original version of this article has been updated.
Statements
Publisher’s note
All claims expressed in this article are solely those of the authors and do not necessarily represent those of their affiliated organizations, or those of the publisher, the editors and the reviewers. Any product that may be evaluated in this article, or claim that may be made by its manufacturer, is not guaranteed or endorsed by the publisher.
Summary
Keywords
ocean acidification, carbonate chemistry, estuarine biogeochemistry, nutrient reductions, Narragansett Bay, pH
Citation
Baskind A, Ahumada G, Gomes K, Stoffel H, Gu S, Davies AJ and Wang H (2025) Correction: Unraveling natural carbonate variability in Narragansett Bay, RI using multiple high temporal resolution pH time series. Front. Mar. Sci. 12:1644709. doi: 10.3389/fmars.2025.1644709
Received
10 June 2025
Accepted
23 June 2025
Published
03 July 2025
Volume
12 - 2025
Edited and reviewed by
Jun Sun, University of Geosciences (Wuhan), China
Updates
Copyright
© 2025 Baskind, Ahumada, Gomes, Stoffel, Gu, Davies and Wang.
This is an open-access article distributed under the terms of the Creative Commons Attribution License (CC BY). The use, distribution or reproduction in other forums is permitted, provided the original author(s) and the copyright owner(s) are credited and that the original publication in this journal is cited, in accordance with accepted academic practice. No use, distribution or reproduction is permitted which does not comply with these terms.
*Correspondence: Abigail Baskind, abaskind@uri.edu; akbaskind@gmail.com
Disclaimer
All claims expressed in this article are solely those of the authors and do not necessarily represent those of their affiliated organizations, or those of the publisher, the editors and the reviewers. Any product that may be evaluated in this article or claim that may be made by its manufacturer is not guaranteed or endorsed by the publisher.