Abstract
Due to their importance in global ocean ecology and biogeochemistry, much is known about the abundance and diversity of marine microbes and this data informs our studies of microbial genetic variability and niche partitioning. However, much less is known about marine microbes’ vital rates, including phylogenetically-resolved intrinsic growth and mortality. Here, we use cyanobacteria to validate a recently-developed, sequence-based modification of the Landry-Hassett Dilution (LHD) technique, which simultaneously assesses the growth and grazer-induced mortality of microbial subpopulations. Using laboratory cultures, we show that most approaches for quantifying cyanobacterial intrinsic growth yield similar results, providing a foundation for methods comparisons in complex communities. We then leverage these findings to validate the modified LHD approach by sampling from a highly-dynamic, coastal marine ecosystem. We find that the LHD 16S rRNA gene-based method returns the same intrinsic growth as other biomass estimates. Further, field sampling yields distinct intrinsic growth among closely-related lineages of both cyano- and heterotrophic bacteria. While grazer-mediated mortality was less variable, we did observe distinct mortality rates within the broader microbiome, supporting the importance of examining vital rates in subpopulations. This validated methodology (and initial field findings) opens the door to answer fundamental ecological and biogeochemical questions about the microbial oceanography of spatially and temporally-variable coastal and open ocean ecosystems.
Introduction
Although we often measure standing stocks of marine organisms, more frequently, we seek to quantify rates of activity or growth, as they should be more tightly linked to both biogeochemical rates and ecological processes (Fowler et al., 2020). Moreover, these rates, rather than standing stocks (abundance) may better reflect microbial responses to fluctuating environments, including both pulse (e.g., storms) and press (e.g., long-term global change) events. While surveys of the oceans have increased our understanding of the factors that govern microbial distributions (Ibarbalz et al., 2019), linking these sequences to fundamental ecological rates remains elusive. This challenge is particularly acute at fine phylogenetic scales where the vast majority of genetic diversity occurs (Acinas et al., 2004) and that exhibit change in fluctuating environments (Eren et al., 2013; Larkin et al., 2016).
In all environments, populations represent the balance of intrinsic growth (i.e., bottom-up) and removal processes (i.e., top-down). In the absence of predators and competitors, measuring the growth rates of axenic, nutrient-replete laboratory strains is relatively straightforward as the change in biomass over time. For marine phytoplankton, these growth rate measurements include in vivo and extracted chlorophyll analysis (via fluorometer or a spectrophotometer), cell abundance (via flow cytometry or microscopy) or carbon incorporation via 14CO2 uptake or oxygen evolution among others. Quantification of dividing cells has also been used to determine specific growth rates either based on cell morphology or DNA content (Armbrust et al., 1989; Burbage and Binder, 2007; Campbell and Carpenter, 1986; Carpenter et al., 1998; Hagström et al., 1979; Jacquet et al., 2001). More recently, in situ growth rates have been quantified based on the relationship between cell size and cell division in the cyanobacteria Synechococcus (Sosik et al., 2003) and Prochlorococcus (Ribalet et al., 2015). Additionally, the Landry-Hassett dilution (LHD) technique (Landry and Hassett, 1982; Landry et al., 1995), based on experimental modification of predator encounter rates, yields intrinsic growth (and mortality) rates for whole communities (e.g., chlorophyll) or populations (e.g., flow cytometric signatures). Recent studies have combined the LHD technique with quantitative PCR or FISH (Demir et al., 2008; Staniewski et al., 2012) to start to tease apart finer-scale plankton groups. Although progress has been made in comparing techniques (Staniewski and Short, 2018) and measuring growth rates of field bacterioplankton populations (Landry et al., 1995), phylogenetic resolution remains a challenge even though closely-related strains exhibit distinct ecologies.
To close this phylogenetic resolution gap, a number of sequencing-based approaches (e.g., rRNA/rDNA ratios, uptake of labeled substrates or DNA analogs, and metagenome-based predictions) have been developed to quantify growth and activity for sequence-defined populations. In employing ratios of rRNA/rDNA to predict in situ activity, there are, however, a number of concerns in translating the abundance of ribosomes (e.g., rRNA) to growth rates due to population-level differences in ribosomal quotas per cell and persistence in non-growing cells (Blazewicz et al., 2013; Hunt et al., 2013). Techniques involving uptake of labeled substrates (e.g., DNA SIP) or labeled nucleotide analogs (e.g., BrdU) coupled with sequencing require incubations and involve biases in cellular uptake as well as indirect relationships with cell division. More recently, metagenomic sequencing has been used to predict growth rates for Metagenome Assembled Genomes (MAGs) with in situ growth estimated using peak-to-trough ratios (based on the assumption of increased read density around the origin of replication for dividing cells) (Ahmed and Campbell, 2025; Larkin et al., 2022) or maximal growth rates based on codon usage biases (Long et al., 2020). Both of these approaches require costly, deep metagenomic sequencing and yet MAG assemblies represents only ~10% of metagenomes reads, and therefore exclude rare and difficult to assemble community members. The peak-to-trough ratio has a number of potential limitations including reproducibility across analysis schemes and distortion from mosaic MAGs (Brown et al., 2016; Gao and Li, 2018), while codon usage bias relies on assumptions about codon usage and predicts maximal growth rates rather than real-time in situ growth rates (Long et al., 2020). Thus, while there are a number of phylogenetically-resolved techniques to evaluate metrics of growth or activity in field populations, each has both benefits and specific limitations.
To better resolve in situ activity of diverse bacterioplankton, here we validate use of the LHD technique in conjunction with molecular community analysis to infer intrinsic growth and mortality rates of marine bacterioplankton as recently pioneered in heterotrophic bacteria (Landry et al., 2024). We first assessed the validity of different approaches for measuring growth rates in cultured cyanobacteria (Prochlorococcus MIT9312 and Synechococcus WH8101). Then, we extended this comparison to complex bacterioplankton communities from a temperate, coastal marine time-series (Piver’s Island Coastal Observatory – PICO; Beaufort NC, USA) (Johnson et al., 2025). The goal of this work is to validate the Landry-Hassett technique coupled with sequencing to quantify the growth and mortality of closely-related plankton populations in variable natural environments. Ultimately, this approach will advance identification of the ecological and evolutionary factors shaping the co-existence and dynamics of these complex microbial communities.
Materials and methods
Growth rate measurements for two cyanobacteria model strains
To facilitate the comparison of different techniques in measuring growth rates, we first used two xenic cultures of marine cyanobacteria: Prochlorococcus MIT9312 and Synechococcus WH8101, selected because (1) they represent the dominant cyanobacterial types in the temperate to tropical open and coastal oceans, respectively and (2) they have previously been demonstrated to have distinct physiological characteristics. Both cultures were grown in replicate 2 L acid-washed borosilicate bottles at 25°C with a 12:12 h light: dark cycle, with maximum light intensity of ~ 400 µmol quanta m-2 s-1 and slowly stirred with Teflon-coated magnetic stir bars. MIT9312 was cultured in ProZ media and WH8101 in SN medium (Larkin et al., 2016; Waterbury et al., 1986). Cell abundances were measured daily to determine when the cultures reached exponential growth. The 48-hour diel experiment initiated once the MIT9312 strain reached ~ 107 cells mL-1 and the WH8301 strain ~ 106 cells mL-1. Cultures were sampled every 2 h starting at 10:00 local time (except at 02:00 and 04:00) from replicate bottles for flow cytometry, in vivo chlorophyll a (Chl a) and photophysiology. In addition, bottles were sampled daily at 10:00 for extracted chlorophyll a, dissolved inorganic carbon (DIC), CO2 fixation (NaH14CO3 incorporation), and oxygen evolution.
Quadruplicate samples for flow cytometric (FCM) analysis were collected, fixed with net 0.125% glutaraldehyde and stored at –80°C until processing. Thawed samples were stained for 60 min with Hoechst 34580 (1.0 µg mL-1 final concentration) (Selph, 2021). Cell concentrations of Prochlorococcus and Synechococcus were quantified by running stained samples at 25 µL min-1 on the Attune NxT acoustic flow cytometer (Life Technologies) with 405 nm excitation and 440 ± 25, 512 ± 13, 603 ± 24, 710 ± 25 nm emission and 488 nm excitation and 530 ± 15, 574 ± 13, 695 ± 20, 780 ± 30 nm emission and populations identify as previously described (Johnson et al., 2010). In vivo chlorophyll a was measured in duplicate on cultures directly using a calibrated Turner 10-AU fluorometer. Extracted chlorophyll a was measured in duplicate by filtering 5 mL onto a 0.2 µm polycarbonate 25 mm filter (Whatman) using gentle (< 10 mm Hg) vacuum; pigment was extracted in 100% methanol for 48 h at –20°C, and the fluorescence was measured using a calibrated Turner 10-AU fluorometer (Johnson et al., 2010). The photophysiology of photosystem II was measured in duplicate using a Fluorescence Induction and Relaxation (FIRe) fluorometer as previously described (Bittar et al., 2013; Johnson, 2004). DIC was measured in triplicate on mercuric chloride poisoned samples using the Apollo Scitech DIC analyzer model AS-C3 (Johnson et al., 2013). CO2 fixation rates were calculated in replicate by incubating samples for 24 h under ambient conditions and measuring H14CO3 uptake with a scintillation counter (Beckman Coulter LS6500) following a weak acidification to release unincorporated label (Johnson et al., 1999). Oxygen evolution was measured in duplicate using the Winkler method by comparing 24-h light and dark incubations (Labasque et al., 2004).
Growth rates of field microbes
At ~10 am local time on July 20, 2022, water was collected at the Piver’s Island Coastal Observatory at the mouth of the Newport River estuary in North Carolina, USA (Johnson et al., 2013, 2025; Ward et al., 2017). Additional validation samples were taken from June 28 - July 3, 2018. A peristaltic pump with an intake at ~1 m delivered 200 µm nylon mesh-filtered water (to exclude large zooplankton) to 20 L carboys. Carboys were covered during seawater collection to avoid light stress. Samples for in situ environmental variables including pH, temperature, chlorophyll a, and DIC were concurrently collected using a 5 L Niskin bottle as previously described (Johnson et al., 2013, 2025). (Supplementary Table S1). Upon returning to the lab, carboys were incubated on a 12:12 h light: dark cycle, at 25°C and maximum light intensity at ~ 400 µmol quanta m-2 s-1 using LED white bulbs. Carboys were slowly stirred with a Teflon-coated magnetic stir bar and were continuously gently bubbled with activated charcoal filtered air.
Using flow cytometry fluorescence and light scattering were used to resolve multiple microbial populations: picocyanobacteria (non-phycoerythrin-containing/non-orange fluorescing picophytoplankton), Synechococcus (phycoerythrin-containing/orange fluorescing Synechococcus), heterotrophic bacteria, and eukaryotic phytoplankton using characteristic scatter and pigment content characteristics as previously described (Johnson et al., 2010).
Dilution experiments
Dilution experiments based on the Landry-Hassett technique (Landry and Hassett, 1982; Landry et al., 1995, 2024) were performed. The dilution technique relies on two assumptions: a) phytoplankton growth is independent of the presence of other phytoplankton, and b) microzooplankton grazing is dependent on encounter frequency (i.e., dilution). To validate the linearity of this approach, four-treatment seawater dilutions produced plots of net growth versus dilution with a r2 greater than 0.83, supporting the assumption that encounter rate is proportional to dilution (Supplementary Figure S1). Although chlorophyll was used to estimate phytoplankton community growth rates, here we combined dilution experiments with flow cytometry and 16S rRNA gene sequencing to resolve rates at the population (e.g., cyanobacteria, Synechococcus) and ASV (subpopulation) levels (Landry et al., 2024).
Polycarbonate incubation bottles were soaked overnight with 10% HCl and then rinsed with ddH2O and in situ seawater 3–4 times before filling. To reduce degradation of photosynthetic pigment molecules all dilution experimental setup was performed in low light and was finished within 2 h of seawater collection. Upon returning to the lab, filtered seawater (FSW) was generated using a 0.22 μm Sterivex filter (Millipore). For the two-point dilution experiments, FSW was flowed to bottles (capacity: 600 mL) to the measured volume (dilution factors of 0.33 and 1.00, i.e., 67 and 0% FSW), with 200 μm mesh screened water filled the remainder of the bottles, with duplicate bottles for each treatment. Another two bottles, filled with SW were prepared as initials. For the four-point dilution experiments, FSW was added to bottles (capacity: 320 mL) to generate dilution factors of 0.28, 0.50, 0.77, and 1.00, i.e., 72, 50, 23, and 0% FSW. 1 mL ProZ media was added to 4- point bottles to relieve potential nutrient limitation (Landry et al., 2003). Finally, the bottles were gently filled with SW, avoiding the introduction of bubbles. In addition, four bottles of 100% SW without ProZ addition served as two initials and two controls.
All the two-point and four-point dilution experiments were performed in duplicate and bottles were incubated with carboys for 24 h. Samples for chlorophyll a (25 mL; using 0.2 µm 25 mm filters) and FCM (1 mL) were collected from all initial and final bottles. Due to volume constraints, DNA samples were only taken from two-treatment bottles. Microbial DNA samples were obtained by filtering ~550 mL onto 0.2 µm 47 mm Supor® sterile hydrophilic polyethersulfone filters and stored at -80°C until later extraction.
DNA extraction and library preparation
Genomic DNA for 16S rRNA gene libraries was extracted from half of each filter (cut with sterile razor blades) using the Gentra Puregene Yeast/Bacteria Kit (QIAGEN) with the addition of bead beating (with 0.1 mm zirconia/silica beads) for 3 cycles of 30 seconds each. Extracted DNA was cleaned with the OneStep PCR inhibitor removal kit (Zymo), quantified by using DeNovix DS 11FX+, and diluted to ~ 20 ng µL-1. 16S rRNA gene primers targeting the V4–V5 region 515F-Y (5′-GTGYCAGCMGCCGCGGTAA) and 926R (5′-CCGYCAATTYM TTTRAGTTT) with added barcodes and adapters were used to construct 16S rRNA gene libraries following the protocol (Needham et al., 2018) as validated in (Parada et al., 2016). PCR reactions were performed in triplicate with 20 μL reactions containing 20 ng of template DNA, 1× Buffer, 0.5 μM of each primer, 200 μM of dNTPs, and 2 units of Q5 DNA polymerase (NEB). The thermal cycling conditions were 30 sec at 98°C, followed by 30 cycles of 10 sec at 98°C, 30 sec at 50°C, 30 sec at 72°C, and a final extension at 72°C for 2 min. Triplicate PCR reactions were pooled and gel extracted. Libraries were pooled and sequenced at the Duke Center for Genomic and Computational Biology on the Illumina MiSeq platform using the V2 kit (2 × 250 bp).
Sequence processing and analysis
Barcodes were removed, and sequences were demultiplexed by the sequencing center. Primers were trimmed using PRINSEQ v0.20.4 (Schmieder and Edwards, 2011) and PhiX contamination was removed using bowtie2 v2.2.6 (Langmead and Salzberg, 2012). Low quality sequence ends were trimmed at a Phred quality score (Q) of 30 using a 10 bp running window by fastq-mcf tool of eautils.1.1.2–537 package (Aronesty, 2013). Paired-end reads with at least 10 bp overlap and no mismatches were merged using VSEARCH v2.15.2 (Rognes et al., 2016). Sequences with expected errors >1 and/or a length< 370 bp were removed using cutadapt (Martin, 2011). Chimeric sequences were removed using VSEARCH v2.15.2.
Minimum entropy decomposition analysis (MED) (v2.1) was used to resolve ASVs (Eren et al., 2015). The minimum substantive abundance threshold for an oligotype (-M) was set to 20 reads to reduce sequencing-error associated noise. We allowed within-node variation of four nucleotides and used default criteria for all other parameters. A total of 8,323 ASVs were identified from 2,875,517 reads. Representative ASV sequences were assigned taxonomy using the reference database silva v.132 in DADA2 v1.16.0 (Callahan et al., 2016). Chloroplasts and mitochondria were removed, and to facilitate cross comparisons, libraries were then subsampled to 61,429 reads per library. AmpliCopyrighter (v.0.46) was used to correct for differential rRNA operon copy numbers across taxa (Angly et al., 2014). Normalization was performed by multiplying relative abundance of ASVs by the total prokaryotic cell abundance (non-phycoerythrin-containing picophytoplankton plus Synechococcus plus heterotrophic bacteria) from flow cytometry analysis of all two-treatment dilution bottles to produce as estimate of “absolute abundance” in cell mL-1. We limited analysis to ASVs that had >50 counts in all libraries being analyzed to reduce the role of stochastic sampling on predicted growth and mortality (grazing) rates; however, further work should establish the reliability of calculations based on different sequencing levels and ASV relative abundances. Sequences from additional validation sampling (2018) were processed independently using a similar protocol. ASVs were matched between sampling periods using 100% identity full length sequences as identified using MegaBLAST. Sequencing data were deposited at BioProject PRJNA1278693.
Growth rates estimates
Multiple methodologies were used to estimate growth rates of both cultured and field cyanobacteria. For extracted and in vivo chlorophyll a concentrations and cell abundance from FCM analysis, net growth rate (µNB) was calculated using:
where N2 and N1 are biomass measurements at t2 and t1, respectively.
Oxygen evolution measured by the Winkler method was converted into net growth rates using some assumptions. First, the ratio of oxygen evolution to carbon fixation in photosynthesis ranges from 1.3 to 1.8 and here we use a conservative estimate of 1.3 (Moore, 1974) to convert oxygen evolution to carbon fixation rates. Second, we assumed 50 fg C/cell for Prochlorococcus MIT9312 (Partensky et al., 1999; Roth-Rosenberg et al., 2021). For Synechococcus, cells contain 100 to 500 fg C (Liu et al., 1999; Moisan et al., 2010); our FCM analysis suggests the cell volume of Synechococcus WH8101 culture cells is ~10 times that of MIT9312 so we assume 500 fg C/cell. Third, using these assumptions and cell concentrations of picocyanobacteria and Synechococcus from FCM analysis, net growth rates of field samples were estimated via equation 1 where N2 was the sum of N1 and added mass. H14CO3 uptake was similarly converted to net growth rates.
To estimate cell division rates based on DNA distributions, cell cycle analysis was performed for both laboratory and field cyanobacteria using the FlowJo (version 10) cell cycle platform. Briefly, histograms of Hoechst 34580 fluorescence (DNA content) for Prochlorococcus MIT9312, Synechococcus WH8101, field Synechococcus, and field picocyanobacteria cells represent the relative DNA per cell frequency distribution for these populations. These DNA frequency distributions were then decomposed into G1, S, and G2+M subpopulations following (Binder and Chisholm, 1995). Finally, in situ division rates based on DNA distributions (µDNA, d-1) were computed as described previously (Carpenter and Chang, 1988; Liu et al., 1997; Ribalet et al., 2015) based on the following equation:
where n is the number of samples collected at fixed intervals during the 24-hr period, is the sum of the duration of S and G2+M phases, computed as twice the distance between the peak of cells in these phase [(], and is the fraction of cells in S and G2+M for sample i.
To estimate cell division rates based on the diel changes in cell size, we first estimated the cell size distribution of Prochlorococcus MIT9312, Synechococcus WH8101, field Synechococcus, and field picocyanobacteria from FCM analysis based on a relationship between light scatter and the diameter of size calibration microspheres (beads). We fit a piecewise linear regression in R (“segmented” function from the “segmented” R package) between the mode values of forward scatter area (FSC-A) (dimensionless) and diameters (µm) of seven sizes of Fluoresbrite calibration grade beads (Polysciences: 0.200 µm, 0.504 µm, 0.761 µm, 1.005 µm, 2.200 µm, 3.160 µm, and 5.700 µm), assuming the same relationship between diameter and FSC-A mode values for cells of Prochlorococcus MIT9312, Synechococcus WH8101, field Synechococcus, and field picocyanobacteria (Supplementary Figure S2):
where d is the diameter (µm) of cells (set ), and x is the normalized mode value of FSC-A of cells (normalized by the mode FSC-A of 1.005 µm calibration beads, which is 5932). Assuming spherical particles, the cell diameters obtained via equation 3 were converted to carbon quotas as described previously (Menden-Deuer and Lessard, 2000), using the following equation:
Based on the carbon quota distributions, we applied the R package ssPopModel version 2.0.0 to estimate population-level daily cell division rates (Ribalet et al., 2015). For dilution experiments, the net growth rate (KD, d-1) was calculated for each group based on the initial and 24 h biomass measurements with equation 1.
Instantaneous gross growth rates with (μn, d−1) and without nutrient addition (μ0, d−1) and grazing mortality (m, d-1) rates were calculated as previously described (Jiang et al., 2021; Landry et al., 2011) based on the linear regression of the net growth rates plotted against the dilution factor (D). The LHD-Chl approach used Chl a to calculate the specific growth rates, net growth rates, and mortality rates of coastal phytoplankton communities. FCM-based cell abundances of coastal picocyanobacteria, Synechococcus, and cyanobacteria (sum of picocyanobacteria and Synechococcus) were used in the LHD-Cells approach to calculate the growth and mortality of each group. For the LHD-Molecular approach, inferred cell concentrations of each ASV were used in equation 1 to calculate net growth rates. Differences between growth/mortality rates estimated from different techniques were compared using ANOVA and followed with a Fishers Least Significant Difference (LSD) test in R using “LSD.test” function from the “agricolae” R package.
Results and discussion
To evaluate different techniques that quantify growth, and ultimately to determine the validity of the Landry-Hassett dilution technique coupled with sequencing, we first compared a suite of growth metrics using model marine cyanobacterial cultures. These methods can broadly be grouped into three categories including biomass-based (extracted chlorophyll a, chlorophyll a measured as in vivo fluorescence, flow cytometry-based cell counts), cell cycle-based (flow cytometric: quantification of cell size and DNA content and modeling of cell cycle stage), and primary production-based (incorporation of 14CO2 or O2 production). As outlined in the methods and elsewhere (Flynn and Raven, 2017; Grande et al., 1989; Hunter-Cevera et al., 2014; Jiang et al., 2021; Toepel et al., 2004), these approaches each measure different aspects of growth, require distinct assumptions, and have specific limitations. Here, we apply these methods to cultures of Prochlorococcus MIT9312 and Synechococcus WH8101, representatives of the two dominant cyanobacterial types in the temperate to tropical open and coastal oceans, respectively. Despite differences in what they measure, under balanced growth, the described experimental approaches should yield similar predicted specific growth rates. Here, specific growth rates ranged from 0.230 ± 0.071 day-1 to 1.143 ± 0.212 day-1 for MIT9312 and from 0.430 ± 0.198 day-1 to 2.067 ± 0.272 day-1 for WH8101 (ANOVA p<0.05) (Figure 1). These rates are consistent with previously-measured laboratory growth rates of 0.3–1 day-1 for Prochlorococcus (Givati et al., 2023; Lin et al., 2013; Moore and Chisholm, 1999) and 0.7–2 day-1 for Synechococcus (Binder and Chisholm, 1995; Campbell and Carpenter, 1986; Kondo et al., 1997) under similar conditions. Although each technique has different assumptions and theoretical basis, most of the approaches yielded statistically similar rates within a strain (Figure 1; Fisher’s LSD). For both strains, the cell size approach calculated the lowest doubling rates, which were statistically lower than most other growth metrics (Figure 1). Cell size has been widely applied to field samples to estimate doubling time (Hunter-Cevera et al., 2014), and may be particularly sensitive to changes in cell size that are uncoupled from cell division (e.g., assumed respiration rates, or shifts in subpopulations with distinct cell sizes) (Stevens et al., 2024). In contrast, oxygen production yielded the highest predicted growth rates for both strains and was statistically higher than all other approaches (except for MIT9312 chlorophyll-based and 14CO2-based; Figure 1). Conversion of oxygen evolution to growth rates requires both primary production measurements and cellular biomass estimates, as well as conversion between oxygen evolution and cellular carbon quotas, all of which potentially result in errors that can reach 50% of predicted growth rates (Grande et al., 1989). Here, a modest increase in the assumed photosynthetic quotient (or cellular carbon content) could decrease the predicted growth rates to within the range of other techniques, demonstrating the sensitivity of this technique to assumed parameters. For these model cyanobacterial strains, using DNA cycle predictions yielded cell division estimates that are comparable to other approaches. This approach requires a daily division cycle, synchrony in cell division (e.g., peaks in the DNA content to identify ) as well as high-resolution temporal sampling to resolve changes across the day-night cycle. While the DNA histograms of the cell cycle do not indicate a clear diel synchrony for the Synechococcus culture (Supplementary Figure S3) and there are known challenges using this approach with some strains of cyanobacteria (Binder and Chisholm, 1995), the recovered growth rates are consistent with other metrics (Figure 1), but caution should be used when interpreting this data. In summary, despite measuring distinct metrics of growth, 14C-carbon dioxide incorporation, extracted chlorophyll a, in vivo chlorophyll a fluorescence, flow cytometric cell abundances, and DNA cell cycle approaches generally yield comparable estimates of growth rates for both Prochlorococcus and Synechococcus cultures.
Figure 1
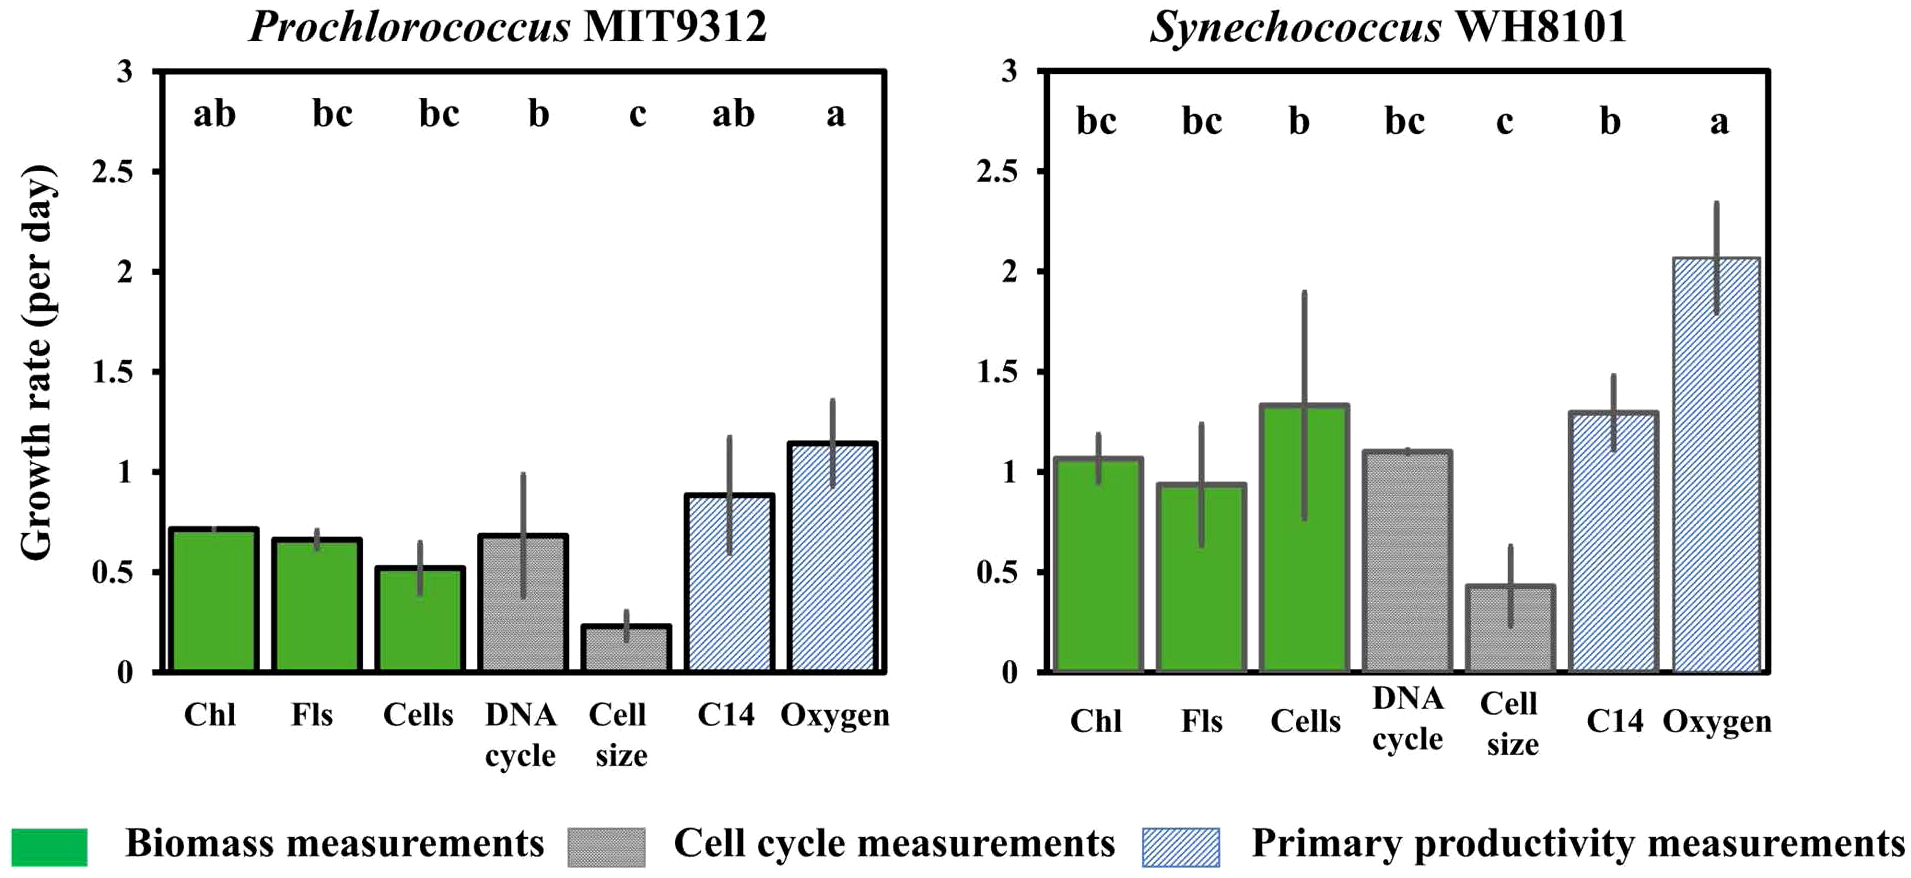
Growth rates of two model cyanobacteria (Prochlorococcus MIT 9312 and Synechococcus WH8101) cultures calculated using seven approaches. Error bars represent one standard deviation for biological duplicates. Letters indicate homogeneous groups according to Fisher’s LSD test (p < 0.05) following ANOVA. Chl: Extracted chlorophyll; Fls: In vivo chlorophyll fluorescence; Cells: Flow cytometry analysis; DNA cycle: Fraction of cells in mitosis; Cell size: Diel changes in cell size; C14: 14C (HCO3) uptake; Oxygen: Oxygen evolution.
Field bacterioplankton populations
Having verified good agreement across most methods for cyanobacteria in balanced growth, comparisons were then extended to natural coastal seawater microbiomes at the Piver’s Island Coastal Observatory. We also included the Landry-Hassett dilution technique both using flow cytometry identified populations and 16S rRNA gene sequencing to resolve growth and mortality rates for populations and subpopulations, respectively, within the natural plankton community. Like most of the global ocean, these coastal ocean samples contain co-occurring plankton populations that add complexity to the analyses. Therefore, we focus on comparisons at the population level using flow-cytometry (i.e., DNA cycle or cell-size) or sequence-based approaches that can resolve subpopulations, or amplicon sequence variants (ASVs). Using this narrower set of approaches that resolve cyanobacterial populations in the field, growth rates of Synechococcus measured with the Landry-Hassett dilution technique coupled with flow cytometry (LHD-Cells), are statistically indistinguishable from DNA-cycle and cell size-based approaches (Figure 2). For non-phycoerythrin-containing picocyanobacteria, the LHD-Cells growth rate is higher than the cell size and cell cycle measurement; however, both cell size (which previously underestimated growth rates in cultures; Figure 1) and cell-cycle (poor resolution of DNA replication phases in cycle analysis; Supplementary Figure S3) have some limitations. In these complex communities, it is not possible to assign sequence variants to flow cytometrically classified ‘Synechococcus’ or ‘picocyanobacteria’ populations because pigment content does not correspond to core genome phylogeny (Grébert et al., 2022), therefore we compared the techniques using the cyanobacteria community as a whole. The LHD-Cells (flow cytometry) based growth rate and the molecular-based delineation of cyanobacteria (LHD-Molecular) are statistically indistinguishable (Figure 2). Overall, these results validate the LHD-Molecular approach to estimate cyanobacteria growth rates. Therefore, we can apply the LHD-Molecular technique to delineate subpopulation-level variation in growth and mortality rates within the cyanobacteria using amplicon sequence variants (ASVs). We observe a large range of growth rates from 0.815 ± 0.190 d-1 to 2.363 ± 0.132 d-1 (Figure 3), resolving into statistically distinct grouping among the 10 most abundant cyanobacteria ASVs (Figure 3A), highlighting the ability of this approach to resolve differences among closely-related microbes. These results are consistent with the relationship between predicted growth rates and changes in field abundance previously observed (Landry et al., 2024). Unlike growth rates, mortality rates are not distinguishable among the most abundant cyanobacterial ASVs (p>0.05) (Figure 3B). Together, these results imply that bottom-up processes, rather than top-down controls, are driving the changes in relative abundance within these cyanobacterial populations for this sampling. These results also align with previous observations that grazers do not discriminate between closely-related taxa (Coleman and Chisholm, 2007), due to the similar size and surface properties of these cyanobacterial cells.
Figure 2
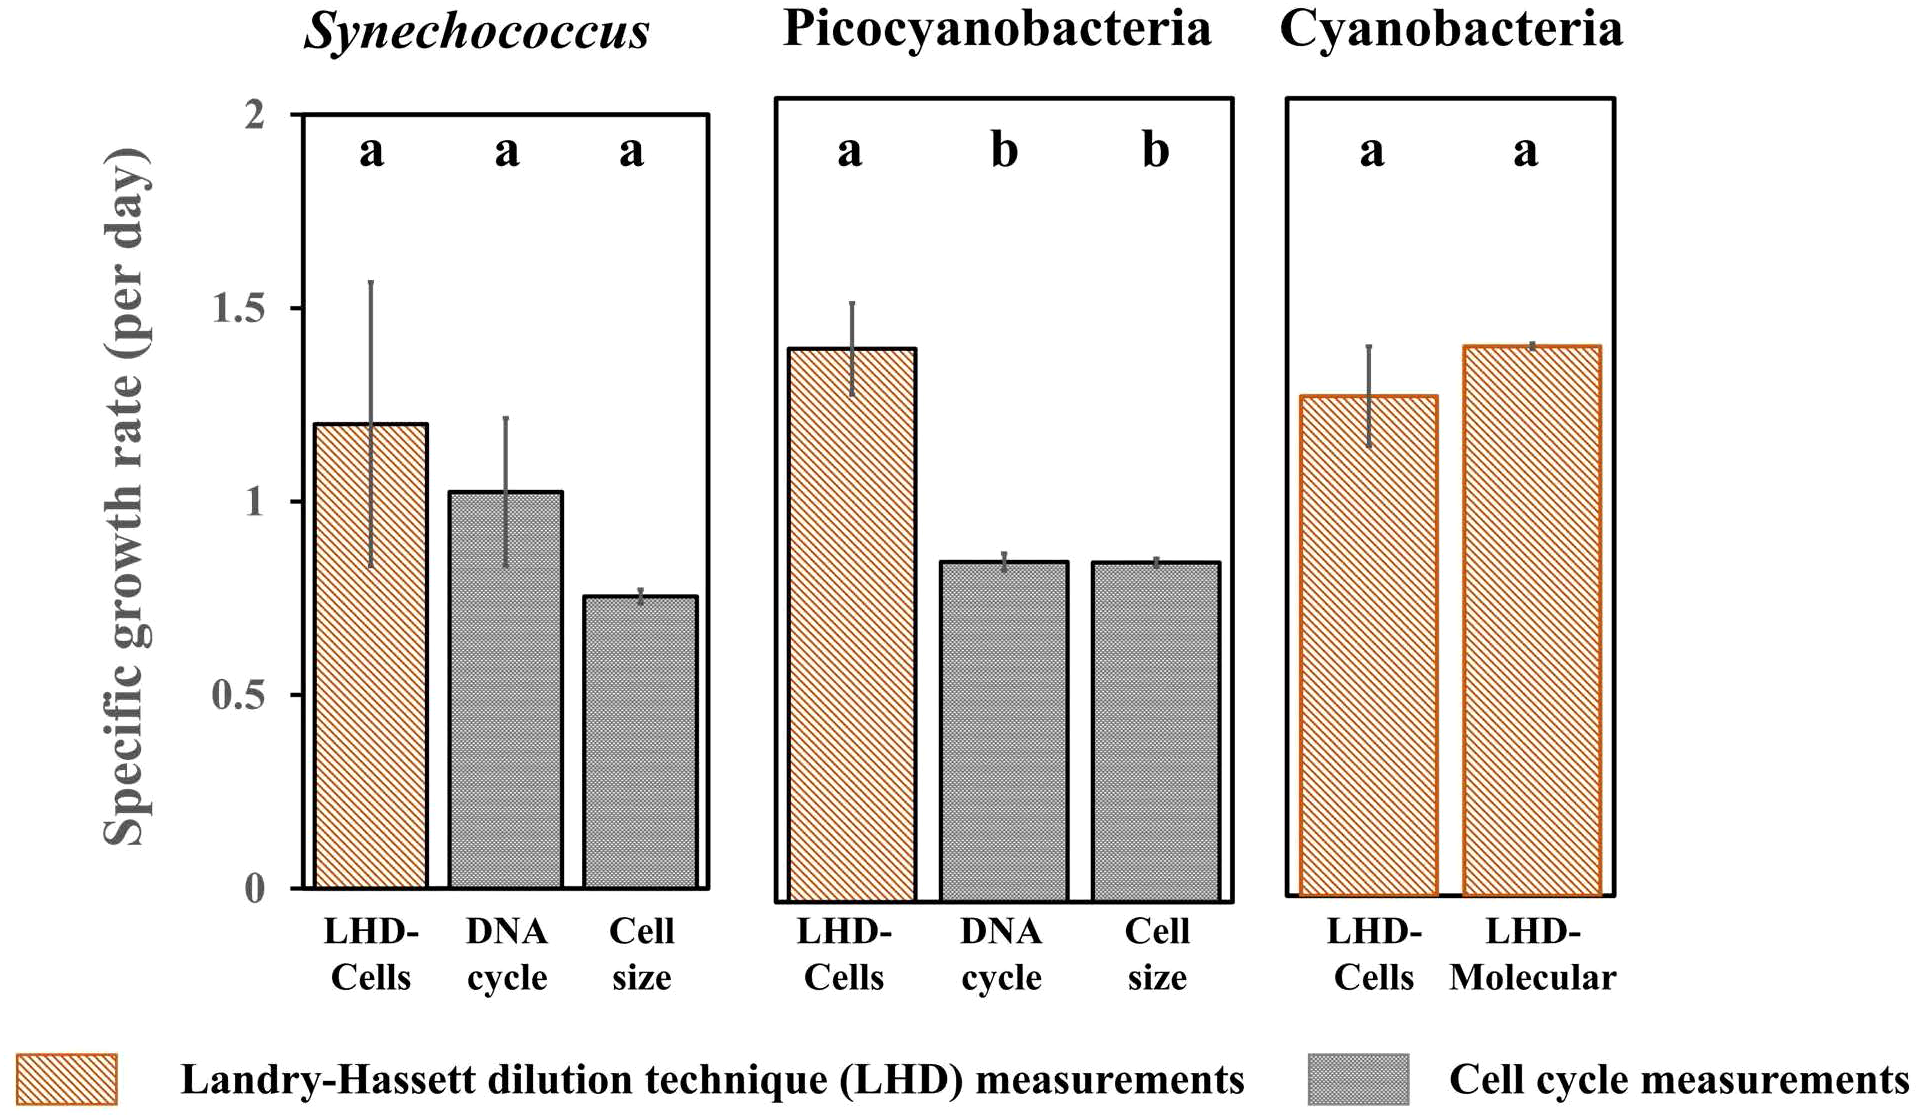
Gross growth rates of natural cyanobacteria collected from coastal seawater at the Piver’s Island Coastal Observatory (PICO) calculated using different approaches. Error bars represent one standard deviation for biological duplicates. Letters indicate homogeneous groups according to Fisher’s LSD test (p < 0.05) following ANOVA. Cells: Flow cytometry analysis; DNA cycle: Fraction of cells in mitosis; Cell size: Diel changes in cell size; Molecular: Cell concentrations calculated using 16S rRNA gene sequencing analysis coupled with flow cytometric cell abundances. See main text for description of Synechococcus, Picocyanobacteria and Cyanobacteria groupings.
Figure 3
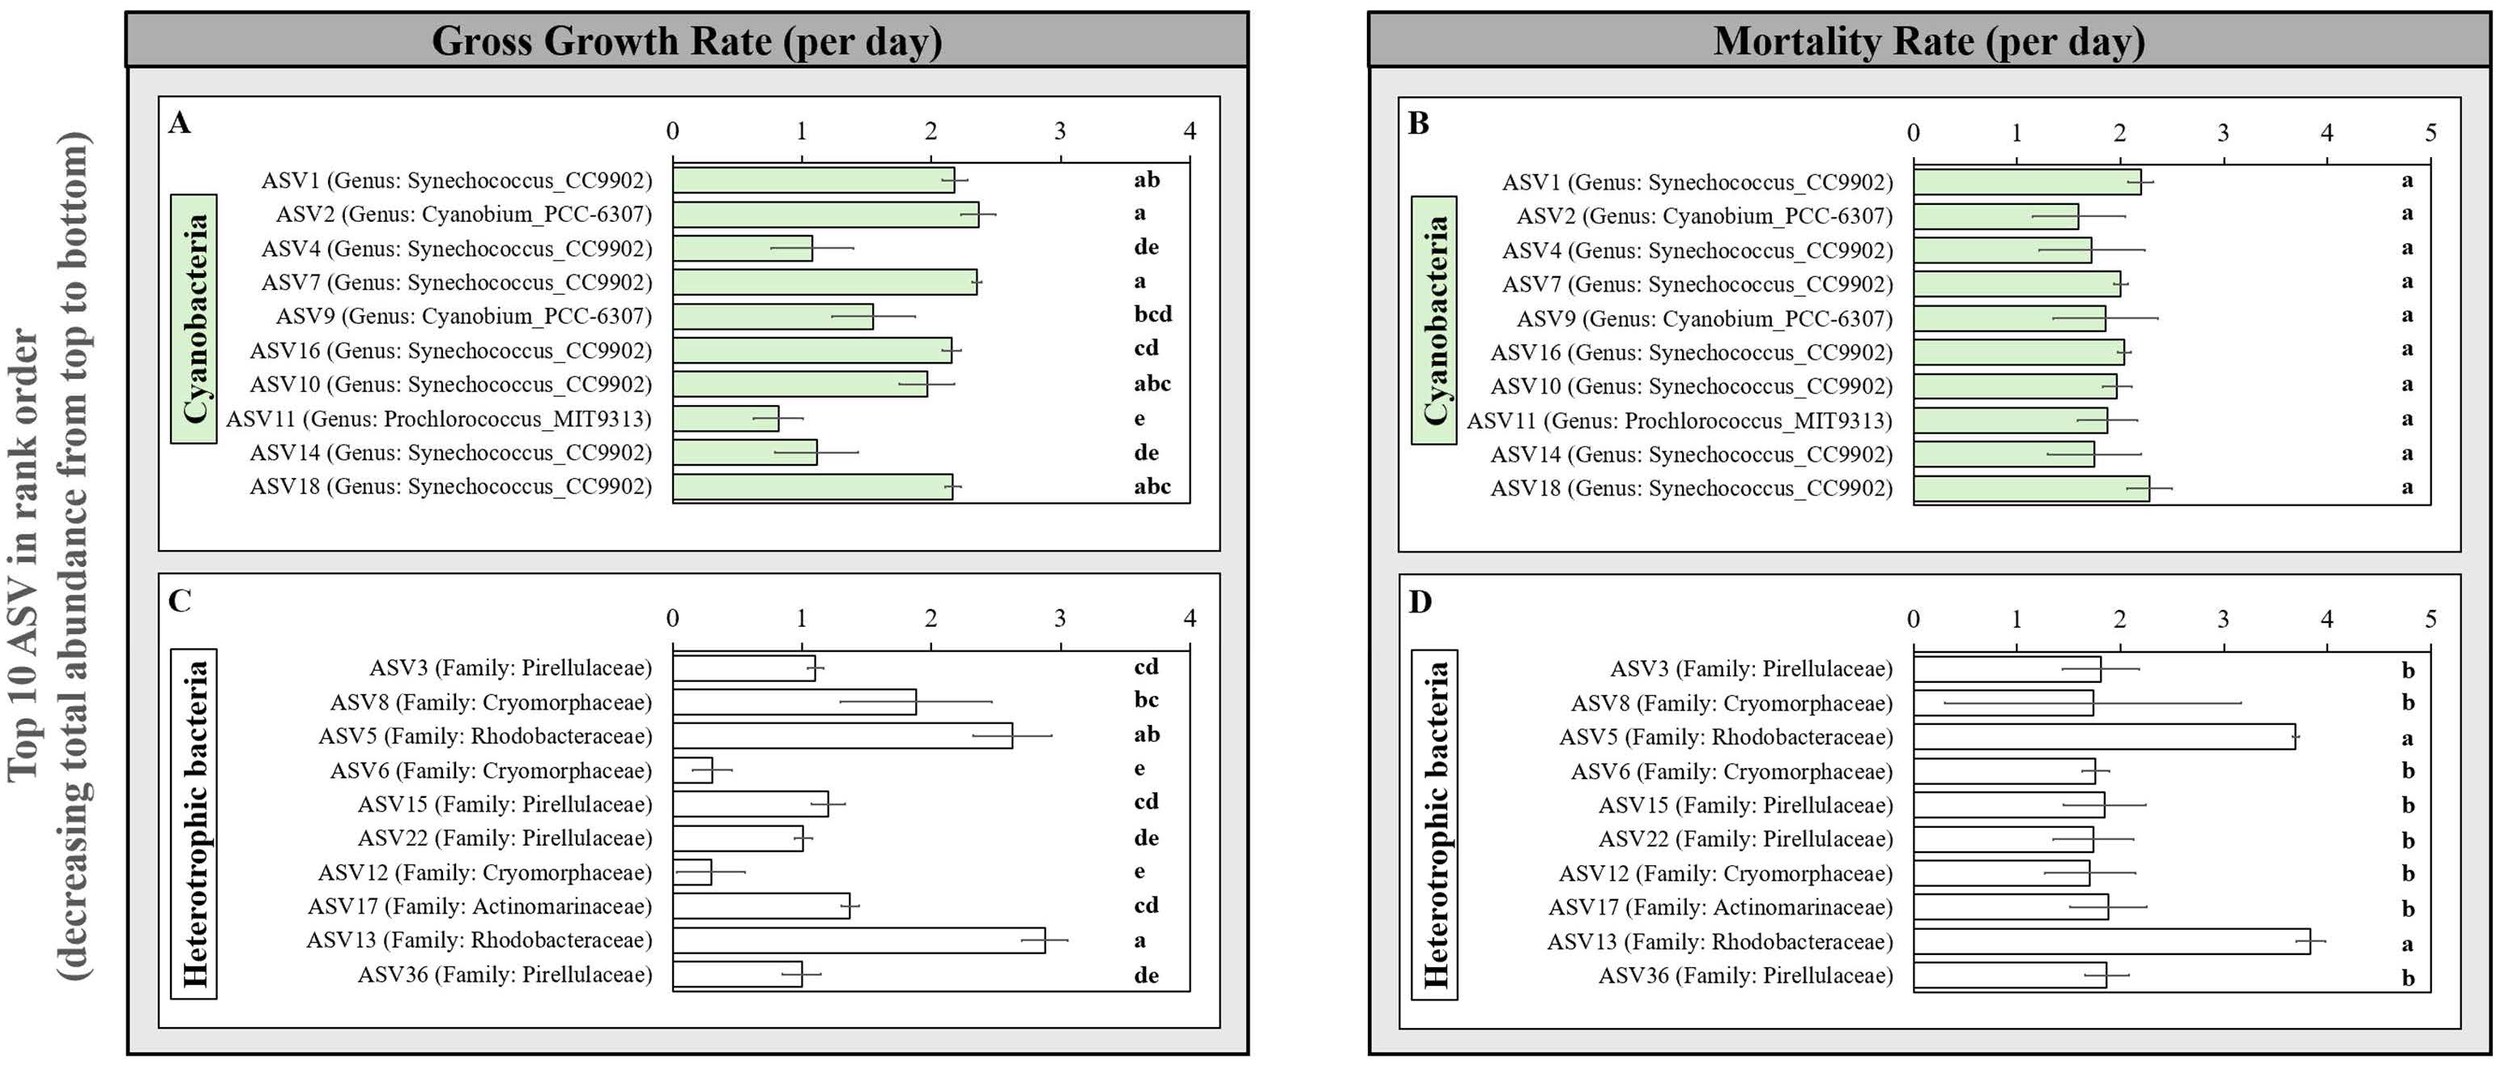
Gross growth (left) and mortality rates (right) of the 10 most abundant cyanobacteria (A, B) and heterotrophic bacteria (C, D). ASVs based on the modified Landry-Hassett Dilution technique in a single seawater sample from PICO. Taxonomy information (Genus/Family level) of each ASV was identified via the Ribosomal Database Project (RDP) Classifier using the reference database silva v.132 in DADA2 vl.16.0. Error bars represent one standard deviation for biological duplicates. Within each panel, letters show homogeneous groups for the 10 most abundant ASVs, as determined by Fisher’s LSD test (p < 0.05) following ANOVA.
As the LHD-molecular approach has good agreement with other growth rate measurements for field cyanobacterial populations (Figure 2) and provides provocative insight into the dynamics of field cyanobacterial subpopulations (Figure 3A), we next expanded this study to total bacterioplankton to explore how growth and mortality rates differ in this phylogenetically (and physiologically) diverse group. As hypothesized, we observe a broader range of predicted growth (0.295 ± 0.266 to 2.752 ± 0.100 d -1) and mortality (1.705 ± 0.436 – 3.837 ± 0.142 d-1) rates across the 10 most abundant heterotrophic bacterioplankton phylotypes (Figures 3C, D). Within the most abundant clades, which should be most reliable in inferring growth rates, we observe the highest growth and mortality rates for ASV5 and ASV13, two members of the Rhodobactereaceae (HIMB11) that are prevalent and active members of coastal communities (Ahmed and Campbell, 2025; Durham et al., 2014; Zhang et al., 2022). Further, we identify a wide range of growth rates within the family Cryomorphaceae [Flavobacteria; ASVs 6, 8, 12 (0.295 ± 0.266 to 1.882 ± 0.583 day-1); Figure 3C], highlighting that distinct bottom-up controls are observed within heterotrophic bacteria. Despite six-fold differences in growth rates, the mortality rates for all 3 Cryomorphaceae ASVs fall within the same statistical grouping (Figure 3D); if these differential growth rates persist, common mortality rates could alter the relative abundance of these phylotypes. Prior studies, including those using the LHD-Molecular technique, have grouped taxa at broader phylogenetic scales to increase the resolution of the “population” (Landry et al., 2024) or because the probes/primers were designed to target coarser groups (Sato et al., 2025; Staniewski and Short, 2018). However, this limited phylogenetic resolution likely obscures true differences in the rates among closely-related taxa as well as identification of the factors shaping their environmental distributions (Yung et al., 2015). The LHD-Molecular approach to quantifying field growth and mortality rates of microbiomes in fluctuating natural environments avoids these potential challenges with low water requirements that are compatible with field sampling and the ability to resolve differences between closely-related taxa using DNA sequencing and analysis.
As an additional step towards validating the LHD-Molecular approach, we measured the growth and mortality rates of three of the ten most abundant cyanobacteria ASVs (Figure 3) over the course of 6 days in 2018 (Figure 4) in the same season as the core validation work (July 20, 2022). All three ASVs have identical growth and mortality rates, within their phylotype, across the 6-day period suggesting that the technique is reproducible when environmental conditions are similar. However, there are differences between sampling campaigns (years). For example, both growth and mortality rates for ASV1 are different between 2018 and 2022, whereas only the growth rate is lower for ASV2 in 2018. For ASV9, there is a more complicated pattern. Together, these results demonstrate the potential utility of the LHD-Molecular approach in teasing apart the growth and mortality of closely related marine microbial subpopulations in changing marine environments.
Figure 4
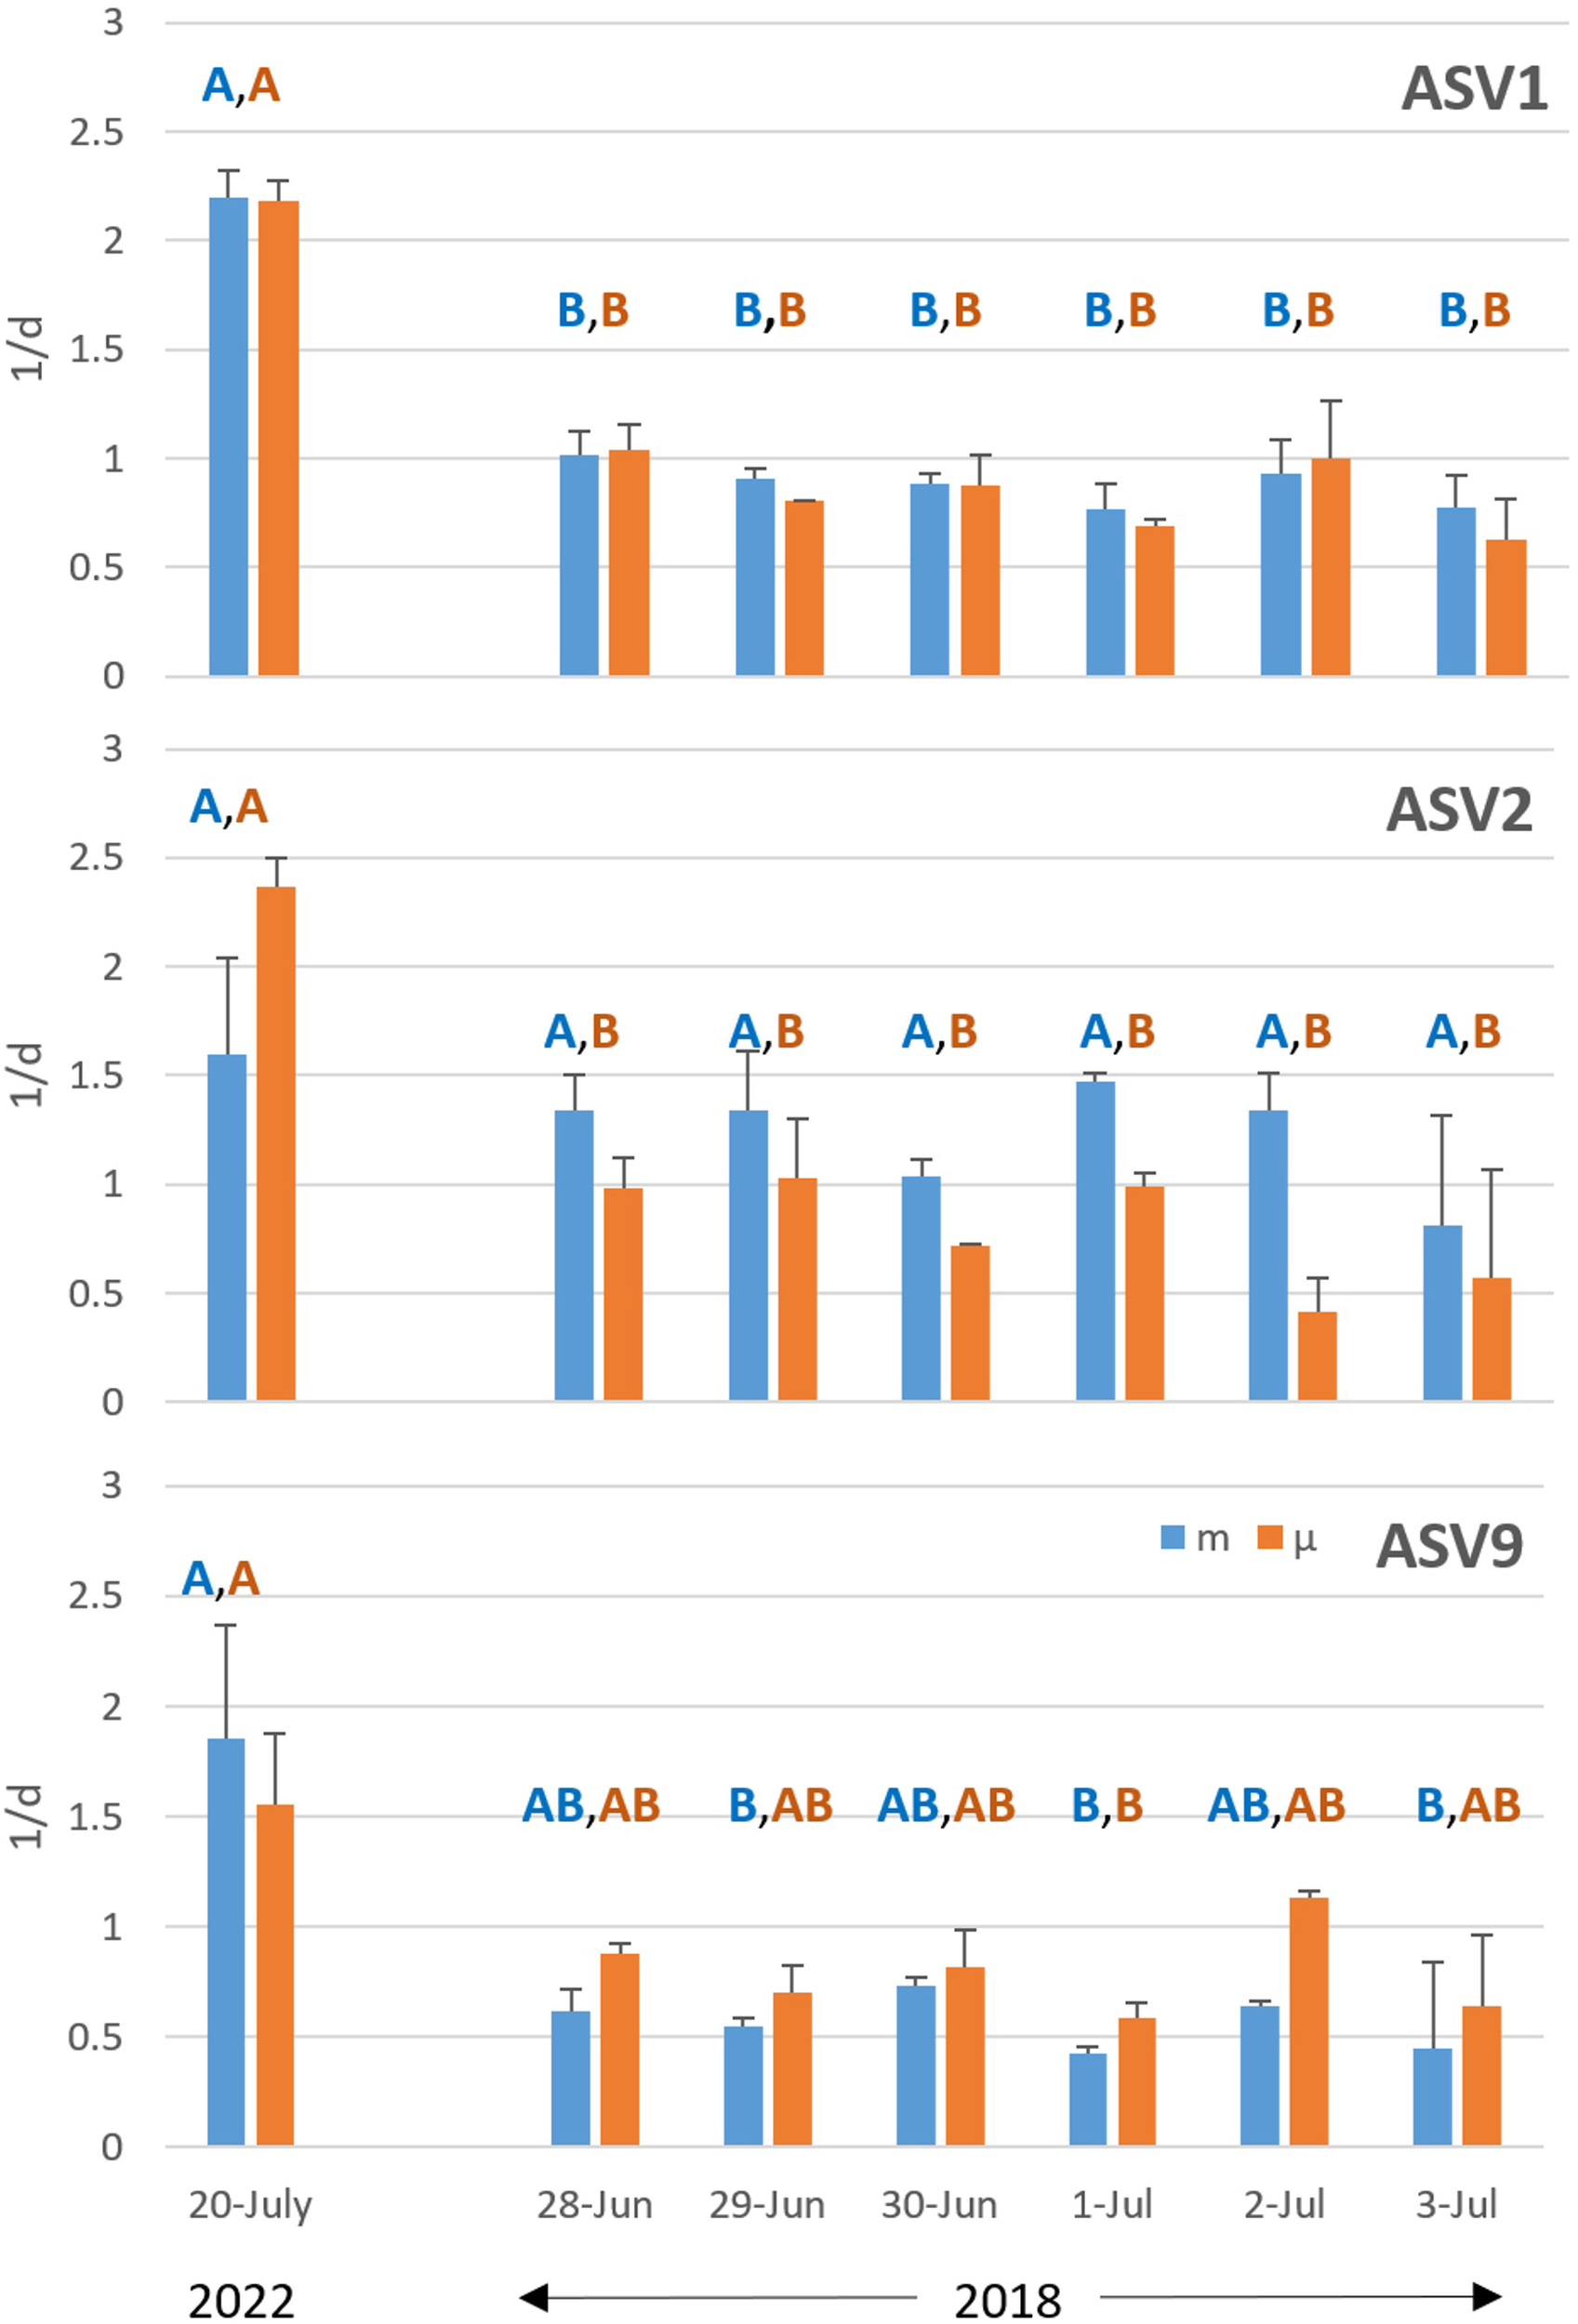
Growth (orange) and mortality (blue) rates of 3 cyanobacterial ASVs measured across 6 consecutive days in 2018. Validation data from 2022 from Figure 3 presented for comparison. Letters within each panel show homogeneous groups, within measurement type, as determined by Fisher’s LSD test (p < 0.05) following ANOVA.
Conclusions
Here, we use cultured model systems to validate the modified LHD technique against classical and flow-cytometry-based predictions of growth rates. Using cultured cyanobacteria, we found that, similar to past studies, each of the techniques is generally inter-comparable (Staniewski and Short, 2018), but that oxygen production predicts higher growth rates and the cell size-based approach lower estimates, raising some concerns with how these techniques and associated assumptions are applied to more complex environmental samples (Figure 1). While there are known challenges in its implementation (Worden and Binder, 2003), the LHD technique when combined with molecular (sequencing) and total cell abundances can resolve closely-related taxa and measure growth (and mortality) rates without the need for conversion factors or other cell parameters, etc., or uptake of specific substrates. However, this technique has its own caveats: in addition to the previously-described assumptions of the LHD technique and biases in DNA extraction and library sequencing, we note that it requires (short) incubations, adequate sequencing depth to resolve the taxa of interest (and thus we have the greatest confidence in the most abundant taxa), and conversion of relative library abundance to an “absolute abundance” in units of cells mL-1. To develop an “absolute abundance” metric from 16S rRNA gene library data requires both rRNA copy number correction and quantification of the cellular abundance of total prokaryotes (Ward et al., 2017); however, this approach has limitations due to incomplete data on rRNA operons per cell for some lineages as well as generally poor quantification of particle-associated cells, which can be a significant fraction of cell counts in the coastal ocean. Alternately, cellular abundance can be calculated by spiking in standards (Zemb et al., 2020), which themselves are subject to amplification biases. Although we acknowledge the limitations of the LHD-Molecular approach, it has the potential to offer unique insights into the dynamics of marine microbial communities.
While this study was intended as a validation and proof-of-concept experiment, we identify differential growth rates among closely related plankton subpopulations (Figure 3). Further, we gained unexpected insights into coastal microbiomes through higher-than expected growth rates (Rhodobacteraceae HIMB11), and large differences in growth rates among closely-related taxa (Cryomorphaceae; Flavobacteria), as well as uncoupling of growth and mortality rates (Figure 3). Future work can expand this research through quantification of viral predation using dilution in virus-free water, in addition to or in lieu of grazer-free water to differentiate the impacts of viral and grazer predators on marine food webs. While simpler tools are sufficient (and preferred) for rate determination in laboratory cultures, the LHD molecular technique may be best applied to field growth rate measurements where complex communities switch among closely-related phylotypes (Hunter-Cevera et al., 2020; Ward et al., 2017). The LHD Molecular approach is uniquely suited to address coupling between growth rates and standing stocks (Landry et al., 2024), potentially high coupling of growth and mortality during stable periods; as well as potential uncoupling during disturbance including upwelling or storms. Environmental disturbances including tropical cyclones and heat/cold waves can persist for days-weeks (Johnson et al., 2025) and we predict that these disturbances will result in at least short-term uncoupling of growth and predation rates, e.g., blooms in rare taxa (Gronniger et al., 2022), when taxa-specific predators (i.e., viruses) likely experience a lag in catching up to their prey. Overall, coupling the modified LHD technique with sequencing offers unprecedented insights into phylotype-resolved growth and removal rates, which can be used to address fundamental ecological and biogeochemical questions about the factors driving the diversity and distributions of bacterioplankton in fluctuating aquatic environments.
Statements
Data availability statement
The original contributions presented in the study are included in the article/Supplementary Material, further inquiries can be directed to the corresponding author/s.
Author contributions
JG: Writing – review & editing, Writing – original draft. KF: Writing – review & editing, Writing – original draft. LH: Data curation, Formal analysis, Writing – review & editing. DH: Writing – review & editing, Writing – original draft. ZJ: Writing – original draft, Writing – review & editing.
Funding
The author(s) declare that financial support was received for the research and/or publication of this article. We acknowledge funding from the Duke Bass Connections program, US Department of Energy EE0008518 and EE0009278 to ZJ; US NSF ICER: 2033934 and DEB: 2224819 to DH and the US NSF REU program.
Acknowledgments
We acknowledge the contribution of the entire PICO sampling team to field work and sample processing and the Bass Connection “Oceans of Microbiomes” team for initial analyses. We thank James Benavides for help with collecting samples during the diel experiments.
Conflict of interest
The authors declared that this work was conducted in the absence of any commercial or financial relationships that could be construed as a potential conflict of interest.
Generative AI statement
The author(s) declared that generative AI was not used in the creation of this manuscript.
Any alternative text (alt text) provided alongside figures in this article has been generated by Frontiers with the support of artificial intelligence and reasonable efforts have been made to ensure accuracy, including review by the authors wherever possible. If you identify any issues, please contact us.
Publisher’s note
All claims expressed in this article are solely those of the authors and do not necessarily represent those of their affiliated organizations, or those of the publisher, the editors and the reviewers. Any product that may be evaluated in this article, or claim that may be made by its manufacturer, is not guaranteed or endorsed by the publisher.
Supplementary material
The Supplementary Material for this article can be found online at: https://www.frontiersin.org/articles/10.3389/fmars.2025.1687609/full#supplementary-material
References
1
Acinas S. G. Klepac-Ceraj V. Hunt D. E. Pharino C. Ceraj I. Distel D. L. et al . (2004). Fine-scale phylogenetic architecture of a complex bacterial community. Nature430, 551–554. doi: 10.1038/nature02649
2
Ahmed M. A. Campbell B. J. (2025). Genome-resolved adaptation strategies of Rhodobacterales to changing conditions in the Chesapeake and Delaware Bays. Appl. Environ. Microbiol.91, e02357–e02324. doi: 10.1128/aem.02357-24
3
Angly F. E. Dennis P. G. Skarshewski A. Vanwonterghem I. Hugenholtz P. Tyson G. W. (2014). CopyRighter: a rapid tool for improving the accuracy of microbial community profiles through lineage-specific gene copy number correction. Microbiome2, 1–13. doi: 10.1186/2049-2618-2-11
4
Armbrust E. V. Bowen J. D. Olson R. J. Chisholm S. W. (1989). Effect of light on the cell cycle of a marine synechococcus strain. Appl. Environ. Microbiol.55, 425–432. doi: 10.1128/aem.55.2.425-432.1989
5
Aronesty E. (2013). Comparison of sequencing utility programs. Open Bioinf. J.7, 1–8. doi: 10.2174/1875036201307010001
6
Binder B. J. Chisholm S. W. (1995). Cell cycle regulation in marine synechococcus sp. Strains. Appl. Environ. Microbiol.61, 708–717. doi: 10.1128/aem.61.2.708-717.1995
7
Bittar T. B. Sassano L. R. Wheeler B. J. Brown S. L. Cochlan W. P. Johnson Z. I. (2013). Carbon allocation under light and nitrogen resource gradients in two model marine phytoplankton. J. Phycol.49, 523–535. doi: 10.1111/jpy.12060
8
Blazewicz S. J. Barnard R. L. Daly R. A. Firestone M. K. (2013). Evaluating rRNA as an indicator of microbial activity in environmental communities: limitations and uses. ISME J.7, 2061–2068. doi: 10.1038/ismej.2013.102
9
Brown C. T. Olm M. R. Thomas B. C. Banfield J. F. (2016). Measurement of bacterial replication rates in microbial communities. Nat. Biotechnol.34, 1256–1263. doi: 10.1038/nbt.3704
10
Burbage C. D. Binder B. J. (2007). Relationship between cell cycle and light-limited growth rate in oceanic prochlorococcus (mit9312) and synechococcus (wh8103) (cyanobacteria). J. Phycol.43, 266–274. doi: 10.1111/j.1529-8817.2007.00315.x
11
Callahan B. J. McMurdie P. J. Rosen M. J. Han A. W. Johnson A. J. A. Holmes S. P. (2016). DADA2: High-resolution sample inference from Illumina amplicon data. Nat. Methods13, 581–583. doi: 10.1038/nmeth.3869
12
Campbell L. Carpenter E. J. (1986). Diel patterns of cell division in marine Synechococcus spp. (Cyanobacteria): use of the frequency of dividing cells technique to measure grow th rate. Mar. Ecol. Prog. Ser., 32, 139–148. doi: 10.3354/meps032139
13
Carpenter E. J. Chang J. (1988). Species-specific phytoplankton growth rates via diel DNA synthesis cycles. I. Concept of the method. Mar. Ecol. Prog. Ser.43, 105–111. doi: 10.3354/meps043105
14
Carpenter E. J. Lin S. Chang J. (1998). “ Phytoplankton growth studies by cell cycle analysis,” in Molecular approaches to the study of the ocean, 1st edn. Ed. CookseyK. E. ( Springer Netherlands, Dordrecht), 227–245. doi: 10.1007/978-94-011-4928-0_10
15
Coleman M. L. Chisholm S. W. (2007). Code and context: Prochlorococcus as a model for cross-scale biology. Trends Microbiol.15, 398–407. doi: 10.1016/j.tim.2007.07.001
16
Demir E. Coyne K. J. Doblin M. A. Handy S. M. Hutchins D. A. (2008). Assessment of microzooplankton grazing on Heterosigma akashiwo using a species-specific approach combining quantitative real-time PCR (QPCR) and dilution methods. Microb. Ecol.55, 583–594. doi: 10.1007/s00248-007-9263-9
17
Durham B. P. Grote J. Whittaker K. A. Bender S. J. Luo H. Grim S. L. et al . (2014). Draft genome sequence of marine alphaproteobacterial strain HIMB11, the first cultivated representative of a unique lineage within the Roseo bacter clade possessing an unusually small genome. Stand. Genomic Sci.9, 632–645. doi: 10.4056/sigs.4998989
18
Eren A. M. Maignien L. Sul W. J. Murphy L. G. Grim S. L. Morrison H. G. et al . (2013). Oligotyping: differentiating between closely related microbial taxa using 16S rRNA gene data. Methods Ecol. Evol.4, 1111–1119. doi: 10.1111/2041-210x.12114
19
Eren A. M. Morrison H. G. Lescault P. J. Reveillaud J. Vineis J. H. Sogin M. L. (2015). Minimum entropy decomposition: Unsupervised oligotyping for sensitive partitioning of high-throughput marker gene sequences. ISME J.9, 968–979. doi: 10.1038/ismej.2014.195
20
Flynn K. J. Raven J. A. (2017). What is the limit for photoautotrophic plankton growth rates? J. Plankton Res.39, 13–22. doi: 10.1093/plankt/fbw067
21
Fowler B. L. Neubert M. G. Hunter-Cevera K. R. Olson R. J. Shalapyonok A. Solow A. R. et al . (2020). Dynamics and functional diversity of the smallest phytoplankton on the Northeast US Shelf. Proc. Natl. Acad. Sci. U. S. A.117, 12215–12221. doi: 10.1073/pnas.1918439117
22
Gao Y. Li H. (2018). Quantifying and comparing bacterial growth dynamics in multiple metagenomic samples. Nat. Methods15, 1041–1044. doi: 10.1038/s41592-018-0182-0
23
Givati S. Yang X. Sher D. Rahav E. (2023). Testing the growth rate and translation compensation hypotheses in marine bacterioplankton. Environ. Microbiol.25, 1186–1199. doi: 10.1111/1462-2920.16346
24
Grande K. D. Williams P. J. L. Marra J. Purdie D. A. Heinemann K. Eppley R. W. et al . (1989). Primary production in the North Pacific gyre: a comparison of rates de termined by the 14C, O2 concentration and 18O methods. Deep Sea Res. Part A Oceanogr. Res. Papers36, 1621–1634. doi: 10.1016/0198-0149(89)90063-0
25
Grébert T. Garczarek L. Daubin V. Humily F. Marie D. Ratin M. et al . (2022). Diversity and evolution of pigment types in marine synechococcus cyanobacteria. Genome Biol. Evol.14, 1–19. doi: 10.1093/gbe/evac035
26
Gronniger J. L. Wang Z. Brandt G. R. Ward C. S. Tsementzi D. Mu H. et al . (2022). Rapid changes in coastal ocean microbiomes uncoupled with shifts in environmental variables. Environ. Microbiol.24, 4167–4177. doi: 10.1111/1462-2920.16086
27
Hagström A. Larsson U. Hörstedt P. Normark S. (1979). Frequency of dividing cells, a new approach to the determination of ba cterial growth rates in aquatic environments. Appl. Environ. Microbiol.37, 805–812. doi: 10.1128/aem.37.5.805-812.1979
28
Hunt D. E. Lin Y. Church M. J. Karl D. M. Izzo L. K. Tringe S. G. et al . (2013). The relationship between abundance and specific activity of bacterioplankton in open ocean surface waters. Appl. Environ. Microbiol.79, 177–184. doi: 10.1128/AEM.02155-12
29
Hunter-Cevera K. R. Neubert M. G. Olson R. J. Shalapyonok A. Solow A. R. Sosik H. M. (2020). Seasons of syn. Limnol. Oceanogr.65, 1085–1102. doi: 10.1002/lno.11374
30
Hunter-Cevera K. R. Neubert M. G. Solow A. R. Olson R. J. Shalapyonok A. Sosik H. M. (2014). Diel size distributions reveal seasonal growth dynamics of a coastal phytoplankter. Proc. Natl. Acad. Sci. U. S. A.111, 9852–9857. doi: 10.1073/pnas.1321421111
31
Ibarbalz F. M. Henry N. Brandão M. C. Martini S. Busseni G. Byrne H. et al . (2019). Global trends in marine plankton diversity across kingdoms of life. Cell179, 1084–1097.e1021. doi: 10.1016/j.cell.2019.10.008
32
Jacquet S. Partensky F. Marie D. Casotti R. Vaulot D. (2001). Cell cycle regulation by light in Prochlorococcus strains. Appl. Environ. Microbiol.67, 782–790. doi: 10.1128/AEM.67.2.782-790.2001
33
Jiang S. Hashihama F. Saito H. (2021). Phytoplankton growth and grazing mortality through the oligotrophic su btropical North Pacific. J. Oceanogr.77, 505–521. doi: 10.1007/s10872-020-00580-4
34
Johnson Z. I. (2004). Development and application of the background irradiance gradient - single turnover fluorometer (BIG-STf). Mar. Ecol. Prog. Ser.283, 73–80. doi: 10.3354/meps283073
35
Johnson Z. I. Hunt D. E. Consortium T. P. Wang G. Blinebry S. Xie N. et al . (2025). The Piver’s Island Coastal Observatory – a decade of weekly+ observations reveal the press and pulse of a changing temperate coastal marine system. Front. Mar. Sci.12. doi: 10.3389/fmars.2025.1505754
36
Johnson Z. Landry M. L. Bidigare R. R. Brown S. L. Campbell L. Gunderson J. et al . (1999). Energetics and growth kinetics of a deep Prochlorococcus spp. population in the Arabian Sea. Deep-Sea Res. II46, 1719–1743. doi: 10.1016/S0967-0645(99)00041-7
37
Johnson Z. I. Shyam R. Ritchie A. E. Lin Y. Mioni C. Lance V. P. et al . (2010). The effects of iron- and light-limitation on phytoplankton communities of deep chlorophyll maxima of the Western Pacific Ocean. J. Mar. Res.68, 1–26. doi: 10.1357/002224010793721433
38
Johnson Z. I. Wheeler B. J. Blinebry S. K. Carlson C. M. Ward C. S. Hunt D. E. (2013). Dramatic variability of the carbonate system at a temperate coastal ocean site (Beaufort, North Carolina, USA) is regulated by physical and biogeochemical processes on multiple timescales. PLoS One8, e85117. doi: 10.1371/journal.pone.0085117
39
Kondo T. Mori T. Lebedeva N. V. Aoki S. Ishiura M. Golden S. S. (1997). Circadian rhythms in rapidly dividing cyanobacteria. Science275, 224–227. doi: 10.1126/science.275.5297.224
40
Labasque T. Chaumery C. Aminot A. Kergoat G. (2004). Spectrophotometric Winkler determination of dissolved oxygen: re-examination of critical factors and reliability. Mar. Chem.88, 53–60. doi: 10.1016/j.marchem.2004.03.004
41
Landry M. R. Brown S. L. Neveux J. Dupouy C. Blanchot J. Christensen S. et al . (2003). Phytoplankton growth and microzooplankton grazing in high-nutrient, low-chlorophyll waters of the equatorial Pacific: Community and taxon-sp ecific rate assessments from pigment and flow cytometric analyses. J. Geophys. Res.: Oceans108, 2000JC000744. doi: 10.1029/2000JC000744
42
Landry M. R. Freibott A. L. Rabines A. Allen A. E. (2024). Determining growth rates of heterotrophic bacteria from 16S rRNA gene sequence-based analyses of dilution experiments. Aquat. Microb. Ecol.90, 23–39. doi: 10.3354/ame02006
43
Landry M. R. Hassett R. P. (1982). Estimating the grazing impact of marine micro-zooplankton. Mar. Biol.67, 283–288. doi: 10.1007/BF00397668
44
Landry M. R. Kirshtein J. Constantinou J. (1995). A refined dilution technique for measuring the community grazing impact of microzooplankton, with experimental tests in the central equatorial Pacific. Mar. Ecol. Prog. Ser.120, 53–63. doi: 10.3354/meps120053
45
Landry M. R. Selph K. E. Taylor A. G. Décima M. Balch W. M. Bidigare R. R. (2011). Phytoplankton growth, grazing and production balances in the HNLC equatorial Pacific. Deep-Sea Res. II58, 524–535. doi: 10.1016/j.dsr2.2010.08.011
46
Langmead B. Salzberg S. L. (2012). Fast gapped-read alignment with Bowtie 2. Nat. Methods9, 357–359. doi: 10.1038/nmeth.1923
47
Larkin A. A. Blinebry S. K. Howes C. Lin Y. Loftus S. E. Schmaus C. A. et al . (2016). Niche partitioning and biogeography of high light adapted Prochlorococcus across taxonomic ranks in the North Pacific. ISME J.10, 1555–1567. doi: 10.1038/ismej.2015.244
48
Larkin A. A. Hagstrom G. I. Brock M. L. Garcia N. S. Martiny A. C. (2022). Basin-scale biogeography of Prochlorococcus and SAR11 ecotype replication. ISME J.17, 185–194. doi: 10.1038/s41396-022-01332-6
49
Lin Y. Gazsi K. Lance V. P. Larkin A. Chandler J. Zinser E. R. et al . (2013). In situ activity of a dominant Prochlorococcus ecotype (eHL-II) from rRNA content and cell size. Environ. Microbiol.15, 2736–2747. doi: 10.1111/1462-2920.12135
50
Liu H. B. Bidigare R. R. Laws E. Landry M. R. Campbell L. (1999). Cell cycle and physiological characteristics of Synechococcus (WH7803) in chemostat culture. Mar. Ecol. Prog. Ser.189, 17–25. doi: 10.3354/meps189017
51
Liu H. B. Nolla H. A. Campbell L. (1997). Prochlorococcus growth rate and contribution to primary production in the equatorial and subtropical North Pacific Ocean. Aquat. Microb. Ecol.12, 39–47. doi: 10.3354/ame012039
52
Long A. M. Hou S. Ignacio-Espinoza J. C. Fuhrman J. A. (2020). Benchmarking microbial growth rate predictions from metagenomes. ISME J.15, 183–195. doi: 10.1038/s41396-020-00773-1
53
Martin M. (2011). Cutadapt removes adapter sequences from high-throughput sequencing reads. EMBnetjournal17, 10–12. doi: 10.14806/ej.17.1.200
54
Menden-Deuer S. Lessard E. J. (2000). Carbon to volume relationships for dinoflagellates, diatoms, and other protist plankton. Limnology & Oceanography45, 569–579. doi: 10.4319/lo.2000.45.3.0569
55
Moisan T. A. Blattner K. L. Makinen C. P. (2010). Influences of temperature and nutrients on Synechococcus abundance and biomass in the southern Mid-Atlantic Bight. Cont. Shelf Res.30, 1275–1282. doi: 10.1016/j.csr.2010.04.005
56
Moore T. C. (1974). “ Kinetics of photosynthetic carbon dioxide assimilation and oxygen evolution in a green alga,” in Research experiences in plant physiology ( Springer Berlin Heidelberg, Berlin, Heidelberg), 87–97. doi: 10.1007/978-3-642-96168-7_7
57
Moore L. R. Chisholm S. W. (1999). Photophysiology of the marine cyanobacterium Prochlorococcus: Ecotypic differences among cultured isolates. Limnol. Oceanogr.44, 628–638. doi: 10.4319/lo.1999.44.3.0628
58
Needham D. M. Fichot E. B. Wang E. Berdjeb L. Cram J. A. Fichot C. G. et al . (2018). Dynamics and interactions of highly resolved marine plankton via automated high-frequency sampling. ISME J.12, 2417–2432. doi: 10.1038/s41396-018-0169-y
59
Parada A. E. Needham D. M. Fuhrman J. A. (2016). Every base matters: assessing small subunit rRNA primers for marine microbiomes with mock communities, time series and global field samples. Environ. Microbiol.18, 1403–1414. doi: 10.1111/1462-2920.13023
60
Partensky F. Hess W. R. Vaulot D. (1999). Prochlorococcus, a marine photosynthetic prokaryote of global significance. Microbiol. Mol. Biol. Rev.63, 106–127. doi: 10.1128/MMBR.63.1.106-127.1999
61
Ribalet F. Swalwell J. Clayton S. Jiménez V. Sudek S. Lin Y. et al . (2015). Light-driven synchrony of Prochlorococcus growth and mortality in the subtropical Pacific gyre. Proc. Natl. Acad. Sci. U.S.A.112, 8008–8012. doi: 10.1073/pnas.1424279112
62
Rognes T. Flouri T. Nichols B. Quince C. Mahé F. (2016). VSEARCH: a versatile open source tool for metagenomics. PeerJ4, e2584. doi: 10.7717/peerj.2584
63
Roth-Rosenberg D. Aharonovich D. Omta A. W. Follows M. J. Sher D. (2021). Dynamic macromolecular composition and high exudation rates in Prochlorococcus. Limnol. Oceanogr.66, 1759–1773. doi: 10.1002/lno.11720
64
Sato T. Yamaguchi T. Hidaka K. Sogawa S. Setou T. Kodama T. et al . (2025). Grazing mortality as a controlling factor in the uncultured non-cyanobacterial diazotroph (Gamma A) around the Kuroshio region. Biogeosciences22, 625–639. doi: 10.5194/bg-22-625-2025
65
Schmieder R. Edwards R. (2011). Quality control and preprocessing of metagenomic datasets. Bioinformatics27, 863–864. doi: 10.1093/bioinformatics/btr026
66
Selph K. E. (2021). Enumeration of marine microbial organisms by flow cytometry using near-UV excitation of Hoechst 34580-stained DNA. Limnol. Oceanogr. Methods19, 692–701. doi: 10.1002/lom3.10454
67
Sosik H. M. Olson R. J. Neubert M. G. Shalapyonok A. Solow A. R. (2003). Growth rates of coastal phytoplankton from time-series measurements with a submersible flow cytometer. Limnol. Oceanogr.48, 1756–1765. doi: 10.4319/lo.2003.48.5.1756
68
Staniewski M. A. Short S. M. (2018). Methodological review and meta-analysis of dilution assays for estimates of virus- and grazer-mediated phytoplankton mortality. Limnol. Oceanogr. Methods16, 649–668. doi: 10.1002/lom3.10273
69
Staniewski M. A. Short C. M. Short S. M. (2012). Contrasting community versus population-based estimates of grazing and virus-induced mortality of phytoplankton. Microb. Ecol.64, 25–38. doi: 10.1007/s00248-012-0019-9
70
Stevens B. L. F. Peacock E. E. Crockford E. T. Shalapyonok A. Neubert M. G. Sosik H. M. (2024). Distinct responses to warming within picoplankton communities across an environmental gradient. Global Change Biol.30, e17316. doi: 10.1111/gcb.17316
71
Toepel J. Wilhelm C. Meister A. Becker A. Martinez-Ballesta M. dC. (2004). Cytometry of Freshwater Phytoplankton. Methods in Cell BiologyAcademic Press: Amsterdam ; Boston. pp. 375–407. doi: 10.1016/s0091-679x(04)75015-3
72
Ward C. S. Yung C.-M. Davis K. M. Blinebry S. K. Williams T. C. Johnson Z. I. et al . (2017). Annual community patterns are driven by seasonal switching between closely-related marine bacteria. ISME J.11, 1412–1422. doi: 10.1038/ismej.2017.4
73
Waterbury J. B. Watson S. W. Valois F. W. Franks D. G. (1986). “ Biological and ecological characterization of the marine unicellular cyanobacterium Synechococcus,” In: PlattT.LiW. K. W. (eds). Photosynthetic picoplankton. Department of Fisheries and Oceans (Canada): Ottawa pp. 71–210.
74
Worden A. Z. Binder B. J. (2003). Application of dilution experiments for measuring growth and mortality rates among Prochlorococcus and Synechococcus populations in oligotrophic environments. Aquat. Microb. Ecol.30, 159–174. doi: 10.3354/ame030159
75
Yung C.-M. Vereen M. K. Herbert A. Davis K. M. Yang J. Kantorowska A. et al . (2015). Thermally adaptive tradeoffs in closely-related marine bacterial strains. Environ. Microbiol.17, 2421–2429. doi: 10.1111/1462-2920.12714
76
Zemb O. Achard C. S. Hamelin J. De Almeida M.-L. Gabinaud B. Cauquil L. et al . (2020). Absolute quantitation of microbes using 16S rRNA gene metabarcoding: A rapid normalization of relative abundances by quantitative PCR target ing a 16S rRNA gene spike-in standard. MicrobiologyOpen9, e977. doi: 10.1002/mbo3.977
77
Zhang S. Liu H. Xia X. (2022). Community Dynamics of Free-Living and Particle-Attached Bacteria over Sequential Blooms of Heterotrophic Dinoflagellate Noctiluca scintillans and Mixotrophic Ciliate Mesodinium rubrum. Appl. Environ. Microbiol.88, 1–17. doi: 10.1128/aem.01323-22
Summary
Keywords
cyanobacteria, growth rates, marine microbes, methods, microbiome, mortality rates
Citation
Gu J, Foley K, Huber L, Hunt DE and Johnson ZI (2026) Validation of a modified Landry-Hassett dilution technique to quantify the growth and mortality rates of subpopulations of planktonic microbes. Front. Mar. Sci. 12:1687609. doi: 10.3389/fmars.2025.1687609
Received
18 August 2025
Revised
02 December 2025
Accepted
09 December 2025
Published
26 January 2026
Volume
12 - 2025
Edited by
Ningdong Xie, University of Florida, United States
Reviewed by
Yun-Chi Lin, National Taiwan Ocean University, Taiwan
Yaodong He, Zhejiang Ocean University, China
Updates
Copyright
© 2026 Gu, Foley, Huber, Hunt and Johnson.
This is an open-access article distributed under the terms of the Creative Commons Attribution License (CC BY). The use, distribution or reproduction in other forums is permitted, provided the original author(s) and the copyright owner(s) are credited and that the original publication in this journal is cited, in accordance with accepted academic practice. No use, distribution or reproduction is permitted which does not comply with these terms.
*Correspondence: Zackary I. Johnson, zackary.johnson@duke.edu
Disclaimer
All claims expressed in this article are solely those of the authors and do not necessarily represent those of their affiliated organizations, or those of the publisher, the editors and the reviewers. Any product that may be evaluated in this article or claim that may be made by its manufacturer is not guaranteed or endorsed by the publisher.