Abstract
Hypoxia poses an increasing threat to coastal ecosystems, particularly in semi-enclosed estuarine systems such as the Upper Gulf of Thailand (UGoT). This study investigates the spatiotemporal dynamics of dissolved oxygen (DO) along the eastern UGoT, with a focus on the Siracha area, by integrating field observations with a coupled three-dimensional hydrodynamic–biochemical model. Temporal and spatial measurements in 2020 revealed pronounced seasonal and vertical variability in DO, with hypoxic events closely associated with strong salinity stratification, elevated river discharge, and phytoplankton decay. The model further identified five progressive stages of hypoxia development in the UGoT: reduced extent (November–May), onset (June), quasi-stable (July–August), expansion (September), and redistribution (October). Unusual DO profiles, characterized by minimum concentrations at mid-depth rather than near the bottom, were also observed. Model simulations indicated that these atypical profiles resulted from the intrusion of cold offshore bottom water into the study area. Nearshore DO dynamics were found to be significantly modulated by offshore circulation, stratification, water quality conditions, and tidal forcing. Scenario simulations further demonstrated that riverine nutrient loading is the primary driver controlling the hypoxia budget, whereas reaeration and tidal mixing also contribute substantially. Overall, the results underscore the critical interplay between physical and biochemical processes in shaping DO dynamics and hypoxia development in the UGoT and its eastern coast. These findings highlight the need for continuous autonomous monitoring and targeted riverine nutrient management to mitigate hypoxia in the eastern UGoT, serving as a representative example of shallow coastal systems near river mouths.
1 Introduction
Hypoxia, typically defined as dissolved oxygen (DO) concentrations below 2 mg L−¹ (Diaz, 2001), is a pervasive problem in aquatic systems and causes severe ecological impacts, including mass fish mortality, habitat degradation, and altered marine community structure (Diaz and Rosenberg, 2008; Vaquer-Sunyer and Duarte, 2008; Dai et al., 2023). Depending on the characteristics of the water body, hypoxia can arise from both physical processes—such as water-column stratification, restricted circulation, freshwater input, wind forcing, and tropical storms—and biochemical processes, including organic matter decomposition and nutrient-driven primary production (Fujiwara and Yamada, 2002; Conley et al., 2011; Alosairi and Alsulaiman, 2019; Hao et al., 2024). Over recent decades, hypoxic zones have expanded worldwide, particularly in semi-enclosed seas and estuaries affected by anthropogenic nutrient loading, where seasonal hypoxia is also closely linked to climate variability and terrestrial nutrient inputs (Dai et al., 2023; Hao et al., 2024).
The Upper Gulf of Thailand (UGoT) is a shallow (Figure 1A), semi-enclosed water body located at the innermost part of the South China Sea. It receives substantial inputs from Thailand’s major rivers, which—similar to river systems draining other large urbanized regions—transport high loads of pollutants (e.g., antibiotics; Wang et al. (2021)) as well as nutrients derived from upstream agricultural, urban, and industrial activities (Buranapratheprat et al., 2021; Uthaipan et al., 2025). As a result, coastal areas and river mouths within the UGoT are highly eutrophic and have experienced increasing and persistent phytoplankton blooms, hypoxic to anoxic conditions, and frequent mass mortality events of both wild and cultured fish and shellfish (Anongponyoskun et al., 2012; Buranapratheprat et al., 2021). Previous studies have shown that hypoxia in the UGoT is primarily driven by nutrient-rich river discharge and monsoon-modulated circulation (Buranapratheprat et al., 2021; Morimoto et al., 2021). Morimoto et al. (2021) further demonstrated that enhanced freshwater inflow increases nutrient loading, elevates biological oxygen demand, and accelerates both the onset and spatial extent of hypoxic conditions.
Figure 1
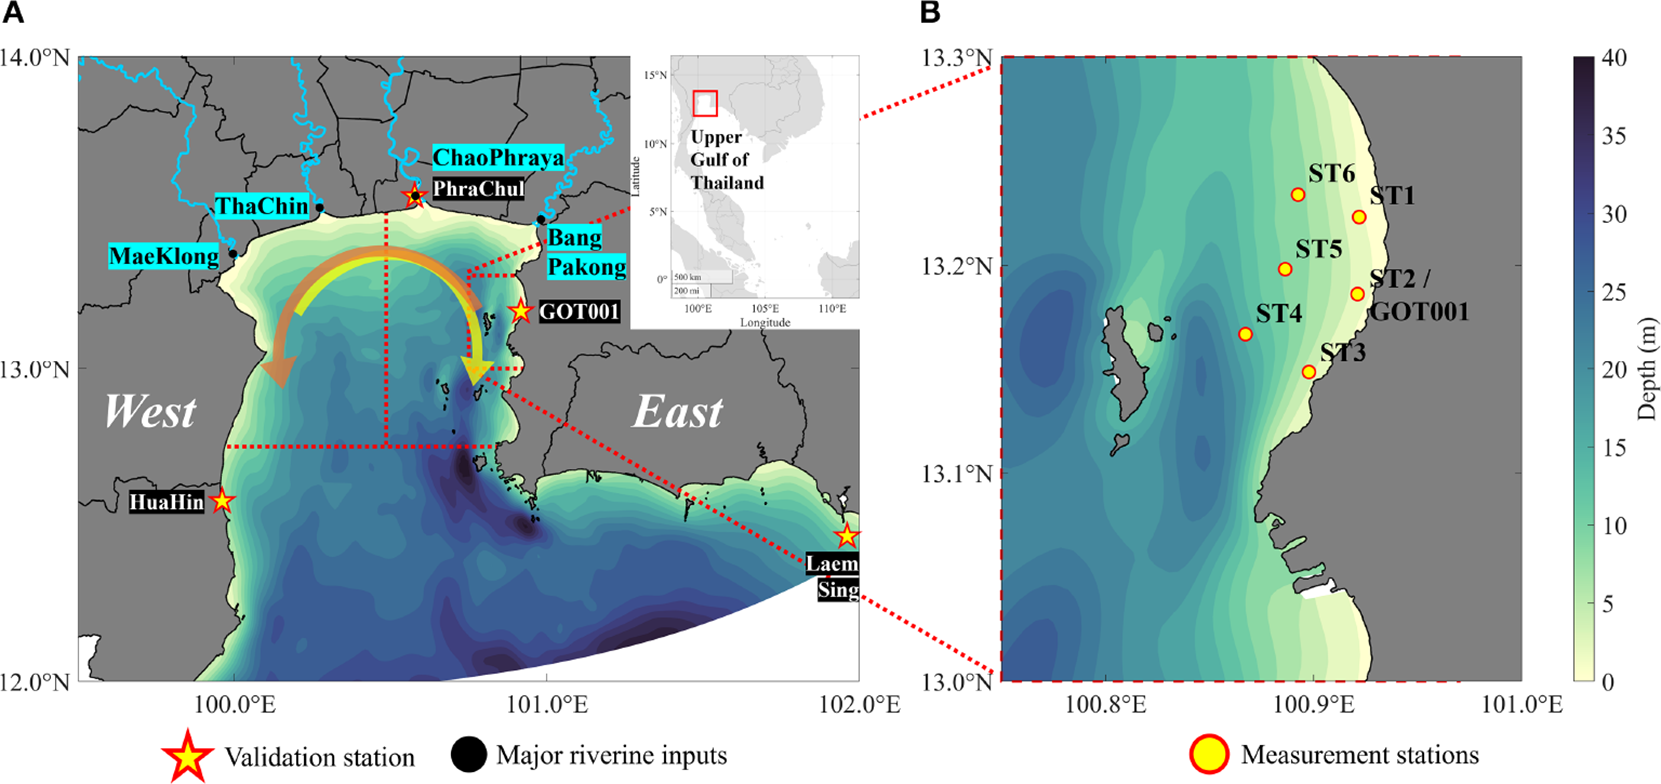
Map of the Upper Gulf of Thailand (UGoT) showing (A) the study area, major riverine inputs (Bang Pakong, Chao Phraya, Tha Chin, and Mae Klong), the location of the GOT001 station, and the 6-monthly sampling stations. The red dashed boxes denote the western and eastern subregions of the UGoT. The yellow arrow indicates the prevailing clockwise circulation during the southwest monsoon, whereas the orange arrows represent circulation during the northeast monsoon. (B) Siracha area, which is the focus of this study.
The Siracha coastal area, located along the eastern coast of the UGoT (eUGoT; Figure 1B), is a vital marine zone that supports local livelihoods, fisheries, tourism, and major industrial activities. The region is particularly well known for green mussel aquaculture, which has been increasingly affected by deteriorating water quality, frequent phytoplankton blooms, and hypoxia. In recent years, both fisheries and aquaculture production in Siracha have shown a marked decline. Hourly DO measurements obtained from dataloggers reveal pronounced diurnal fluctuations, ranging from near anoxic conditions to approximately 8 mg L−¹. During the southwest monsoon, when the UGoT receives enhanced river discharge and nutrient loading, hypoxic and anoxic events develop and persist in the central UGoT, particularly near river mouths (Morimoto et al., 2021). Long-term observations further indicate that hypoxia occurs intermittently along the eUGoT. In contrast to offshore hypoxia, which reaches its maximum spatial extent during peak river discharge in October, nearshore low-oxygen conditions tend to dissipate rapidly during the same period. Moreover, frequent observations in the offshore Siracha area reveal an atypical vertical DO structure, with minimum concentrations occurring at mid-depth rather than near the seabed, as is generally expected in coastal waters. This suggests that offshore DO variability is governed by more complex processes than riverine forcing alone. However, the mechanisms driving DO dynamics in the Siracha area remain poorly understood, highlighting a critical gap in both scientific knowledge and coastal resource management.
This study examines the spatial and temporal variability of DO in the Siracha coastal area using field observations and a coupled three-dimensional hydrodynamic–biochemical model. We analyze the development and seasonal progression of hypoxia and quantify the relative contributions of physical processes (e.g., river discharge and tidal mixing) and biological processes (e.g., primary production) in regulating DO dynamics. The resulting insights into DO variability and hypoxia formation are broadly applicable to other shallow, monsoon-influenced coastal systems and eutrophic estuaries worldwide.
2 Materials and methods
2.1 Study area
This study was conducted in the UGoT, a shallow sea located at the innermost part of the South China Sea. The UGoT extends from 99.80°E to 102.10°E and 11.95°N to 13.50°N (Figure 1A), with a specific focus on the eUGoT, where the Siracha coastal area is located (Figure 1B). The UGoT covers a total surface area of approximately 22,800 km², whereas the Siracha area encompasses approximately 580 km². The mean water depth is ~18 m for the UGoT and ~15 m for the Siracha area. Despite its ecological significance and its importance as a major hub for aquaculture, maritime transport, and industrial activities, the region has experienced persistent water-quality degradation over the past several decades, including eutrophication, recurrent hypoxia, and elevated nutrient concentrations. Freshwater inputs from four major rivers—the Bang Pakong, Chao Phraya, Tha Chin, and Mae Klong Rivers—together with tidal forcing and wind-driven mixing, generate a highly dynamic hydrodynamic environment. Previous studies have documented strong seasonal variations in water-column stratification, hypoxia, and anoxia in the UGoT (Buranapratheprat et al., 2021; Morimoto et al., 2021). The pronounced spatial and temporal variability of this system, as revealed by long-term observations and earlier studies, makes the UGoT an ideal natural laboratory for investigating the interactions between physical forcing and biochemical processes.
2.2 Temporal measurement from dataloggers
Hourly observations of solar radiation (W m−²), wind speed (m s−¹) and direction (°), relative humidity (%), air temperature (°C), atmospheric pressure (hPa), water level (m), water temperature (°C), salinity (psu), flow velocity (m s−¹), chlorophyll-a concentration (µg L−¹), and DO (mg L−¹) were obtained from the marine telemetry GOT001 station, operated by the Hydro-Informatics Institute (HII) and the Faculty of Fisheries, Kasetsart University. Water temperature and salinity were measured using the INFINITY-CTW, chlorophyll and turbidity with the INFINITY-CLW, and DO with the RINKO W manufactured by JFE Advantech. In addition, 10-min interval water-level data from three auxiliary stations—Phra Chul, Hua Hin, and Laem Sing—were acquired from the Hydrographic Department of the Royal Thai Navy.
2.3 Spatial measurement
Monthly hydrographic and water-quality surveys were conducted over 12 consecutive months from January to December 2020 at six measurement stations in the Siracha area (Figure 1B), with an average spacing of ~4 km to capture spatial variability. Three stations were located nearshore in shallow waters (ST1, ST2, and ST3 at depths of 3, 6, and 6 m, respectively), approximately 1 km from the coastline, whereas the remaining three stations were situated farther offshore in deeper waters (ST4, ST5, and ST6 at depths of 18, 14, and 12 m, respectively), approximately 5 km from the coastline. All hydrographic measurements were conducted using a multiparameter CTD profiler (AAQ-RINKO; JFE Advantech, Japan) equipped with a fast-response optical DO sensor (response time: 0.4 s). The CTD recorded water temperature (°C), salinity (psu), DO saturation (%), chlorophyll-a concentration (ppb), and turbidity (FTU). All vertical profile data were averaged into 10-cm-depth bins for subsequent analysis. Concurrent with the CTD casts, discrete water samples were collected for nutrient analysis, including ammonium, nitrate, and phosphate, following the Grasshoff method for ammonium, the Griess method for nitrate, and the Strickland and Parsons method for phosphate. Water samples were collected using a vertical water sampler at 1 m below the surface at the nearshore stations (ST1–ST3), and at both 1 m below the surface and 1 m above the seabed at the offshore stations (ST4–ST6).
2.4 Hydrodynamic modeling
A three-dimensional hydrodynamic model was developed using Delft3D-FLOW (Deltares, 2014) to simulate water level, current velocity, water temperature, and salinity dynamics for the year 2020. The model was driven by tidal forcing, wind stress, and riverine inputs to realistically represent water-column stratification. A curvilinear coordinate grid was applied, with horizontal cell sizes ranging from 0.1 to 1.3 km², enabling accurate representation of the complex coastal geometry. In the vertical dimension, the water column was resolved using 10 sigma layers with relative thicknesses of 2%, 6%, 8%, 10%, 10%, 10%, 10%, 12%, 14%, and 18% from the surface to the seabed. The model domain covered the entire UGoT and was extended further south to minimize offshore boundary effects. The full model domain is shown in Figure 1A, whereas the high-resolution grid details are provided in the supplementary material. Offshore boundary conditions for water level, depth-varying salinity, and water temperature were obtained from a larger-scale hydrodynamic model of the Gulf of Thailand (Phattananuruch and Pokavanich, 2024). Meteorological forcing was prescribed using hourly reanalysis data from ERA5, including air temperature, relative humidity, cloud cover, atmospheric pressure, wind speed, and wind direction (Hersbach et al., 2020). Freshwater discharge to the UGoT was initially derived from the Global Flood Awareness System (Alfieri et al., 2013) and then adjusted to be consistent with observations from the Royal Irrigation Department of Thailand and further refined by manual adjustment as needed for the model to reproduce salinity at the GOT001 station. This treatment accounts for strong tidal influence, upstream water regulation, unrepresented lateral inflows and outflows, and limited reliable monitoring near the river mouth. This approach follows a validated method for improving simulations of saltwater intrusion and estuarine circulation (Pokavanich and Guo, 2024).
The simulation was carried out with a temporal resolution of 5 min to accurately capture short-term dynamic processes such as tides and wind-driven circulation. Bottom friction was represented using a Chezy coefficient of 55 m0.5 s−1, which falls within the typical range for estuarine environments (Van der Werf, 2009). To represent unresolved sub-grid scale turbulent mixing, the model employs a k–ϵ turbulence closure scheme with user-defined background horizontal eddy viscosity and diffusivity, both set to 0.1 m² s−1 (Burchard and Baumert, 1995; Delhez et al., 1999). Uniform water temperature and salinity at 30°C and 31 ppt were applied as the initial conditions, respectively. A 2-year spin-up period (2018-2019) was used to bring the model to dynamic equilibrium prior to the simulation period. Model validation against field observations of both temporal and spatial data confirmed the model’s accuracy and reliability.
2.5 Hypoxia modeling
A conceptual diagram of the water-quality model, focusing on the DO budget, is shown in Figure 2. The hypoxia model was developed using Delft3D-WAQ, a multidimensional framework that simulates water-quality dynamics by solving the advection–diffusion–reaction equation. The model was driven by hydrodynamic outputs, including water level, current velocity, water temperature, and salinity, derived from the hydrodynamic simulations. To realistically represent the DO budget, the model also simulates key environmental variables, including phytoplankton biomass, detritus, dissolved macronutrients, inorganic matter, and light availability. Biochemical processes are parameterized using simple constant, linear, or Monod-type formulations, whereas phytoplankton gross primary production, respiration, and mortality are simulated using the BLOOM module (Los, 2009). Particulate matter is subject to settling and resuspension processes, governed by near-bed shear stress computed from the hydrodynamic model. Light attenuation is represented using calculated light extinction coefficients contributed by phytoplankton biomass, detritus, organic matter, and background turbidity. Detailed descriptions of the implemented processes are provided in the Deltares DELWAQ technical reference manual (Deltares, 2003). Most process parameters were assigned their default values, whereas modified parameters used in this study are listed in Table 1.
Figure 2
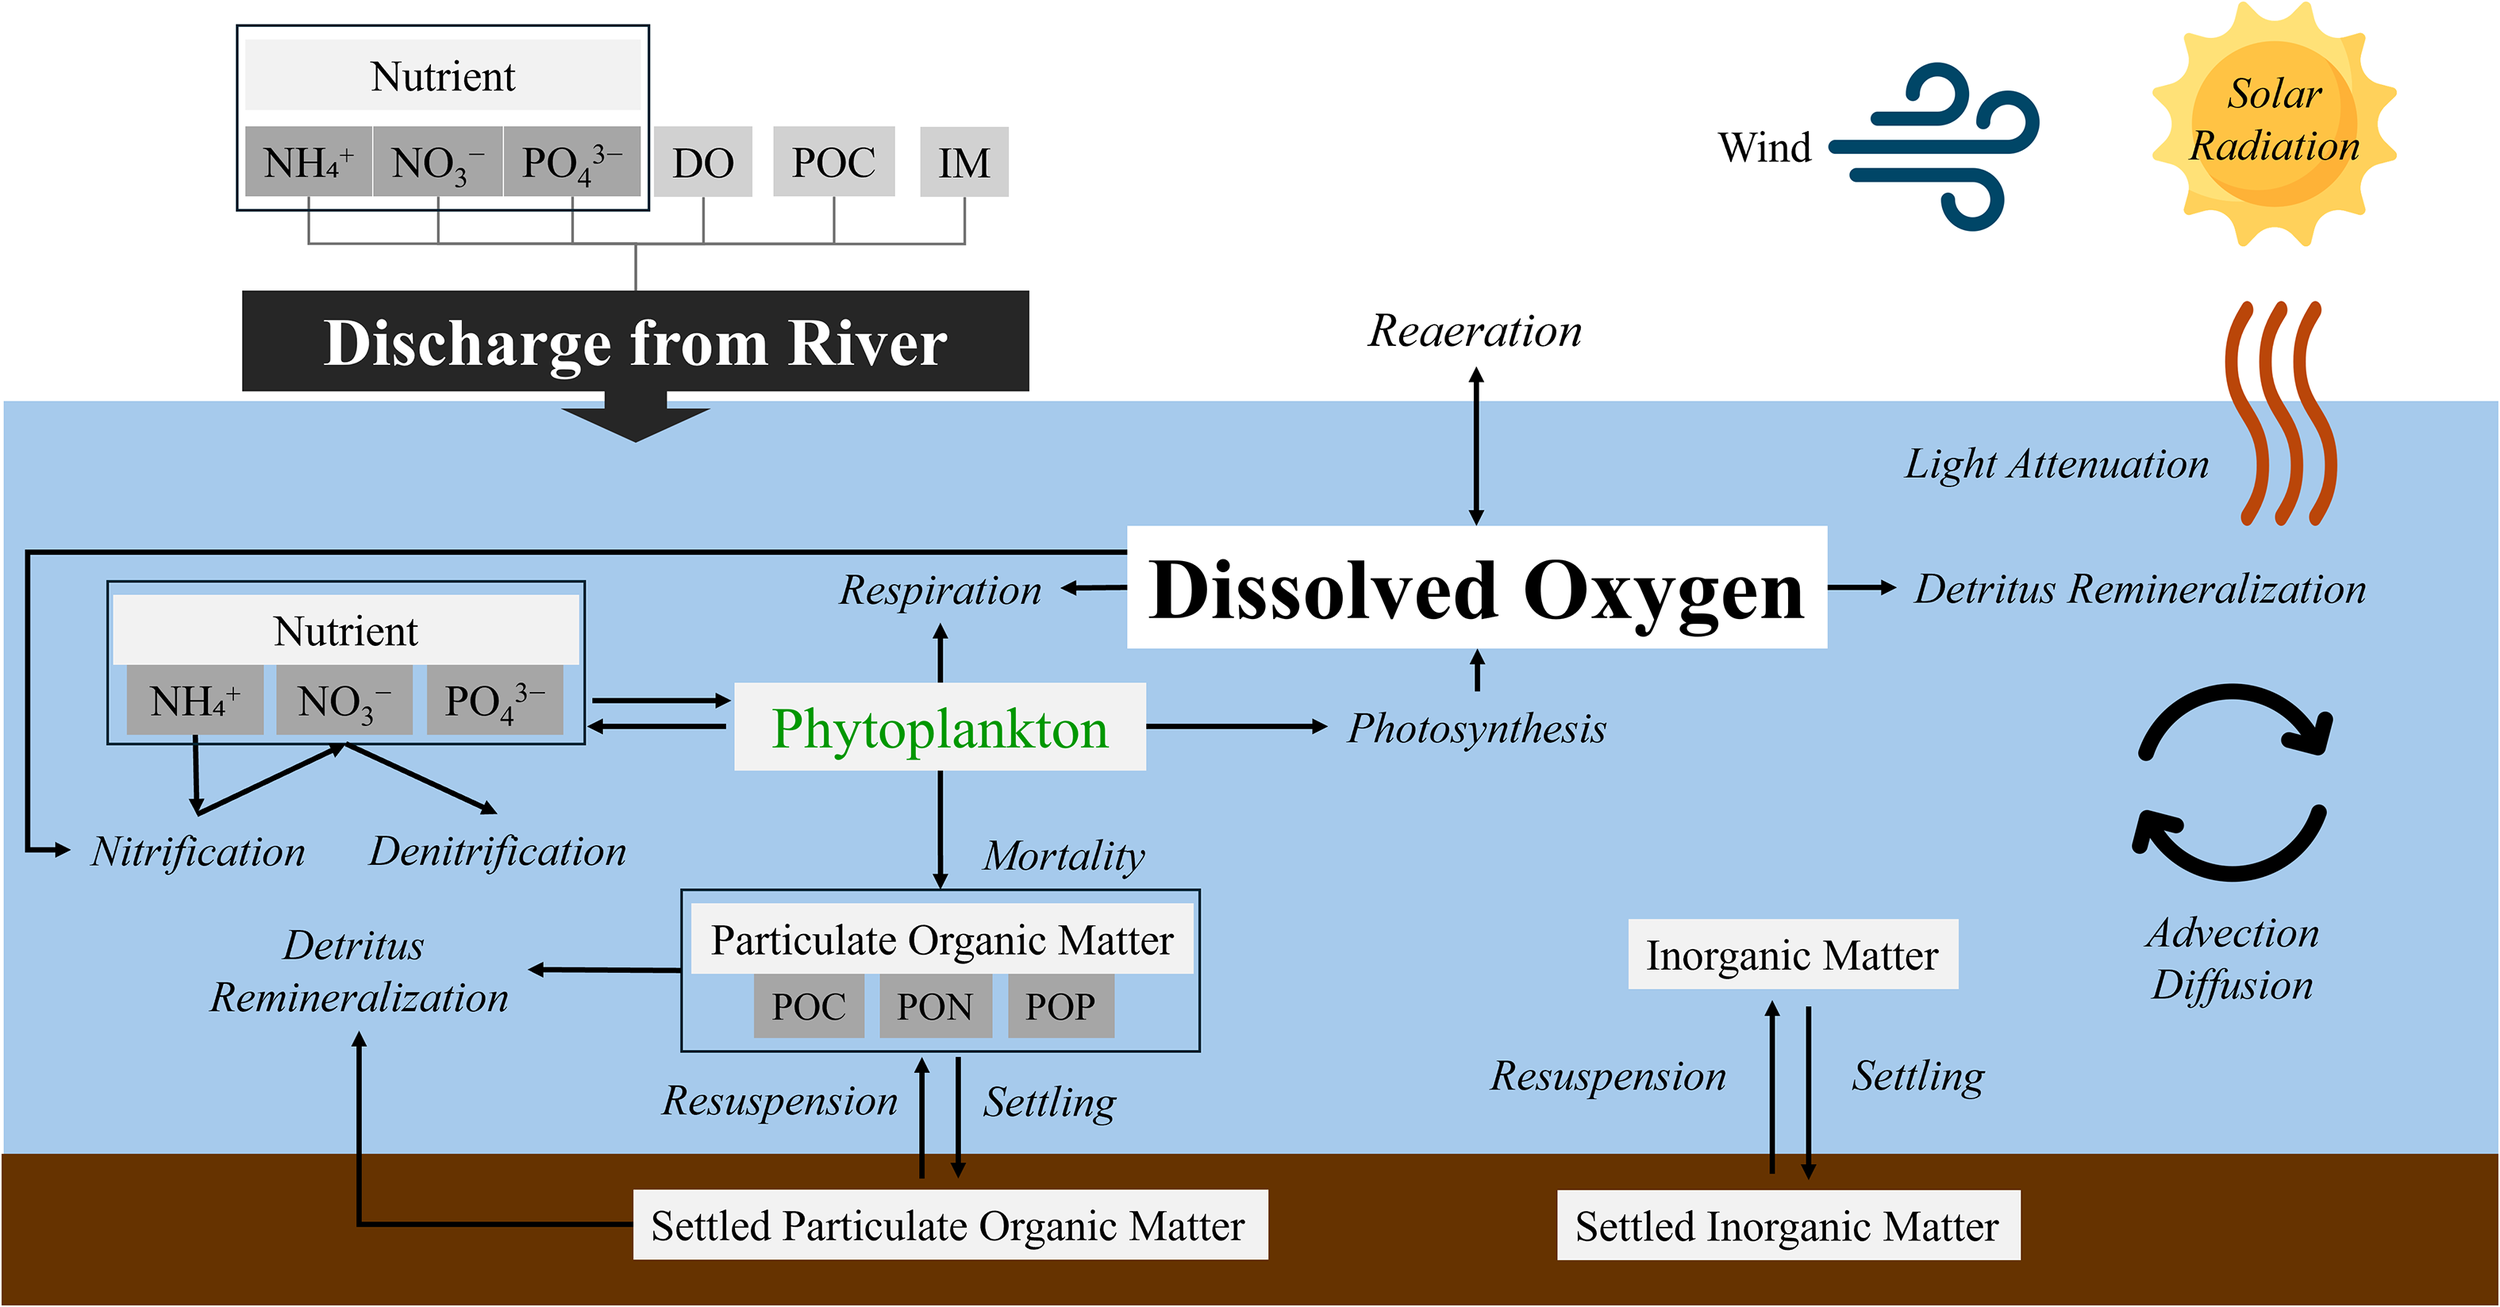
Conceptual diagram showing processes affecting DO in the study area.
Table 1
| Substance | Description | Unit | Value |
|---|---|---|---|
| Temp | Ambient water temperature | °C | from hydrodynamic model |
| DO | Reaeration coefficient | m/day | 0.028 × (wind speed)2 |
| POC | POC mineralization rate | 1/day | 0.18 |
| RcNit | Nitrification rate | 1/day | 0.1 |
| VsedIM1 | Sedimentation velocity of IM1 | m/day | 0.1 |
| TaucSIM1 | Critical shear stress for sedimentation of IM1 | N/m2 | 0.1 |
| VSedPOC1 | Sedimentation velocity of POC1 | m/day | 0.5 |
| TaucSPOC1 | Critical shear stress for sedimentation of POC1 | N/m2 | 0.1 |
| ExtVlIM1 | Light extinction coefficient of IM1 | m2/gDM | 0.01 |
| ExtVlPOC1 | Light extinction coefficient of POC1 | m2/gC | 0.1 |
| VResDM | Resuspension rate of dry matter | 1/day | 1 |
| TaucRS1DM | Critical shear stress for dry matter resuspension (layer S1) | N/m2 | 0.2 |
Example of model parameterization used in hypoxia simulations.
The DO budget, the primary target of this study, is regulated by both physical and biochemical processes. Physical processes include DO advection and diffusion from surrounding waters, as well as air–sea exchange driven by wind forcing. Biochemical processes comprise DO production through phytoplankton photosynthesis and its consumption through phytoplankton respiration, water-column and benthic detrital remineralization, and nitrification. Phytoplankton growth, fueled by nutrient uptake, enhances DO through photosynthesis but reduces it through respiration. Following phytoplankton mortality, organic matter contributes to particulate detritus, which may settle to the seabed or remain suspended, where subsequent remineralization consumes DO. Nutrient cycling further influences DO through oxygen-demanding nitrification and denitrification, which alters nutrient availability. In addition, physical processes such as light attenuation, advection, diffusion, and exchanges between the water column and sediments collectively control the transport, distribution, and vertical structure of DO.
River inputs supplied DO, nutrients—ammonium (NH4+), nitrate (NO3−), and phosphate (PO4³−)—and detrital material to the model domain in the form of particulate organic matter, partitioned into particulate organic carbon (POC), particulate organic nitrogen (PON), and particulate organic phosphorus (POP), as well as particulate inorganic matter (IM). Based on observations indicating that silicate is abundant in the UGoT, it was excluded from the model formulation. No phytoplankton was prescribed from riverine sources. Based on previous observations and model calibration, non-uniform riverine nutrient concentrations were prescribed. For NH4+ and NO3−, concentrations were set to 0 mg L−¹ from 10–31 August 2020, 2 mg L−¹ from 30 July–5 August 2020, 10 mg L−¹ from 1–8 June 2020, 150 mg L−¹ on 6 August 2020, and 180 mg L−¹ from 9–12 June 2020. On all other dates, concentrations were maintained at 0.1 mg L−¹. For PO4³−, concentrations were set to 0 mg L−¹ from 10–31 August 2020, 0.4 mg L−¹ from 30 July–5 August 2020, 2 mg L−¹ from 1–8 June 2020, 30 mg L−¹ on 6 August 2020, and 36 mg L−¹ from 9–12 June 2020; otherwise, concentrations were fixed at 0.05 mg L−¹. This parameterization provided the best model calibration performance and reflects enhanced nutrient fluxes during the flooding season and contributions from additional nutrient sources in the system, as suggested by previous studies. Future work will incorporate improved riverine nutrient data to further refine and enhance the realism of the model.
At the start of the simulation, DO and inorganic matter (IM) were uniformly initialized at 6 mg L−¹ and 0 mg DM L−¹, respectively, with identical boundary values. Initial concentrations of NH4+, NO3−, and PO4³− were uniformly prescribed at 0.005 mg L−¹, whereas offshore boundary concentrations were set to 0.001 mg L−¹, consistent with the low background levels observed in the region. Fast-decomposing organic substances (POC, PON, and POP) were initialized at 0 mg L−¹ both within the domain and at the boundaries. Phytoplankton biomass was initialized at 0.01 mg C L−¹, with boundary values of 0.0025 mg C L−¹. In the bottom sediment layer (S1), IM1S, DetCS1, DetNS1, and DetPS1 were all initialized at 0 mg L−¹, and no boundary conditions were applied for these components. In the model configuration, remineralization of POC, PON, and POP proceeds at the same prescribed rates after settling to the seafloor, and the nutrients released through benthic remineralization are returned directly to the bottom model layer. Owing to the lack of reliable observations on the quantity and composition of particulate material accumulated on the seabed, the model assumes that all resuspended material originates exclusively from newly settled particles, with the sediment pool initialized at zero. Although this simplification may lead to an idealized representation of sediment–water interactions, this study primarily focuses on water-column biochemical processes and hypoxia development driven predominantly by riverine nutrient inputs. More realistic sediment–water coupling will be addressed in future model refinements.
3 Results and discussion
3.1 Model validation
The model was initially validated using water level measurements obtained from secondary sources at four locations around the UGoT. The comparison between simulated and observed values demonstrated strong agreement, confirming the model’s reliability. The model demonstrates strong performance in simulating water level, with high correlation coefficients (R² = 0.79–0.90) and low RMSE values (0.17–0.39 m) across multiple stations in Table 2, indicating robust hydrodynamic predictions. Similarly, the water temperature simulation exhibits a high degree of accuracy, effectively capturing seasonal variations. The salinity model successfully reproduces overall trends and key fluctuations, aligning well with observed data. Chlorophyll-a simulation provides valuable insights into biological dynamics and accurately captures baseline trends, closely following observed values during periods of low phytoplankton activity, although peak concentrations and phytoplankton bloom in May remain underestimated. Model effectively captures key seasonal trends and follows observed fluctuations, reflecting the model’s ability to simulate DO dynamics. The model can fairly reproduce the same order of nutrient concentration. Discrepancies between the modeled and observed values may result from complex biological dynamics at the study site, such as nitrogen and phosphorus recycled by green Noctiluca sp., which can significantly contribute to the nutrient supply required for phytoplankton growth. Although the nutrient concentrations (NH4+ and NO3−) simulated by the model exhibit quantitative discrepancies compared with the observed data, they remain within the same order of magnitude. This suggests that the model reasonably captures the overall scale of nutrient variability in the system, despite certain limitations in quantitative accuracy.
Table 2
| Station | Parameters | Unit | Data interval | R2 | R | RMSE |
|---|---|---|---|---|---|---|
| GOT001 | Water level | m | Hourly | 0.86 | 0.93 | 0.32 |
| Water temperature | °C | Hourly | 0.89 | 0.94 | 0.56 | |
| Salinity | psu | Hourly | 0.76 | 0.87 | 0.59 | |
| Chlorophyll-a | µg/L | Daily | 0.30 | 0.55 | 7.43 | |
| Dissolved oxygen | mg/L | Daily | 0.21 | 0.46 | 1.28 | |
| Phra Chul | Water level | m | Hourly | 0.79 | 0.89 | 0.39 |
| Hua Hin | Water level | m | Hourly | 0.90 | 0.95 | 0.20 |
| Laem Sing | Water level | m | Hourly | 0.89 | 0.94 | 0.17 |
Statistical metrics for the validation of the coupled hydrodynamic-biochemical model against field observations during 1 January 2020 to 1 January 2021.
It is important to note that the model does not reproduce the May phytoplankton bloom, as this event is driven by nutrient sources that are not primarily supplied by river discharge. However, the primary objective of this study is to investigate hypoxia dynamics driven by the dominant nutrient sources at GOT001—namely, riverine inputs—as identified in previous studies (e.g., Burnett et al. (2007); Buranapratheprat et al. (2021); Morimoto et al. (2021); Dai et al. (2023)). Accordingly, the modeling framework focuses on phytoplankton blooms occurring during the rainy season associated with the southwest monsoon (June–September), when decreased salinity and enhanced freshwater-derived nutrient inputs coincide with the overall clockwise circulation in the UGoT (Buranapratheprat et al., 2002). Thus, the model remains appropriate for the objectives of this study and supports the conclusions presented. Importantly, the May bloom is not associated with hypoxic conditions in the water column. Hypoxia formation at GOT001 requires two key factors: (1) enhanced dissolved oxygen consumption driven by elevated phytoplankton biomass and (2) the development of freshwater-induced water-column stratification (halocline). Because the May bloom occurs in the absence of this stratification, hypoxia does not develop during that period. Model validation using both spatial and temporal observations (Figure 3 and Figure 4) demonstrates that the model successfully reproduces the seasonal development and breakdown of water-column stratification—as indicated by clear near-surface and near-bottom density differences—as well as the occurrence of hypoxia (DO < 2 mg L−¹) in both nearshore and offshore regions.
Figure 3
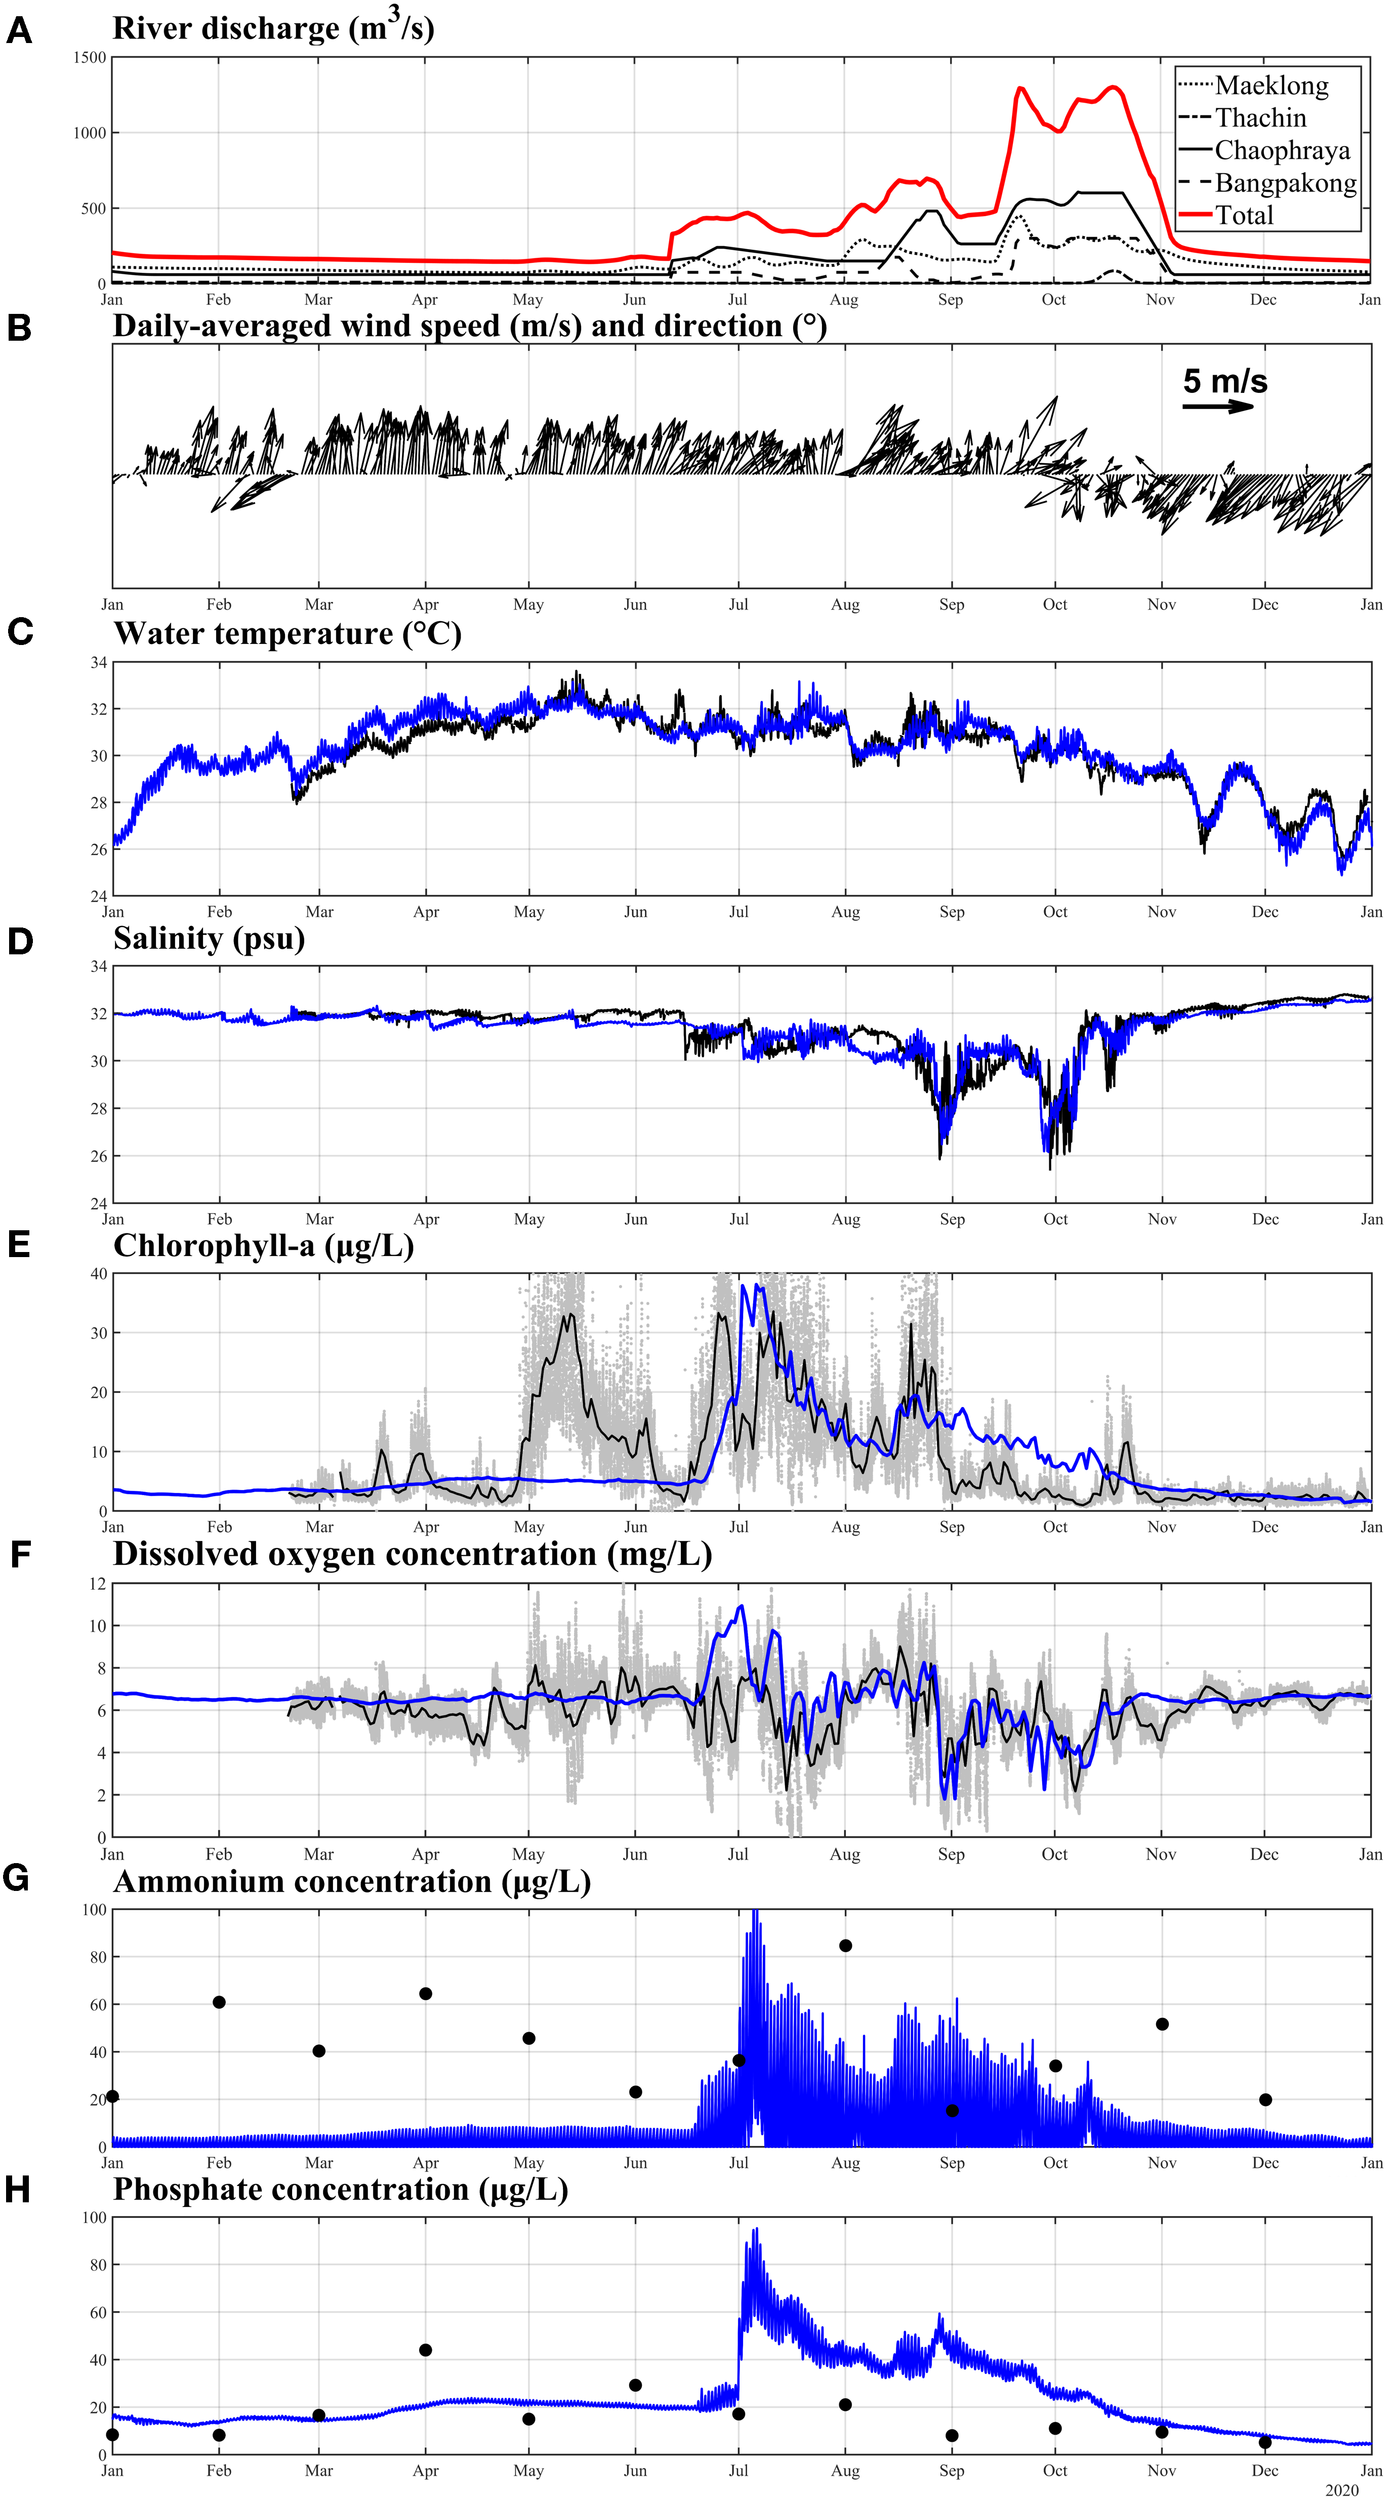
(A) Model input river discharge data; (B) daily-averaged wind speed at station GOT001; (C–F) comparisons between observed and simulated hourly averaged water temperature, hourly averaged salinity, daily averaged chlorophyll-a concentration, and daily averaged dissolved oxygen concentration at GOT001. (G, H) comparisons between observed NH4+ concentration, and PO4³− concentration and daily averaged values of model data at GOT001. Black lines and dots indicate observed values, and blue lines represent model simulations. Gray dots in panels (E, F) represent raw observations recorded at 5-min intervals.
Figure 4
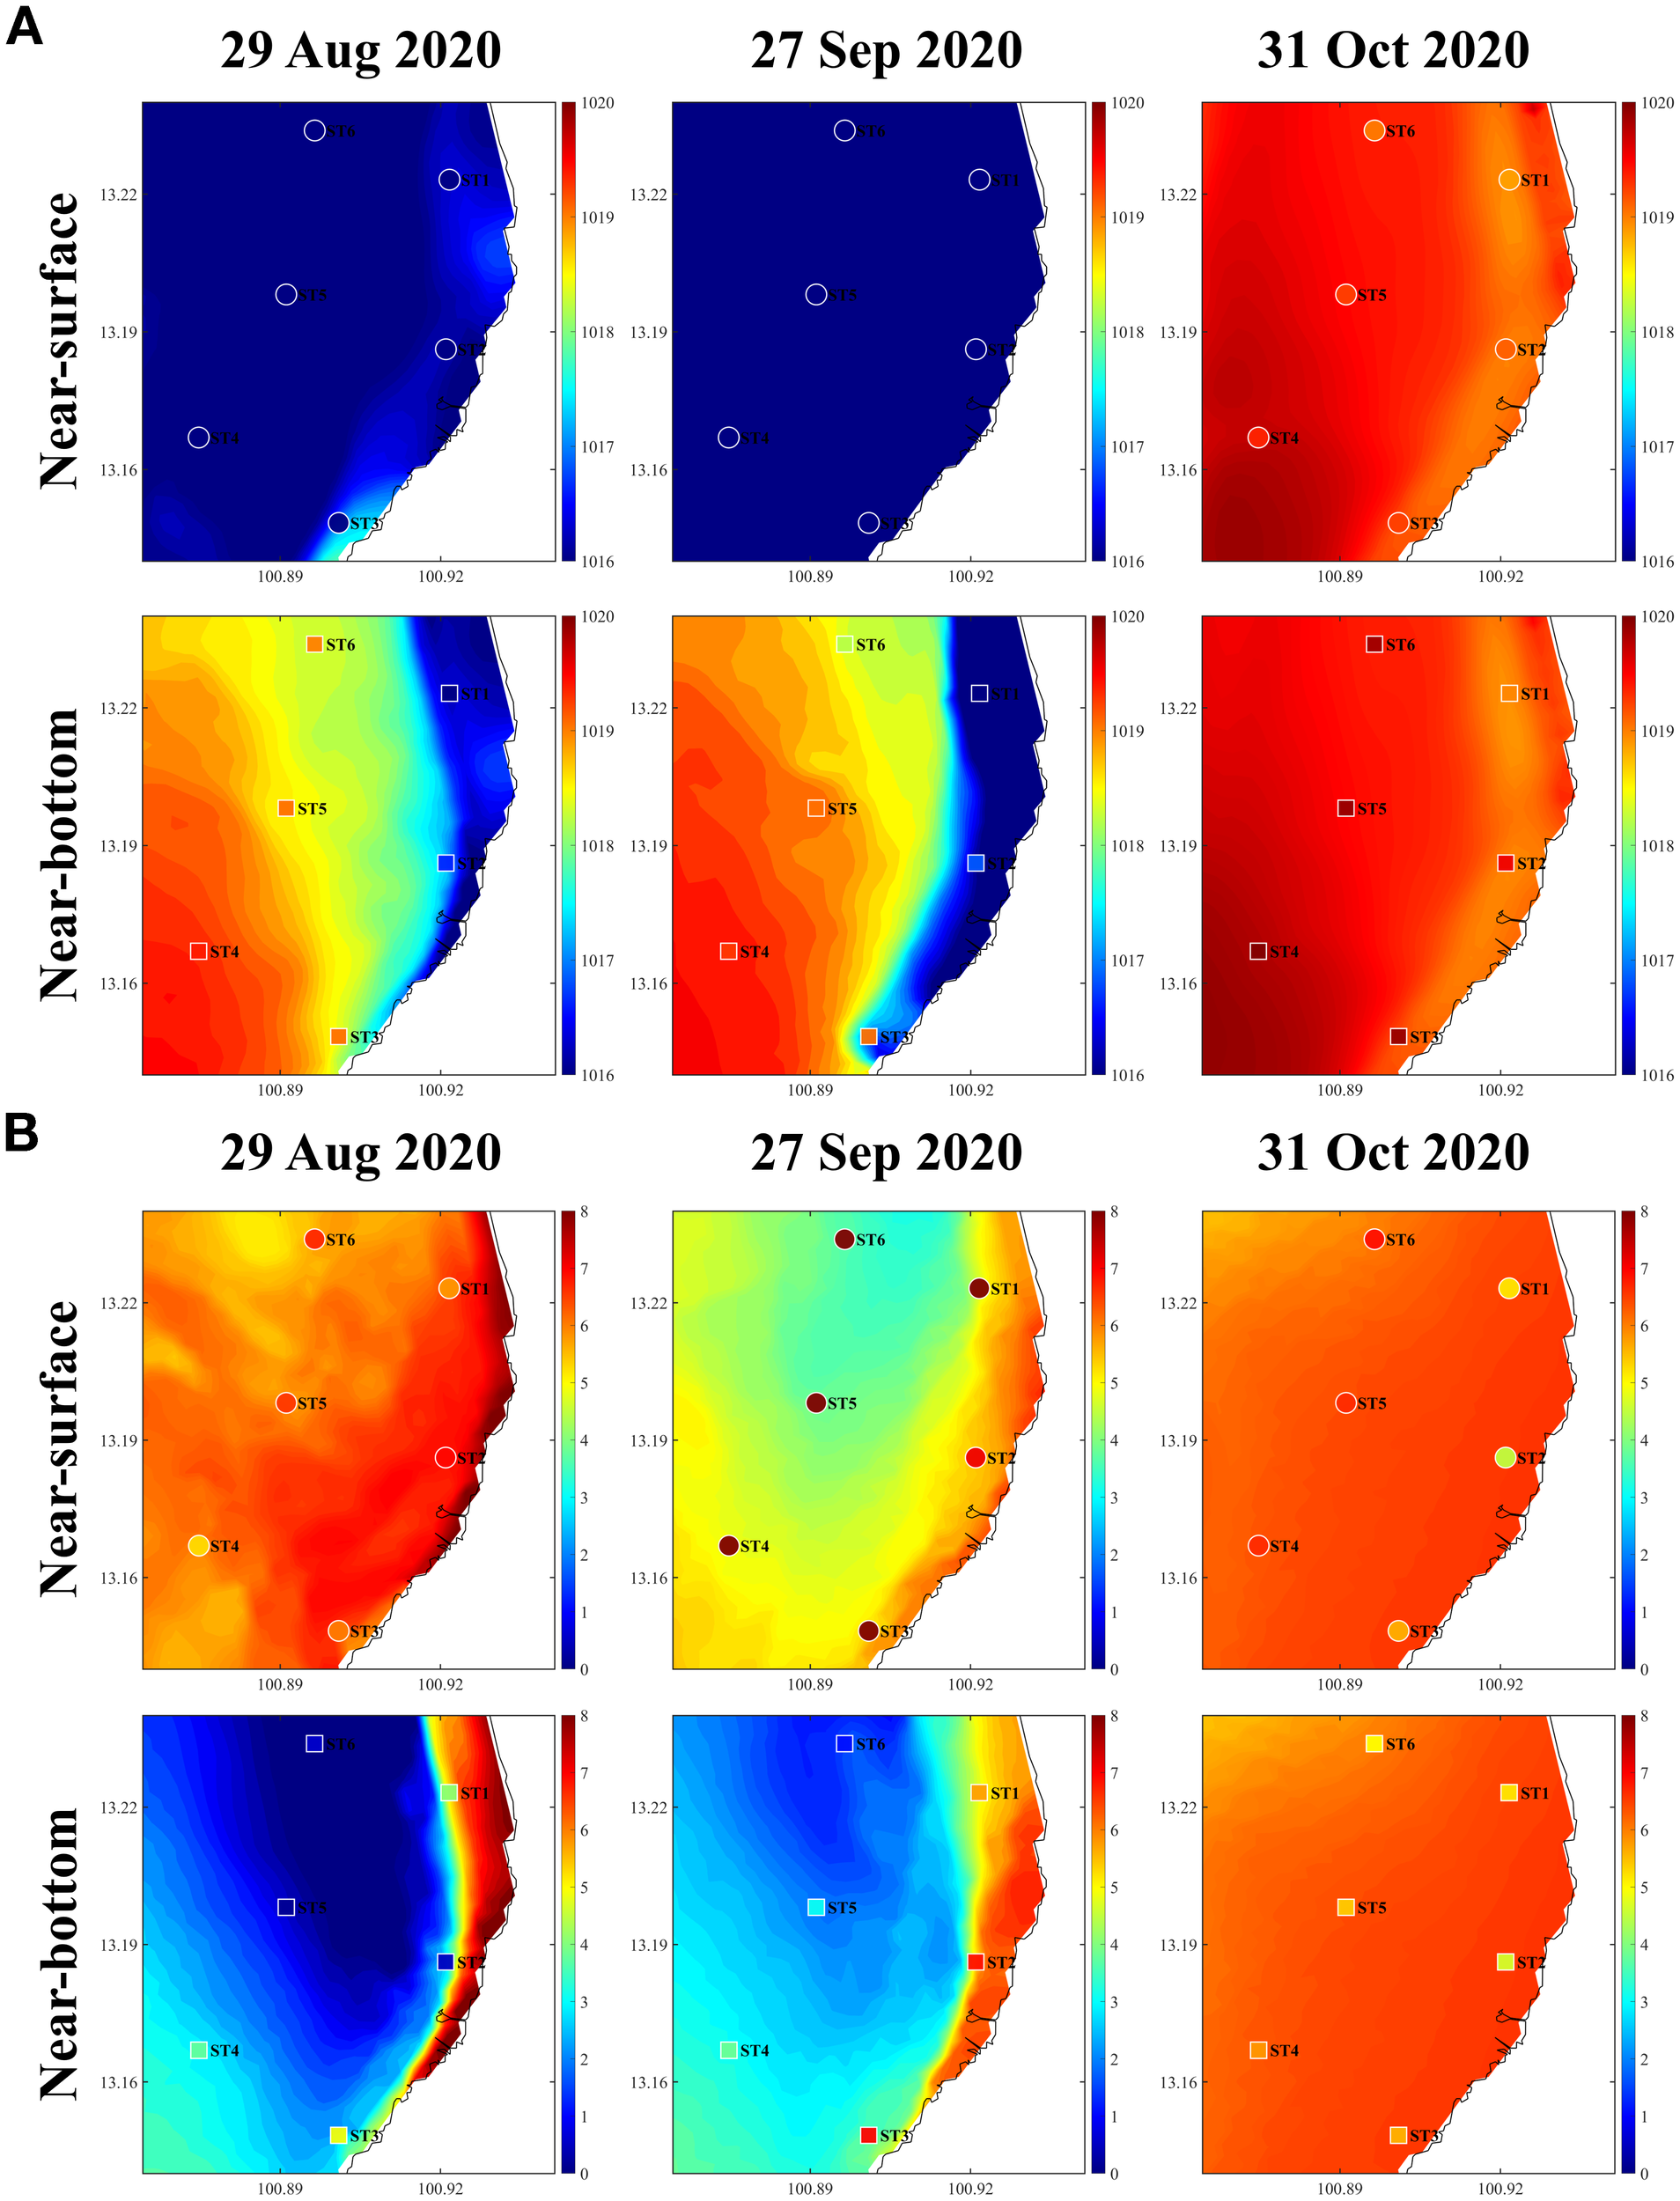
Comparison of observed and modeled near-surface and near-bottom (A) water density (kg m−3) and (B) DO concentration (mg L−¹) in the Siracha area. Observations are shown as dots and boxes, whereas model results are shown as color contours.
3.2 Observation results
Temporal measurements at the GOT001 station are presented together with river discharge in Figure 3A. River discharge exhibited pronounced seasonal variability, with peak flows during September–October and reduced discharge from November to June. Wind forcing (Figure 3B) strongly modulated water-column stability and DO dynamics, with stronger winds during the northeast monsoon (November–March; mean speed = 3.94 m s−¹) and weaker winds during the southwest monsoon (May–October; mean speed = 2.85 m s−¹). During the study period, winds predominantly originated from the south (161 days), southwest (104 days), and northeast (52 days), with no significant northerly wind events. Water temperature (Figure 3C) displayed a clear seasonal cycle, reaching a maximum of 33.6°C in May and a minimum of 25.6°C in December. Salinity (Figure 3D) reached a minimum of 25.37 psu in September and a maximum of 32.80 psu in December, with the lowest values coinciding with periods of high river discharge, indicating the strong influence of freshwater inputs. Chlorophyll-a concentrations (Figure 3E) peaked between May and August, reflecting frequent phytoplankton blooms, and declined to background levels of ~1–2 µg L−¹ during other periods. The lowest DO concentrations (Figure 3F) occurred in June and October, whereas values remained relatively stable at around 6 mg L-¹ for the remainder of the year.
The observed variability in DO within the estuarine system is primarily driven by interactions among river discharge, wind forcing, water temperature, salinity, and phytoplankton dynamics. These physical and biological factors collectively regulate water-column stratification, mixing processes, and the balance between oxygen production and consumption. Increased freshwater input lowers salinity and enhances vertical stratification, which suppresses vertical mixing, restricts DO exchange between surface and bottom layers, and promotes hypoxic conditions. Concurrently, nutrient enrichment associated with high river discharge stimulates phytoplankton blooms, further intensifying DO consumption during subsequent organic matter degradation. As a result, the lowest DO concentrations coincide with periods of high river discharge, strong stratification, and algal decay. In addition, elevated water temperatures reduce oxygen solubility and accelerate metabolic rates, thereby increasing biological oxygen demand and enhancing DO depletion. In contrast, higher DO levels were observed during the northeast monsoon (November–March), associated with cooler temperatures, stronger winds, and enhanced vertical mixing.
Monthly spatial surveys revealed pronounced spatial and vertical variability in DO concentrations. Vertical profiles (Figure 5) show clear contrasts between offshore and nearshore stations, with deeper offshore stations (e.g., ST6 and ST4) differing markedly from the shallow nearshore station ST3. At ST3 (mean depth ~4 m), DO remained relatively uniform with depth throughout all seasons. In contrast, at ST6 and ST4 (mean depths of ~11–16 m), DO consistently exhibited elevated surface values (6–12 mg L-¹) followed by sharp declines toward the bottom. The very high surface DO concentrations (>8 mg L-¹) were associated with intense phytoplankton bloom events, during which chlorophyll-a exceeded 10 µg L−¹. These vertical structures likely reflect a balance between oxygen supply from phytoplankton photosynthesis and air–sea exchange at the surface, and oxygen consumption at depth, where oxygen sources are absent whereas remineralization processes persist. This stratified pattern was most pronounced from June to September.
Figure 5
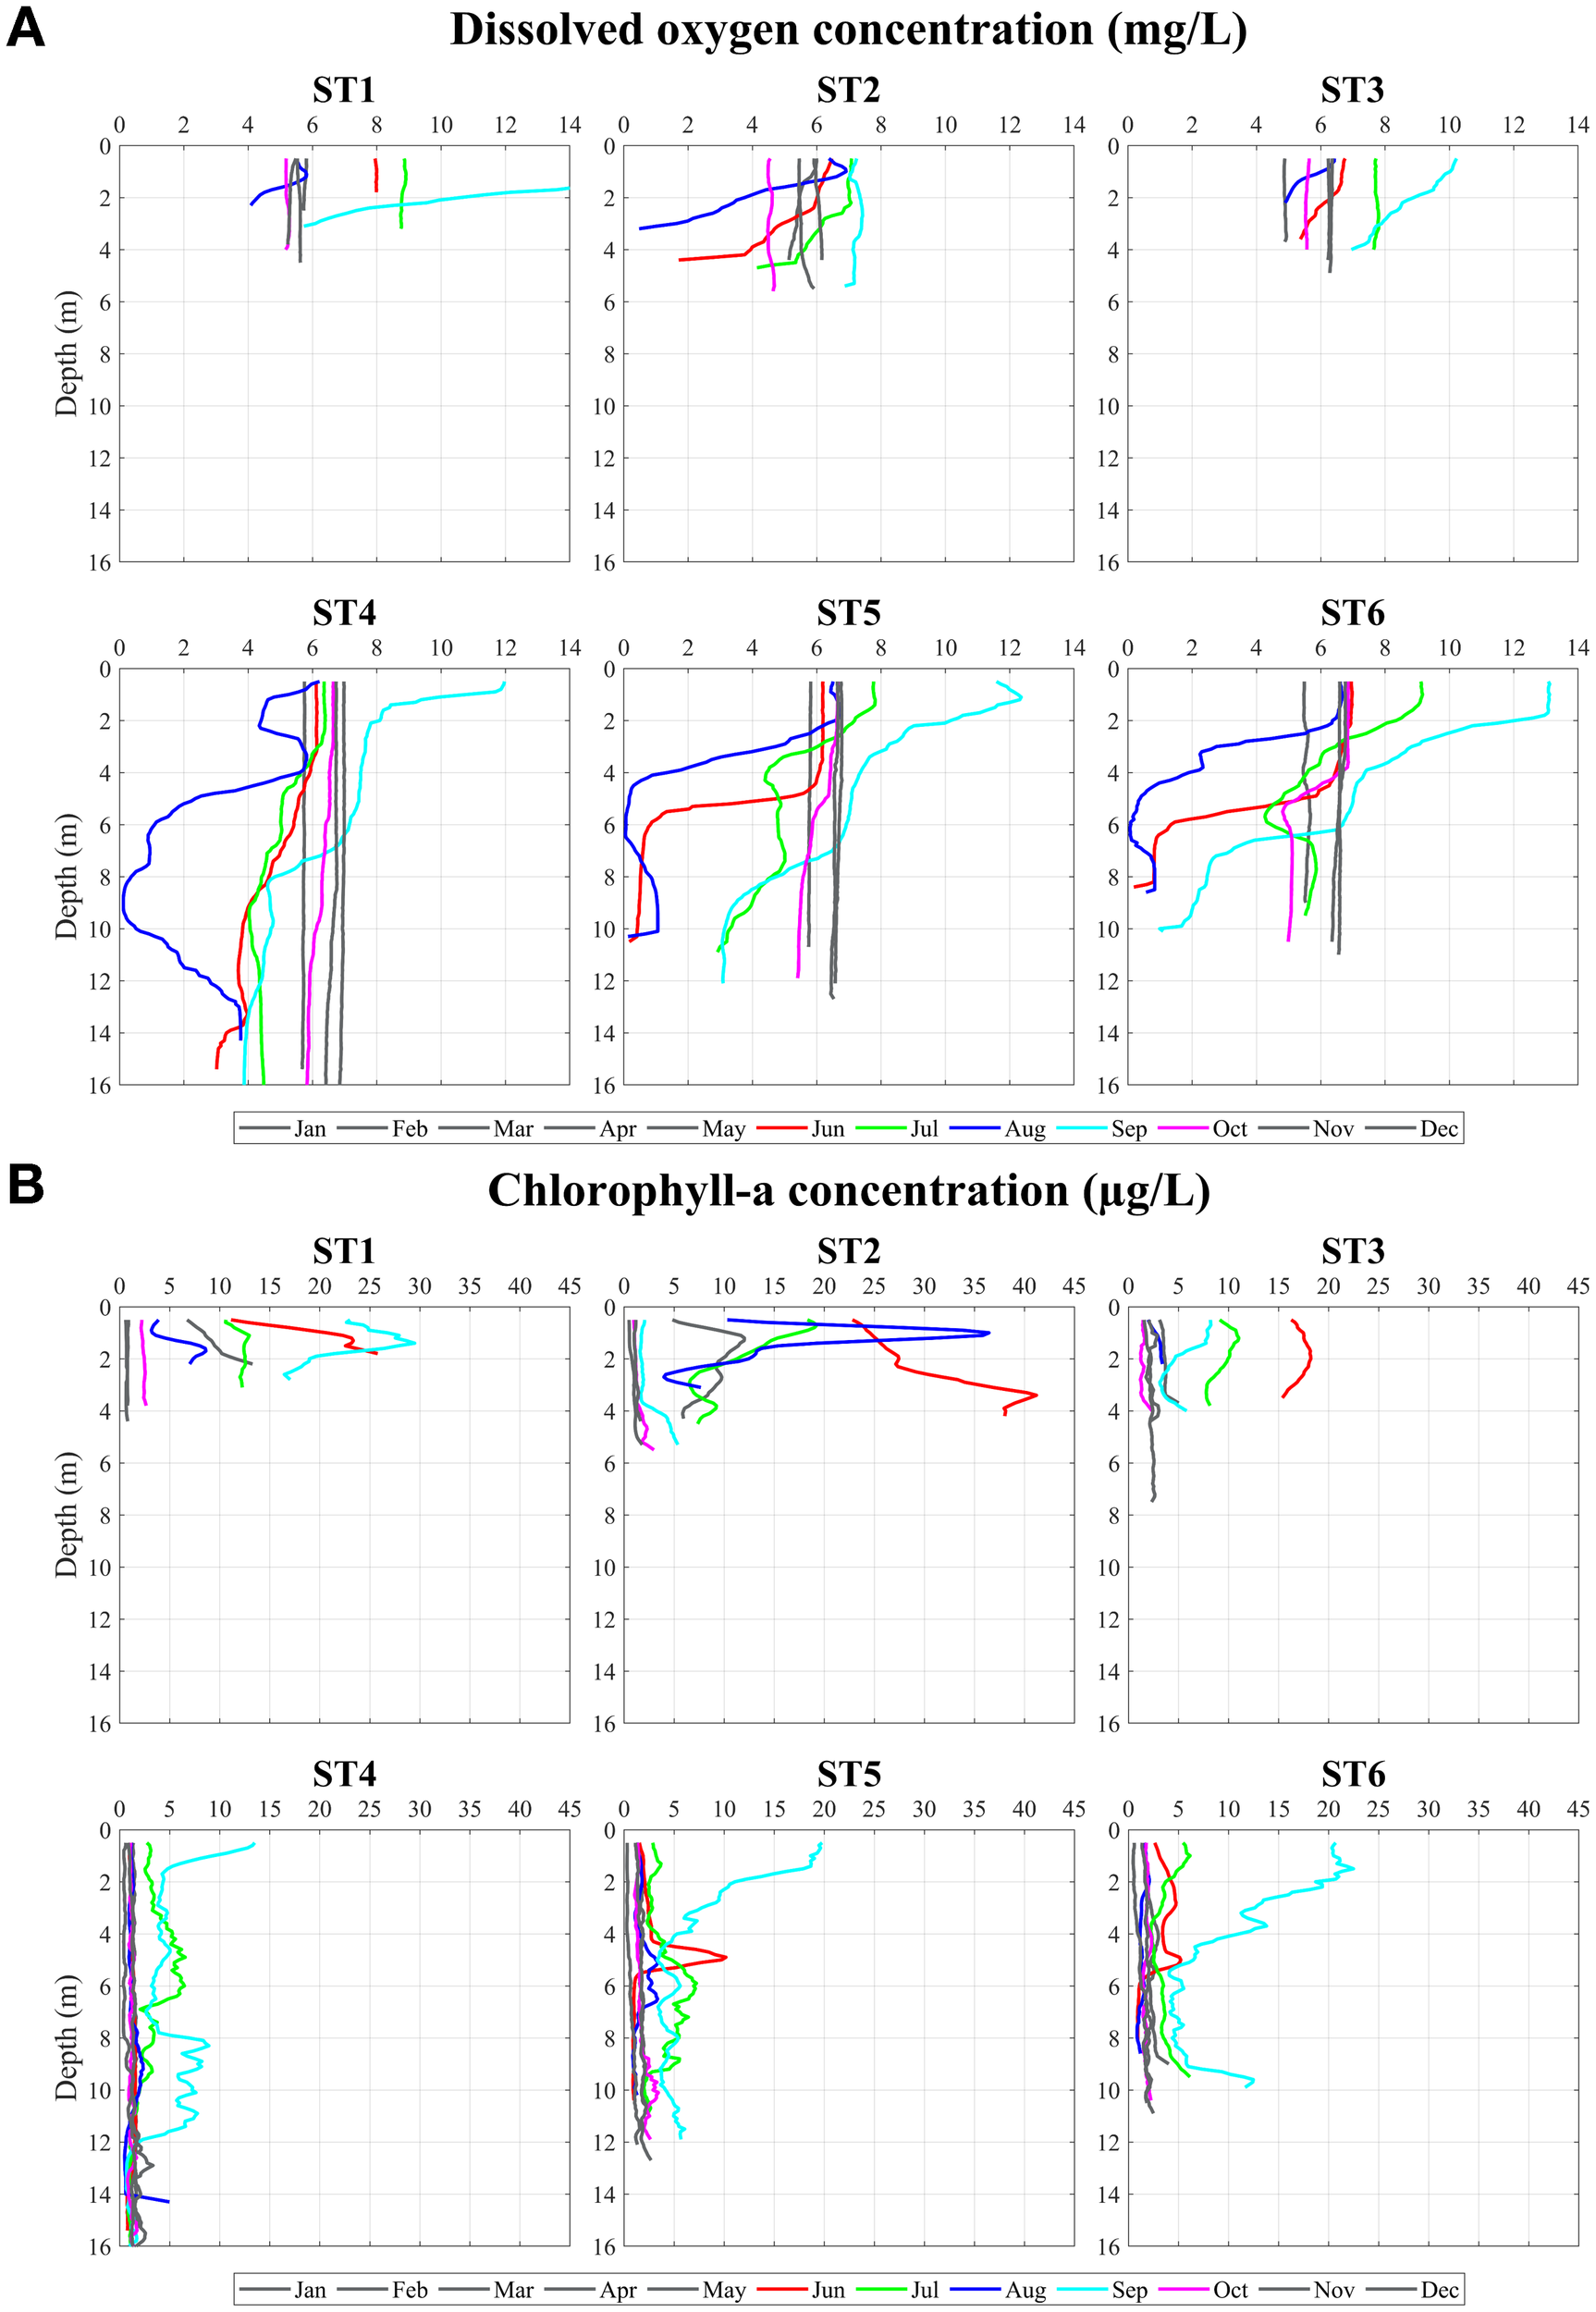
Observed vertical profiles of (A) DO concentrations (mg L−¹) and (B) Chlorophyll-a concentration (μg L−¹) from the monthly observation in the Siracha coastal area during 2020.
Anomalous DO profiles were observed in July and August 2020, when minimum DO concentrations occurred at mid-depth (~6 m at ST6 and ~10 m at ST4) rather than near the seabed, with DO increasing again toward the bottom. This atypical vertical structure cannot be explained by surface-driven oxygen dynamics alone. Similar mid-depth minimum DO profiles were also observed during other years between July and September (not shown). To investigate the mechanisms responsible for these features, a three-dimensional coupled hydrodynamic–biochemical model was employed.
3.3 Hydrodynamics of the UGoT
The three-dimensional model results are consistent with previous studies of circulation and stratification in the UGoT (e.g., Yanagi and Takao (1998); Yanagi et al. (2001); Buranapratheprat et al. (2002); Buranapratheprat et al. (2006); Buranapratheprat et al. (2008); Saramul and Ezer (2014); Buranapratheprat et al. (2016); Guo et al. (2021); Phattananuruch and Pokavanich (2024)). Surface circulation in the UGoT exhibits strong seasonal variability primarily driven by monsoonal winds. A comparison of the vertical distributions of water temperature and salinity indicates that the vertical temperature variation at any location in the UGoT is relatively small (1°C–3°C), whereas vertical salinity differences are substantially larger, particularly near river mouths and during the southwest monsoon (wet season). As shown in Figure 6, the water density difference between near-surface and near-bottom layers is dominated by salinity rather than temperature, indicating that water-column stratification in the UGoT is primarily salinity controlled.
Figure 6
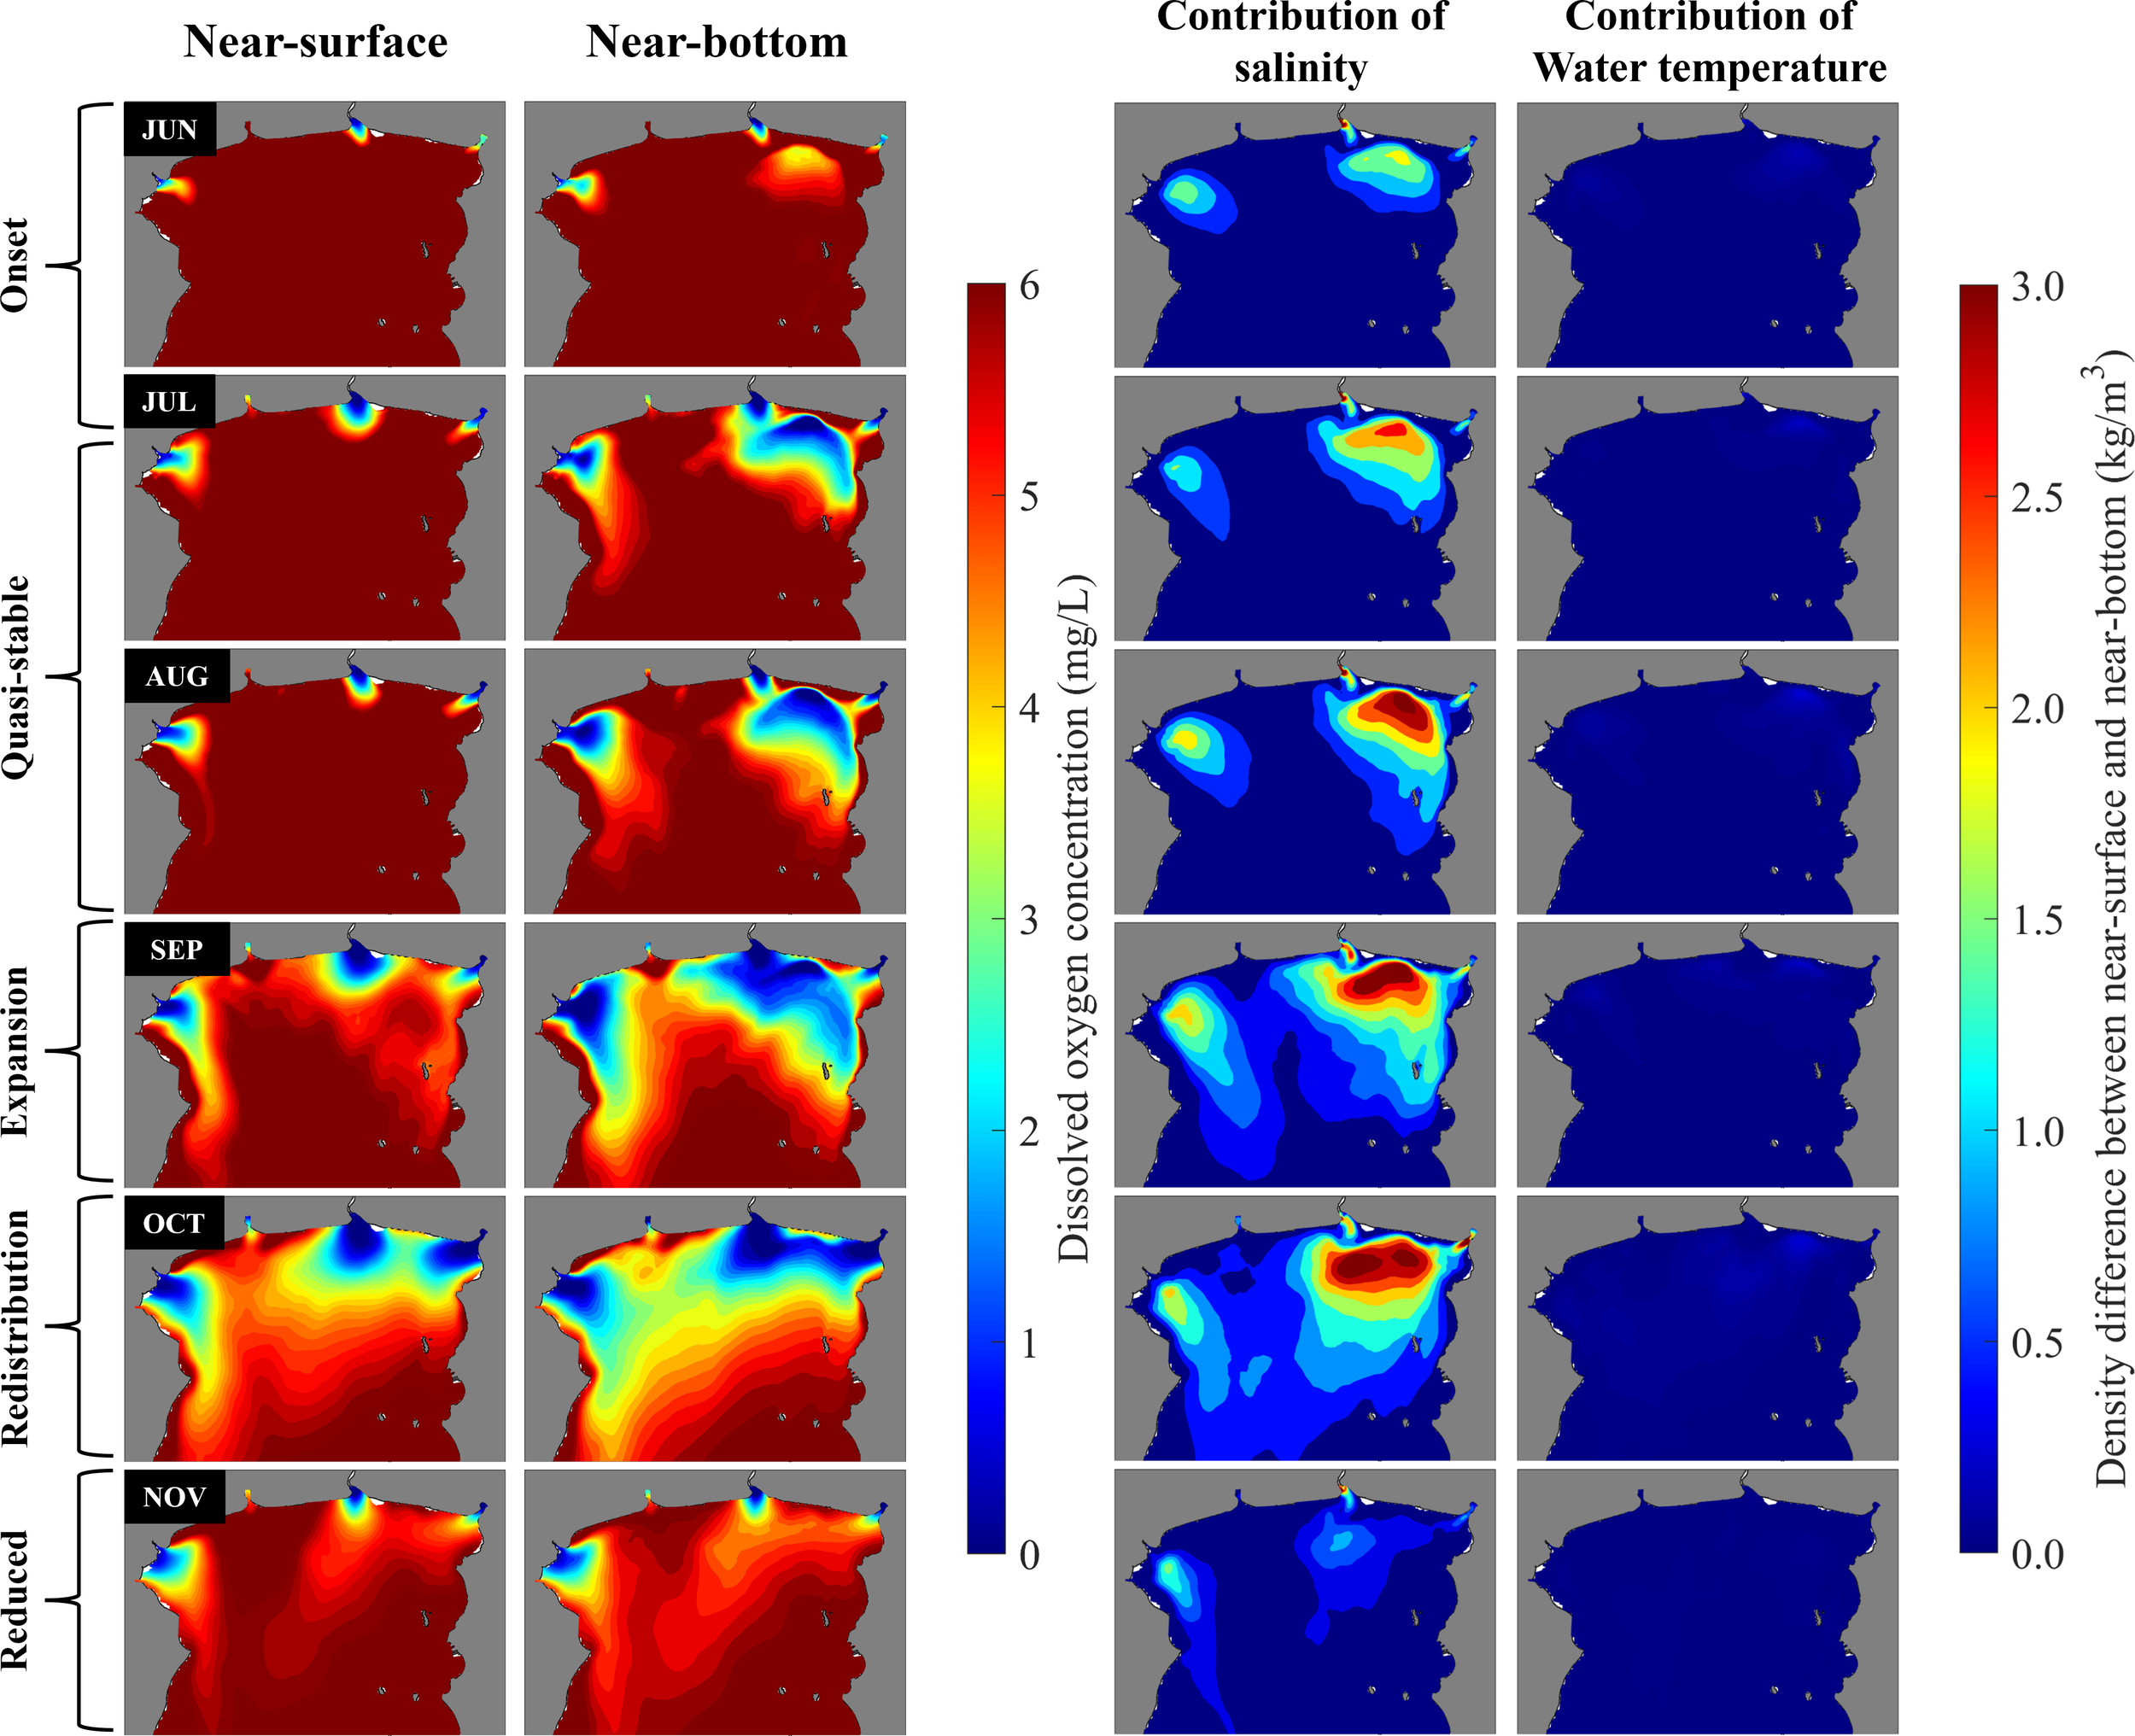
Monthly mean near-surface and near-bottom DO concentrations and the contributions of salinity and temperature differences between the surface and bottom layers to water density differences, based on model results from June to November 2020.
During the northeast monsoon (January–February), surface waters flow southwestward, forming a counterclockwise gyre (Figure 1A) with inflow along the eastern coast and outflow along the western coast, and the water column remains vertically well mixed. In March and April, weakened winds mark a transition period, during which the counterclockwise circulation weakens and weak thermal stratification begins to develop. By June, the southwest monsoon sets in, reversing the flow direction, with surface currents moving northeastward along the western coast. In June, the flow strengthens and a clockwise circulation develops, accompanied by increased river discharge and the onset of salinity-driven stratification. From July to September, the clockwise circulation intensifies, with pronounced halocline development, particularly north of 13°N. Surface waters enter from the southwest along the western boundary and exit along the eastern boundary, enhancing water transport into the northern UGoT. In October, river discharge reaches its peak and the monsoon transitions back to northeasterly winds; the clockwise circulation weakens and shifts toward a weak counterclockwise pattern. From November to December, river input decreases, air temperatures drop, and the water column—especially in the Siracha area—becomes vertically well mixed again, with a stable counterclockwise circulation reestablished.
3.4 Hypoxia development and fate at the UGoT
To investigate the dynamics of DO in the UGoT, we analyzed outputs from the validated coupled hydrodynamic–biochemical model developed in this study. Figure 6 shows the modeled monthly mean DO concentrations in the near-surface and near-bottom layers across the UGoT, whereas Figure 7 presents spatially averaged DO concentrations for the entire UGoT and separately for the eastern and western regions, incorporating all horizontal and vertical model grids. The results reveal pronounced spatial and temporal variability in DO, with a clear seasonal signature. DO concentrations are generally high (> 6.2 mg L-¹) from December to March, decrease slightly during April and May, increase again in June, and then decline rapidly from July to reach minimum values in October (< 5 mg L−¹), before recovering in November. During April and May, when water-column stratification is weak or absent, the slight decrease in DO is likely attributed to elevated water temperatures, which reduce oxygen solubility and enhance biological oxygen consumption through accelerated biomass mineralization. A more detailed investigation of these processes is warranted in future work. More importantly, the rapid DO decline from June onward is primarily associated with the development of water-column stratification driven by increased river discharge, together with enhanced oxygen consumption resulting from intensified phytoplankton biomass mineralization. Based on the combined evolution of stratification and DO conditions, hypoxia development in the UGoT can be classified into five progressive stages: (1) reduced extent, (2) onset, (3) quasi-stable, (4) expansion, and (5) redistribution.
Figure 7
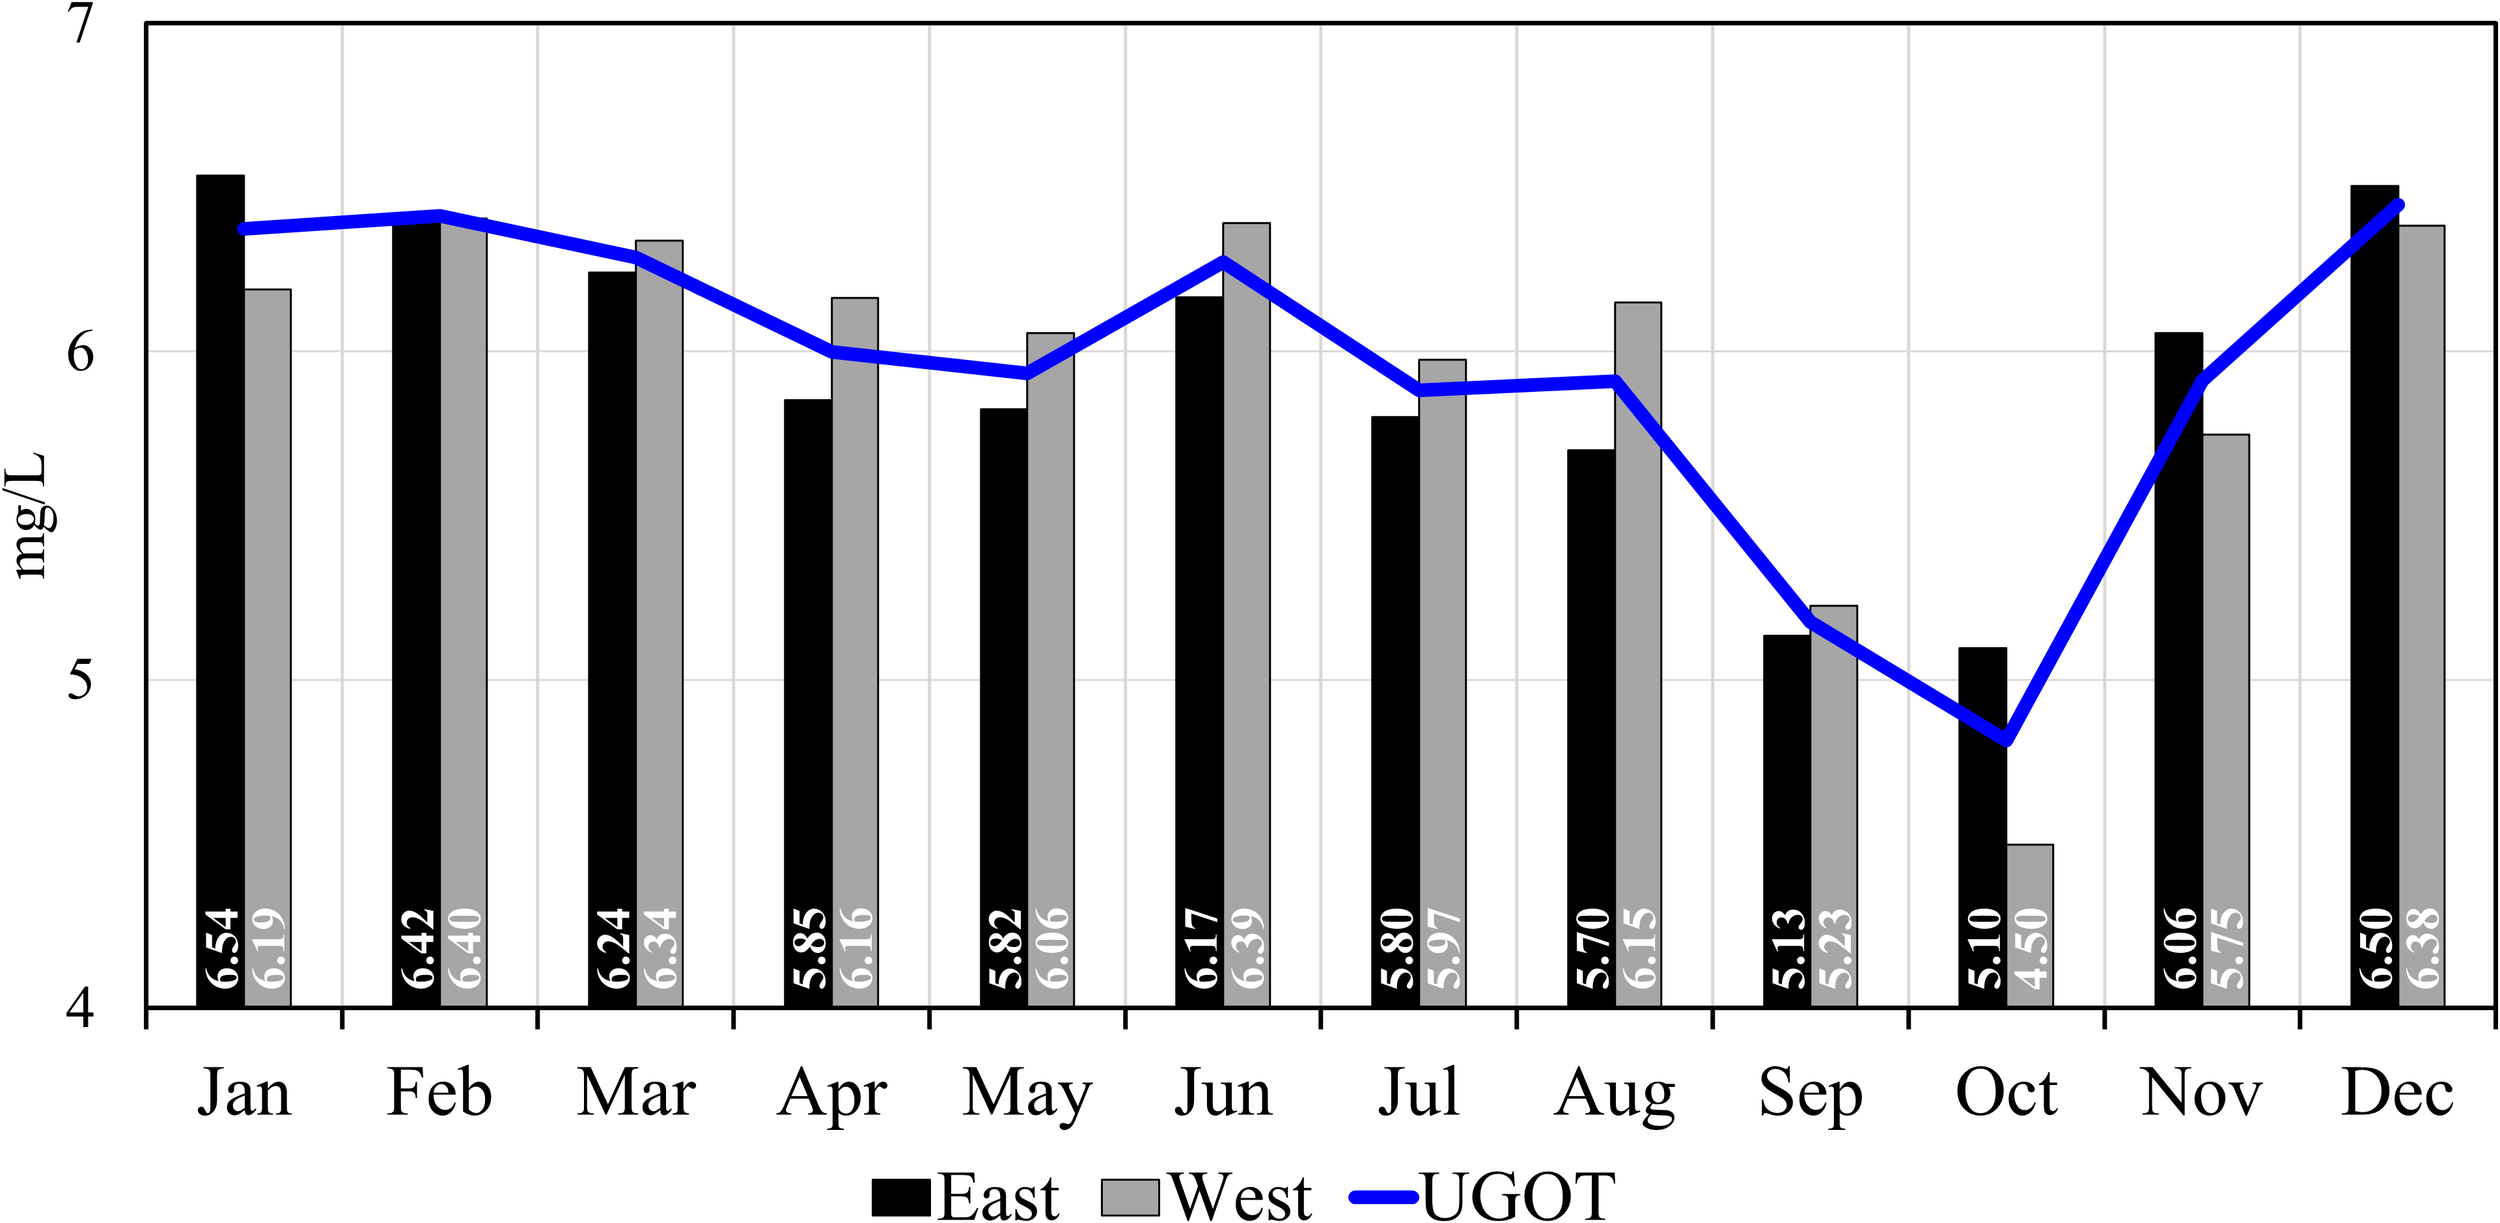
Monthly averaged DO concentrations over the entire UGoT, the eastern section, and the western section, based on horizontal and vertical averages of all model grid cells.
Although not shown here, the period from November to May represents the “reduced extent” state of hypoxia in the UGoT. During this phase, water-column stratification is minimal and DO concentrations remain relatively high throughout most areas and across the vertical water column. This period corresponds to the northeast monsoon and the first monsoon transition (April–May), when the water column is either well mixed or only weakly stratified due to thermal gradients. The reduced-extent phase is followed by the “onset” state of hypoxia in June and early July, during which hypoxia gradually develops and initially forms near river mouths and in deeper waters (~20 m) between the Chao Phraya River and the Bang Pakong River. This region is typically characterized by weak circulation and strong salinity-driven stratification (Figure 6). Although not shown here, field observations of bottom sediments indicate elevated concentrations of particulate organic matter and fine inorganic material, which promote enhanced oxygen consumption in both the water column and sediments. Together with stratification, these conditions favor hypoxia formation. Following the onset phase, the UGoT transitions into a “quasi-stable” state between July and August, during which the hypoxic volume remains relatively constant. DO concentrations in the lower water layers persistently range between 1 and 2 mg L−¹, whereas surface waters retain moderate DO levels of approximately 5–6 mg L−¹.
In September, the UGoT enters the “expansion” state. Increased freshwater input, together with elevated riverine nutrient and organic matter fluxes, intensifies water-column stratification and enhances DO consumption throughout the water column, leading to a rapid system-wide decline in DO. At the same time, strengthened salinity stratification suppresses vertical oxygen supply. These combined effects drive a rapid expansion of hypoxia, particularly in the Siracha region along the eastern UGoT, where the dominant clockwise circulation transports freshwater and reinforces halocline development (Figure 1). During this period, the Siracha area experienced mass fish mortalities and severe degradation of shellfish aquaculture. In October, the system transitions into the “redistribution” state. The monsoonal wind reverses direction, weakening the clockwise circulation and initiating a weak counterclockwise flow. Despite peak river discharge, freshwater becomes concentrated in the central UGoT, near and north of ~13°N, rather than extending into the Siracha area. Instead, offshore waters from the southern UGoT are advected toward the Siracha coast under the altered circulation pattern. These physical changes trigger hypoxia redistribution, with low-DO water masses shifting from the eastern to the western UGoT, guided by coastal currents and plume dynamics. As shown in Figure 7, mean DO increases in the eastern UGoT while declining in the western region. By November, reduced river discharge and atmospheric cooling weaken water-column stratification, and the UGoT returns to the “reduced extent” state of hypoxia.
3.5 Dissolved oxygen dynamics at the eUGoT
We applied the model results to investigate the mechanisms governing the observed DO dynamics in the eUGoT, with a focus on the Siracha area. Temporal contours of 25-h low-pass-filtered, depth-varying along-north–south flow velocity, salinity, and DO concentrations at the nearshore station (ST3) and offshore station (ST6) from August to October 2020 were analyzed together with wind and river discharge (Figure 8). Southwesterly winds prevailed during August–September, followed by the onset of northerly winds in early October, corresponding to the southwest monsoon and the second monsoon transition, respectively. Water levels exhibited mixed tides with tidal ranges of 1.5–3.2 m (Figure 8C, D).
Figure 8
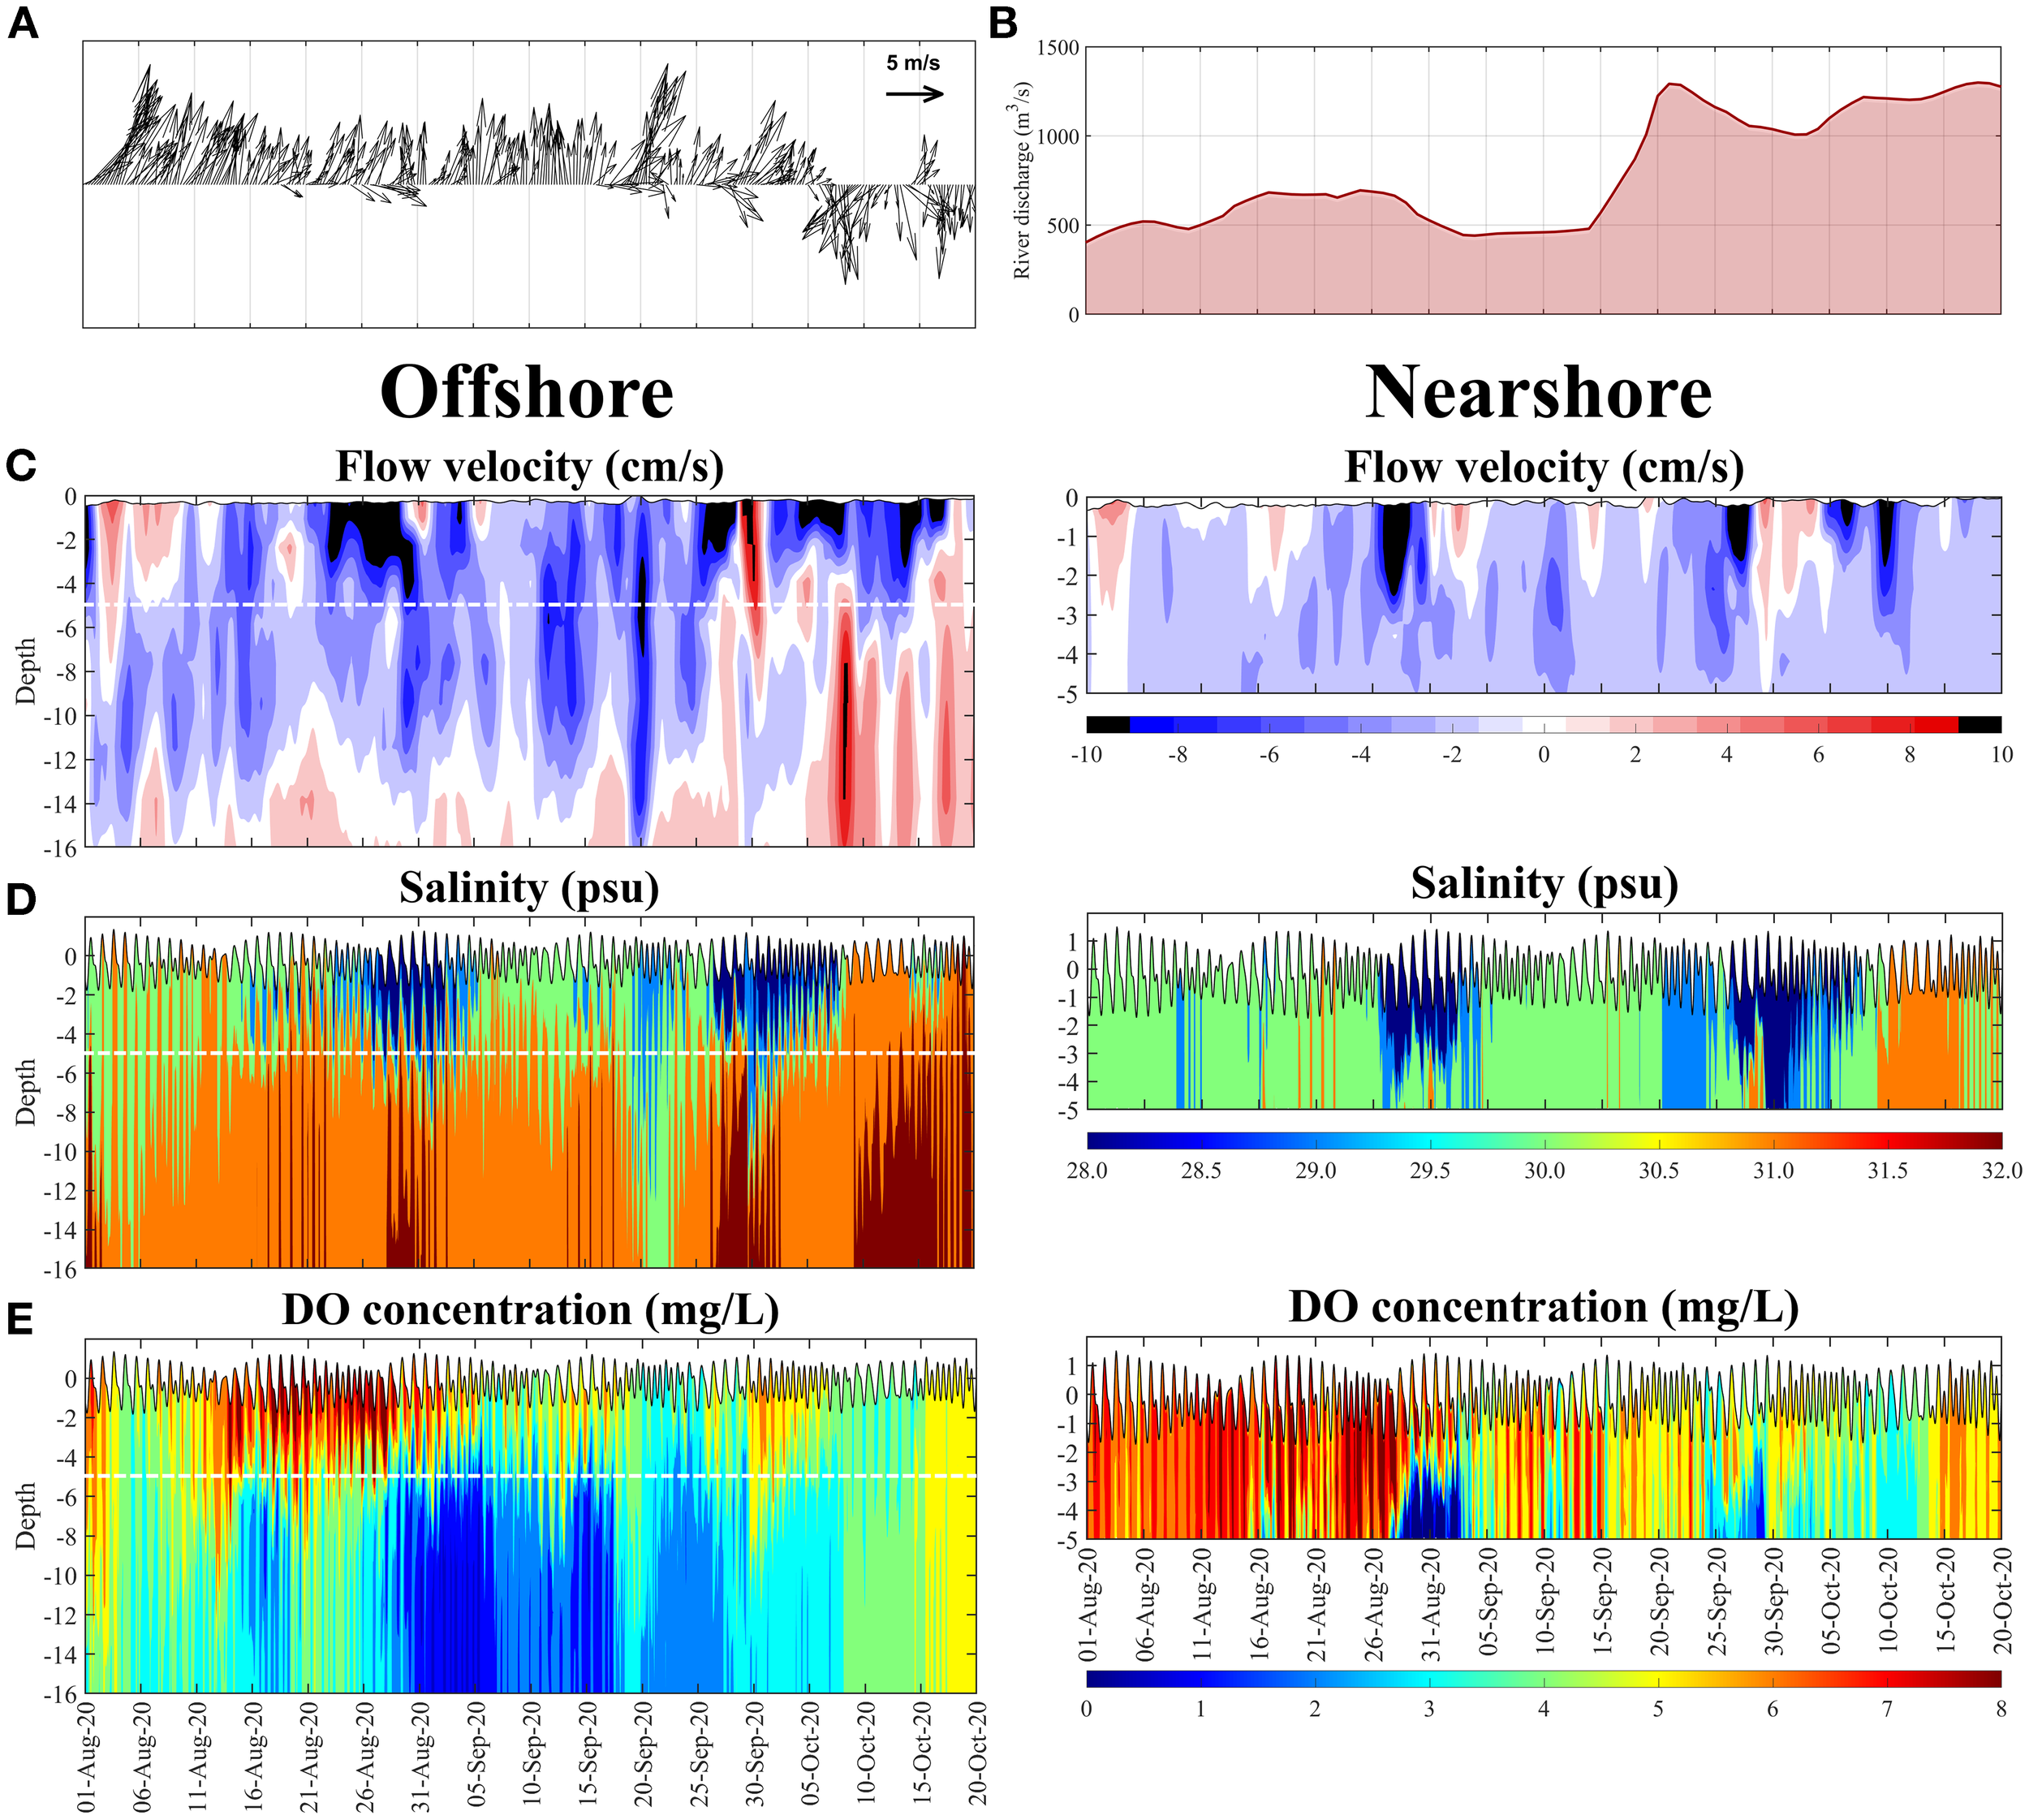
(A) Six-hourly measured wind from GOT001, (B) total river discharge to the UGoT, simulated results of depth-varying, (C) 25-h low-passed filtered north-south component of flow velocities, (D, E) salinity and DO concentration at offshore (ST04) station and at nearshore (GOT001) station.
Salinity and DO at both nearshore and offshore locations exhibited marked vertical and temporal variability. Two low-salinity episodes were observed near the surface at both stations during 21 August–4 September and 27 September–6 October 2020. Offshore hypoxia persisted in the lower water column from early August to early October. Notably, the lowest DO occurred at mid-depth during 14–17 August and near the surface during 9–14 October. Nearshore hypoxia first appeared in mid-August and, similar to offshore conditions, rapidly dissipated in mid-October following the wind reversal from southwest to northeast. The close correspondence between nearshore and offshore salinity and DO at identical depths indicates strong offshore control, with no consistent relationship between DO variability and river discharge during this period. These results indicate that hypoxia dynamics in the Siracha area are primarily regulated by offshore circulation and offshore water-mass properties. Tidal forcing drives north–south water transport and enhances vertical mixing, whereas wind forcing and density-driven flows control the two-layer circulation, with southward near-surface flow and northward near-bottom flow. Periods of large tidal range (>2 m), particularly during spring tides, intensify northward subsurface transport. At the offshore station, hypoxia follows the system-wide hypoxia evolution of the UGoT, transitioning from the quasi-stable state in August to the expansion state in September and the redistribution state in October, with the maximum hypoxic volume occurring in September.
Strong westerly wind events on 19 August, 26–28 August, 15–16 September, 21 September, and 26 September caused substantial near-surface salinity reductions, particularly offshore. Tidal currents influenced DO through two mechanisms: (1) transporting higher-salinity offshore bottom water toward Siracha and lifting low-salinity, low-DO coastal water to mid-depth, and (2) advecting low-salinity, low-DO water from the central UGoT toward Siracha. After 5 October, the shift to persistent northerly winds induced estuarine circulation along the eUGoT, with near-surface flow directed southward and near-bottom flow toward the coast. This circulation displaced hypoxic water toward the bay head and upward toward the surface, marking the termination of the seasonal hypoxia in the Siracha area. Similar wind-driven hypoxia dynamics have been reported for Tokyo Bay (Fujiwara and Yamada, 2002; Amunugama and Sasaki, 2018).
3.6 Physical and biochemical controls of the dissolved oxygen budget at the eUGoT
To quantify the relative contributions of physical and biochemical processes to the DO budget of the eUGoT, we conducted a series of numerical sensitivity experiments using five model scenarios in which key processes were selectively activated or suppressed. The scenarios included (1) a Control run, in which all processes were active; (2) a No-Reaeration run, in which air–sea gas exchange was disabled; (3) a No-Riverine Nutrient run, in which riverine inputs of NH4+, NO3−, and PO4³− were set to zero; (4) a No-Riverine POC run, in which riverine POC inputs were removed; and (5) a No-Tide run, in which tidal forcing was excluded from both the hydrodynamic and water-quality simulations. All simulations were initialized with identical initial conditions. Weekly, spatially averaged DO concentrations across all horizontal and vertical grids in the Siracha area (Figure 9A) were calculated and compared with the Control run to quantify relative DO changes for each scenario (Figure 9B).
Figure 9
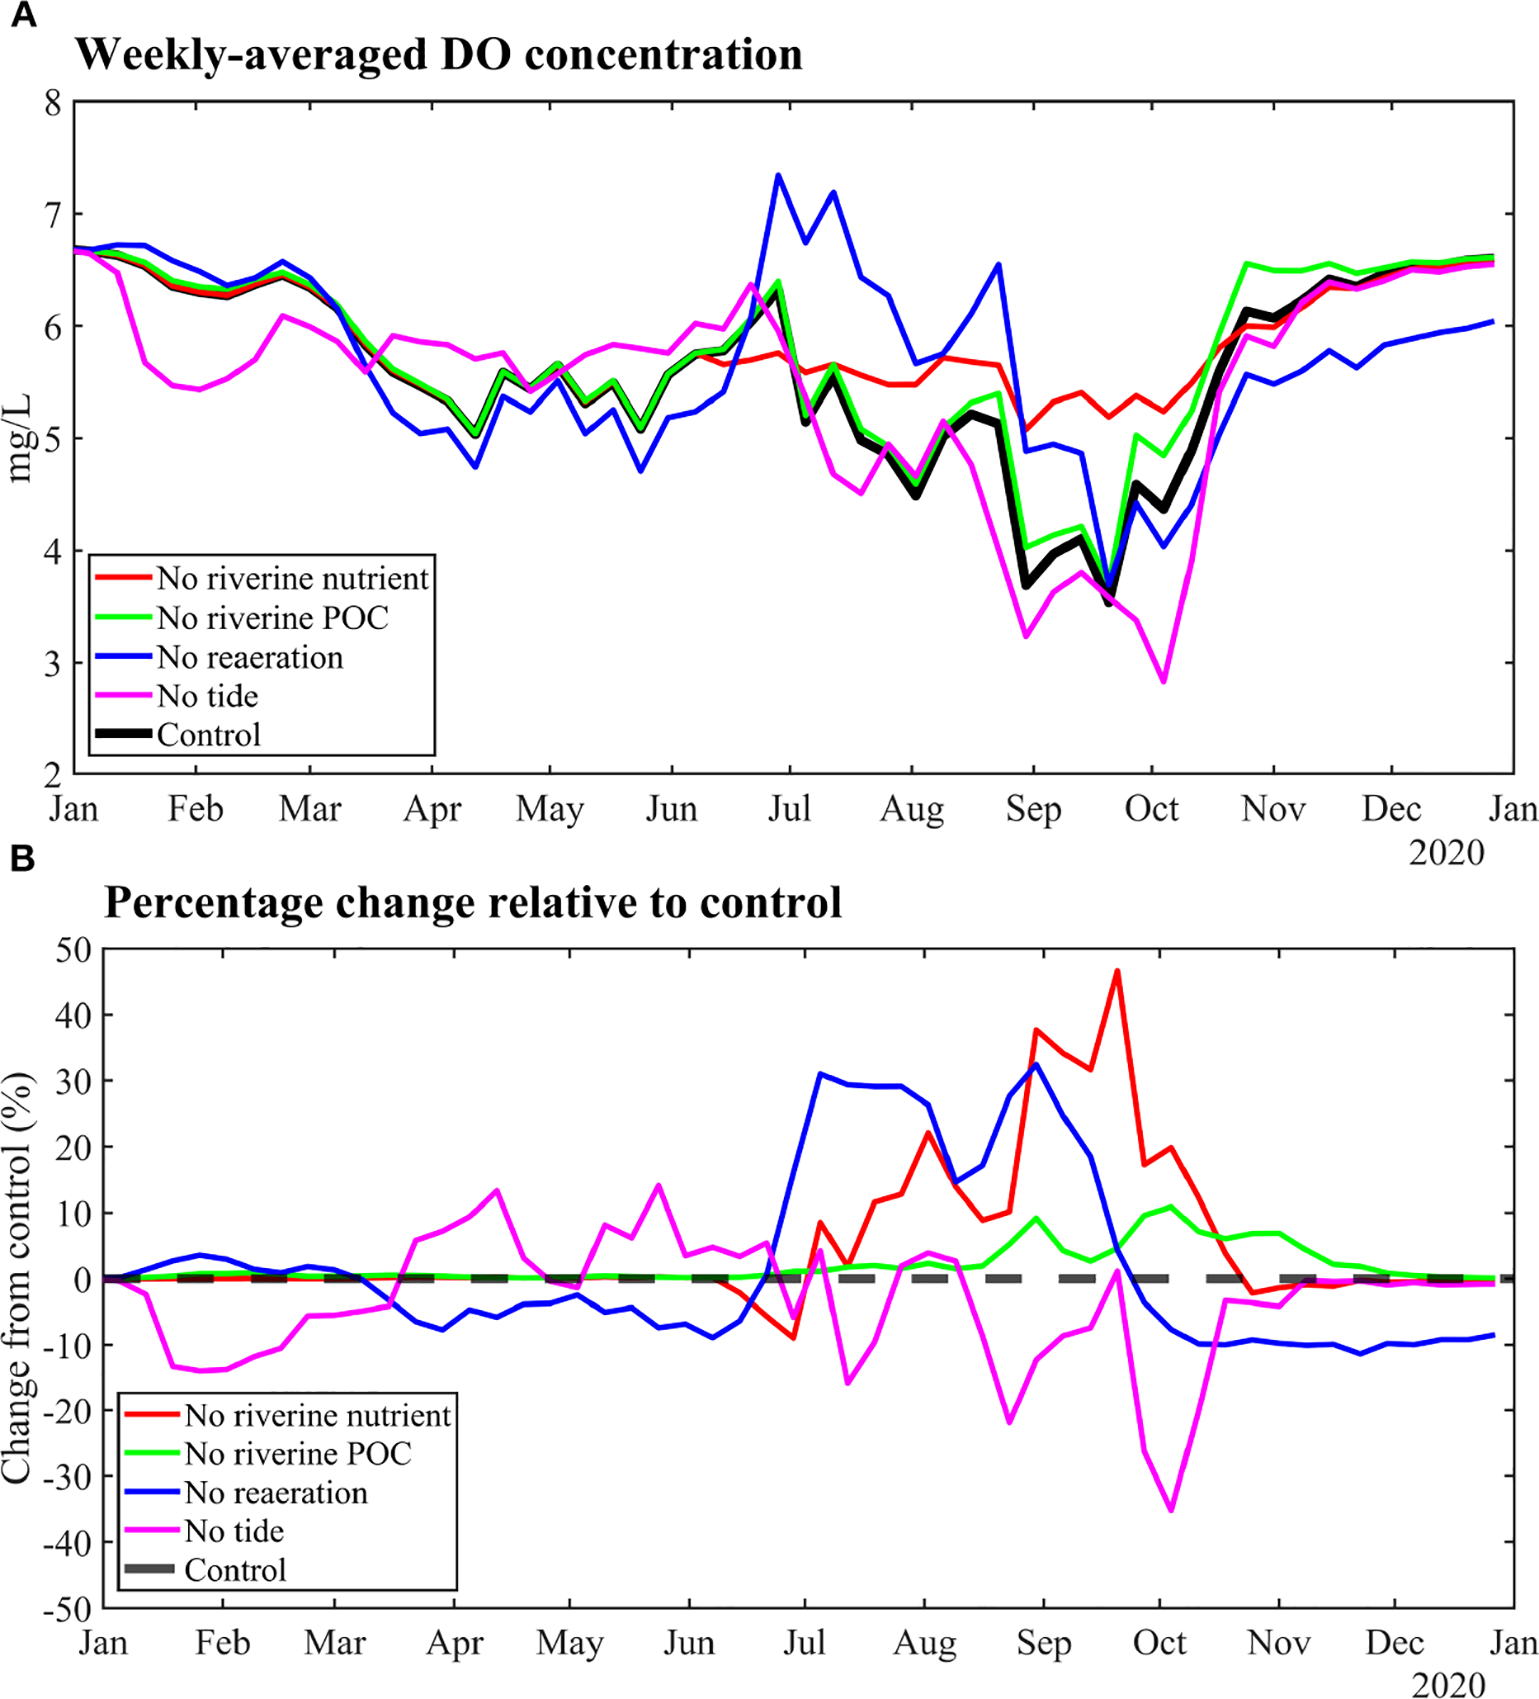
Comparisons between (A) weekly all-grid averaged DO concentration of control run and different scenario runs at the Siracha area and (B) corresponding percentage changes when compared with the control run during 2020.
The results reveal pronounced differences in DO responses among scenarios, indicating that each process contributes distinctly to DO regulation over time. The No-Riverine Nutrient scenario consistently produced higher DO concentrations, with a maximum increase of 46.61% in September and a minimum change of −8.94% in June, demonstrating the dominant role of nutrient inputs in driving oxygen consumption. The No-Reaeration scenario produced mixed responses, with DO increasing by up to 32.43% in August but decreasing by −11.36% in November, indicating that reaeration plays a seasonally dependent role. In contrast, removal of riverine POC produced a smaller and more uniform effect, with a maximum DO increase of 10.88% in October. The No-Tide scenario exhibited the most abrupt variability, with a DO increase of 14.09% in May and a sharp decline of −35.21% in October.
Overall, these experiments demonstrate that riverine nutrient inputs are the primary driver of the DO budget in the eUGoT, and their removal consistently enhances DO levels. Reaeration plays a secondary but critical role, particularly during low-oxygen periods. Tidal forcing, strongly influenced by the shallow bathymetry and large tidal range of the region, exerts a major control on DO by enhancing vertical mixing and advective exchange. In the absence of tides, the DO budget of the eUGoT generally deteriorates due to weakened water-column mixing and reduced offshore exchange. However, during April and May, DO increased in the No-Tide scenario, suggesting that tidal transport can episodically introduce low-DO waters from the central Upper Gulf into the eUGoT. These findings imply that effective hypoxia mitigation in the eUGoT should prioritize reduction of riverine nutrient loads, while also considering enhancement of reaeration and preservation of tidal mixing, particularly during the southwest monsoon.
4 Conclusions
This study successfully developed a numerical modeling framework for the UGoT and its eastern region (eUGoT), represented by the Siracha area, enabling a robust interpretation of DO dynamics and the key controlling factors governing the DO budget in both regions. The simulations revealed distinct developmental states of DO variability in the UGoT. In the eUGoT, the strong similarity between nearshore and offshore water properties indicates that nearshore DO conditions are strongly regulated by offshore processes. Wind forcing, particularly during the southwest monsoon, further modulates DO dynamics by altering cross-shore exchange. Strong onshore winds enhance downwelling circulation, promoting the intrusion of offshore hypoxic waters into coastal zones, whereas offshore-directed winds can suppress this transport or induce upwelling, depending on local bathymetry and wind stress. The interaction between tidal mixing and offshore intrusion generates a highly dynamic system in which DO fluctuates over short spatial and temporal scales. In nearshore environments, mixing not only ventilates the water column but may also resuspend organic-rich bottom waters, thereby increasing oxygen demand. Our results highlight the coupled and interdependent roles of physical and biochemical processes in regulating DO in the eUGoT. River discharge, tidal mixing, and reaeration were identified as the dominant controls on DO dynamics and the overall oxygen budget. These findings emphasize the necessity of explicitly accounting for both physical forcing and biochemical processes when assessing hypoxia risk in coastal systems such as the eUGoT. Accurate numerical modeling must therefore resolve both short-term variability driven by tides and winds, and longer-term changes associated with anthropogenic nutrient loading and climate variability.
The primary objective of this study was to establish a baseline understanding of the complex interactions between physical and biochemical processes components governing eutrophication and hypoxia in the UGoT. Owing to limitations in several critical input datasets—particularly river discharge, riverine nutrient loads, sediment–water interactions, and offshore boundary conditions—we focused on elucidating how tidal variability and seasonal modulation of river discharge regulate hypoxia development. Future work will involve expanded field measurements and targeted numerical experiments to resolve the mechanistic processes underlying key observed features. A major next step is to improve the model’s ability to reproduce the May phytoplankton bloom by incorporating non-riverine nutrient sources and refining the representation of biochemical processes at GOT001 and across the UGoT. We further hypothesize that enhancing the treatment of sediment–water interactions will substantially improve hypoxia simulations, as benthic processes have been identified as major regulators of oxygen dynamics in many coastal embayment worldwide (Amunugama and Sasaki, 2018). In addition, submarine groundwater discharge, identified by Burnett et al. (2007) as a potential nutrient source to the UGoT, should be explicitly evaluated in future numerical investigations for its role in hypoxia development.
Finally, the results underscore the critical need for systematic, continuous monitoring of river discharge and nutrient inputs. The present reliance on manually adjusted discharge and nutrient data introduces unavoidable uncertainty and limits model reproducibility. Long-term, high-frequency observational programs are therefore essential to improve prediction accuracy and to support effective management strategies for mitigating hypoxia in the UGoT.
Statements
Data availability statement
The original contributions presented in the study are included in the article/Supplementary Material. Further inquiries can be directed to the corresponding author.
Author contributions
PK: Visualization, Validation, Methodology, Data curation, Software, Investigation, Writing – original draft, Formal analysis. TP: Conceptualization, Investigation, Resources, Funding acquisition, Validation, Writing – review & editing, Methodology, Supervision, Project administration. KK: Investigation, Data curation, Resources, Writing – review & editing. CC: Conceptualization, Investigation, Supervision, Validation, Writing – review & editing, Formal Analysis.
Funding
The author(s) declared that financial support was not received for this work and/or its publication.
Acknowledgments
This study was supported by the projects “Development of a Hydrodynamic Model and Early Warning System for the Gulf of Thailand: Phase 2” and “Ocean Forecast Modeling and Early Warning System for the Gulf of Thailand: Phase 3 – Water Quality Modeling in the Upper Gulf of Thailand,”, funded by the Hydro-Informatics Institute (Public Organization) and the Siracha Fisheries Research Station. We also gratefully acknowledge the Estuarine and Coastal Dynamic Modeling Laboratory (ECDM) and the Department of Marine Science, Faculty of Fisheries, Kasetsart University, for providing equipment and laboratory facilities.
Conflict of interest
The authors declared that this work was conducted in the absence of any commercial or financial relationships that could be construed as a potential conflict of interest.
Generative AI statement
The author(s) declare that Generative AI was used in the creation of this manuscript. Generative AI (ChatGPT, OpenAI, GPT-5) was used to support language editing and grammar correction.
Any alternative text (alt text) provided alongside figures in this article has been generated by Frontiers with the support of artificial intelligence and reasonable efforts have been made to ensure accuracy, including review by the authors wherever possible. If you identify any issues, please contact us.
Correction note
A correction has been made to this article. Details can be found at: 10.3389/fmars.2026.1786090.
Publisher’s note
All claims expressed in this article are solely those of the authors and do not necessarily represent those of their affiliated organizations, or those of the publisher, the editors and the reviewers. Any product that may be evaluated in this article, or claim that may be made by its manufacturer, is not guaranteed or endorsed by the publisher.
Supplementary material
The Supplementary Material for this article can be found online at: https://www.frontiersin.org/articles/10.3389/fmars.2025.1708069/full#supplementary-material
References
1
Alfieri L. Burek P. Dutra E. Krzeminski B. Muraro D. Thielen J. et al . (2013). GloFAS–global ensemble streamflow forecasting and flood early warning. Hydrol. Earth Syst. Sci.17, 1161–1175. doi: 10.5194/hess-17-1161-2013
2
Alosairi Y. Alsulaiman N. (2019). Hydro-environmental processes governing the formation of hypoxic parcels in an inverse estuarine water body: Model validation and discussion. Mar. pollut. Bull.144, 92–104. doi: 10.1016/j.marpolbul.2019.04.067
3
Amunugama M. Sasaki J. (2018). Numerical modeling of long-term biogeochemical processes and its application to sedimentary bed formation in Tokyo Bay. Water10, 572. doi: 10.3390/w10050572
4
Anongponyoskun M. Tharapan S. Intarachart A. Doydee P. Sojisuporn P. (2012). Dissolved oxygen dispersion model within green mussel farming area in sri racha bay, chonburi province, Thailand. Agric. Natural Resour.46, 565–572.
5
Buranapratheprat A. Luadnakrob P. Yanagi T. Morimoto A. Qiao F. (2016). The modification of water column conditions in the Gulf of Thailand by the influences of the South China Sea and monsoonal winds. Continent. Shelf. Res.118, 100–110. doi: 10.1016/j.csr.2016.02.016
6
Buranapratheprat A. Morimoto A. Phromkot P. Mino Y. Gunbua V. Jintasaeranee P. (2021). Eutrophication and hypoxia in the upper Gulf of Thailand. J. Oceanogr.77, 831–841. doi: 10.1007/s10872-021-00609-2
7
Buranapratheprat A. Yanagi T. Boonphakdee T. Sawangwong P. (2002). Seasonal variations in inorganic nutrient budgets of the bangpakong estuary, Thailand. J. Oceanogr.58, 557–564. doi: 10.1023/A:1021214726762
8
Buranapratheprat A. Yanagi T. Niemann K. Matsumura S. Sojisuporn P. (2008). Surface chlorophyll-a dynamics in the Upper Gulf of Thailand revealed by a coupled hydrodynamic-ecosystem model. J. Oceanogr.64, 639–656. doi: 10.1007/s10872-008-0054-9
9
Buranapratheprat A. Yanagi T. Sojisuporn P. Chinorost B. (2006). Influence of local wind field on seasonal circulations in the upper Gulf of Thailand. Coastal Mar. Sci.30, 19–26.
10
Burchard H. Baumert H. (1995). On the performance of a mixed-layer model based on the k-epsilon closure. J. Geophys. Res. - Oceans.100, 8523–8540. doi: 10.1029/94JC03229
11
Burnett W. C. Wattayakorn G. Taniguchi M. Dulaiova H. Sojisuporn P. Rungsupa S. et al . (2007). Groundwater-derived nutrient inputs to the Upper Gulf of Thailand. Continent. Shelf. Res.27, 176–190. doi: 10.1016/j.csr.2006.09.006
12
Conley D. J. Carstensen J. Aigars J. Axe P. Bonsdorff E. Eremina T. et al . (2011). Hypoxia is increasing in the coastal zone of the Baltic Sea. Environ. Sci. Technol.45, 6777–6783. doi: 10.1021/es201212r
13
Dai M. Zhao Y. Chai F. Chen M. Chen N. Chen Y. et al . (2023). Persistent eutrophication and hypoxia in the coastal ocean. Cambridge. Prisms.: Coast. Futures.1, e19. doi: 10.1017/cft.2023.7
14
Delhez E. J. Grégoire M. Nihoul J. C. Beckers J.-M. (1999). Dissection of the GHER turbulence closure scheme. J. Mar. Syst.21, 379–397. doi: 10.1016/S0924-7963(99)00023-8
15
Deltares (2003). Delft3D-WAQ: Technical reference manual (The Netherlands: WL| Delft Hydraulics).
16
Deltares (2014). Delft3D-FLOW simulation of multi-dimensional hydrodynamic flows and transport phenomena including sediments, user manual (The Netherlands: Deltares Delft).
17
Diaz R. J. (2001). Overview of hypoxia around the world. J. Environ. Qual.30, 275–281. doi: 10.2134/jeq2001.302275x
18
Diaz R. J. Rosenberg R. (2008). Spreading dead zones and consequences for marine ecosystems. Science321, 926–929. doi: 10.1126/science.1156401
19
Fujiwara T. Yamada Y. (2002). Inflow of oceanic water into Tokyo Bay and generation of a subsurface hypoxic water mass. J. Geophys. Res.107, 13–11-13-19. doi: 10.1029/2000JC000749, 2002
20
Guo J. Qu D. Zhang Z. Sangmanee C. Chanthasiri N. Guo B. (2021). Thermohaline conditions and circulation in the Gulf of Thailand during the northeast monsoon. Continent. Shelf. Res.225, 104487. doi: 10.1016/j.csr.2021.104487
21
Hao L. Sanada A. Chi B. Xiong B. Maruya Y. Yano S. (2024). Long-term developments in seasonal hypoxia and response to climate change: A three-decade modeling study in the Ariake Sea, Japan. Sci. Total. Environ.929, 172471. doi: 10.1016/j.scitotenv.2024.172471
22
Hersbach H. Bell B. Berrisford P. Hirahara S. Horányi A. Muñoz-Sabater J. et al . (2020). The ERA5 global reanalysis. Q. J. R. Meteorol Soc.146, 1999–2049. doi: 10.1002/qj.3803
23
Los H. (2009). Eco-hydrodynamic modelling of primary production in coastal waters and lakes using BLOOM ( Ios Press). Available at: https://books.google.co.th/books?id=wBH0w9Dp9_wC.
24
Morimoto A. Mino Y. Buranapratheprat A. Kaneda A. Tong-U-Dom S. Sunthawanic K. et al . (2021). Hypoxia in the Upper Gulf of Thailand: Hydrographic observations and modeling. J. Oceanogr.77, 859–877. doi: 10.1007/s10872-021-00616-3
25
Phattananuruch K. Pokavanich T. (2024). Monsoon-driven dispersal of river-sourced floating marine debris in tropical semi-enclosed waters: A case study in the gulf of Thailand. J. Mar. Sci. Eng.12, 2258. doi: 10.3390/jmse12122258
26
Pokavanich T. Guo X. (2024). Saltwater intrusion in Chao Phraya Estuary: A long, narrow and meandering partially mixed estuary influenced by water regulation and abstraction. J. Hydrol.: Regional. Stud.52, 101686. doi: 10.1016/j.ejrh.2024.101686
27
Saramul S. Ezer T. (2014). On the dynamics of low latitude, wide and shallow coastal system: numerical simulations of the Upper Gulf of Thailand. Ocean. Dynamics.64, 557–571. doi: 10.1007/s10236-014-0703-z
28
Uthaipan K. Yuan Z. Zhao Y. Intararuang W. Vasinamekhin V. Sangmanee C. et al . (2025). Spatiotemporal variations in socioeconomic and hydrological factors impacting water quality in Thailand’s major rivers. Ecosyst. Health Sustainabil.11, 0345. doi: 10.34133/ehs.0345
29
Van der Werf J. (2009). Hydrodynamic Validation of Delft3D using Data from the SandyDuck97 Experiments (Delft: Deltares).
30
Vaquer-Sunyer R. Duarte C. M. (2008). Thresholds of hypoxia for marine biodiversity. Proc. Natl. Acad. Sci.105, 15452–15457. doi: 10.1073/pnas.0803833105
31
Wang A. Guo X. Morimoto A. Maetani K. Tanoue R. Tong U. D. S. et al . (2021). Transport and dilution of fluvial antibiotic in the Upper Gulf of Thailand. Environ. pollut.288, 117779. doi: 10.1016/j.envpol.2021.117779
32
Yanagi T. Sachoemar S. I. Takao T. Fujiwara S. (2001). Seasonal variation of stratification in the gulf of Thailand. J. Oceanogr.57, 461–470. doi: 10.1023/A:1021237721368
33
Yanagi T. Takao T. (1998). Seasonal variation of three-dimensional circulations in the Gulf of Thailand. La. mer.36, 43–55.s.
Summary
Keywords
hydrodynamic model, hypoxic model, monsoon, riverine nutrients, stratification
Citation
Kaewkhong P, Pokavanich T, Khaodon K and Charoenpong C (2026) Physico-biochemical controls on dissolved oxygen dynamics in the Eastern Upper Gulf of Thailand: field observations and numerical modeling. Front. Mar. Sci. 12:1708069. doi: 10.3389/fmars.2025.1708069
Received
18 September 2025
Revised
04 December 2025
Accepted
04 December 2025
Published
06 January 2026
Corrected
03 February 2026
Volume
12 - 2025
Edited by
Haosheng Huang, Louisiana State University, United States
Reviewed by
Zhixuan Feng, East China Normal University, China
Muhammad Abdur Rouf, Khulna University, Bangladesh
Updates
Copyright
© 2026 Kaewkhong, Pokavanich, Khaodon and Charoenpong.
This is an open-access article distributed under the terms of the Creative Commons Attribution License (CC BY). The use, distribution or reproduction in other forums is permitted, provided the original author(s) and the copyright owner(s) are credited and that the original publication in this journal is cited, in accordance with accepted academic practice. No use, distribution or reproduction is permitted which does not comply with these terms.
*Correspondence: Tanuspong Pokavanich, ffistop@ku.ac.th
Disclaimer
All claims expressed in this article are solely those of the authors and do not necessarily represent those of their affiliated organizations, or those of the publisher, the editors and the reviewers. Any product that may be evaluated in this article or claim that may be made by its manufacturer is not guaranteed or endorsed by the publisher.