There was a mistake in Figure 1 as published. The legend explaining the symbols in the figure was incomplete. The corrected Figure 1 appears below.
Figure 1
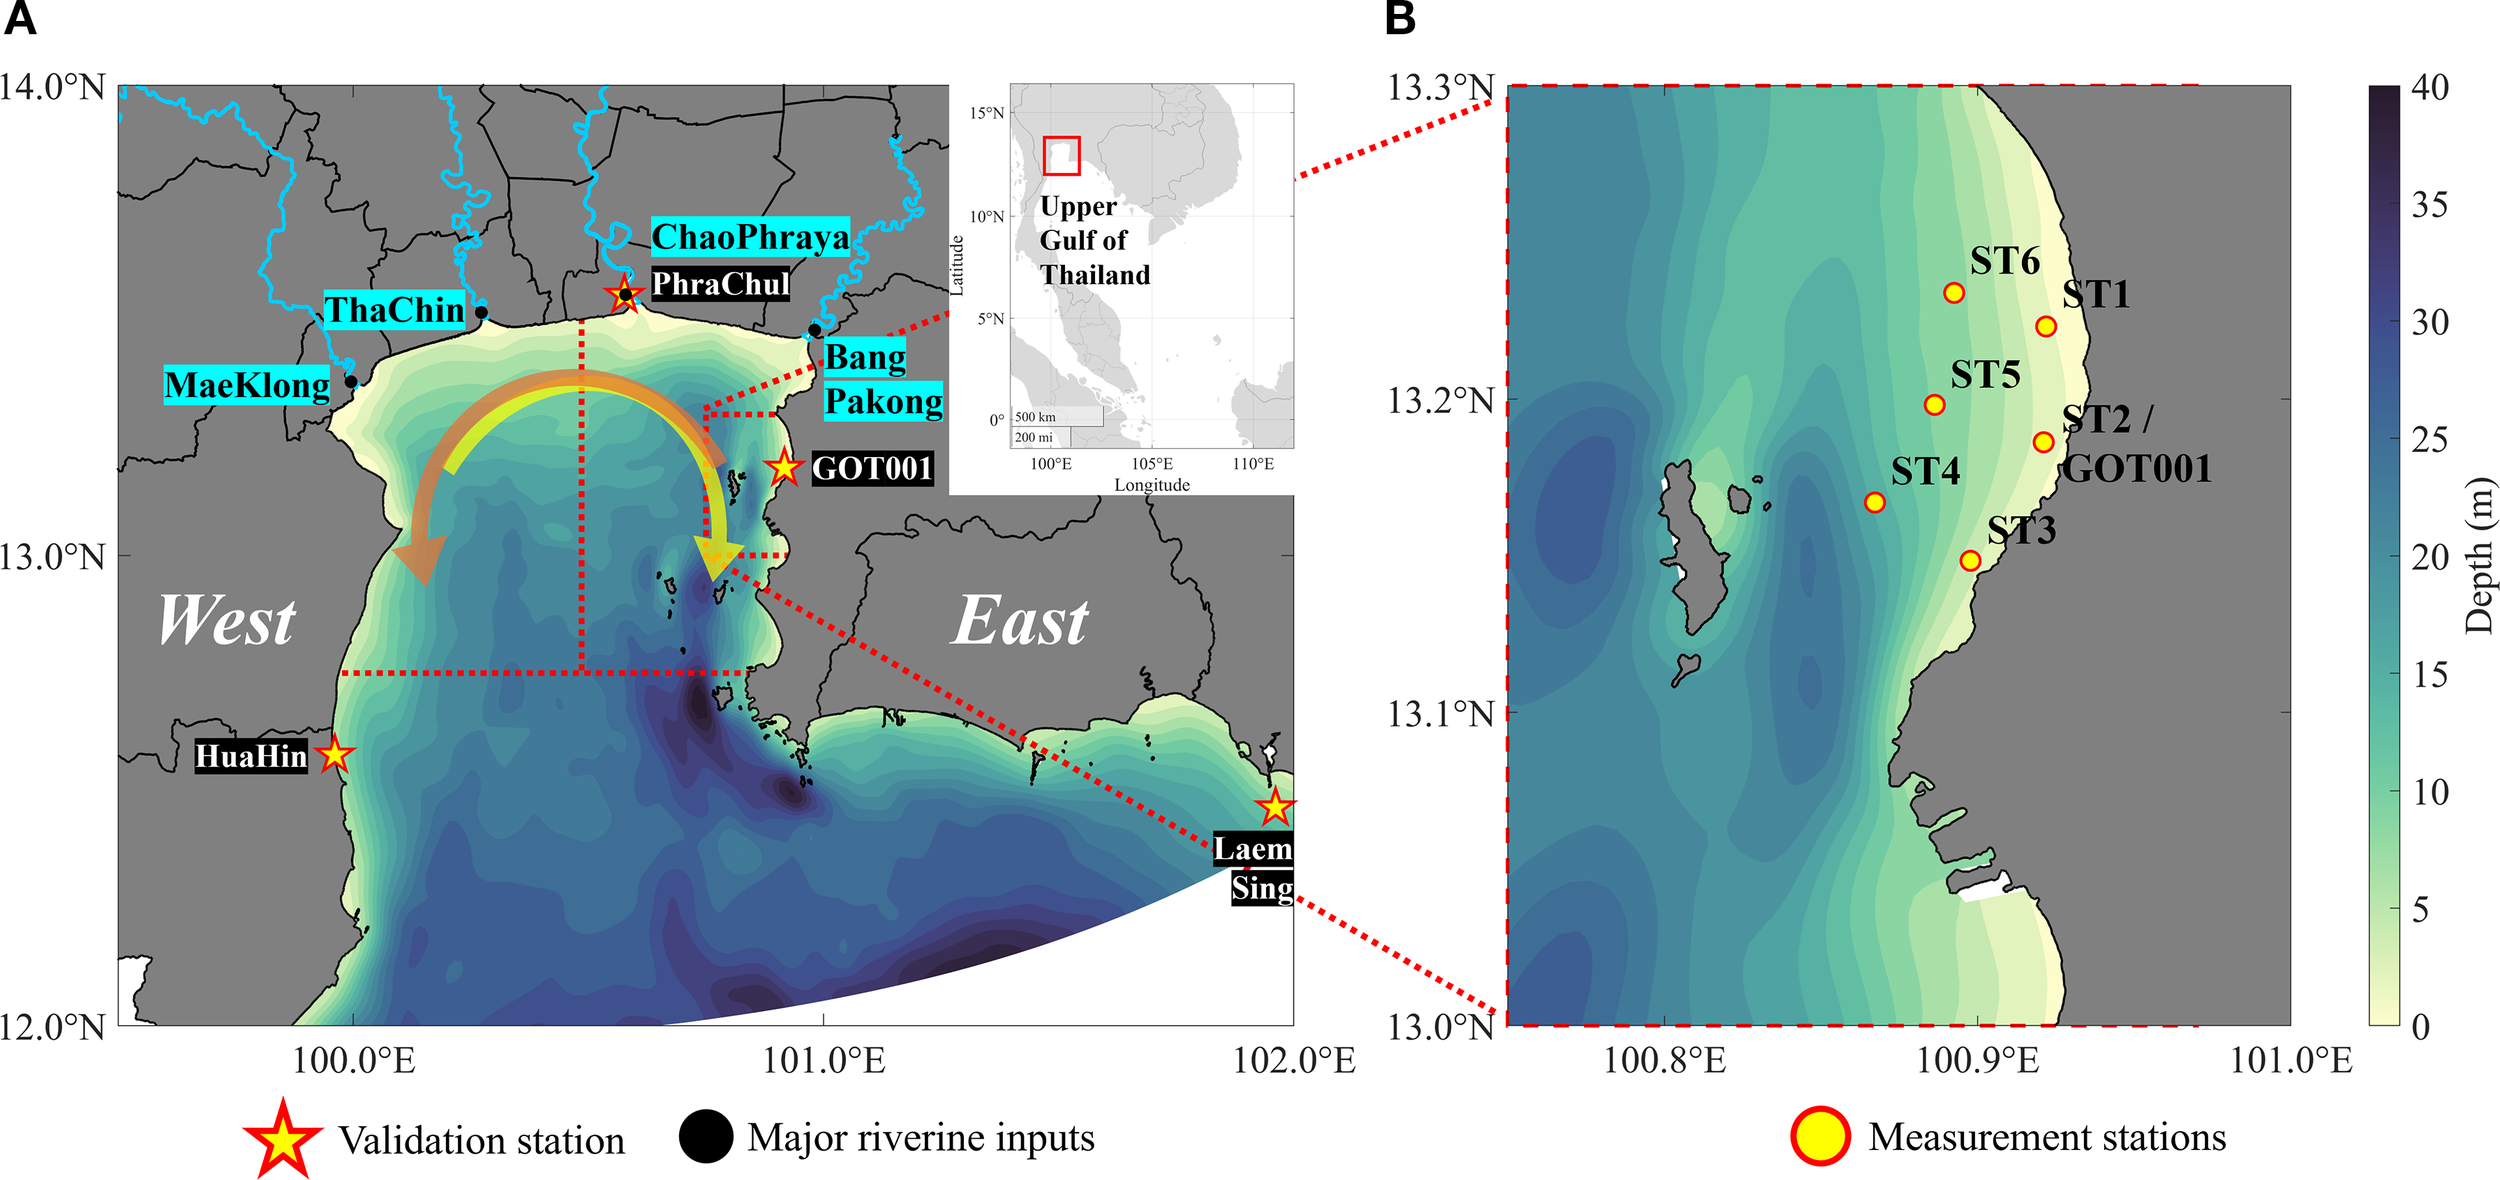
Map of the Upper Gulf of Thailand (UGoT) showing (A) the study area, major riverine inputs (Bang Pakong, Chao Phraya, Tha Chin, and Mae Klong), the location of the GOT001 station, and the 6-monthly sampling stations. The red dashed boxes denote the western and eastern subregions of the UGoT. The yellow arrow indicates the prevailing clockwise circulation during the southwest monsoon, whereas the orange arrows represent circulation during the northeast monsoon. (B) Siracha area, which is the focus of this study.
There was a mistake in Figure 9 as published. A black horizontal bar dividing panels A and B has been removed. The corrected Figure 9 appears below.
Figure 9
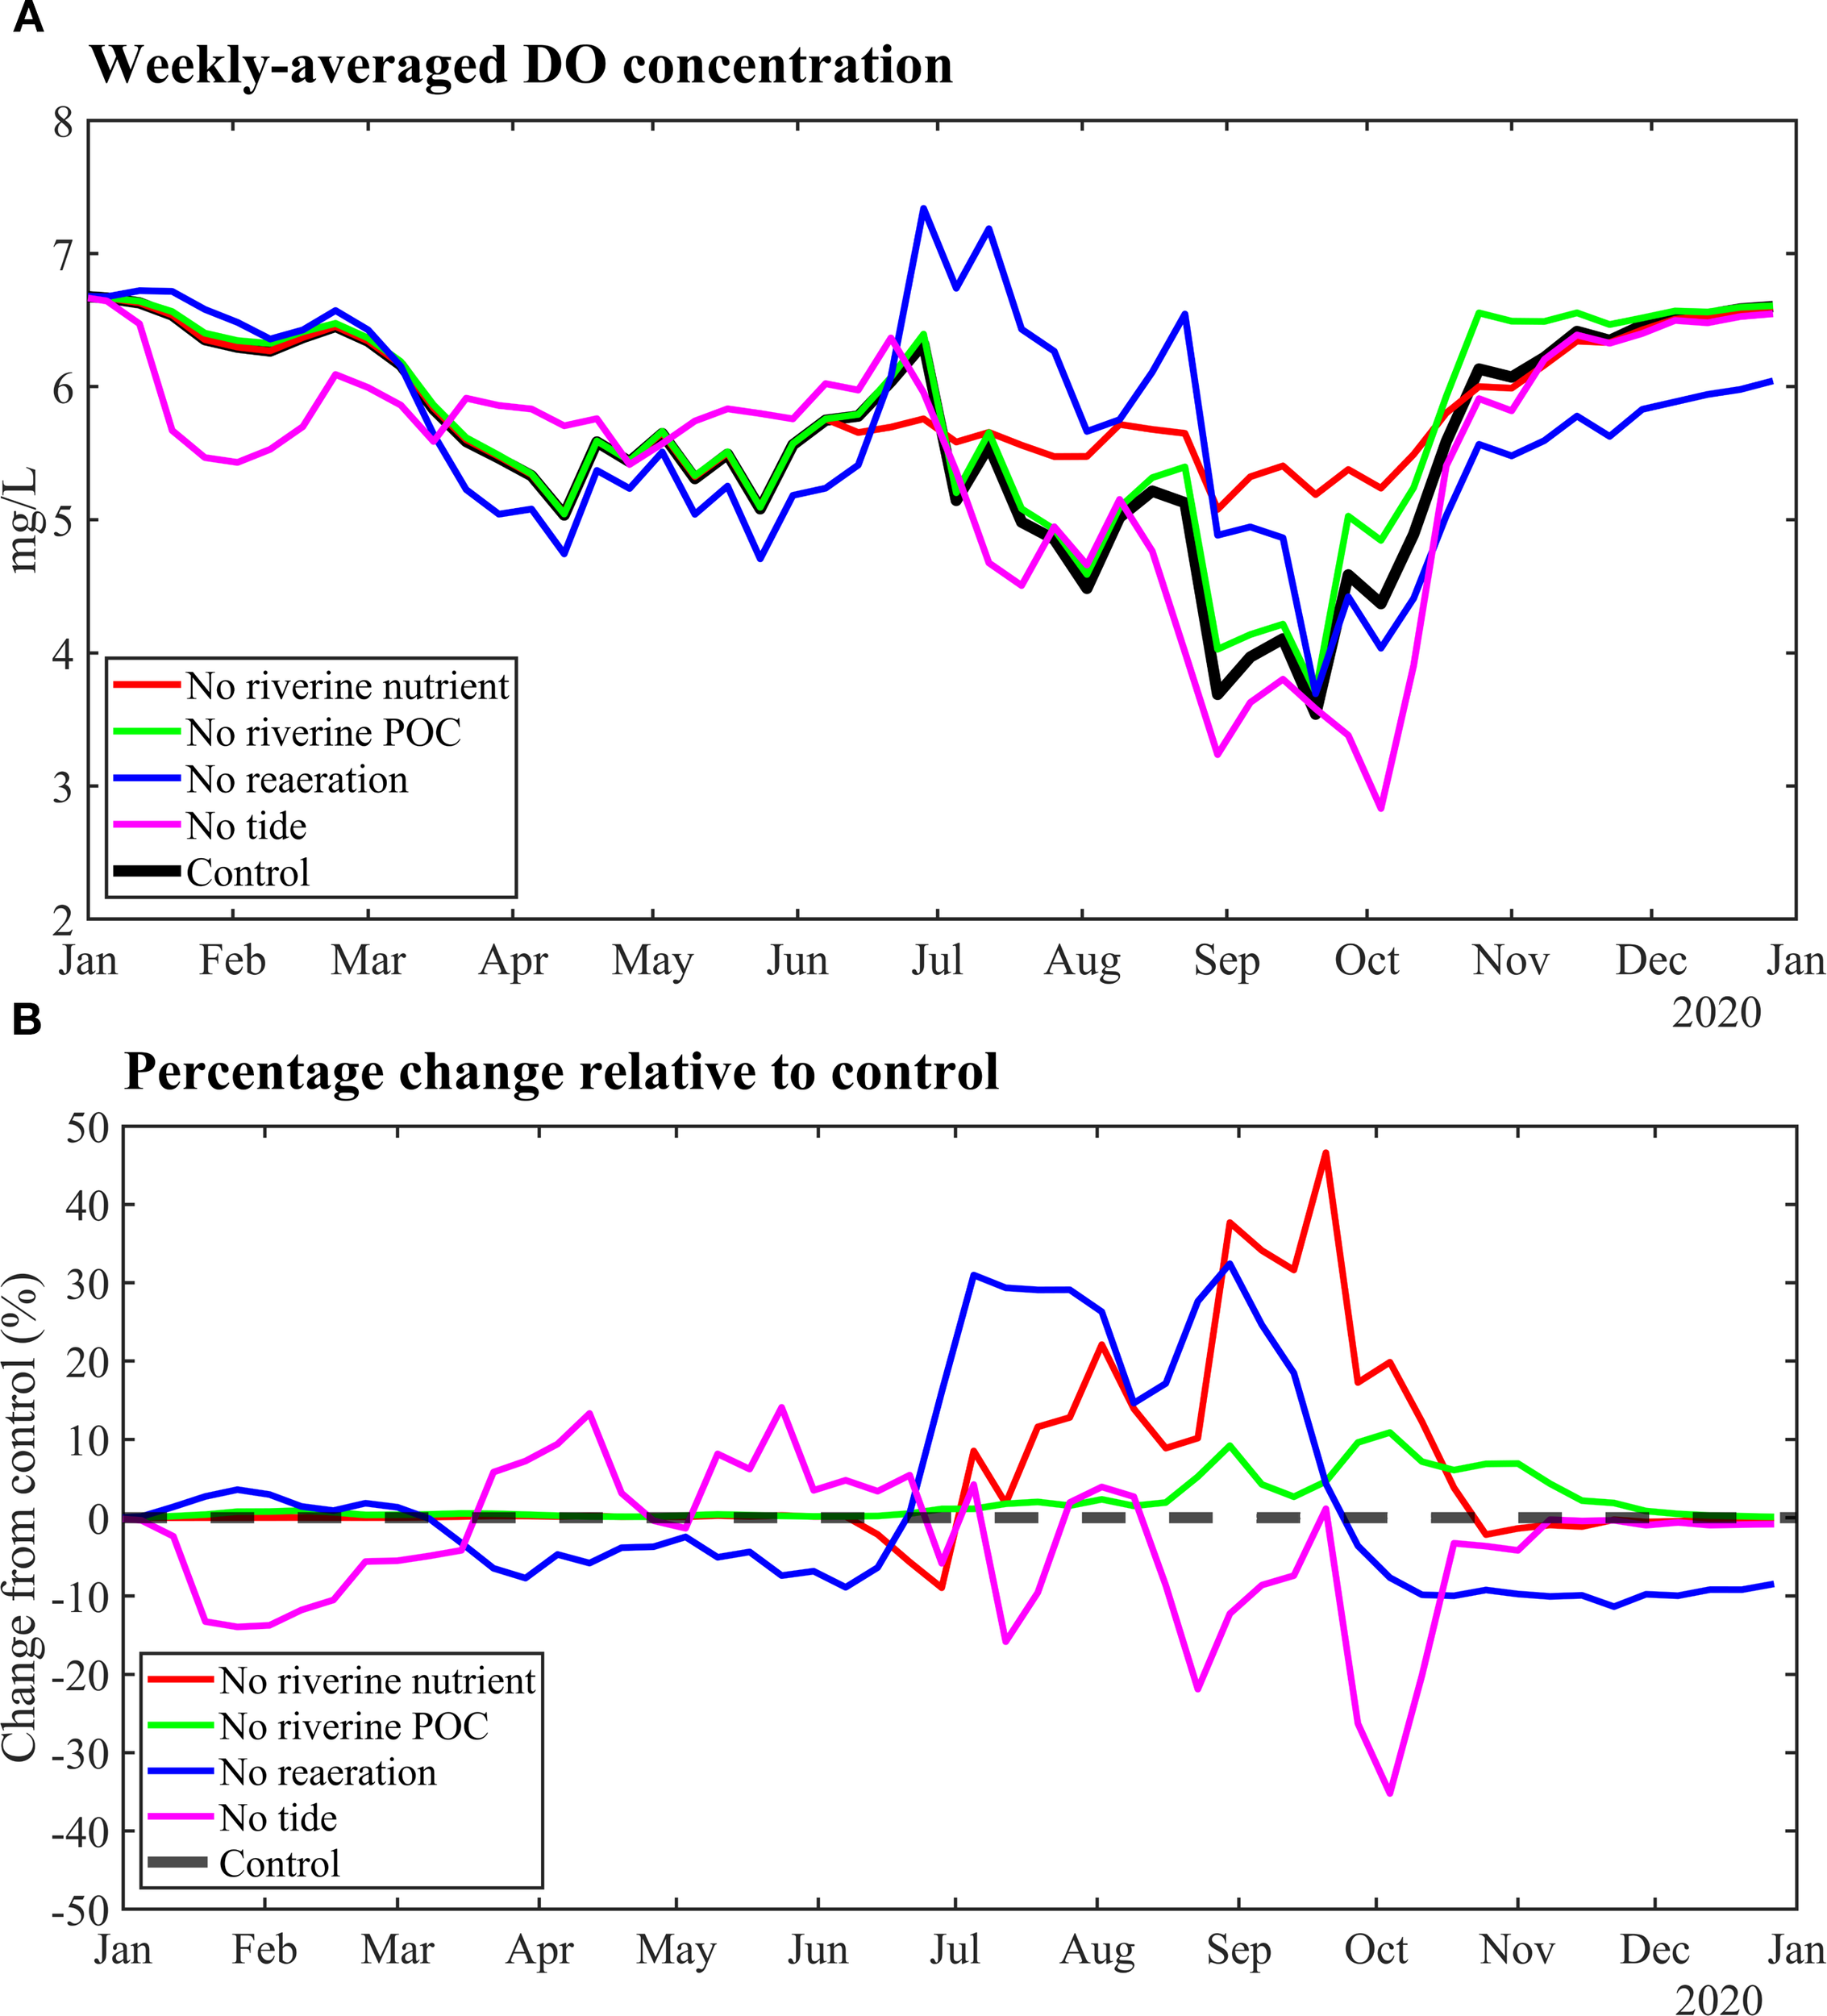
Comparisons between (A) weekly all-grid averaged DO concentration of control run and different scenario runs at the Siracha area and (B) corresponding percentage changes when compared with the control run during 2020.
The original version of this article has been updated.
Statements
Publisher’s note
All claims expressed in this article are solely those of the authors and do not necessarily represent those of their affiliated organizations, or those of the publisher, the editors and the reviewers. Any product that may be evaluated in this article, or claim that may be made by its manufacturer, is not guaranteed or endorsed by the publisher.
Summary
Keywords
hydrodynamic model, hypoxic model, monsoon, riverine nutrients, stratification
Citation
Kaewkhong P, Pokavanich T, Khaodon K and Charoenpong C (2026) Correction: Physico-biochemical controls on dissolved oxygen dynamics in the Eastern Upper Gulf of Thailand: field observations and numerical modeling. Front. Mar. Sci. 13:1786090. doi: 10.3389/fmars.2026.1786090
Received
12 January 2026
Accepted
15 January 2026
Published
03 February 2026
Volume
13 - 2026
Edited and reviewed by
Haosheng Huang, Louisiana State University, United States
Updates
Copyright
© 2026 Kaewkhong, Pokavanich, Khaodon and Charoenpong.
This is an open-access article distributed under the terms of the Creative Commons Attribution License (CC BY). The use, distribution or reproduction in other forums is permitted, provided the original author(s) and the copyright owner(s) are credited and that the original publication in this journal is cited, in accordance with accepted academic practice. No use, distribution or reproduction is permitted which does not comply with these terms.
*Correspondence: Tanuspong Pokavanich, ffistop@ku.ac.th
Disclaimer
All claims expressed in this article are solely those of the authors and do not necessarily represent those of their affiliated organizations, or those of the publisher, the editors and the reviewers. Any product that may be evaluated in this article or claim that may be made by its manufacturer is not guaranteed or endorsed by the publisher.