 Yanhong Lin1,2†
 Fei Xin
 Xin Zhao
 Faming Huang
- 1School of Computer and Information Engineering, Xiamen University of Technology, Xiamen, China
- 2Key Laboratory of Marine Spatial Planning Technology, China Oceanic Development Foundation, Tianjin, China
- 3School of Geographic Sciences, East China Normal University, Shanghai, China
- 4Institute for Global Innovation and Development, East China Normal University, Shanghai, China
- 5Third Institute of Oceanography, Ministry of Natural Resources, Xiamen, China
- 6Fujian Provincial Key Laboratory of Coast and Island Management Technology, Xiamen, China
Introduction: Coastal ecosystems are vital blue carbon sinks that are increasingly threatened by climate change. Their vulnerability and sensitivity are strongly influenced by ecological structures and local conditions.
Methods: Using the Ecopath model, we evaluated the responses of three bays in Fujian, China (Sansha Bay, Fuqing Bay, and Xinghua Bay) under scenarios of increased precipitation, ocean deoxygenation, and warming. The analysis focused on how differences in food web structures shape ecosystem responses to climate pressures and determine their sensitivity and vulnerability.
Results: The results revealed differentiated response patterns dictated by baseline food web characteristics, including constant, linear, and non-linear threshold collapse, in which the baseline ecological structure of a bay dictates its degree of vulnerability. Fuqing Bay, despite having the lowest total system throughput (2405 t/km²/year), showed the highest resilience and bivalve ecological carrying capacity (22.80 t/km²). In contrast, Xinghua Bay, a high biomass system (Total Biomass: 39.93 t/km²), exhibited the highest sensitivity, with its food web structure collapsing even under low deoxygenation stress (shrimp EE > 1). Under severe warming, bivalve ecological carrying capacity declined linearly by up to 50% across all the bays, with absolute losses being the greatest in the most productive systems.
Discussion: Our findings underscore the critical role of baseline ecosystem structure in shaping divergent climate responses and provide a scientific basis for site-specific adaptive management and blue carbon conservation strategies.
1 Introduction
Global climate change represents a major environmental challenge. As a critical component of the Earth’s climate system, the oceans are subject to multiple pressures, including warming, deoxygenation, and rising sea levels (IPCC, 2022a). Such environmental changes affect the structure and function of marine ecosystems profoundly by influencing biological and physiological processes, population dynamics, and species interactions (Doney et al., 2012; Kang et al., 2021). Extensive research has shown that climate change can drive shifts in primary productivity, reduce the habitats of mid-to-high trophic level species, and decrease the sustainability of fishery resources, thereby threatening marine ecosystem services that are essential for human societies (Cheung et al., 2010; Lotze et al., 2019). Despite being some of the most vulnerable environments, coastal ecosystems regulate global climate. They act as critical blue carbon sinks, capturing atmospheric carbon and contributing to climate change mitigation (Mcleod et al., 2011). Understanding how climate change affects marine ecosystems has become imperative because of their ecological vulnerability and essential functions in climate mitigation.
Previous research has established a foundation for understanding the impacts of climate change on coastal ecosystems. Warming influences species metabolism and geographic distribution, whereas ocean deoxygenation can trigger widespread hypoxia, altering community structure and ecosystem function (Chust et al., 2014; Gattuso et al., 2015; Vaquer-Sunyer and Duarte, 2008). Food web models have become indispensable for investigating such effects. The Ecopath framework has been used extensively to construct ecosystem structures based on energy flow (Christensen and Walters, 2004; Heymans et al., 2016). The Ecopath framework has been instrumental in assessing the potential effects of overfishing, climate-driven changes in primary productivity, and aquaculture expansion on ecosystem structure, function, and energy transfer efficiency (Stock et al., 2023; Ullah et al., 2018). It has also been used to estimate the ecological carrying capacity of aquaculture activities such as bivalve farming (Byron et al., 2011; Outeiro et al., 2018; Zhang et al., 2023).
Despite the significant advances above, previous research has focused primarily on individual regions, such as the North Atlantic (Byron et al., 2011; Potier et al., 2025), Mediterranean Sea (Coll et al., 2008; Raptis et al., 2025), and Chinese sea areas, such as the Bohai Sea (Yan et al., 2025; Zhang et al., 2023). Few studies have compared multiple regional ecosystems within the same climatic and management context (Gao et al., 2022; Zhang et al., 2022). The scarcity of cross-regional and comparative analyses limits our capacity to understand how inherent structural heterogeneity governs ecosystem responses to climate stressors comprehensively, which may in turn hinder effective identification of system-specific vulnerabilities during formulation of management strategies.
The research gap above is particularly evident along the Fujian coast, one of the most economically dynamic and ecologically diverse regions in China.
As a core area of the “21st Century Maritime Silk Road” and a key national marine economic development zone, the Fujian coast supports intensive aquaculture, international shipping, and emerging industries. The representative bays of the area, such as Sansha, Fuqing, and Xinghua Bay, are therefore, at the forefront of navigating the complex trade-offs between economic prosperity and climate resilience. The three bays are typical bays of the Fujian coast; they have comparable climatic foundations yet differ in ecological and anthropogenic structure in ways directly relevant to climate sensitivity. All three bays are shallow coastal systems within the same subtropical monsoon coastal zone, sharing a consistent climate forcing and dominant plankton–benthos energy pathways. The environmental consistency provides a stable foundation, allowing effective isolation of the impact of structural differences on climate vulnerability. Understanding their differential vulnerability is not simply a scientific question but a pressing policy imperative for sustainable regional planning.
Despite such shared climatic baselines, the three systems exhibit distinct hydrographic and anthropogenic characteristics that shape their ecological structure and sensitivity to climate pressures. Sansha Bay is a semi-enclosed system with weak tidal flushing and relatively limited riverine input, resulting in pronounced summer stratification and long water residence times. The bay is recognized as the largest aquaculture base for large yellow croaker in China, and it is dominated by high-intensity mariculture. The aquaculture industry has undergone rapid expansion, growing from 6.2 km² in 2005 to 154 km² in 2020 (Yao et al., 2025). Intensive aquaculture development in combination with port and industrial growth has increasingly imposed environmental pressure on the bay ecosystem. Such pressures manifest in the form of deteriorating water quality, sediment enrichment, and habitat degradation, which collectively intensify ecological stress and alter the bay’s biological community structure (Fang et al., 2024).
Fuqing Bay covers a sea area of 226.7 km² and harbors over 130 islands and reefs. The Bay receives significant freshwater discharge and experiences strong tidal mixing driven by its complex archipelago topography, which enhances localized water exchange. It is a key aquaculture base in Fujian Province, with more than 32 km² dedicated to aquaculture. It also supports a port economy that includes advanced manufacturing, chemical materials, and modern logistics. This combination of aquaculture and industrial development makes Fuqing Bay an ideal site for studying the impacts of human activities and climate change on coastal ecosystems.
Xinghua Bay is shallow, with a wide mouth, and it exhibits efficient basin-scale tidal flushing, largely driven by the offshore wind power industry, with ports facilitating wind turbine transport (Zhang et al., 2020). The bay also supports bivalve farming and experiences stronger land-based nutrient inputs alongside large-scale coastal development. However, rapid industrial development has induced several environmental challenges, including wastewater pollution from aquaculture (He et al., 2019) and potential disruptions to marine life owing to wind turbine construction (Zhang et al., 2023). Such activities disrupt the food web structure severely and increase its vulnerability to external disturbances, offering an opportunity for studying the combined effects of industrial growth and climate change on coastal zones. The physical and anthropogenic gradients in the bay create heterogeneous exposure pathways to warming, precipitation extremes, and deoxygenation, providing a natural experimental framework for elucidating differentiated climate-response patterns. In addition, the systems establish a crucial ecological and anthropogenic gradient along the Fujian coast, providing meaningful insight into the regional vulnerability spectrum.
Furthermore, prior ecological research underscores the need for an integrated comparison. In Sansha Bay, studies have quantified aquaculture-driven nutrient loading (Li et al., 2025; Song et al., 2023) and hydrodynamic constraints (Lin et al., 2017). Research in Fuqing Bay has focused primarily on heavy metal pollution assessment and source apportionment, as well as hydrodynamic transport characteristics (Liu et al., 2009; Wang et al., 2025). Although previous studies in Xinghua Bay have examined nekton and macrobenthos communities, and ecosystem degradation, such efforts have remained fragmented and short-term (Cai et al., 2021; Zhang et al., 2025). Crucially, no comparative study has integrated the three representative bays within an ecological framework to evaluate how structural heterogeneity shapes differential sensitivity to climate stressors. Addressing such a regional synthesis gap is essential for climate-resilient coastal management.
To address the research gap, the present study employed the Ecopath model to systematically compare the ecological responses of the three bays along the Fujian coast. To evaluate the impact of climate change on food web dynamics and bivalve ecological carrying capacity in Fujian coastal bays, increases in key climate-driven stressors were selected as scenarios: precipitation, ocean deoxygenation, and ocean warming. The stressors were selected because they represent environmental pressures in the region and have direct implications for aquaculture-based ecosystems. Observational and modeling studies have indicated increasing precipitation in Fujian (Ma et al., 2021; Su et al., 2022; Fan et al., 2017), seasonal hypoxia, declining dissolved oxygen (Li et al., 2024; Zhang et al., 2022), and a consistent warming trend in sea surface temperature in the East China Sea (Ding et al., 2024; Lin et al., 2022; Wang et al., 2019). Such environmental changes influence primary production, species interactions, and the bivalve ecological carrying capacity, thus providing a scientific basis for scenario selection.
In designing the climate scenarios, the authors focused on three key stressors, including precipitation, deoxygenation, and warming, because they represent the primary climate-driven pathways that regulate energy flow, species interactions, and ecological carrying capacity in coastal ecosystems. Changes in precipitation and river discharge alter salinity regimes and introduce pulses of dissolved organic carbon and nutrients, which can reduce light availability, constrain primary production, and intensify eutrophication-driven oxygen depletion (Balch et al., 2016). Persistent ocean warming reduces oxygen solubility and elevates metabolic oxygen demand, thereby accelerating deoxygenation in shallow coastal waters. The effect is amplified further in semi-enclosed bays where restricted water exchange and nutrient enrichment enhance benthic respiration and increase the likelihood of seasonal hypoxia (Breitburg et al., 2018).
By incorporating such stressors, the authors aimed to evaluate the sensitivity and vulnerability of the bay, with particular attention to changes in ecological carrying capacity. Bivalve ecological carrying capacity was selected as a focal metric because suspension-feeding bivalves play a central ecological and management role in such coastal systems. Ecologically, bivalves represent a major benthic filter-feeding component, and they regulate particulate organic matter, and participate to a great extent in nutrient removal and water-quality improvement (van der Schatte Olivier et al., 2020). In addition, their biomass and filtration capacity influence energy transfer efficiency and the stability of lower trophic levels, making them sensitive indicators of ecosystem responses to climate-driven changes in primary production, oxygen availability, and hydrological conditions. From a management perspective, bivalve aquaculture is the dominant human activity in the three bays and constitutes a key sector for regional livelihoods and coastal blue-carbon strategies. Therefore, ecological carrying capacity estimation is essential for balancing production goals with ecosystem integrity, and the Ecopath framework has been applied extensively to quantify such limits in coastal and estuarine systems (Byron et al., 2011; Outeiro et al., 2018; Zhang et al., 2023). Focusing on bivalve ecological carrying capacity provides both an ecologically meaningful and management-relevant indicator for assessing system-specific climate vulnerability.
We aimed to evaluate the bays’ sensitivity and vulnerability, and how baseline ecosystem structures shape divergent response modes under climate stressors. Based on their different food-web configurations, two guiding hypotheses were formulated:
H1. Bays with food webs simplified by strong mariculture dominance and reduced trophic redundancy exhibit higher sensitivity to climate stressors, as perturbations propagate more directly through linearized energy pathways.
H2. Bays with higher trophic diversity, stronger internal energy recycling, and more coupled benthic–pelagic linkages display lower sensitivity to climate stressors due to greater functional compensation and buffering capacity.
The hypotheses provide a basis for interpreting the comparative climate responses of the three bays. Our results could provide new perspectives on the differentiated risks faced by coastal ecosystems in the context of climate change and lay a scientific foundation for developing site-specific management and adaptation strategies.
2 Materials and methods
2.1 Study area
The ecosystem structure of three representative bays in Fujian Province under different climate change scenarios, including Sansha Bay, Fuqing Bay, and Xinghua Bay (Figure 1), were investigated comparatively. The bays were selected because of their distinct geomorphological and hydrological characteristics that shape their physical foundations, such as water exchange capacity and habitat heterogeneity, thereby influencing ecosystem structure and function. In addition, each bay has been subjected to different forms of anthropogenic pressure driven by unique development models, providing a context suitable for comparative analysis of climate responses (Table 1) (Wang et al., 2021, 2019).

Figure 1. Map of the study area.

Table 1. Comparative environmental contexts of Sansha Bay, Fuqing Bay, and Xinghua Bay.
2.2 Ecopath modeling approach
Given the complex ecological and anthropogenic dynamics of the three bays, an ecosystem modeling framework is required to quantify energy flows, trophic interactions, and system responses under climate change scenarios. Therefore, the EwE approach (software v. 6.7.0; Ecopath International Initiative, Barcelona, Spain), which has been used extensively to analyze the impact of fisheries on ecosystems (Christensen and Walters, 2004), was adopted. Ecopath is based on the principle of mass and energy conservation, which ensures that the total energy inputs and outputs are balanced for each functional group.
Each functional group is constrained by two master equations: the energy balance (Equations 1, 2) and production balance (Equation 3) (Christensen and Walters, 2004):
For each functional group (i), the mass balance master equation is:
where Bi is the biomass of functional group i, Pi is the production, Yi is the total fishery catch, M2i is the predation rate, Ei is the net migration rate (), BAi is the biomass accumulation rate, and M0i is the mortality rate.
Mass balance should occur over a given time period such that
where i and j are the functional and predator groups, respectively, is the production/biomass ratio, EEi is the ecotrophic efficiency (the proportion of production utilized in the system), is the consumption/biomass ratio for group j, and is the fraction of predator j’s diet contributed by prey i.
The parameters B, , , and EE are basic parameters required for the Ecopath model. The parameters enable the calculation of one parameter if the other parameters are provided, thus ensuring a consistent and balanced ecosystem representation. The model was iteratively balanced, with ecotrophic efficiency (EE) values ranging between 0 and 1. Values close to 1 indicate that nearly all production is utilized by predation and fisheries, whereas values greater than 1 indicate production insufficient to meet demand.
The bivalve ecological carrying capacity was selected as the primary metric to assess the impacts of climate change. This capacity was determined by incrementally increasing the biomass of the bivalve group until EE exceeded 1.
As the present study focuses on the differential vulnerability among the three bays, comparative terms such as “high” and “low” used in the results and discussion refer to the relative ranking of key Ecopath indicators among the three Fujian bays. This internal comparative framework enables identification of structural heterogeneity and link it to potential differences in system resilience under climatic stressors.
2.3 Model construction and parameterization
Site-specific Ecopath models for Fuqing Bay, Sansha Bay, and Xinghua Bay were constructed, and each ecosystem was represented by 13 to 14 functional groups defined according to the feeding habits and habitat characteristics of species within the bays (Tables 2,3,4). To ensure ecological coherence and model stability, functional groups were defined following standard Ecopath practice, which aggregates species based on shared trophic roles, habitat use, feeding strategies, and life-history traits (Christensen et al., 2005; Heymans et al., 2016).

Table 2. Input (in bold) and output parameters for the Ecopath model of Sansha Bay.

Table 3. Input (in bold) and output parameters for the ecopath model of Fuqing Bay.

Table 4. Input (in bold) and output parameters for the ecopath model of Xinghua Bay.
In each bay, species were grouped according to trophic guild, vertical habitat, feeding preference and prey spectrum, similarity in body size, and metabolic characteristics. These traits jointly determine their trophic position and contribution to local energy pathways. Functional groups preserve the dominant energy flows and trophic interactions even when species composition differs across systems (Plaganyi, 2007). Considering Ecopath requires complete parameterization for each group, data availability (biomass, P/B, Q/B, and diet composition) also influenced aggregation. The group structure was grounded in the species recorded in the field surveys of Fuqing, Sansha, and Xinghua Bays, ensuring representation of all major trophic pathways, including primary producers, zooplankton, benthic invertebrates, bivalves, small pelagic fishes, demersal predators, and top predators. Because species composition and hydrodynamic regimes differ substantially among the three bays, enforcing identical group structures would have grouped ecologically dissimilar species and reduced model realism. Instead, a consistent trophic-guild framework was applied across all bays while allowing species-level membership to vary according to local assemblages. This maintains ecological meaning within each system while preserving comparability across systems for cross-bay analysis.
The spatial extent of each model covered the entire bay, which was consistent with the survey design, whereas the temporal scope reflected the most recent available data. Biomass estimates were derived directly from recent bay-specific field surveys (Sansha Bay: October and November 2016; Xinghua Bay: Sept. 2024; Fuqing Bay: Nov. 2023). Parameters for P/B, Q/B, detritus inputs, and diet composition were obtained from the literature and empirical equations (Supplementary Tables S1–S6). The selection of the present study prioritized data derived from local or regionally relevant studies (e.g., the Fujian coast, East China Sea, or South China Sea) to ensure the parameters reflected the specific environmental and physiological conditions of the system. When direct local data for specific functional groups were unavailable, input values were sought from studies on the closest ecologically and taxonomically similar species or functional groups within the region.
Ecological plausibility was verified using Ecopath diagnostic tools, including PREBAL analysis. PREBAL checks were used to ensure that fundamental ecological relationships were not violated, specifically by confirming that biomass generally declines with increasing trophic level, ensuring that P/B and Q/B remained within typical ranges reported for similar taxa, assessing energetic feasibility through P/Q and EE, to guarantee P/Q < 1, and EE did not exceed 1., and confirming internal consistency among consumption, production, predation mortality, and export flows to achieve trophic flow balance. To further assess uncertainty, 500 Monte Carlo simulations were conducted per bay, varying B, P/B, and Q/B randomly within ±10%. All runs were automatically re-balanced, and the resulting variability in ecotrophic efficiency (EE), production (P/B), and consumption (Q/B) was recorded. The low coefficients of variation (≈11% for EE and ≈6% for P/B and Q/B) demonstrate stable model behavior under moderate uncertainty. Balanced baseline models served as the foundation for the subsequent climate scenario simulations.
2.4 Scenario construction
2.4.1 Scenario 1: increased precipitation
Climate change is intensifying the global hydrological cycle, leading to increased precipitation and river runoff in many coastal regions. The process enhances the discharge of terrestrial Dissolved Organic Carbon (DOC) into coastal waters. Elevated DOC contents have potential impacts on nearshore marine ecosystems. Although long-term DOC projections for the Fujian coast are not yet available, the underlying mechanism has been documented in multiple river systems. For example, observations in the Jiulong River, a major watershed discharging into the Fujian coastal region, show that DOC concentrations rise during high-discharge periods associated with precipitation events (Yang et al., 2013). DOC increased from 1.7 mg/L during pre-storm baseflow to 2.1 mg/L at stormflow. The event-scale dynamics are consistent with the well-established hydrological mechanism in which intensified rainfall enhances flow-path connectivity to upper soil and litter layers, mobilizing terrestrially derived DOC into river systems.
A framework following Chapman et al. (2020) was employed. Here, DOC-driven reductions in phytoplankton biomass serve as a proxy for the net ecological stress imposed by increased terrestrial carbon loads. Balch et al. (2016) indicated increases in riverine DOC discharge into the Gulf of Maine by approximately 30% with the intensification of the hydrological cycle due to climate change, with associated reductions in water clarity and phytoplankton productivity. Although the Gulf of Maine is geographically distinct, the ecological sensitivity ranges reported provide a benchmark widely used for representing the upper bounds of DOC impacts in coastal systems. Furthermore, while Yang et al. (2013) documented an about 24% concentration increase, the corresponding DOC flux increase during the storm event would be substantially higher than 30% due to the massive co-occurrence of increased discharge, confirming that our upper bound is regionally plausible. Accordingly, we implemented three precipitation–DOC scenarios, representing low, moderate, and high ecological stress, corresponding to 10%, 20%, and 30% reductions, respectively, in phytoplankton biomass. The values do not assume direct translation of DOC concentrations from foreign systems but instead follow established impact-gradient practice to test the ecological sensitivity of the food web to reduced primary productivity. Regional evidence from the Jiulong River confirms the mechanism, while the gradient approach enables examination of ecosystem responses across plausible bounds in the absence of region-specific long-term DOC forecasts.
2.4.2 Scenario 2: ocean deoxygenation
Ocean deoxygenation alters metabolic performance, foraging activity, and survival probabilities across marine taxa, with well-documented differences in physiological sensitivity among benthic invertebrates. Global syntheses consistently show that actively respiring crustaceans require higher oxygen concentrations to maintain aerobic metabolism and are therefore among the most hypoxia-sensitive groups, whereas bivalves display comparatively greater short-term tolerance but still experience reduced filtration, growth, and survival under declining oxygen (Diaz and Rosenberg, 2008; Levin et al., 2009; Vaquer-Sunyer and Duarte, 2008). The cross-taxonomic sensitivity gradients have been repeatedly observed across global estuaries and are not region-specific.
To reflect the empirically established physiological patterns, the hypoxia scenarios were parameterized using the relative biomass responses reported by Alva-Basurto and Arias-González (2014), who quantified taxon-specific impacts of acute hypoxic events: shrimp biomass exhibited severe declines (93.9%), while bivalve biomass showed moderate reductions (9.5%). The relative sensitivities are fully consistent with global hypoxia-tolerance rankings, providing an ecologically grounded basis for scaling biomass shifts under progressive oxygen stress.
Accordingly, three deoxygenation scenarios were defined to represent low, moderate, and severe hypoxic stress by proportionally scaling the empirically observed gradients. Shrimp biomass was reduced by 30%, 60%, and 90%, and bivalve biomass by 3%, 6%, and 10%, respectively. The approach captures well-supported cross-taxonomic physiological differences rather than relying on region-specific dissolved-oxygen thresholds, which vary substantially across short spatial and temporal scales. Using taxon-level physiological gradients, therefore, provides a more robust basis for scenario construction in ecosystem modeling.
2.4.3 Scenario 3: ocean warming
Ocean warming represents a major global threat to marine ecosystem structure and function, particularly through its capacity to drive the collapse of high trophic level biomass. To determine the ecological stress gradient required for the model, quantifiable ecological responses reported in the literature were utilized. The empirical findings of Ullah et al. (2018), which provided a direct measurement of trophic impacts under severe thermal stress, were referenced. Their experimental and modeling study simulated a warming of 2.8 °C, and empirically validated a 52% reduction in the biomass of both secondary (herbivorous) and tertiary (carnivorous) organisms. The reduction is attributed to decreased energy transfer efficiency, which limits the amount of energy available to sustain higher trophic levels.
To model the overall decline observed in the experiments, a 50% biomass reduction rate, highly consistent with this empirical result, was adopted as the upper bound benchmark for potential ecological impacts, defining low, moderate, and severe warming scenarios, characterized by biomass reductions of 20, 35, and 50%, respectively, for secondary and tertiary consumers.
3 Results
3.1 Baseline model analysis
Three baseline ecosystem models were constructed for Sansha Bay, Xinghua Bay, and Fuqing Bay. The models represent the food web structure and energy flow dynamics within each bay, and are the foundation for scenario simulations. To characterize the structure and function of the modeled ecosystem, several key indices were calculated (Table 5). Total Biomass (TB) measures the overall standing stock of living matter. The Total Primary Production to Total Respiration Ratio (TPP/TR) indicates the metabolic balance and maturity of the system. Total Consumption (TC) quantifies the total feeding activity across the food web. The Connectance Index (CI) describes the structural complexity based on the proportion of realized trophic links. Finally, the System Omnivory Index (SOI) reflects the average trophic diversity of consumers within the system. The PREBAL checks confirmed that the three Ecopath models adhered to fundamental ecological constraints, including decreasing biomass with an increase in trophic level, biologically reasonable P/B and Q/B ratios, and feasible P/Q and EE values. The diagnostics indicate that the baseline trophic structures and energy flows are ecologically plausible and internally coherent. The Monte Carlo analysis further supported the robustness of the models. Despite imposing ±10% variation on the key input parameters, the resulting variability in EE, P/B, and Q/B remained small, suggesting stable model behavior under moderate parameter uncertainty.
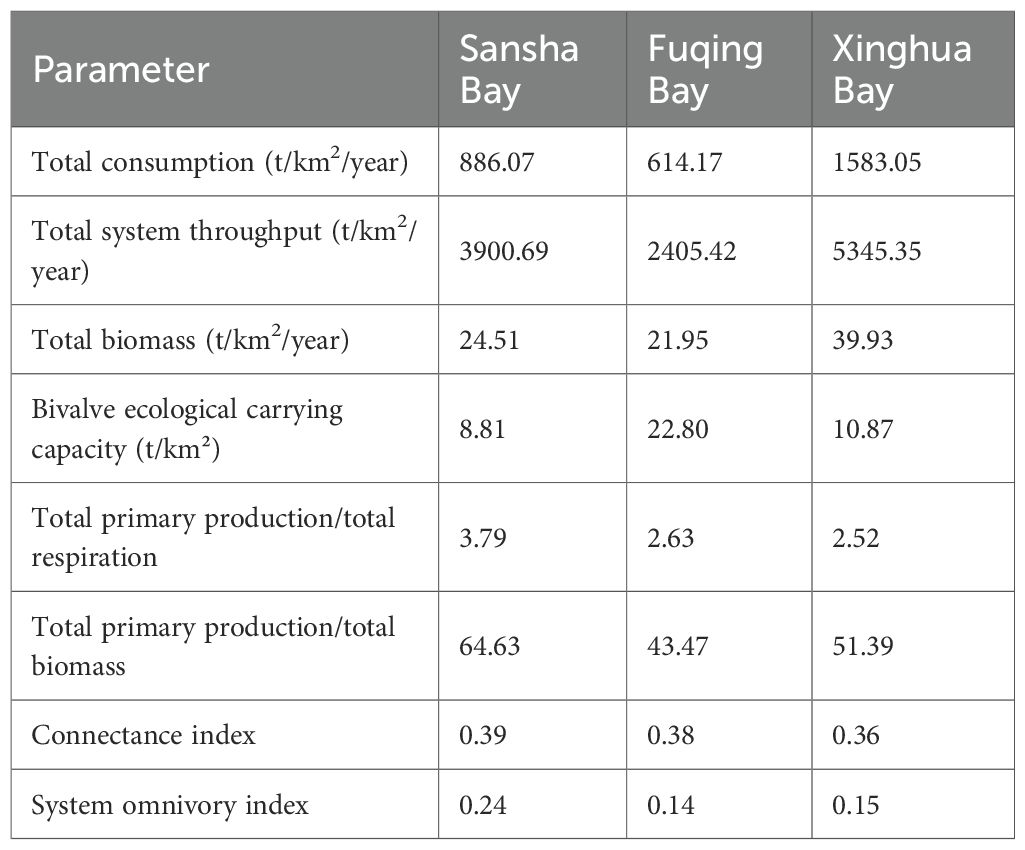
Table 5. Baseline ecosystem indicators of the three bays.
Fuqing Bay had the highest ecological carrying capacity for bivalves (22.80 t/km²), which was higher than those of Xinghua Bay (10.87 t/km²) and Sansha Bay (8.81 t/km²).
The total system throughput (TST), a key metric for overall ecosystem activity and vitality, was the highest in Xinghua Bay (5345.35 t/km²/year), indicating active energy and material flows. The total Biomass (TB), which reflects biomass accumulation, was also the highest in Xinghua Bay (39.93 t/km²/year). This suggests that Xinghua Bay is an energy-accumulating system, in which energy is converted efficiently and retained within the food web. Consistently, Xinghua Bay had the highest total consumption (TC; 1583.05 t/km2/year), indicating intensive trophic interactions. In contrast, Fuqing Bay had the lowest TST, TB, and TC values, implying a lower overall energy circulation and system scale.
For the total primary production-to-total respiration ratio (TPP/TR), which is a key indicator of the carbon balance of an ecosystem, a value equal to 1 indicates a steady state, and a value greater than 1 indicates a developmental state. The values of the three bays were all greater than 1, with Sansha Bay having the highest value (3.79), indicating a dependence on primary production and a relatively imbalanced state that may render it more vulnerable to external disturbances. The total primary production-to-total biomass ratio (TPP/TB), which reflects the production efficiency and speed of the life cycle, where a higher value represents greater efficiency and a higher turnover rate, was also the highest in Sansha Bay (64.63), implying the fastest biomass turnover. In contrast, Fuqing Bay had the lowest value (43.47), which indicated a more stable system.
The connectance index (CI), which reflects food web complexity and stability, was the highest in Sansha Bay (0.39). This suggests a more intricate food web, with a greater number of connections between species. The system omnivory index (SOI), which measures the dietary breadth of predators, was also the highest in Sansha Bay (0.23). This implies that food web predators have broader diets.
Lindeman spine diagrams (Figure 2) show the energy distribution across trophic levels. Energy flow in all three bays was concentrated mainly between trophic levels I and III. The biomass of trophic level II was 1.47, 2.27, and 2.79 times that of level I in Sansha Bay, Xinghua Bay, and Fuqing Bay, respectively, indicating strong energy recycling within the lower trophic levels. The proportion of primary production consumed was 23.95, 42.00, and 32.98%, respectively, indicating that primary production was most effectively utilized in Xinghua Bay. The energy flow to detritus dominated trophic levels I and II, accounting for 85.22 and 13.30% in Sansha Bay, 71.17 and 26.73% in Xinghua Bay, and 77.14 and 20.16% in Fuqing Bay, respectively.

Figure 2. Lindeman spine diagrams for the models of (A) Sansha Bay, (B) Fuqing Bay, and (C) Xinghua Bay. The Lindeman spine diagrams represent energy flow through the trophic levels of the bay ecosystems. The horizontal axes indicate the trophic levels from primary producers to top predators. P represents primary production (first trophic level), D represents detritus. Blocks indicate trophic levels or functional groups, and arrows indicate energy transfer between levels.
Diet-tree maps (Figure 3) highlighted clear differences in the basal energy pathways among the three bays. In Sansha Bay, detritus directly supported most of the benthic food web. Phytoplankton mainly supported the food chains of zooplankton, maintaining the classic pelagic base. In Xinghua Bay, phytoplankton served as the primary food source for zooplankton and benthic invertebrates (excluding benthic bivalves). Detritus played a critical supporting role for specific benthic species and higher-trophic-level predators, primarily via two pathways: direct consumption (by benthic bivalves) and indirect consumption (by cephalopods). In Fuqing Bay, phytoplankton primarily sustained the base of the pelagic food web (zooplankton), whereas detritus formed the foundation of the benthic food web, supporting most benthic species, including bivalves, shrimps, cephalopods, and other benthic invertebrates.

Figure 3. Diet tree maps for the ecosystem models of the three bays. Each main square represents a functional group of predators (or consumers). Inside each main square are multiple smaller sub-squares that represent the food sources (prey) or food categories of the respective predator. The size of the sub-square area is directly proportional to the percentage of food sources contributing to the diet of the predator. (A) Sansha Bay. The numbers indicate 1: Planktivorous Pelagic Fish; 2: Benthic Small Gobiids; 3: Demersal Carnivores Fish; 4: Demersal Piscivorous Fish; 5: Demersal Omnivorous Fish; 6: Benthic Shrimps; 7: Benthic Crabs; 8: Stomatopods; 9: Cephalopods; 10: Benthic Bivalves; 11: Other Benthic Invertebrates; 12: Zooplankton; 13: Phytoplankton; and 14: Detritus. (B) Fuqing Bay. The numbers indicate 1: Planktivorous Small Fish; 2: Benthic Detritivorous Fish; 3: Benthopelagic Piscivorous Fish; 4: Demersal Carnivores Fish; 5: Benthic Shrimps; 6: Benthic Crabs; 7: Stomatopods; 8: Cephalopods; 9: Benthic Bivalves; 10: Other Benthic Invertebrates; 11: Zooplankton; 12: Phytoplankton; 13: Detritus (C) Xinghua Bay. The numbers indicate 1: Planktivorous Small Fish; 2: Demersal Omnivorous Fish; 3: Benthopelagic Piscivorous Fish; 4: Demersal Carnivorous Fish; 5: Benthic Shrimps; 6: Benthic Crabs; 7: Stomatopods; 8: Cephalopods; 9: Benthic Bivalves; 10: Other Benthic Invertebrates; 11: Zooplankton; 12: Phytoplankton; 13: Detritus.
In summary, baseline model analysis revealed fundamental differences in ecological functions. Fuqing Bay is characterized by a unique paradox; the lowest overall vitality (TST, TB, and TC) but the highest bivalve ecological carrying capacity, coupled with a stable TPP/TB ratio, suggesting a highly targeted and efficient diversion of the low-flux energy base for aquaculture production. This resulted in a stable structure supported by a modest and effective energy base. Xinghua Bay exhibited the highest energy throughput, biomass accumulation, and consumption, indicating a large, active, and balanced system. Sansha Bay, despite its complex trophic connections, exhibited the lowest overall scale and fastest biomass turnover, reflecting an imbalanced, vulnerable state with strong reliance on the detrital pathway.
3.2 Scenario analysis
The increased precipitation scenario was designed to simulate dilution by enhanced freshwater input, leading to reduced nutrient concentrations, and consequently, decreased primary productivity. The bivalve ecological carrying capacity in the scenario remained unchanged across all three bays despite substantial decreases in primary producers. With a decrease in phytoplankton biomass, the EEs of phytoplankton and detritus also increased (Figure 4), whereas those of the other functional groups remained nearly constant. Among the three bays, the EE rankings remained consistent with that in the baseline model. Sansha Bay had the lowest EE values for both phytoplankton and detritus.

Figure 4. Changes in ecotrophic efficiency under increased precipitation.
The deoxygenation scenario was designed to simulate biomass changes in oxygen-sensitive functional groups (shrimp and bivalves), reflecting their immediate sensitivity to hypoxic stress. As shown in Tables 6,7,8, biomass reduction resulted in heterogeneous responses across the three bays. The compensatory response of Sansha Bay was limited, and the model became unstable under severe deoxygenation, with the EE of shrimp exceeding 1. This indicates that the energy demand placed on shrimp populations surpassed their modeled availability, signifying a breakdown of the system balance under severe stress. The model displayed even greater sensitivity in Xinghua Bay and Fuqing Bay. Instability emerged in the low deoxygenation scenario, with the EE of shrimp reaching 1.18 and 1.20 in Xinghua Bay and Fuqing Bay, respectively. The model remained unbalanced in the moderate and severe deoxygenation scenarios.

Table 6. Trophic indicators in the ocean deoxygenation scenario for Sansha Bay.

Table 7. Trophic indicators in the ocean deoxygenation scenario for Fuqing Bay.

Table 8. Trophic indicators in the ocean deoxygenation scenario for Xinghua Bay.
The ocean warming scenario simulated a decline in secondary and tertiary consumers, representing the potential impact of thermal stress on higher-trophic-level species. As shown in Figure 5, the bivalve ecological carrying capacity showed a clear linear declining trend across all three ecosystems. In Fuqing Bay, the carrying capacity declined from 22.80 t/km² under baseline conditions to 18.24, 14.82, and 11.40 t/km² in the low, moderate, and severe warming scenarios, respectively. That in Xinghua Bay decreased from 10.87 to 8.70, 7.07, and 5.44 t/km², and that in Sansha Bay from 8.81 to 7.05, 5.73, and 4.40 t/km², respectively. The absolute magnitude of the carrying capacity loss differed because of variations in baseline values. Fuqing Bay, with the highest initial capacity, maintained the greatest absolute potential, even under the most severe stress level. In contrast, Xinghua Bay and Sansha Bay started from much lower baselines, and their capacities dropped to critically low levels in the severe warming scenario.
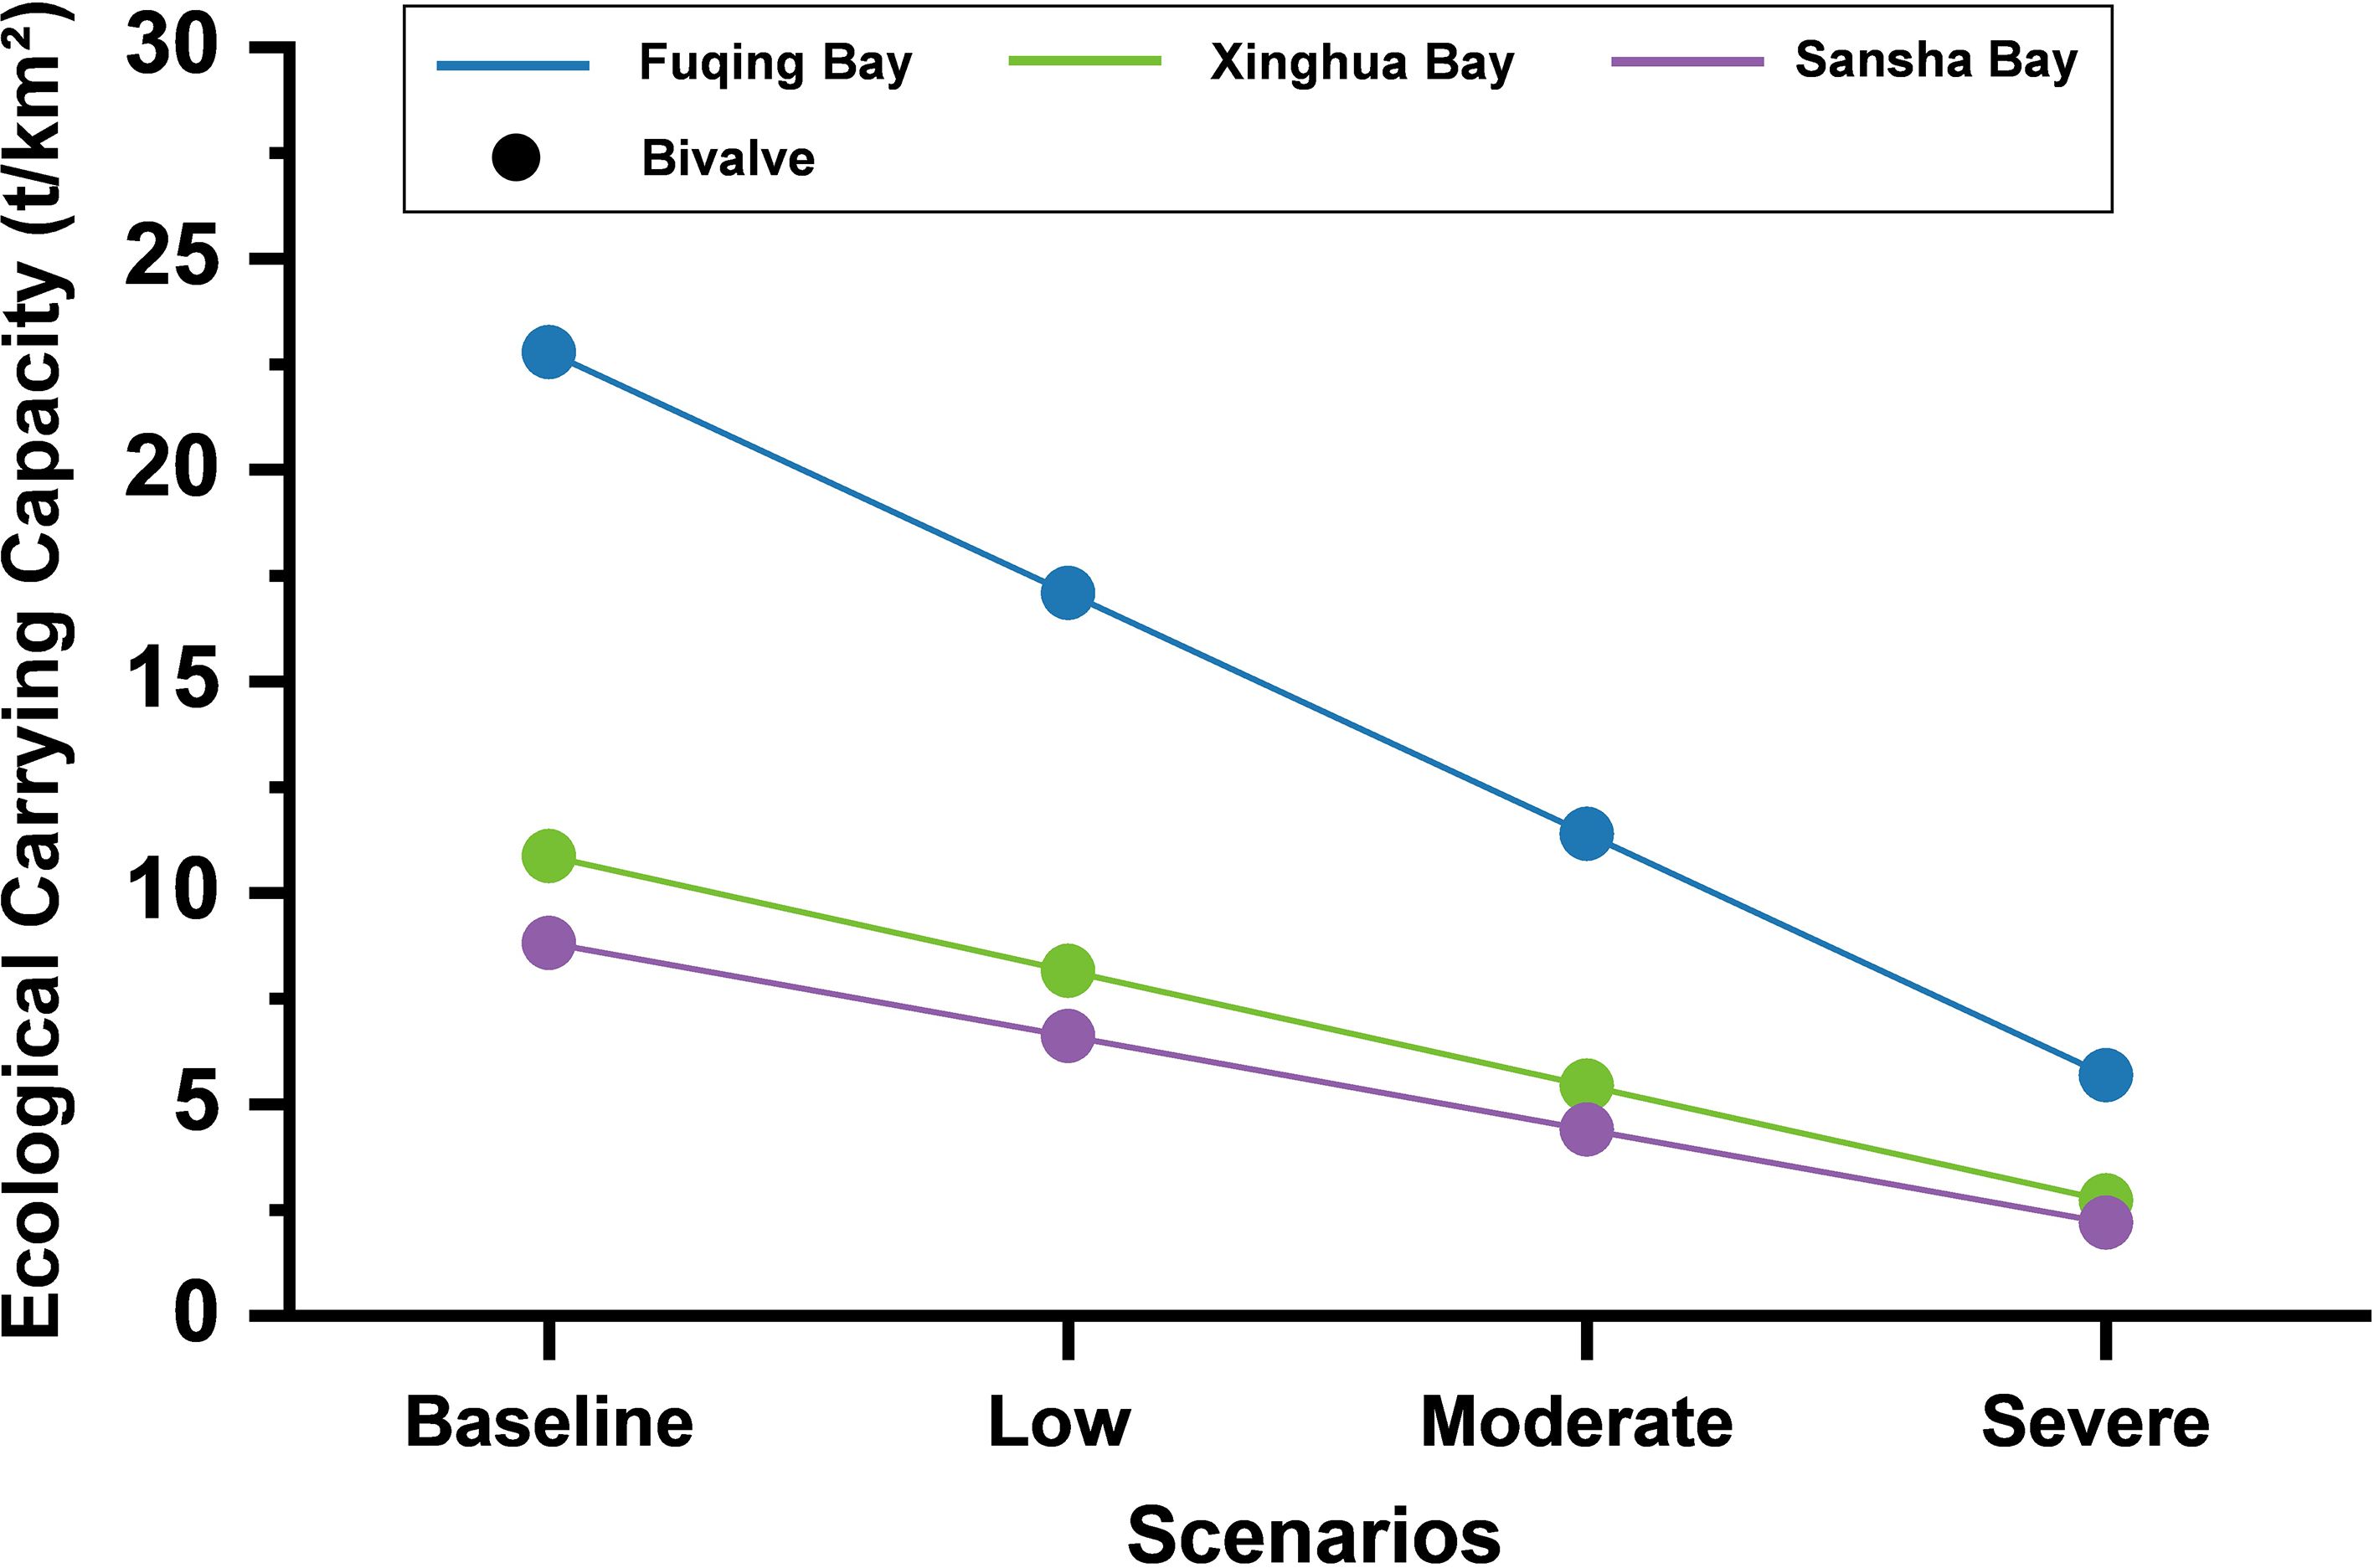
Figure 5. Changes in ecological carrying capacity for bivalves under ocean warming.
4 Discussion
4.1 Baseline food web structure
The baseline models revealed fundamental ecological differences among the three bays, shaped by long-term natural conditions and human activities. The distinctions establish the structural foundation for their divergent responses to climate stressors.
Xinghua Bay, with the highest TST, TB, and TC, functions as a highly productive, metabolically active ecosystem. Such characteristics imply high biological productivity but also suggest potential vulnerability under environmental stress, as systems with high metabolic activity and tight energy utilization often depend on continuous nutrient and oxygen supplies. This interpretation is consistent with previous observations reporting lower nekton diversity (Cai et al., 2021) and a trend toward the miniaturization of macrobenthic communities (Zhang et al., 2025) in Xinghua Bay, both of which indicate a simplified food web and reduced ecological redundancy. Overall, the consistencies reinforce the reliability of the model results and highlight the dual nature of Xinghua Bay, which is both highly productive and ecologically sensitive.
In contrast, Fuqing Bay exhibited the lowest TST, TB, and TC, indicating a low-flux system. However, low TC implies minimal internal competition. The strong hydrodynamic conditions in Fuqing Bay promoted efficient nutrient transport and dispersion. The factors allow the system to efficiently utilize a small energy base, channeling it directly to target groups, such as bivalves, as evidenced by the bay’s highest ecological carrying capacity for bivalves. The low TPP/TB ratio confirmed a slow biomass turnover rate and high structural stability of the accumulated biomass. This interpretation is consistent with previous hydrodynamic and ecological studies highlighting the powerful tidal energy and high water exchange efficiency of Fuqing Bay (Liu et al., 2009). This enables efficient transport and utilization of nutrients from adjacent areas, which sustain the unique high-efficiency characteristic.
Sansha Bay ranked intermediate in TST, TB, and TC values, reflecting a system heavily influenced by intensive cage aquaculture. The practices have altered local hydrodynamics and contributed to sediment accumulation and eutrophication. Although anthropogenic inputs can enhance the system energy temporarily, the semi-enclosed geography (Figure 1) limits efficient utilization, leading to chronic nutrient enrichment and reduced ecological efficiency. Sansha Bay thus represents a medium vitality, high turnover, and fragile ecosystem that is particularly sensitive to external disturbances. The finding corroborates recent research showing that intensive aquaculture in Sansha Bay elevates sediment heavy metal concentrations and places the bay at a moderate ecological risk level (Fang et al., 2024; Song et al., 2023).
Notably, the baseline data for the three bays are not synchronized temporally, with surveys conducted between 2016 and 2024. However, the comparative analysis of the present study is predicated on system-level structural and functional attributes (e.g., TST, TPP/TR, CI, and SOI), which tend to exhibit greater inertia than individual biomass fluctuations. The high-level metrics remain relatively robust over multi-year timescales, provided that the dominant anthropogenic pressures and hydrodynamic regimes do not undergo fundamental shifts (Andersen et al., 2008). Considering the core industrial and aquaculture frameworks within each bay remained consistent during the study period, the identified structural contrasts are considered a valid representation of their inherent food web organization. Therefore, despite the temporal asynchrony, these baseline models provide a meaningful foundation for assessing the differentiated responses of each system to simulated climate stressors and for understanding cross-system heterogeneity.
Collectively, the distinct baseline conditions establish the structural foundation for the subsequent dynamic response of each bay to climate stressors, providing a comparative basis for assessing ecosystem resilience.
4.2 Diverse response patterns
The scenario simulation results revealed that the vulnerability of the three bays to climate change was governed by the interaction between two distinct factors. First, the type of climate stressor dictated the dynamic response mode across the bays, yielding three fundamental patterns: constant, threshold, and linear. Second, the unique baseline ecosystem structure of each bay affected the specific sensitivity and vulnerability within the respective mode. The dynamics of external pressure and the capacity of the internal system are fundamental drivers of the final vulnerability observed (Pacifici et al., 2015).
In the increased precipitation scenarios, the bivalve ecological carrying capacity in all three bays remained virtually unchanged, exhibiting a constant response mode. The simulated increase in precipitation primarily reduced primary productivity, which was typically buffered by the stability of low trophic levels. Structural stability in this constant mode reflects the adaptive mechanisms developed under chronic anthropogenic pressure. In Fuqing Bay, the strong tidal hydrodynamics and water exchange efficiency effectively disperse pollutants. This provides a higher hydrological buffering capacity against nutrient dilution or primary productivity decline caused by precipitation, thus maintaining a high bivalve ecological carrying capacity. Despite the high metabolic load and tight energy utilization in Xinghua Bay, internal compensatory mechanisms offset the loss of primary producers and maintained the overall balance. Sansha Bay also maintained stability through a distinct pathway. Its system structure, characterized by a fast turnover rate and low baseline utilization of basal resources, ensured capacity to withstand the reduction in primary productivity without approaching trophic imbalance.
The precipitation scenario results demonstrated that, while the bivalve ecological carrying capacity was resilient to reductions in primary production, the broader food web exhibited altered energy utilization patterns, in which higher EE increases potentially indicated greater ecological vulnerability under intensified precipitation. Moreover, the increase in EE values across reduction levels indicated a stable response of basal resource utilization to decreasing phytoplankton biomass.
The ocean deoxygenation scenario triggered a threshold-type response that was characterized by abrupt transitions from stability to collapse, as evidenced by EE values exceeding 1. Xinghua Bay and Fuqing Bay displayed immediate fragility, with instability emerging already in the low deoxygenation scenario. This indicates that the energy demand placed on shrimp populations surpassed their modeled available production, signifying a breakdown in the mass balance, even under mild hypoxic stress. The models remained highly unbalanced at moderate and severe deoxygenation levels, demonstrating complete structural failure driven by unsustainable trophic demand. In contrast, the compensatory response of Sansha Bay was limited, and it maintained its structural stability in the severe deoxygenation scenario.
The differences reflect the industrial and ecological characteristics of the bays. Industrial and intensive mariculture wastewater contribute to long-term eutrophication, which accelerates marine deoxygenation processes (Cai et al., 2025). In Fuqing Bay, long-term organic enrichment from aquaculture effluents and industrial discharge likely intensified oxygen depletion and exacerbated sensitivity to hypoxia. In Sansha Bay, sediment accumulation from aquaculture and coastal manufacturing activities has increased benthic organic loading, which delays hypoxia-induced stress until thresholds are crossed. In Xinghua Bay, intensive aquaculture has placed the bay in a state of high metabolic load and phytoplankton-driven energy flow, with extremely tight system energy budgets and low ecological redundancy. The minor hydrodynamic changes associated with offshore wind farm construction may have further impacted local organic matter distribution and oxygen exchange (Daewel et al., 2022), resulting in the lowest dynamic threshold to deoxygenation and leading to immediate collapse.
Unlike precipitation and deoxygenation, the impact of ocean warming on all three bays was linear. The bivalve ecological carrying capacity decreased proportionally with a reduction in biomass at higher trophic levels. As the higher trophic levels declined by 20, 35, and 50%, the carrying capacity decreased proportionally. According to the metabolic theory of ecology proposed by Brown et al. (2004), increasing temperatures generally accelerate the metabolic rates of organisms, thereby disrupting ecosystem structure and function by altering food webs and energy flux (Gomes et al., 2024). Although metabolic rate and temperature have a theoretical exponential relationship within the small temperature increase range examined in the present study, this exponential effect was mathematically approximately linear, causing a decline in the bivalve ecological carrying capacity to exhibit a local linear trend.
Baseline ecological carrying capacity plays a key role in determining the absolute potential of each bay to sustain bivalve populations under climate stress. The magnitude of the decline depended strongly on baseline productivity. Fuqing Bay, with the highest baseline capacity and nutrient input, maintained the greatest absolute potential even under severe stress, suggesting strong metabolic buffering. Sansha Bay, with lower baseline biomass and weaker trophic coupling, showed the smallest absolute decline but the lowest overall capacity. The results emphasize that baseline productivity and system connectivity jointly determine the absolute and relative resilience of coastal ecosystems to warming conditions.
Among the three simulated response modes, threshold-type dynamics warrant particular attention because they represent non-linear ecosystem responses to external stresses. Similar threshold-type dynamics have been reported widely in ecological literature, indicating that marine ecosystems are particularly prone to abrupt regime shifts. Burkett et al. (2005) demonstrated that climate change leads to rapid threshold responses in ecological communities, including coastal ecosystems in North America. Jutras et al. (2023) revealed a non-linear and abruptly accelerating worsening of bottom-water hypoxia in the St. Lawrence Estuarine System, providing strong evidence for understanding the non-linear responses of ecosystems to climate change. Such findings reinforce the importance of identifying early warning indicators and maintaining functional redundancy to prevent regime shifts under compounded climate and anthropogenic pressures.
The simulation results provide partial support for H1. As anticipated, Fuqing Bay and Sansha Bay, which possess higher trophic diversity and more internally coupled energy pathways, showed less fluctuations in system-level indicators under climate stressors. Their more complex trophic structures appear to buffer perturbations by distributing impacts across multiple energy pathways. The findings also support H2. Xinghua Bay, characterized by high-intensity bivalve culture and a simplified food-web structure, exhibited greater variability in biomass distributions and system indicators across scenarios. The dominance of a single suspension-feeding guild limits compensatory dynamics and reduces the capacity of the system to absorb environmental shocks. The comparative evidence indicates that trophic complexity enhances climate resistance, whereas mariculture-driven simplification amplifies sensitivity, consistent with the conceptual expectations outlined in H1 and H2.
4.3 Implications and future directions
The comparative modeling results provide valuable insights into how structural heterogeneity and humans shape ecosystem resilience along the coast of Fujian. Recognizing constant, threshold, and linear response modes can guide adaptive management by identifying systems that require priority monitoring under climate stressors. Xinghua Bay should be prioritized for oxygen monitoring and load management, whereas maintaining hydrodynamic exchange in Fuqing Bay may enhance its resilience to precipitation and warming. In Sansha Bay, nutrient inputs from aquaculture should be mitigated and sediment management enhanced to support ecosystem stability. The findings have several critical implications for ecosystem-based management and policies. First, for Environmental Monitoring Agencies, the identification of threshold-type responses underscores the need for a precautionary approach in coastal management. Since crossing ecological thresholds can lead to slow or irreversible recovery, managers should prioritize establishing early warning systems based on critical indicators to prevent catastrophic ecosystem collapse, rather than relying solely on routine seasonal monitoring. Second, for Fisheries and Aquaculture Management, the observed response patterns emphasize that management strategies cannot rely solely on linear projections of environmental change; adaptive strategies tailored to ecosystem-specific dynamics are necessary. This entails intricate trade-offs among ecological health, economic benefits, and climate resilience, which is a fundamental multi-objective optimization challenge (Meng et al., 2016; Yang et al., 2021a). More consideration should be given to the integration of multiple objectives in the future coastal management policy framework (Kong et al., 2023; Yang et al., 2021b). Third, for Blue Carbon Policy Makers, the results reveal that the stability of coastal carbon sinks is not uniform. Policies aimed at enhancing blue carbon must be site-specific. For instance, in fragile systems such as Sansha Bay, mitigating nutrient runoff from aquaculture is a prerequisite for ensuring long-term carbon sequestration, while in Xinghua Bay, managing hypoxia risk is paramount. By integrating these system-specific vulnerabilities into policy frameworks, agencies can move from a reactive to a proactive, ecosystem-based management approach.
Although the present study provides a systematic evaluation of climate sensitivity, several limitations point to important directions for future research. First, the Ecopath modeling framework, although powerful for food web simulations, simplifies trophic complexity by aggregating species into functional groups and does not account for long-term processes such as species migration, geographical dispersal, or regime shifts. These dynamics may fundamentally alter the energy flows under sustained climate stress. Future research could explore heuristic or hybrid modeling approaches, which may better capture the inherent randomness and high uncertainty in complex ecological processes (Liao et al., 2025; Zhang et al., 2016). Second, the temporal scope of the baseline data limits the long-term applicability of the findings, and future work would benefit from synchronized surveys or long-term time-series modeling to disentangle temporal effects from spatial structural differences and to provide stronger comparability among bay-scale ecosystem assessment. In addition, integrating time-series data and dynamic climate models would improve temporal resolution and predictive reliability.
A major limitation of this study is the independent investigation of single stressors, which does not capture the interactive effects of multiple concurrent pressures (Piggott et al., 2015). In reality, climate stressors, such as warming, deoxygenation, and increased precipitation often co-occur and can interact synergistically. For instance, ocean warming not only reduces oxygen solubility but also elevates metabolic oxygen demand, thereby accelerating deoxygenation (Breitburg et al., 2018; IPCC, 2022b). The effect can be compounded further by increased precipitation, which enhances terrestrial runoff of dissolved organic carbon, fueling microbial respiration and intensifying coastal hypoxia. Such multi-stressor interactions could lower the resilience of ecosystems, push them toward tipping points more rapidly than predicted by single-stressor models, and potentially reshape response patterns from linear to abrupt threshold collapses. Therefore, future research should prioritize multi-stressor scenarios to provide a more holistic and realistic assessment of coastal ecosystem vulnerability. By linking food web dynamics to climate adaptation strategies, the present study provides a scientific foundation for designing climate-resilient coastal management and policies that contribute to the broader goals of marine sustainability under accelerating global change.
5 Conclusion
The present study provides a systematic assessment of the ecological responses of three representative coastal bays to major climatic stressors using the Ecopath model. The results demonstrated a complex interaction in which the nature of the climate stressor dictated the dynamic response mode, with three distinct patterns, including 1) a constant response, where systems showed structural stability under increased precipitation; 2) a linear decline, where bivalve ecological carrying capacity decreased proportionally with warming; and 3) a non-linear threshold collapse, where deoxygenation triggered abrupt systemic failure. Crucially, vulnerability was determined by the baseline structure of each bay, with the high-metabolism Xinghua Bay being most susceptible to threshold collapse.
Overall, the present study enhances our understanding of differentiated sensitivity and resilience among coastal ecosystems in the region. The findings emphasize the importance of management and adaptation strategies that reflect the structural and functional characteristics of individual bays. By grounding climate response analysis within a comparative and region-specific framework, the present study provides a scientific basis for enhancing the sustainability, carbon sink function, and adaptive capacity of coastal ecosystems under ongoing climate change.
Data availability statement
The original contributions presented in the study are included in the article/Supplementary Material. Further inquiries can be directed to the corresponding author.
Author contributions
YL: Conceptualization, Funding acquisition, Writing – review & editing. FX: Writing – original draft, Writing – review & editing, Data curation, Methodology, Formal Analysis. XZ: Writing – review & editing, Funding acquisition. FH: Writing – review & editing, Resources. JL: Writing – original draft, Visualization, Data curation. BC: Writing – review & editing, Validation, Visualization.
Funding
The author(s) declared that financial support was received for this work and/or its publication. This study was supported by the Xiamen Municipal Bureau of Science and Technology, People’s Republic of China [grant 3502Z202573067], Key Laboratory of Marine Spatial Planning Technology, China Oceanic Development Foundation, People’s Republic of China [grant ZK-HZ25005], High-level Talent Program from Xiamen University of Technology, People’s Republic of China [grant YKJ24008R], and National Natural Science Foundation of China, People’s Republic of China [grant 42206239].
Acknowledgments
We would like to thank Editage (www.editage.cn) for English language editing.
Conflict of interest
The author(s) declared that this work was conducted in the absence of any commercial or financial relationships that could be construed as a potential conflict of interest.
Generative AI statement
The author(s) declared that generative AI was not used in the creation of this manuscript.
Any alternative text (alt text) provided alongside figures in this article has been generated by Frontiers with the support of artificial intelligence and reasonable efforts have been made to ensure accuracy, including review by the authors wherever possible. If you identify any issues, please contact us.
Publisher’s note
All claims expressed in this article are solely those of the authors and do not necessarily represent those of their affiliated organizations, or those of the publisher, the editors and the reviewers. Any product that may be evaluated in this article, or claim that may be made by its manufacturer, is not guaranteed or endorsed by the publisher.
Supplementary material
The Supplementary Material for this article can be found online at: https://www.frontiersin.org/articles/10.3389/fmars.2025.1746943/full#supplementary-material
References
Alva-Basurto J. C. and Arias-González J. E. (2014). Modelling the effects of climate change on a Caribbean coral reef food web. Ecol. Model. 289, 1–14. doi: 10.1016/j.ecolmodel.2014.06.014
Andersen K. H., Beyer J. E., and Lundberg P. (2008). Trophic and individual efficiencies of size-structured communities. Proc. R. Soc. B: Biol. Sci. 276, 109–114. doi: 10.1098/rspb.2008.0951
Balch W., Huntington T., Aiken G., Drapeau D., Bowler B., Lubelczyk L., et al. (2016). Toward a quantitative and empirical dissolved organic carbon budget for the Gulf of Maine, a semienclosed shelf sea. Global Biogeochemical Cycles 30, 268–292. doi: 10.1002/2015GB005332
Breitburg D., Levin L. A., Oschlies A., Grégoire M., Chavez F. P., Conley D. J., et al. (2018). Declining oxygen in the global ocean and coastal waters. Science 359, eaam7240. doi: 10.1126/science.aam7240
Brown J. H., Gillooly J. F., Allen A. P., Savage V. M., and West G. B. (2004). Toward A metabolic theory of ecology. Ecology 85, 1771–1789. doi: 10.1890/03-9000
Burkett V. R., Wilcox D. A., Stottlemyer R., Barrow W., Fagre D., Baron J., et al. (2005). Nonlinear dynamics in ecosystem response to climatic change: Case studies and policy implications. Ecol. Complexity 2, 357–394. doi: 10.1016/j.ecocom.2005.04.010
Byron C., Link J., Costa-Pierce B., and Bengtson D. (2011). Calculating ecological carrying capacity of shellfish aquaculture using mass-balance modeling: Narragansett Bay, Rhode Island. Ecol. Model. 222, 1743–1755. doi: 10.1016/j.ecolmodel.2011.03.010
Cai S., Liu S., Lao Q., Chen C., Jiang C., Lu X., et al. (2025). Human-driven nutrient structure shifts as a new driver of coastal deoxygenation: Evidence from long-term observations in a bay with frequent human activities. Mar. pollut. Bull. 220, 118444. doi: 10.1016/j.marpolbul.2025.118444
Cai H., Zhang J., Lv Z., and Wang Y. (2021). Biodiversity and community structure of nekton in the Xinghua Bay, Fujian Province. Trans. Oceanology Limnology 43, 83–91. doi: 10.13984/j.cnki.cn37-1141.2021.06.012
Chapman E. J., Byron C. J., Lasley-Rasher R., Lipsky C., Stevens J. R., and Peters R. (2020). Effects of climate change on coastal ecosystem food webs: Implications for aquaculture. Mar. Environ. Res. 162, 105103. doi: 10.1016/j.marenvres.2020.105103
Cheung W. W. L., Lam V. W. Y., Sarmiento J. L., Kearney K., Watson R., Zeller D., et al. (2010). Large-scale redistribution of maximum fisheries catch potential in the global ocean under climate change. Global Change Biol. 16, 24–35. doi: 10.1111/j.1365-2486.2009.01995.x
Christensen V. and Walters C. J. (2004). Ecopath with Ecosim: methods, capabilities and limitations. Ecol. Model. 172, 109–139. doi: 10.1016/j.ecolmodel.2003.09.003
Christensen V., Walters C., and Pauly D. (2005). Ecopath with Ecosim: A User’s Guide Vol. 12 (Penang, Malaysia: Fisheries Centre, University of British Columbia, Vancouver, Canada and ICLARM).
Chust G., Allen I., Bopp L., Schrum C., Holt J., Tsiaras K., et al. (2014). Biomass changes and trophic amplification of plankton in A warmer ocean. Global Change Biol. 20, 2124–2139. doi: 10.1111/gcb.12562
Coll M., Palomera I., Tudela S., and Dowd M. (2008). Food-web dynamics in the South Catalan Sea ecosystem (NW Mediterranean) for 1978–2003. Ecol. Model. 217, 95–116. doi: 10.1016/j.ecolmodel.2008.06.013
Daewel U., Akhtar N., Christiansen N., and Schrum C. (2022). Offshore wind farms are projected to impact primary production and bottom water deoxygenation in the North Sea. Commun. Earth Environ. 3, 292. doi: 10.1038/s43247-022-00625-0
Diaz R. J. and Rosenberg R. (2008). Spreading dead zones and consequences for marine ecosystems. Science 321, 926–929. doi: 10.1126/science.1156401
Ding W., Wu Q., and Chen Y. (2024). Trends of maximum annual sea surface temperature in the Eastern China Seas. Front. Mar. Sci. 11. doi: 10.3389/fmars.2024.1452125
Doney S. C., Ruckelshaus M., Emmett Duffy J., Barry J. P., Chan F., English C. A., et al. (2012). Climate change impacts on marine ecosystems. Annu. Rev. Mar. Sci. 4, 11–37. doi: 10.1146/annurev-marine-041911-111611
Fan Y. R., Huang G. H., Li Y. P., Wang X. Q., Li Z., and Jin L. (2017). Development of PCA-based cluster quantile regression (PCA-CQR) framework for streamflow prediction: Application to the Xiangxi river watershed, China. Appl. Soft Computing 51, 280–293. doi: 10.1016/j.asoc.2016.11.039
Fang Y., Li M., Liu X., Song Y., Lin M., and Yao H. (2024). Response of heavy metal distribution of surface sediments to aquaculture in Sansha Bay, Fujian. J. East China Normal University(Natural Science), 2024, 144–156.
Gao S., Chen Z., Lu Y., Li Z., Zhang S., and Yu W. (2022). Comparison of marine ecosystems of haizhou bay and lvsi fishing ground in China based on the ecopath model. Water 14, 1397. doi: 10.3390/w14091397
Gattuso J.-P., Magnan A., Billé R., Cheung W. W. L., Howes E. L., Joos F., et al. (2015). Contrasting futures for ocean and society from different anthropogenic CO2 emissions scenarios. Science 349, aac4722. doi: 10.1126/science.aac4722
Gomes D. G. E., Ruzicka J. J., Crozier L. G., Huff D. D., Brodeur R. D., and Stewart J. D. (2024). Marine heatwaves disrupt ecosystem structure and function via altered food webs and energy flux. Nat. Commun. 15, 1988. doi: 10.1038/s41467-024-46263-2
He L., Yang P., Tan L., Tong C., and Huang J. (2019). Nutrient distribution of overlying water in tidal marshes in five estuaries and bays of the Fuzhou region in autumn. Environ. Sci. 40, 1788–1796. doi: 10.13227/j.hjkx.201807267
Heymans J. J., Coll M., Link J. S., Mackinson S., Steenbeek J., Walters C., et al. (2016). Best practice in Ecopath with Ecosim food-web models for ecosystem-based management. Ecol. Model. 331, 173–184. doi: 10.1016/j.ecolmodel.2015.12.007
IPCC (2022a). Summary for Policymakers, in: The Ocean and Cryosphere in a Changing Climate: Special Report of the Intergovernmental Panel on Climate Change (Cambridge: Cambridge University Press), 3–36. doi: 10.1017/9781009157964.001
IPCC (2022b). “Changing ocean, marine ecosystems, and dependent communities,” in The Ocean and Cryosphere in a Changing Climate: Special Report of the Intergovernmental Panel on Climate Change (Cambridge University Press, Cambridge), 447–588. doi: 10.1017/9781009157964.007
Jutras M., Mucci A., Chaillou G., Nesbitt W. A., and Wallace D. W. R. (2023). Temporal and spatial evolution of bottom-water hypoxia in the St Lawrence estuarine system. Biogeosciences 20, 839–849. doi: 10.5194/bg-20-839-2023
Kang B., Pecl G. T., Lin L., Sun P., Zhang P., Li Y., et al. (2021). Climate change impacts on China’s marine ecosystems. Rev. Fish Biol. Fisheries 31, 599–629. doi: 10.1007/s11160-021-09668-6
Kong X., Yang Y., Lv Z., Zhao J., and Fu R. (2023). A dynamic dual-population co-evolution multi-objective evolutionary algorithm for constrained multi-objective optimization problems. Appl. Soft Computing 141, 110311. doi: 10.1016/j.asoc.2023.110311
Levin L. A., Ekau W., Gooday A. J., Jorissen F., Middelburg J. J., Naqvi S. W. A., et al. (2009). Effects of natural and human-induced hypoxia on coastal benthos. Biogeosciences 6, 2063–2098. doi: 10.5194/bg-6-2063-2009
Li D., Chen J., Wang B., Jin H., Shou L., Lin H., et al. (2024). Hypoxia triggered by expanding river plume on the East China Sea inner shelf during flood years. J. Geophysical Research: Oceans 129, e2024JC021299. doi: 10.1029/2024JC021299
Li J., Lu X., Zhu Q., Zhuang Y., Yang W., and Qi D. (2025). Nitrate δ15N and δ18O values reveal mariculture impacts on nitrogen cycling in Sansha Bay, SE China. J. Mar. Sci. Eng. 13. doi: 10.3390/jmse13020343
Liao B., Yang Y., Xu J., Kong X., and Su J. (2025). A constrained multi-objective evolutionary algorithm with tri-populations assisted by an additional objective function. Cluster Computing 28, 261. doi: 10.1007/s10586-024-04944-z
Lin H., Chen Z., Hu J., Cucco A., Zhu J., Sun Z., et al. (2017). Numerical simulation of the hydrodynamics and water exchange in Sansha Bay. Ocean Eng. 139, 85–94. doi: 10.1016/j.oceaneng.2017.04.031
Lin Q., Lin B., Zhang D., and Wu J. (2022). Web-based prototype system for flood simulation and forecasting based on the HEC-HMS model. Environ. Model. Software 158, 105541. doi: 10.1016/j.envsoft.2022.105541
Liu H., Wu Q., Luo Z., and Pan W. (2009). Model study on the tidal regime and pollutant transport in the Fuqing Bay. J. Xiamen Univ. (Natural Science) 48, 139–143.
Lotze H. K., Tittensor D. P., Bryndum-Buchholz A., Eddy T. D., Cheung W. W. L., Galbraith E. D., et al. (2019). Global ensemble projections reveal trophic amplification of ocean biomass declines with climate change. Proc. Natl. Acad. Sci. 116, 12907–12912. doi: 10.1073/pnas.1900194116
Ma Z., Guo Q., Yang F., Chen H., Li W., Lin L., et al. (2021). Recent changes in temperature and precipitation of the summer and autumn seasons over Fujian Province, China. Water 13, 1900. doi: 10.3390/w13141900
Mcleod E., Chmura G. L., Bouillon S., Salm R., Björk M., Duarte C. M., et al. (2011). A blueprint for blue carbon: toward an improved understanding of the role of vegetated coastal habitats in sequestering CO2. Front. Ecol. Environ. 9, 552–560. doi: 10.1890/110004
Meng Z., Pan J.-S., and Xu H. (2016). QUasi-Affine TRansformation Evolutionary (QUATRE) algorithm: A cooperative swarm based algorithm for global optimization. Knowledge-Based Syst. 109, 104–121. doi: 10.1016/j.knosys.2016.06.029
Outeiro L., Byron C., and Angelini R. (2018). Ecosystem maturity as a proxy of mussel aquaculture carrying capacity in Ria de Arousa (NW Spain): A food web modeling perspective. Aquaculture 496, 270–284. doi: 10.1016/j.aquaculture.2018.06.043
Pacifici M., Foden W. B., Visconti P., Watson J. E. M., Butchart S. H. M., Kovacs K. M., et al. (2015). Assessing species vulnerability to climate change. Nat. Climate Change 5, 215–224. doi: 10.1038/nclimate2448
Piggott J. J., Townsend C. R., and Matthaei C. D. (2015). Reconceptualizing synergism and antagonism among multiple stressors. Ecol. Evol. 5, 1538–1547. doi: 10.1002/ece3.1465
Plaganyi E. (2007). Models for an Ecosystem Approach to Fisheries (Rome, Italy:FAO Fisheries Technical Paper).
Potier M., Savina-Rolland M., Belloeil P., Gascuel D., and Robert M. (2025). How will the cumulative effects of fishing and climate change affect the health and resilience of the Celtic Sea ecosystem? Sci. Total Environ. 969, 178942. doi: 10.1016/j.scitotenv.2025.178942
Raptis N., Papantoniou G., Raitsos D. E., Damalas D., and Tsagarakis K. (2025). Ecopath modelling Unravels the food web of the Gulf of Corinth, a deep Mediterranean important marine Mammal area. Deep Sea Res. Part I: Oceanographic Res. Papers 218, 104466. doi: 10.1016/j.dsr.2025.104466
Song Y., Li M., Fang Y., Liu X., Yao H., Fan C., et al. (2023). Effect of cage culture on sedimentary heavy metal and water nutrient pollution: Case study in Sansha Bay, China. Sci. Total Environ. 899, 165635. doi: 10.1016/j.scitotenv.2023.165635
Stock A., Murray C. C., Gregr E. J., Steenbeek J., Woodburn E., Micheli F., et al. (2023). Exploring multiple stressor effects with Ecopath, Ecosim, and Ecospace: Research designs, modeling techniques, and future directions. Sci. Total Environ. 869, 161719. doi: 10.1016/j.scitotenv.2023.161719
Su Y., Wen Y., and Yang A. (2022). “Future Changes in Precipitation over Fujian Province using RegCM4 under RCP Emission Scenarios,” in Proceedings of the 2022 8th International Conference on Computing and Data Engineering, ICCDE ‘22, (New York, NY, USA: Association for Computing Machinery). 34–38. doi: 10.1145/3512850.3512864
Ullah H., Nagelkerken I., Goldenberg S. U., and Fordham D. A. (2018). Climate change could drive marine food web collapse through altered trophic flows and cyanobacterial proliferation. PloS Biol. 16, 1–21. doi: 10.1371/journal.pbio.2003446
van der Schatte Olivier A., Jones L., Vay L. L., Christie M., Wilson J., and Malham S. K. (2020). A global review of the ecosystem services provided by bivalve aquaculture. Rev. Aquaculture 12, 3–25. doi: 10.1111/raq.12301
Vaquer-Sunyer R. and Duarte C. M. (2008). Thresholds of hypoxia for marine biodiversity. Proc. Natl. Acad. Sci. 105, 15452–15457. doi: 10.1073/pnas.0803833105
Wang Q., Li Y., Li Q., Liu Y., and Wang Y. (2019). Changes in means and extreme events of sea surface temperature in the East China seas based on satellite data from 1982 to 2017. Atmosphere. 10, 140. doi: 10.3390/atmos10030140
Wang Y., Li J., Zhong Y., Zhu S., Guo D., and Shang S. (2019). Discovery of accessible locations using region-based geo-social data. World Wide Web 22, 929–944. doi: 10.1007/s11280-018-0538-5
Wang D., Li J., and Zhu S. (2021). Detecting urban hot regions by using massive geo-tagged image data. Neurocomputing 428, 325–331. doi: 10.1016/j.neucom.2020.03.121
Wang E., Yang Y., Sun Y., Wang J., Chen X., Yang J., et al. (2025). Comprehensive assessment of heavy metal pollution in northeast Fuqing Bay: integrating sediments, seawater, and marine organisms analysis with multivariate techniques. Front. Mar. Sci. 12. doi: 10.3389/fmars.2025.1684021
Yan J., Chen Y., Cao Y., Sun J., Wen B., Gao X., et al. (2025). Marine ranching enhances ecosystem stability and biological carbon sequestration potential: insights from Ecopath with Ecosim model simulation of 30-year ecological path of a national marine ranching in China. Front. Mar. Sci. 12. doi: 10.3389/fmars.2025.1583896
Yang L., Guo W., Chen N., Hong H., Huang J., Xu J., et al. (2013). Influence of a summer storm event on the flux and composition of dissolved organic matter in a subtropical river, China. Appl. Geochemistry 28, 164–171. doi: 10.1016/j.apgeochem.2012.10.004
Yang Y., Liu J., and Tan S. (2021a). A partition-based constrained multi-objective evolutionary algorithm. Swarm Evolutionary Comput. 66, 100940. doi: 10.1016/j.swevo.2021.100940
Yang Y., Liu J., and Tan S. (2021b). A multi-objective evolutionary algorithm for steady-state constrained multi-objective optimization problems. Appl. Soft Computing 101, 107042. doi: 10.1016/j.asoc.2020.107042
Yao H., Li M., Liu X., Li W., Song Y., Chen J., et al. (2025). Joint effect of aquaculture and land reclamation on sediment dynamics. J. Hydrology: Regional Stud. 60, 102561. doi: 10.1016/j.ejrh.2025.102561
Zhang W., Dunne J. P., Wu H., Zhou F., and Huang D. (2022). Using timescales of deficit and residence to evaluate near-bottom dissolved oxygen variation in coastal seas. J. Geophysical Research: Biogeosciences 127, e2021JG006408. doi: 10.1029/2021JG006408
Zhang X., Huang B., and Tay R. (2016). Estimating spatial logistic model: A deterministic approach or a heuristic approach? Inf. Sci. 330, 358–369. doi: 10.1016/j.ins.2015.10.015
Zhang S., Li Z., Lin H., Huang Y., He X., Lin J., et al. (2023). Macrobenthos community changes before and after the construction of offshore wind farm in Xinghua Bay. J. Appl. Oceanography 42, 591–603.
Zhang X., Lin Y., Liu K., Yu S., Huang Y., Zhang S., et al. (2025). Macrobenthic community structure and its temporal and spatial variations in Xinghua Bay, Fujian. J. Appl. Oceanography 44, 279–289.
Zhang X., Song H., Zhuang H., Yi S., Hong X., Chu J., et al. (2023). Calculating the carrying capacity of bivalve mariculture in the Changshan Archipelago (Bohai Strait, China): Ecopath modeling perspective. J. Sea Res. 192, 102367. doi: 10.1016/j.seares.2023.102367
Zhang H., Wu J., and HE P. (2020). Primary research on the impacts of marine environment ecology from the offshore wind farm operation. J. Fisheries Res. 42, 223–233.
Keywords: climate stressors, coastal ecosystem structure, constant patterns, ecopath model, linear patterns, non-linear threshold patterns, scenario analysis
Citation: Lin Y, Xin F, Zhao X, Huang F, Liao J and Chen B (2026) How do different baseline food web structures shape coastal ecosystem response patterns to climate change in three bays of Fujian, China? Front. Mar. Sci. 12:1746943. doi: 10.3389/fmars.2025.1746943
Received: 15 November 2025; Accepted: 29 December 2025; Revised: 16 December 2025;
Published: 19 January 2026.
Edited by:
Yidan Xu, Maastricht University, NetherlandsReviewed by:
Wei Yang, Jimei University, ChinaChengxue Li, Stony Brook University, United States
Yancheng Tao, Guangxi Academy of Marine Sciences (Guangxi Mangrove Research Center), China
Copyright © 2026 Lin, Xin, Zhao, Huang, Liao and Chen. This is an open-access article distributed under the terms of the Creative Commons Attribution License (CC BY). The use, distribution or reproduction in other forums is permitted, provided the original author(s) and the copyright owner(s) are credited and that the original publication in this journal is cited, in accordance with accepted academic practice. No use, distribution or reproduction is permitted which does not comply with these terms.
*Correspondence: Fei Xin, eGluZmVpMjgxMEBnbWFpbC5jb20=
†These authors share first authorship