Abstract
Under accelerating coastal eutrophication, disentangling the relative roles of light limitation and nitrogen enrichment is essential for diagnosing seagrass decline. We conducted a fully crossed light × ammonium experiment using intact Zostera marina cores from Guzhenkou Bay (4 irradiance levels: 180, 90.6, 17, 0 μmol photons m-2 s-1; 4 NH4Cl levels: 0, 25, 50, 100 μmol L-1; 5 weeks; 16 units; no within-cell replication). Across traits, irradiance—not NH4Cl within the tested range—governed responses at the level of dominant main effects. Shading sharply reduced shoot density, above- and below-ground biomass (AGB, BGB) and Fv/Fm, with near-complete collapse at darkness. Biomass turnover accelerated under shading (higher above-ground shedding, below-ground mass loss), and below-ground carbon content declined, together indicating a shift from carbon accrual to expenditure. By contrast, NH4Cl enrichment showed minimal main effects on morphology, pigments, Fv/Fm, or antioxidant enzymes, although tissue δ15N decreased with NH4Cl addition, evidencing ammonium assimilation. Antioxidant responses were variable (POD increased with reduced irradiance; SOD, CAT, GSH-Px inconsistent), while MDA did not increase under shading and was occasionally higher under high light, consistent with lower photo-oxidative load at low irradiance. Leaf and rhizome δ13C showed no significant treatment effects and only a weak, non-significant tendency toward less negative values under severe shading. Collectively, the trait suite diagnoses light-driven carbon limitation as the proximal stressor, with nitrogen effects contingent on concentration and context. We recommend tiered monitoring that couples rapid photophysiology (Fv/Fm) with structural (shoot density, AGB/BGB) and integrative biogeochemical indicators (below-ground C; δ-isotopes), and management focused on water clarity to meet species-specific light requirements.
1 Introduction
Seagrass meadows provide foundational coastal services—stabilizing sediments, sequestering carbon, and supporting fisheries (Unsworth et al., 2018; Kent et al., 2021; Serrano et al., 2021). Yet many populations persist close to their light limits, making them highly sensitive to turbidity pulses and chronic eutrophication (Ralph et al., 2007; Bulmer et al., 2018; Van Katwijk et al., 2024). Although nutrient supply can alter growth and physiology, restoration trajectories often hinge on maintaining a positive carbon balance, which is primarily governed by irradiance at the canopy (Ralph et al., 2007). Accordingly, disentangling the roles of light and nitrogen remains both a practical and theoretical priority for management and recovery planning (Ralph et al., 2007; Van Katwijk et al., 2024).
Zostera marina is a foundation species widely distributed in temperate coastal ecosystems of the Northern Hemisphere (Green and Short, 2003; Olsen et al., 2016). Importantly, Z. marina has been extensively used as a model seagrass species in studies examining light limitation (Bertelli and Unsworth, 2018) and nutrient enrichment (Van Katwijk et al., 1997), providing a well-established empirical basis for evaluating how irradiance and ammonium availability jointly shape early growth trajectories under controlled conditions relevant to coastal eutrophication.
Light governs both instantaneous photochemistry and whole-plant carbon economics in seagrasses: when irradiance drops below compensation, positive carbon balance cannot be maintained, precipitating growth decline and range contraction (Ralph et al., 2007). Consistent with this framework, short-term shading rapidly depletes rhizome and root non-structural carbohydrates (NSC) and reduces biomass and shoot density, reflecting a shift from carbon accrual to carbon expenditure (Burke et al., 1996; Wong et al., 2021). Early-warning signals of this transition typically include declines in photophysiology (Fv/Fm), suppressed leaf extension, and reductions in above- and below-ground biomass, often accompanied by accelerated tissue turnover (senescent leaf loss and below-ground mass loss) (Burke et al., 1996; Ralph et al., 2007; Wong et al., 2021). At the same time, as excitation pressure wanes, chloroplast redox control follows a ‘push–pull’ behavior in which reactive oxygen species (ROS) generation depends on light-driven reductant supply, so oxidative damage does not necessarily intensify under shading (Foyer and Noctor, 2016).
Nitrogen supply can modulate the light-driven trajectory in two opposing ways. Low–moderate enrichment may alleviate nutrient limitation and transiently stimulate growth, whereas high ammonium (NH4+) or co-stress with low light imposes metabolic costs and can become toxic (Van Katwijk et al., 1997; Touchette and Burkholder, 2000). Mechanistically, low irradiance enhances ammonium toxicity because photosynthesis and the carbon stores required to assimilate NH4+ into amino acids are reduced (Collos and Harrison, 2014), consistent with reports that elevated ammonium and low light form a dangerous synergy for eelgrass (Villazán et al., 2013). Importantly, the magnitude and direction of nitrogen effects depend strongly on dose, exposure duration, and light context, highlighting the need to evaluate nitrogen responses within ecologically realistic concentration ranges rather than assuming uniformly negative effects (Van Katwijk et al., 1997; Touchette and Burkholder, 2000). Critically, nitrogen effects depend on dose, exposure duration and light context; therefore, diagnosing limitation is best achieved with a multi-metric suite spanning morphology (shoot density/biomass), photophysiology (Fv/Fm) and, where feasible, biogeochemistry (NSC, δ-isotopes) rather than reliance on a single indicator (McMahon et al., 2013; Collier et al., 2016; Roca et al., 2016; Statton et al., 2017). Within this framework, antioxidant enzyme activities (e.g. SOD, CAT, GSH-Px, POD) and lipid peroxidation products (MDA) provide complementary indicators of cellular redox balance and photo-oxidative stress, allowing discrimination between carbon limitation driven by light reduction and stress responses associated with excess excitation energy (Foyer and Noctor, 2016; Bertelli and Unsworth, 2018).
Here, we employed intact Z. marina cores from Guzhenkou Bay in a fully crossed 4 × 4 irradiance (180, 90.6, 17, 0 μmol photons m-2 s-1) × NH4Cl addition (0, 25, 50, 100 μmol L-1) matrix over five weeks. The experimental gradients were designed to represent generalized light and ammonium conditions relevant to coastal eutrophication, rather than to reproduce site-specific environmental conditions at Guzhenkou Bay. The selected ammonium concentrations span background to elevated levels commonly reported in eutrophic coastal waters, while remaining below or near thresholds previously associated with acute toxicity in Z. marina, thereby enabling assessment of dose-dependent responses under contrasting light regimes (Van Katwijk et al., 1997; Villazán et al., 2013). Our aim was to determine whether irradiance or ammonium enrichment exerts the dominant control on early structural, physiological and isotopic responses. We quantified (i) structural metrics (shoot density, leaf length, above- and below-ground biomass, leaf shedding rate and below-ground mass loss), (ii) photophysiological/pigment parameters (Fv/Fm, Rubisco activity, chlorophyll a and b), (iii) antioxidant enzyme activities (SOD, CAT, GSH-Px, POD) and malondialdehyde (MDA), and (iv) elemental/isotopic composition (C, N, δ13C, δ15N). Because each light × nutrient cell lacked replicates, we restricted inference to main effects of irradiance and ammonium, acknowledging that interaction effects are confounded with residual error. We hypothesized that (1) irradiance would dominate responses across hierarchical levels—indicative of carbon limitation under shading, (2) within the tested ammonium range, NH4Cl alone would induce minimal structural or photophysiological effects but would be traceable isotopically via declining δ15N, and (3) antioxidant enzyme and MDA responses would reflect reduced photo-oxidative load under low irradiance rather than increased oxidative damage. Our results support these hypotheses and suggest a tiered, field-transferable monitoring framework aligning rapid photophysiology with structural and isotopic indicators, while reaffirming water-clarity (and thus canopy irradiance) as the primary management focus.
2 Materials and methods
2.1 Sampling and experimental design
A total of sixteen undisturbed seagrass–sediment cores were collected from Guzhenkou Bay. Sampling was conducted using PVC cylinders (18 cm outer diameter, 17.69 cm inner diameter, 15 cm height). After being carefully excavated with a shovel, each core was sealed in a zip-lock bag and secured within the PVC cylinder using adhesive tape to preserve its natural structure. All cores were then placed in insulated containers with ice packs and immediately transported to the laboratory. After collection and transport (Day 1), cores were allowed to recover overnight under controlled laboratory conditions. On Day 2, experimental treatments were initiated immediately thereafter, without an extended acclimation period.
In the laboratory, each core was standardized to three shoots trimmed to 30 cm in height and transferred to an individual aerated seawater pot (inner diameter 19.5 cm, height 80 cm; 23 ± 1°C; 12 h light: 12 h dark). To minimize variation in initial plant size and biomass among experimental units, all cores were visually inspected prior to treatment initiation, and only intact cores with comparable shoot vigor, morphology, and sediment structure were selected. The number of shoots per core was fixed (n = 3), reflecting typical shoot densities observed in the source meadow and allowing sufficient biomass for subsequent analyses while minimizing within-core self-shading. Shoot height was standardized to 30 cm to ensure comparable initial aboveground biomass and canopy structure across treatments. Initial leaf number per shoot was not explicitly quantified; however, the above visual selection ensured comparable leaf development and overall plant condition among experimental units.
A fully crossed 4 × 4 irradiance × nutrient matrix was established, with one experimental unit per treatment combination (i.e., no within-treatment replication). Irradiance was set to 180 (high light; H), 90.6 (medium light; M), 17 (low light; L) or 0 (darkness; EL) μmol photons m-2 s-1 using dimmable LED arrays fitted with neutral-density shade screens or blackout cloth; four NH4Cl addition levels were applied, corresponding to 0 (control; CK), 25 (low N addition; L), 50 (medium N addition; M), and 100 (high N addition; H) μmol L-¹ added relative to background concentrations. Seawater was renewed weekly, and following each renewal NH4Cl was re-added to re-establish the target concentrations for each treatment (Figure 1).
Figure 1
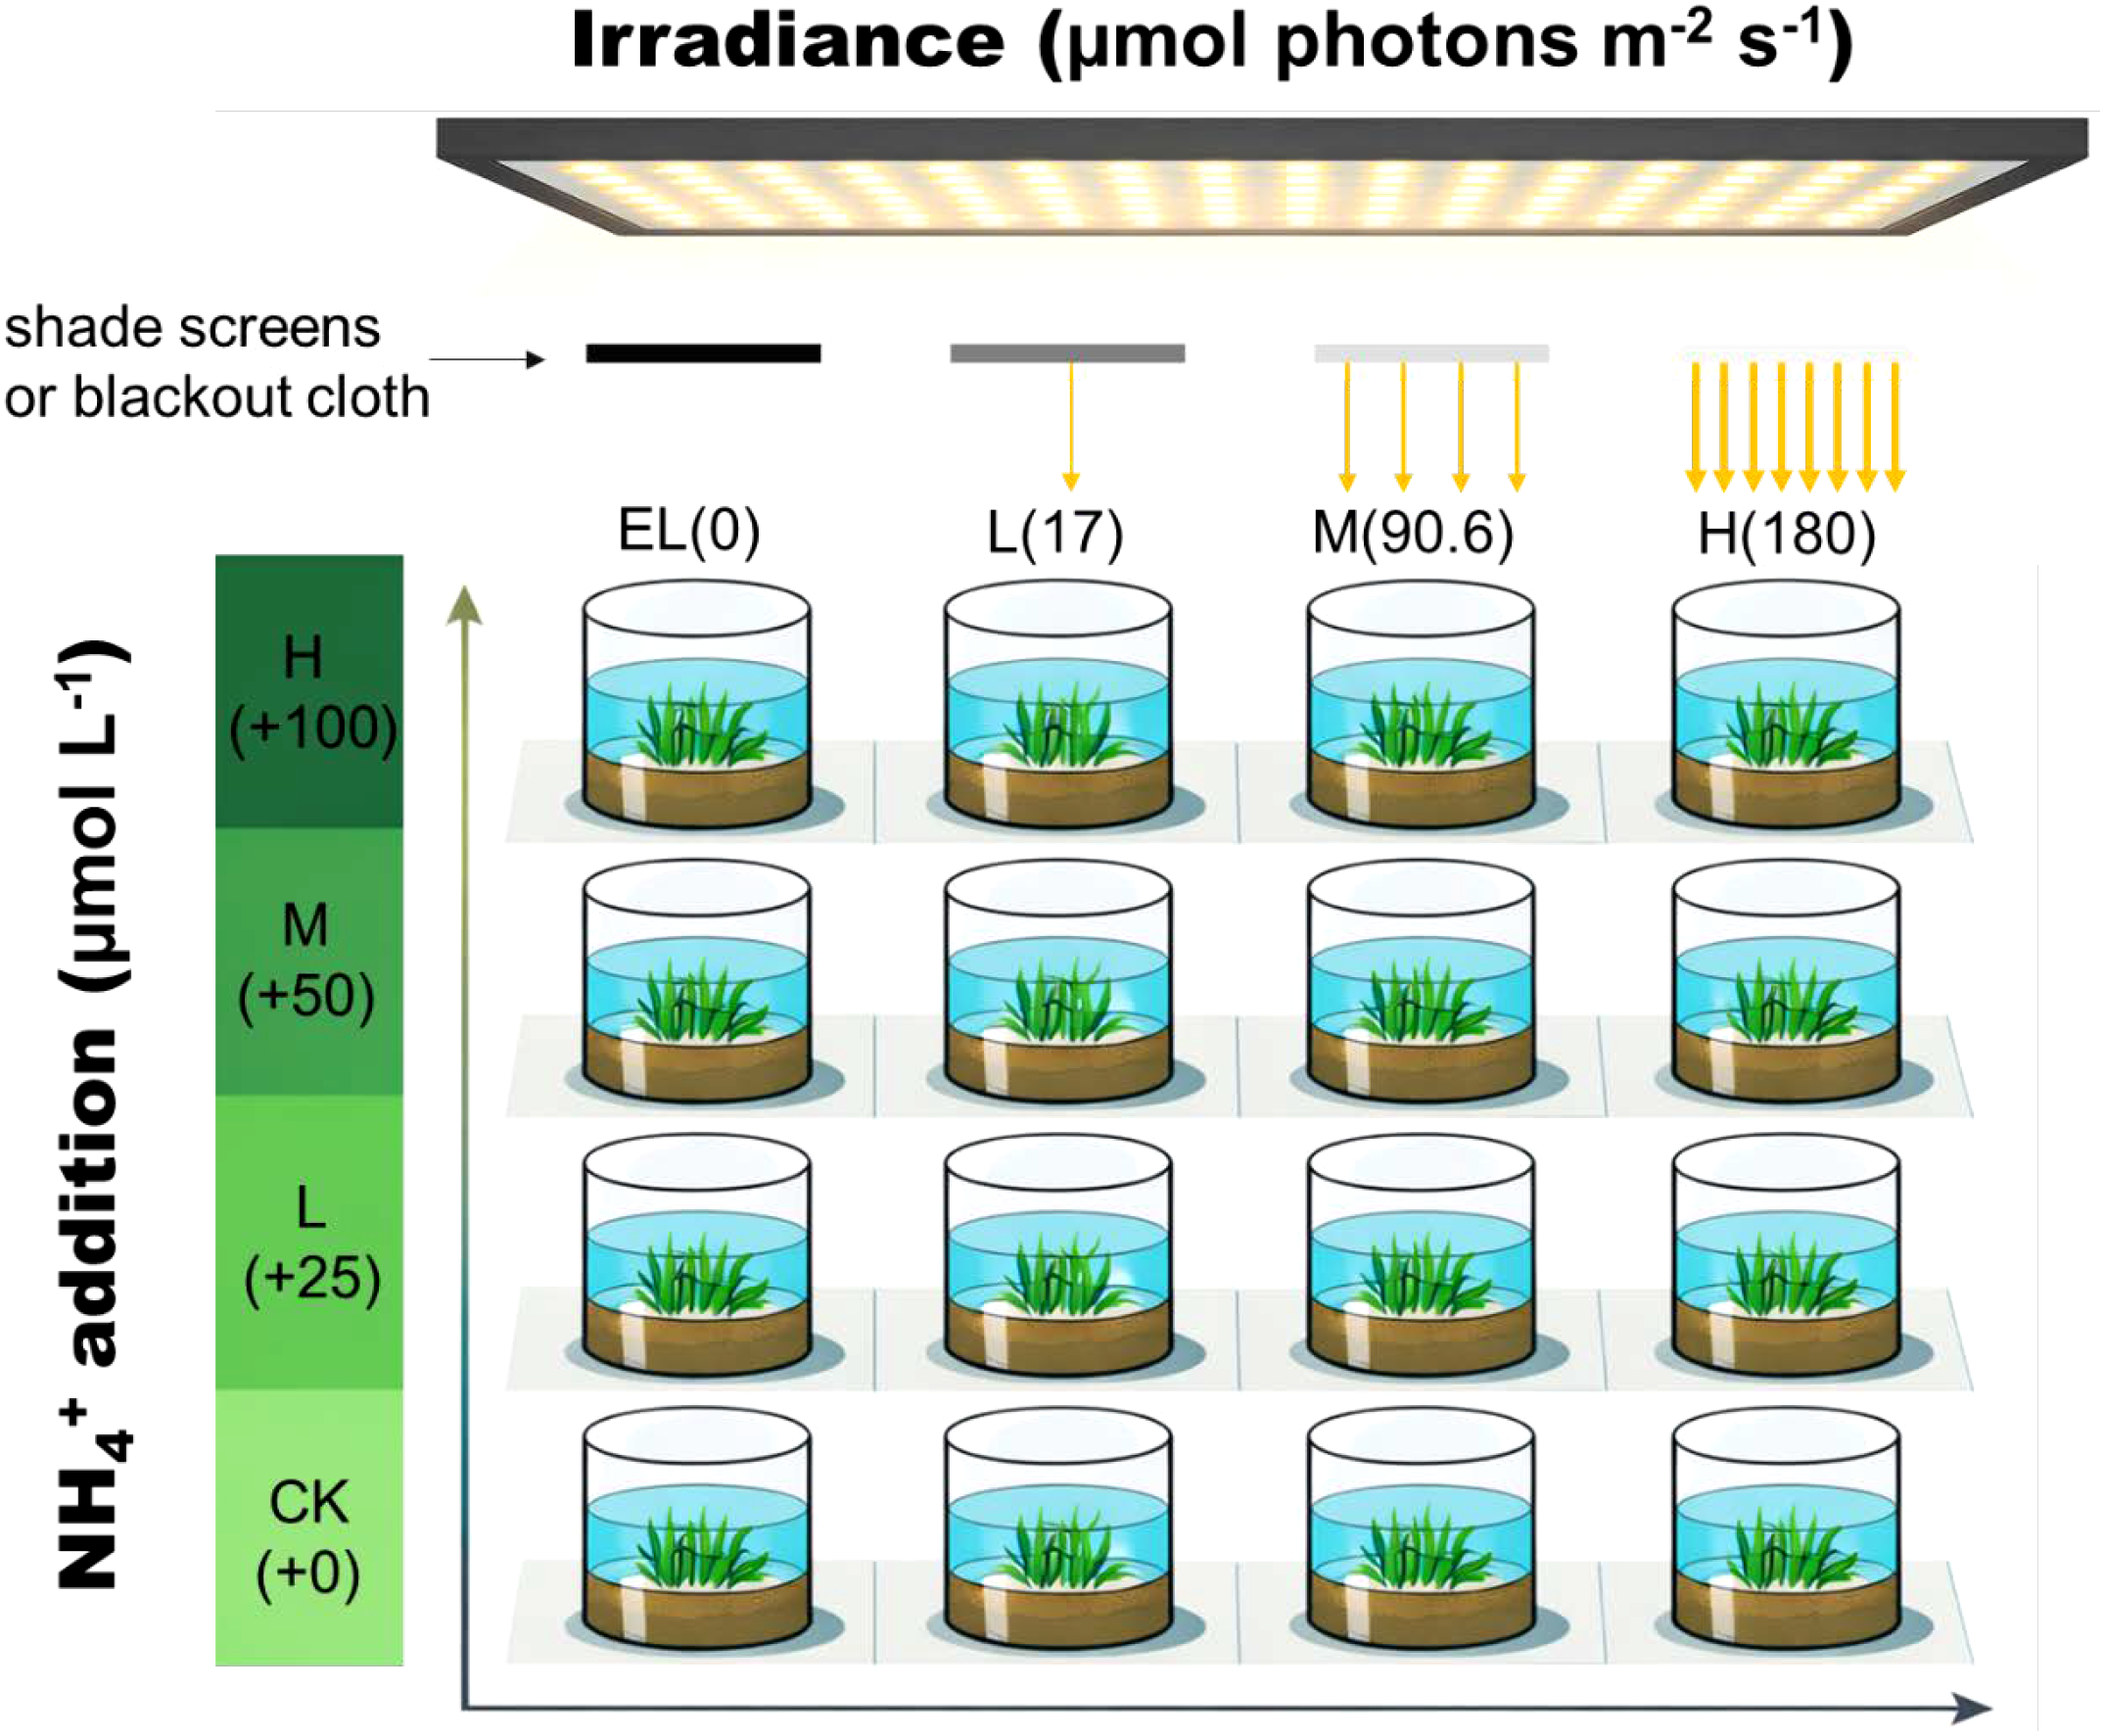
Schematic diagram of the fully crossed 4 × 4 irradiance × ammonium enrichment experimental design for Zostera marina.
Sixteen intact seagrass–sediment cores (one per treatment combination; no within-treatment replication) were exposed to four PPFD levels (180, 90.6, 17, and 0 μmol m-² s-¹) using dimmable LED panels with neutral-density shade screens or blackout cloth, and four NH4Cl addition levels (added concentrations of 0, 25, 50, and 100 μmol L-¹). Cores were maintained in aerated seawater pots under controlled temperature and photoperiod conditions. The schematic diagram was generated from an AI-produced illustration (ChatGPT 5.2) and subsequently refined to accurately represent the experimental design.
Because intact seagrass–sediment cores were used as experimental units, belowground biomass and sediment conditions were preserved at collection. Although initial belowground biomass could not be destructively quantified prior to treatment, the use of undisturbed cores from the same meadow and the above standardization procedures were intended to minimize among-treatment variability at the start of the experiment. Consequently, post-treatment differences in morphological traits are attributed primarily to experimental treatments rather than to initial heterogeneity among cores.
The experimental duration was set to five weeks to capture early-stage physiological and morphological responses of Z. marina to changes in irradiance and ammonium availability. During preliminary observations and the course of the experiment, seagrass growth remained relatively stable across most treatments during the first four weeks. However, pronounced shoot mortality began to occur during the fifth week, particularly under low-irradiance conditions. The experiment was therefore terminated at five weeks to avoid confounding early treatment responses with severe light-induced mortality, which would have precluded reliable measurement of early physiological and morphological changes.
At the end of the experiment, samples were harvested for subsequent analyses. Photosynthetic parameters were determined to evaluate seagrass photosynthetic performance. Additional samples were collected for measurements of morphological attributes, enzymatic activities, carbon and nitrogen concentrations, and the stable isotopic composition of these elements. In a limited number of treatments, biomass loss toward the end of the experiment restricted the measurement of certain variables due to insufficient remaining material.
2.2 Morphological analysis
Upon completion of the experiment, shoots per pot were counted, and leaf lengths were measured. Above- and belowground tissues were carefully separated, oven-dried at 60°C until constant mass, and weighed. Fallen leaves and dead belowground tissue fragments were collected at the end of the experiment, dried, and weighed. The aboveground shedding rate (AGR) was calculated as the proportion of fallen leaf biomass relative to the sum of fallen leaves and standing live aboveground biomass. Similarly, the belowground decomposition rate (BGR) was calculated as the proportion of dead belowground tissue fragments relative to the sum of dead and live belowground biomass. These metrics represent end-point proportional indicators of tissue turnover rather than continuous time-based rates.
2.3 Physiological analysis
The maximum quantum yield of PSII (Fv/Fm) in eelgrass leaves was measured using a Diving-PAM fluorometer (Walz, Germany). Prior to measurement, plants were dark-adapted for 30 min to ensure full relaxation of PSII reaction centers. Measurements were taken 2–5 cm above the sheath of the second youngest leaf, following the protocol of Zhang et al. (2024). One measurement was conducted per treatment. Leaf blades were collected from each treatment. Chlorophyll a (Chl a) and chlorophyll b (Chl b) contents were quantified according to Lichtenthaler (1987). To evaluate photosynthetic carbon fixation capacity, Rubisco activity was assessed following Makino et al. (1985) with minor modifications. Enzymatic antioxidant defenses and redox regulation under contrasting light and ammonium conditions were evaluated by determining the activities of superoxide dismutase (SOD), catalase (CAT), glutathione peroxidase (GSH-Px), and peroxidase (POD) according to Dazy et al. (2009). Lipid peroxidation was evaluated by measuring malondialdehyde (MDA) content following the method of Hodges et al. (1999), providing an index of oxidative membrane damage. Together, these biochemical assays were used to diagnose oxidative stress status and cellular damage associated with combined light and nutrient treatments. All biochemical analyses were performed by Wilmin Biotechnology (Suzhou, China).
2.4 Elemental/isotope analysis
Dried tissues were finely homogenized and sieved prior to elemental and isotope analyses. Carbon and nitrogen concentrations were determined with a Vario EL III CHNS elemental analyzer (Elementar Analysensysteme GmbH, Germany) and expressed on a dry-weight basis; C:N ratios are reported on a molar scale. Stable isotope compositions (δ13C and δ15N) were analyzed using a Flash EA 1112 elemental analyzer coupled to a Delta V Advantage isotope ratio mass spectrometer (Thermo Fisher Scientific, USA). Isotopic values are expressed in delta (δ) notation:
δ(‰) = [(Rsample/Rstandard) - 1] × 1000
relative to Vienna Pee Dee Belemnite (V-PDB) for carbon and atmospheric N2 for nitrogen. Analytical precision (± 1 SD) was ±0.08 ‰ for δ13C and ±0.20 ‰ for δ15N, based on replicate analyses.
2.5 Data analyses
Prior to hypothesis testing, data were tested for normality using the one-sample Kolmogorov–Smirnov test. Variables that deviated from normality (aboveground shedding rate, MDA, and belowground δ15N) were square-root or square transformed before analysis. These transformations were applied solely to improve adherence to model assumptions; biological interpretation focuses on the direction and relative magnitude of treatment effects rather than on transformed-scale values. Homogeneity of variances was assessed visually from residual plots, as Levene’s test is not applicable in a 2-factor design without replication. A 2-way analysis of variance without replication was used to evaluate the main effects of irradiance and NH4Cl addition on response variables. Accordingly, statistical inference was restricted to the main effects of irradiance and ammonium, and interaction effects were not interpreted. As statistical inference in this unreplicated factorial design is restricted to main effects, all results reported below describe main effects of irradiance and NH4Cl enrichment and should be interpreted cautiously. When a significant main effect was detected (p < 0.05), post hoc comparisons among factor levels were used descriptively. Statistical analyses were performed using IBM SPSS Statistics 23 (IBM Corp., Armonk, NY, USA), and p-values < 0.05 were considered statistically significant.
3 Results
3.1 Morphological responses
Light intensity significantly affected most morphological traits of Zostera marina, while NH4Cl enrichment alone had no significant main effects (Table 1). Shoot density differed markedly among irradiance levels (p < 0.001, partial η² = 0.90), with no shoots surviving under darkness (EL) in most treatments except EL–L (Figure 2A). This isolated survival likely reflects stochastic variation among intact cores rather than a systematic treatment effect. In contrast, plants exposed to high irradiance (H) maintained the highest shoot density (3–4 shoots pot-1), followed by medium (M) and low light (L) conditions.
Table 1
| Parameter | Source of variation | F | P | partial η² |
|---|---|---|---|---|
| Shoot density | Irradiance | 18.23 | < 0.001 | 0.9 |
| NH4Cl | 1.62 | 0.253 | 0.45 | |
| Leaf length | Irradiance | 3.25 | 0.102 | 0.62 |
| NH4Cl | 1.48 | 0.312 | 0.43 | |
| Aboveground biomass | Irradiance | 8.7 | 0.013 | 0.81 |
| NH4Cl | 0.99 | 0.457 | 0.33 | |
| Belowground biomass | Irradiance | 9.75 | 0.005 | 0.83 |
| NH4Cl | 0.73 | 0.56 | 0.27 | |
| Aboveground shedding rate | Irradiance | 13.31 | 0.001 | 0.87 |
| NH4Cl | 1.03 | 0.426 | 0.34 | |
| Belowground decomposition rate | Irradiance | 7.94 | 0.007 | 0.8 |
| NH4Cl | 3.38 | 0.068 | 0.63 |
Analysis of variance results for the effects of light intensity and NH4Cl enrichment on morphological parameters.
Figure 2
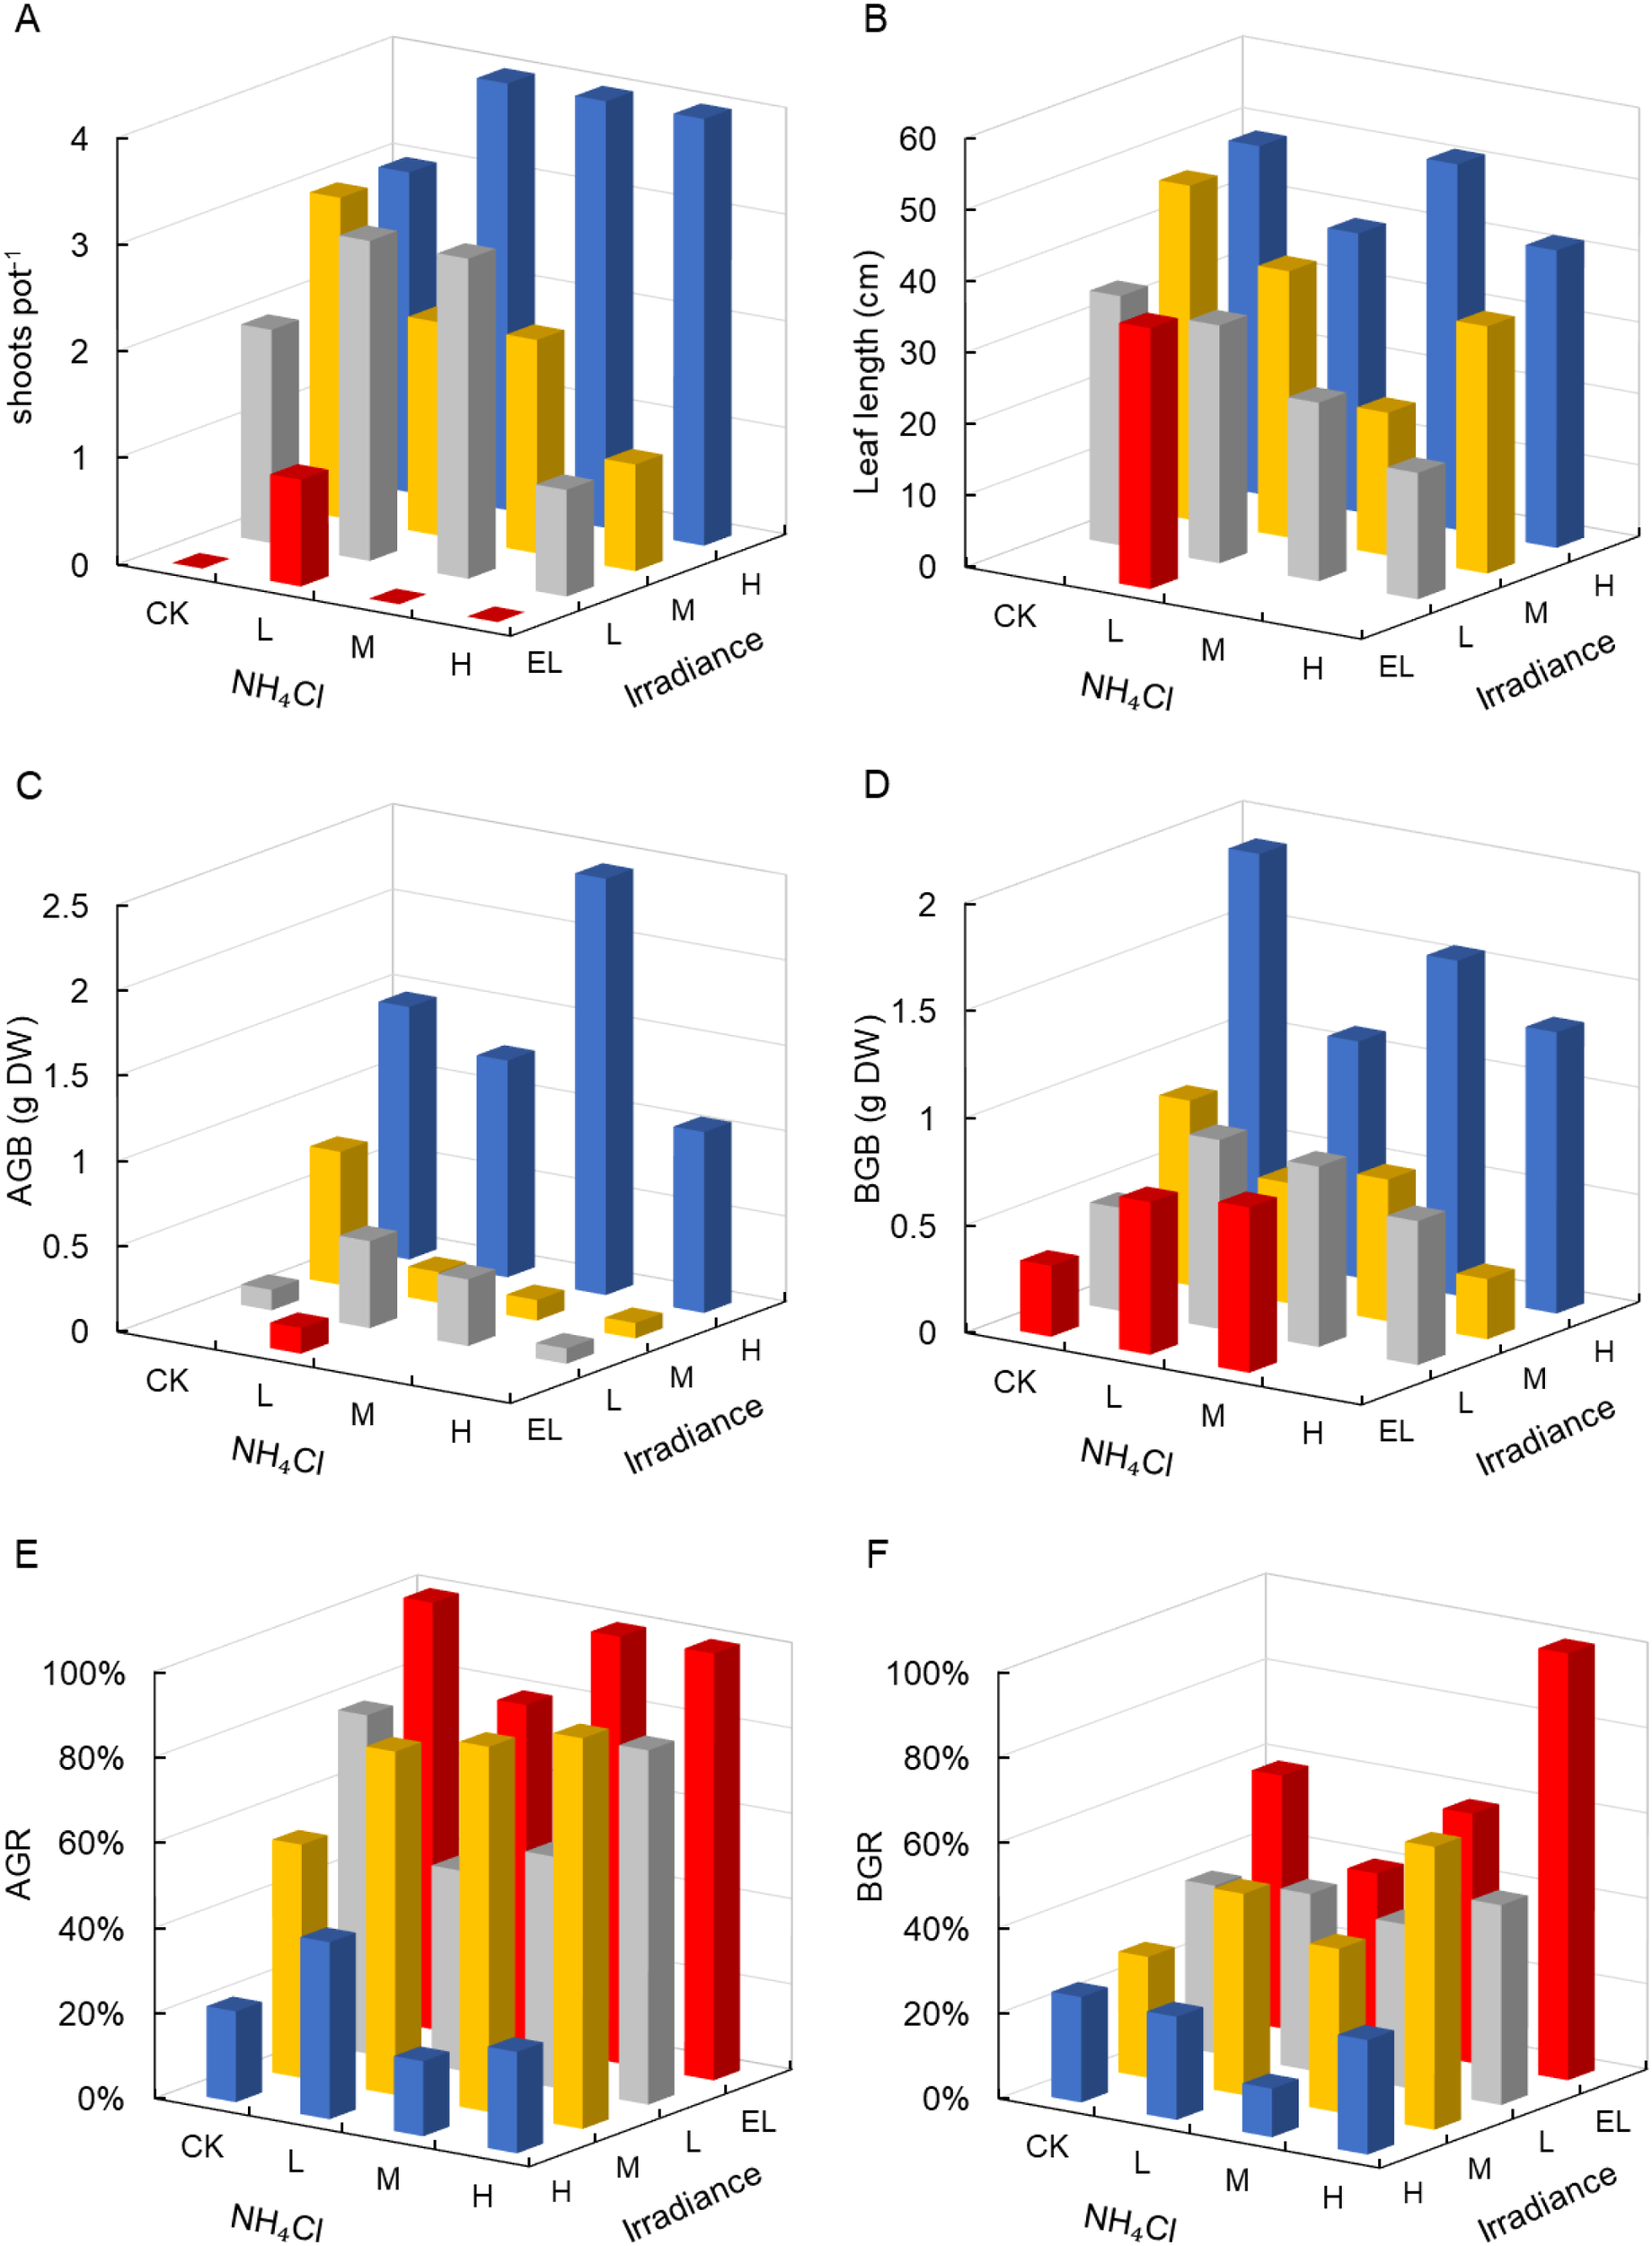
Morphological responses of Zostera marina to gradients of light intensity and NH4Cl enrichment. (A) Shoot density per pot; (B) Leaf length; (C) Aboveground biomass; (D) Belowground biomass; (E) Aboveground shedding rate; (F) Belowground decomposition rate. Irradiance levels (H, M, L, EL) and NH4Cl addition levels (CK, L, M, H) are indicated consistently across figures using the same color scheme and axis orientation, as defined in Section 2.1.
Leaf length showed a similar light-dependent trend, although the effect of irradiance was not statistically significant (p = 0.102, partial η² = 0.62; Table 1). Under H conditions, leaves reached 51 cm (H–M), while leaf elongation was strongly suppressed under EL (Figure 2B).
Aboveground biomass (AGB) and belowground biomass (BGB) were both significantly affected by differences among irradiance levels, indicating a graded main effect of irradiance (p = 0.013, partial η² = 0.81, and p = 0.005, partial η² = 0.83, respectively; Table 1). The highest AGB was observed under H–M (2.44 g DW pot-1), while AGB declined to 0.15 g DW under EL (Figure 2C), with these treatment combinations presented as illustrative examples of the overall main effect of irradiance rather than indicative of interaction effects. BGB followed a similar pattern, peaking at 1.1–1.9 g DW under H but declining sharply under shading (Figure 2D).
Biomass turnover metrics also responded significantly to light. Aboveground shedding rate (AGR) increased under reduced irradiance (p = 0.001, partial η² = 0.87), exceeding 80–100% in EL treatments (Figure 2E). In individual cells (illustrative only), belowground decomposition rate (BGR) was highest under EL-H and M–H (up to 66–100%; p = 0.007, partial η² = 0.80; Figure 2F). NH4Cl enrichment did not significantly affect AGR or BGR.
3.2 Physiological responses
Photosynthetic performance (Fv/Fm) was strongly affected by light (p = 0.002, partial η² = 0.92), while NH4Cl had no significant effect (Table 2). Under H conditions, Fv/Fm remained stable at 0.81–0.82 across all NH4Cl levels (Figure 3), whereas values declined markedly under M (0.56–0.69) and L (0.13–0.39) light, and were < 0.20 under EL.
Table 2
| Parameter | Source of variation | F | P | partial η² |
|---|---|---|---|---|
| Fv/Fm | Irradiance | 22.76 | 0.002 | 0.92 |
| NH4Cl | 0.12 | 0.947 | 0.06 | |
| Rubisco | Irradiance | 2.17 | 0.21 | 0.46 |
| NH4Cl | 1.85 | 0.255 | 0.53 | |
| chla | Irradiance | 4.88 | 0.067 | 0.66 |
| NH4Cl | 0.8 | 0.543 | 0.32 | |
| chlb | Irradiance | 5.21 | 0.06 | 0.68 |
| NH4Cl | 0.92 | 0.494 | 0.36 | |
| chl | Irradiance | 5.02 | 0.064 | 0.67 |
| NH4Cl | 0.84 | 0.527 | 0.34 |
Analysis of variance results for the effects of light intensity and NH4Cl enrichment on physiological parameters.
Figure 3
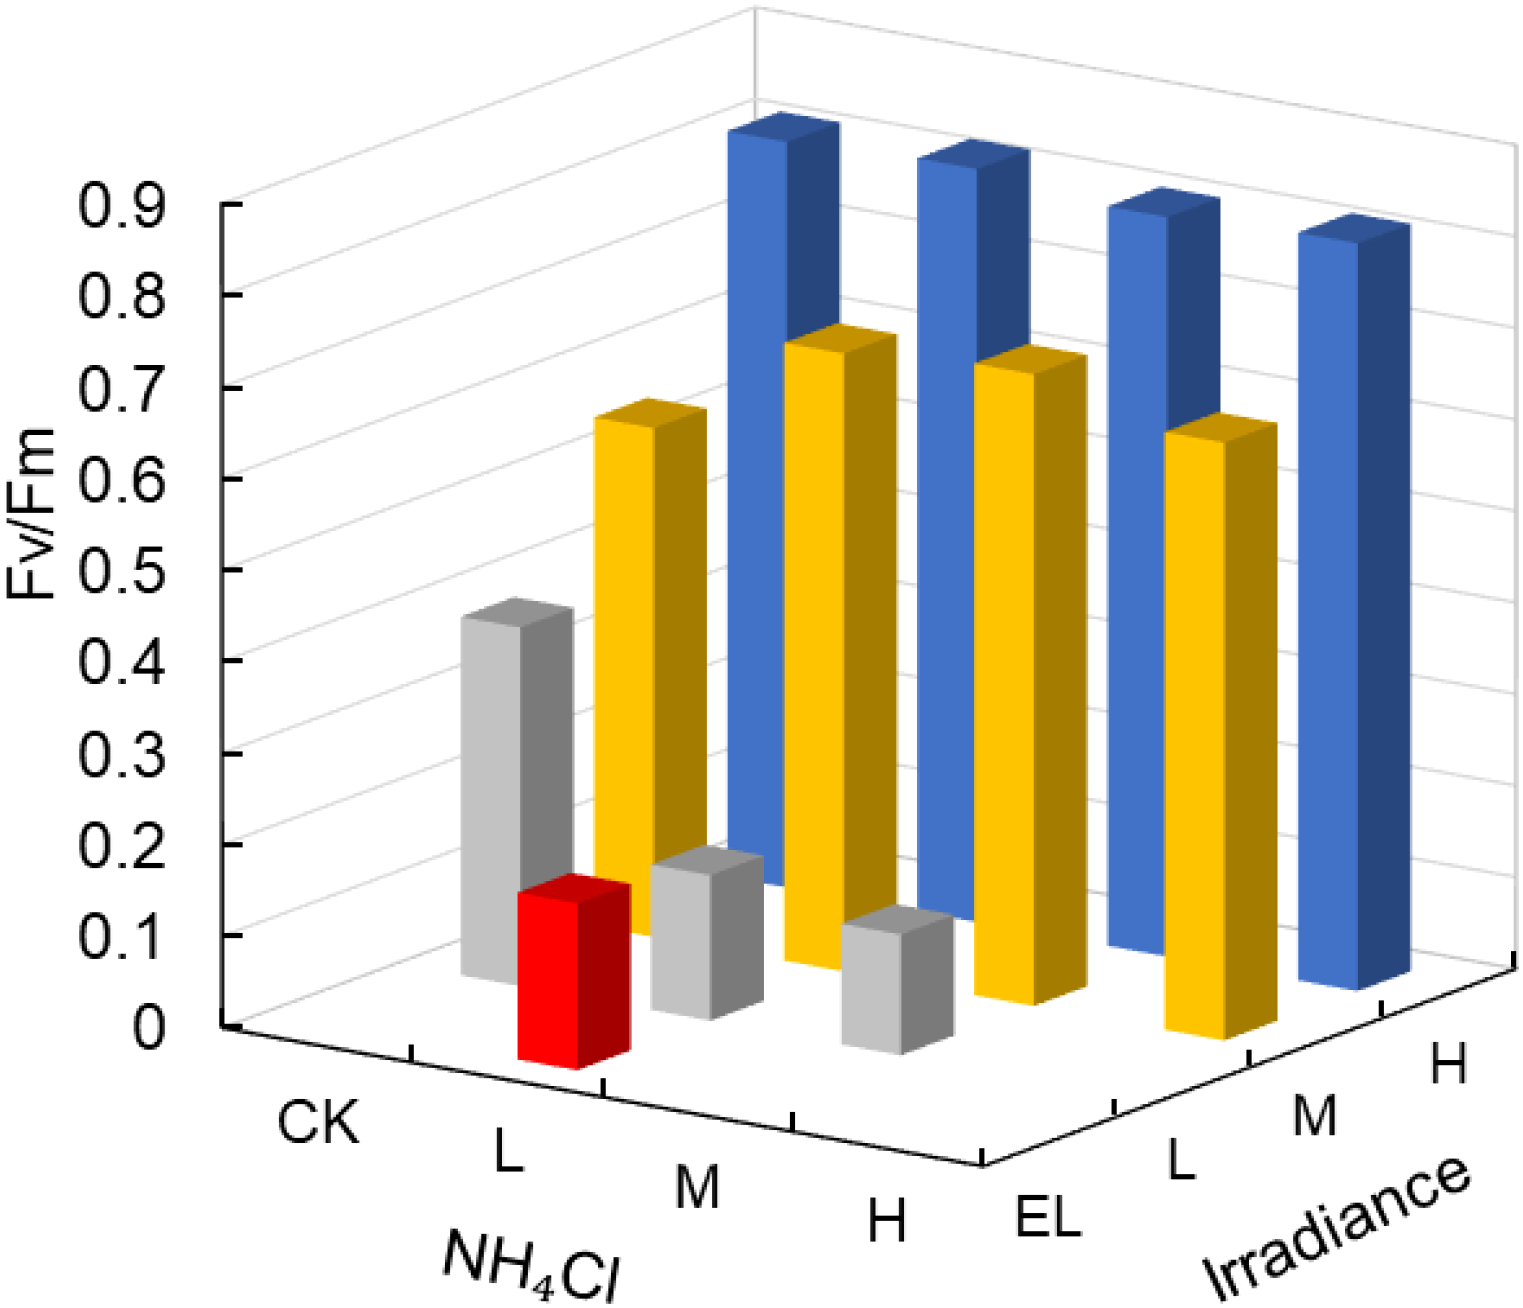
Photosynthetic performance (Fv/Fm) of Zostera marina under gradients of light intensity and NH4Cl enrichment. Irradiance levels (H, M, L, EL) and NH4Cl addition levels (CK, L, M, H) are indicated consistently across figures using the same color scheme and axis orientation, as defined in Section 2.1.
Rubisco activity tended to decrease under shading but showed no significant main effects of light or NH4Cl (Table 2; Figure 4A). The highest and lowest values occurred in specific treatment combinations (e.g., higher under H–CK/H–L and lower under L–L/L–M), but these are reported as descriptive extremes rather than statistically supported differences, given that interaction effects and within-cell contrasts are not assessed in this unreplicated design.
Figure 4
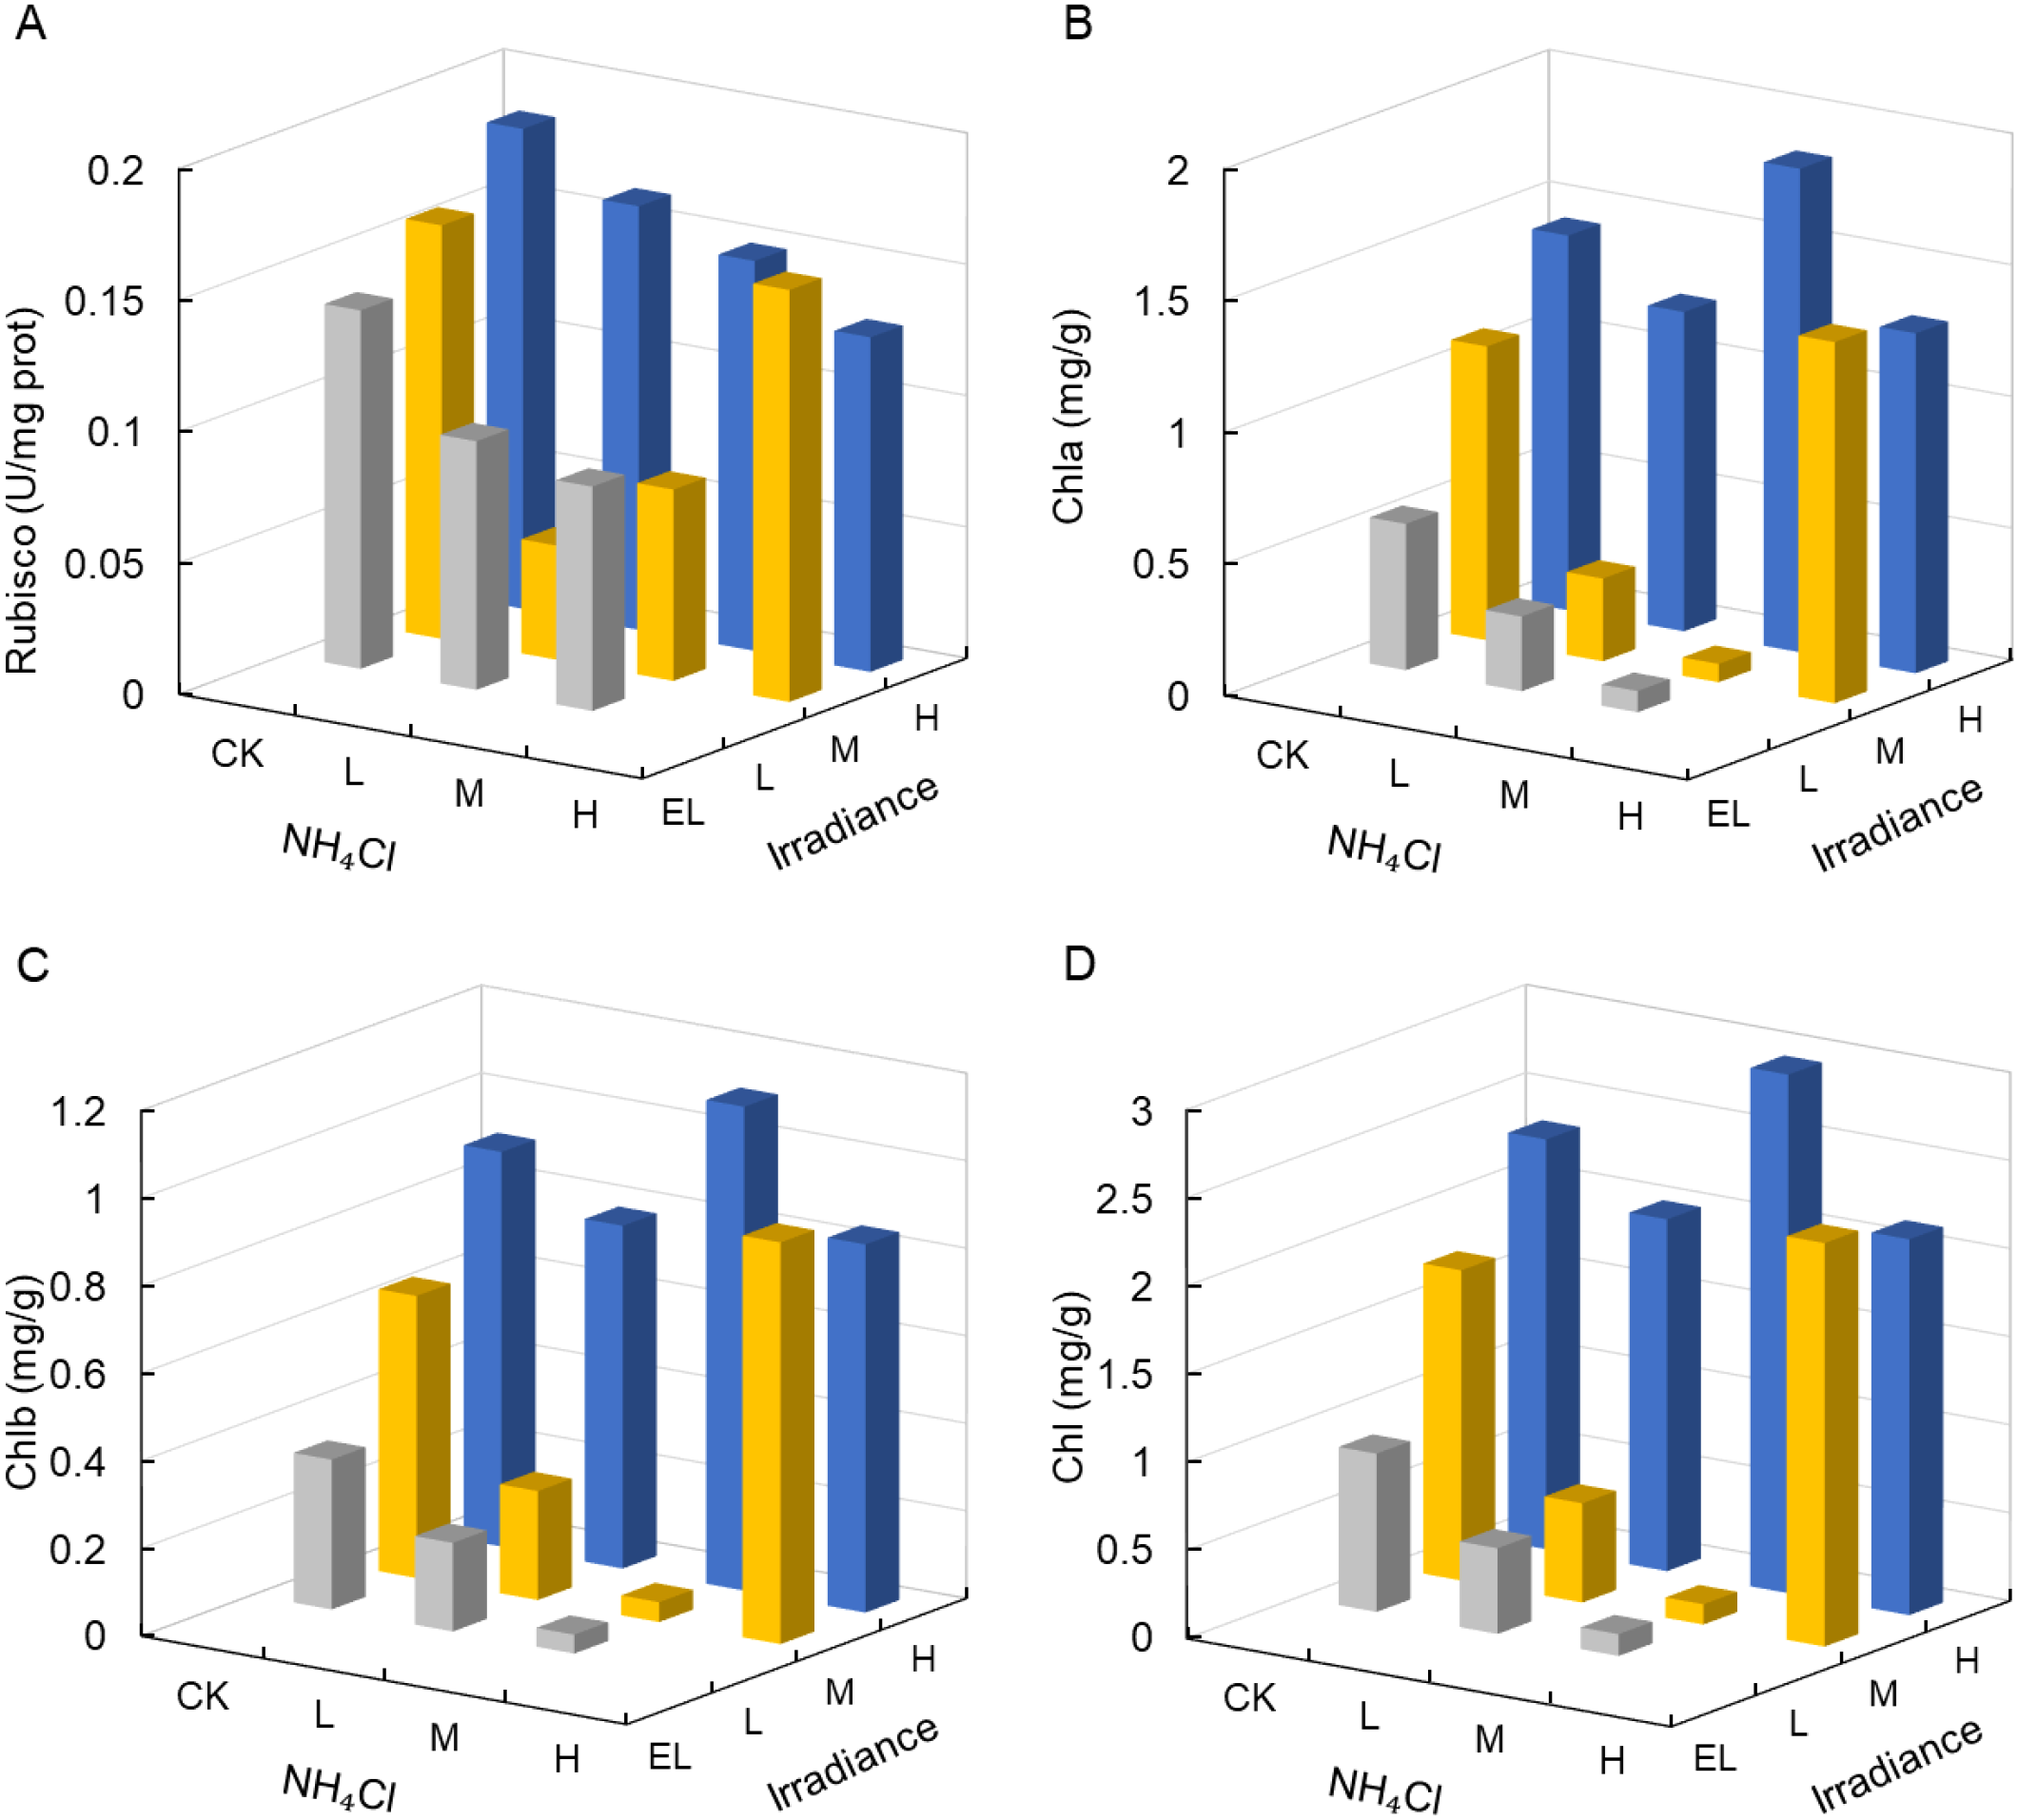
Rubisco activity and photosynthetic pigment concentrations in Zostera marina under gradients of light intensity and NH4Cl enrichment. (A) Rubisco activity, (B) chlorophyll a, (C) chlorophyll b, and (D) total chlorophyll. Irradiance levels (H, M, L, EL) and NH4Cl addition levels (CK, L, M, H) are indicated consistently across figures using the same color scheme and axis orientation, as defined in Section 2.1.
Chlorophyll a, chlorophyll b, and total chlorophyll content showed a descriptive tendency to decrease under shading (Figures 4B–D); however, the main effect of irradiance did not reach the α = 0.05 threshold (p = 0.067, 0.060, and 0.064 for Chl a, Chl b and total Chl, respectively; partial η² = 0.66–0.68), and NH4Cl remained non-significant (Table 2). Consistent with this near-significant trend, total chlorophyll was highest under H (2.0–2.94 mg g-¹) and was lower under L (Figure 4D).
Superoxide dismutase (SOD), catalase (CAT), and glutathione peroxidase (GSH-Px) showed no significant main effects of irradiance or NH4Cl (Table 3). However, SOD tended to be highest under L–CK (731.77 U mg-¹ prot; Figure 5A).
Table 3
| Parameter | Source of variation | F | P | partial η² |
|---|---|---|---|---|
| SOD | Irradiance | 1.02 | 0.425 | 0.29 |
| NH4Cl | 1.95 | 0.24 | 0.54 | |
| POD | Irradiance | 56.68 | <0.001 | 0.96 |
| NH4Cl | 3.91 | 0.088 | 0.7 | |
| CAT | Irradiance | 2.37 | 0.189 | 0.49 |
| NH4Cl | 0.15 | 0.925 | 0.08 | |
| MDA | Irradiance | 3.58 | 0.109 | 0.59 |
| NH4Cl | 1.39 | 0.347 | 0.45 | |
| GSH-Px | Irradiance | 0.99 | 0.436 | 0.28 |
| NH4Cl | 2.56 | 0.168 | 0.61 |
Analysis of variance results for the effects of light intensity and NH4Cl enrichment on antioxidant enzyme activities and malondialdehyde (MDA) content.
Figure 5
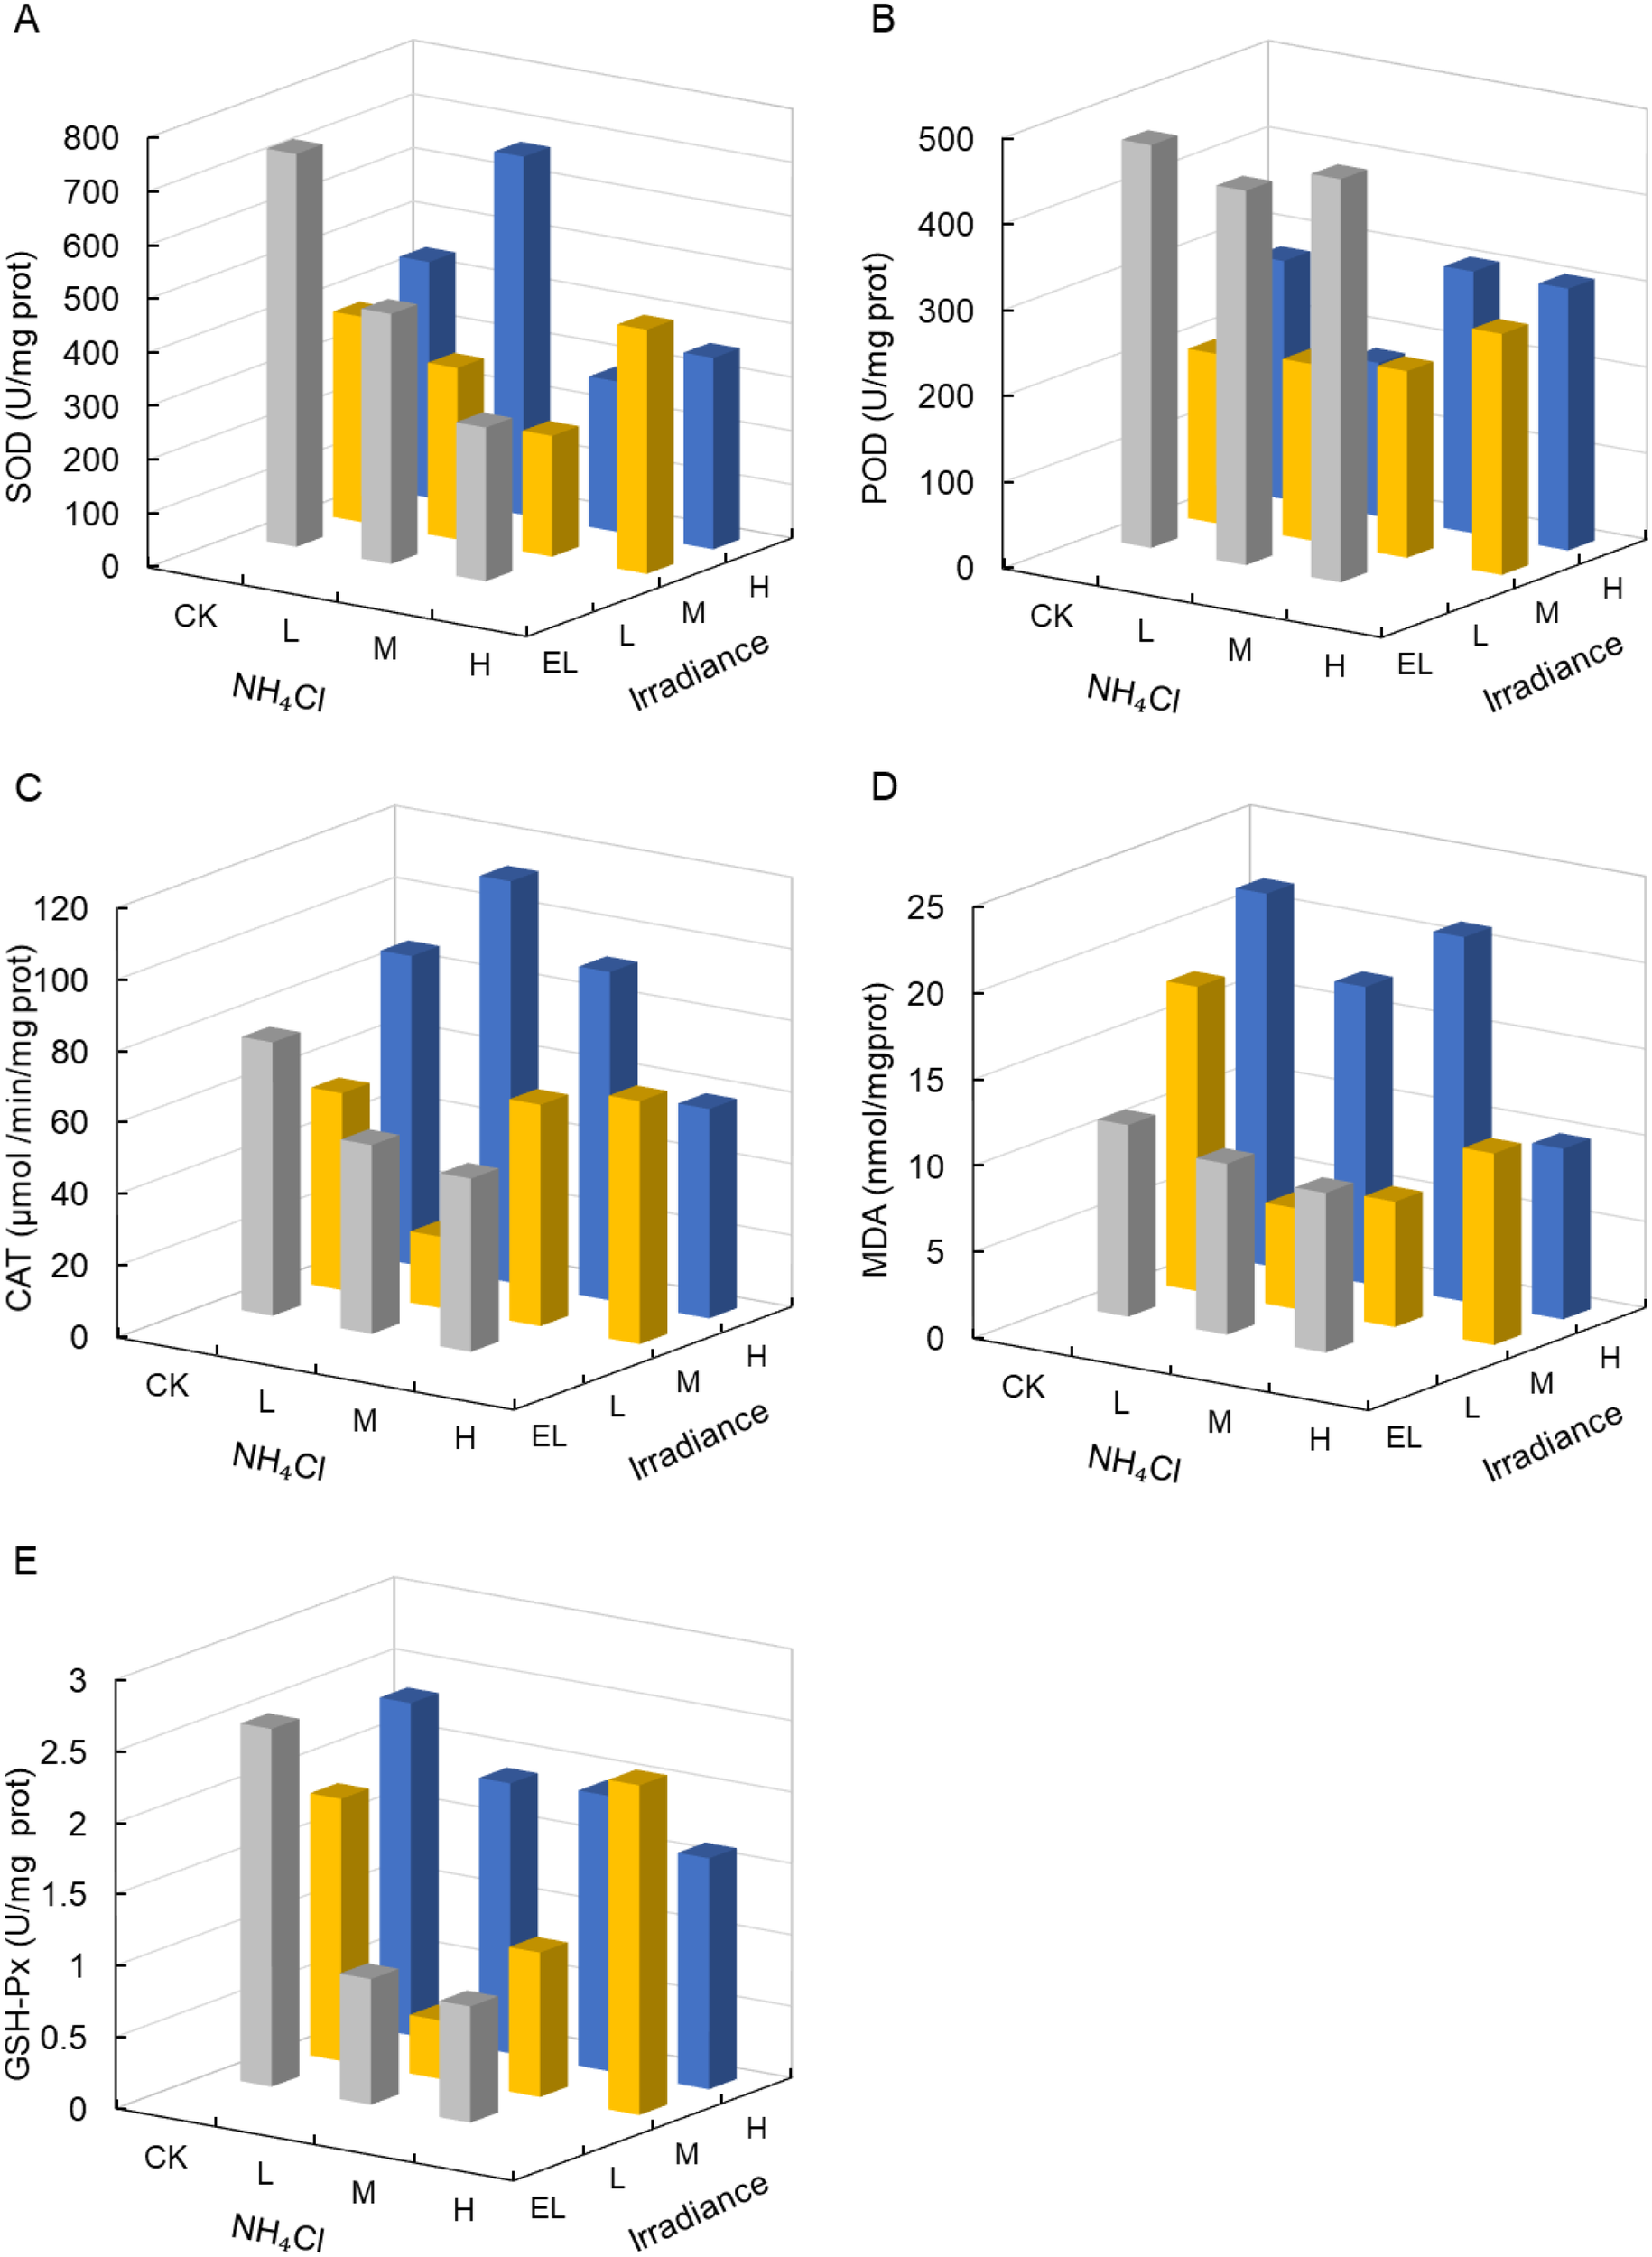
Antioxidant enzyme activities and malondialdehyde (MDA) content in Zostera marina under gradients of light intensity and NH4Cl enrichment. (A) SOD; (B) POD; (C) CAT; (D) MDA; (E) GSH-Px. Irradiance levels (H, M, L, EL) and NH4Cl addition levels (CK, L, M, H) are indicated consistently across figures using the same color scheme and axis orientation, as defined in Section 2.1.
In contrast, peroxidase (POD), a broad-spectrum enzyme involved in hydrogen peroxide scavenging and cell wall–associated oxidative processes, responded strongly to irradiance (p < 0.001, partial η² = 0.96; Table 3), with higher values generally observed under reduced irradiance (Figure 5B). CAT and GSH-Px activities showed variable but non-significant trends (Figures 5C, E).
Lipid peroxidation (MDA) did not differ significantly among treatments (p > 0.05; Table 3). While higher MDA values were observed in some high-irradiance combinations (up to 21.56 nmol mg-¹ prot; Figure 5D), these differences are reported descriptively and should not be interpreted as statistically supported contrasts.
3.3 Elemental/isotope responses
Carbon and nitrogen content of aboveground tissues were not significantly affected by irradiance or NH4Cl (p > 0.05; Table 4), whereas belowground carbon content showed a significant response to light (p = 0.003, partial η² = 0.85; Figures 6A–D). C:N ratios remained relatively stable across treatments (Figures 6E, F).
Table 4
| Tissue | Parameter | Source of variation | F | P | partial η² |
|---|---|---|---|---|---|
| Aboveground | C | Irradiance | 0.62 | 0.628 | 0.24 |
| NH4Cl | 0.7 | 0.586 | 0.26 | ||
| N | Irradiance | 1.11 | 0.416 | 0.36 | |
| NH4Cl | 0.04 | 0.987 | 0.02 | ||
| C/N | Irradiance | 1.21 | 0.385 | 0.38 | |
| NH4Cl | 0.23 | 0.872 | 0.1 | ||
| δ13C | Irradiance | 3.25 | 0.102 | 0.62 | |
| NH4Cl | 1.91 | 0.229 | 0.49 | ||
| δ15N | Irradiance | 1.2 | 0.386 | 0.38 | |
| NH4Cl | 6.88 | 0.023 | 0.78 | ||
| Belowground | C | Irradiance | 11.2 | 0.003 | 0.85 |
| NH4Cl | 3.92 | 0.054 | 0.66 | ||
| N | Irradiance | 0.34 | 0.795 | 0.15 | |
| NH4Cl | 1.13 | 0.395 | 0.36 | ||
| C/N | Irradiance | 0.44 | 0.732 | 0.18 | |
| NH4Cl | 1.34 | 0.329 | 0.4 | ||
| δ13C | Irradiance | 2.92 | 0.1 | 0.59 | |
| NH4Cl | 0.55 | 0.66 | 0.22 | ||
| δ15N | Irradiance | 1.74 | 0.236 | 0.47 | |
| NH4Cl | 44.79 | <0.001 | 0.96 |
Analysis of variance results for the effects of light intensity and NH4Cl enrichment on carbon and nitrogen contents, C:N ratios, and stable isotope composition.
Figure 6
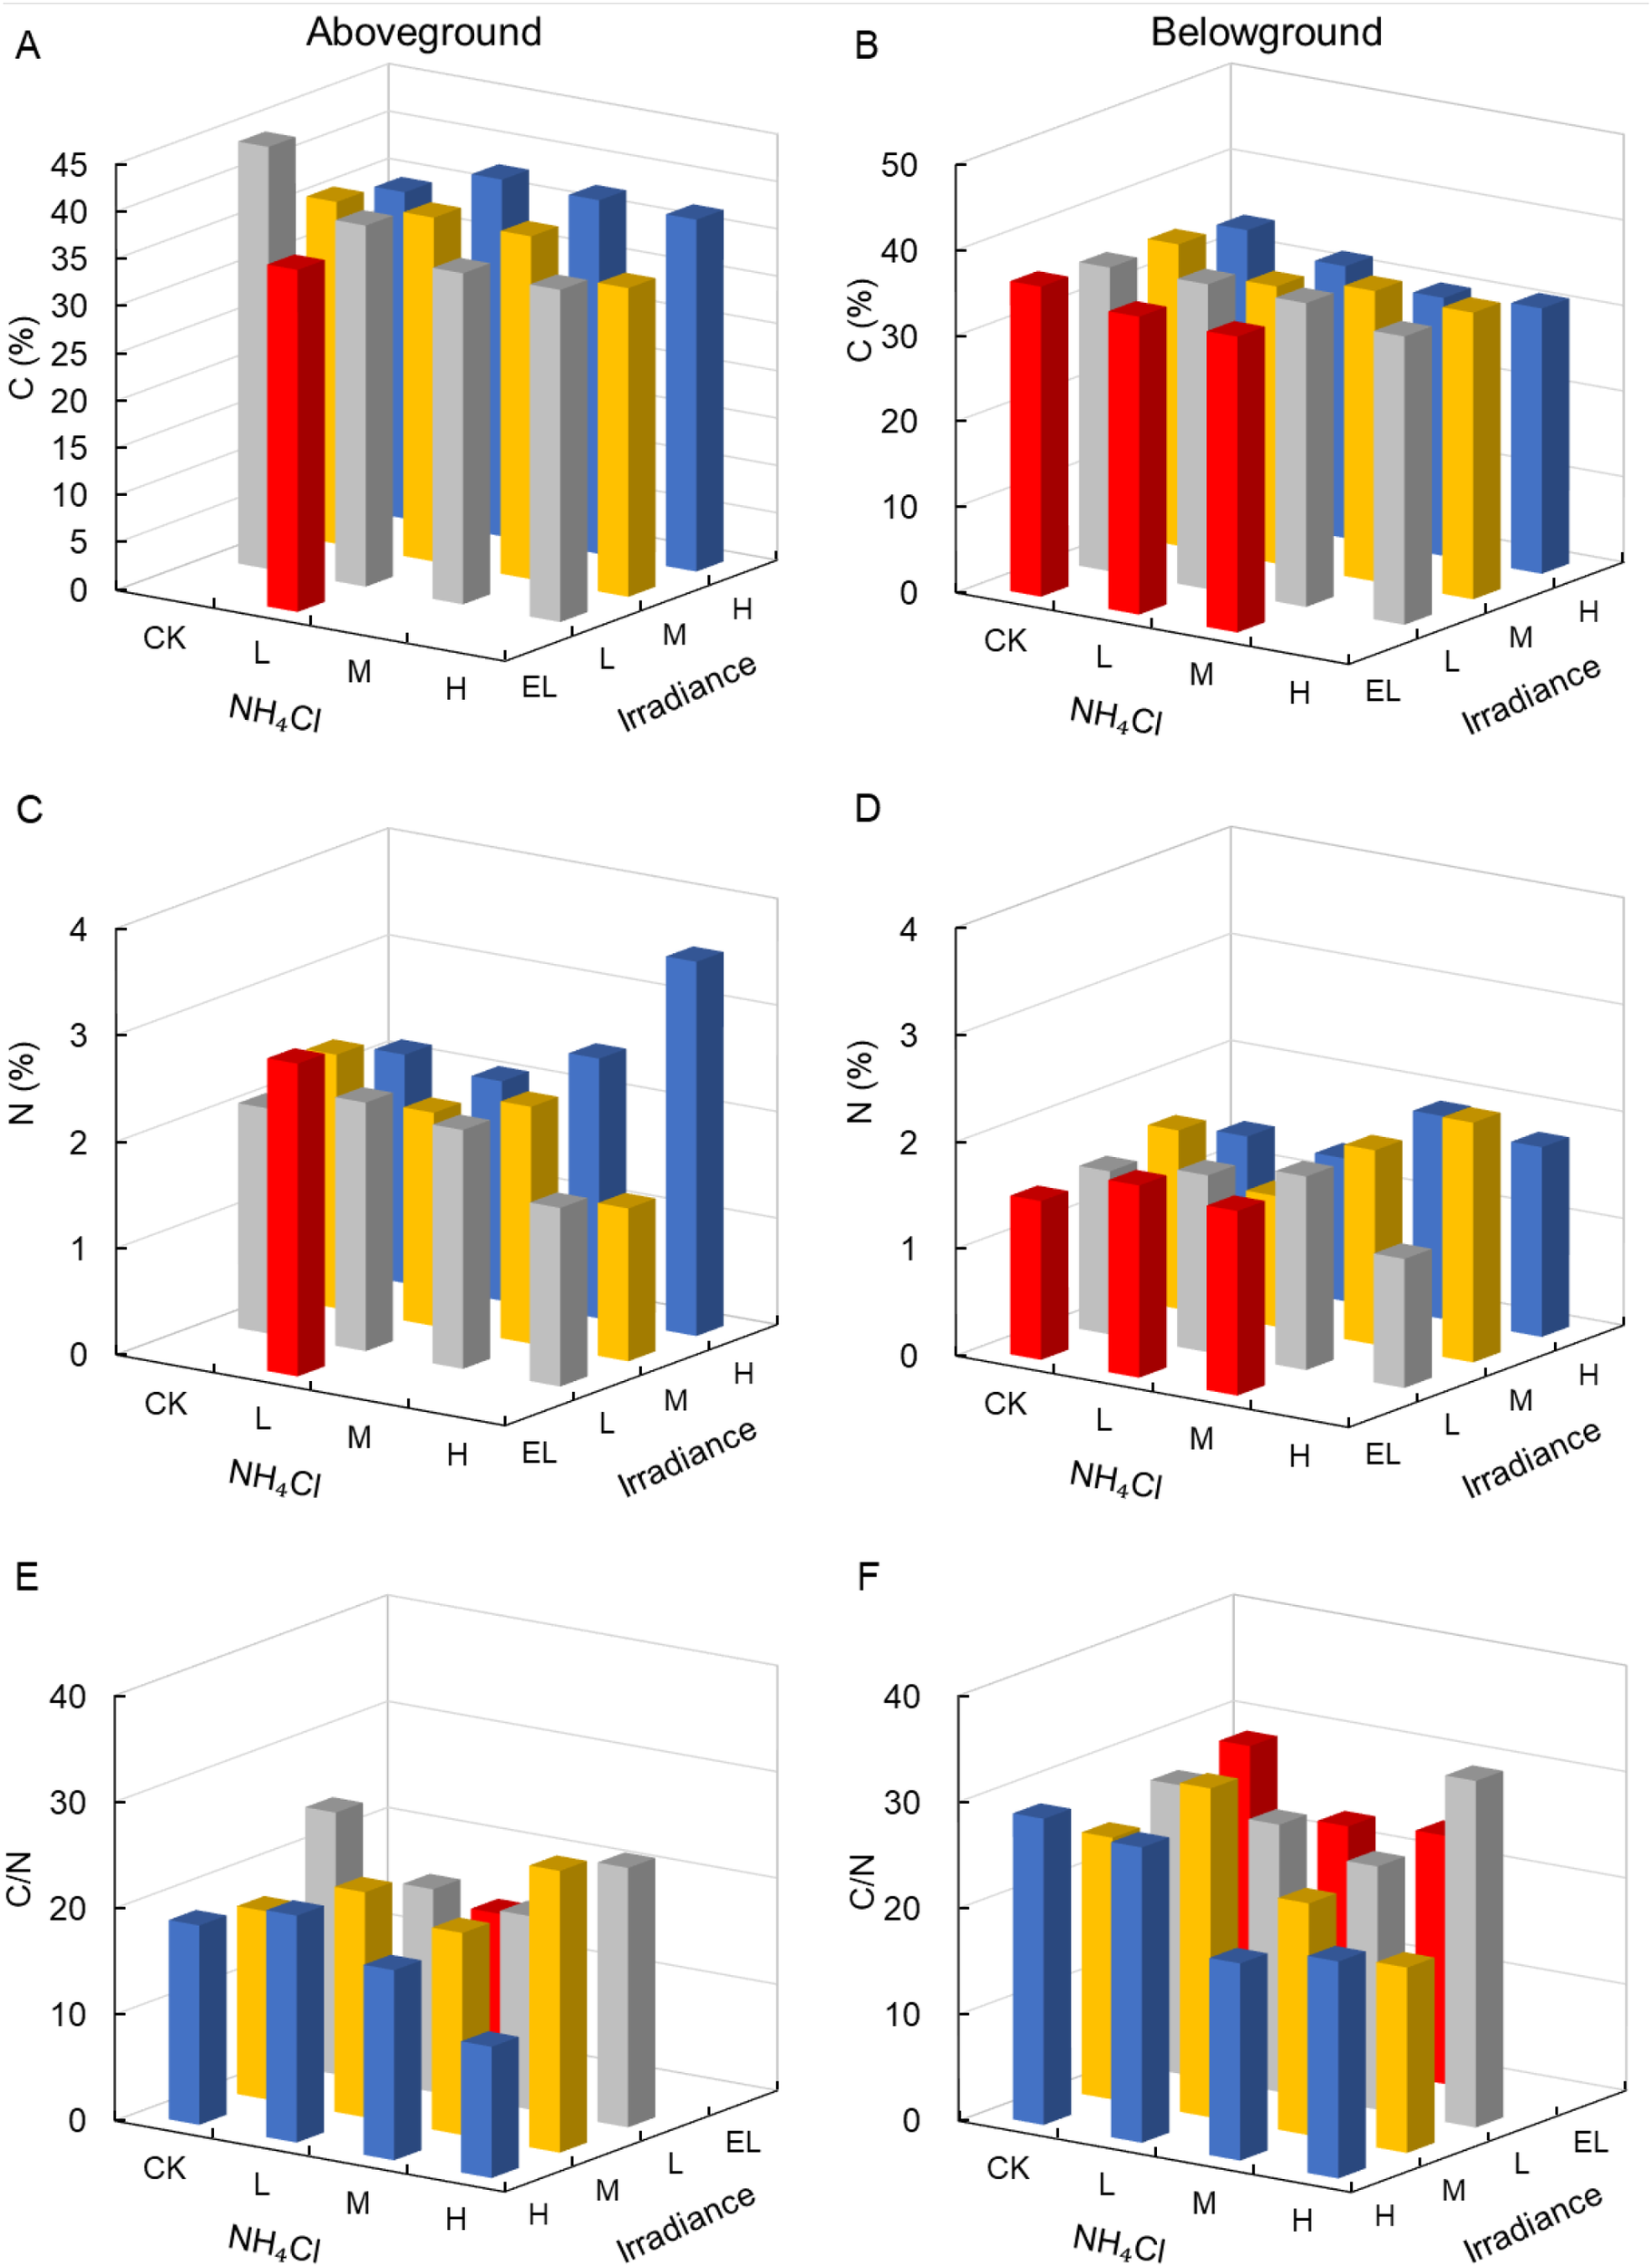
Carbon and nitrogen content and C:N ratios in Zostera marina under gradients of light intensity and NH4Cl enrichment. (A) Aboveground carbon content; (B) Belowground carbon content; (C) Aboveground nitrogen content; (D) Belowground nitrogen content; (E) Aboveground C:N ratio; (F) Belowground C:N ratio. Irradiance levels (H, M, L, EL) and NH4Cl addition levels (CK, L, M, H) are indicated consistently across figures using the same color scheme and axis orientation, as defined in Section 2.1.
Stable carbon isotope composition (δ13C) showed no significant treatment effects (p = 0.10 aboveground, p = 0.22 belowground; Table 4). Nevertheless, Figures 7A, B suggests a descriptive tendency toward less negative δ13C under shading (e.g., −11.37‰ in EL–L versus −14 to −16.48‰ under high light), which is presented as an illustrative pattern rather than a statistically supported treatment effect. Accordingly, mechanistic interpretations are framed cautiously and should be considered hypothesis-generating under the constraints of the design.
Figure 7
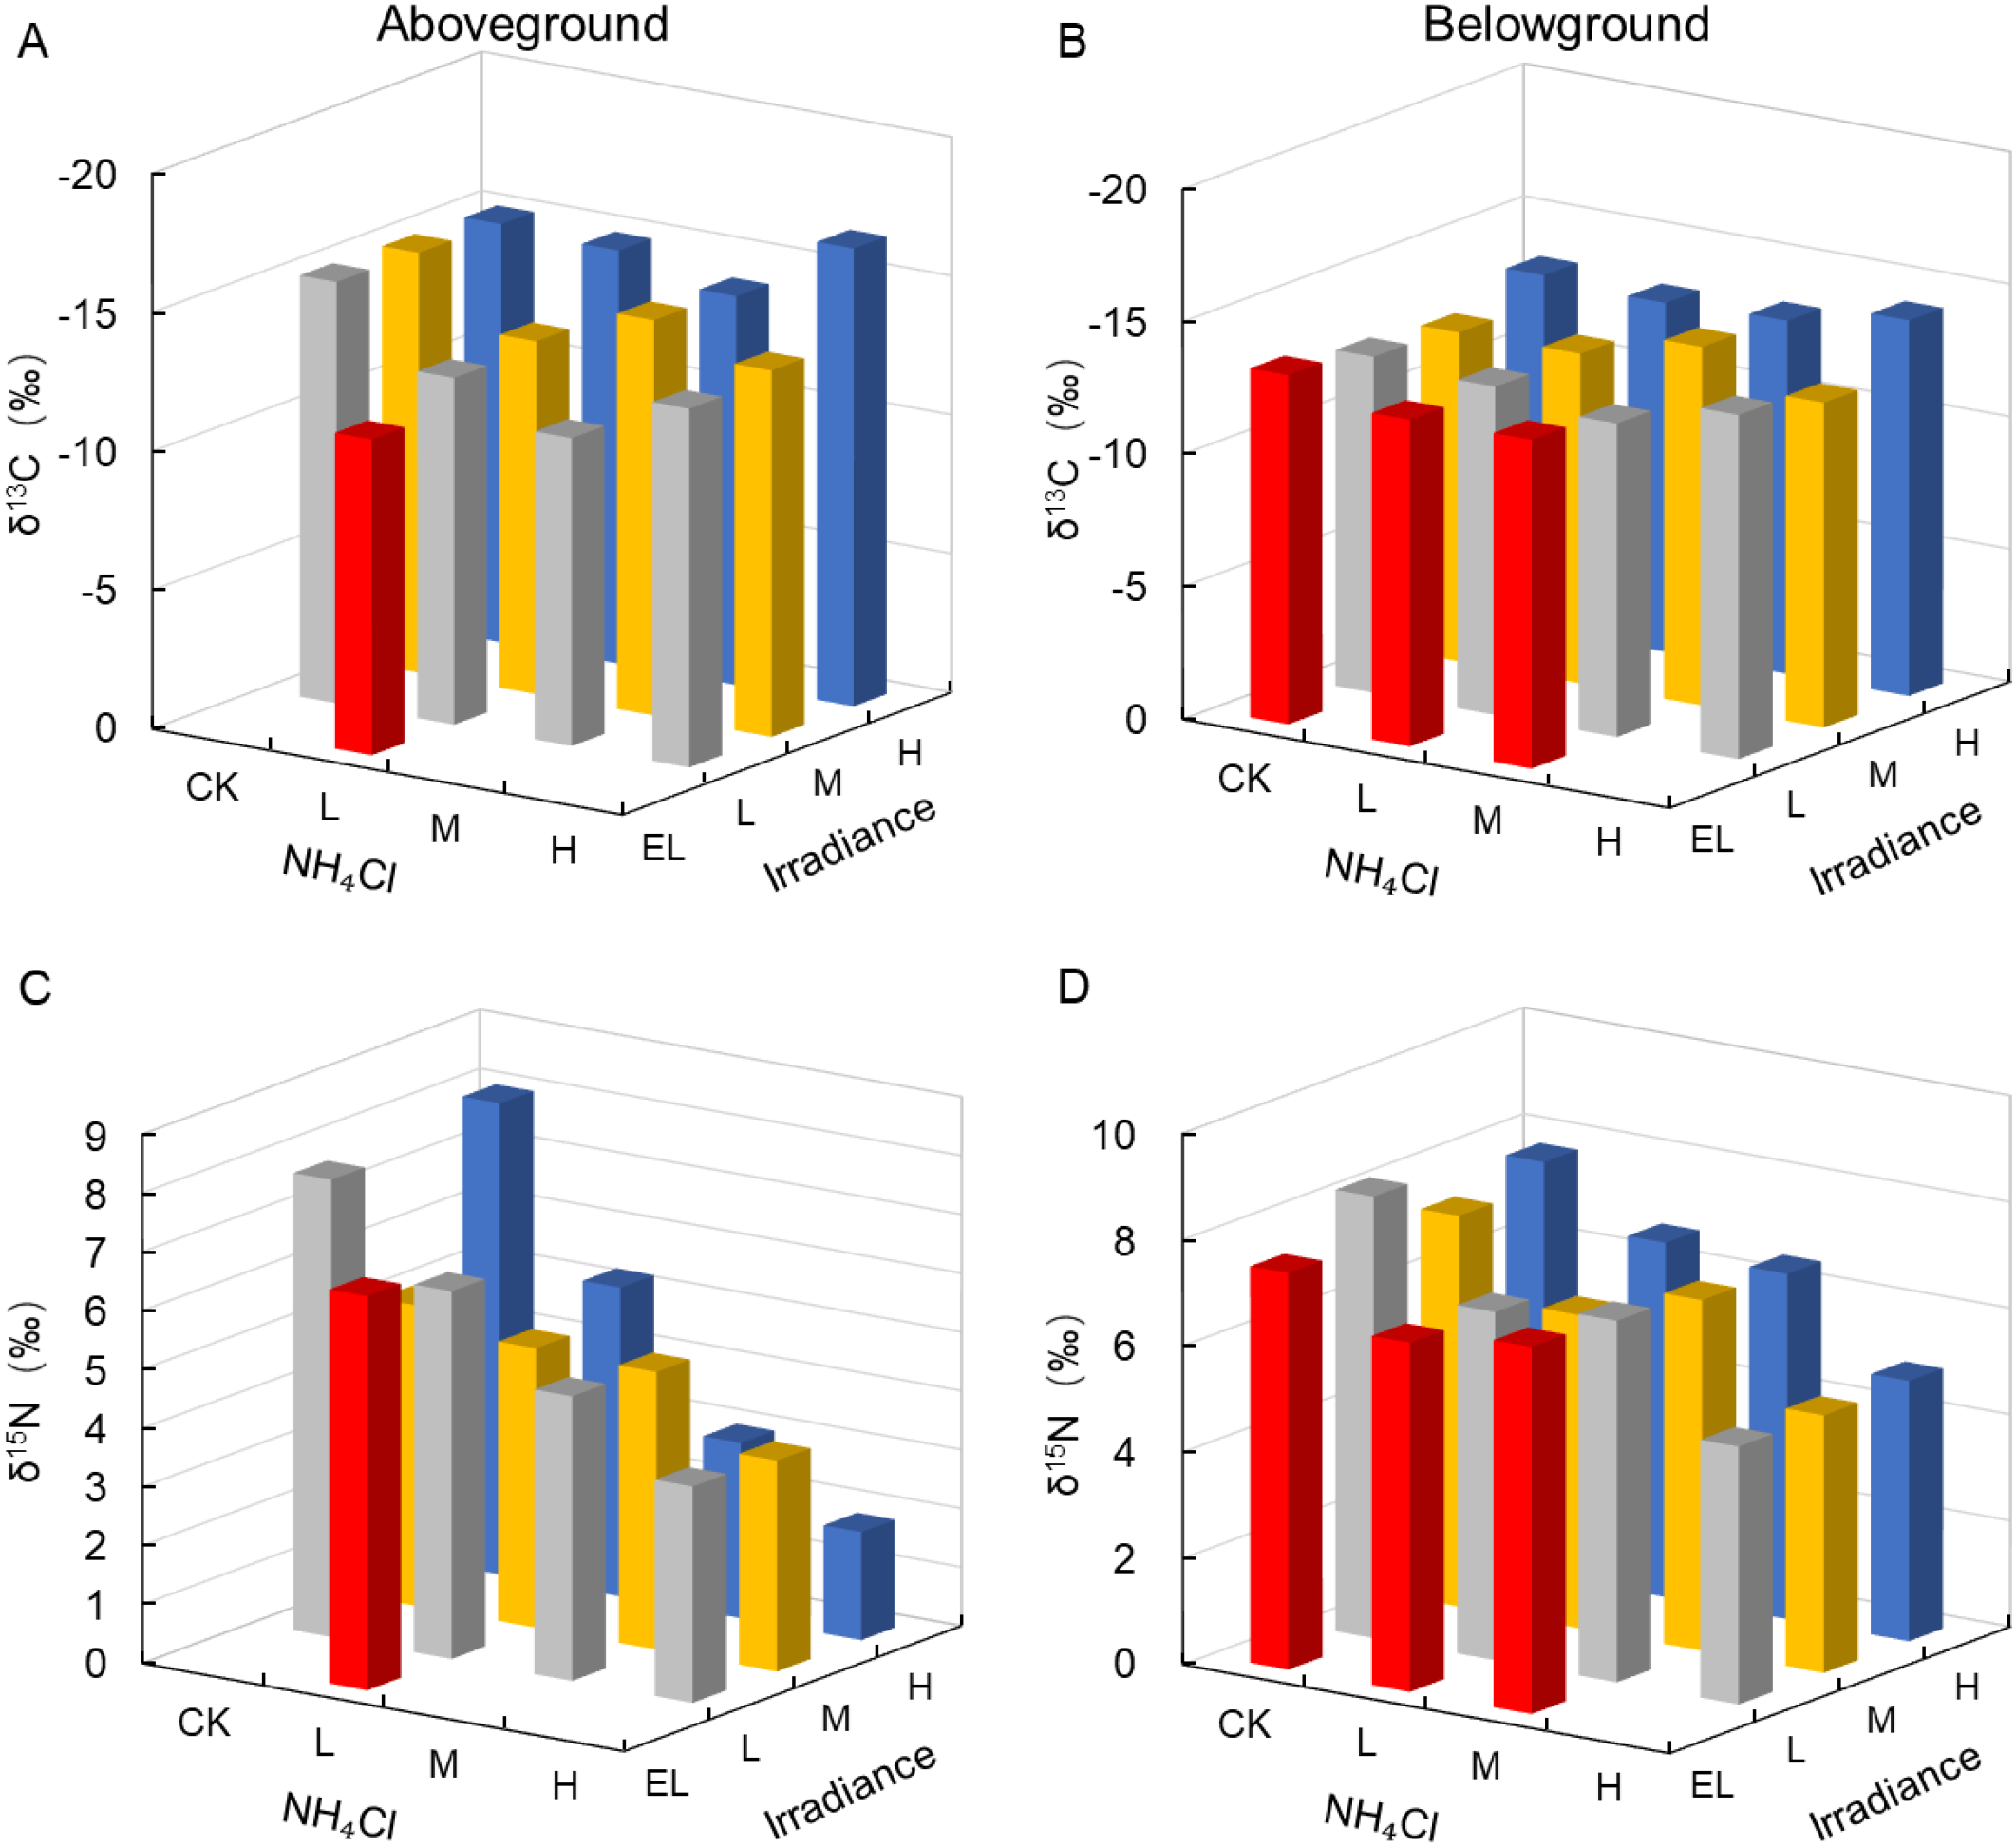
Stable isotope composition (δ13C and δ15N) in Zostera marina under gradients of light intensity and NH4Cl enrichment. (A) Aboveground δ13C; (B) Belowground δ13C; (C) Aboveground δ15N; (D) Belowground δ15N. Irradiance levels (H, M, L, EL) and NH4Cl addition levels (CK, L, M, H) are indicated consistently across figures using the same color scheme and axis orientation, as defined in Section 2.1.
Stable nitrogen isotope composition (δ15N) in aboveground tissues was significantly influenced by NH4Cl enrichment (p = 0.023, partial η² = 0.77), with δ15N decreasing from a range of 5.11–8.02‰ in the CK treatments (based on measured values) to < 4‰ under high NH4Cl (Figure 7C). Belowground δ15N also declined markedly with NH4Cl (p < 0.001, partial η² = 0.96; Figure 7D), indicating assimilation of 15N-depleted ammonium.
4 Discussion
Our results indicate that irradiance, rather than NH4Cl enrichment within the tested range, dominated the observed early responses of Zostera marina across morphological and physiological traits. Importantly, because this fully crossed design lacked within-cell replication, statistical inference is restricted to main effects only; thus, the discussion below interprets patterns as evidence of dominant main effects and does not test or attribute causality to specific light × NH4Cl combinations.
Pronounced declines in shoot density, AGB, BGB, and Fv/Fm under shading are consistent with the classic light-requirement theory for seagrasses, which states that most species require at least 10–20% of surface irradiance to maintain a positive carbon balance (Duarte, 1991; Dennison et al., 1993; Duarte et al., 2005; Ballesteros et al., 2007). For Z. marina, minimum light thresholds of approximately 10% of surface irradiance have been reported [e.g., 11% SI in a Danish embayment; (Lee et al., 2007)], below which shoot mortality and biomass loss may occur. This response is attributed to the fact that, below the compensation irradiance, respiration exceeds photosynthesis, leading to carbohydrate depletion and eventual die-off (Alcoverro et al., 1999; Ralph et al., 2007; Hintz et al., 2022). In agreement, we observed Fv/Fm values falling below 0.2 and near-total biomass collapse under EL conditions, indicating severe photoinhibition and insufficient photochemical energy to support net carbon gain. Such extremely low Fv/Fm values (~0.2) imply a large fraction of nonfunctional PSII reaction centers (Gorbunov and Falkowski, 2022), a pattern commonly observed in seagrasses that are dead or dying (Biber et al., 2004) when light falls below minimum requirements (Bertelli and Unsworth, 2018). For context, unstressed leaves typically show Fv/Fm ≈ 0.83 (Björkman and Demmig, 1987).
Conversely, NH4Cl enrichment did not elicit significant stress responses under our high-light conditions, in line with mesocosm evidence showing that ammonium becomes deleterious primarily when combined with low light, whereas no such effects occur under high light; moreover, moderate (<10 µM) DIN can even stimulate growth when nutrient-limited (Villazán et al., 2013). At higher concentrations, ammonium toxicity in Z. marina is well documented (Van Katwijk et al., 1997).
Shading shifted plant carbon balance from accrual to expenditure, consistent with reported NSC depletion and declines in both aboveground and belowground biomass (Burke et al., 1996). In our experiment, the increase in aboveground loss and the decline of belowground mass are consistent with a canopy-thinning strategy that lowers whole-plant respiratory demand, while mobilizing rhizome carbohydrates to sustain metabolism under low light (Wong et al., 2021). This dynamic aligns with seagrass light-stress theory: rapid photophysiological impairment under shading precedes growth and survival losses as net carbon balance turns negative (Ralph et al., 2007; Bertelli and Unsworth, 2018). Consequently, the observed decrease in below-ground carbon content provides a strong signature of carbon limitation.
Antioxidant enzyme responses were variable among treatments. In our study, POD activity increased under reduced irradiance, while SOD, CAT and GSH-Px showed no consistent trends, which is plausible under diminished photo-oxidative pressure (lower excitation energy at PSII/PSI) where ROS generation is limited by reductant availability (Foyer and Noctor, 2016). Such responses are consistent with the view that oxidative stress in seagrasses is context-dependent—shaped by light history, stress duration and co-stressors (Bertelli and Unsworth, 2018; Costa et al., 2021). Importantly, our MDA results—no increase under shading and occasionally higher values under high irradiance—support a mechanism where low light does not exacerbate oxidative damage, but higher ROS generation occurs when photosynthetic electron transport is more active, in line with chloroplast “push–pull” redox theory (Foyer and Noctor, 2016), and with observations that increases in light or temperature do not necessarily elevate MDA levels in seagrasses (Costa et al., 2021).
Across traits, NH4Cl enrichment alone showed minimal main effects, consistent with evidence that low–moderate inorganic N additions, typically reported at concentrations <10 µM may stimulate seagrass growth rather than cause toxicity (Touchette and Burkholder, 2000; Villazán et al., 2013). Ammonium toxicity in Z. marina typically emerges at relatively high water-column concentrations—on the order of ~102 µM—and can be exacerbated by low light (Van Katwijk et al., 1997). Because our highest addition (100 μmol L-¹) sits close to this lower toxicity bound, we interpret the weak ammonium responses as conditional on the short experimental duration and light context, and anticipate that clearer effects could develop with longer exposure and/or under stronger light limitation. Given that light limitation is a primary proximal stressor for seagrasses, and eutrophication often depresses performance via indirect light reduction (Ralph et al., 2007), our data align with the view that N effects are contingent on concentration and context, whereas light is the dominant immediate driver in this experiment.
Isotopically, both aboveground and belowground δ15N declined with NH4Cl addition, consistent with assimilation of 15N-depleted ammonium and isotope fractionation during uptake/assimilation (Ariz et al., 2011; Foscari et al., 2021). Leaf δ15N is widely used to trace nitrogen sources in seagrass and coastal producers, with lower values indicating greater reliance on ammonium when source δ15N and/or uptake fractionation favor ¹4N (Kahmen et al., 2008; Jones et al., 2018). In Z. marina, DIN-uptake/δ15N studies support this interpretation, so the observed δ15N shift provides an internal tracer corroborating NH4+ assimilation despite minimal whole-plant morphological/physiological responses (Robinson, 2001; Sandoval-Gil et al., 2015).
The present experimental design does not explicitly separate direct ammonium uptake through leaves from indirect effects mediated via sediment processes. Ammonium was added to the water column, and given the relatively short experimental duration, direct uptake by aboveground tissues likely contributed substantially to the observed nitrogen-related responses. This interpretation is supported by previous uptake studies showing that maximum ammonium uptake rates in aboveground tissues of Z. marina are substantially higher than those in belowground tissues (approximately 2.6-fold) (Li et al., 2020). Nevertheless, sediment-mediated processes, including microbial transformation and changes in sediment nitrogen availability, may also contribute to plant nitrogen acquisition, particularly over longer timescales (Herbert, 1999).
Although treatment effects on δ13C were not statistically significant, we observed a slight tendency toward less negative values under EL–L (−11.4‰) relative to H (−14 to −16.5‰). We note, however, that most experimental and review studies report δ13C enrichment under higher irradiance, as increased photosynthetic demand and boundary-layer drawdown (and/or greater HCO3- use) reduce discrimination, yielding less negative δ13C (Grice et al., 1996; Hemminga and Mateo, 1996; Lepoint et al., 2004). Conversely, shading typically increases discrimination and drives more negative δ13C (Durako and Hall, 1992). Our non-significant pattern should therefore be interpreted cautiously and may reflect transient DIC speciation, site-specific boundary-layer conditions, or tissue turnover effects. One possible explanation is that leaf and rhizome δ¹³C reflect carbon acquisition integrated over tissue turnover times that may exceed the five-week experimental duration, thereby constraining the development of strong isotopic responses under short-term light manipulation.
We acknowledge that this unreplicated factorial design limits formal statistical inference and precludes testing for interaction effects. Consequently, the present results should be interpreted as indicative of dominant main effects during early response stages, rather than as definitive tests of light × nitrogen interactions under the present experimental design.
5 Conclusion
Our controlled microcosm shows that irradiance, not ammonium enrichment within 0–100 μmol L-1, governs the early trajectory of Zostera marina. Shading depressed shoot density, AGB, BGB and Fv/Fm, increased tissue turnover, and reduced below-ground carbon—an integrated signature of light-driven carbon limitation. In contrast, NH4Cl produced minimal main effects on morphology, pigments, Fv/Fm or MDA and yielded isotopic, not structural, evidence of uptake via declining δ15N. Antioxidant responses were variable (POD increase; other enzymes inconsistent), and MDA did not rise under shading, consistent with reduced excitation pressure at low light. Collectively, these results argue for tiered diagnostics: rapid photophysiology (Fv/Fm) to flag approaching thresholds, structural metrics (shoot density, AGB/BGB, turnover) to quantify functional loss, and integrative biogeochemical markers (below-ground C; δ-isotopes) to assess resource balance. From a management perspective, maintaining water clarity to meet species-specific minimum light requirements remains paramount, which can be operationalized in practice using routinely available optical proxies such as underwater PAR, Secchi depth, or turbidity-based estimates within existing coastal monitoring programs; nitrogen effects are context- and dose-dependent. Methodologically, the absence of within-cell replication precluded formal interaction tests, so subtle light × NH4+ effects may have been missed. Longer exposures and graded NH4+ treatments should explicitly resolve interaction thresholds and link optical conditions to % surface-light targets, while direct NSC measurements will strengthen inferences connecting photophysiology, turnover and survival.
Statements
Data availability statement
The raw data supporting the conclusions of this article will be made available by the authors, without undue reservation.
Author contributions
SX: Investigation, Writing – review & editing, Software, Funding acquisition, Data curation, Writing – original draft, Visualization. GY: Writing – original draft, Investigation. XW: Writing – original draft, Investigation. YY: Writing – original draft, Investigation. YW: Writing – original draft, Investigation. ML: Writing – original draft, Investigation. YuZ: Writing – original draft, Investigation. SY: Investigation, Writing – original draft. XZ: Investigation, Writing – original draft. YiZ: Writing – review & editing.
Funding
The author(s) declared that financial support was received for this work and/or its publication. This research was supported by the Young Scientists Fund of the National Natural Science Foundation of China (42206142), Shandong Provincial Natural Science Foundation (ZR2024QD102), and the Taishan Scholars Program (Distinguished Taishan Scholars).
Conflict of interest
The author(s) declared that this work was conducted in the absence of any commercial or financial relationships that could be construed as a potential conflict of interest.
Generative AI statement
The author(s) declared that generative AI was not used in the creation of this manuscript.
Any alternative text (alt text) provided alongside figures in this article has been generated by Frontiers with the support of artificial intelligence and reasonable efforts have been made to ensure accuracy, including review by the authors wherever possible. If you identify any issues, please contact us.
Publisher’s note
All claims expressed in this article are solely those of the authors and do not necessarily represent those of their affiliated organizations, or those of the publisher, the editors and the reviewers. Any product that may be evaluated in this article, or claim that may be made by its manufacturer, is not guaranteed or endorsed by the publisher.
References
1
Alcoverro T. Zimmerman R. C. Kohrs D. G. Alberte R. S. (1999). Resource allocation and sucrose mobilization in light-limited eelgrass Zostera marina. Mar. Ecol. Prog. Ser.187, 121–131. doi: 10.3354/meps187121
2
Ariz I. Cruz C. Moran J. F. González-Moro M. B. García-Olaverri C. González-Murua C. et al . (2011). Depletion of the heaviest stable N isotope is associated with NH4+/NH3 toxicity in NH4+-fed plants. BMC Plant Biol.11, 83. doi: 10.1186/1471-2229-11-83
3
Ballesteros E. Cebrian E. Alcoverro T. (2007). Mortality of shoots of Posidonia oceanica following meadow invasion by the red alga Lophocladia lallemandii. Botanica Mar.50(1), 8–13. doi: 10.1515/BOT.2007.002
4
Bertelli C. M. Unsworth R. K. F. (2018). Light stress responses by the eelgrass, Zostera marina (L). Front. Environ. Sci.6, 00039. doi: 10.3389/fenvs.2018.00039
5
Biber P. D. Paerl H. W. Gallegos C. L. Kenworthy W. J. (2004). Evaluating indicators of seagrass stress to light. Estuarine indicators (Boca Raton, FL, USA: CRC Press), 215–232.
6
Björkman O. Demmig B. (1987). Photon yield of O2 evolution and chlorophyll fluorescence characteristics at 77 K among vascular plants of diverse origins. Planta170, 489–504. doi: 10.1007/BF00402983
7
Bulmer R. H. Townsend M. Drylie T. Lohrer A. M. (2018). Elevated turbidity and the nutrient removal capacity of seagrass. Front. Mar. Sci.5, 462. doi: 10.3389/fmars.2018.00462
8
Burke M. K. Dennison W. C. Moore K. A. (1996). Non-structural carbohydrate reserves of eelgrass Zostera marina. Mar. Ecol. Prog. Ser.137, 195–201. doi: 10.3354/meps137195
9
Collier C. J. Chartrand K. Honchin C. Fletcher A. Rasheed M. (2016). Light thresholds for seagrasses of the GBRWHA: a synthesis and guiding document. Report. James Cook University, Cairns, Australia.
10
Collos Y. Harrison P. J. (2014). Acclimation and toxicity of high ammonium concentrations to unicellular algae. Mar. pollut. Bull.80, 8–23. doi: 10.1016/j.marpolbul.2014.01.006
11
Costa M. M. Silva J. Barrote I. Santos R. (2021). Heatwave effects on the photosynthesis and antioxidant activity of the seagrass Cymodocea nodosa under contrasting light regimes. Ocean2 (3), 448–460. doi: 10.3390/oceans2030025
12
Dazy M. Masfaraud J.-F. Férard J.-F. (2009). Induction of oxidative stress biomarkers associated with heavy metal stress in Fontinalis antipyretica Hedw. Chemosphere75, 297–302. doi: 10.1016/j.chemosphere.2008.12.045
13
Dennison W. C. Orth R. J. Moore K. A. Stevenson J. C. Carter V. Kollar S. et al . (1993). Assessing water quality with submersed aquatic vegetation. BioScience43, 86–94. doi: 10.2307/1311969
14
Duarte C. M. (1991). Seagrass depth limits. Aquat. Bot.40, 363–377. doi: 10.1016/0304-3770(91)90081-F
15
Duarte C. M. Middelburg J. J. Caraco N. (2005). Major role of marine vegetation on the oceanic carbon cycle. Biogeosciences2, 1–8. doi: 10.5194/bg-2-1-2005
16
Durako M. J. Hall M. O. (1992). Effects of light on the stable carbon isotope composition of the seagrass Thalassia testudinum. Mar. Ecol. Prog. Ser.86, 99–101. doi: 10.3354/meps086099
17
Foscari A. Leonarduzzi G. Incerti G. (2021). N uptake, assimilation and isotopic fractioning control δ15N dynamics in plant DNA: A heavy labelling experiment on Brassica napus L. PloS One16, e0247842. doi: 10.1371/journal.pone.0247842
18
Foyer C. H. Noctor G. (2016). Stress-triggered redox signalling: what’s in pROSpect? Plant. Cell Environ.39, 951–964. doi: 10.1111/pce.12621
19
Gorbunov M. Y. Falkowski P. G. (2022). Using chlorophyll fluorescence to determine the fate of photons absorbed by phytoplankton in the World’s oceans. Annu. Rev. Mar. Sci.14, 213–238. doi: 10.1146/annurev-marine-032621-122346
20
Green E. P. Short F. T. (2003). World atlas of seagrasses (Berkeley, CA, USA: University of California Press).
21
Grice A. Loneragan N. Dennison W. (1996). Light intensity and the interactions between physiology, morphology and stable isotope ratios in five species of seagrass. J. Exp. Mar. Biol. Ecol.195, 91–110. doi: 10.1016/0022-0981(95)00096-8
22
Hemminga M. Mateo M. (1996). Stable carbon isotopes in seagrasses: variability in ratios and use in ecological studies. Mar. Ecol. Prog. Ser.140, 285–298. doi: 10.3354/meps140285
23
Herbert R. (1999). Nitrogen cycling in coastal marine ecosystems. FEMS Microbiol. Rev.23, 563–590. doi: 10.1111/j.1574-6976.1999.tb00414.x
24
Hintz N. H. Schulze B. Wacker A. Striebel M. (2022). Ecological impacts of photosynthetic light harvesting in changing aquatic environments: A systematic literature map. Ecol. Evol.12, e8753. doi: 10.1002/ece3.8753
25
Hodges D. M. DeLong J. M. Forney C. F. Prange R. K. (1999). Improving the thiobarbituric acid-reactive-substances assay for estimating lipid peroxidation in plant tissues containing anthocyanin and other interfering compounds. Planta207, 604–611. doi: 10.1007/s004250050524
26
Jones B. L. Cullen-Unsworth L. C. Unsworth R. K. (2018). Tracking nitrogen source using δ15N reveals human and agricultural drivers of seagrass degradation across the British Isles. Front. Plant Sci.9, 133. doi: 10.3389/fpls.2018.00133
27
Kahmen A. Wanek W. Buchmann N. (2008). Foliar δ15N values characterize soil N cycling and reflect nitrate or ammonium preference of plants along a temperate grassland gradient. Oecologia156, 861–870. doi: 10.1007/s00442-008-1028-8
28
Kent F. Lilley R. Unsworth R. Cunningham S. Begg T. Boulcott P. et al . (2021). Seagrass restoration in Scotland–handbook and guidance. NatureScot Research Report1286.
29
Lee K. S. Park S. R. Kim Y. K. (2007). Effects of irradiance, temperature, and nutrients on growth dynamics of seagrasses: A review. J. Exp. Mar. Biol. Ecol.350, 144–175. doi: 10.1016/j.jembe.2007.06.016
30
Lepoint G. Dauby P. Gobert S. (2004). Applications of C and N stable isotopes to ecological and environmental studies in seagrass ecosystems. Mar. pollut. Bull.49, 887–891. doi: 10.1016/j.marpolbul.2004.07.005
31
Li S.-Q. Zhang Y.-H. Li Z. Zhang P.-D. (2020). Uptake kinetics of nitrogen and phosphorus by Zostera marina. Chin. J. Plant Ecol.44, 772. doi: 10.17521/cjpe.2019.0335
32
Lichtenthaler H. (1987). Chlorophylls and carotenoids: pigments of photosynthetic biomembranes. Methods Enzymol.148, 350–382. doi: 10.1016/0076-6879(87)48036-1
33
Makino A. Mae T. Ohira K. (1985). Enzymic properties of ribulose-1, 5-bisphosphate carboxylase/oxygenase purified from rice leaves. Plant Physiol.79, 57–61. doi: 10.1104/pp.79.1.57
34
McMahon K. Collier C. Lavery P. S. (2013). Identifying robust bioindicators of light stress in seagrasses: A meta-analysis. Ecol. Indic.30, 7–15. doi: 10.1016/j.ecolind.2013.01.030
35
Olsen J. L. Rouzé P. Verhelst B. Lin Y.-C. Bayer T. Collen J. et al . (2016). The genome of the seagrass Zostera marina reveals angiosperm adaptation to the sea. Nature530, 331–335. doi: 10.1038/nature16548
36
Ralph P. J. Durako M. J. Enriquez S. Collier C. J. Doblin M. A. (2007). Impact of light limitation on seagrasses. J. Exp. Mar. Biol. Ecol.350, 176–193. doi: 10.1016/j.jembe.2007.06.017
37
Robinson D. (2001). δ15N as an integrator of the nitrogen cycle. Trends Ecol. Evol.16, 153–162. doi: 10.1016/S0169-5347(00)02098-X
38
Roca G. Alcoverro T. Krause-Jensen D. Balsby T. J. S. van Katwijk M. M. Marbà N. et al . (2016). Response of seagrass indicators to shifts in environmental stressors: a global review and management synthesis. Ecol. Indic.63, 310–323. doi: 10.1016/j.ecolind.2015.12.007
39
Sandoval-Gil J. M. Camacho-Ibar V. F. Del Carmen Ávila-López M. Hernández-López J. Zertuche-González J. A. Cabello-Pasini A. (2015). Dissolved inorganic nitrogen uptake kinetics and δ15N of Zostera marina L.(eelgrass) in a coastal lagoon with oyster aquaculture and upwelling influence. J. Exp. Mar. Biol. Ecol.472, 1–13. doi: 10.1016/j.jembe.2015.06.018
40
Serrano O. Gómez-López D. I. Sánchez-Valencia L. Acosta-Chaparro A. Navas-Camacho R. González-Corredor J. et al . (2021). Seagrass blue carbon stocks and sequestration rates in the Colombian Caribbean. Sci. Rep.11, 11067. doi: 10.1038/s41598-021-90544-5
41
Statton J. McMahon K. McCallum R. Armstrong P. Dunham N. Strydom S. et al . (2017). Determining light stress bio-indicators and thresholds for a tropical multi-species seagrass assemblage. Report of Theme 5 - Project 5.5.1 prepared for the Dredging Science Node, Western Australian Marine Science Institution, Perth, Western Australia, 50 pp.
42
Touchette B. W. Burkholder J. M. (2000). Review of nitrogen and phosphorus metabolism in seagrasses. J. Exp. Mar. Biol. Ecol.250, 133–167. doi: 10.1016/S0022-0981(00)00195-7
43
Unsworth R. K. F. Nordlund L. M. Cullen-Unsworth L. C. (2018). Seagrass meadows support global fisheries production. Conserv. Lett.12 (1), e12566. doi: 10.1111/conl.12566
44
Van Katwijk M. M. Van Beusekom J. E. Folmer E. O. Kolbe K. De Jong D. J. Dolch T. (2024). Seagrass recovery trajectories and recovery potential in relation to nutrient reduction. J. Appl. Ecol.61, 1784–1804. doi: 10.1111/1365-2664.14704
45
Van Katwijk M. Vergeer L. Schmitz G. Roelofs J. (1997). Ammonium toxicity in eelgrass Zostera marina. Mar. Ecol. Prog. Ser.157, 159–173. doi: 10.3354/meps157159
46
Villazán B. Pedersen M. F. Brun F. G. Vergara J. J. (2013). Elevated ammonium concentrations and low light form a dangerous synergy for eelgrass Zostera marina. Mar. Ecol. Prog. Ser.493, 141–154. doi: 10.3354/meps10517
47
Wong M. C. Vercaemer B. M. Griffiths G. (2021). Response and recovery of eelgrass (Zostera marina) to chronic and episodic light disturbance. Estuar. Coasts.44, 312–324. doi: 10.1007/s12237-020-00803-3
48
Zhang Y. Yue S. Gao Y. Zhao P. Liu M. Qiao Y. et al . (2024). Insights into response of seagrass (Zostera marina) to sulfide exposure at morphological, physiochemical and molecular levels in context of coastal eutrophication and warming. Plant. Cell Environ.47, 4768–4785. doi: 10.1111/pce.15048
Summary
Keywords
ammonium enrichment, antioxidant defense, light limitation, photosynthesis, Zostera marina L., δ-isotopes
Citation
Xu S, Yin G, Wang X, Yuan Y, Wang Y, Liu M, Zhang Y, Yue S, Zhang X and Zhou Y (2026) Light outweighs ammonium: irradiance governs early morphological, physiological and isotopic responses of Zostera marina under controlled nutrient additions. Front. Mar. Sci. 13:1752748. doi: 10.3389/fmars.2026.1752748
Received
03 December 2025
Revised
20 January 2026
Accepted
26 January 2026
Published
12 February 2026
Volume
13 - 2026
Edited by
Guangming Xu, Beijing Normal University, Zhuhai, China
Reviewed by
Jessica Arnull, University of Edinburgh, United Kingdom
Xiang Zhang, Hainan University, China
Updates
Copyright
© 2026 Xu, Yin, Wang, Yuan, Wang, Liu, Zhang, Yue, Zhang and Zhou.
This is an open-access article distributed under the terms of the Creative Commons Attribution License (CC BY). The use, distribution or reproduction in other forums is permitted, provided the original author(s) and the copyright owner(s) are credited and that the original publication in this journal is cited, in accordance with accepted academic practice. No use, distribution or reproduction is permitted which does not comply with these terms.
*Correspondence: Shaochun Xu, xushaochun@qdio.ac.cn; Yi Zhou, yizhou@qdio.ac.cn
Disclaimer
All claims expressed in this article are solely those of the authors and do not necessarily represent those of their affiliated organizations, or those of the publisher, the editors and the reviewers. Any product that may be evaluated in this article or claim that may be made by its manufacturer is not guaranteed or endorsed by the publisher.