


- 1 Département de Biologie, Université Laval, Québec, QC, Canada
- 2 Takuvik Joint International Laboratory, Université Laval – CNRS, QC, Canada
- 3 Centre d’Études Nordiques, Université Laval, Québec, QC, Canada
- 4 Québec-Océan, Québec, QC, Canada
- 5 Institut de Biologie Intégrative et des Systèmes, Québec, QC, Canada
Cyanobacterial mats are often a major biological component of extreme aquatic ecosystems, and in polar lakes and streams they may account for the dominant fraction of total ecosystem biomass and productivity. In this study we examined the vertical structure and physiology of Arctic microbial mats relative to the question of how these communities may respond to ongoing environmental change. The mats were sampled from Ward Hunt Lake (83°5.297′N, 74°9.985′W) at the northern coast of Arctic Canada, and were composed of three visibly distinct layers. Microsensor profiling showed that there were strong gradients in oxygen within each layer, with an overall decrease from 100% saturation at the mat surface to 0%, at the bottom, accompanied by an increase of 0.6 pH units down the profile. Gene clone libraries (16S rRNA) revealed the presence of Oscillatorian sequences throughout the mat, while Nostoc related species dominated the two upper layers, and Nostocales and Synechococcales sequences were common in the bottom layer. High performance liquid chromatography analyses showed a parallel gradient in pigments, from high concentrations of UV-screening scytonemin in the upper layer to increasing zeaxanthin and myxoxanthin in the bottom layer, and an overall shift from photoprotective to photosynthetic carotenoids down the profile. Climate change is likely to be accompanied by lake level fluctuations and evaporative concentration of salts, and thus increased osmotic stress of the littoral mat communities. To assess the cellular capacity to tolerate increasing osmolarity on physiology and cell membrane integrity, mat sections were exposed to a gradient of increasing salinities, and PAM measurements of in vivo chlorophyll fluorescence were made to assess changes in maximum quantum yield. The results showed that the mats were tolerant of up to a 46-fold increase in salinity. These features imply that cyanobacterial mats are resilient to ongoing climate change, and that in the absence of major biological perturbations, these vertically structured communities will continue to be a prominent feature of polar aquatic ecosystems.
Introduction
Cyanobacterial mats are well known for their ecological success in extreme environments (Stal and Krumbein, 1985). Some of the most striking examples occur in the polar regions where cyanobacterial mats often dominate the biomass and productivity of freshwater ecosystems (Vincent, 2000). This ubiquitous and abundant distribution has been attributed to the ability of Arctic and Antarctic cyanobacterial communities to withstand extreme conditions of the polar environment including continuous solar radiation (UV and photosynthetically active radiation, PAR) during summer, persistent cold temperatures, and freeze–thaw cycles (Zakhia et al., 2008). These ambient conditions of the Arctic are currently being modified by the impacts of global climate change. Observations and models show faster climatic changes in the Arctic than at other latitudes, with a rate of atmospheric warming over the last four decades that has been up to three times greater than the global average (Serreze and Francis, 2006), and this trend is likely to continue in the future (IPCC, 2007).
Two major impacts of warming on Arctic lakes are reduced thickness and duration ice cover, and a shift toward an increasingly negative precipitation minus evaporation balance. The latter is favored by increased evaporation at warmer lake water temperatures, as well as the increasing exposure of the lakes to the atmosphere during a longer ice-free season. For some High Arctic lakes this has led to increased salinities, and in some cases, complete evaporation to dryness (Smol and Douglas, 2007). Cyanobacterial mats living in these shallow water ecosystems will be increasingly subject to the osmotic stresses of solute concentration and desiccation. These effects may be further compounded by salt-exclusion during freeze-up of shallow water lakes (Schmidt et al., 1991) and the littoral zone of deeper lakes. Cyanobacteria have long been known to be tolerant of salinity fluctuations, but to a variable extent among taxa (Mackay et al., 1984), and osmotic effects have not been assessed in the Arctic where the physiological stress may be exacerbated by cold ambient temperatures. Both evaporation and salt-exclusion contribute to high salinity and the polar microbial mats are exposed to higher salinities in liquid water compared to microbial mats at lower latitudes. Reduced ice cover (and its associated snow; Belzile et al., 2001) also results in greater exposure to solar UV radiation, which is increasing over the Arctic as a result of stratospheric ozone depletion (Manney et al., 2011).
The phylogenetic composition of temperate latitude microbial mats has been extensively studied (e.g., Balskus et al., 2011; Bolhuis and Stal, 2011) and these communities contain diverse cyanobacteria, other Bacteria, and some eukaryotes. However, despite their ubiquitous distribution throughout the Arctic, in lakes, ponds and streams, the community composition, and structure of microbial mats in northern Polar Regions is much less studied. Initial surveys of bacteria (Bottos et al., 2008), cyanobacteria (Jungblut et al., 2010), and one metagenomic study of mats on Arctic ice shelves, has confirmed the diversity of cyanobacteria along with other Bacteria, notably Proteobacteria, and Archaea (Varin et al., 2010). The ice shelf mats also provide a protected habitat for eukaryotes including diatoms, chlorophytes, flagellates, ciliates, and microinvertebrates (Vincent, 2000).
Most studies to date on high latitude microbial mats have focused on their bulk taxonomic, pigment, and physiological characteristics; however there is also evidence of strong vertical gradients in these properties within such communities (e.g., Quesada et al., 1999; Hawes and Schwarz, 2001). Such gradients are also well known from temperate latitude mats. For example, a study conducted on microbial mats of the intertidal zone showed major vertical changes down the mat profile in coloration, pigment content, and phylogenetic composition (Balskus et al., 2011).
Our aims in the present study were to characterize cyanobacterial mats growing at the northern limit of the terrestrial High Arctic, and to evaluate the hypothesis that these communities have a high tolerance to the osmotic stresses that may be increasingly common in the future. We determined the oxygen and pH gradients in mat samples by way of microsensor profiling in two successive years of sampling. We partitioned the mats into their component layers distinguishable by color, and examined the molecular phylogeny (by 16S rRNA gene analysis) and pigment composition (by high performance liquid chromatography, HPLC) of each stratum to evaluate the vertical structure of these communities that thrive in the extreme High Arctic environment.
Materials and Methods
Study Site
Sampling took place in July 2010 and 2011 at Ward Hunt Lake (WHL; 83°05.297′N, 74°09.985′W), as part of the program “Northern Ellesmere Island in the Global Environment” (NEIGE). This lake is on Ward Hunt Island off the northern coast of Ellesmere Island in the Canadian High Arctic and within Quttinirpaaq National Park. The total area is of the lake is 0.37 km2, with a maximum recorded depth of 7.5 m. At this extreme latitude, ice covers the lake for at least 9 months of the year and there are 147 days of continuous light during summer (Mueller et al., 2005). Microbial mats occur in the seasonally ice-free littoral zone along the northern and western sides of the lake. Although, phytoplankton in this oligotrophic lake are strongly nutrient limited, high concentrations of nutrients have been recorded in the interstitial waters of the mats (Villeneuve et al., 2001), and in 2-week bioassays the mat phototrophs showed no response to nutrient enrichment (Bonilla et al., 2005).
Field Sampling
Temperature, oxygen, and conductivity of lake water in the littoral zone were measured on July 10, 2011 using a Hydrolab DS5X profiler (Loveland, CO, USA).
The mats were sampled from 10 to 20 cm water depth in July 2010 and 2011. The samples were placed in a cooler with lake water and taken directly to a field laboratory. Microenvironmental gradients within the mats were assessed within 20–40 min of collection using micromanipulator-controlled, 10 μm diameter Unisense microsensors for oxygen and pH (Unisense, Aarhus, Denmark), with accurate positioning to within 10 μm. The microsensor measurements were made at 100 μm intervals to obtain vertical profiles through the mats.
The cyanobacterial mats samples were separated at the field laboratory into three layers: surface black colonies, an upper pink layer, and a lower green layer (Figure 1). Subsamples for HPLC analysis of the three layers were placed into a dry-shipper (previously cooled with liquid nitrogen) in the field and transferred to −80°C storage until pigment analysis. Samples for DNA extraction were stored in 1.5 mL of buffer (1.8 mL of 40 mmol L−1 EDTA; 50 mmol L−1 Tris pH = 8.3; 0.75 mol L−1 sucrose) and kept frozen in the dry-shipper in the field and transferred to −80°C storage until analysis.
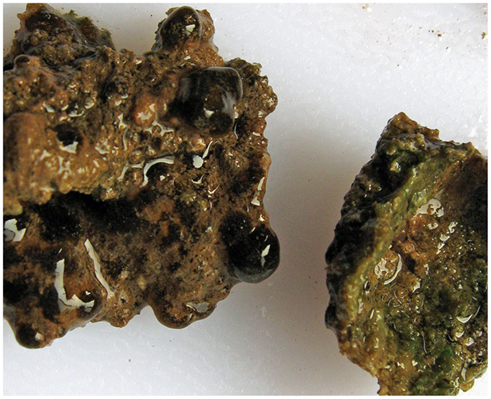
Figure 1. Photograph of the Ward Hunt Lake microbial mats. The mats were photographed 30 min after sampling, on July 7, 2010. The mat on the left shows the view from the top, with black colonies distributed over the pink surface. The mat on the right has been turned upside down to show the green layer, which extended down into interstices of the underlying rocky substrate. The black colonies were up to 5 mm in diameter.
Pigment Analysis
Within 1 month of collection, samples from the three layers of the microbial mat destined for pigment analysis were freeze-dried using a Labconco Freezone 12 (Labconco, Kansas City, USA). Mat subsamples were then weighed and extracted in the dark by grinding for 2 min followed by two sonication treatments for 30 s each at 17 W in 4 mL 90% acetone:water (vol/vol). The samples were then left overnight at −20°C under an argon gas atmosphere, and the supernatant recovered after vortexing and centrifugation (4150 rpm for 15 min at 4°C). This was filtered through a 0.2-μm pore size PTFE Acrodisc filter (PALL Corporation, Ann Arbor, MI, USA) and placed in a 2-mL amber vial with an argon gas atmosphere for immediate analysis by HPLC. Each layer of the mat was extracted three more times to ensure the full recovery of all material. Four vials were thus analyzed for each mat sample, and the results summed.
High performance liquid chromatography analysis was performed using a ProStar HPLC system (Varian, Palo Alto, CA, USA) with a Symmetry C8 column (3.5 μm pore size, 4.6 mm × 150 mm; Waters Corporation, Milford, MA, USA) at 25°C, with a C8 guard column (5 μm pore size, 3.9 mm × 20 mm; Waters Corporation). Carotenoids were quantified by their absorbance at 450 nm in a Diode Array Detector (350–750 nm) and chlorophylls were detected by fluorescence (excitation at 400 nm and emission at 650 nm). The HPLC separation method was as in Zapata et al. (2000). Pigments were identified based on retention time and spectral comparisons with standards from DHI (Water & Environments, Horsholm, Denmark).
Molecular Analysis
Mat samples for DNA analysis were extracted using a modified salt-based protocol as in Harding et al. (2011). Cyanobacteria-specific primers 27F1 and 809R (Jungblut et al., 2005, 2010) were used to amplify 16S rRNA gene fragments using the polymerase chain reactions (PCR) with Phusion® High-Fidelity Polymerase, buffer, and dNTPs (New England BioLabs, Pickering, ON, Canada) on the iCyclerTM Thermal Cycler (Bio-Rad Laboratories, Inc., Hercules, CA, USA). Denaturation was for 30 s at 98°C, followed by 29 cycles of 10 s at 98°C, 30 s at 55°C, 30 s at 72°C, and a final extension time of 5 min at 72°C.
Amplified PCR products were verified by gel electrophoresis then purified with a QIAquick PCR Purification kit (Qiagen, Mississauga, ON, Canada). Amplicons were cloned using a StrataClone PCR Cloning Kit (Stratagene, Agilent Technologies, Santa Clara, CA, USA). Positive clones were transferred to 96-well plates containing Luria Bertani medium with 7% glycerol. The target cloned fragments were amplified using the vector-specific primers M13F and M13R. PCR products were verified by gel electrophoresis and the results visualized using the Bio-Rad Gel Doc imaging system and Quantity One Software (Bio-Rad Laboratories, Hercules, CA, USA). For each library 30–50 clones were sequenced using the vector-specific T7 universal primer (single read) at the Centre Hospitalier de l’Université Laval (CHUL, QC, Canada) using an ABI 3730xl system (Applied Biosystems, Foster City, CA, USA), after purification.
A total of 108 high quality sequences were retained and manually checked using the BioEdit program (Hall, 1999 – version 7.0.5.3). Suspect sequences were checked manually to detect chimeras by separate nBLAST searches of short fragments. The closest matches for each ribotype based on nBLAST searches (Altschul et al., 1990) of the nr/nt GenBank database were selected as reference sequences, additional sequences of cultured species were also added in an attempt to increase the phylogenetic resolution. If the closest match was to an uncultured clone, the closest isolated strain sequence was retrieved and included in our phylogenetic analysis. Following our microscopy identification (see below) of the morphological genus Dichothrix we directly sequenced several filaments from one colony, which were picked under a stereo microscope. Four samples were amplified directly using cyanobacterial specific primers 27F1 and 809R and sequenced in both directions using the same primers. The eight separate sequencing reactions yielded the same sequence (CBS4-C1). The phylogenetic tree was constructed following, initial alignment with multiple alignment using fast Fourier transform (MAFFT, Katoh and Toh, 2008) on the EMBL-EBI portal (http://www.ebi.ac.uk/Tools/msa/mafft/), all sequences were then trimmed to 754 nt and realigned using first MAFFT and then ClustalW2, both provided similar arrangements and Nexus guide trees with the 16S rRNA gene sequence of E. coli DP170 as the outgroup. The final tree was constructed and bootstrapped (1000 replicates) using the Maximum Likelihood in RAxML program (Version 7.3.0; Stamatakis, 2006; Stamatakis et al., 2008). The evolutionary model used was GTR +i+ gamma (Tavaré, 1986). The sequences are deposited in GenBank (accession numbers JQ249752–JQ249830).
Microscopy Analysis
The microbial mat samples were preserved with a 10% (final concentration) glutaraldehyde–paraformaldehyde solution (Lovejoy et al., 1993) and maintained in the dark at 4°C until analysis. Samples were dispersed prior to enumeration and diluted in purified water (milliQ water, Millipore, Billerica, USA) to be sedimented in 15 mL cylindrical counting chambers (Villeneuve et al., 2001); and observed by Fluorescence, Nomarski, Utermöhl (FNU) microscopy (Lovejoy et al., 1993). Samples were examined using an Olympus IX71 inverted microscope (Olympus Canada, Richmond Hill, ON, Canada) at 200× and 400× magnification under UV, green, or blue excitation as well as under bright field (Köhler) illumination.
Another microbial mat sample for taxonomic analysis was kept frozen at −20°C without fixatives. This sample was thawed and dispersed in water prior to examination with an Olympus IX71 inverted microscope at 200× magnification under visible light.
Salinity Tolerance Experiment
Twelve 150 mL beakers were filled with 100 mL of water sampled from WHL on July 7, 2010, and these lake water samples were then adjusted to the following conductivities with a NaCl solution: 0.25 (original lake water, no salt addition) 0.5, 1, 2.5, 5, 10, 30, 100, 150, 200, 250, and 300 mS cm−1. NaCl solution was used as sodium and chloride are the most abundant dissolved ions in seawater, and the marine aerosols that reach this coastal lake. The experiment was repeated the next year (July 7, 2011) with the same range of salinities, plus an additional treatment of 50 mS cm−1. A 1.3-cm2 sample of freshly collected microbial mat was placed in each beaker, and the active fluorescence parameters F0 (minimum fluorescence) and Fm (maximum fluorescence) were then measured over the subsequent 24 h using a PAM 2000 (Walz, Germany). Photochemical quantum yield [Fv/Fm = (Fm − F0)/Fm] was calculated according to Butler (1978) to assess the physiological state of the photosynthetic communities within the microbial mats. The measurements were made placing the fluorescence detector at a distance of 6 mm from black communities of the surface. In the 2010 experiment, the mats were also inverted to measure the response of the bottom community.
Results
Microsensor Profiles
On July 10, 2010, the lake water at the mat sampling site had a measured conductivity of 250 μS cm−1, the pH was 7.45, the water temperature was 5.2°C, and the oxygen concentration was at 107% of saturation. The microbial mat was composed of three distinct layers: the black layer from the surface to 2.2 mm depth in 2010 and to 1.5 mm in 2011; the pink layer to 4 mm depth; and the green layer to the bottom at 5.5 mm in 2010 and 4.8 mm depth in 2011 (Figure 2). Within the mat, the in situ percentage of oxygen saturation decreased from 100% at the surface to 56% within the upper black layer, further decreasing to 19% through the middle pink layer and to 0% at the bottom of the green layer. There was a steep gradient within each layer, as indicated by the high coefficients of variation (Table 1). The pH slightly increased down the mat profile from 7.45 to 7.52 in the upper black layer, to 7.80 through the pink layer, and to 7.93 in the bottom green layer, with peaks in pH at the midpoint of each layer (Figure 2A; Table 1). The oxygen and pH profiles were similar in 2011, but oxygen did not fall completely to zero at the bottom of the profile (Figure 2B).
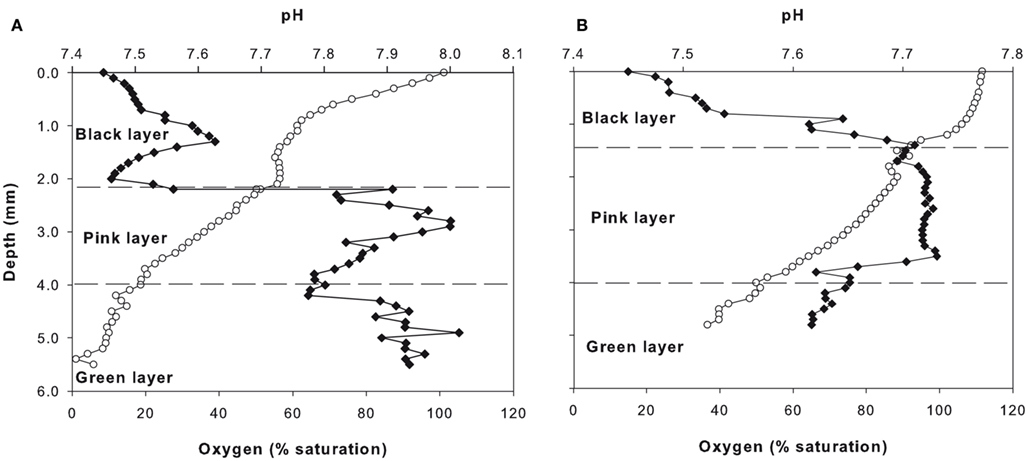
Figure 2. Unisense microsensor oxygen (white circles) and pH (black diamonds) profiles down through the microbial mat in 2010 (A) and 2011 (B).
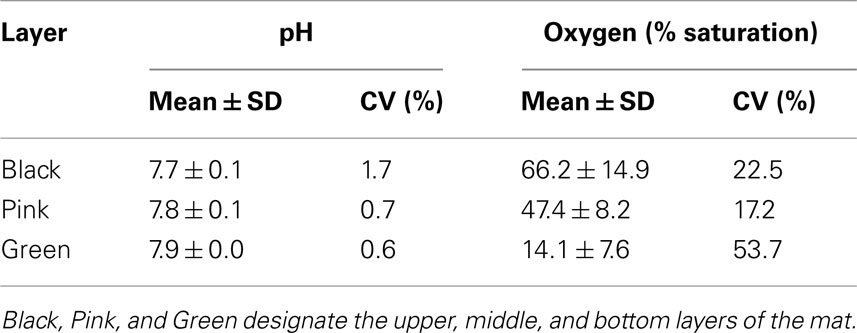
Table 1. pH and oxygen, SD; coefficient of variation (CV) within the three layers of cyanobacterial mats from Ward Hunt Lake, July 7, 2010.
Pigment Analyses
The major pigments as shown by HPLC analysis were scytonemin and its decomposition product reduced-scytonemin, 4-ketomyxol-2′-methylpentoside (keto-mmp), fucoxanthin, myxoxanthin, alloxanthin, zeaxanthin, lutein, canthaxanthin, echinenone, Chlorophyll a (Chl a), and β-carotene (Table 2). Chl a concentrations were similar in the pink and black layers, and increased eightfold in the lower layer, from 55 (pink) to 430 μg Chl a g−1 dry weight (green). The black and pink layers had similar ratios of pigments per unit Chl a, with high ratios of scytonemin, red-scytonemin, keto-mmp, canthaxanthin, echinenone, and β-carotene. Canthaxanthin, echinenone, and β-carotene were still present in the green layer, along with myxoxanthin and zeaxanthin and trace amounts of reduced-scytonemin, scytonemin, and keto-mmp. The eukaryotic pigments fucoxanthin, alloxanthin, and lutein were also recovered from this bottom layer. The concentrations of photoprotective carotenoids (echinenone, zeaxanthin, lutein, and canthaxanthin) and photosynthetic carotenoids (fucoxanthin and alloxanthin) varied among layers. Myxoxanthin and β-carotene have more than one role in the cell and were therefore excluded from this analysis. Photoprotective carotenoids per unit Chl a were twofold higher in the black and pink layers relative to the bottom green layer, while the two photosynthetic carotenoids were only detected in the green layer (Table 2).
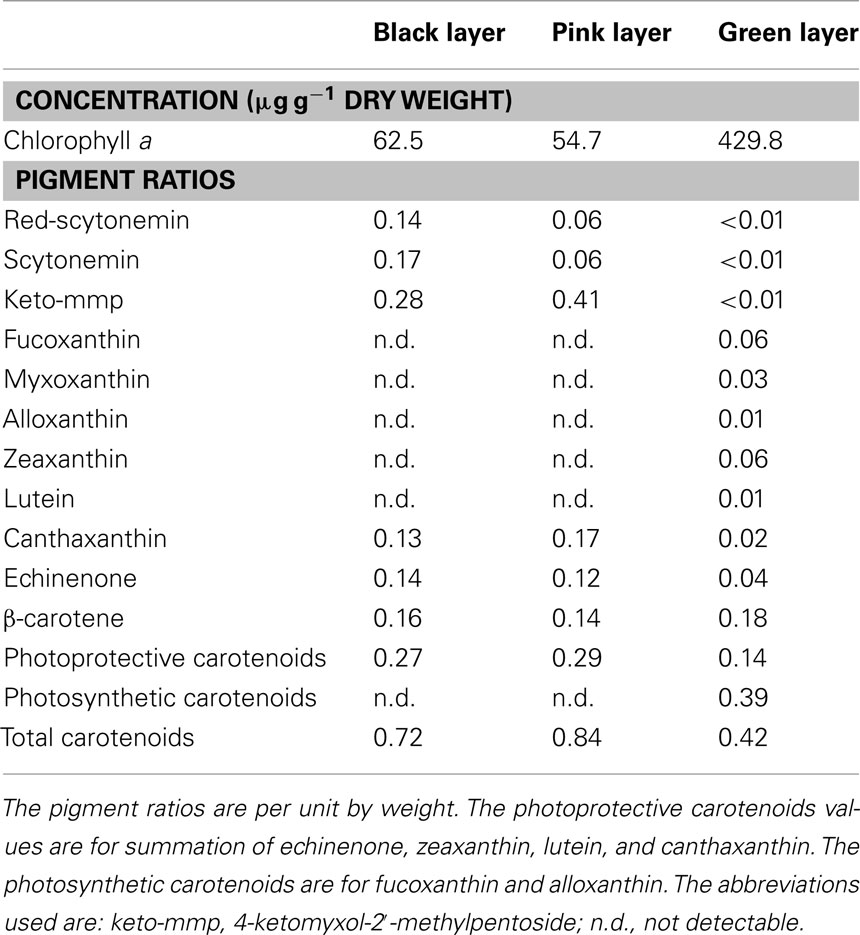
Table 2. Pigment characteristics of the microbial mat layers as defined in Table 1.
Molecular Analysis
A clone library was generated for each layer. We obtained 26, 41, and 41 high quality sequences for the black, pink, and green layer respectively for a final number of 108 sequences The cyanobacteria sequences from the three layers were diverse and while several of the sequences had good matches to cultured species for example Snowella spp. and Synechococcus sp. PC7502, the majority had best matches to other environmental clones, notably those recovered previously form WHL sequences (Figure 3) reported in Jungblut et al. (2010). Three environmental clusters accounted for the majority of the clones and these were named after the original WHL sequences (WHL-82, WHL-87, and WHL-69). Nearest cultured matches to other sequences included Nostoc, Leptolyngbya, Phormidium, Oscillatoria, Chamaesiphon, and Gloeobacter (Figure 3). Oscillatorian sequences were found in all three layers, but in different proportions. The black layer sequences were mostly Nostoc, which accounted for 65% of the sequences. Synechococcus and Leptolyngbya were the second and third most frequent followed by Pseudanabaena and Gloeobacter. The pink layer was similar to the black layer with Nostoc accounting for 50% of sequences, but the second most common sequences were closest to Pseudanabaena with 22%, followed by Gloeobacter, Synechococcus, Phormidium, and Leptolyngbya and Chamaesiphon. The green layer was quite different with lower representation by Nostoc (29% of sequences). Snowella sequences accounted for 22% and Synechococcus for 27% of the sequences, and taxa with sequences closest to Pseudanabaena, Leptolyngbya, Phormidium, Oscillatoria, and Gloeobacter were also present in this layer (Figure 4). The sequence of Dichothrix morphospecies aligned most closely to Leptolyngbya in the Oscillatoriales.
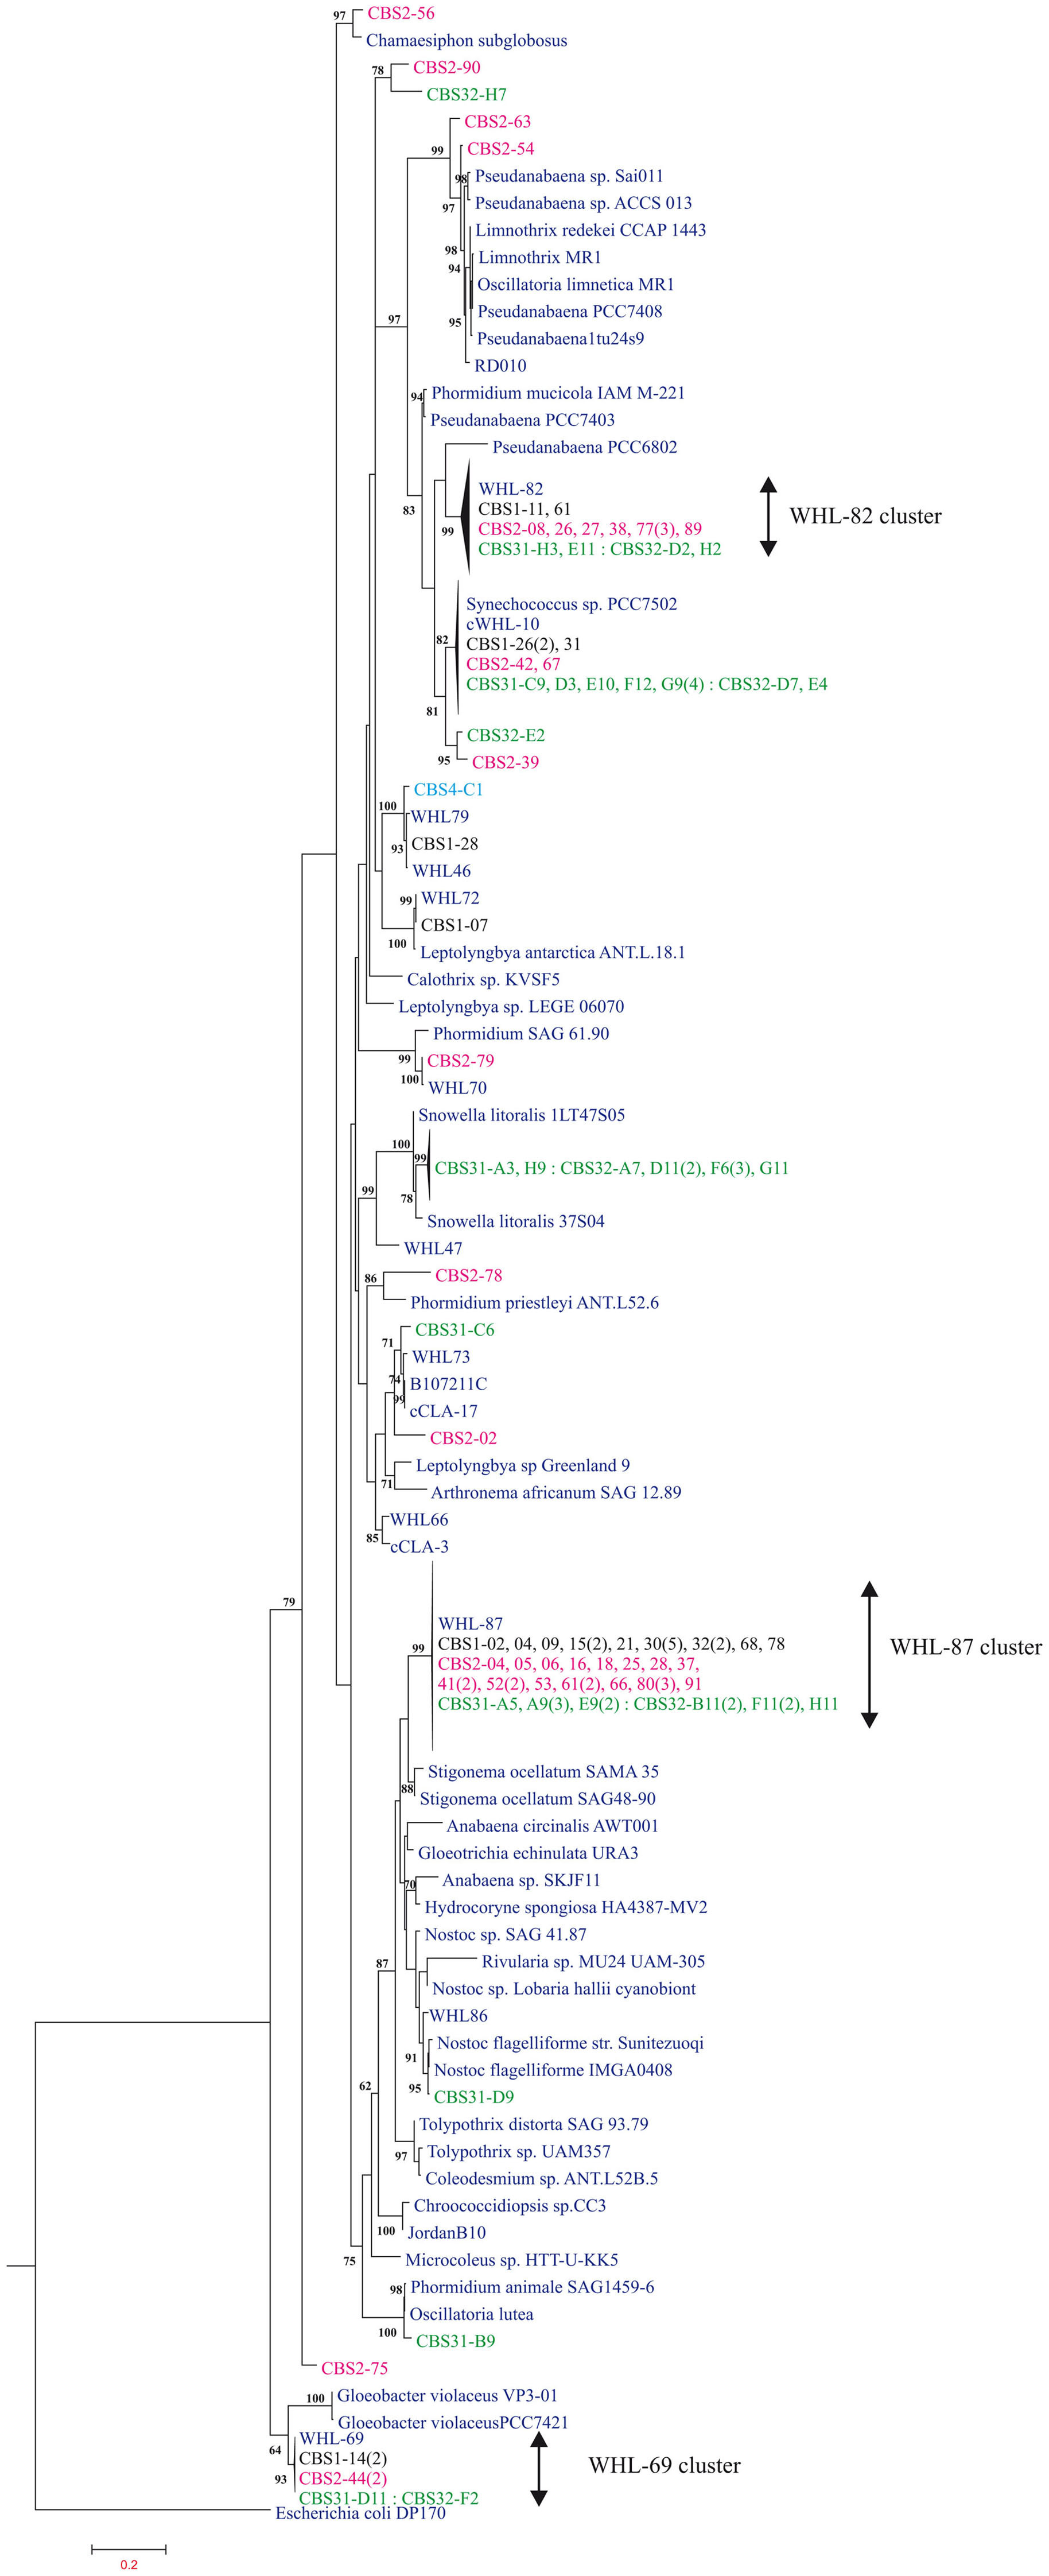
Figure 3. Phylogenetic tree from clone library and reference sequences. Sequences from the black (CBS1), pink (CBS2), and green (CBS31 and CBS32) layers are in black, pink, and green respectively. The different sequence designations from the libraries follow the dash, and the numbers of identical sequences are given in parenthesis. The Dichothrix filaments CBS4-C1 direct PCR sequence is light blue. Reference sequences are dark blue. WHL sequences are from Jungblut et al. (2010) and cCLA sequences from Harding et al. (2011). Bootstraps values ≥60% based on maximum likelihood are indicated at the nodes.
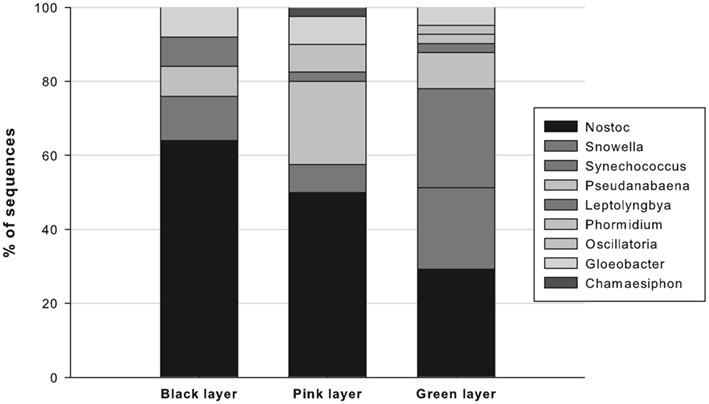
Figure 4. The percentage of each taxonomic group in the black, pink, and green layers of the Ward Hunt Lake microbial mat. The nearest matches are given to the following reference taxa: Gloeobacter, accession number FR798924.1, 93% similarity; Leptolyngbya, AY493607.1, 88–99%; Synechococcus, AF448080.1, 95–99%; Pseudanabaena, AB039019.1, 86–94%; Snowella, AJ781041.1, 97%; Nostoc, EU178143.1, 90–95%.
Microscopic Analysis
Diverse morphospecies were observed within the microbial mat. In the black and pink layers, heterocystous Dichothrix sp. was well represented, with its usual associated fine filaments. Nostoc sp., mostly in small colonies, were also noted. The pink layer contained various Oscillatoriales of diverse filament diameters, within the morpho-genera Lyngbya, Oscillatoria, Phormidium, Pseudanabaena, and Leptolyngbya. In the lower green layer, the order Synechococcales was represented, specifically, the colonial genera Snowella and Aphanocapsa. Other than cyanobacteria, pennate diatoms occurred throughout the microbial mat and included the genera Achnanthes, Caloneis, Cymbella, Denticula, Eunotia, Navicula, and Nitzschia. Nematodes were observed in the green layer.
Salinity Responses
The initial Fv/Fm of the microbial mat in 2010 ranged from 0.35 to 0.39. For the upper black layer, the Fv/Fm values immediately after the salt amendments defined as T0 remained above 0.25 up to 150 mS cm−1, and fell to less than 0.1 at conductivities of 200 mS cm−1 and above. After 8 and 24 h of incubation, high Fv/Fm values (>0.2) were maintained up to 30 mS cm−1 (Figure 5A). A similar set of responses was recorded for the green layer, with high Fv/Fm values (>0.2) up to 100 mS cm−1 at T0 and to 30 mS cm−1 at 8 and 24 h (Figure 5B). This experiment was repeated in 2011 for the upper black layer, and the results were similar to those in 2010. Fv/Fm values above 0.2 were recorded at conductivities up to 50 mS cm−1 over 4 h. After 2 days of incubation, Fv/Fm values >0.29 were maintained up to 30 mS cm−1 and there was a decline to <0.1 at 50 mS cm−1 (Figure 5C).
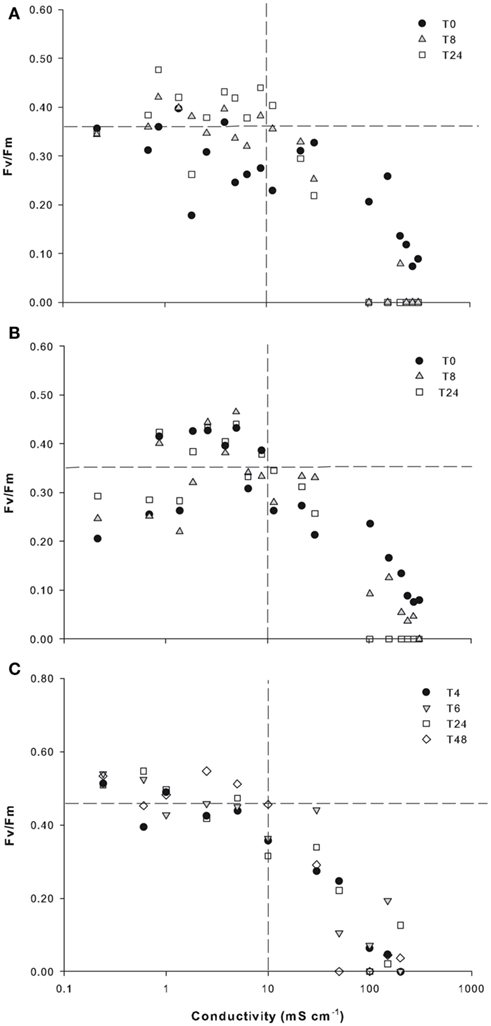
Figure 5. Photophysiological responses by Ward Hunt Lake mats to osmotic stress. The mats were incubated at a range of increasing salinities, and the quantum yield ratio (Fv/Fm) was measured immediately (T0), and after 8 and 24 h in 2010 and immediately (T0) and after 4, 6, 24, and 48 h in 2011. The 2010 data are for the surface black layer (A) and the bottom green layer (B), and the 2011 data are for the surface black layer only (C). The horizontal dashed lines are for the mean Fv/Fm values calculated for all time intervals at salinity up to 10 mS cm−1 (vertical dashed lines).
To test the capacity of the photosynthetic communities to recover from the salinity increase, all mat sections at the end of the first experiment were placed back into lake water with its natural conductivity of 0.25 mS cm−1. The mats that had been previously exposed to conductivities of less than 50 mS cm−1 showed ongoing Fv/Fm ratios above 0.2 and values above 0.3 were recorded for prior exposures of up to 10 mS cm−1. There was some evidence of partial recovery in the two most extreme salinities (150 and 200 mS cm−1), where Fv/Fm values rose from zero to around 0.2 after 4 h (Figure 6).
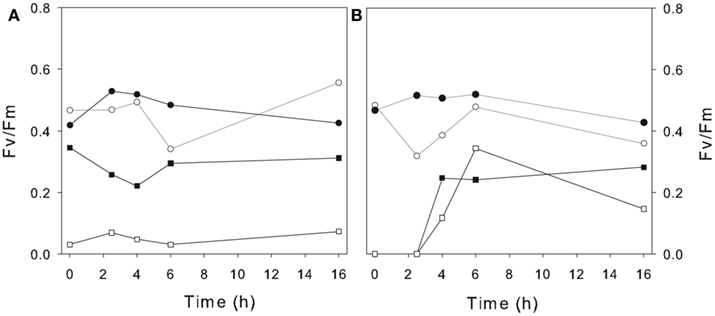
Figure 6. Photophysiological activity of Ward Hunt Lake mats during their recovery from osmotic stress. The mats that were incubated under increased salinities for 48 h (as in Figure 5) were transferred back to the original Ward Hunt Lake water (conductivity of 0.25 mS cm−1), and their photosynthetic quantum yields (Fv/Fm) were then monitored during the subsequent 16 h. (A) Pre-incubation conditions of 0.25 (control; solid circles), 5 (open circles), 30 (closed squares), and 100 mS cm−1 (open squares). (B) Pre-incubation conditions of 2.5 (control; solid circles), 10 (open circles), 150 (closed squares), and 200 mS cm−1 (open squares).
Discussion
Community Composition
Cyanobacteria dominated the microbial mats from WHL, as in many lakes of the polar regions (e.g., Vincent, 2000; Zakhia et al., 2008). Previous studies on this lake have reported taxa from the Nostocales, Oscillatoriales, and Synechococcales (Villeneuve et al., 2001; Bonilla et al., 2005; Jungblut et al., 2010), consistent with our analyses. Nostoc was found throughout the mat, producing black globular colonies at the surface. The sequence from filaments of the “Dichothrix” sample was found to be within the Oscillatoriales, rather than the Nostocales as expected. Reliably classified Dichothrix species are not as yet represented in GenBank and further investigation is required to determine if this Dichothrix, which had heterocysts and therefore is morphologically a heterocystous Nostocales, has affinities to the non-heterocystis Oscillatoriales. Alternatively, the thin trichomes that appear on the tips of Dichothrix colonies may be a separate oscillatorian taxon, which we amplified from our single trichome. Deeper within the mat matrix there were no macroscopic colonies, suggesting a shift toward the uniseriate, filamentous form of Nostoc that is often found in association with Oscillatoria (Potts, 2000). The ability of Nostoc to fix nitrogen, resist desiccation (Mataloni et al., 2000), and form UV-screening pigments (see below) would make it well suited to life at the mat surface in the shallow littoral waters of the lake. While not observed in the present study, Nostoc also produces motile hormogones (Broady, 1979), enabling vertical migration to optimize UV-protection deeper within the mat, light-harvesting toward the mat surface, and access to nutrient resources in the mat interior.
In the green layer of the mat, there was an increased presence of taxa that had their closest 16S rRNA gene sequence matches to Snowella and Synechococcus. These mostly planktonic taxa have previously been reported as metaphyton (Komárek and Komárková-Legnerova, 1992). Synechococcus mats are known from hot spring environments (Stal, 2000), but have been less reported from the polar regions.
Gloeobacter-like sequences (WHL-69 cluster, Figure 3) were found throughout the mat, and have been reported previously from WHL and a pond mat from Ellesmere Island (Jungblut et al., 2010). The sequences in the present study also closely match a set of Gloeobacterales sequences from an epilithic biofilm of a Spanish high mountain lake (GenBank accession number FR667281 and associated sequences). The Gloeobacterales lineage is divergent from other cyanobacteria in a variety of striking ways, including the absence of thylakoids and unique genes for carotenoid biosynthesis (Tsuchiya et al., 2005). However the GenBank reference Gloeobacter in culture (strain PCC 7421) is only 93% similar to our sequences, the Jungblut et al. (2010) sequences, and those from the Spanish alpine lakes, implying that this phylogenetically unusual component of the cold biosphere may prove to be a new genus.
Oscillatorian cyanobacteria were found through the mat profile and are well known from Arctic and Antarctic mats. These organisms in culture have an ability to acclimate via pigment shifts to large variations in ambient irradiance including UV radiation (Quesada and Vincent, 1997). Most are cold-tolerant rather than psychrophiles (Tang et al., 1997). The oscillatorians recorded here had close matches to those previously reported in this region of the High Arctic (Jungblut et al., 2010; Harding et al., 2011) and included those that remain distance from cultured groups (WHL-82 clade and WHL-87 clade). Overall our phylogenies highlighted the poor concordance between morphospecies and 16S rRNA gene sequences as previously noted by Jungblut et al. (2010) and others. The limited morphological repertoire of cyanobacteria likely contributes to this poor phylogeny and suggests that this group requires major careful taxonomic revision. The 16S rRNA gene may also lack resolution at higher taxonomic ranks and additional genes need to be included in such revisions. However, despite these shortcomings, at the level of 99–100% similarity many of the sequences were previously recovered from the same lake and all of their nearest environmental matches were to other cold regions as earlier reported by Jungblut et al. (2010).
Pigment Composition
The HPLC analyses showed clear differences in pigment concentration and composition through the mat profile, and this vertical structure may reflect both species differences as well as physiological differences among the layers (Quesada et al., 1999). Reduced-scytonemin and scytonemin were major pigments of the black layer of the microbial mat, and are well known in the Nostocales. The decrease in scytonemin and reduced-scytonemin with an increase in keto-mmp was consistent with Pseudanabaena and other oscillatorians in the pink layer. The photoprotective carotenoids were in highest concentration, both in absolute terms and per unit Chl a in the upper two layers where irradiance and oxygen levels were highest, consistent with their role as quenching agents of reactive oxygen species.
The pigment signature of the green layer was in accordance with the appearance of myxoxanthin and zeaxanthin, which are typical for Synechococcales, and the presence of three pigments that are characteristic of eukaryotic taxa: fucoxanthin (found in diatoms and other chrysophytes), alloxanthin (found in cryptophytes), and lutein (characteristic of green algae). Our observations as well as previous taxonomic analyses of these mats have observed pennate diatoms, notably Cymbella spp. and Achnanthes spp., as well as chlorophytes, notably Mougeotia sp. and Zygnema sp. (Villeneuve et al., 2001). Canthaxanthin, echinenone, and β-carotene are found in all cyanobacteria, and were detected in all three layers, as expected.
Scytonemin and its reduced derivative (Garcia-Pichel and Castenholz, 1991) contributed the dominant fraction of the total pigment content of the mat, collectively accounting for 2% of the dry weight of the surface community, 0.6% of the pink layer, and 0.2% of the bottom layer. In cultured organisms, scytonemin has been recorded up to 5% of dry weight, and can similarly accumulate to high levels in natural assemblages (Karsten et al., 1998). This pigment has a broad absorbance maximum that peaks in the UV-A waveband but that also extends into the UV-B and PAR wavebands (Proteau et al., 1993). It can absorb up to 90% of incident radiation (Castenholz and Garcia-Pichel, 2000), and thereby acts as an effective sunscreen for the entire community. The Ward Hunt communities therefore seem well protected from any future increases in UV exposure as a result of stratospheric ozone depletion or increased duration of ice-free conditions.
Oxygen and PH Profiles
The oxygen content of the mats dropped from 100% saturation, to 0% at the bottom of the green layer in 2010, and to below 40% in 2011. This implies that the mat consortia have a strong respiratory demand for oxygen as a result of the bottom layer phototrophs growing under shaded conditions, as well as the high concentration of bacterial heterotrophs typically found in polar microbial mats (e.g., Varin et al., 2010). It may also reflect the strong oxygen sink conditions immediately beneath the mats, where heterotrophic bacteria would dominate. The low photosynthesis/respiration (P/R) balance is likely to extend upward through the mat later in the season when the lake becomes covered by ice and snow and the day length shortens, eventually to continuous winter darkness. In shallow Antarctic ponds, the bottom waters become anoxic during winter-freeze-up, and the mats experience continuous reducing conditions through much of the year (Schmidt et al., 1991). Similar conditions are likely to prevail in WHL during late Arctic autumn and winter.
The pH profiles of the Ward Hunt mats showed an increase with depth, contrary to the decreasing P/R ratios down the profile as inferred from the oxygen data. However the shifts were relatively small, in accordance with the high dissolved inorganic carbon concentrations, and thus buffering capacity, that have been observed in the interstitial waters of these mats. Up to 141 mg C L−1 were measured in the mats, while the concentrations in the overlying water were around 16 mg C L−1 (Villeneuve et al., 2001). The pH peaks in each layer might reflect a depth optimum for oxygenic photosynthesis in each community, with the equivalent peak in oxygen obliterated by its rapid diffusive flux downward as a result of the strong vertical gradient in concentration. Although rare, 16S rRNA gene sequences of green sulfur bacteria have been recorded from these microbial mats (Lionard and Lovejoy, unpublished data). However, no marker pigments (bacteriochlorophylls) for photosynthetic sulfur bacteria were detected in the HPLC analyses, implying that any anoxygenic photosynthesis was likely minimal. The pH values throughout the mat were within the neutral to alkaline range in which cyanobacteria are commonly found (Castenholz, 2009).
Salinity Tolerance
The Ward Hunt mats tolerated increased salinity up to a conductivity of 10 mS cm−1, 46 times ambient salinities of the lake water, with little change in photophysiological state as measured by the active fluorescence parameter Fv/Fm. For the mats previously exposed to high salinities and then placed in freshwater, this quantum yield ratio returned within hours to the range 0.35–0.39, indicative of excellent physiological conditions for Nostoc (Bowker et al., 2002). The mucilaginous, exopolysaccharide sheath enveloping Nostoc colonies, is known to provide a buffer from external variations in salinity (Webb et al., 2003; Hall-Stoodley et al., 2004). However, salinity tolerance varies widely among cyanobacteria, which range from species of relatively narrow tolerance (Stal and Krumbein, 1985) to euryhaline species (Nübel et al., 1999). The broad tolerances measured here for both the surface and bottom communities imply that cyanobacteria species in the mats continue to be metabolically active despite large and rapid fluctuations in salinity, effectively increasing the range of environmental conditions where active photosynthesis can occur, with implications for the energy budget within the microbial mats. These results are consistent with measurements of photosynthesis by microbial mats from Arctic (Mueller et al., 2005) and Antarctic ice shelves (Hawes et al., 1992); and Antarctic lakes (Sabbe et al., 2004), which have shown acclimation to greatly increased salinities.
Conclusion
The cyanobacterial mats of WHL were suited to resist the major fluctuations in environmental conditions that occur at present in the High Arctic. The layered community structure, with UV-screening pigments and photoprotective carotenoids at the surface, allows a more diverse community including eukaryotes to grow in the bottom green communities of the mats. These bottom communities must contend with low oxygen tensions in summer, and the entire mat community is likely to experience anoxia during winter-freeze-up. The salinity responses measured here indicate broad tolerances and no loss of photosynthetic function under high and fluctuating osmolarities. Previous work on polar microbial mats has shown their tolerance of desiccation (Hawes et al., 1992), and that cyanobacterial isolates from Arctic and Antarctic mats grow faster at temperatures that are well above the present day ambient conditions (Tang et al., 1997). In combination, these results imply that cyanobacterial communities will continue to dominate polar aquatic ecosystems despite ongoing variations in water balance, increased UV radiation, and prolongation of ice-free conditions. However, these slow-growing mat communities currently experience little grazing pressure, and their persistence may be less assured if the northward expansion of invasive species accompanying climate change (Vincent et al., 2011 and references therein) includes arthropod grazers that feed on these large stocks of benthic microbial biomass.
Conflict of Interest Statement
The authors declare that the research was conducted in the absence of any commercial or financial relationships that could be construed as a potential conflict of interest.
Acknowledgments
We acknowledge financial support from the Canada Research Chair in Aquatic Ecosystem Studies, the Network of Centers of Excellence program ArcticNet, and Natural Sciences and Engineering Council of Canada. Logistical support was supplied by the Polar Continental Shelf Project (PCSP publication number) and we are also grateful to Parks Canada for access to their facilities in Quttinirpaaq “top of the world” National Park. We also thank Denis Sarrazin and Sébastien Bourget for field assistance, Marie-Josée Martineau for laboratory assistance, and Anne-Dorothée Jungblut for advice on the molecular analyses. We also thank the two referees for their insightful review comments and suggestions on the submitted manuscript.
References
Altschul, S. F., Warren, G., Webb, M., Myers, E. W., and Lipman, D. J. (1990). Basic local alignment search tool. J. Mol. Biol. 215, 403–410.
Balskus, E. P., Case, R. J., and Walsh, C. T. (2011). The biosynthesis of cyanobacterial sunscreen scytonemin in intertidal microbial mat communities. FEMS Microbiol. Ecol. 77, 322–332.
Belzile, C., Vincent, W. F., Gibson, J. A. E., and Van Hove, P. (2001). Bio-optical characteristics of the snow, ice and water column of a perennially ice-covered lake in the high Arctic. Can. J. Fish. Aquat. Sci. 58, 2405–2418.
Bolhuis, H., and Stal, L. J. (2011). Analysis of bacterial and archaeal diversity in coastal microbial mats using massive parallel 16S rRNA gene tag sequencing. ISME J. 5, 1701–1712.
Bonilla, S., Villeneuve, V., and Vincent, W. F. (2005). Benthic and planktonic algal communities in a high Arctic lake: pigment structure and contrasting responses to nutrient enrichment. J. Phycol. 41, 1120–1130.
Bottos, E. M., Vincent, W. F., Greer, C. W., and Whyte, L. G. (2008). Prokaryotic diversity of arctic ice shelf microbial mats. Environ. Microbiol. 10, 950–966.
Bowker, M. A., Reed, S. C., Belnap, J., and Phillips, S. L. (2002). Temporal variation in community composition, pigmentation, and Fv/Fm of desert cyanobacterial soil crusts. Microb. Ecol. 43, 13–25.
Broady, P. A. (1979). The Signy Island terrestrial reference sites: IX. The ecology of the algae of Site 2, a moss carpet. Antarct. Sci. 47, 13–29.
Butler, W. L. (1978). Energy distribution in the photochemical apparatus of photosynthesis. Annu. Rev. Plant Physiol. 29, 345–378.
Castenholz, R. W., and Garcia-Pichel, F. (2000). “Cyanobacteria responses to UV-radiation,” in The Ecology of Cyanobacteria: Their Diversity in Time and Space, eds B. A. Whitton, and M. Potts (Dordrecht: Kluwer Acad. Publ.), 591–611.
Garcia-Pichel, F., and Castenholz, R. W. (1991). Characterization and biological implications of scytonemin, a cyanobacterial sheath pigment. J. Phycol. 27, 395–409.
Hall, T. A. (1999). BioEdit: a user-friendly biological sequences alignment editor and analysis program for Windows 95/98/NT. Nucleic Acids Symp. Ser. 41, 95–98.
Hall-Stoodley, L., Costerton, J. W., and Stoodley, P. (2004). Bacterial biofilms: from the natural environment to infectious diseases. Nat. Rev. Microbiol. 2, 95–108.
Harding, T., Jungblut, A.-D., Lovejoy, C., and Vincent, W. F. (2011). Microbes in high Arctic snow and implications for the cold biosphere. Appl. Environ. Microbiol. 77, 3234.
Hawes, I., Howard-Williams, C., and Vincent, W. F. (1992). Desiccation and recovery of Antarctic cyanobacterial mats. Polar Biol. 12, 587–594.
Hawes, I., and Schwarz, A.-M. (2001). Absorption and utilization of low irradiance by cyanobacterial mats in two ice-covered Antarctic lakes. J. Phycol. 37, 5–15.
IPCC. (2007). “IPCC Summary for policymakers,” in Climate Change 2007: The Physical Science Basis. Contribution of Working Group I to the Fourth Assessment Report of the Intergovernmental Panel on Climate Change, eds S. Solomon, D. Qin, M. Manning, Z. Chen, M. Marquis, K. B. Averyt, M. Tignor, and H. L. Miller (Cambridge: Cambridge University Press), 1–18.
Jungblut, A.-D., Hawes, I., Mountfort, D., Hitzfeld, B., Dietrich, D. R., Burns, B. P., and Neilan, B. A. (2005). Diversity within cyanobacterial mat communities in variable salinity meltwater ponds of McMurdo Ice Shelf, Antarctica. Environ. Microbiol. 7, 519–529.
Jungblut, A.-D., Lovejoy, C., and Vincent, W. F. (2010). Global distribution of cyanobacterial ecotypes in the cold biosphere. ISME J. 4, 191–202.
Karsten, U., Maier, J., and Garcia-Pichel, F. (1998). Seasonality in UV-absorbing compounds of cyanobacterial mat communities from an intertidal mangrove flat. Aquat. Microb. Ecol. 16, 37–44.
Katoh, K., and Toh, H. (2008). Recent developments in the MAFFT multiple sequence alignment program. Brief. Bioinformatics 9, 286–298.
Komárek, J., and Komárková-Legnerova, J. (1992). Variability of some planktonic gomphosphaerioid cyanoprokaryotes in northern lakes. Nord. J. Bot. 12, 513–524.
Lovejoy, C., Vincent, W. F., Frenette, J.-J., and Dodson, J. J. (1993). Microbial gradients in a turbid estuary: application of a new method for protozoan community analysis. Limnol. Oceanogr. 38, 1295–1303.
Mackay, M. A., Norton, R. S., and Borowitzka, L. J. (1984). Organic osmoregulatory solutes in cyanobacteria. Microbiology 130, 2177–2191.
Manney, G. L., Santee1, M. L., Rex, M., Livesey, N. J., Pitts, M. C., Veefkind, P., Nash, E. R., Wohltmann, I., Lehmann, R., Froidevaux, L., Poole, L. R., Schoeberl, M. R., Haffner, D. P., Davies, J., Dorokhov, V., Gernandt, H., Johnson, B., Kivi, R., Kyro, E., Larsen, N., Levelt, P. F., Makshtas, A., McElroy, C. T., Nakajima, H., Concepción Parrondo, M., Tarasick, D. W., von der Gathen, P., Walker, K. A., and Zinoviev, N. S. (2011). Unprecedented Arctic ozone loss in 2011. Nature 478, 469–477.
Mataloni, G., Tell, G., and Wynn-Williams, D. D. (2000). Structure and diversity of soil algal communities from Cierva Point (Antarctic Peninsula). Polar Biol. 23, 205–211.
Mueller, D. R., Vincent, W. F., Bonilla, S., and Laurion, I. (2005). Extremotrophs, extremophiles and broadband pigmentation strategies in a high arctic ice shelf ecosystem. FEMS Microbiol. Ecol. 53, 73–87.
Nübel, U., Garcia-Pichel, F., Kühl, M., and Muyzer, G. (1999). Quantifying microbial diversity: morphotypes, 16S rRNA genes, and carotenoids of oxygenic phototrophs in microbial mats. Appl. Environ. Microbiol. 65, 422–430.
Potts, M. (2000). ‘Nostoc,’ in The Ecology of Cyanobacteria, eds B. A. Whitton, and M. Potts (Netherlands: Kluwer Academic Publishers), 465–504.
Proteau, P. J., Gerwick, W. H., Garcia-Pichel, F., and Castenholz, R. (1993). The structure of scytonemin, an ultraviolet sunscreen pigment from the sheaths of cyanobacteria. Experientia 49, 825–829.
Quesada, A., and Vincent, W. F. (1997). Strategies of adaptation by Antarctic cyanobacteria to ultraviolet radiation. Eur. J. Phycol. 32, 335–342.
Quesada, A., Vincent, W. F., and Lean, D. R. S. (1999). Community and pigment structure of Arctic cyanobacterial assemblages: the occurrence and distribution of UV-absorbing compounds. FEMS Microbiol. Ecol. 28, 315–323.
Sabbe, K., Hodgson, D. A., Verleyen, E., Taton, A., Wilmotte, A., Vanhoutte, K., and Vyverman, W. (2004). Salinity, depth and the structure and composition of microbial mats in continental Antarctic lakes. Freshw. Biol. 49, 296–319.
Schmidt, S., Moskal, W., De Mora, S. J., Howard-Williams, C., and Vincent, W. F. (1991). Limnological properties of Antarctic ponds during winter freezing. Antarct. Sci. 3, 379–388.
Serreze, M. C., and Francis, J. A. (2006). The Arctic amplification debate. Climate Change 76, 241–264.
Smol, J. P., and Douglas, M. S. V. (2007). Crossing the final ecological threshold in high Arctic ponds. Proc. Natl. Acad. Sci. U.S.A. 104, 12395–12397.
Stal, L. J. (2000). “Cyanobacterial mats and stromatolites,” in The Ecology of Cyanobacteria: Their Diversity in Time and Space, eds B. A. Whitton, and M. Potts (Dordrecht: Kluwer), 61–120.
Stal, L. J., and Krumbein, W. E. (1985). Isolation and characterization of cyanobacteria from a marine microbial mat. Botanica Marina 28, 351–366.
Stamatakis, A. (2006). RAxML – VI-HPLC: maximum likelihood- based phylogenetic analyses with thousands of taxa and mixed models. Bioinformatics 22, 2688–2690.
Stamatakis, A., Hoover, P., and Rougemont, J. (2008). A rapid bootstrap algorithm for the RAxML web servers. Syst. Biol. 57, 758–771.
Tang, E. P. Y., Tremblay, R., and Vincent, W. F. (1997). Cyanobacterial dominance of polar freshwater ecosystems: are high latitude mat-formers adapted to the low temperature environment? J. Phycol. 33, 171–181.
Tavaré, S. (1986). Some probabilistic and statistical problems in the analysis of DNA sequences. Lect. Math. Life Sci. 17, 57–86.
Tsuchiya, T., Takaichi, S., Misawa, N., Maoka, T., Miyashita, H., and Mimuro, M. (2005). The cyanobacterium Gloeobacter violaceus PCC 7421 uses bacterial-type phytoene desaturase in carotenoid biosynthesis. FEBS Lett. 579, 2125–2129.
Varin, T., Lovejoy, C., Jungblut, A.-D., Vincent, W. F., and Corbeil, J. (2010). Metagenomic profiling of Arctic microbial mat communities as nutrient scavenging and recycling systems. Limnol. Oceanogr. 55, 1901–1911.
Villeneuve, V., Vincent, W. F., and Komarek, J. (2001). Community structure and microhabitat characteristics of cyanobacterial mats in an extreme High Arctic environment: Ward Hunt Lake. Nova Hedwigia 123, 199–224.
Vincent, W. F. (2000). “Cyanobacterial dominance in the Polar regions,” in The Ecology of Cyanobacteria, eds B. A. Whitton, and M. Potts (Netherlands: Kluwer Academic Publishers), 321–340.
Vincent, W. F., Callaghan, T. V., Dahl-Jensen, D., Johansson, M., Kovacs, K. M., Michel, C., Prowse, T., Reist, J. D., and Sharp, M. (2011). Ecological implications of changes in the Arctic cryosphere. Ambio 40, 87–99.
Webb, J. S., Givskov, M., and Kjelleberg, S. (2003). Bacterial biofilms: prokaryotic adventures in multicellularity. Curr. Opin. Microbiol. 6, 578–585.
Zakhia, F., Jungblut, A.-D., Taton, A., Vincent, W. F., and Wilmotte, A. (2008). “Cyanobacteria in cold ecosystems,” in Psychrophiles: From Biodiversity to Biotechnology, eds R. Margesin, F. Schinner, J.-C. Marx, and C. Gerday (Berlin: Springer–Verlag), 121–135.
Keywords: microbial mats, cyanobacteria, polar lake, pigments, molecular phylogeny
Citation: Lionard M, Péquin B, Lovejoy C and Vincent WF (2012) Benthic cyanobacterial mats in the high Arctic: multi-layer structure and fluorescence responses to osmotic stress. Front. Microbio. 3:140. doi: 10.3389/fmicb.2012.00140
Received: 29 January 2012; Paper pending published: 17 February 2012;
Accepted: 24 March 2012; Published online: 26 April 2012.
Edited by:
George S. Bullerjahn, Bowling Green State University, USAReviewed by:
Michael R. Twiss, Clarkson University, USARachael Marie Morgan-Kiss, Miami University, USA
Copyright: © 2012 Lionard, Péquin, Lovejoy and Vincent. This is an open-access article distributed under the terms of the Creative Commons Attribution Non Commercial License, which permits non-commercial use, distribution, and reproduction in other forums, provided the original authors and source are credited.
*Correspondence: Marie Lionard, Département de Biologie, Université Laval, Québec, QC, Canada G1V 0A6. e-mail:bWFyaWUubGlvbmFyZEBiaW8udWxhdmFsLmNh