 Ji Zhang1,2
 James J. Elser2,3*
- 1Institute of Medicinal Plants, Yunnan Academy of Agricultural Sciences, Kunming, China
- 2School of Life Sciences, Arizona State University, Tempe, AZ, United States
- 3Flathead Lake Biological Station, University of Montana, Polson, MT, United States
Surveys of carbon:nitrogen:phosphorus ratios are available now for major groups of biota and for various aquatic and terrestrial biomes. However, while fungi play an important role in nutrient cycling in ecosystems, relatively little is known about their C:N:P stoichiometry and how it varies across taxonomic groups, functional guilds, and environmental conditions. Here we present the first systematic compilation of C:N:P data for fungi including four phyla (Ascomycota, Basidiomycota, Glomeromycota, and Zygomycota). The C, N, and P contents (percent of dry mass) of fungal biomass varied from 38 to 57%, 0.23 to 15%, and 0.040 to 5.5%, respectively. Median C:N:P stoichiometry for fungi was 250:16:1 (molar), remarkably similar to the canonical Redfield values. However, we found extremely broad variation in fungal C:N:P ratios around the central tendencies in C:N:P ratios. Lower C:P and N:P ratios were found in Ascomycota fungi than in Basidiomycota fungi while significantly lower C:N ratios (p < 0.05) and higher N:P ratios (p < 0.01) were found in ectomycorrhizal fungi than in saprotrophs. Furthermore, several fungal stoichiometric ratios were strongly correlated with geographic and abiotic environmental factors, especially latitude, precipitation, and temperature. The results have implications for understanding the roles that fungi play in function in symbioses and in soil nutrient cycling. Further work is needed on the effects of actual in situ growth conditions of fungal growth on stoichiometry in the mycelium.
Introduction
Ecological stoichiometry is the study of the balance of multiple chemical elements in ecological interactions and processes (Sterner and Elser, 2002). By using the perspective of ecological stoichiometry, we can better understand the coupling of energy and material flows at key interfaces in Earth’s diverse habitats (Elser et al., 2000a). For example, the features of the stoichiometry of algae–zooplankton interactions have been shown to affect trophic transfer efficiencies and consumer-driven nutrient recycling at the ecosystem scale (Frost et al., 2002; Andersen et al., 2004). Moreover, the extension of ecological stoichiometry to biological phenomena, referred to as biological stoichiometry (Elser et al., 2000c), provides a mechanistic theory linking cellular and biochemical features of co-evolving biota with constraints imposed by, and impacts on, ecosystem energy and nutrient flows (Elser et al., 2003).
To date, studies involving ecological stoichiometry and biological stoichiometry have mostly been done in aquatic systems (McGroddy et al., 2004), but recent work has extended it to new research areas beyond the aquatic realm (Hessen et al., 2013) such as study of terrestrial vegetation (Kerkhoff et al., 2006), insects (Woods et al., 2004), and soils (Cleveland and Liptzin, 2007). As nutrient cycling in natural ecosystems is largely driven by microorganisms (Spohn, 2016), the carbon:nitrogen:phosphorus ratios of soil microbial biomass and ecoenzymatic activity ratios related to resource acquisition have begun to be surveyed (Cleveland and Liptzin, 2007; Sinsabaugh et al., 2009), with a primary emphasis on bacteria. Differences in fungal and bacterial physiology may have important influences on large scale C and N cycling (Waring et al., 2013). However, relatively little is known about fungal stoichiometry despite the important role they play in biogeochemical cycling in ecosystems (Gadd, 2004, 2007). It is still not clear that how these processes might be influenced by the C:N:P stoichiometric requirements of the fungi themselves. In one of the first studies of fungal C:N:P stoichiometry, Danger et al. (2016) assessed the ecological stoichiometry of aquatic fungi and several species of terrestrial fungi, finding that the variation of C:N:P ratios of fungal biomass exceeded variations found for bacteria. However, fungal biodiversity is considerably higher in terrestrial than in aquatic ecosystems (Bärlocher and Boddy, 2016) but our knowledge of their stoichiometry remain lacking.
The role of fungi in symbiosis, e.g., ectomycorrhizae, is of particular interest. Most plant species form symbioses with soil fungi, and up to 80% of plant N and P is provided by mycorrhizal fungi (Behie and Bidochka, 2014; van der Heijden et al., 2015). Mycorrhizal fungi can use organic nitrogen and phosphorus forms, which would otherwise remain largely unavailable to plant roots (Landeweert et al., 2001). Intriguingly, the reciprocity of benefits to host plant and fungus are highly dependent upon the C:P stoichiometry of the transaction (Schwartz and Hoeksema, 1998). Since mycorrhizal fungi explore the soil volume for nutrients as part of this symbiotic transaction, it is important to better understand the resource requirements of fungi symbiosis. In particular, what are N and P requirements of the fungal partner? Answering such simple questions is difficult because our understanding of fungal C, N, and P stoichiometry and how it varies across taxonomic groups, functional guilds, and environmental conditions is poorly developed.
To address these gaps in our knowledge, here we present the first systematic compilation of C:N:P data for fungi. Our questions are as follows. What range and average values of C:N:P ratios are exhibited by fungi? Does fungal stoichiometry differ among phyla or functional guilds? Do environmental factors affect fungal stoichiometry? Answering these questions will allow stoichiometric theory to be brought to bear on key ecological processes driven by fungi.
Materials and Methods
We performed a systematic literature search in ISI Web of Science and Google Scholar using combinations of key words including stoichiometry, element, carbon, nitrogen, phosphorus, chemical composition, mineral, nutrient, fungi, mushroom, yeast, Saccharomyces, fruit body, sporocarp, mycorrhizal, mycelium, and hyphae. We also followed cited references in the identified literature to find additional relevant studies.
Contents (percent of dry mass) or ratios of C, N, and P were extracted from published studies, either from tables or from figures by WebPlotDigitizer1. Studies that directly reported either absolute protein and RNA (or rRNA) content or protein:RNA ratio were also selected. In this case, studies that measured macromolecular content only under severe limitation and far from optimal growth conditions were excluded (Loladze and Elser, 2011). The protein:RNA ratio was converted to N:P ratio (28 entries for 18 species) according to a model developed by Loladze and Elser (2011). For studies that did not report %C, we used the average of C content (%C) data from the literature (44.0) in order to calculate C:N or C:P ratios from N content and P content values. Records without detailed taxonomic information (e.g., unidentified fungi) were excluded. See Supplementary Materials for the full dataset and references (Appendix S1, S2).
Fungal nomenclature followed the Index Fungorum2. Information for 377 fungi species (101 genera from 82 families) was assembled across a broad range of diversity including four phyla (Ascomycota, Basidiomycota, Glomeromycota, and Zygomycota). We used Funguild, a new open annotation tool, to assign the fungal species to the functional guilds (Nguyen et al., 2016). Ectomycorrhizal fungi, pathotrophs (receiving nutrients by harming host cells), and saprotrophs were selected for comparison of C:N:P stoichiometry among functional guilds (Appendix S3).
To assess possible correlations of fungal C:N:P ratios with climatic conditions, mean annual temperature, and mean annual precipitation data from 1950 to 2000 for the sampling sites of Agaricomycetes species were obtained from the WorldClim database3 at a spatial resolution of 30 arc-seconds (ca.1 km) using Diva-GIS 7.5 software4 (Hijmans et al., 2005). Agaricomycetes were the taxonomic group for which we had the most data, providing sufficient basis for assessment of climatic and geographic factors. Most of the element data for the correlation analysis are from fruiting bodies due to the lack of data for mycelia.
Elemental concentration and stoichiometric ratio data (%C, %N, %P, C:N, C:P, and, N:P) were log10-transformed before analyses to improve the normality of residuals. Student’s t-test was used to compare the concentration and ratios in fungus species for two phyla, Ascomycota and Basidiomycota, for which we had a large number of observations. ANOVA followed by Tukey’s post hoc test were used to assess the statistical significance of differences in the variables among different functional guilds. Pearson’s correlation analysis was performed to check for correlations between fungal C:N:P ratios and various geographic and abiotic environmental factors. All analyses were performed using R 3.1.3 program (R Core Team, 2015).
Results
The elemental concentrations of fungal biomass varied considerably: from 38 to 57% for %C, 0.23 to 15% for %N, and 0.040 to 5.5% for %P (Appendix S2). The median C:N:P ratio was 250:16:1 (molar, Figure 1 and Table 1), a value with N:P ratio remarkably close to the canonical Redfield ratio of 16:1 (Redfield, 1958).
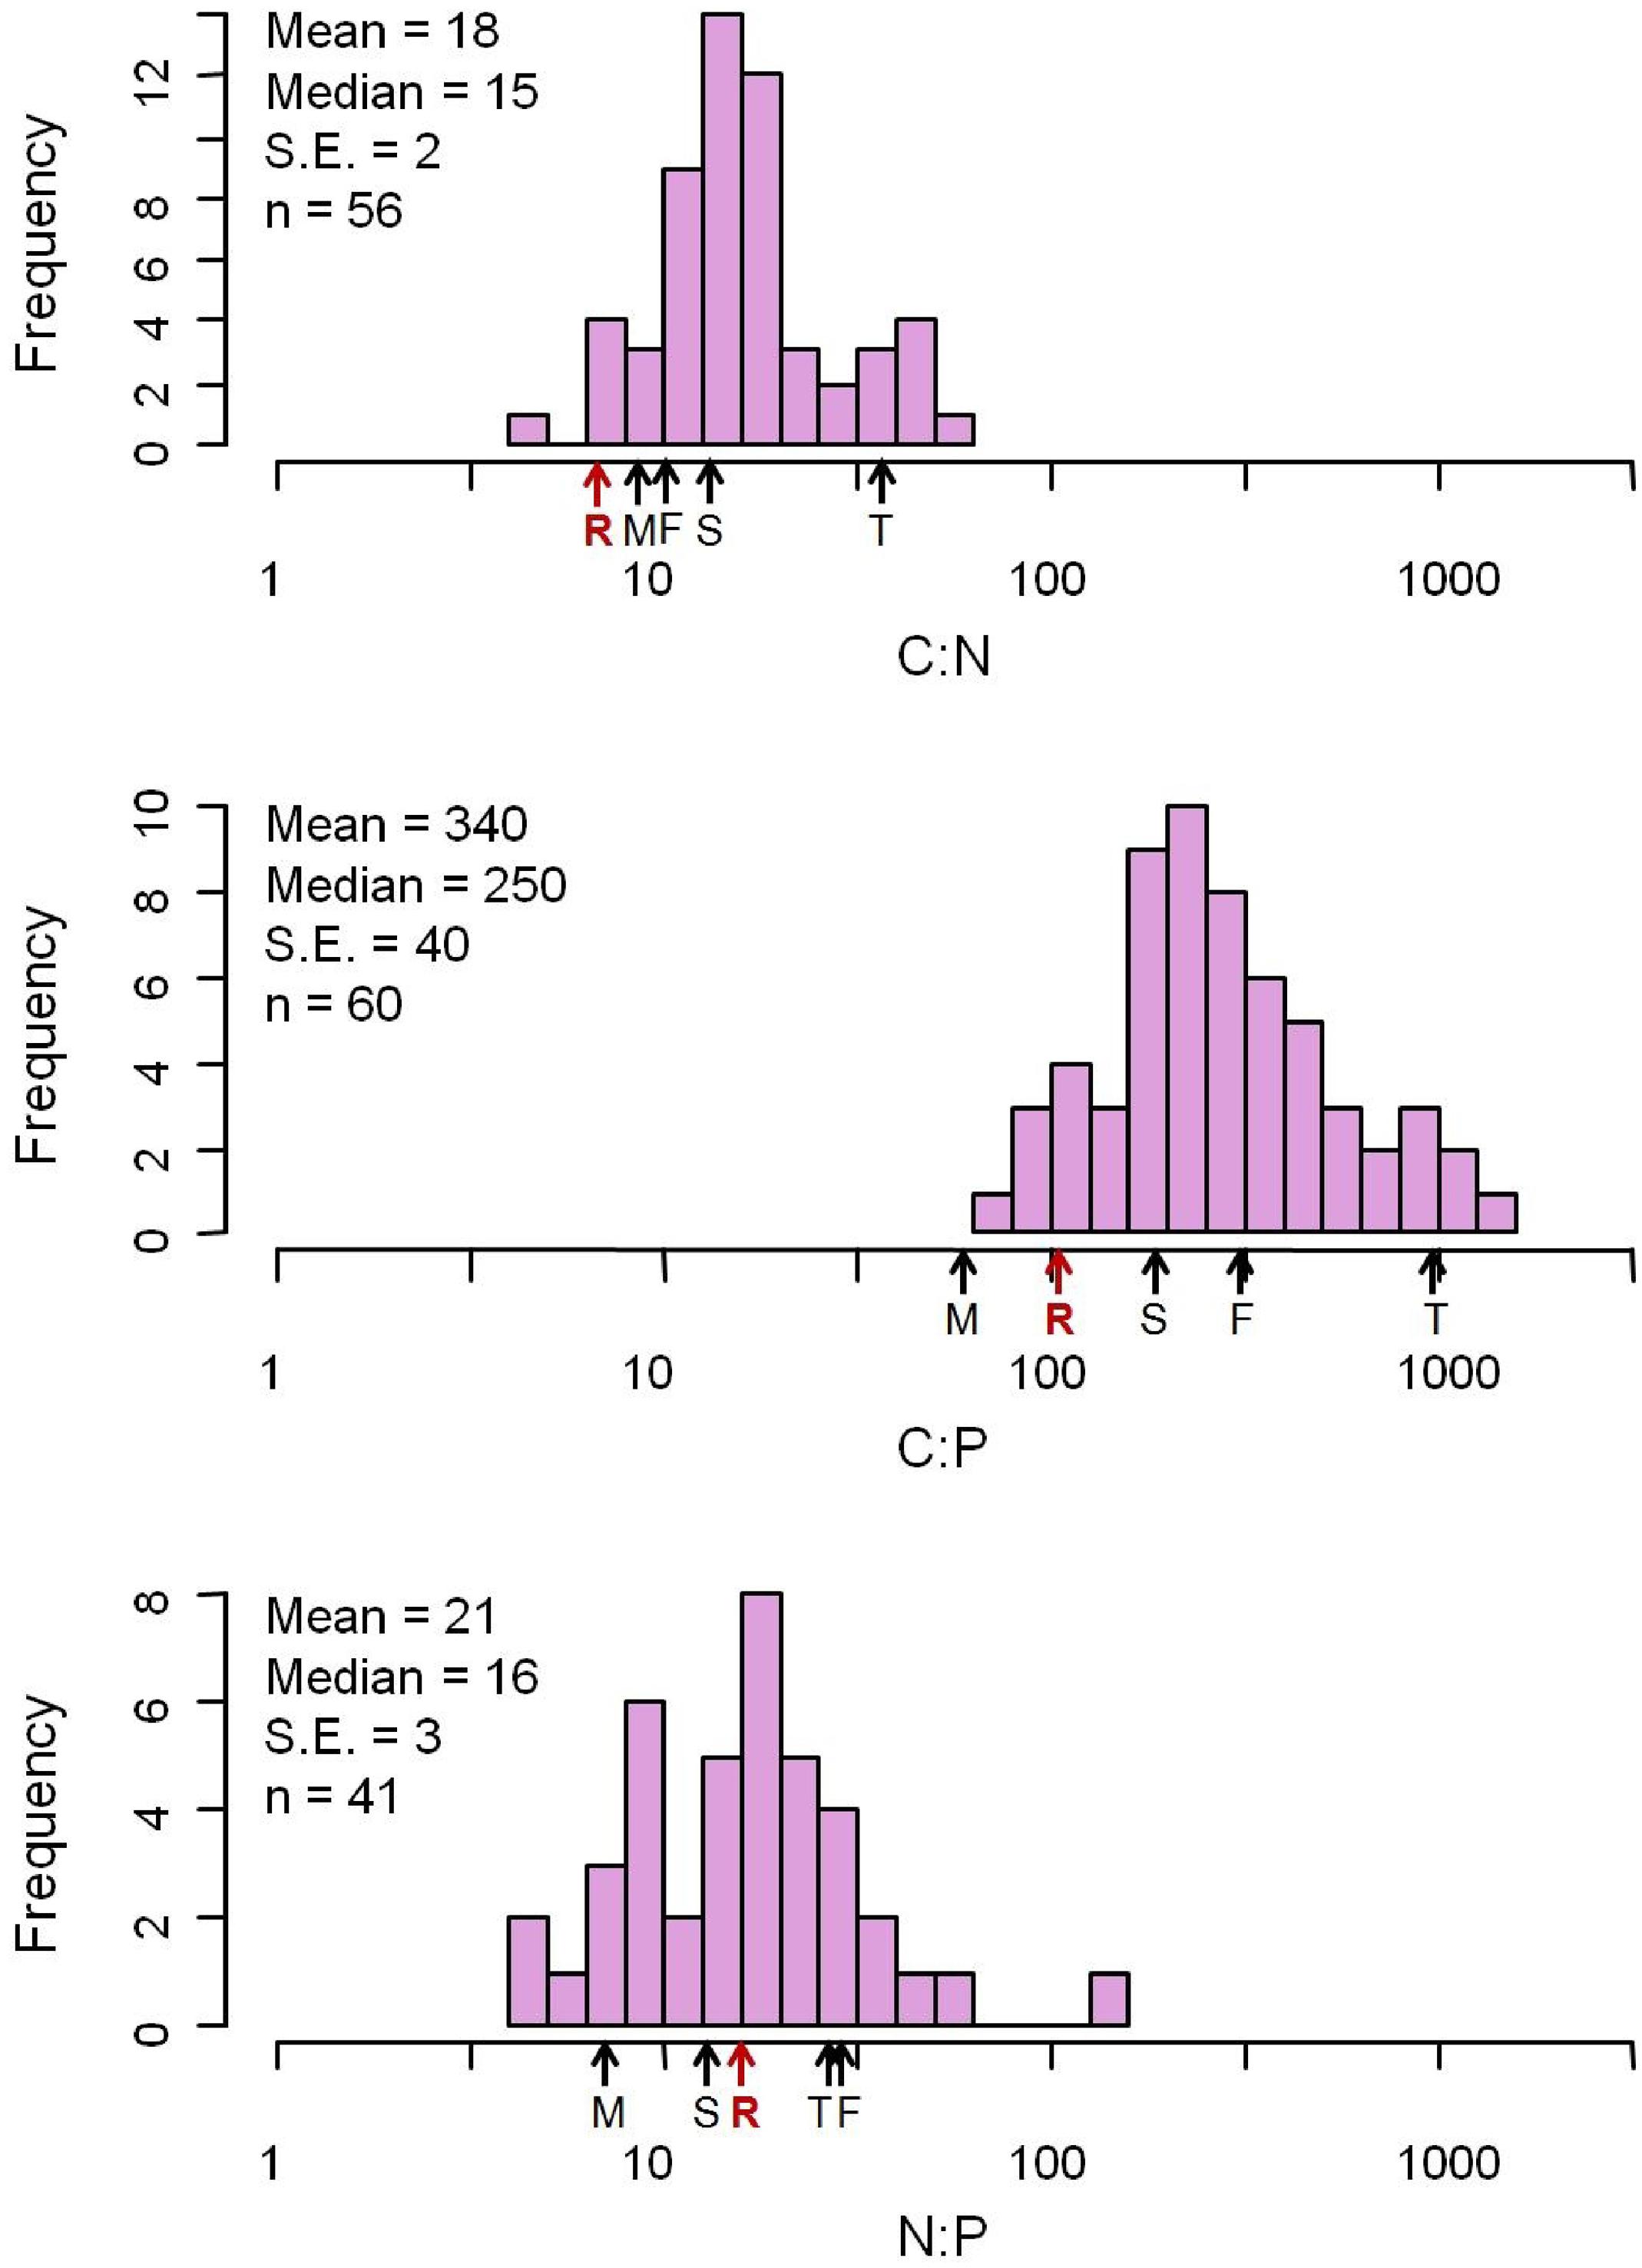
FIGURE 1. Distribution of C:N:P molar ratios from 377 fungus species. The mean C:N:P ratios for major biota and ecosystems from previous studies are marked with arrows. F, freshwater autotrophs (Elser et al., 2000a); M, soil microbial biomass (Cleveland and Liptzin, 2007); R, Redfield (Redfield, 1958); T, terrestrial autotrophs (Elser et al., 2000a); S, soil (Cleveland and Liptzin, 2007).
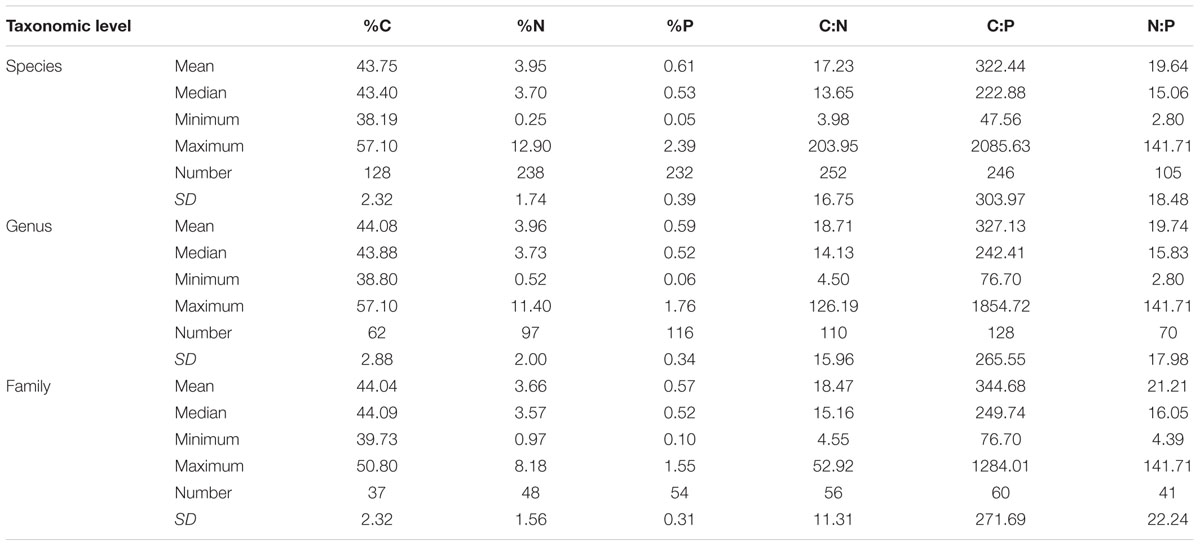
TABLE 1. Contents and ratios of C, N, and P in fungi at different taxonomic levels.
At the family level, significant differences (p < 0.05) between Ascomycota and Basidiomycota fungi in C content and C:P and N:P ratios were found (Figure 2). Among the three fungal guilds considered, significantly lower C:N ratio (p < 0.05) and higher N:P ratio (p < 0.01) were observed in ectomycorrhizal species compared to saprotrophic species (Figure 3 and Table 2).
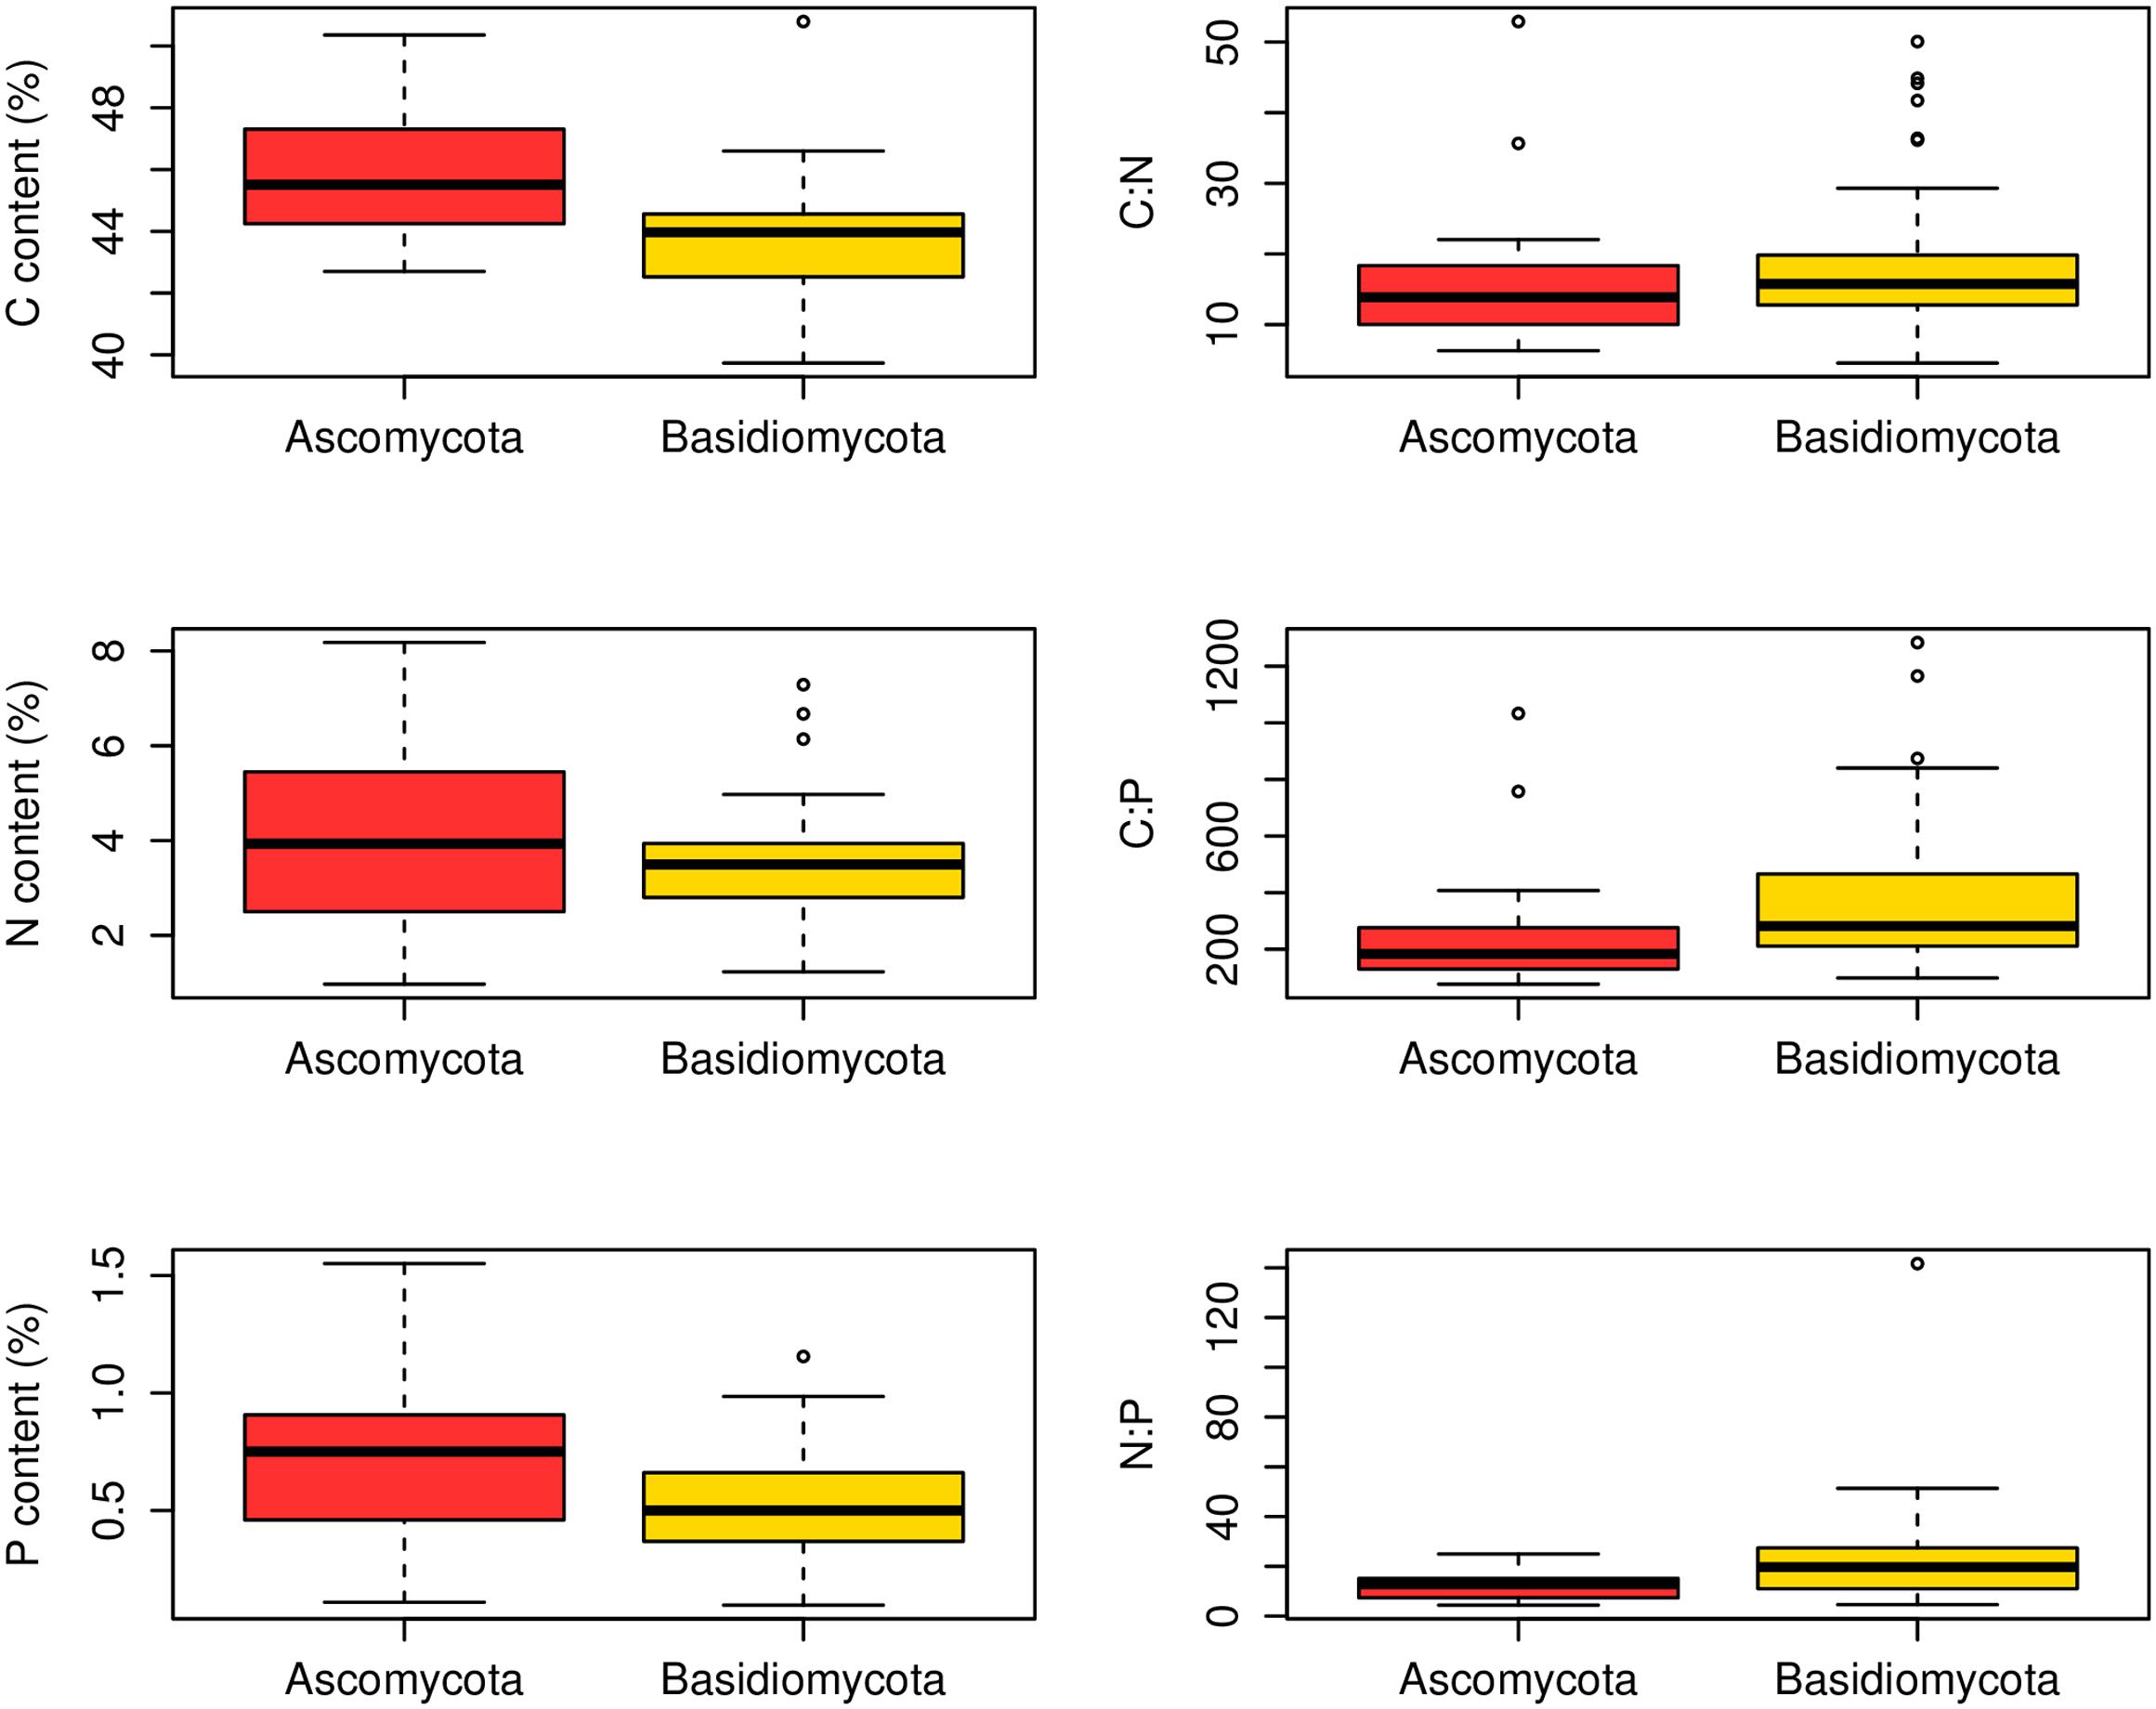
FIGURE 2. Contents and ratios of fungi C, N, and P between different phyla. Significant differences (p < 0.05) between Ascomycota (23 families) and Basidiomycota (49 families) fungi were found in C content and C:P and N:P ratios.
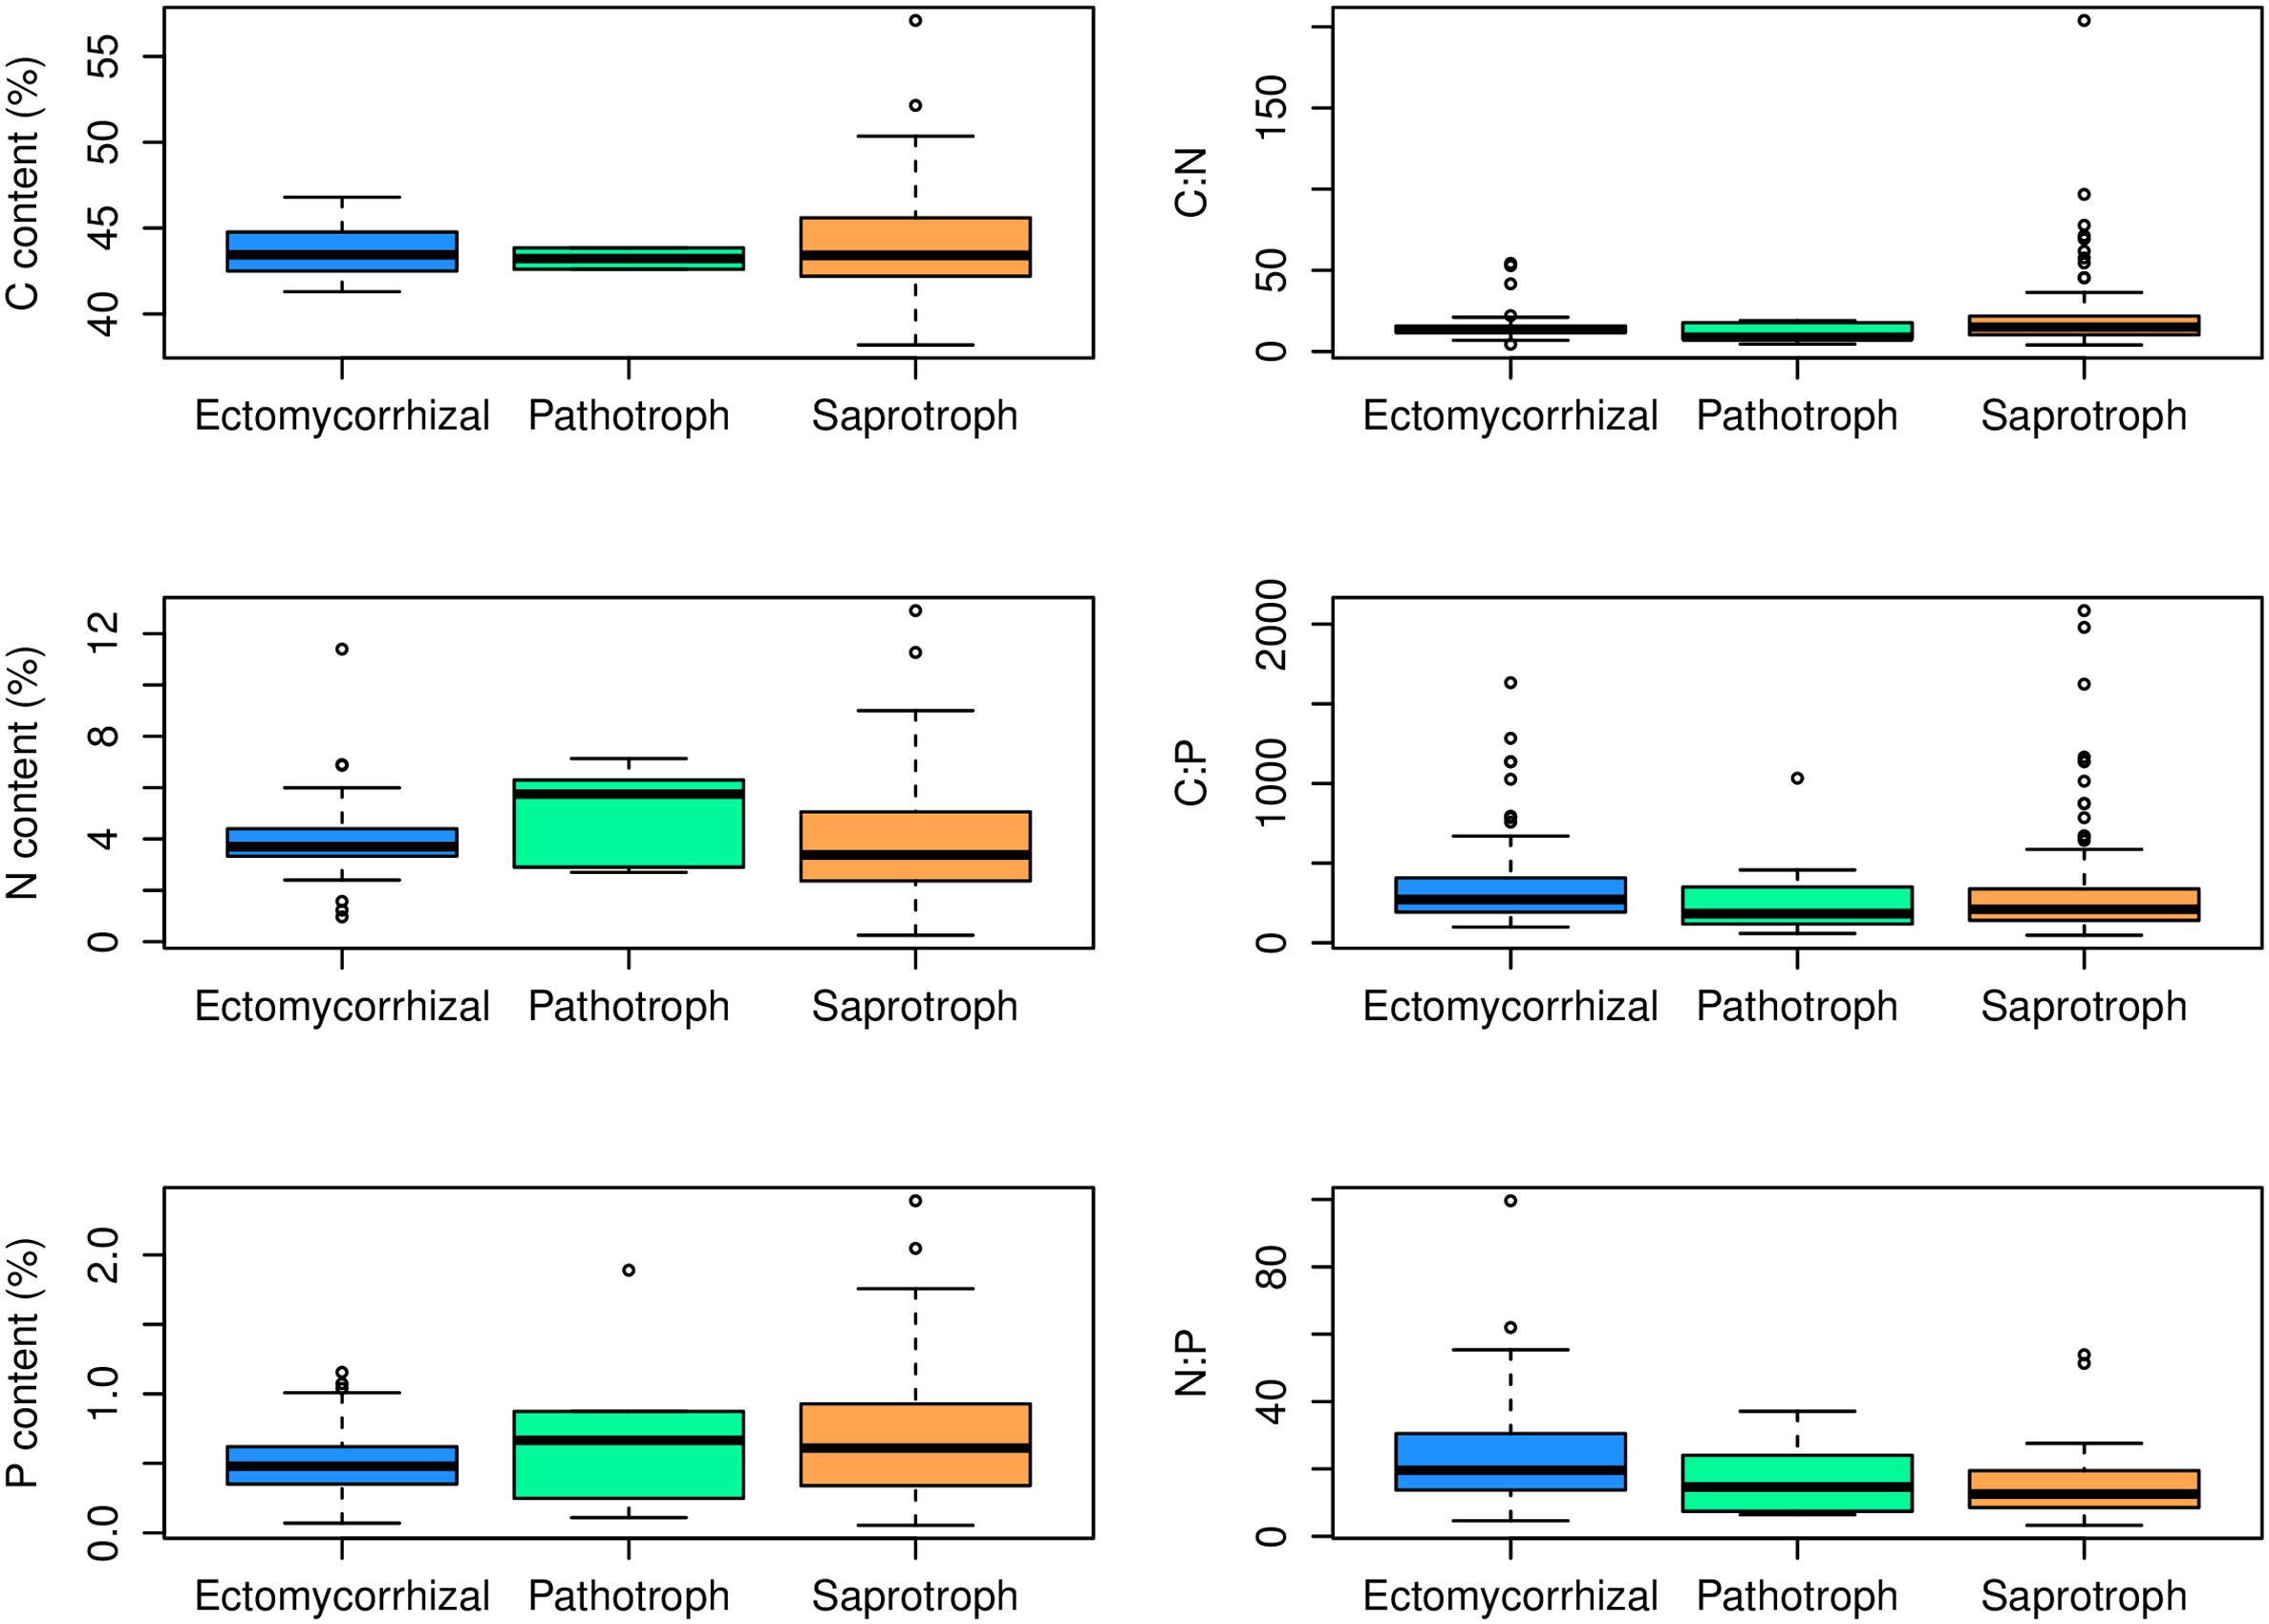
FIGURE 3. Contents and ratios of fungi C, N, and P among different functional guilds. Significant lower C:N ratio (p < 0.05) and higher N:P ratio (p < 0.01) were found in the ectomycorrhizal fungi rather than in saprotrophs.
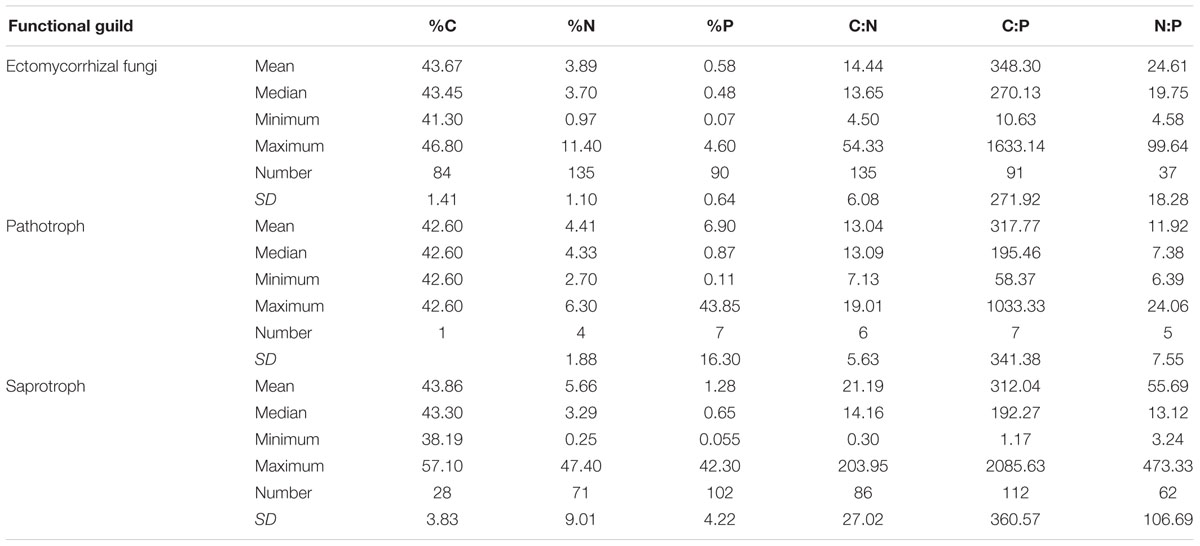
TABLE 2. Contents and ratios of fungal C, N, and P among different functional guilds.
N:P ratios of Agaricomycete fungi increased toward the equator, coincident with increases in average temperature and precipitation (Table 3). However, elemental contents and stoichiometric ratios in this group showed little direct correlation with elevation (Table 3).
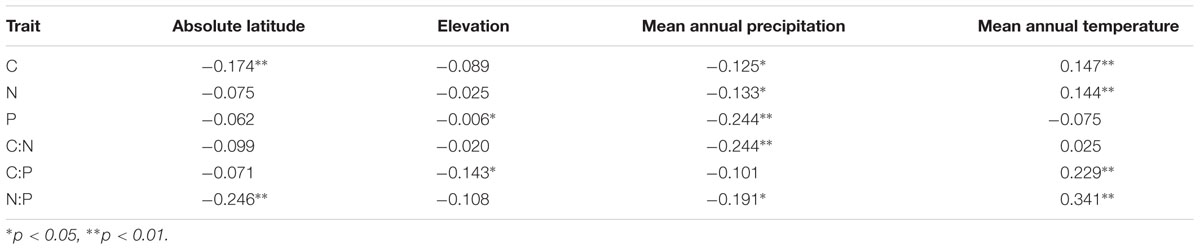
TABLE 3. Pearson’s correlation coefficients for the Agaricomycete fungi C, N, and P contents and ratios and four abiotic environmental variables.
Discussion
Large-Scale Patterns of Fungal N:P
Our data reveal that elemental ratios of fungal biomass vary from 3.3 to 220 (C:N), 21 to 2800 (C:P), and 1.5 to 140 (N:P) (Appendix S2). The variation of these ratios is considerable and exceeds that reported for fungi, bacteria or whole microbial communities in previous studies (Cleveland and Liptzin, 2007; Mouginot et al., 2014; Danger et al., 2016), although the highest N:P ratio we report is less than the extremely high N:P ratio (400) of microbes from hot springs of Yellowstone National Park (Neveu et al., 2016). Overall, however, our data for fungi bear remarkable resemblance to stoichiometric properties of other taxa. Most notable is that the median N:P ratio of fungal biomass was 16:1, identical to the canonical Redfield ratio for marine phytoplankton (Redfield, 1958).
This remarkable outcome highlights the influence of a strong central tendency in N:P ratio due to the core biochemical investments associated with N-rich proteins and P-rich protein synthesis machinery (e.g., ribosomal RNA) that holds across all biota (Loladze and Elser, 2011). However, there was extremely broad variation in C:N:P ratios around this central value, variation that likely reflects both local biochemical variation due to physiological adjustment to environmental conditions (Klausmeier et al., 2004) but also broader phylogenetic influences of different fungal taxa exhibiting different life history strategies in particular environments.
The poleward decline of N:P in our data (Table 3) also bears a striking similarity to patterns seen for other biota and ecosystems. For example, leaf N:P ratios decline with latitude (McGroddy et al., 2004; Reich and Oleksyn, 2004; Kerkhoff et al., 2005) as do N:P ratios in multicellular and unicellular photoautotrophs in freshwater and marine ecosystems (Borer et al., 2013; Martiny et al., 2013). Elser et al. (2000b) reported a similar poleward increase in P demands in the crustacean Daphnia, invoking selection for rapid growth (and thus P-rich RNA) due to the short growing season as an explanation. Decreases in soil microbial N:P ratios on the Tibetan Plateau as a function of latitude were reported by (Chen et al., 2016) and were associated with changes in soil microbial community structures. However, Cleveland and Liptzin (2007) found that microbial N:P ratios in soil microbial biomass were constrained at the global scale and did not show a latitudinal pattern.
Foliar nutrient contents tend to increase with altitude (Körner, 1989). In contrast to studies of foliar N:P ratios in plants along mountain slopes (Morecroft and Woodward, 1996; van de Weg et al., 2009), we found no correlation of fungal N:P ratios with elevation. This may have been the result of a confounding effect driven by the negative relationship between absolute latitude and elevation of the sampling sites in our dataset (Appendix S2).
In general, foliar N:P ratios increase with temperature across large geographic gradients (Reich and Oleksyn, 2004). We found a similar trend in fungal N:P ratio (Table 3). However, while temperature explained a substantial proportion of the total variability in leaf P (Reich and Oleksyn, 2004), variation in fungal P showed no detectable association with temperature. This may be due, in part, to the smaller temperature range from 1.5°C to 26.6°C in our data set compared with the -12.8°C to 28.0°C range considered by Reich and Oleksyn (2004). As most of the element data for the correlation analysis in our study are from fruiting bodies, further work is needed on the effects of actual in situ growth conditions (temperature and humidity) of fungal growth on stoichiometry in the mycelium.
While fungal N:P ratios changed with environmental conditions, it is unclear if the patterns we observe reflect shifts in the species present (with each species stoichiometrically homeostatic around a particular value) or if the ratios might vary if a given species was grown across the full range of environmental (soil, temperature, N, P, etc) conditions. This issue requires further investigation. How resource stoichiometry affects fungi is of particular interest (Danger et al., 2016) but data on nutrient availability are found in only a few studies. For instance, in terrestrial fungi, phylogenetically related strains can have distinct stoichiometric ratios despite the same growth conditions (Mouginot et al., 2014). In aquatic fungi, Leach and Gulis (2010) reported that fungal biomass is homeostatic with respect to C:N and N:P but is weakly homeostatic with respect to C:P. However, Danger and Chauvet (2013) found highly plastic C:P and N:P ratios in aquatic hyphomycetes as a function of external nutrient supply.
Stoichiometry in Mycorrhizal Symbioses
While the central similarity of average fungal C:N:P stoichiometry to previous observations is notable, the differences of N:P among fungal phyla that we observed needs further investigation. At least some of this variation may be associated with different functional guilds within fungal groups (Talbot et al., 2015). For example, in this study, ectomycorrhizal fungi had lower C:N ratio and higher N:P ratio compared with saprotrophs, supporting a role for trophic guild in influencing fungal C:N:P stoichiometry. The ectomycorrhizal fungal lifestyle has evolved multiple times from saprotrophic lineages of wood and litter decomposers through convergent evolution (van der Heijden et al., 2015). Contrasting effects of nitrogen availability on plant carbon supply to mycorrhizal fungi and saprotrophs may exist (Högberg et al., 2003). A considerable amount of research has been aimed at assessing the ability of ectomycorrhizal fungi to use organic nitrogen sources (Chalot and Brun, 1998). Ectomycorrhizal fungi benefit from organic matter decomposition primarily through increased nitrogen mobilization (Lindahl and Tunlid, 2015). Compared to saprotrophs, mycorrhizal fungi have a stable supply of C from their hosts, so they may exploit organic substrates selectively for N and other nutrients (Bödeker et al., 2016). A recent study has shown that ectomycorrhizal species have lower N content than saprotrophic fungal species (Trocha et al., 2016). However, we found that the N content of saprotrophic fungal species had a wider range than ectomycorrhizal species but the average N content did not differ significantly between the two guilds. We suggest that additional information about the C:N:P stoichiometry of functional groups of fungi may shed considerable light on the nature of various symbioses as well as on the functioning of various fungi as a reflection of their functional group.
Implications for Soil Nutrient Cycling
Soil microbial communities strongly affect element cycling at the ecosystem scale by adjusting the rates of various element acquisition processes (organic matter decomposition, N2 fixation, and P solubilization) to acquire limiting resources or by adjusting partitioning and turnover times in the microbial biomass (Spohn, 2016). For instance, global nitrogen-release patterns can be explained by fundamental stoichiometric relationships of decomposer activity (Manzoni et al., 2008). Heterotrophic microbial communities, which drive much of the nutrient cycling in soils, have received increasing interest in recent years (Zechmeister-Boltenstern et al., 2015). Indeed, Cleveland and Liptzin (2007) suggested that an average soil microbial N:P ratio might be a more appropriate index of ecosystem nutrient limitation than plant N:P ratios. A recent study showed that the biogeochemical consequences of N deposition in temperate forests may be driven by the stoichiometry of the dominant trees and their associated microbes (Midgley and Phillips, 2016) while van Diepen et al. (2017) found that fungi exposed to chronic nitrogen enrichment are less able to decay leaf litter. All of these studies point to the importance of multi-resource interactions in nutrient cycling in soils. To advance our understanding of how fungi contribute to these processes, further studies are needed of the relationship between fungal and soil C:N:P ratios as a function of nutrient supply, temperature, and precipitation in order to establish the strength of C:N:P stoichiometric homeostasis in soil fungi. This information will help in many areas of terrestrial ecosystem ecology, including in improving our models of the impacts of fungi on N and P immobilization vs. mineralization.
Our analysis indicates extremely broad variation in fungal C:N:P ratios around a core central tendency in N:P ratio that is notably similar to observations for other biota. Our analyses suggest that variation in fungal C:N:P stoichiometry likely reflects both local biochemical variation due to physiological adjustment to environmental conditions but also broader phylogenetic influences of different fungal guilds in particular environments.
Author Contributions
JZ and JE conceived and designed the study; JZ analyzed the data; JZ and JE wrote the paper.
Funding
This work was supported by the National Natural Science Foundation of China (31460538) and by the J. Bierman fund at the Flathead Lake Biological Station.
Conflict of Interest Statement
The authors declare that the research was conducted in the absence of any commercial or financial relationships that could be construed as a potential conflict of interest.
Acknowledgment
We thank Diana Six for her helpful comments on the manuscript.
Supplementary Material
The Supplementary Material for this article can be found online at: http://journal.frontiersin.org/article/10.3389/fmicb.2017.01281/full#supplementary-material
Footnotes
- ^ http://arohatgi.info/WebPlotDigitizer/
- ^ http://www.indexfungorum.org
- ^ http://worldclim.org/current
- ^ http://www.diva-gis.org
References
Andersen, T., Elser, J. J., and Hessen, D. O. (2004). Stoichiometry and population dynamics. Ecol. Lett. 7, 884–900. doi: 10.1111/j.1461-0248.2004.00646.x
Bärlocher, F., and Boddy, L. (2016). Aquatic fungal ecology – How does it differ from terrestrial? Fungal Ecol. 19, 5–13. doi: 10.1016/j.funeco.2015.09.001
Behie, S. W., and Bidochka, M. J. (2014). Nutrient transfer in plant–fungal symbioses. Trends Plant Sci. 19, 734–740. doi: 10.1016/j.tplants.2014.06.007
Bödeker, I. T. M., Lindahl, B. D., Olson,Å., and Clemmensen, K. E. (2016). Mycorrhizal and saprotrophic fungal guilds compete for the same organic substrates but affect decomposition differently. Funct. Ecol. 30, 1967–1978. doi: 10.1111/1365-2435.12677
Borer, E. T., Bracken, M. E. S., Seabloom, E. W., Smith, J. E., Cebrian, J., Cleland, E. E., et al. (2013). Global biogeography of autotroph chemistry: is insolation a driving force? Oikos 122, 1121–1130. doi: 10.1111/j.1600-0706.2013.00465.x
Chalot, M., and Brun, A. (1998). Physiology of organic nitrogen acquisition by ectomycorrhizal fungi and ectomycorrhizas. FEMS Microbiol. Rev. 22, 21–44. doi: 10.1111/j.1574-6976.1998.tb00359.x
Chen, Y., Chen, L., Peng, Y., Ding, J., Li, F., Yang, G., et al. (2016). Linking microbial C:N:P stoichiometry to microbial community and abiotic factors along a 3500-km grassland transect on the Tibetan Plateau. Glob. Ecol. Biogeogr. 25, 1416–1427. doi: 10.1111/geb.12500
Cleveland, C. C., and Liptzin, D. (2007). C:N:P stoichiometry in soil: is there a “Redfield ratio” for the microbial biomass? Biogeochemistry 85, 235–252.
Danger, M., and Chauvet, E. (2013). Elemental composition and degree of homeostasis of fungi: are aquatic hyphomycetes more like metazoans, bacteria or plants? Fungal Ecol. 6, 453–457. doi: 10.1016/j.funeco.2013.05.007
Danger, M., Gessner, M. O., and Bärlocher, F. (2016). Ecological stoichiometry of aquatic fungi: current knowledge and perspectives. Fungal Ecol. 19, 100–111. doi: 10.1016/j.funeco.2015.09.004
Elser, J. J., Acharya, K., Kyle, M., Cotner, J., Makino, W., Markow, T., et al. (2003). Growth rate-stoichiometry couplings in diverse biota. Ecol. Lett. 6, 936–943. doi: 10.1046/j.1461-0248.2003.00518.x
Elser, J. J., Fagan, W. F., Denno, R. F., Dobberfuhl, D. R., Folarin, A., Huberty, A., et al. (2000a). Nutritional constraints in terrestrial and freshwater food webs. Nature 408, 578–580. doi: 10.1038/35046058
Elser, J. J., O’Brien, W. J., Dobberfuhl, D. R., and Dowling, T. E. (2000b). The evolution of ecosystem processes: growth rate and elemental stoichiometry of a key herbivore in temperate and arctic habitats. J. Evol. Biol. 13, 845–853. doi: 10.1046/j.1420-9101.2000.00215.x
Elser, J. J., Sterner, R. W., Gorokhova, E., Fagan, W. F., Markow, T. A., Cotner, J. B., et al. (2000c). Biological stoichiometry from genes to ecosystems. Ecol. Lett. 3, 540–550. doi: 10.1111/j.1461-0248.2000.00185.x
Frost, P. C., Stelzer, R. S., Lamberti, G. A., and Elser, J. J. (2002). Ecological stoichiometry of trophic interactions in the benthos: understanding the role of C:N:P ratios in lentic and lotic habitats. J. N. Am. Benthol. Soc. 21, 515–528. doi: 10.2307/1468427
Gadd, G. M. (2004). Mycotransformation of organic and inorganic substrates. Mycologist 18, 60–70. doi: 10.1017/S0269915X04002022
Gadd, G. M. (2007). Geomycology: biogeochemical transformations of rocks, minerals, metals and radionuclides by fungi, bioweathering and bioremediation. Mycol. Res. 111, 3–49. doi: 10.1016/j.mycres.2006.12.001
Hessen, D. O., Elser, J. J., Sterner, R. W., and Urabe, J. (2013). Ecological stoichiometry: an elementary approach using basic principles. Limnol. Oceanogr. 58, 2219–2236. doi: 10.4319/lo.2013.58.6.2219
Hijmans, R. J., Cameron, S. E., Parra, J. L., Jones, P. G., and Jarvis, A. (2005). Very high resolution interpolated climate surfaces for global land areas. Int. J. Climatol. 25, 1965–1978. doi: 10.1002/joc.1276
Högberg, M. N., Bååth, E., Nordgren, A., Arnebrant, K., and Högberg, P. (2003). Contrasting effects of nitrogen availability on plant carbon supply to mycorrhizal fungi and saprotrophs - a hypothesis based on field observations in boreal forest. New Phytol. 160, 225–238. doi: 10.1046/j.1469-8137.2003.00867.x
Kerkhoff, A. J., Enquist, B. J., Elser, J. J., and Fagan, W. F. (2005). Plant allometry, stoichiometry and the temperature-dependence of primary productivity. Glob. Ecol. Biogeogr. 14, 585–598. doi: 10.1111/j.1466-822X.2005.00187.x
Kerkhoff, A. J., Fagan, W. F., Elser, J. J., and Enquist, B. J. (2006). Phylogenetic and growth form variation in the scaling of nitrogen and phosphorus in the seed plants. Am. Nat. 168, E103–E122. doi: 10.1086/507879
Klausmeier, C. A., Litchman, E., Daufresne, T., and Levin, S. A. (2004). Optimal nitrogen-to-phosphorus stoichiometry of phytoplankton. Nature 429, 171–174. doi: 10.1038/nature02454
Körner, C. (1989). The nutritional status of plants from high altitudes. Oecologia 81, 379–391. doi: 10.1007/BF00377088
Landeweert, R., Hoffland, E., Finlay, R. D., Kuyper, T. W., and van Breemen, N. (2001). Linking plants to rocks: ectomycorrhizal fungi mobilize nutrients from minerals. Trends Ecol. Evol. 16, 248–254. doi: 10.1016/S0169-5347(01)02122-X
Leach, D., and Gulis, V. (2010). Microbial Stoichiometry and Homeostasis of Nutrient Ratios in Fungi. Bridges 5. Available at: http://citeseerx.ist.psu.edu/viewdoc/download?
Lindahl, B. D., and Tunlid, A. (2015). Ectomycorrhizal fungi - potential organic matter decomposers, yet not saprotrophs. New Phytol. 205, 1443–1447. doi: 10.1111/nph.13201
Loladze, I., and Elser, J. J. (2011). The origins of the Redfield nitrogen-to-phosphorus ratio are in a homoeostatic protein-to-rRNA ratio. Ecol. Lett. 14, 244–250. doi: 10.1111/j.1461-0248.2010.01577.x
Manzoni, S., Jackson, R. B., Trofymow, J. A., and Porporato, A. (2008). The global stoichiometry of litter nitrogen mineralization. Science 321, 684–686. doi: 10.1126/science.1159792
Martiny, A. C., Pham, C. T. A., Primeau, F. W., Vrugt, J. A., Moore, J. K., Levin, S. A., et al. (2013). Strong latitudinal patterns in the elemental ratios of marine plankton and organic matter. Nat. Geosci. 6, 279–283. doi: 10.1038/NGEO1757
McGroddy, M. E., Daufresne, T., and Hedin, L. O. (2004). Scaling of C:N:P stoichiometry in forests worldwide: implications of terrestrial Redfield-type ratios. Ecology 85, 2390–2401. doi: 10.1890/03-0351
Midgley, M. G., and Phillips, R. P. (2016). Resource stoichiometry and the biogeochemical consequences of nitrogen deposition in a mixed deciduous forest. Ecology 97, 3369–3378. doi: 10.1002/ecy.1595
Morecroft, M. D., and Woodward, F. I. (1996). Experiments on the causes of altitudinal differences in the leaf nutrient contents, size and δ13C of Alchemilla alpina. New Phytol. 134, 471–479. doi: 10.1111/j.1469-8137.1996.tb04364.x
Mouginot, C., Kawamura, R., Matulich, K. L., Berlemont, R., Allison, S. D., Amend, A. S., et al. (2014). Elemental stoichiometry of fungi and bacteria strains from grassland leaf litter. Soil Biol. Biochem. 76, 278–285. doi: 10.1016/j.soilbio.2014.05.011
Neveu, M., Poret-Peterson, A. T., Anbar, A. D., and Elser, J. J. (2016). Ordinary stoichiometry of extraordinary microorganisms. Geobiology 14, 33–53. doi: 10.1111/gbi.12153
Nguyen, N. H., Song, Z., Bates, S. T., Branco, S., Tedersoo, L., Menke, J., et al. (2016). FUNGuild: an open annotation tool for parsing fungal community datasets by ecological guild. Fungal Ecol. 20, 241–248. doi: 10.1016/j.funeco.2015.06.006
R Core Team (2015). R: A Language and Environment for Statistical Computing. Vienna: R Foundation for Statistical Computing.
Redfield, A. C. (1958). The biological control of chemical factors in the environment. Am. Sci. 46, 205–221.
Reich, P. B., and Oleksyn, J. (2004). Global patterns of plant leaf N and P in relation to temperature and latitude. Proc. Natl. Acad. Sci. U.S.A. 101, 11001–11006. doi: 10.1073/pnas.0403588101
Schwartz, M. W., and Hoeksema, J. D. (1998). Specialization and resource trade: biological markets as a model of mutualisms. Ecology 79, 1029–1038.
Sinsabaugh, R. L., Hill, B. H., and Follstad Shah, J. J. (2009). Ecoenzymatic stoichiometry of microbial organic nutrient acquisition in soil and sediment. Nature 462, 795–798. doi: 10.1038/nature08632
Spohn, M. (2016). Element cycling as driven by stoichiometric homeostasis of soil microorganisms. Basic Appl. Ecol. 17, 471–478. doi: 10.1016/j.baae.2016.05.003
Sterner, R. W., and Elser, J. J. (2002). Ecological Stoichiometry: The Biology of Elements from Molecules to the Biosphere. Princeton, NJ: Princeton University Press.
Talbot, J. M., Martin, F., Kohler, A., Henrissat, B., and Peay, K. G. (2015). Functional guild classification predicts the enzymatic role of fungi in litter and soil biogeochemistry. Soil Biol. Biochem. 88, 441–456. doi: 10.1016/j.soilbio.2015.05.006
Trocha, L. K., Rudy, E., Chen, W., Dabert, M., and Eissenstat, D. M. (2016). Linking the respiration of fungal sporocarps with their nitrogen concentration: variation among species, tissues and guilds. Funct. Ecol. 30, 1756–1768. doi: 10.1111/1365-2435.12688
van de Weg, M. J., Meir, P., Grace, J., and Atkin, O. K. (2009). Altitudinal variation in leaf mass per unit area, leaf tissue density and foliar nitrogen and phosphorus content along an Amazon-Andes gradient in Peru. Plant Ecol. Divers. 2, 243–254. doi: 10.1080/17550870903518045
van der Heijden, M. G. A., Martin, F. M., Selosse, M., and Sanders, I. R. (2015). Mycorrhizal ecology and evolution: the past, the present, and the future. New Phytol. 205, 1406–1423. doi: 10.1111/nph.13288
van Diepen, L. T. A., Frey, S. D., Landis, E. A., Morrison, E. W., and Pringle, A. (2017). Fungi exposed to chronic nitrogen enrichment are less able to decay leaf litter. Ecology 98, 5–11. doi: 10.1002/ecy.1635
Waring, B. G., Averill, C., and Hawkes, C. V. (2013). Differences in fungal and bacterial physiology alter soil carbon and nitrogen cycling: insights from meta-analysis and theoretical models. Ecol. Lett. 16, 887–894. doi: 10.1111/ele.12125
Woods, H. A., Fagan, W. F., Elser, J. J., and Harrison, J. F. (2004). Allometric and phylogenetic variation in insect phosphorus content. Funct. Ecol. 18, 103–109. doi: 10.1111/j.1365-2435.2004.00823.x
Keywords: elemental composition, fungus, guild, homeostasis, Redfield ratios, stoichiometry
Citation: Zhang J and Elser JJ (2017) Carbon:Nitrogen:Phosphorus Stoichiometry in Fungi: A Meta-Analysis. Front. Microbiol. 8:1281. doi: 10.3389/fmicb.2017.01281
Received: 28 February 2017; Accepted: 26 June 2017;
Published: 14 July 2017.
Edited by:
Télesphore Sime-Ngando, Centre National de la Recherche Scientifique (CNRS), FranceReviewed by:
Michael Danger, Université de Lorraine, FranceMarcela Claudia Pagano, Universidade Federal de Minas Gerais, Brazil
Copyright © 2017 Zhang and Elser. This is an open-access article distributed under the terms of the Creative Commons Attribution License (CC BY). The use, distribution or reproduction in other forums is permitted, provided the original author(s) or licensor are credited and that the original publication in this journal is cited, in accordance with accepted academic practice. No use, distribution or reproduction is permitted which does not comply with these terms.
*Correspondence: James J. Elser, amltLmVsc2VyQGZsYnMudW10LmVkdQ==